AND IMPACTS ON SOILS AND VEGETATION
72
Sand dunes of the Darhat Valley Mongolia : understanding their origins, dynamics, and impacts on soils and vegetation by Patrick Harold OConnell A thesis submitted in partial fulfillment of the requirements for the degree of Master of Science in Land Resources and Environmental Sciences Montana State University © Copyright by Patrick Harold OConnell (2001) Abstract: Nomadic pastoralism has endured for more than 1500 years in Mongolia. Within the last century political changes have affected pastoralism by altering traditional land use patterns. Erosion and sand dune activity in the Darhat Valley, Mongolia has accompanied the changes in pastoral practices over the last 50 years and has threatened the sustainability of rangelands hi some areas. The welfare of Mongolian herders is dependent on rangeland productivity. This study describes the affects of saltation and sand dune migration on soils and vegetation and determines if erosion was continuing in the Darhat Valley’s Renchinlhumbe Sum. The New Spring Site (NSS) and the Hoogii Site (HS) were two Renchinlhumbe locations selected for this study. As barchan sand dunes move they destroy vegetation leaving bare ground. If vegetation does not reestablish these areas, bare soils lose stability and erode. Because barchan dunes in Renchinlhumbe migrate 5-10 m annually, one can estimate the length of time since a dune has left an area. By measuring the thickness of the soil’s A-horizon at increasing distances upwind from the base of windward dune slopes, continuing erosion could be estimated. The thickness of A-horizon along five transects upwind of five migrating dunes was measured. Vegetation data were also collected in this study. Plant community composition based on the percent cover of five data classes: 1) bare ground, 2) forbs, 3) grasses, 4) sedges, and 5) lichen was determined along seven transects. Each percent composition value was composited from three one-meter hoop measurements. The thickness of A-horizon measurements showed progressing soil loss with increasing distances upwind of NSS dunes, indicating continuing erosion. Conversely, soil-loss and continuing erosion was not found at the HS. Soil stability at both sites was affected by compaction from large dunes and topography. The NSS had a gently rolling terrain and windward slope faces more directly exposed to scouring by saltation. The HS was predominately flat and less susceptible to scouring. Plant community composition data showed that forbs and grasses declined more slowly and recovered more quickly than sedges and lichen. Patterns of vegetative recovery were influenced by differing depths of sand accumulation, and accessibility to ground water.
Transcript of AND IMPACTS ON SOILS AND VEGETATION
Sand dunes of the Darhat Valley Mongolia : understanding their origins, dynamics, and impacts onsoils and vegetationby Patrick Harold OConnell
A thesis submitted in partial fulfillment of the requirements for the degree of Master of Science in LandResources and Environmental SciencesMontana State University© Copyright by Patrick Harold OConnell (2001)
Abstract:Nomadic pastoralism has endured for more than 1500 years in Mongolia. Within the last centurypolitical changes have affected pastoralism by altering traditional land use patterns. Erosion and sanddune activity in the Darhat Valley, Mongolia has accompanied the changes in pastoral practices overthe last 50 years and has threatened the sustainability of rangelands hi some areas. The welfare ofMongolian herders is dependent on rangeland productivity. This study describes the affects of saltationand sand dune migration on soils and vegetation and determines if erosion was continuing in the DarhatValley’s Renchinlhumbe Sum. The New Spring Site (NSS) and the Hoogii Site (HS) were twoRenchinlhumbe locations selected for this study.
As barchan sand dunes move they destroy vegetation leaving bare ground. If vegetation does notreestablish these areas, bare soils lose stability and erode. Because barchan dunes in Renchinlhumbemigrate 5-10 m annually, one can estimate the length of time since a dune has left an area. Bymeasuring the thickness of the soil’s A-horizon at increasing distances upwind from the base ofwindward dune slopes, continuing erosion could be estimated. The thickness of A-horizon along fivetransects upwind of five migrating dunes was measured. Vegetation data were also collected in thisstudy. Plant community composition based on the percent cover of five data classes: 1) bare ground, 2)forbs, 3) grasses, 4) sedges, and 5) lichen was determined along seven transects. Each percentcomposition value was composited from three one-meter hoop measurements.
The thickness of A-horizon measurements showed progressing soil loss with increasing distancesupwind of NSS dunes, indicating continuing erosion. Conversely, soil-loss and continuing erosion wasnot found at the HS. Soil stability at both sites was affected by compaction from large dunes andtopography. The NSS had a gently rolling terrain and windward slope faces more directly exposed toscouring by saltation. The HS was predominately flat and less susceptible to scouring. Plantcommunity composition data showed that forbs and grasses declined more slowly and recovered morequickly than sedges and lichen. Patterns of vegetative recovery were influenced by differing depths ofsand accumulation, and accessibility to ground water.

SAND DUNES OF THE DARHAT VALLEY MONGOLIA:
UNDERSTANDING THEIR ORIGINS, DYNAMICS,
AND IMPACTS ON SOILS AND VEGETATION
by
Patrick Harold O’Connell Jr.
A thesis submitted in partial fulfillment of the requirements for the degree
of
Master of Science
m
Land Resources and Environmental Sciences
MONTANA STATE UNIVERSITY-BOZEMAN Bozeman, Montana
December 2001

APPROVAL
of a thesis submitted by
Patrick H. O’Connell
This thesis has been read by each member of the thesis committee and has been found to
be satisfactory regarding content, English usage, format, citations, bibliographic style, and
consistency and is ready for submission to the College of Graduate Studies.
Cliff Montague ■ / / / 7 ^ / o/(Signatoe) r (Date)
Approved for the Department of Land Resources and Environmental Sciences
Jeffrey S. Jacobsen — i z h / o \(Date)
Approved for the Graduate Studies
Bruce McLeod /c>? ' / O - O /(Signature) / (Date)

iii
STATEMENT OF PERMISSION TO USE
In presenting this thesis in partial fulfillment of the requirements for a master's
degree at Montana State University-B ozeman, I agree that the Library shall make it
available to borrowers under rules of the Library.
If I have indicated my intention to copyright this thesis by including a copyright notice
paper, copying is allowable only for scholarly purposes, consistent with "fair use" as
prescribed in the U.S. Copyright Law. Requests for permission for extended quotation
from or reproduction of this thesis in whole or in parts may be granted only by the
copyright holder.
Signatun ____

ACKNOWLEDGMENTS
My committee: Cliff Montagne, Jim Bander, and Jerry Nielsen, thank you for your willingness to advise me. I would like to thank CliffMontagne for his vision of a global community and admirable dedication to seeing his vision realized. His creation of a Bioregions program and ongoing work promoting sustainable lifestyle choices at home and abroad inspires, and provides extraordinary learning opportunities for others. The experiences that were shared while living and working in Mongolia are among my most treasured. I will always be grateful to Cliff for making them possible. I would also like to thank Kent Brody for his financial contributions to the Bioregions Project. My research would not have been possible without Kent’s generous support.
I would like to thank Jim Bander for contributing a commendable amount of time and energy providing me with essential guidance and technical support. Fm particularly indebted to Jim for agreeing to impart some structure to a not so structured graduate student, and for his generous, much appreciated encouragement. I would also like to thank Jerry Nielsen for the joy and enthusiasm he has for teaching. Much of my appreciation for the field of Pedology is attributable to what he shared as a teacher.
I would like to extend a special thanks to Kathy Jennings, Patty Shea, and Peggy Humphrey for the extraordinary kindness and generosity they have shown me throughout my experience as a graduate student. They endeavor to not only help students succeed, but to touch their hearts as well.
My work in the Darhat Valley, Mongolia would not have been possible without the wonderful support team provided by Boojum Expeditions. Special thanks to Kent Madin for accommodating our needs throughout our stay in Mongolia, for generously sharing Boojum’s beautiful cabin and UB apartment, and for showing us such a great time. Thanks to Mishig, Maggie, Nyamsuren, and Tuulaa for their support and kindness, and Odkhuu for committing two weeks of his time to transporting me, Jay, and our equipment to our study sites.
A big thank you to Jay Skovlin for his invaluable assistance and friendship in the field. His plant identification skills and soils knowledge were essential to this project. Our survival in the valley was also ensured by Jay, who had the wisdom to bring along five pounds of peanut butter. Also, thank you to Sonya Skovlin, Emily Hall, Heather Heintz, Don Hart, and Otgoo for their field help and frienship.
I would like to thank Teki Tsagaan for her friendship and an exceptional Mongolian adventure. I would also like to thank Clain Jones, Arsil Saleh, Juan Fajardo, Sonya Skovlin, Bill Christner, Antionette Anthony, Jean Harper, Mami Rolston, Todd Blackwell, Brian Perry, Angela Herbert, Mariel Cohn, and my many other friends for all of their love, friendship, and encouragement.
Finally, I would like to thank Patrick O’Connell Sr., Brenda O’Connell, Dale Maggiore, and Jazz for believing in me. I am continually humbled by the love, support, encouragement, and generosity they offer me. Thank you for being there for me, for your kindness and understanding, for making so many things possible, and for all that cannot be captured in words.
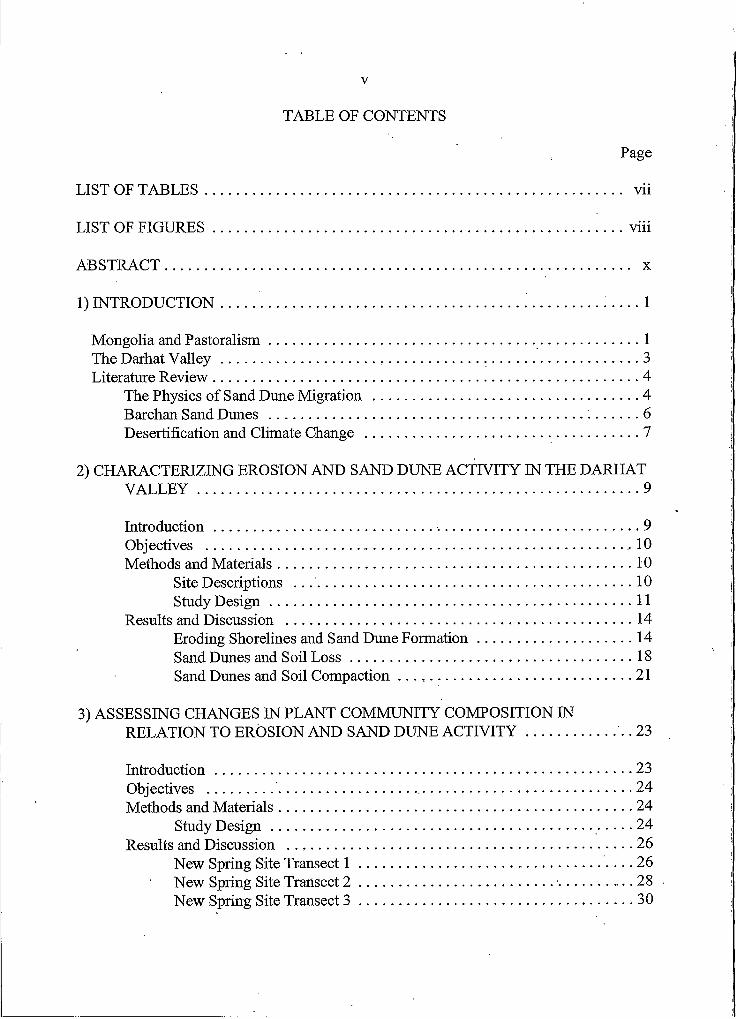
TABLE OF CONTENTS
LIST OF TABLES........................................................................................................ vii
LIST OF FIGURES........................................................................................................viii
ABSTRACT.................................................................................................................... x
1) INTRODUCTION........ ..................................................................................... : I
Mongolia and Pastoralism..............................................................................................IThe Darhat V alley ........................................ 3Literature Review........................................................................................................... 4
The Physics of Sand Dune Migration ................................................................... 4Barchan Sand Dunes ................................................................................ 6Desertification and Climate Change ..................................................................... 7
2) CHARACTERIZING EROSION AND SAND DUNE ACTIVITY IN THE DARHATVALLEY............................................................................................................... 9
Introduction........................... 9Objectives ......................... .10Methods and Materials..........................................................................................10
Site Descriptions ..................................................................................... 10Study D esign ............................................................................................11
Results and Discussion ........................................................................................14Eroding Shorelines and Sand Dune Formation........................................14Sand Dunes and Soil L o ss ........................................................................IBSand Dunes and Soil Compaction ............................................ 21
3) ASSESSING CHANGES IN PLANT COMMUNITY COMPOSITION INRELATION TO EROSION AND SAND DUNE ACTIVITY....................... . .23
Introduction......................................................................................................... 23Objectives ................. 24Methods and Materials......................................................................................... 24
Study D esign................................................................................. 24Results and Discussion .. ....................................................................................26
New Spring Site Transect I .......................................... 26New Spring Site Transect 2 .................................................. 28New Spring Site Transect 3 ........................... 30
Page

TABLE OF CONTENTS - Continued
New Spring Site Transect 4 ..................... 31Hoogii Site Transect I ...................... .: ................................................. 32Hoogii Site Transect 2 ....................... 35Hoogii Site Transect 3 .................. 36
4) CONCLUSION ............................................... 38Management Approaches.................................... 39
LITERATURE CITED ................................................................................................... 41
APPENDICES........................................................................... 44
APPENDIX A - SOIL PROFILE DESCRIPTIONS AND SPECIES LIST FORTHE NEW SPRING AND HOOGII STUDY SITES...............................45
APPENDIX B - ILLUSTRATIONS OF THE DUNE EROSION OCCURRING ALONG THREE TRANSECTS EXTENDING UPWIND OF NSS SAND DUNES ................................................ '.....................................56
vi
Page

LIST OF TABLES
Table ' Page
1. The ground cover data sets for the NSS transects............................................... 29
2. The ground cover data sets for the HS transects ................................................. 33
3. Soil profile descriptions for the N S S ................................................................... 45
4. Soil profile descriptions for the H S ..................................................................... 50
5 . List of plant species identified at the NSS ansd H S ............................................54
vii
VM
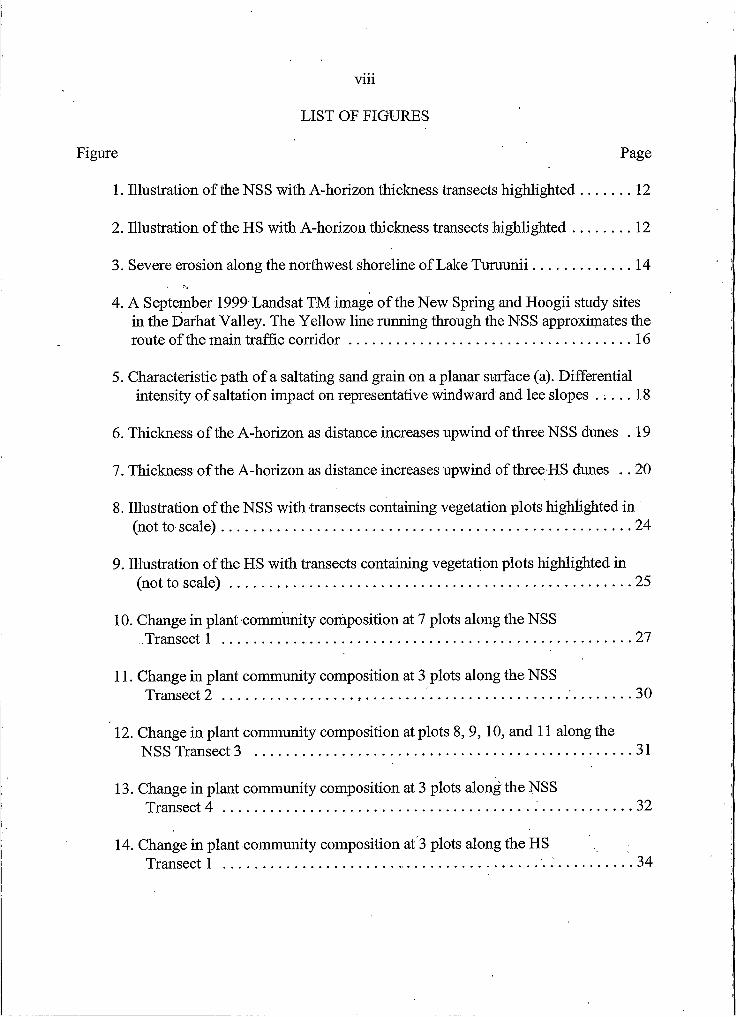
LIST OF FIGURES
1. Illustration of the NSS with A-horizon thickness transects highlighted............12
2. Illustration of the HS with A-horizon thickness transects highlighted..............12
3. Severe erosion along the northwest shoreline of Lake Turuunii........................14' a
Figure Page
4. A September 1999 Landsat TM image of the New Spring and Hoogii study sites in the Darhat Valley. The Yellow line running through the NSS approximates theroute of the main traffic corridor......................................................................16
5. Characteristic path of a saltating sand grain on a planar surface (a). Differentialintensity of saltation impact on representative windward and lee slopes . . . . . 18
6. Thickness of the A-horizon as distance increases upwind of three NSS dunes . 19
7. Thickness of the A-horizon as distance increases upwind of three HS dunes ... 20
8. Illustration of the NSS with transects containing vegetation plots highlighted in(not to scale)........ ...............................................................................................24
9. Illustration of the HS with transects containing vegetation plots highlighted in(not to scale)..................................................................................................... 25
10. Change in plant community composition at 7 plots along the NSSTransect I ....................................................................................................... 27
11. Change in plant community composition at 3 plots along the NSSTransect 2 ................................ ......................................................' .............. 30
12. Change in plant community composition at plots 8, 9, 10, and 11 along theNSS Transect 3 ............................................................................................... 31
13. Change in plant community composition at 3 plots along the NSSTransect 4 .............................................................................. 32
14. Change in plant community composition at 3 plots along the HSTransect I .............................................. 34

LIST OF FIGURES - Continued
15. Change in plant community composition at 10 plots along the HSTransect 2 ....................................................................................................... 35
16. Change in plant community composition at 10 plots along the HSTransect 3 .................................................. 36
17. A bird’s-eye view illustration of the N S S ......................................................... 56
18. A cross-sectional and 3-dimensional illustration of soil loss occurring along thefirst thirty-five meters of the NSS Transect 3 .............................. ................. 57
19. A cross-sectional and 3-dimensional illustration of soil loss occurring along thefirst thirty-five meters of the NSS Transect 5 .............. ................................. 58
20. A cross-sectional and 3-dimensional illustration of soil loss occurring along thefirst thirty-five meters of the NSS Transect 6 ................................................59
Figure Page
ABSTRACT
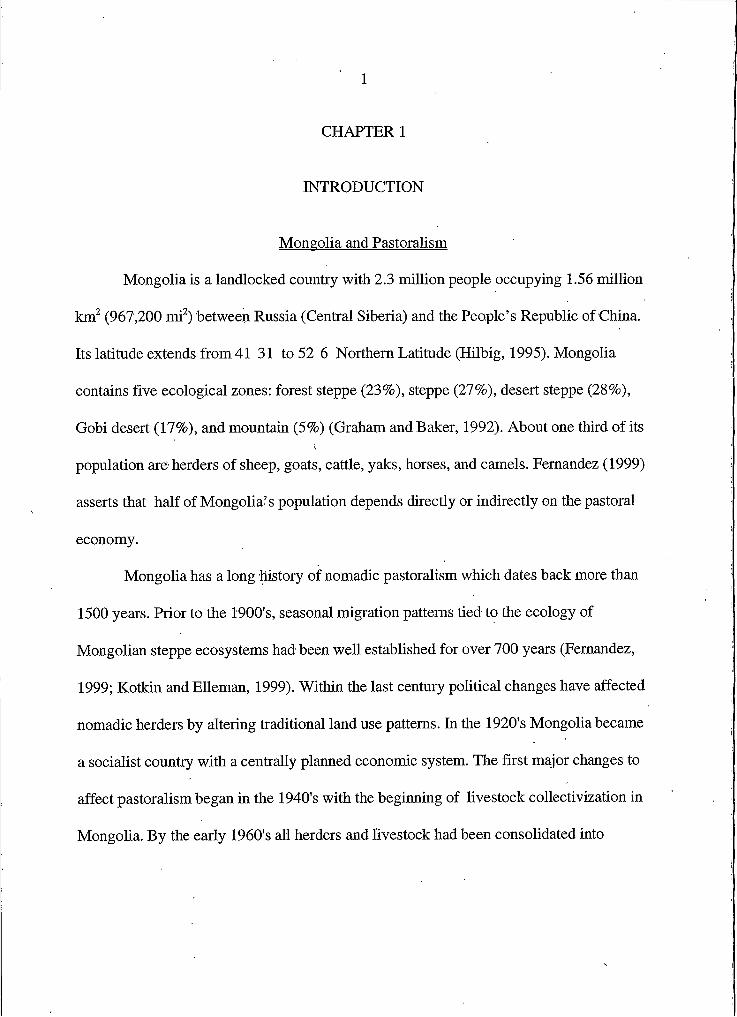
Nomadic pastoralism has endured for more than 1500 years in Mongolia. Within the last century political changes have affected pastoralism by altering traditional land use patterns. Erosion and sand dune activity in the Darhat Valley, Mongolia has accompanied the changes in pastoral practices over the last 50 years and has threatened the sustainability of rangelands iii some areas. The welfare of Mongolian herders is dependent on rangeland productivity. This study describes the affects of saltation and sand dune migration on soils and vegetation and determines if erosion was continuing in the Darhat Valley’s Renchinlhumbe Sum. The New Spring Site (NSS) and the Hoogii Site (HS) were two Renchinlhumbe locations selected for this study.
As barchan sand dunes move they destroy vegetation leaving bare ground. If vegetation does not reestablish these areas, bare soils lose stability and erode. Because barchan dunes in Renchinlhumbe migrate 5-10 m annually, one can estimate the length of time since a dune has left an area. By measuring the thickness of the soil’s A-horizon at increasing distances upwind from the base of windward dune slopes, continuing erosion could be estimated. The thickness of A-horizon along five transects upwind of five migrating dunes was measured. Vegetation data were also collected in this study. Plant community composition based on the percent cover of five data classes: I) bare ground,2) forbs, 3) grasses, 4) sedges, and 5) lichen was determined along seven transects. Each percent composition value was composited from three one-meter hoop measurements.
The thickness of A-horizon measurements showed progressing soil loss with increasing distances upwind of NSS dunes, indicating continuing erosion. Conversely, soil loss and continuing erosion was not found at the HS. Soil stability at both sites was affected by compaction from large dunes and topography. The NSS had a gently rolling terrain and windward slope faces more directly exposed to scouring by saltation. The HS was predominately flat and less susceptible to scouring. Plant community composition data showed that forbs and grasses declined more slowly and recovered more quickly than sedges and lichen. Patterns of vegetative recovery were influenced by differing depths of sand accumulation, and accessibility to ground water.
I
CHAPTER I
INTRODUCTION
Mongolia and Pastoralism
Mongolia is a landlocked country with 2.3 million people occupying 1.56 million
km2 (967,200 mi2) between Russia (Central Siberia) and the People’s Republic of China.
Its latitude extends from 41 31 to 52 6 Northern Latitude (Hilbig, 1995). Mongolia
contains five ecological zones: forest steppe (23%), steppe (27%), desert steppe (28%),
Gobi desert (17%), and mountain (5%) (Graham and Baker, 1992). About one third of its
population are herders of sheep, goats, cattle, yaks, horses, and camels. Fernandez (1999)
asserts that half of Mongolia’s population depends directly or indirectly on the pastoral
economy.
Mongolia has a long history of nomadic pastoralism which dates back more than
1500 years. Prior to the 1900's, seasonal migration patterns tied to the ecology of
Mongolian steppe ecosystems had been well established for over 700 years (Fernandez,
1999; Kotkin and Elleman, 1999). Within the last century political changes have affected
nomadic herders by altering traditional land use patterns. In the 1920's Mongolia became
a socialist country with a centrally planned economic system. The first major changes to
affect pastoralism began in the 1940's with the beginning of livestock collectivization in
Mongolia. By the early 1960's all herders and livestock had been consolidated into

2
organized administrative units called sums. Each sum occupied a territory in which a
group of herders worked collectively to manage and maintain the production of
collective-owned livestock. In exchange, each herder in a collective received a salary and
benefits (Fernandez, 1999). Collectives also developed mechanized infrastructures to
transport trade goods, supplies, and medical and veterinary care to herders in the
countryside.
Prior to the establishment of livestock collectives, animals were maintained in
small herds by family units well distributed across the landscape. These herding
households migrated seasonally and typically covered annual distances of 100-200 km
(Agriteam Canada, 1997). Following collectivization, seasonal migrations continued, but
the large collective herds meant higher intensities of grazing in areas previously occupied
by the herds of just a few families.
Collectives were disbanded in the early 1990's following Mongolia’s transition to
a democracy, and pursuit of a free market economy. When this occurred the large
livestock herds of the collectives were broken up and sold to individual herders, who now
own their livestock outright. In this post-collective period, Mongolia has experienced a
dramatic devaluation of its currency and herders have lost the government salaries and
benefits they received (Kotkin and Elleman, 1999). As a result, contemporary pastoralists
rarely exchange currency, but instead depend on the barter value of their livestock to
purchase trade goods.
Because mechanized infrastructures were dissolved along with the collectives,
herders must now travel to trade centers to purchase goods and access medical and

3
veterinary care. To do so typically requires non-mechanized means, as few can afford to
fuel or maintain a truck, and few can pay the inflated prices charged by middle men. It
has, therefore, become impractical for herders to move far away from areas of trade to
graze their livestock. Accordingly, pastoral migration patterns have changed dramatically
in the post-collective period, and rarely exceed distances greater than 10-20 km from a
trade center (Canada Agriteam, 1997).
The Darhat Valley
The Darhat Valley is located west of Lake Khovsgol in northern Mongolia. It is a
large basin that was a lake system during the Pleistocene. Today, many small lakes and
rivers characterize the basin and are all that remain of a lake comparable in area to Lake
Khovsgol. The Darhat Valley is 110 km long and 10-40 km wide, and its floor is formed
mostly in sandy-oozy lacustrine deposits and, more rarely, gravels (Golden and
Tumurtogoo, 2000; Uflyand et. al., 1969). It supports a grassland community
characteristic of the Mongolian steppe.
Renchinlhumbe Sum in the northern Darhat Valley represents one area in
Mongolia where socioeconomic restructuring, and changing pastoral practices have
significantly altered land use patterns. Renchinlhumbe has maintained a population of
about 4000 people and 70,000 livestock through the 1990's (Tsagaan, 2000). Kotkin and
Elleman (1999) report that 1724 residents were working-age adults in 1996, and of these
1207 (70%) made their living as livestock herders.
4
Over the last 50 years erosion and sand dunes have appeared, and subsequently
spread in a number of Renchinlhumbe locations (Hoogii, 1999). As dunes have formed
and moved across the landscape, they have destroyed vegetation in their path. In these
areas forage productivity has been reduced, in some cases severely. Because the
livelihoods of so many in Renchinlhumbe’ s post-collective community have come to
depend directly on pastoralism, the loss of rangeland forage productivity has become a
growing concern.
The overall objective of this project was to initiate the study of wind erosion and
sand dune formation in Renchinlhumbe and develop a method for monitoring their
progress. This will improve herders’ awareness of these landscape processes and help
them to make more informed land use decisions. Before these concerns can be addressed,
however, an understanding of how and why sand dunes form, move, and impact soil
surfaces is necessary. It is also beneficial to know about the implications of
desertification in other areas of Asia.
Literature Review
The Physics of Sand Dune Migration
The primary components of soil are sand, silt, and clay. The smallest or finest
fraction of these are the silts and clays with particle sizes between 0.05-0.002 mm and
< 0.002 mm, respectively. Sand consists of particles between 0.05-2 mm. When soil is
eroded by the wind, particles become suspended in air according to their respective
particle sizes. If the wind is sufficiently strong, the silt and clay fractions of an eroding
5
soil can be carried high into the atmosphere where they may remain suspended for days.
These particles may travel hundreds of kilometers from their point of origin before
returning to the ground (Lancaster, 1995).
Unlike silts and clays, most sands (i.e. particle sizes > 0.1 mm) are too heavy to
travel long distances by wind. Instead, they tend to travel along the ground by a series of
short bounces in a process known as saltation (Brady and Weil, 1999). Once a sand
particle becomes airborne, it begins to accelerate as it falls back to the ground (Lancaster,
1995). This added momentum increases the particle’s potential for dislodging other
particles as it impacts the soil surface. The effect of saltation on soil is considered greatest
on smooth, hard surfaces with little roughness1. Under these conditions, particles lose less
momentum as they collide with the ground, allowing them to remain active longer, and to
displace a larger number of stationary sand grains.
A single rebounding sand grain can dislodge as many as 10 stationary grains (Pye
and Tsoar, 1990). A cloud of sabating sand therefore, can contribute significant scouring
properties to the wind. Pye and Tsoar (1990) describe three erosional processes resulting
from aeolian sands. Their list includes (a) deflation which refers to the loss of loose
sediments by direct wind drag, (b) entrainment, the suspension of loose sediment by
particle impacts, and (c) the abrasion of hard surfaces resulting from entrained clouds of
sediment.
1 Surface roughness refers to the presence of vegetation or other non-erodible surface elements that impair the movement of sand across a surface (Lancaster 1995).
6
Though the study of sand dune dynamics is extensive, the process of dune
accretion is still poorly understood. One theory proposed by Bagnold (1941) details a
process driven by the tendency of loose sand to reduce the momentum of sabating sand
grains. Saltating rapidly across smooth, hard, stable soil surfaces, they lose speed and
energy when encountering the loose materials of an active sand bed. This causes the sand
grains to fall out of suspension and accumulate, enhancing dune formation. BagnokTs
theory, if correct, would explain how a dune can continue to receive additions and grow
far downwind from a sand source.
Barchan Sand Dunes
The barchan is a crescentic sand dune characterized by a pair of wing/hom like
structures extending downwind of its main body. According to Hesp and Hastings (1998),
the barchan dune represents one of the most streamlined shapes in nature, and its
wings/horns typify the streamlining effects of wind on a mobile, erodible surface. The
formation of the wings/horns is attributed to the tendency of windblown sand to move
more quickly along the sides of the dune than over its center where the impact angle is
greatest (Pye and Tsoar, 1990). To maintain their crescentic form, barchans require a
stable wind regime where a single, dominant wind direction persists. Pye and Tsoar
(1990), and Lancaster (1995) further relate that these dunes are most stable in areas where
sand sources are limited. Barchans which develop under these conditions have the
potential to become long term landscape features that migrate' great distances and endure
7
for centuries. It is generally agreed that 5-10 m/yr is the typical migration rate for most
large barchans, though rates >30 m/yr have been recorded for some smaller dunes
(Gay, 1999; Khatelli and Gabriels, 1998; Lancaster, 1995). For a more detailed discussion
of the dynamics of barchan formation see Pye and Tsoar (1990).
Desertification and Climate Change
Environmental data collected throughout the world over the last century provides
compelling evidence of significant climate change within the last 100 years. Few regions
provide more evidence of this than Asia, where desertification is an increasing problem
for a rapidly expanding human population. Kazimierz (1980) contends that pollen spectra
extracted from Upper Quaternary lacustrine deposits reveal that a shift towards aridisation
began to occur throughout Siberia and central Asia.about 2000 years ago. For at least
3000 years prior, these areas experienced a wetter, more humid climate regime
(Kazimierz, 1980). Mongolian tree ring data indicate that, compared to earlier centuries,
the 20th century represents a period of unusual warmth (Jacoby et al., 1996). In addition,
Xue (1996) describes a trend towards aridity over the past 40 years for Mongolian and
Inner Mongolian grasslands as evidenced by a significant southeastward shift of the
mixed land use belt.
The extent to which anthropogenic activities have contributed to climate change
has been a hotly debated topic for decades. Today, many scientists relate much of the
change to an expanding human population and the changes in land uses that have been
required to accommodate its growth. In support of this view Dahl and Mckell (1986)

8
explain that of the 40,920 km2 (66,000 mi2) of Asian deserts which have been attributed
to anthropogenic activities over the past 2500 years, 12,400 km2 (20,000 mi2) have
formed within the last 50 years. The primary causes for the rapid expansion of Asian
desertification during this time are attributed to deforestation, overgrazing, and over
cultivation (Kharin, 1985; Xue, 1996).

9
CHAPTER 2
CHARACTERIZING WIND EROSION AND SAND DUNE ACTIVITYIN THE DARHAT VALLEY
Introduction
Decades of wind erosion and sand dune activity in the Darhat Valley’s
Renchinlhumbe Sum have resulted in the loss of productive rangeland. If
Renchinlhumbe’ s pastoral traditions are to remain sustainable in the future, then its
herding community will need to improve their understanding of the dynamic processes of
wind erosion and sand dune formation. Currently, many areas affected by these processes
are widely scattered throughout the Sum. This makes it difficult for herders to be sensible
to how much total area in Renchinlhumbe has been impacted by wind erosion. Moreover,
it makes it difficult for them to determine if effected areas as a whole are declining,
remaining static, or continuing to spread over time.
To assess the need for implementing erosion control strategies, herders and
government officials from the town of Renchinlhumbe (the Sum’s trade center) wish to
learn how to monitor areas impacted by wind erosion and sand dune activity to determine
if these processes are ongoing. This will allow them to identify locations where wind
erosion is continuing and grazing practices are in most need of evaluation and change.
Though many effective monitoring techniques exist today, most are inapplicable in
Renchinlhumbe because they require tools and technologies that are inaccessible to its

10
pastoral community. Relative isolation, economic hardships, and severely limited natural
resources necessitate the herders’ need for simple, practical monitoring techniques.
Objectives
To assist Renchinlhumbe’ s pastoral community, the objective of this project was:
(I) to characterize sand dune activity in the Darhat, and (2) to develop and test a simple
monitoring technique capable of determining if erosion is continuing.
Methods and Materials
Site Descriptions
Two representative sites in the northern Darhat Valley were chosen for this
project. Study area I, the New Spring Site (NSS), was located (51° 13' 46.1726"N, 99° 37'
22.3366"E) approximately 12 km (J1A mi) north of Renchinlhumbe. This site occupied
an area roughly I km2 (0.62 mi2) in size, and was situated between a stream at its
westernmost boundary and a small wooded lake system at its northeast comer. The NSS
features 6 barchan sand dunes which are migrating in a SE direction approximately
5-10 m per year (Figure I). The landscape in this area is characterized by a gently rolling
topography with some relatively steep slopes along the lake’s shoreline. The general
elevation for this site is 1560 m.
Study area 2, the Hoogii Site (HS), was established (51° 18' 20.6564"N, 99° 35'
10.90"E) approximately 25 km (15 1A mi) NNW of Renchinlhumbe, and represents an
estimated area of 0.75 km2. This site borders a dry, eroded riverbed to its NW, which is

11
believed to be the point source of the area’s three barchan sand dunes (Figure 2). An
escarpment approximately 150 m in front of Dune I determines the SE boundary for the
HS. The dunes are traveling in a SW direction at an estimated 5-10 m per year (Hoogii,
1999). The HS is predominately flat between its NW and SW boundaries. The only
exceptions to this were the dune trail ridges which formed as the dunes migrated.
The soils at the NSS and the HS were classified as fine-sandy, siliceous, Typic
Calcicryolls. These soils are deep, well drained, and have high permeability. They are
formed in lacustrine deposits which are extensive throughout the Darhat Valley. The
climate is cold, with very cold winters, monsoonal summers, and fewer than seventy days
of growing season annually. Based on precipitation and temperature data provided by the
Renchinlhumbe Sum weather station for the twenty-five year period between 1974 and ;
1998, annual precipitation and temperatures in Renchinlhumbe typically range from 250
mm to 350 mm and -7.5 0C to -8.5 0C, respectively.
Study Design
Because barchans migrate 5-10 m annually, it is possible to estimate the length of
time since a dune has left a particular area. If, as a dune migrates, reductions in the
thickness of the soil surface (A-horizon) occur relative to increasing distance from the
base of the dune’s windward slope, then continuing erosion can be inferred. Based on this
reasoning A-horizon thicknesses were measured along transects extending upwind from
the windward base of 5 Renchinlhumbe sand dunes. Due to the mixing of soil horizons
12
2 » I
Lake Turuunii
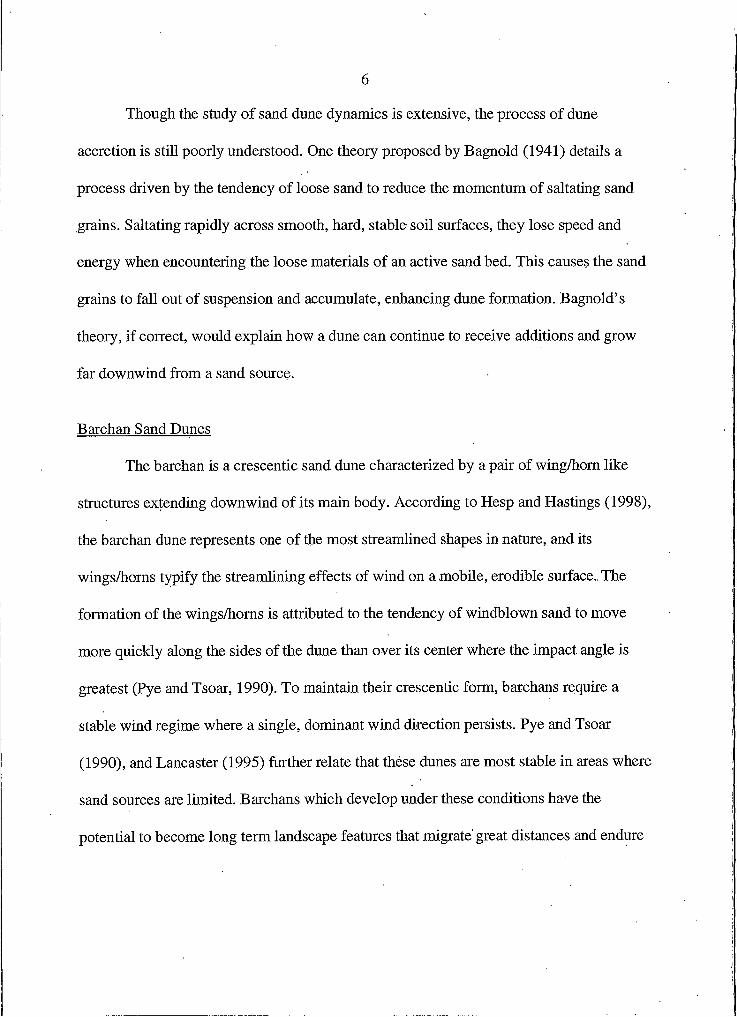
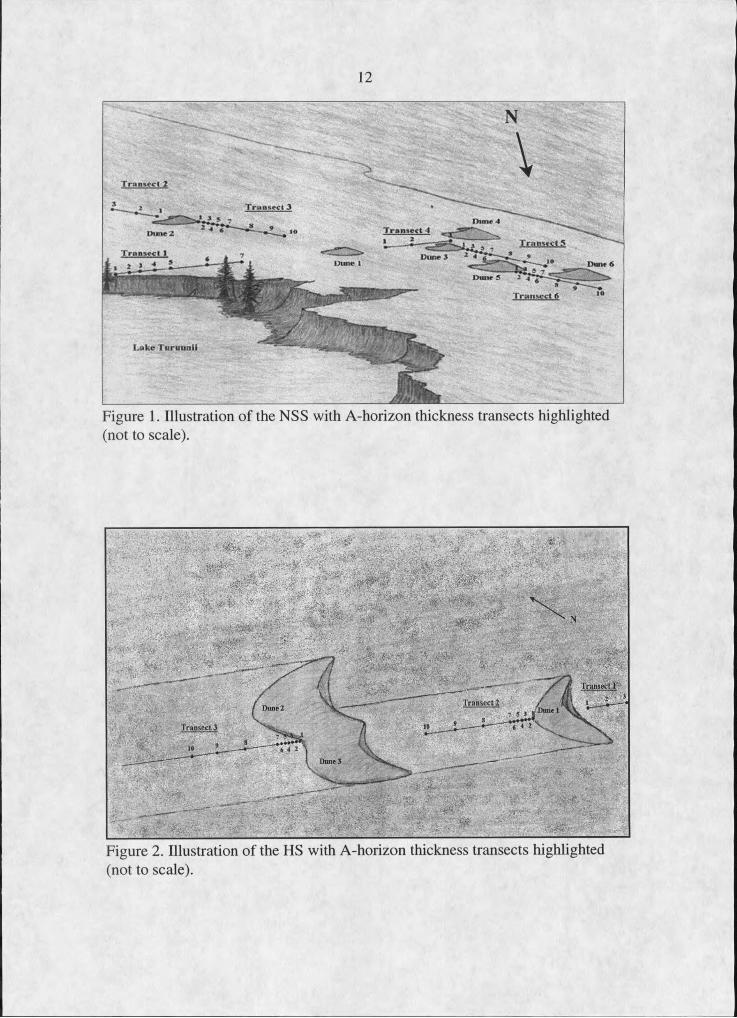
Figure I. Illustration of the NSS with A horizon thickness transects highlighted (not to scale).
Transect 2Dune 2
Transect 3
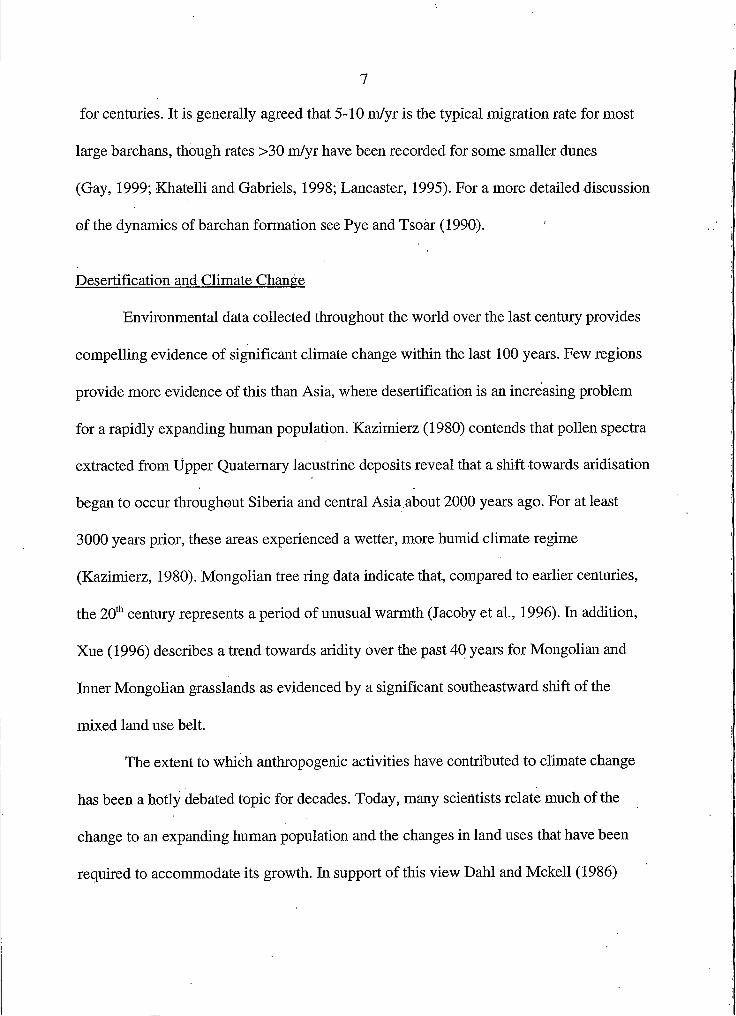
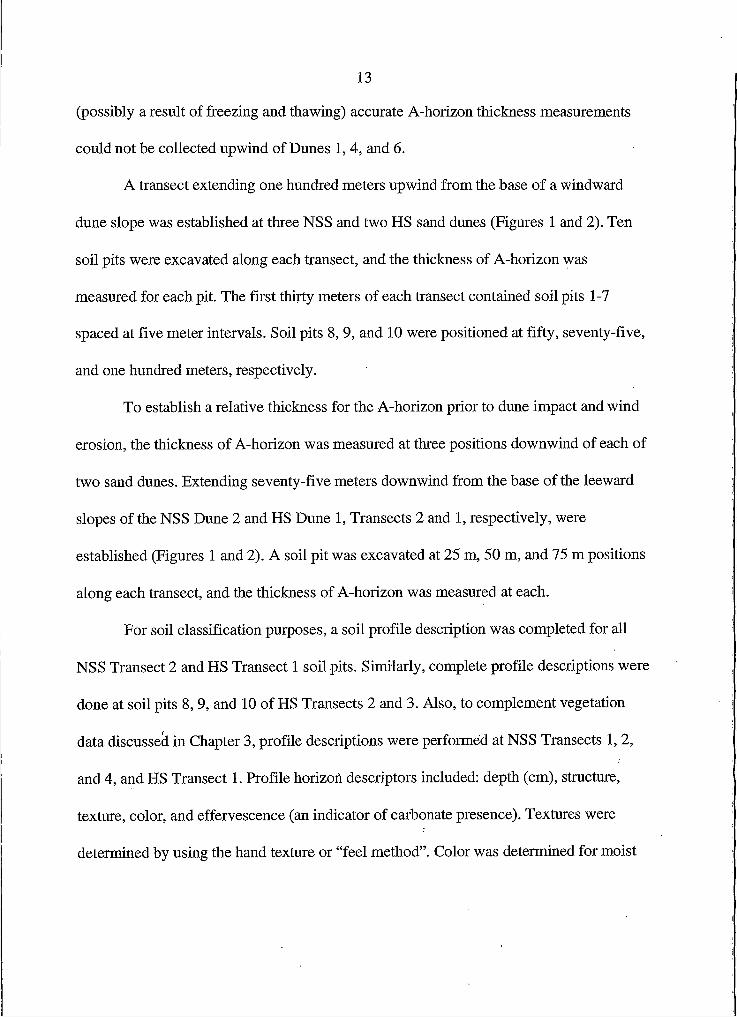
Figure 2. Illustration of the HS with A horizon thickness transects highlighted (not to scale).
13
(possibly a result of freezing and thawing) accurate A-horizon thickness measurements
could not be collected upwind of Dunes I, 4, and 6.
A transect extending one hundred meters upwind from the base of a windward
dune slope was established at three NSS and two HS sand dunes (Figures I and 2). Ten
soil pits were excavated along each transect, and the thickness of A-horizon was
measured for each pit. The first thirty meters of each transect contained soil pits 1-7
spaced at five meter intervals. Soil pits 8, 9, and 10 were positioned at fifty, seventy-five,
and one hundred meters, respectively.
To establish a relative thickness for the A-horizon prior to dune impact and wind
erosion, the thickness of A-horizon was measured at three positions downwind of each of
two sand dunes. Extending seventy-five meters downwind from the base of the leeward
slopes of the NSS Dune 2 and HS Dune I, Transects 2 and I, respectively, were
established (Figures I and 2). A soil pit was excavated at 25 m, 50 m, and 75 m positions
along each transect, and the thickness of A-horizon was measured at each.
For soil classification purposes, a soil profile description was completed for all
NSS Transect 2 and HS Transect I soil pits. Similarly, complete profile descriptions were
done at soil pits 8, 9, and 10 of HS Transects 2 and 3. Also, to complement vegetation
data discussed in Chapter 3, profile descriptions were performed at NSS Transects I, 2,
and 4, and HS Transect I. Profile horizon descriptors included: depth (cm), structure,
texture, color, and effervescence (an indicator of carbonate presence). Textures were
determined by using the hand texture or “feel method”. Color was determined for moist
14
samples using a Munsell color book, and carbonate presence was detected by the
effervescence of soil with a 10% solution of HCL.
Results and Discussion
Eroding Shorelines and Sand Dune Formation
The NSS contains two lakes. Lake Turuunii and a small neighboring lake
(unnamed), that provide drinking water for livestock throughout the summer months.
Bisecting these lakes is a main road that supports animal and mechanized trafficking to
and from Renchinlhumbe Sum’s trade center. Extensive soil loss, indicative of decades of
active wind erosion, was observed where the shorelines of each lake paralleled the main
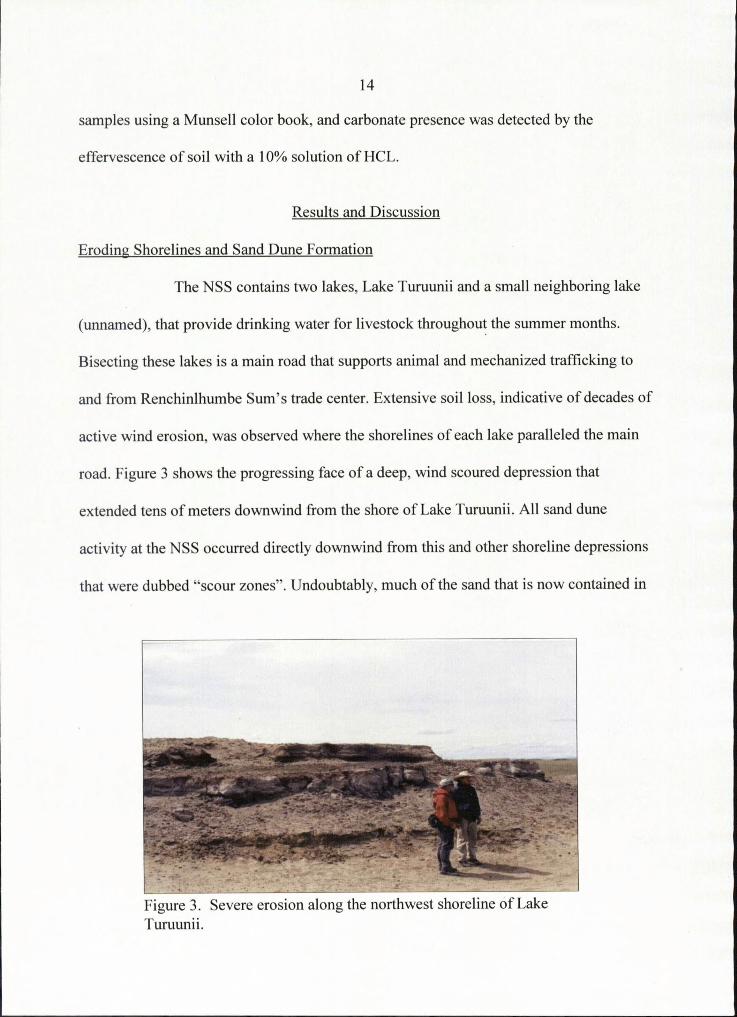
road. Figure 3 shows the progressing face of a deep, wind scoured depression that
extended tens of meters downwind from the shore of Lake Turuunii. All sand dune
activity at the NSS occurred directly downwind from this and other shoreline depressions
that were dubbed “scour zones”. Undoubtably, much of the sand that is now contained in
Figure 3. Severe erosion along the northwest shoreline of LakeTuruunii.

15
the NSS dunes originated from the areas’ two severely eroded lake shores. Evidence of
this appears on a Landsat TM image taken in September 1999 that shows areas of erosion
and sand dune activity extending downwind from the two NSS lakes (Figure 4). Erosion
and sand dune activity correspond to those areas appearing lightest in color at the NSS.
The site’s two lakes appear darkest in color in the northwest quadrant of the NSS. Dune
2, indicated on the image by the lower arrow, represents the southeastern most extent of
dune activity at the NSS. Light colored streaks extending downwind from the
southeastern shorelines of lakes like Targan west of the NSS, show that erosion and sand
dunes are pervasive in other Renchinlhumbe locations as well.
According to Dregne (1995) desertification often initiates around areas like
watering points where intensive land use is common. The nearness of the two eroded
NSS lake shores to a road and a number of seasonal herder campsites provides the
opportunity for soils here to sustain frequent impacts from livestock in search of water.
Daily animal trafficking along the eroded bank of Lake Turuunii was observed
throughout the summer of 1999. Because information obtained from local herders was at
times inconsistent, it was difficult to definitively establish a long-term cause and effect
relationship between land use (i.e. livestock activity) and wind erosion at the NSS.
Nevertheless, many years of prolonged exposure to animal use seemed a highly plausible
explanation for how these banks lost stabilizing vegetation, became vulnerable to wind
erosion, and subsequently contributed to sand dune formation. Evidence supporting this
view appeared where the soil pits of NSS Transect I followed an eroded path used to

16
Figure 4. A September 1999 Landsat TM image of the New Spring and Hoogii study sites in the Darhat Valley. The yellow line running through the New Spring Site approximates the route of the main traffic corridor. This image was provided courtesy ofClyde Golden.

17
access water. Table 3 shows that platy soil structure occurred in the Ab-horizons of
profiles 1-5 (Appendix A). Compaction and platy structure are often indicative of soils in
highly trafficked areas that have become compacted as a result of heavy use (Abdel-
Magid et. ah, 1987, Kozlowski,!999). This eroded section likely typifies other stretches
of shoreline at the NSS where unstable soils have been eroded by the wind.
The HS sand dunes are named for Hoogii, a herder who has resided in the area
since 1948. Hoogii (1999) contends that years of overgrazing by a large sheep collective
during the socialist government era caused soils along a local river bank to deteriorate
and erode. The river and the lake from which it flowed became dry for unknown reasons
during the 1980's. The HS sand dunes are located downwind of the currently dry riverbed,
and seem to have originated in a large depression along the eroded bank. Because
vegetation has reestablished and stabilized eroded and sand affected areas upwind of the
HS dunes, it is difficult to identify them on the Landsat TM image (Figure 4). Similar to
the NSS, dunes at the HS (indicated by upper arrow) correspond to the areas of lightest
color. Notice that individual dunes at the NSS are difficult to discern in the image
because they are indistinguishable from surrounding areas of bare ground generated by
active erosion. The HS dunes, however, appear more distinct in the landscape because
they were the only areas of bare ground detected at this site by the Landsat satellite’s 30
m pixel resolution. It is probable that reduced animal use resulting from the river
becoming dry and the disbanding of the sheep collective has facilitated vegetation
reestablishment at the HS.
18
Sand Dunes and Soil Loss
Barchan dunes at the NSS and HS continue to actively travel downwind through
processes of foredune deposition and post dune scour. As they progress across the
landscape they bury and subsequently eliminate vegetation. These dunes average 60 m in
width. If a dune of this size advances 10 m, 600 m2 of bare soil will be exposed each year.
Consequently, where large dunes are abundant, their cumulative effects can generate
large areas of bare ground. If vegetation is unable to reestablish and stabilize these areas,
soils become vulnerable to the scouring effects of the valley’s strong winds. Lyles (1988)
explains that the impact of saltating particles abrades and breaks down large soil
aggregates, reducing them to sizes removable by the wind. Because the NSS has a gently
rolling terrain and numerous windward slope faces, wind scouring is a particular concern
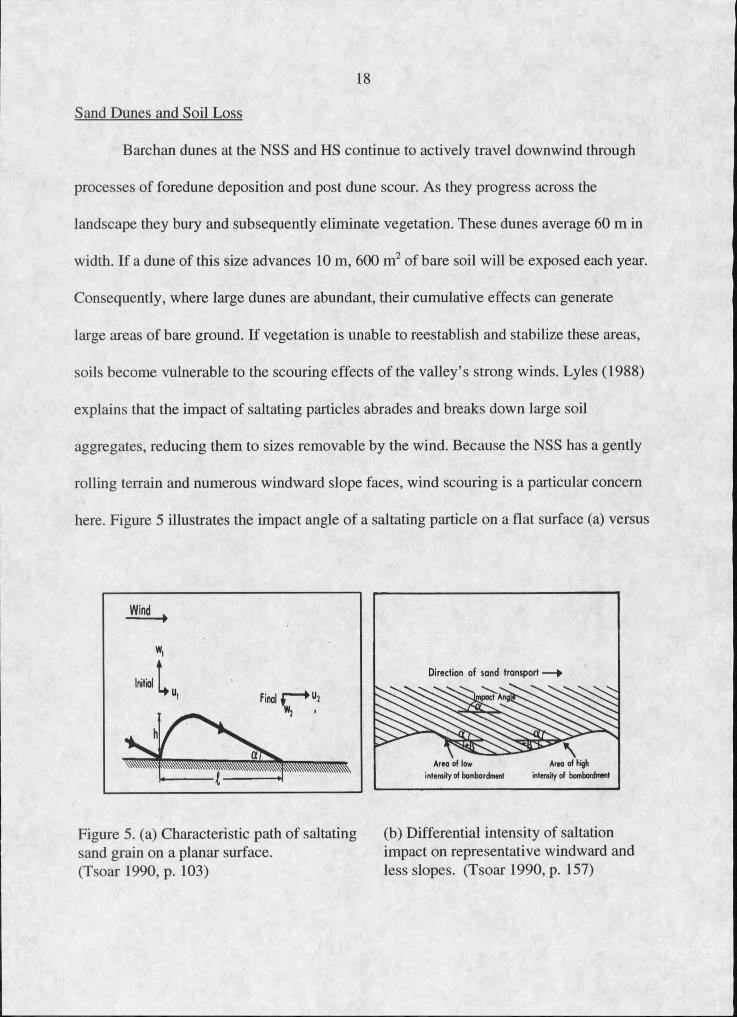
here. Figure 5 illustrates the impact angle of a saltating particle on a flat surface (a) versus
Direction of sand transport
ipact Anj
Area of high intensity of bombardment
A rea of lowintensity of bombardment
Figure 5. (a) Characteristic path of saltating (b) Differential intensity of saltation sand grain on a planar surface. impact on representative windward and(Tsoar 1990, p. 103) less slopes. (Tsoar 1990, p. 157)
19
a sloped surface (b). As the angle of a windward slope increases, the more directly
exposed it becomes to the destructive energy of wind blown sand. Evidence of this
destructive energy can been seen in the 2.5 m of excavated soil pictured in Figure 3.
Sometime after the NSS sand dunes formed and began migrating across the
landscape, bare soils immediately upwind of their windward bases began to destabilize
and new scour zones formed. Four of these scour zones extend >100 m upwind of Dunes
3,4,5, and 6, respectively, indicating that soil loss had persisted in these areas for many
years. Furthermore, nearness of the scour zone’s leading edges to the bases of the mobile
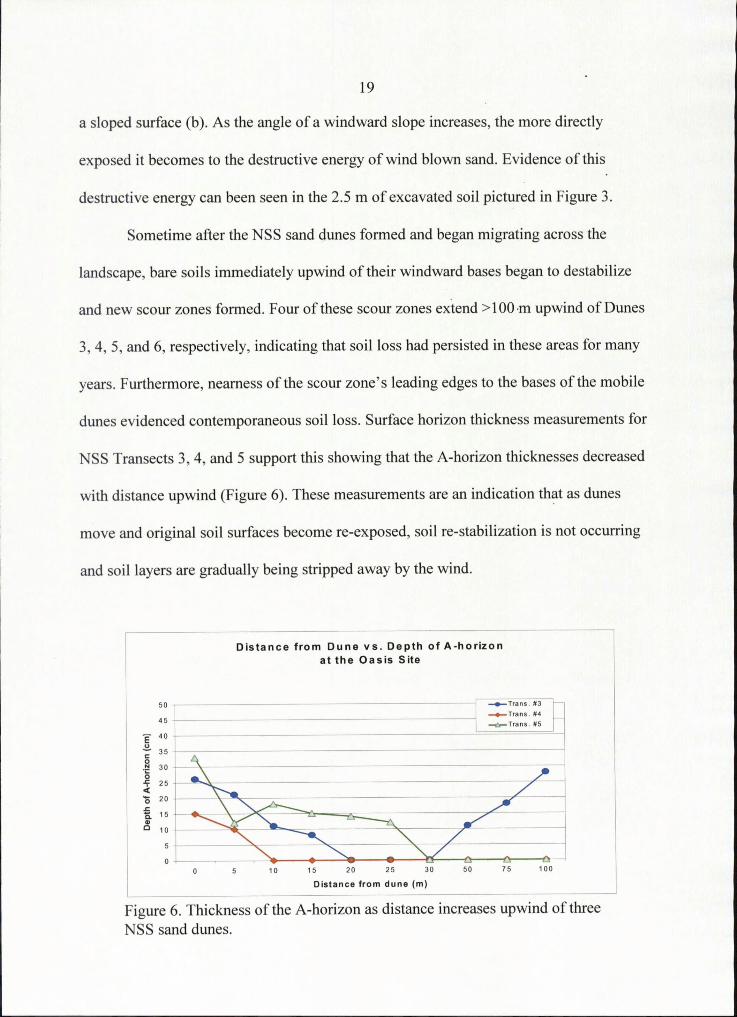
dunes evidenced contemporaneous soil loss. Surface horizon thickness measurements for
NSS Transects 3, 4, and 5 support this showing that the A-horizon thicknesses decreased
with distance upwind (Figure 6). These measurements are an indication that as dunes
move and original soil surfaces become re-exposed, soil re-stabilization is not occurring
and soil layers are gradually being stripped away by the wind.
Dis tance from Dune vs . Depth of A-horizon at the Oas is Site
Trans. #3 Trans. #4 Trans. #5
■¥ 25
0 5 10 15 20 25 30 50 75 100
Distance from dune (m)
Figure 6. Thickness of the A-horizon as distance increases upwind of three NSS sand dunes.
20
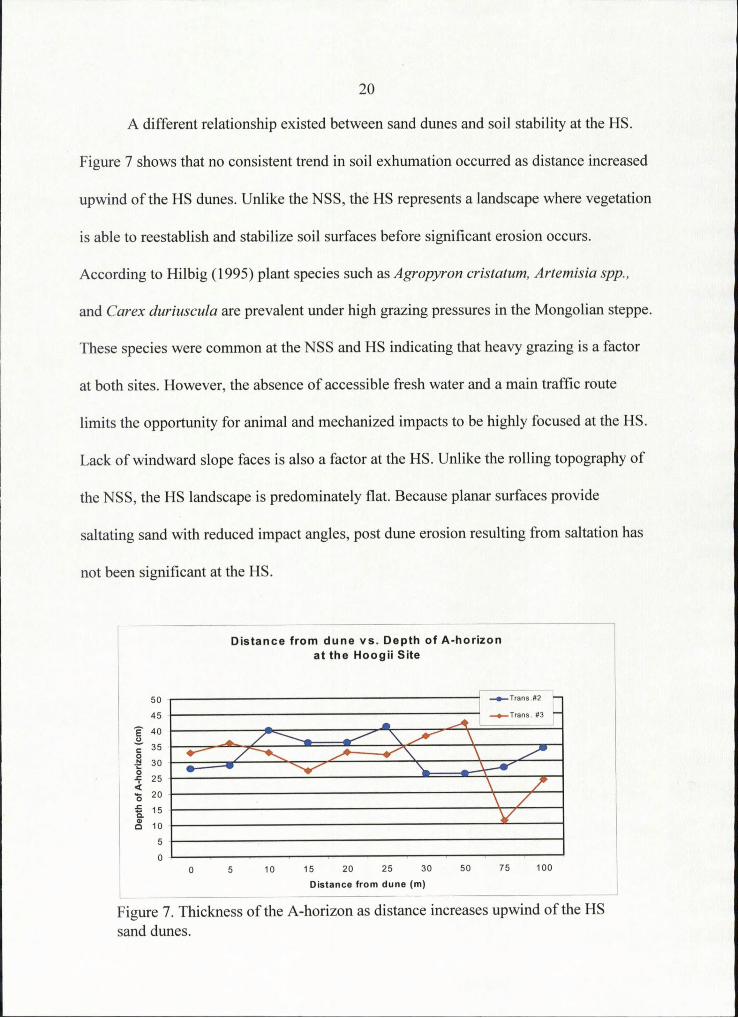
A different relationship existed between sand dunes and soil stability at the HS.
Figure 7 shows that no consistent trend in soil exhumation occurred as distance increased
upwind of the HS dunes. Unlike the NSS, the HS represents a landscape where vegetation
is able to reestablish and stabilize soil surfaces before significant erosion occurs.
According to Hilbig (1995) plant species such as Agropyron cristatum, Artemisia spp.,
and Carex duriuscula are prevalent under high grazing pressures in the Mongolian steppe.
These species were common at the NSS and HS indicating that heavy grazing is a factor
at both sites. However, the absence of accessible fresh water and a main traffic route
limits the opportunity for animal and mechanized impacts to be highly focused at the HS.
Lack of windward slope faces is also a factor at the HS. Unlike the rolling topography of
the NSS, the HS landscape is predominately flat. Because planar surfaces provide
saltating sand with reduced impact angles, post dune erosion resulting from saltation has
not been significant at the HS.
Dis ta nc e from d u n e v s . Depth of A hor izon a t the Hoogii Site
Trans #2
Trans #3 “
£ 15
□ 10
o 5 10 15 20 25 30 50 75 100
Distance from dune (m)
Figure 7. Thickness of the A-horizon as distance increases upwind of the HS sand dunes.

21
Sand Dunes and Soil Compaction
Soil structure data from the NSS and the HS in Tables 3 and 4 suggest that sand
dunes can modify soil structures as they traverse the landscape (Appendix A). At the
Darhat Valley study sites, grassland mollisols undisturbed by sand dune activity have fine
sub-angular blocky or granular structures in their surface horizons. Soil surfaces re
exposed upwind of migrating dunes have platy structure attributable to the weight of the
advancing dunes. With an average height of 11 m, Dune 3 at the HS, for example, can
exert an estimated 17,920 kg/m2 (39,424 Ibs/yd2) of pressure upon a soil surface2.
Extended exposure to this pressure has compacted the soil surface horizon, and
compressed blocky and granular structures into plates. The resultant bare soil surface is
smoother and harder, becoming more supportive of saltation and less amenable to plant
reestablishment than the original soil.
Hard surfaces exacerbate saltation-induced erosion because they absorb less
energy from the impacting sand grains. This allows the sand to stay suspended longer and
impact a larger area. Platy structure can also facilitate the process of wind erosion.
Lancaster (1995) explains that plate shaped mineral grains typically maintain lower
trajectories than comparable spheroidal mineral grains, causing them to sabate longer.
Though no supporting literature was found, the writer conjectures platy soil aggregates
(peds) will move further by saltation than spheroidal aggregates as well. Moreover, soil
containing platy aggregate structure has less macropore volume. This loss of air filled
pores effectively reduces the soil’s capacity to mitigate impacts from animal/mechanized
2 Estimated pressure based on laboratory measurements using sand of medium grain size.

2 2
trafficking, making it less resilient and more easily degraded by these processes.
Evidence of this was observed in situ where trafficked platy soil structures readily broke
into small sheets or flakes that were easily striped away by the wind.
I

23
CHAPTER 3
CHANGES IN PLANT COMMUNITY COMPOSITION
IN RELATION TO EROSION AND SAND DUNE ACTIVITY
. Introduction
The maintenance of vegetative ground cover is critical to the stability of soils in
the Darhat Valley. As ground cover decreases, sandy textured soils become increasingly
susceptible to wind erosion. The NSS and the HS had plant communities that reflected
various stages of degradation resulting from wind erosion and sand dune activity and
subsequent stages of recovery. Extensive soil loss and large expanses of mostly bare
ground provided evidence for the absence of surface stabilizing vegetation and soil
degradation at the NSS. Soil surface stability and vegetative cover, however, prevailed at
the HS.
Plant community response to the affects of saltation and sand dune migration in
the Darhat Valley is poorly understood in Renchinlhumbe. Because herders there are
concerned about forage productivity, it is important that they improve their understanding
of how saltation and sand dunes contribute to vegetation loss. Similarly, understanding
plant reestablishment following these erosion processes is pertinent, for it can help to
establish the role of other site-specific factors in facilitating or impeding vegetation
recovery.

24
Objectives
The objective of this part of the study was to further understanding of the function
and dynamics of erosion in the Darhat Valley by assessing the changes in plant
community composition in relation to erosion and sand dune activity.
Methods and Materials;
Study Design
Plant communities were studied along four NSS transects and three HS transects
that corresponded to soils transects discussed in Chapter 2 (Figures 8 and 9). With
exception of NSS Transect 2 which had one additional vegetation plot (11), all transect
vegetation plots corresponded to soil pit locations. Because only bare soils were present
at NSS plots 1-7 of Transect 2 and plots 1-10 of Transects 5 and 6, no corresponding
vegetation data could be collected.
Due to the lack of vegetation data along upwind dune transects. Transects I and 3
were established to document changes in the species composition of plant communities in
two additional locations of the NSS effected by saltation. Transect I occurred along a
section of Lake Turuunii-s eroded northwest facing bank (Figure 8). This transect
contained seven plots, five of which ran 1-2 meters upwind and nearly parallel to the edge
of the eroded bank. Transect 3, established as a distant extension of Transect I, was
positioned downwind of Dune 3 and contained three plots. Vegetation plots for Transects
I and 3 were selected according to observable changes in total plant cover relative to bare
ground, rather than by distance. Areas of high plant cover that were designated as stable

25
Transect 3
T r a n s e c t I
Figure 8. Illustration of the NSS with transects containing vegetation plots highlighted (not to scale).
Tramect 3
Figure 9. Illustration of the HS with transects containing vegetation plots highlighted (not to scale).

26
communities corresponded to >50% ground cover (GC). Likewise, communities
demonstrating moderate plant density and low plant density were designated as semi
active (<50% GC) and active (<10% GC), respectively. Effort was made to avoid
transitional areas by establishing plots in the center of a defined vegetative community.
Plant community composition determinations for each plot were based on the
percent coverage of five data classes: I) bare ground (BG), 2) forbs, 3) grasses, 4) sedges,
and 5) lichen. To obtain a percent value for the plant class(es) at a plot, a one meter nylon
rope hoop was randomly tossed three times, in close proximity to a central soil pit. The
percent surface area covered by each plant class was then visually assessed and recorded
for the area inside each hoop. In addition, the number of species representing each of the
four vegetation classes was recorded. Hoop data from each plot were later composited to
create a single averaged value.
Results and Discussion
New Spring Site Transect I
Field observations indicated that the two NSS lakes were frequently used as
watering areas by resident and trafficking animals during this study. Evidence that animal
use has facilitated wind erosion along shorelines appeared in the plant communities of
Transect !(Figure 10). Plots 1-5 ran nearly parallel to an eroding 3-4 m (10-12 ft) high
bank that bordered Lake Turuunifs southwest shoreline and provided the sand source for
this area of the transect. Plots 6 and 7 received sand additions from the more distant
northwest sections of the eroded bank.

27
PLANT COMMUNITY COMPOSITION (New Spring Site Transect 1)
O. 50
Plo t#
D % Forbs□ % Grass□ % Sedge□ % Lichen□ % Bare Ground
Figure 10. Change in plant community composition at seven plots along the NSS Transect I.
Various levels of impact from wind blown sand was evident in the plant
communities of Transect I . Plots 2, 5, and 7 had stable plant communities (i.e.<50 %
BG), indicating that sand deposition was the most limited at these sites (Figure 10). The
plant community at plot 2 was predominately forbs with a small percentage of grasses.
Plots 5 and 7 supported a similar forb/grass community. However, unlike plot 2, plots 5
and 7 also contained sedges, indicating that a more complex plant community was present
at these two plots. For this reason, impact from current sand activity was believed to be
limited at plots 5 and 7, as their vegetation appeared to be recovering rather than
degrading. Conversely, reduced plant diversity and close proximity to an area of active
erosion were evidence that vegetation at plot 2 was slowly degrading.
28
With respective BG values of 73% and 75%, plots I and 3 were designated as
semi-active. Surficial sand depth was measured at 43 cm for plot I, and 15 cm for plot 3.
Because active erosion was impacting these two plots, the plant communities of both
were decreasing in density and diversity. Variation between the vegetative compositions
of plot I and plot 3 (i.e. the dominance of grass or forb) can be explained by their
differing depths of accumulated surface sand (Table I).
Described as active, plots 4 and 6 each had >90% BG. They both had relatively
deep surficial sand deposits of 64 cm (plot 4) and 92 cm (plot 6). The only vegetation
present at these two sites was a taprooted grass (Elymus racemosus), indicating that this
grass was better suited for recovering active areas where deposits of sand were deepest.
This assertion was further supported by field observations of the grass occurring only on
deep active sands, and Hilbig (1995).
New Spring Site Transect 2
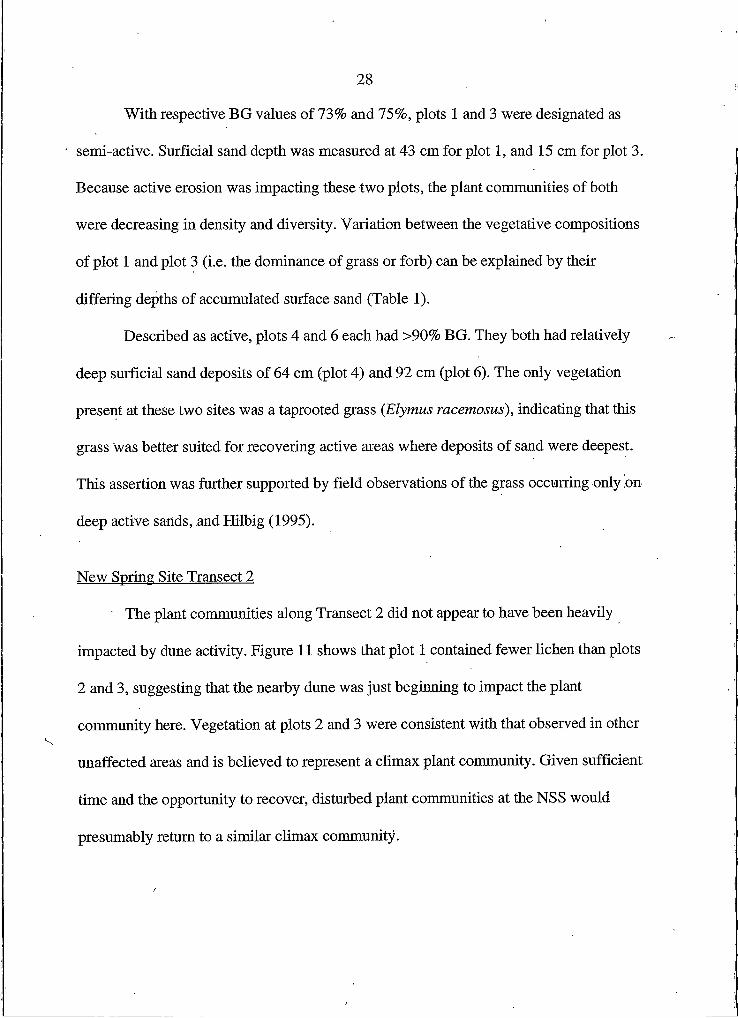
The plant communities along Transect 2 did not appear to have been heavily
impacted by dune activity. Figure 11 shows that plot I contained fewer lichen than plots
2 and 3, suggesting that the nearby dune was just beginning to impact the plant
community here. Vegetation at plots 2 and 3 were consistent with that observed in other
unaffected areas and is believed to represent a climax plant community. Given sufficient
time and the opportunity to recover, disturbed plant communities at the NSS would
presumably return to a similar climax community.

29
TaOe I T h e g p iix lo c ^ data s^ s for the four NSS transects
Hot#□stance
from dine (cm)Depthof
surface sand (Baregound Fbrbs Grass
0/Sedge Lichen
uii; /0
Transect#11 - 43 73 3 24 0 02 - 12 43 52 5 0 03 - 15 75 19 6 0 04 - 64 90 0 10 0 05 - 24 43 44 10 3 06 - 92 95 0 5 0 07 - 17 39 46 9 6 0
Transect #21 25 0 48 23 18 6 52 50 0 35 31 18 5 113 75 0 38 25 20 5 13
Transect#38 50 0 61 1 1 37 09 75 - 60 12 13 15 010 100 - 82 3 14 1 011 125 - 92 1 7 0 0
Transect#41 - 30 35 7 3 I 02 - 73 15 6 3 0 183 - 32 34 7 3 1 0

30
PLANT COMMUNITY COMPOSITION (New Spring Transect 2)
P lo t#
a% Forbs□ % Grass 0% Sedge□ % Lichen□ % Bare Ground
Figure 11. Change in plant community composition at seven plots along the NSS Transect I.
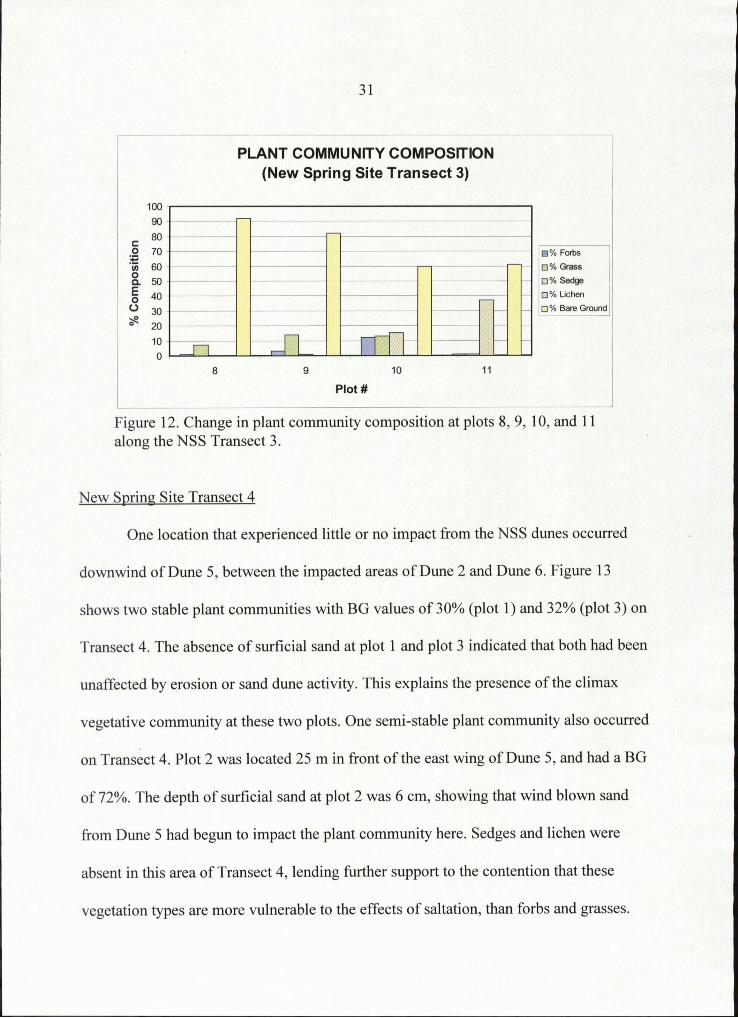
New Spring Site Transect 3
Plant communities were measured along a transect progressing upwind from the
NSS Dune 2. As distance upwind from Dune 2 increased, vegetation made a transition
from a sedge dominated community to a grass dominated community (Figure 12).
Because increasing distance corresponded to increasing lengths of time for vegetative
recovery, initial reestablishment by sedges indicates their function as pioneer species at
this site. Standing water at a depth of 92 cm and 89 cm at plots 10 and 11 (Appendix A),
respectively, and the initial dominance of sedges at plots 8 and 9 indicate that the water
table is < 100 cm along much of this transect. Over time, grasses increased in abundance
and eventually replaced sedges as the dominant vegetation type. The increase in % BG
and decline of sedges from plot 8 to plot 11 in Figure 12 was a consequence of their
proximity to a scour zone located about ten meters upwind of plot 11. See additional
illustration in Appendix B.
31
PLANT COMMUNITY COMPOSITION (New Spring Site Transect 3)
O
"5)
REo
O5?
H% Forbs□ % Grass D % Sedge□ % LichenQ% Bare Ground
Plo t#
Figure 12. Change in plant community composition at plots 8, 9, 10, and 11 along the NSS Transect 3.
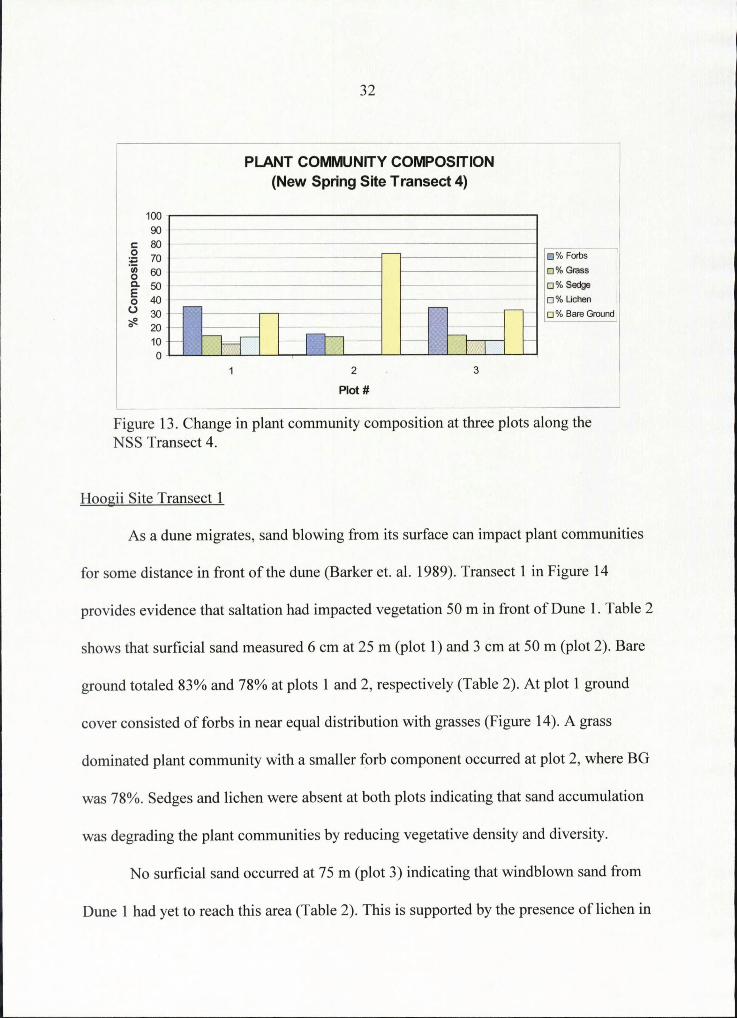
New Spring Site Transect 4
One location that experienced little or no impact from the NSS dunes occurred
downwind of Dune 5, between the impacted areas of Dune 2 and Dune 6. Figure 13
shows two stable plant communities with BG values of 30% (plot I) and 32% (plot 3) on
Transect 4. The absence of surficial sand at plot I and plot 3 indicated that both had been
unaffected by erosion or sand dune activity. This explains the presence of the climax
vegetative community at these two plots. One semi-stable plant community also occurred
on Transect 4. Plot 2 was located 25 m in front of the east wing of Dune 5, and had a BG
of 72%. The depth of surficial sand at plot 2 was 6 cm, showing that wind blown sand
from Dune 5 had begun to impact the plant community here. Sedges and lichen were
absent in this area of Transect 4, lending further support to the contention that these
vegetation types are more vulnerable to the effects of saltation, than forbs and grasses.
32
PLANT COMMUNITY COMPOSITION (New Spring Site Transect 4)
c 80
o- 50O 40
B% Forbs□ % Grass□ % Sedge□ % Lichen□ % Bare Ground
1 2 3
Plot#
Figure 13. Change in plant community composition at three plots along the NSS Transect 4.
Hoogii Site Transect I
As a dune migrates, sand blowing from its surface can impact plant communities
for some distance in front of the dune (Barker et. al. 1989). Transect I in Figure 14
provides evidence that saltation had impacted vegetation 50 m in front of Dune I. Table 2
shows that surficial sand measured 6 cm at 25 m (plot I) and 3 cm at 50 m (plot 2). Bare
ground totaled 83% and 78% at plots I and 2, respectively (Table 2). At plot I ground
cover consisted of forbs in near equal distribution with grasses (Figure 14). A grass
dominated plant community with a smaller forb component occurred at plot 2, where BG
was 78%. Sedges and lichen were absent at both plots indicating that sand accumulation
was degrading the plant communities by reducing vegetative density and diversity.
No surficial sand occurred at 75 m (plot 3) indicating that windblown sand from
Dune I had yet to reach this area (Table 2). This is supported by the presence of lichen in

33
TaOe ZThegD undoovercya sets for the three HS transects
Hot#□stance
from dune (cm)Depthof
surface sand (cm)Baregound Forbs Grass
0/Sedge Lichen
/0
Transect #11 25 3 83 8 9 0 02 50 6 78 6 16 0 03 75 0 70 9 17 0 4
Transect#21 0 6 100 0 0 0 02 5 9 99 1 0 0 03 10 12 96 4 0 0 04 15 9 92 8 0 0 05 20 10 97 3 0 0 06 25 13 93 7 0 0 07 35 9 78 15 7 0 08 50 10 73 15 12 0 09 75 8 47 33 20 0 010 100 12 60 14 26 0 0
Transect#31 0 0 100 0 0 0 02 5 0 96 3 1 0 03 10 4 78 7 14 1 04 15 0 73 8 10 9 05 20 5 38 17 43 2 06 25 7 25 22 53 0 07 35 9 25 15 60 0 08 50 19 32 23 14 31 09 75 32 32 18 8 42 010 100 10 40 41 6 13 0

34
PLANT COMM UNITY COMPOSITION (Hoogii Site Transect 1)
5I
IUas
Distance from dune (m)
□ % Forbs□ % Grass□ % Sedge□ % Lichen□ % Bare Ground
Figure 14. Changes in plant community composition at three distances along the HS Transect I.
Figure 14, which does not occur in areas of active sand accumulation. Curiously, sedges
were absent at plot 3, indicating that the plant community here differed from those
occurring in other non-dune affected areas. This inconsistency was attributed to natural
variability.
Hoogii Site Transect 2
At the HS vegetation begins to reestablish and stabilize bare soil surfaces soon
after dune migration. Evidence of this appeared along Transect 2 located in the wake of
Dune I . The graph of the Transect 2 vegetation data in Figure 15 shows that forbs were
initiating site recovery as close as 5 m (plot 2) from Dune I. The first 25 m (plots 1-6) of
this transect contained a nearly homogenous forb community that provided sparse ground
cover with 92%-98% bare ground (Table 2). Grasses were very minimal along this area of
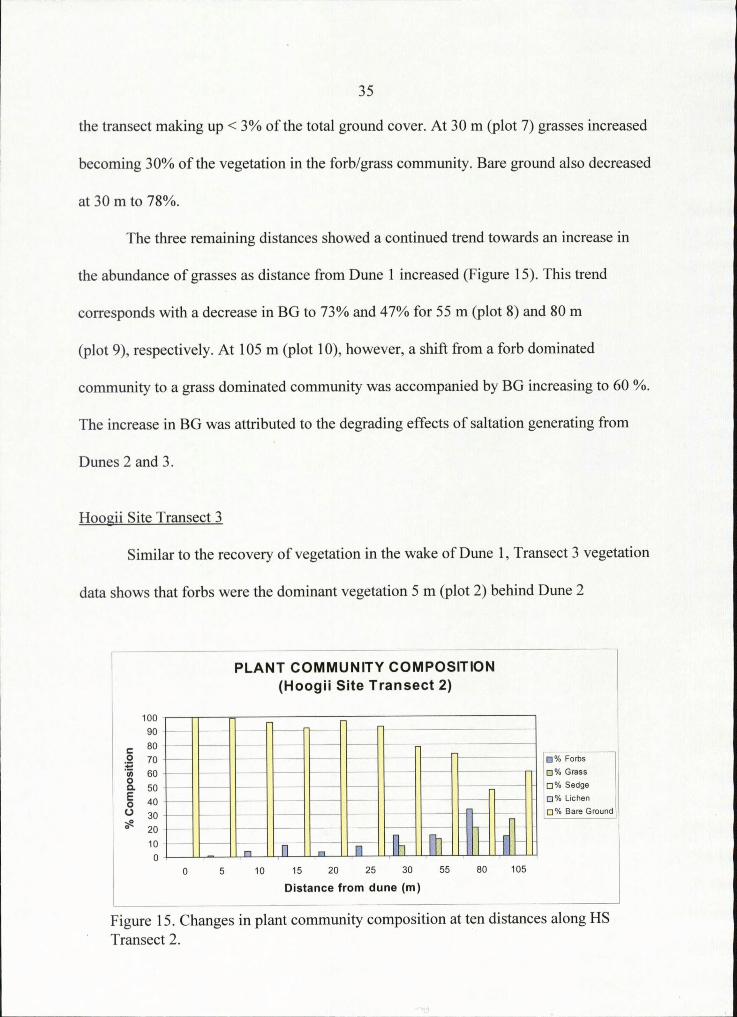
35
the transect making up < 3% of the total ground cover. At 30 m (plot 7) grasses increased
becoming 30% of the vegetation in the forb/grass community. Bare ground also decreased
at 30 m to 78%.
The three remaining distances showed a continued trend towards an increase in
the abundance of grasses as distance from Dune I increased (Figure 15). This trend
corresponds with a decrease in BG to 73% and 47% for 55 m (plot 8) and 80 m
(plot 9), respectively. At 105 m (plot 10), however, a shift from a forb dominated
community to a grass dominated community was accompanied by BG increasing to 60 %.
The increase in BG was attributed to the degrading effects of saltation generating from
Dunes 2 and 3.
Hooeii Site Transect 3
Similar to the recovery of vegetation in the wake of Dune I, Transect 3 vegetation
data shows that forbs were the dominant vegetation 5 m (plot 2) behind Dune 2
PLANT COMMUNITY COMPOSITION (Hoogii Site Transect 2)
.2 70
CL 50
Distance from dune (m)
0 % Forbs□ % Grass□ % Sedge□ % Lichen□ % Bare Ground
Figure 15. Changes in plant community composition at ten distances along HS Transect 2.

36
(Figure16). BG was 96% here, also similar to Transect I, yet grasses were already more
strongly represented than they were in the first 25 m of Transect 2. A transition to a grass
dominated community occurred at 10 m (plot 3), where BG was 78%. While sedges were
absent along Transect 2, they were present at six Transect 3 plots, appearing first at plot
3. At 15 m (plot 4) BG was 73%, and sedges were in almost equal distribution with
grasses and forbs. Sedges were also present at 20 m (plot 5), though they were a minor
component in this plant community where BG was 48%. At both 25 m (plot 6) and 30 m
(plot 7) BG was 25% and sedges were absent.
PLANT COMMUNITY COMPOSITION (Hoogii Site T ransect 3)
c 80
£■ 50o 40
Distance from dune (m)
□ % Forbs□ % Grass□ % Sedge□ % Lichen□ % Bare Ground
Figure 16. Change in plant community composition at ten distances along HS Transect 3.
The shift to a grass dominated community at plot 3 of Transect 3 suggests that less
time was required for grasses to reestablish in this area relative to Transect 2 (Figures 15
and 16). The different vegetative recovery patterns of Transects 2 and 3 relate to their
respective depths of surficial sand. Between 5-30 m (plots 2-7) of Transect 3 all surface

37
sand measurements were 9 cm (Table 2). By comparison, surface sand was 9 cm for
5-30 m (plots 2-7) of Transect 2. Based on these data, succession following dune
migration at the HS was initiated by forbs, then progressed to a grass dominated plant
community. Further, the length of time grasses required to reestablish and achieve
dominance increased where more sand occurred on the surface following dune migration.
This reasoning can also be used to explain the presence of sedges on plots 2
through 7 of Transect 3 (Figure 16). In this area sedges occurred only at plots 3,4, and 5
where sand deposition was 5 cm (Table 2). These data support the contention.that early
sedge recovery (i.e. 0-30 m) in the wake of the Hoogii dunes only occurs where surficial
sand deposits are shallow. The presence of sedges at 55 m, 80 m, and 105 m is difficult to
explain. Because these were the only plots in the study to contain moss, it can be
reasoned that these organisms’ ability to retain moisture benefits the growth of sedges.

38
CHAPTER 4
CONCLUSION
As barchan dunes in the Darhat Valley migrate, they bury and subsequently
destroy vegetative ground cover. Soil surfaces re-exposed following dune migration are
bare and susceptible to erosion by the wind. The thickness of A-horizon measurements
showed progressing soil loss as distance upwirid from the NSS dunes increased. This
supports the contention that erosion is continuing at this site. The A-horizon
measurements collected at the HS showed no evidence of progressing soil loss, however,
indicating that erosion was not continuing at this site.
One factor influencing soil stability in the Darhat Valley is topography. The
rolling terrain of the NSS provides numerous windward slope faces which are vulnerable
to scouring by saltating sand grains. By comparison, the HS was predominately flat,
making the soil surfaces there less susceptible to the scouring affects of saltation.
Sand dunes can also influence soil stability and erosion by modifying soil
structures. As they move across soil surfaces in the Darhat Valley, large dunes compress
granular and blocky soil structures into thin flat plates. This makes the soil surface
smooth, hard, and less conducive to seed establishment. Platy soil structures also reduce
pore volume, making them brittle and less resilient to impacts such as animal trafficking.
By characterizing plant communities at the NSS and HS, it was possible to
identify relationships between changes in community composition and sand activity.
Sedges and lichen were consistently the least resistant to the effects of saltation and sand
39
accumulation. Likewise, forbs and grasses declined more slowly and recovered more
quickly following disturbance from sand. Patterns of vegetation recovery in sand
disturbed areas were related to depth of sand accumulation and accessibility to ground
water.
Management Approaches
There are many schools of thought regarding what constitutes the best approach(s)
to the remediation of disturbed lands. Choosing a management strategy in a developed
country where both options and resources are numerous, therefore, can be a difficult
challenge. Considering that the majority of remediation approaches are developed in
countries where resource availability is not a primary concern, prescribing appropriate
management practices in developing countries may be an even greater challenge. The
erosion and sand dune activity occurring in the Darhat valley, particularly at the NSS, has
resulted in a the loss of productive rangeland which is critical to the sustainability of the
areas nomadic herding community. Because more extensive studies will be required
before any true understanding of the cause(s) can be established, it would be irresponsible
to attempt to prescribe any single management approach based on the limited scope of
this study. Nevertheless, for conditions to have any chance of improving in the near
future requires that action be taken soon. Until more scientific study can occur, perhaps
the best strategy is to establish several small study areas where alternative management
practices can be tested to determine their merits. A comprehensive listing of the most
popular remediation approaches for the recovery of dune effected areas appears in Tibke

40
(1988) and Pye and Tsoar (1990). Kazuhiro et al. (1998) also presents effective grazing
control practices which have been employed to recover vegetation in Inner Mongolia.
Review of this information should provide a several alternative choices which have been
successful in other rangeland areas of the world.
41
LITERATURE CITED
Abdel-Magid, A. H., M. I. Trlica, and R. H. Hart. 1987. Soil and Vegetation Responses to Simulated Trampling. Journal of Range Management. 40(4): 303-306.
Agriteam Canada. 1997. Study of Extensive Livestock Production Systems. TA No. 2606-MON. Report submitted to the Asian Development Bank. Calgary:Agriteam Canada.
Bagnold, R. A. 1941. The Physics of Wind Blown Sand and Desert Dunes. Chapman and Hall, London. 265pp.
Barker, J. R., D. J. Herlocker, S. A. Young. 1989. Vegetal Dynamics in Response to Sand Dune Encroachment Within the Coastal Grasslands of Central Somalia. African Journal of Ecology. 27: 277-282.
Brady, N. C. and R. R. Weil. 1999. The Nature and Properties of Soils, twelfth edition. Prentice Hall. Upper Saddle River, New Jersey. 881pp.
Dahl, B. E. and MacKell, C. M. 1986. Use and Abuse of China’s Deserts and Rangelands. Rangelands. 8(6): 267-271.
Dregne, H. E. 1995. Desertification Control: A Framework for action. Environmental Monitoring and Assessment. 37(1-3): 111-122.
Femandez-Gimenez, M. E. 1999. Reconsidering the Role of Absentee Herd Owners: A View from Mongolia. Human Ecology. 27(1): 1-27.
Froese, J. C., R. M. Cruse, and M. Ghaffarzadeh. 1999. Erosion Mechanics of Soil with an Impermeable Subsurface Layer. Soil Science Society of America Journal. 63:1836-1841.
Gay, P. S. 1999. Observations Regarding the Movement of Barchan Sand Dunes in the Nazca to Tanaca Area of Southern Peru. Geomoiphology. 27: 279-293.
Goulden, C. E. and O. Tumurtogoo. The Geological History and Geography of Lake Hovsgol. (Unpublished)
Hilbig, W. 1995. The Vegetation of Mongolia. SPB Academic Publishing. Amsterdam, The Netherlands. 258pp.
Hesp, P. A. and K. Hastings. 1998. Width, Height, and Slope Relationships and Aerodynamic Maintenance of Barchans. Geomorphology. 22: 193-204.
42
Hoogii. 1999. Personal Communication. Hoogii is a pastoralist and has been a resident at the Renchinlhumbe study site that bears his name since 1948.
Jacoby, G. C., R. D. D’Arrigo, and T. Davaajamts. Mongolian Tree Rings and 20th- Century warming. 1996. Science. 273: 771-773.
Kazimierz, K. 1980. Geomorphological Evidence of Holocene Climatic Changes in Northern Mongolia. Geographia Polonica. 43: 100-110.
Kazuhiro, K., T. Kazuhiko, J. Jiang, N. Yinhao, and K. Zhenwu. 1998. VegetationRestoration by Seasonal Exclosure in the Kerqin Sandy Land, Inner Mongolia. 139: 133-144.
Kharin, N. G. 1985. Desertification in the Countries of Western Asia. Problemy Osvoeniya Pustyn. 3: 41-47.
Khatelli, H., and D. Gabriels. 1998. A Study on the Dynamics of Sand Dunes in Tunisia: Mobile Barkhans Move in the Direction of the Sahara. Arid Soil Research and Rehabilitation. 12: 47-54.
Kozlowski, T. T. 1999. Soil Compaction and Growth of Woody Plants. Scandinavian Journal of Forest Restoration. 14: 596-619.
Lancaster, N. 1995. Geomorphologv of Desert Dunes. Routledge. London, England. 290pp.
Lyles, L. 1988. Basic Wind Erosion Processes. Agriculture, Ecosystems and Environment. 22/23: 91-101.
Pye, K. and H. Tsoar.1990. Aeolian Sand and Sand Dunes. Unwin Hyman. London, England. 396pp.
Sneath, D. 1999. Mobility, Technology, and Desertification of Pastoralism in Mongolia, p. 223-236. In S. Kotkin and B. A. Elleman (ed.) Mongolia in the Twentieth Century. M. E. Sharpe. Armank, New York.
Tibke, G. 1988. Basic Principles of Wind Erosion Control. Agriculture, Ecosystems, and Environment. 22/23: 103-122.
Tsagaan, Temuulen. 2000. Personal Communication. Temuulen is a Mongolian citizen and graduate student at Montana State University:
Xue, Y. 1996. The Impact of Desertification in the Mongolian and the Inner Mongolian Grassland on the regional Climate. Journal of Climate. 9: 2173-2189.

43
Uflyand, A. K., A. V. IF yin, and A. L. Spirkin. 1969. Basins of Baykalian type in Norhtem Mongolia. International Geology Review. 12(10): 1231-1243.

44
APPENDICES
APPENDIX A
SOIL PROFILE DESCRIPTIONS AND SPECIES LIST FOR THE NEW SPRING AND HOOGE STUDY SITES

Table 3. Soil profile descriptions for the NSS.
Profile Horizon Depth (cm) Color (moist) Texture1 Structure2 Effervescence3 Landform
NSS transect I
I C 0-43 10yr3/2 Is m VS SwaleAb 43-54 10yr2/2 si Pi VSBw 54-81 10yr4/3 Is sbk VSC 81+ 10yr4/3 Is m VS
2 C 0-12 10yr3/2 Is m ST KnollAb 12-21 10yr2/2 si Pi VSBw 21-29 10yr4/3 Is sbk VSBk 29-40 10yr4/l Is sbk STC 40+ 10yr4/3 Is m VS
3 A/C 0-15 10yr3/3 Is (f)sbk VS SwaleAb 15-27 I Oyr 3/1 si Pl VSBk 27-42 10yr5/l Is sbk STC 42+ 10yr4/3 Is m VS
4 C 0-64 10yr4/3 Is m VS BackslopeAb 64-78 10yr3/2 si Pi STBk 78+ 10yr4/l Is sbk ST
5 AJC 0-24 I Oyr 3/2 si (f)sbk ST SwaleAb 24-33 10yr2/l si Pi STBk 33-58 10yr4/l Is sbk STC 58+ 10yr5/2 Is m VS
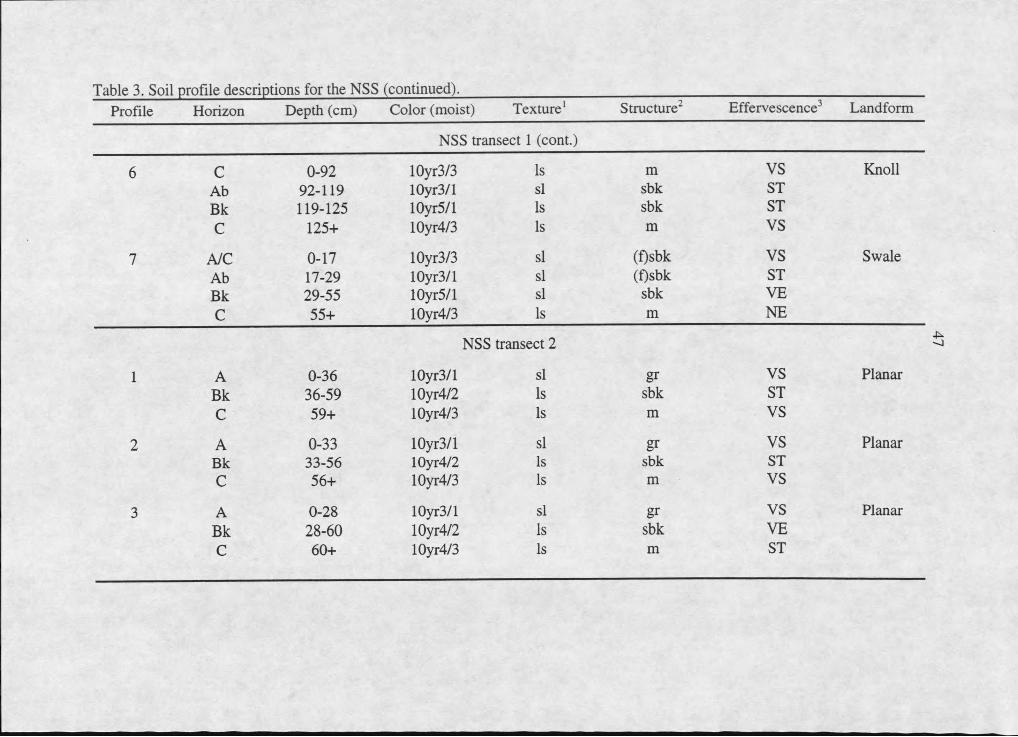
Table 3. Soil profile descriptions for the NSS (continued).Profile Horizon Depth (cm) Color (moist) Texture1 Structure2 Effervescence3 Landform
NSS transect I (cont.)
6 C 0-92 10yr3/3 Is m VS KnollAb 92-119 10yr3/l si sbk STBk 119-125 10yr5/l Is sbk STC 125+ 10yr4/3 Is m VS
7 AJC 0-17 10yr3/3 si CQsbk VS SwaleAb 17-29 10yr3/l si (Osbk STBk 29-55 10yr5/l si sbk VEC 55+ 10yr4/3 Is m NE
NSS transect 2
I A 0-36 10yr3/l si gr VS PlanarBk 36-59 10yr4/2 Is sbk STC 59+ 10yr4/3 Is m VS
2 A 0-33 10yr3/l si gr VS PlanarBk 33-56 10yr4/2 Is sbk STC 56+ 10yr4/3 Is m VS
3 A 0-28 10yr3/l si gr VS PlanarBk 28-60 10yr4/2 Is sbk VEC 60+ 10yr4/3 Is m ST
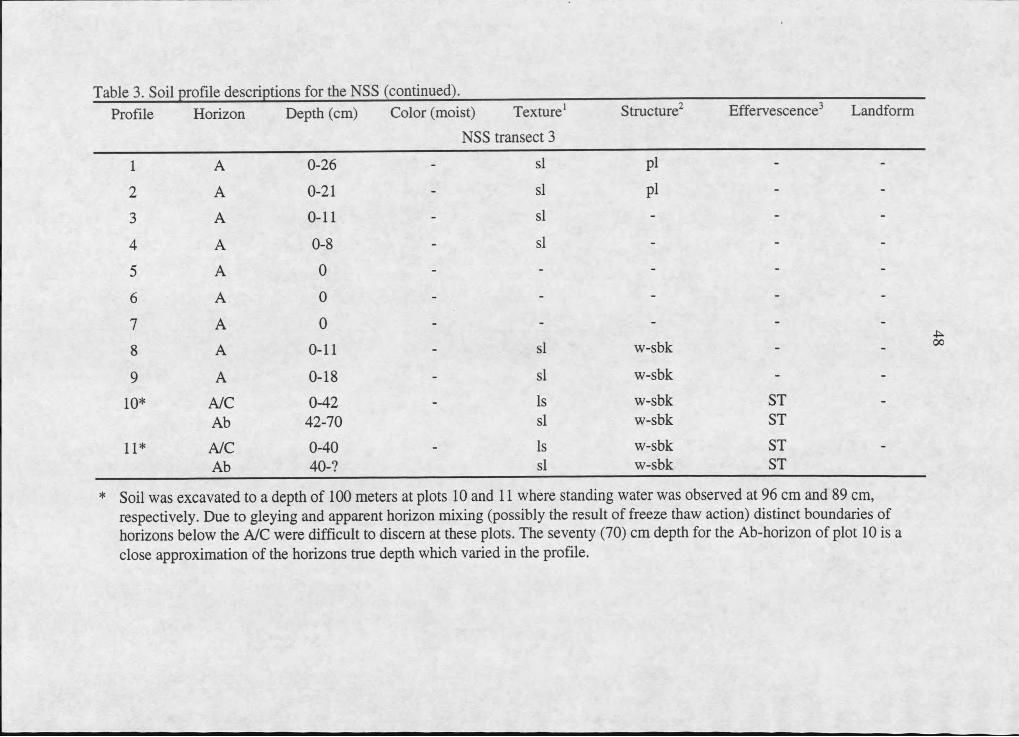
Table 3. Soil profile descriptions for the NSS (continued).Profile Horizon Depth (cm) Color (moist) Texture1
NSS transect 3
Structure2 Effervescence3 Landform
I A 0-26 - si Pi - -
2 A 0-21 - si Pl - -
3 A 0-11 - si - - -
4 A 0-8 - si - - -
5 A 0 - - - - -
6 A 0 - - - - -
7 A 0 - - - - -
8 A 0-11 - si w-sbk - -
9 A 0-18 - si w-sbk - -
10* A/C 0-42 - Is w-sbk ST -Ab 42-70 si w-sbk ST
11* A/C 0-40 - Is w-sbk ST -Ab 40-? si w-sbk ST
* Soil was excavated to a depth of 100 meters at plots 10 and 11 where standing water was observed at 96 cm and 89 cm, respectively. Due to gleying and apparent horizon mixing (possibly the result of freeze thaw action) distinct boundaries of horizons below the A/C were difficult to discern at these plots. The seventy (70) cm depth for the Ab-horizon of plot 10 is a close approximation of the horizons true depth which varied in the profile.

Table 3. Soil profile descriptions for the NSS (continued).Profile Horizon Depth (cm) Color (moist) Texture1 Structure2 Effervescence3 Landform
NSS transect 4
I A 0-17 10yr3/l si gr VS PlanarBk 17-58 10yr4/2 Is sbk STC 58+ 5y4/2 Is m NE
2 C 0-6 5y5/2 S m VS PlanarA 6-31 10yr3/l si gr VSBk 31-54 10yr4/2 Is sbk VEC 54+ 5y4/2 Is m NE
3 A 0-28 I Oyr 3/1 si gr ST PlanarBk 28-60 10yr4/2 Is sbk VEC 60+ 5y4/2 Is m NE
NSS transect 5 (cont.)
I A 0-15 - si pl - -
2 A 0-10 - si Pi - -
3 A 0 - - - - -
4 A 0 - - - - -
5 A 0 - - - - -
6 A 0 - - - - -
7 A 0 - - - - -
8 A 0 - - - - -
9 A 0 - - - - -

Table 3. Soil profile descriptions for the NSS (continued).Profile Horizon Depth (cm) Color (moist) Texture1 Structure2 Effervescence3 Landform
10 A 0 - - - -
NSS transect 6 (cont.)
I A 0-33 si Pi - -
2 A 0-12 si Pi - -
3 A 0-18 si - - -
4 A 0-15 si - - -
5 A 0-14 si - - -
6 A 0-12 si - - -
7 A 0 - - - -
8 A 0 - - - -
9 A 0 - - - -
10 A 0 - - - -
1. si = sandy loam, Is = loamy sand, s = sand.2. gr = granular, (f) = fine, m = massive, pi = platy, sbk = subangular blocky, w- = weak.3. NE = non-effervescent, ST = strong effervescence, VS = very slightly effervescent, VE = violent effervescence.
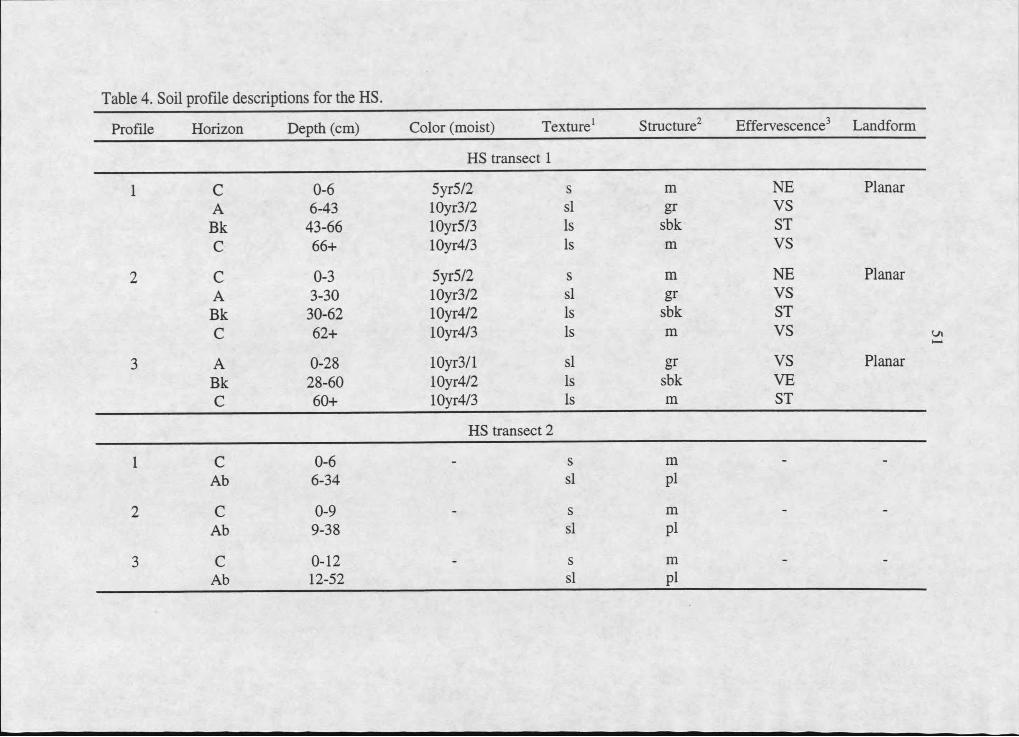
Table 4. Soil profile descriptions for the HS.
Profile Horizon Depth (cm) Color (moist) Texture1 Structure2 Effervescence3 Landform
HS transect I
I C 0-6 5yr5/2 S m NE PlanarA 6-43 10yr3/2 si gr VSBk 43-66 10yr5/3 Is sbk STC 66+ 10yr4/3 Is m VS
2 C 0-3 5yr5/2 S m NE PlanarA 3-30 10yr3/2 sl gr VSBk 30-62 10yr4/2 Is sbk STC 62+ 10yr4/3 Is m VS
3 A 0-28 10yr3/l sl gr VS PlanarBk 28-60 10yr4/2 Is sbk VEC 60+ 10yr4/3 Is m ST
HS transect 2
I C 0-6 S m - -
Ab 6-34 sl Pl
2 C 0-9 - s m - -
Ab 9-38 sl Pl
3 C 0-12 - S m - -
Ab 12-52 sl Pl
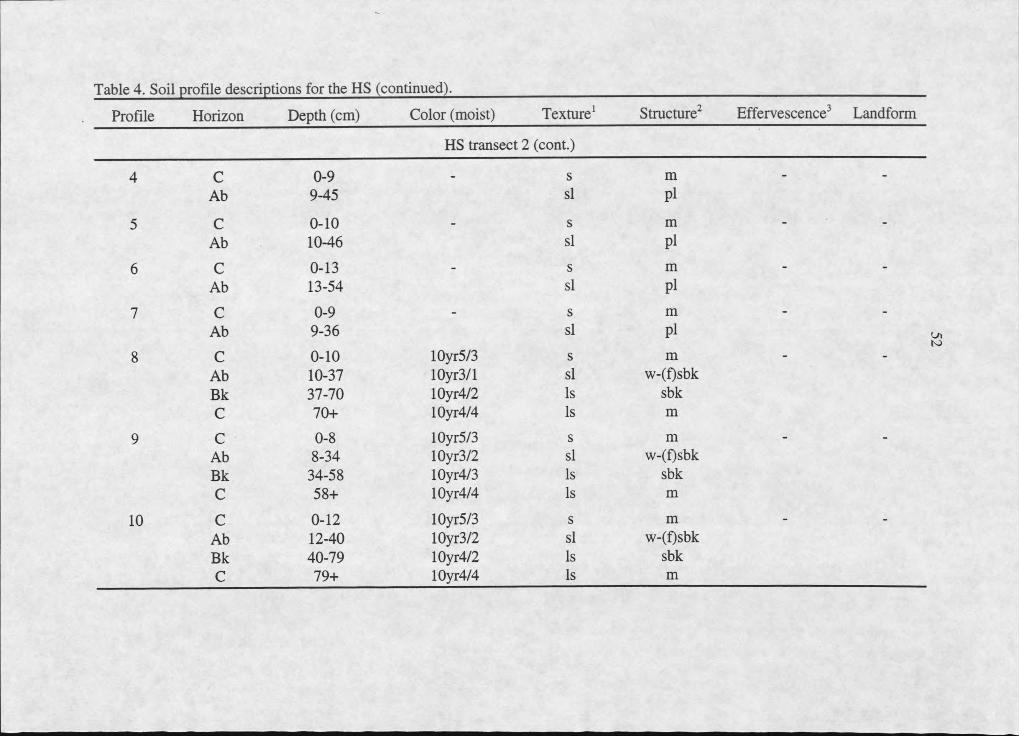
Table 4. Soil profile descriptions for the HS (continued).
Profile Horizon Depth (cm) Color (moist) Texture1 Structure2 Effervescence3 Landform
HS transect 2 (cont.)
4 C 0-9 - S m — —
Ab 9-45 si Pl
5 C 0-10 - s m -
Ab 10-46 si Pi6 C 0-13 - S m -
Ab 13-54 si Pl7 C 0-9 - S m -
Ab 9-36 si Pi8 C 0-10 10yr5/3 S m -
Ab 10-37 10yr3/l si w-(f)sbkBk 37-70 10yr4/2 Is sbkC 70+ 10yr4/4 Is m
9 C 0-8 10yr5/3 S m -
Ab 8-34 10yr3/2 si w-(f)sbkBk 34-58 10yr4/3 Is sbkC 58+ 10yr4/4 Is m
10 C 0-12 10yr5/3 S m -
Ab 12-40 10yr3/2 Si w-(f)sbkBk 40-79 10yr4/2 Is sbkC 79+ 10yr4/4 Is m
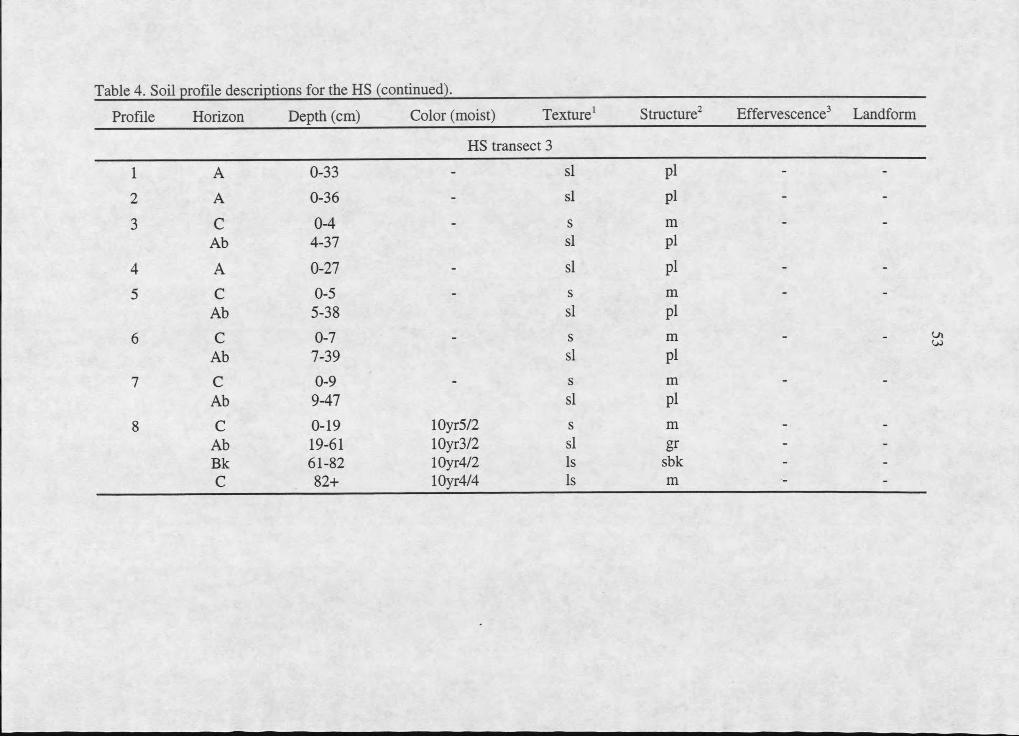
Table 4. Soil profile descriptions for the HS (continued).
Profile Horizon Depth (cm) Color (moist) Texture1 Structure11 Effervescence3 Landform
HS transect 3
I A 0-33 - si Pi - -
2 A 0-36 - si Pl - -
3 C 0-4 - S m - -Ab 4-37 si Pi
4 A 0-27 - si Pl - -
5 C 0-5 - S m - -Ab 5-38 si Pi
6 C 0-7 - S m - -Ab 7-39 si Pl
7 C 0-9 - S m - -Ab 9-47 si Pi
8 C 0-19 10yr5/2 S m - -Ab 19-61 10yr3/2 si gr - -Bk 61-82 10yr4/2 Is sbk - -C 82+ 10yr4/4 Is m •- -

Table 4. Soil profile descriptions for the HS (continued).
Profile Horizon Depth (cm) Color (moist) Texture1 Structure2 Effervescence3 Landform
HS transect 3(cont.)
9 C 0-32 10yr5/2 S m -
Ab 3243 10yr3/2 si grBk 43-68 10yr5/3 Is sbkC 68+ 10yr4/4 Is m
10 C 0-10 10yr5/3 S m -Ab 10-34 10yr3/2 si grBk 34-76 10yr5/3 Is sbkC 76+ 10yr4/3 Is m
I. si = sandy loam, Is = loamy sand, s = sand.2. gr = granular, (f) = fine, m = massive, pi = platy, sbk = subangular blocky, w- = weak.3. NE = non-effervescent, ST = strong effervescence, VS = very slightly effervescent, VE = violent effervescence
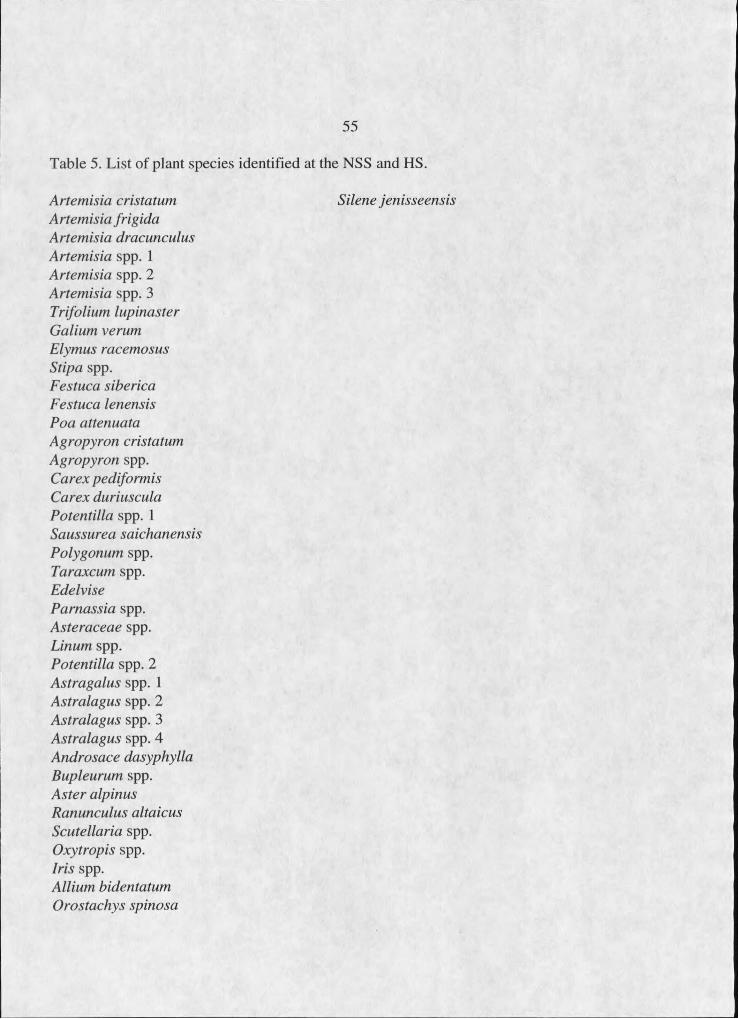
55
Artemisia cristatum Silene jenisseensisA rtemisia frigidaArtemisia dracunculusArtemisia spp. IArtemisia spp. 2Artemisia spp. 3Trifolium lupinasterGalium verumElymus racemosusStipa spp.Festuca siberica Festuca lenensis Poa attenuata Agropyron cristatum Agropyron spp.Carex pediforrnis Carex duriuscula Potentilla spp. I Saussurea saichanensis Polygonum spp.Taraxcum spp.Edelvise Parnassia spp.Asteraceae spp.Linum spp.Potentilla spp. 2 Astragalus spp. I Astralagus spp. 2 Astralagus spp. 3 Astralagus spp. 4 Androsace dasyphylla Bupleurum spp.Aster alpinus Ranunculus altaicus Scutellaria spp.Oxytropis spp.Iris spp.Allium bidentatum Orostachys spinosa
Table 5. List of plant species identified at the NSS and HS.
56
■■ .1
APPENDIX B
ILLUSTRATIONS OF SEVERE EROSION OCCURRING ALONG THE TRANSECTS EXTENDING UPWIND
OF THREE NSS SAND DUNES
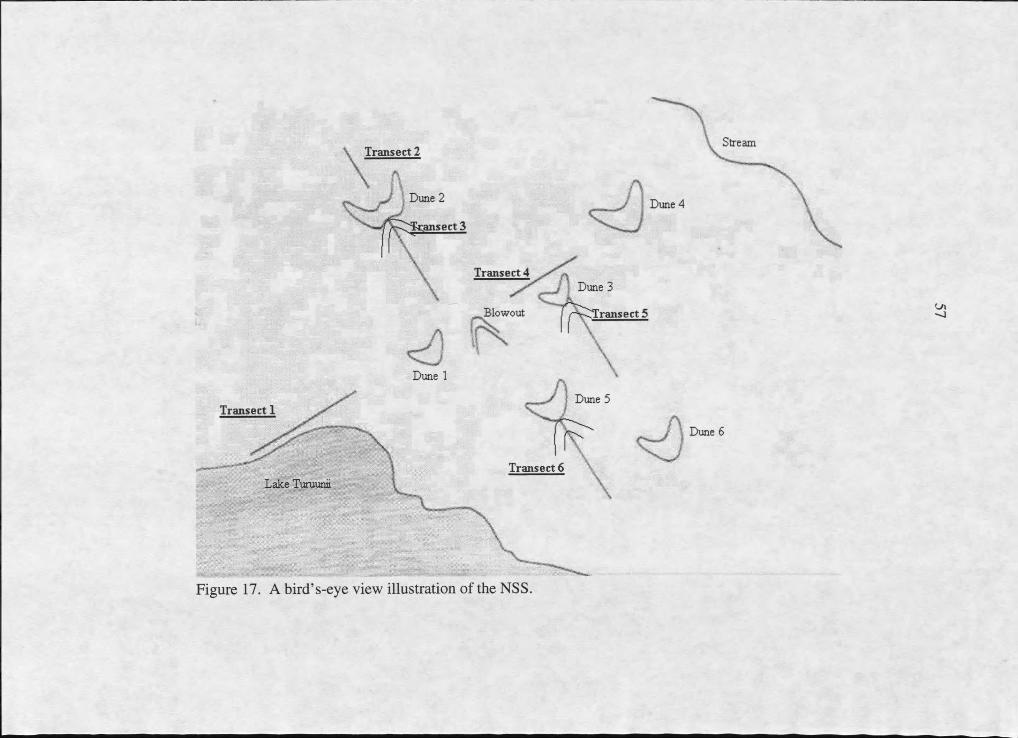
S treamTransect 2
D u n e 2D une 4
iansect 3
Transect 4D une 3
B lo w o u t 'ransect 5
D une I
D une 5Transect I
D une 6
Transect 6L a k e TuruunH
Figure 17. A bird’s-eye view illustration of the NSS.

H8HHB8H BH 1 K f f l f f l l
Figure 18. A cross-sectional illustration of soil loss along the first thirty-five meters of theNSS Transect 3.

Figure 19. A cross-sectional and 3-dimensional illustration of soil loss occurring along the first thirty-five meters of the NSS Transect 5.
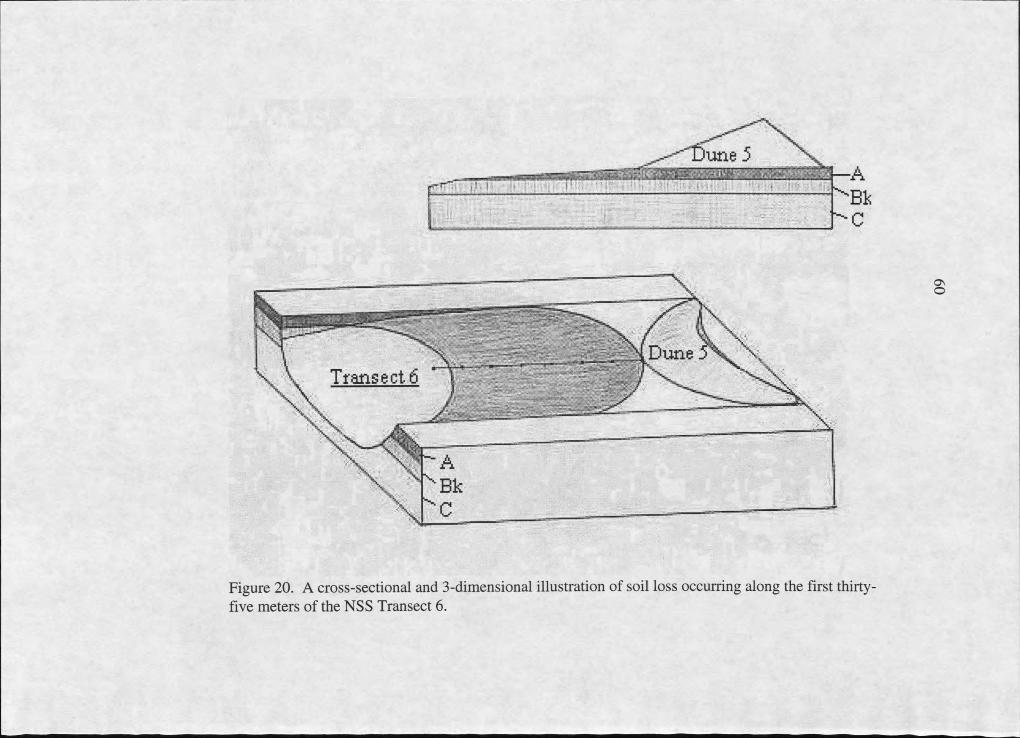
s' " ' : : ' I ' . ' = '-^
DuneTransect#
Figure 20. A cross-sectional and 3-dimensional illustration of soil loss occurring along the first thirty-five meters of the NSS Transect 6.