Survival Bond Nederland Workshop uvponline 12 juni 2010 Door Bart Bongers en Alex Bossers.


Promotors: Prof. dr. ir. K. Verheyen
Department of Forest and Water Management, Forest & Nature Lab Prof. dr. ir. P. Boeckx Department of Applied Analytical and Physical Chemistry, Laboratory of Applied Physical Chemistry Prof. dr. ir. R. Samson Department of Bioscience Engineering, University of Antwerp
Dean: Prof. dr. ir. G. Van Huylenbroeck Rector: Prof. dr. P. Van Cauwenberghe

Sandy ADRIAENSSENS
DRY DEPOSITION AND CANOPY EXCHANGE FOR TEMPERATE TREE SPECIES UNDER HIGH NITROGEN DEPOSITION
Thesis submitted in fulfillment of the requirements For the degree of Doctor (PhD) in Applied Biological Sciences

Dutch translation of the title: Droge depositie en kroonuitwisseling bij gematigde boomsoorten blootgesteld aan hoge stikstofdepositie Illustrations on the cover: Front: Young beech (Fagus sylvatica L.) leaves in Wellin, Walloon region (April 2009) Back: Autumn canopy of the beech tree studied in Chapter 5, 6 and 7 (October 2008) Citation: Adriaenssens S. (2012). Dry deposition and canopy exchange for temperate tree species under high nitrogen deposition. PhD thesis, Ghent University, Ghent, Belgium, 209p. ISBN-number: 978-90-5989-508-9 The author and the promotor give the authorisation to consult and to copy parts of this work for personal use only. Every other use is subject to the copyright laws. Permission to reproduce any material contained in this work should be obtained from the author

Woord vooraf
“Winter is gone and the leaves turn green” (Nick Drake, 1969) Het doorbreken van de lente in het bos heb ik de afgelopen vier jaar van zeer dichtbij meegemaakt. Die eerste groene blaadjes waren steevast het signaal om volop in actie te schieten en de data te verzamelen die de basis van dit doctoraat vormen. Alleen heb ik het altijd een beetje gek gevonden dat er maar één naam op de voorkant van zo’n doctoraat prijkt, want, naar mijn gevoel, is dit werk toch zeker niet het resultaat van enkel mezelf. Samenwerking was de basis en ook de rode draad van dit werkstuk. De voorbije vier jaar ben ik in het bos, in het labo, aan mijn bureau en op het thuisfront bijgestaan door een hele rits aan enthousiaste collega’s, vrienden en familie. Gelukkig bestaat er nog zoiets als een dankwoord om al deze mensen toch nog even naar voor te schuiven. Kris, je hebt het Labo voor Bosbouw uitgebouwd tot een zeer inspirerende plaats die tegenwoordig het Bos en Natuur Labo heet. Je enthousiasme voor wetenschappelijk onderzoek werkt zeer aanstekelijk. Ik twijfelde dan ook niet lang toen je me, een jaar na het afronden van mijn thesis hier, belde om te vragen of ik niet op dat “kroonuitwisselingsproject” wilde werken. Ik wil je enorm bedanken om mij die kans te geven en om zoveel vertrouwen in mij te stellen. De voorbije vier jaar stond je deur altijd open voor advies, steun en het enthousiast onthalen van vreemde resultaten. Bedankt hiervoor! Daarnaast had ik de luxe om naast een biogeochemische visie, ook input te krijgen op vlak van ecofysiologie en stabiele isotopen. Roeland, door jouw enthousiasme en vrolijkheid kon een mens moeilijk slecht gezind blijven wanneer het werk soms niet helemaal liep zoals gepland. Pascal, jouw kritische blik zorgde ervoor dat we af en toe eens out-of-the-bos-box leerden denken. Bedankt alledrie om steeds onvoorwaardelijk achter mij te staan! I want to thank all the members of the jury, i.e. Prof. H. Vanlangenhove, Prof. K.Steppe, Prof. Q. Ponette and Prof. W. de Vries, for their time and effort in reading this PhD, and for their positive comments. Dit doctoraat werd mogelijk gemaakt door een onderzoeksproject van het Fonds voor Wetenschappelijk Onderzoek Vlaanderen; hoofdstuk 5 werd gerealiseerd dankzij een exchange grant van Nitrogen in Europe (NinE). In den beginne was er Jeroen, die het FWO-project had geschreven waarop dit doctoraat kon gebeuren en die me op weg zou helpen die eerste maanden. Maar ook in het midden en tot het eind was er Jeroen, altijd klaar om mee na te denken over nieuwe experimenten, deze mee te helpen opzetten, even een weekje staalophaling over te nemen wanneer ik

ziek of op vakantie was, te discussiëren over statistiek, met de kritische borstel door een tekst te gaan, maar ook om zeer geduldig te luisteren naar typische onderzoeksfrustraties en altijd in voor een vrolijke noot. Kortom, zo’n beetje een steun en toeverlaat. Enorm bedankt voor dit alles! Bij mijn start in Gontrode kwam ik in de 0.17 terecht, later geklasseerd als de koudste bureau van het gebouw. Maar dat “koude” gold allerminst voor de mensen daar aanwezig. Karen, je hebt mij zeer warm onthaald, met de nodige porties cake, raad en daad bij al mijn doctoraatsperikelen, maar ook met een zelfde humor die tot vele hilarische 0.17-momenten leidde. Tatiana, ik denk dat dit laatste na jouw komst er niet op is verslechterd. Bedankt voor al jullie hulp en steun! Darline, bedankt om de 0.17 ook gedurende meer dan een jaar te komen opvrolijken met, tussen het werk door, allerlei gesprekken over plantjes, tuinieren en muzikale ideeën. Van de lege 0.17, hierdoor echt wel een beetje koud, ging ik de laatste vier maanden naar de 0.02, de “warmste” bureau van het gebouw. Lander, super bedankt voor al het statistisch advies, om de R-microbe over te brengen, de vegetatiekunde-excursies mee te organiseren en af en toe een Miles Davis plaat op te leggen en samen een pintje te drinken. Margot, ongelooflijk bedankt voor het kritisch en belangeloos nalezen van een aantal hoofdstukken en het checken van de referenties, maar vooral voor de niet aflatende stroom aan supporter-kaartjes en –mails om de laatste maanden door te komen!! Dit doctoraat bestaat uit vele tabellen en figuren, die op zich dan weer bestaan uit vele getallen. Deze getallen zouden niet bestaan zonder het werk van een aantal mensen. Luc, samen hebben we 400 boompjes in de Kangoo gekregen, specie gemengd, geplant, proefjes uitgevoerd, “wagonnetjes” gemaakt, waterstalen opgehaald en de volgens jou (en ook door jou) leukste proefopzet gebouwd. Bedankt voor al die creatieve oplossingen en om altijd klaar te staan om te helpen. Greet, bedankt om die tweewekelijkse stroom aan waterstalen zo goed bij te houden en te analyseren! Kris, zonder jou stond ik waarschijnlijk nu nog plantstalen te vermalen, bedankt! Katja, bedankt om die 2320 plantstalen steeds even opgewekt aan te nemen, te analyseren wanneer de getalletjes er moesten zijn en die 160 waterstalen ‘even’ om te zetten. Jan, bedankt om die waterstalen even fluks te analyseren. Het project waarop dit doctoraat gebeurde zou financieel en administratief waarschijnlijk in het honderd zijn gelopen zonder de strenge opvolging van Christel, bedankt! Ook een dikke merci aan de stage- en jobstudenten Ward en Noam. Drie promotoren betekent ook drie onderzoeksgroepen. Het Labo voor Bosbouw is in vele opzichten een unieke werkplaats, dankzij o.a. de samenwerking die hoog in het vaandel wordt gedragen, de vele plantacties, nachtelijke muizenvang-sessies, de middagmalen aan de picknicktafel en de open haard. Bedankt aan alle Gontrodenaren, inclusief VBV, om hieraan bij te dragen. Een speciaal dankjewel aan de leden van de stuurgroep biogeochemie die hierboven nog niet vermeld werden, zijnde Lotte, An, Evy, Andreas, Gorik en Stephanie. De ISOFYS omgeving leek op het eerste zicht in contrast te staan met het groene Gontrode, maar de mensen alleszins niet. Bedankt Dries R., Samuel, Katja, Hari, Saskia, Jorin, Dries H., Victoria, Dongmei en Eric om me zo vanzelfsprekend

als “deel van de bende” te beschouwen. En speciaal voor jullie: Amabokoboko! Ook op de Groenenborgercampus in Wilrijk zat de sfeer er steeds goed in, met dank aan Sepbe, Fati, Ali, Nina, Frances, David en Jelle. Een speciaal dankjewel aan Shari als mijn voormalige thesisstudente en nu lid van de UA-bende. Zonder jouw bijdrage zouden hoofdstuk 2 en 3 er heel wat minder goed uitgezien hebben! Joris, merci voor het statistisch advies bij hoofdstuk 5! Karin, many thanks for your hospitality in Sweden and for your time to write Chapter 5 together with me. Dimitry, enorm bedankt om je vrije tijd te spenderen aan het verwerken van de Lidar data en aan het Biosystems departement van de KULeuven voor het nemen van de Lidarbeelden. Bedankt ook Maja voor het delen van onze torenbevindingen en het luisterend oor bij alle doctoraatsperikelen. Ik wil ook het Labo voor Celbiologie en Histologie van de UA bedanken voor het gebruik van hun elektronenmicroscoop, het labo voor Fytopathologie van de UGent voor het gebruik van hun lichtmicroscoop met bijhorende camera, de Vlaamse Milieumaatschappij voor het gebruik van hun materiaal voor de passieve samplermetingen en Filip Rys van het Proefcentrum voor Sierteelt voor zijn advies bij het opstarten van de potproef voor hoofdstuk 2, 3 en 4. De vereiste energie om dit werk tot een goed einde te brengen was uiteraard niet oneindig. Vanuit mijn omgeving werd deze steevast gevoed door vele aanmoedigingen en steun. Mama en papa, héél veel dank voor jullie goede zorgen en vertrouwen van de voorbije jaren . Jaak en Hilde, ook enorm bedankt voor jullie steun van de afgelopen vier jaar. De ‘Land- en Bossers’ van 2006 en alle aanverwanten, de wereldwinkelgroep van Kieldrecht, onze band, Isabel en Kathy, bedankt voor alle fantastische momenten! Pim, bedankt voor je geduld, je liefde, de oneindige stroom van mooie muziek, de vele lekkere maaltijden van de afgelopen maanden en om gewoon bij mij te zijn.


Contents
LIST OF ABBREVIATIONS AND SYMBOLS
CHAPTER 1 INTRODUCTION ................................................................................. 1
1.1 Atmospheric deposition on forest ecosystems ................................................... 1 1.1.1 Definition ....................................................................................................... 1 1.1.2 Human induced changes in atmospheric deposition ...................................... 2
1.2 The forest canopy as an interceptor of atmospheric nitrogen and sulphur ... 5 1.2.1 Wet and dry deposition processes .................................................................. 5 1.2.2 Canopy exchange processes of N .................................................................. 8 1.2.3 Canopy exchange processes of S ................................................................. 11
1.3 On the importance of studying processes at different spatio-temporal scales . ............................................................................................................................. 11
1.4 Aims and outline of the thesis ........................................................................... 12
CHAPTER 2 FOLIAR NITROGEN UPTAKE FROM WET DEPOSITION AND THE RELATIONSHIP WITH LEAF WETTABILITY AND WATER STORAGE CAPACITY ...................................................................................................................... 17
2.1 Abstract .............................................................................................................. 17
2.2 Introduction ....................................................................................................... 18
2.3 Materials and methods ...................................................................................... 19 2.3.1 Plant material and climate ............................................................................ 19 2.3.2 Experimental setup and sample analysis ...................................................... 20
2.3.2.1 15N application ...................................................................................... 20 2.3.2.2 Measurement of leaf wettability and visualisation of leaf surface structure .............................................................................................................. 21 2.3.2.3 Estimation of leaf/needle biomass, water storage capacity and surface area .............................................................................................................. 22 2.3.2.4 Analysis of plant material ..................................................................... 22 2.3.2.5 Analysis of plant available inorganic nitrogen .................................... 23
2.3.3 Data processing ............................................................................................ 23
2.4 Results ................................................................................................................ 24 2.4.1 Foliar N uptake ............................................................................................ 24 2.4.2 Leaf characteristics ...................................................................................... 26
2.5 Discussion ........................................................................................................... 30 2.5.1 Effect of N form ........................................................................................... 30

2.5.2 Tree species effect ........................................................................................ 31 2.5.3 Effect of leaf phenology ............................................................................... 32 2.5.4 Effect of NO3
- to NH4+ ratio ........................................................................ 33
2.5.5 Leaf surface characteristics and N uptake ................................................... 34
2.6 Conclusion .......................................................................................................... 35
CHAPTER 3 CANOPY RETENTION OF 15NH3 BY FOUR TEMPERATE TREE SPECIES AND THE INTERACTION WITH LEAF PROPERTIES ............ 37
3.1 Abstract .............................................................................................................. 37
3.2 Introduction ....................................................................................................... 38
3.3 Materials and methods...................................................................................... 40 3.3.1 Plant material and experimental site ............................................................ 40 3.3.2 Experimental setup and sample analysis ...................................................... 40
3.3.2.1 15NH3 and 13CO2 application ................................................................ 40 3.3.2.2 Analysis of plant material and gas samples ......................................... 41 3.3.2.3 Measurement of stomatal characteristics ............................................. 42
3.3.3 Data analysis ................................................................................................ 42
3.4 Results ................................................................................................................ 43 3.4.1 15NH3 retention............................................................................................. 43 3.4.2 13CO2 retention and leaf characteristics ....................................................... 45 3.4.3 Relationship between 15NH3 retention and leaf characteristics ................... 48
3.5 Discussion ........................................................................................................... 50 3.5.1 Tree species effect ........................................................................................ 50 3.5.2 Effect of treatment date ................................................................................ 50 3.5.3 Effect of increasing NH3 concentration ....................................................... 52 3.5.4 Leaf characteristics ...................................................................................... 53 3.5.5 Methodological considerations .................................................................... 54
3.6 Conclusion .......................................................................................................... 56
CHAPTER 4 RETENTION OF DISSOLVED INORGANIC NITROGEN BY FOLIAGE AND TWIGS OF FOUR TEMPERATE TREE SPECIES ...................... 59
4.1 Abstract .............................................................................................................. 59
4.2 Introduction ....................................................................................................... 60
4.3 Materials and methods...................................................................................... 62 4.3.1 Plant material and experimental site ............................................................ 62 4.3.2 Experimental set-up and sample analysis .................................................... 62
4.3.2.1 15N application ...................................................................................... 62 4.3.2.2 Analysis of plant material ..................................................................... 62 4.3.2.3 Analysis of water samples..................................................................... 63
4.3.3 Data processing ............................................................................................ 63

4.4 Results ................................................................................................................ 64 4.4.1 15N retention by plant material ..................................................................... 64 4.4.2 Rinsing experiment in the leafless period .................................................... 66 4.4.3 Water samples .............................................................................................. 68
4.5 Discussion ........................................................................................................... 70 4.5.1 Nitrogen retention processes by canopy components .................................. 72 4.5.2 Throughfall water ......................................................................................... 74
4.6 Conclusion .......................................................................................................... 77
4.7 Appendix: Supplementary experiment ........................................................... 78 4.7.1 Aims and description ................................................................................... 78 4.7.2 Results .......................................................................................................... 78
CHAPTER 5 THROUGHFALL DEPOSITION AND CANOPY EXCHANGE PROCESSES ALONG A VERTICAL GRADIENT WITHIN THE CANOPY OF BEECH AND NORWAY SPRUCE ............................................................................... 81
5.1 Abstract .............................................................................................................. 81
5.2 Introduction ....................................................................................................... 82
5.3 Materials and methods ...................................................................................... 84 5.3.1 Site description ............................................................................................. 84 5.3.2 Data collection ............................................................................................. 85
5.3.2.1 Water fluxes and plant material ........................................................... 85 5.3.2.2 Chemical analysis ................................................................................. 87
5.3.3 Data analysis ................................................................................................ 88 5.3.3.1 Ion fluxes ............................................................................................... 88 5.3.3.2 Canopy budget modelling ..................................................................... 88 5.3.3.3 Statistical analysis ................................................................................ 90
5.4 Results ................................................................................................................ 91 5.4.1 Bulk deposition, throughfall deposition and leaf N content ........................ 91 5.4.2 Net throughfall ............................................................................................. 95 5.4.3 Dry deposition and canopy exchange .......................................................... 98
5.5 Discussion ......................................................................................................... 101 5.5.1 Volume ....................................................................................................... 101 5.5.2 Sodium, chloride and sulphate ................................................................... 101 5.5.3 Base cations ............................................................................................... 104 5.5.4 Nitrogen and hydrogen .............................................................................. 106 5.5.5 Limitations and implications of the study .................................................. 109
5.6 Conclusion ........................................................................................................ 110
CHAPTER 6 DRY DEPOSITION ALONG A VERTICAL GRADIENT WITHIN A BEECH CANOPY: COMPARISON OF METHODS AND DEPENDENCE ON CANOPY STRUCTURE ............................................................................................... 113

6.1 Abstract ............................................................................................................ 113
6.2 Introduction ..................................................................................................... 114
6.3 Materials and methods.................................................................................... 116 6.3.1 Site description........................................................................................... 116 6.3.2 Sample collection and analysis .................................................................. 116
6.3.2.1 Air concentrations of NH3, NO2 and SO2 ........................................... 116 6.3.2.2 Throughfall water ............................................................................... 117 6.3.2.3 Terrestrial Laser Scanning (TLS) ....................................................... 118
6.3.3 Data analysis .............................................................................................. 119 6.3.3.1 Air-concentration-based dry deposition (DDvd) ................................. 119 6.3.3.2 Ion fluxes and dry deposition derived by the canopy budget model (DDCBM) ............................................................................................................ 120 6.3.3.3 Dry deposition calculated from the artificial foliage (DDAF) ............ 120 6.3.3.4 Terrestrial Laser Scanning ................................................................. 122 6.3.3.5 Statistical analysis .............................................................................. 123
6.4 Results .............................................................................................................. 123 6.4.1 Vertical profiles of NH3, NO2 and SO2 ...................................................... 123 6.4.2 Effect of deposition velocity on semi-annual (leafed and leafless period) and yearly dry deposition ............................................................................................... 123 6.4.3 Comparison of the three dry deposition methods ...................................... 125 6.4.4 Influence of local canopy structure on throughfall variability and dry deposition ................................................................................................................. 126
6.5 Discussion ......................................................................................................... 129 6.5.1 Vertical profiles of NH3, NO2 and SO2 ...................................................... 129 6.5.2 Dry deposition measurements .................................................................... 130
6.5.2.1 Single-layer versus multi-layer approach .......................................... 130 6.5.2.2 Aerosol deposition: base cations, sodium and chloride ..................... 130 6.5.2.3 Sulphur................................................................................................ 131 6.5.2.4 Nitrogen compounds ........................................................................... 132
6.5.3 Role of canopy structure ............................................................................ 133
6.6 Conclusion ........................................................................................................ 134
CHAPTER 7 ATMOSPHERIC DEPOSITION TO FORESTS BASED ON THROUGHFALL MEASUREMENTS: EFFECT OF CANOPY BUDGET MODEL APPROACHES ON STAND DEPOSITION, FOREST TYPE EFFECT AND TIME TREND ANALYSIS ...................................................................................................... 137
7.1 Abstract ............................................................................................................ 137
7.2 Introduction ..................................................................................................... 138
7.3 Materials and methods.................................................................................... 140 7.3.1 Study sites .................................................................................................. 140
7.3.1.1 Individual beech canopy and time trend analysis .............................. 140

7.3.1.2 Deposition ratio between a coniferous and deciduous forest ............. 140 7.3.2 Sample collection and analysis .................................................................. 140
7.3.2.1 Individual beech canopy ..................................................................... 140 7.3.2.2 Deposition ratio between a coniferous and deciduous forest ............. 141 7.3.2.3 Trend analysis ..................................................................................... 141
7.3.3 Canopy budget models ............................................................................... 142 7.3.3.1 Time step ............................................................................................. 143 7.3.3.2 Precipitation deposition ..................................................................... 145 7.3.3.3 Tracer ion ........................................................................................... 145 7.3.3.4 Canopy leaching of weak acids .......................................................... 146 7.3.3.5 Canopy uptake of NO3
- ....................................................................... 147 7.3.3.6 Canopy uptake of NH4
+ and NO3- during the leafless period ............. 149
7.3.4 Data analysis .............................................................................................. 149
7.4 Results .............................................................................................................. 150 7.4.1 Deposition onto an individual beech canopy ............................................. 150 7.4.2 Deposition ratio between a coniferous and a deciduous stand .................. 153 7.4.3 Determination of trends in deposition ........................................................ 155
7.5 Discussion ......................................................................................................... 158 7.5.1 Effect of time step, type of precipitation data and tracer ion ..................... 158 7.5.2 Effect of canopy exchange calculations: canopy leaching of weak acids, NO3
- uptake and canopy uptake of N during the leafless season ............................. 161 7.5.3 Comparison with literature data ................................................................. 163 7.5.4 Local effects ............................................................................................... 163
7.6 Conclusion ........................................................................................................ 164
CHAPTER 8 GENERAL DISCUSSION AND CONCLUSIONS ........................ 167
8.1 Quantifying canopy exchange and dry deposition of N: methodological considerations ............................................................................................................. 168
8.2 Forest canopy control on dry deposition and canopy exchange processes 172 8.2.1 Leaf wettability, water storage capacity and bark roughness .................... 172 8.2.2 Leaf chemical and physiological characteristics ........................................ 173 8.2.3 Canopy structure ........................................................................................ 174
8.3 Control of atmospheric N concentration on dry deposition and canopy exchange ...................................................................................................................... 175
8.4 Suggestions for further research .................................................................... 176
SUMMARY .................................................................................................................... 179
SAMENVATTING ........................................................................................................ 183
REFERENCES ............................................................................................................... 187

CURRICULUM VITAE ................................................................................................ 205

List of abbreviations and symbols
Abbreviations
AF Artifical foliage
BC Base cations (= Na+ + K+ + Ca2+ + Mg2+)
BD Bulk precipitation deposition (mmolc m-2 period-1)
CA Contact angle (°)
CBM Canopy budget model
CE Canopy exchange (mmolc m-2 period-1 or kg ha-1 yr-1)
CL Canopy leaching (CE > 0) (mmolc m-2 period-1)
CU Canopy uptake (CE > 0) (mmolc m-2 period-1 or kg ha-1 yr-1)
dbh Diameter at breast height
DD Dry deposition (mmolc m-2 period-1 or kg ha-1 yr-1)
DDCBM Dry deposition calculated by the canopy budget model
DDAF Dry deposition calculated from artificial foliage
DDvd Dry deposition calculated from air concentration measurements multiplied
with a deposition velocity
DDF Dry deposition factor
DIN Dissolved inorganic nitrogen
DM Dry matter
DOC Dissolved organic carbon
DON Dissolved organic nitrogen
L Stomatal length (µm)
LAI Leaf area index (m2 m-2)
LiDAR Light detection and ranging
MMD Mean mass diameter (µm)
NTF Net throughfall deposition (mmolc m-2 period-1 or µmolc g-1 DM)
PAR Photosynthetic active radiation
PD Precipitation deposition (bulk or wet-only) (mmolc m-2 period-1)
RH Relative humidity (%)
SD Stomatal density (number of stomata m-2 leaf area)

SEM Scanning electron microscopy
SF Stemflow deposition (mmolc m-2 period-1)
SPS Stomatal pore surface (µm2)
TDac Total acidifying deposition (molc ha-1 yr-1)
TDN Total nitrogen deposition (kg ha-1 yr-1)
TF Throughfall deposition (mmolc m-2 period-1 or µmolc g-1 DM)
TLS Terrestrial laser scanning
W Stomatal width (µm)
WA Weak acids
WD Wet-only precipitation deposition (mmolc m-2 period-1)
WSC Water storage capacity (g m-2)
Symbols
δj Time-averaged relative difference from the mean
gsmax Theoretical maximal stomatal conductance (mol H2O m-2 s-1)
p Significance of a statistical test
r Pearson correlation coefficient
rs Spearman rank correlation coefficient
Rs Stomatal resistance (s m-1)
vd deposition velocity (cm s-1)
Chemical compounds
C Carbon
Ca2+ Calcium
Cl- Chloride
CO2 Carbon dioxide
H+ Proton
HCl Hydrogen chloride
HCO3- Bicarbonate
HNO3 Nitric acid
K+ Potassium
KCl Potassium chloride
Mg2+ Magnesium
N Nitrogen

Na+ Sodium
NH4+ Ammonium
NH3 Ammonia
pNH4+ Particulate NH4
+
NHx Reduced nitrogen (NH3 + NH4+)
N2O Nitrous oxide
NO3- Nitrate
NO2 Nitrogen dioxide
pNO3- Particulate NO3
-
NOy Oxidised nitrogen (NO3-, HNO3, NO2,…)
PO43- Phosphate
S Sulphur
SO2 Sulphur dioxide
SO42- Sulphate
pSO42- Particulate SO4
2- 15N N with atom mass of 15 g mol-1 13C C with atom mass of 13 g mol-1


1 Introduction
1.1 Atmospheric deposition on forest ecosystems
1.1.1 Definition
Atmospheric deposition is an important nutrient source in forest ecosystems (Lindberg et
al. 1986). It represents the total input of ions, gases and organic compounds to a forest
canopy and can be divided into several fractions according to Ulrich (1983) (Fig. 1.1).
From the viewpoint of the depositing compound, a distinction can be made between i)
wet deposition, i.e. the input of rainfall and snow, ii) dry deposition, i.e. the input of
particulate and gaseous compounds and iii) occult deposition, i.e. the impaction of mist
and fog (Ulrich 1983). An important contribution of occult deposition is generally limited
to mountainous and coastal areas, while the importance of dry and wet deposition varies
from region to region (Lovett 1994). From the viewpoint of the depositing surface (the
forest canopy), a distinction is made based on whether this surface influences the
deposition process. Precipitation deposition, i.e. rainfall, snow and large particles, is only
influenced by gravitation, while interception deposition consists of small particles, gases,
mist and fog and is determined by the state of the receiving surface (Ulrich 1983).
Fig. 1.1 Overview of the input and output pathways of a forest canopy (Talkner et al. 2010)
1

Chapter 1
Although in the rest of this work the viewpoint of the depositing compound is considered,
it is on interception deposition that the filtering efficiency of the forest canopy (size,
structure and chemical state) exerts an influence (see 1.2). In general, the structure of
forest canopies creates favourable micrometeorological conditions for the deposition of
atmospheric particles and gases (Rodrigo and Avila 2002). Their higher roughness and
greater exposed surface compared to other vegetation types promotes turbulence at the
forest boundary layer and increases their ability to filter gases and particles (De Schrijver
et al. 2007). Atmospheric deposition can then interfere with the forest canopy, which can
act as a net source or sink for a specific chemical compound. Stand deposition is then the
output of ions and organic compounds from the canopy and consists of throughfall and
stemflow, which represent the dissolved nutrient input to the forest floor (Fig. 1.1;
Talkner et al. 2010).
1.1.2 Human induced changes in atmospheric deposition
The study of atmospheric deposition on forest ecosystems has gained increasing interest
when first anthropogenic emissions of sulphur (S) dioxide (SO2) and then nitrogen (N)
compounds such as nitric oxide (NOy) and reduced N (NHx) increased. High SO2
emissions accounted for a strong acidity in rainfall dissolved as SO42-, the so-called ‘acid
rain’ (Martin 1984), which in turn could lead to acidification of forest soils (Johnson and
Lindberg 1992; De Schrijver et al. 2006). Furthermore, it led to acute and chronic effects
on stomatal functioning of tree foliage close to emission sources (Neighbour et al. 1988;
McAinsh et al. 2002) and significantly affected leaf characteristics such as leaf wettability
(Haines et al. 1985). In the 1970s and ‘80s, North America and Europe negotiated
emission reductions internationally, which has led to a significant decrease in SO2
emissions (Cape et al. 2003; Vestreng et al. 2007) and depositions (Staelens et al. in
press). Currently, most SO2 deposition occurs to forest ecosystems outside North America
and Europe (Fowler et al. 2009).
From 1960 onwards, the global rate of increase in anthropogenic NOx and NH3 emissions
has accelerated sharply in industrialized regions due to fossil fuel combustion and
agricultural activities (Galloway et al. 2003). Before this emission increase, N was only
available for the growth of plants and microbes when converted from N2 in the
atmosphere to reactive forms such as NH4+ and NO3
-, or through biological N fixation
(Driscoll et al. 2003). The productivity of most natural ecosystems was limited by the
2

Introduction
supply of biologically available N, particularly in temperate and boreal regions, and many
native plant species are adapted to and function optimally in soils with low N levels. The
more than doubled atmospheric input of reactive N into these ecosystems has
significantly altered the N cycle (Vitousek et al. 1997). As forest ecosystems tend to have
a high accumulation potential for this additional N (Galloway et al. 2003), several studies
have observed increased tree growth with N deposition (Solberg et al. 2009), although not
for all tree species (Thomas et al. 2010). Within the framework of climate change, much
attention has also been given to the impact of this increased N availability to carbon (C)
storage in forests; however, this effect is still under debate (Nadelhoffer et al. 1999;
Magnani et al. 2007; Sievering et al. 2007; Högberg 2011).
Research conducted during the last 20 years has caused a major shift in the perspective of
forest ecologists on N. The large reservoir size and the relatively low turnover rate of
forest ecosystems implicates that these human induced changes in N availability can have
long-term effects (Aber et al. 2003). Chronic N input from air pollution exceeds the
normal growth requirement of forests in large areas in Europe and some parts of North
America, and has led to a conceptual model of “N saturation” that describes the temporal
sequence of changes in ecosystem functioning in response to chronic increased N input
(Aber et al. 1989; Gundersen et al. 2006). After the first phase of increasing primary
production and accelerated N cycling, the composition of the forest floor vegetation may
gradually change towards more nitrophilic species (Bobbink et al. 1998) and other
essential resources (light, water and other nutrients) may at least periodically limit tree
growth. In the accelerated N cycle, net nitrification becomes important, nitrate (NO3-)
starts to appear in soil water and the ecosystem approaches N saturation. When elevated
NO3- leaching becomes a chronic condition, soil acidification becomes significant due to
the depletion of so-called base cations such as calcium and magnesium and the
mobilization of aluminium (Gundersen et al. 2006; De Schrijver et al. 2007). In this
regard, NO3- acts in concert with sulphate (SO4
2-) leaching, thus N and S pollution can
have additive effects. Nitrate leaching will continue to increase with deposition (Dise et
al. 2009) and losses of NO and the greenhouse gas N2O from the ecosystem was shown to
increase significantly (Pilegaard et al. 2006). This N saturation concept is supported by
many studies, although not all studies have supported the temporal sequence in which the
ecosystem responses occur (Emmett 2007; Lovett and Goodale 2011). Recently, a new
conceptual model of the N saturation process was presented and supported with data by
3

Chapter 1
Lovett and Goodall (2011), focusing on the mass balance of N and distinguishing kinetic
N saturation from capacity N saturation (Fig. 1.2). This illustrates the complexity of the N
cycle in forest ecosystems, as a result of which ecosystem N stocks and processes are not
as well studied as those of C (Butterbach-Bahl and Gundersen 2011).
Fig. 1.2 Conceptual model of N saturation in an ecosystem, illustrating N flow to various fates (internal sinks and losses from the ecosystem), examples of controlling factors, and ecosystem responses associated with N flow to those fates. Detritus includes the forest floor and woody debris, and SOM represents soil organic matter (Lovett and Goodale 2011)
The implementation of international agreements and conventions, e.g. the European
Commissions’ National Emission Ceilings Directive (NECD) or the UNECE Convention
on Long-range Transboundary Air Pollution (CLRTAP) and the establishment of critical
loads, must lead to emission reductions and increased ecosystem protection against
adverse effects of air pollution. Critical loads are defined as “a quantitative estimate of an
exposure to one or more pollutants below which significant harmful effects on specified
sensitive elements of the environment do not occur according to present knowledge”
(Nilsson and Grennfelt 1988). At the European level, emissions of NHx, NOy and SOx
4

Introduction
have steadily decreased from 1990 to 2005 (Hertel 2011), but this has not always resulted
in decreased atmospheric depositions on a local level (Erisman et al. 2005; Fowler et al.
2005). Long-term monitoring of N and S fluxes and their effects on total nutrient cycling
is imperative to assess ecosystem control on N and S losses and allow detection of forest
ecosystem recovery from historical pollution effects (Neirynck et al. 2008). However,
deposition processes to forest ecosystems are generally still poorly understood and
accurate quantification of N and S deposition remains a key issue (Wesely and Hicks
2000; Erisman et al. 2005). As the acidifying effect of N and S can be neutralised by the
base cations K+, Ca2+ and Mg2+, quantification of the atmospheric deposition of these ions
is also of importance to evaluate forest nutrient cycling.
1.2 The forest canopy as an interceptor of atmospheric nitrogen and sulphur
As mentioned in 1.1.1, forest canopies act as very efficient sinks for atmospheric gases
and particles. For example, atmospheric N deposition to forest ecosystems is enhanced up
to a factor of 2 to 3 compared to open land (Fowler et al. 2004). Although forest canopies
receive the same amount of wet deposition as other vegetation types, their large
aboveground biomass in contact with incident rainfall can alter the chemical composition
of precipitation significantly. This section reviews the effect forest canopies can exert on
these processes and addresses existing knowledge gaps.
1.2.1 Wet and dry deposition processes
Wet deposition is controlled by the concentration and size distribution of atmospheric
particles, the concentration, solubility and reactivity of gases and by the meteorological
factors that control precipitation (Lovett 1994; Beverland et al. 1998). Its composition
will therefore vary across regions. Especially small aerosols enclosing SO42-, NO3
- and
NH4+ are efficiently removed from the atmosphere through wet deposition (Fowler et al.
2001). The atmospheric chemistry of S and N compounds is complex and beyond the
scope of this thesis. In general, the wet deposition process is the result of gravity acting
on droplets that have grown large enough to fall, and the primary control on the rate of
deposition is the number and size of droplets in the air and the chemistry of those droplets
(Lovett 1994). Wet deposition can be reasonably well estimated by bulk or wet-only
precipitation collectors. When using bulk precipitation collectors, wet deposition is
5

Chapter 1
overestimated due to dry deposition onto the collector surface, which is washed away into
the sample during the next precipitation event (Staelens et al. 2005).
Deposition of dry particles and gases is a complex process governed by air concentrations
and turbulent transport processes in the boundary layer, as well as by the chemical and
physical nature of the depositing species and the capability of the surface to capture or
absorb gases and particles (Erisman and Draaijers 2003). It is generally conceptualized as
a resistance analogy (Hicks et al. 1987; Fig. 1.3). First, the transport of gases and particles
from the atmosphere to the near surface is governed by the level of atmospheric
turbulence (aerodynamic resistance; Ra), generated by both wind shear and buoyancy.
Tree height, leaf area density profile and the leaf area index (LAI) have been shown to
influence the dry deposition of particles through the level of atmospheric turbulence
(Erisman and Draaijers 2003; Katul et al. 2011), but research questions on the impact of
the canopy on dry deposition still remain to be answered and supportive data are lacking
(Petroff et al. 2008).
Fig. 1.3 The dry deposition process as the sum of the aerodynamic resistance Ra, the boundary layer resistance Rb and the surface resistance Rc. Ra is determined by the roughness length (z0) and the displacement height (d) and influences the concentration gradient (C(t)) above the receptor surface (Erisman and Draaijers 2003)
6

Introduction
Second, deposition on the forest canopy is determined by the boundary layer resistance
(Rb) (Hicks et al. 1987). Particles at the large end of the spectrum (i.e. with an
aerodynamic diameter > 5 µm) such as aerosols containing Na+, Cl-, Ca2+, Mg2+ and NO3-
(Lindberg et al. 1986; Ruijgrok et al. 1997) are transferred through the boundary layer
mainly by gravitational sedimentation and inertial impaction, while smaller particles (<
0.2 µm) can be transferred through Brownian diffusion (Davidson and Wu 1991).
Particles between this size range and particularly from 0.2 to 2 µm, such as NH4+, SO4
2-
but also NO3- are not readily dry deposited and tend to travel long distances in the
atmosphere until their eventual deposition, most likely through incorporation into
precipitation (Lovett 1994). However, they can still account for a large part of total mass
deposition (Davidson et al. 1982). Since particles are not able to diffuse through stomatal
openings, their deposition is mainly determined by microstructure and turbulence
intensity (Erisman and Draaijers 2003). Tree shoots with a more complex structure, such
as needles or more hairy leaves are more efficient in capturing dry deposition (Beckett et
al. 2000; Freer-Smith et al. 2004). Gases such as NH3, HNO3, NO2 and SO2 can easily
traverse the boundary layer by molecular diffusion, but then final deposition is
determined by the chemical, physical and biological nature of the canopy, summarized as
the canopy resistance Rc which consists of several resistances in parallel (Erisman and
Draaijers 2003). Surface deposition (defined as the cuticular resistance, Rcut) is controlled
by leaf characteristics, such as surface wetness chemistry and leaf surface wetness,
(Burkhardt and Eiden 1994; Neirynck et al. 2005) and the nature of the gas (highly
reactive gases such as HNO3 vs less reactive such as SO2 or NO2). Stomatal transport (or
stomatal resistance, Rs) is regulated by all the physiological factors and meteorological
conditions that regulate stomatal opening (Hicks et al. 1987). The sum of Ra, Rb and Rc is
the total canopy resistance Rt (s cm-1), the inverse of the deposition velocity (vd; cm s-1).
The deposition flux of a certain atmospheric gas or particle to a forest canopy is then
calculated by the product of vd with its atmospheric concentration.
Despite significant developments and research throughout the years, measurements of dry
deposition (see Chapter 6 for an overview) are still subject to several problems and cannot
be quantified with sufficient accuracy (Erisman et al. 1994). Process oriented studies are
needed to derive insight into deposition processes for different atmospheric components
and to obtain process descriptions and parameters to be used in models.
Micrometeorological methods provide the highest accuracy for this purpose, but in
7

Chapter 1
heterogeneous forest stands throughfall measurements might be a more suitable
alternative. These process oriented studies can also be used to test or verify other
simple/cheap measuring methods (Erisman et al. 1994).
1.2.2 Canopy exchange processes of N
Uptake of atmospheric N deposition is potentially possible through foliage, twigs,
branches and stems (Harrison et al. 2000). The ability of tree canopies to take up
ammonium (NH4+) and NO3
- from wet deposition is well known, as observed from
changes in N composition of rainfall and throughfall (Parker 1983; Lindberg et al. 1986;
Cappellato et al. 1993; Lovett and Lindberg 1993; Neary and Gizyn 1994; Houle et al.
1999), from 15N labelling studies (Bowden et al. 1989; Brumme et al. 1992; Eilers et al.
1992; Garten et al. 1998; Dail et al. 2009) and from comparisons of N fluxes beneath real
and plastic trees of similar morphology (Ignatova and Dambrine 2002; Stachurski and
Zimka 2002). It is believed that the transport of NO3- and NH4
+ ions at the leaf surface
primarily occurs through cuticular diffusion (Peuke et al. 1998; Fig. 1.4), however, the
exact mechanism is still unclear as it also is for the uptake through the bark of twigs,
branches and stems. Based on precipitation and throughfall measurements it is concluded
that NH4+ uptake is an ion-exchange process for which base cations are leached from the
foliage (Draaijers et al. 1997; Stachurski and Zimka 2002; Umana and Wanek 2010), but
passive diffusion through stomata and cuticular transport have also been suggested as
mechanisms (Schaefer et al. 1988; Bowden et al. 1989; Wilson 1992; Boyce et al. 1996).
Generally, uptake or emission of gaseous N dioxide (NO2) and ammonia (NH3) occurs via
the stomata and cuticle (Rennenberg and Gessler 1999) and has been observed from
micrometeorological measurements (Neirynck et al. 2007; Wu et al. 2011), 15N-labelling
experiments (Vose and Swank 1990; Bruckner et al. 1993; Gessler et al. 2002) and flux
chamber experiments (Van Hove et al. 1987a; Thoene et al. 1996; Gessler et al. 2000;
Gessler et al. 2002; Raivonen et al. 2009). Nitrogen dioxide and NH3 dissolve in the leaf
apoplast to primarily form nitrous acid (HONO, HNO2) and nitric acid (HNO3) that then
dissociate to nitrite (NO2‐), NO3‐, and protons (H+) and NH4+, respectively (Wellburn
1990). After dissolution NO3‐ is rapidly reduced to NO2-, which is in turn reduced to NH4
+
after transport to the chloroplast (Stulen et al. 1998). Ammonium is assimilated by the
glutamine synthetase and glutamate synthase systems (Pearson et al. 2002; Krupa 2003).
Atmospheric NH3 and NO2 may also be adsorbed at the leaf cuticle and dissolve in the
8

Introduction
thin water film. They can then either be taken up through the cuticle, washed off with
incident rainfall or be re-emitted when the water films are dried (Rennenberg and Gessler
1999).
Fig. 1.4 Uptake mechanisms of NH3/NH4+ (left) and NO2/NO3
- (right) through tree leaves (Rennenberg and Gessler 1999)
The uptake of N compounds is greatly controlled at the leaf level by chemical and
physiological leaf characteristics (Sparks 2009). The dissolution of NH3 in the apoplast is
driven by the concentration difference between NH3 in the substomatal cavity and
NH3/NH4+ in the aqueous phase of the apoplast, resulting in a stomatal compensation
point which determines if emission or deposition occurs (Farquhar et al. 1980). Stomatal
compensation points for NH3 are shown to depend on leaf development stage (Wang et al.
2011), temperature and N nutritional stage (Farquhar et al. 1980; Sutton et al. 1995;
Husted and Schjoerring 1996). As forest ecosystems become more N saturated, tree
canopies may emit significant amounts of NH3 (Rennenberg and Gessler 1999; Neirynck
and Ceulemans 2008). Some studies have also reported on a leaf compensation point for
NO2 (Thoene et al. 1991; Gessler et al. 2000; Raivonen et al. 2009), but this has not
always been confirmed (Chaparro-Suarez et al. 2011). The primary physiological leaf
control over gaseous uptake of NH3 and NO2 is stomatal conductance (Hanson and
Lindberg 1991; Hanstein et al. 1999; Gessler et al. 2000; Chaparro-Suarez et al. 2011),
which in turn depends on the microclimate (Van Hove et al. 1990), internal CO2
concentration (Farquhar and Sharkey 1982) and plant water status (Hutchinson et al.
1972). Dissolved uptake through leaf cuticles is suggested to be enhanced by the degree
of wettability of the foliar surface (Harrison et al. 2000; Sase et al. 2008) and was shown
9

Chapter 1
to occur mainly during the growing season when the foliage is physiologically active
(Harrison et al. 2000).
Canopy uptake of N may contribute substantially (16-42 %) to the total N demand of
trees (Harrison et al. 2000), depending on the atmospheric N concentration (Schaefer et
al. 1988; Eilers et al. 1992; Krupa 2003), N status of the plant (Muller et al. 1996; Stulen
et al. 1998) and the tree species (Morikawa et al. 1998). Canopy uptake of atmospheric N
may support additional growth, development and storage in trees (Fangmeier et al. 1994).
The rest of the N demand is met by N uptake through the roots, mainly as NH4+, NO3
- and
to a lesser extent as organic N (Vallano and Sparks 2007). Plant available N in the soil is
mainly the result of litter decomposition, biological N2 fixation and atmospheric
deposition (Butterbach-Bahl and Gundersen 2011). The uptake of N by roots is a well
regulated process controlled by shoot-related signals (Stulen et al. 1998; Rennenberg and
Gessler 1999). Enhanced canopy N uptake was shown to reduce N uptake via roots
(Pérez-Soba and Van der Eerden 1993; Muller et al. 1996) through the translocation of
amino acids generated from N taken up via foliage via the phloem to the roots, which
then interact with inorganic N uptake in the roots (Rennenberg et al. 1998). However, a
feedback mechanism also exist in the opposite direction, leading to decreased canopy
uptake at increasing root N availability (Dyckmans and Flessa 2001; Vallano and Sparks
2008; Tateno and Takeda 2010).
Estimates of canopy N uptake compared to soil-derived N are highly variable, ranging
from 0-80 % (Harrison et al. 2000; Gaige et al. 2007; Sievering et al. 2007), mainly due
to the difficulty of estimating canopy uptake from throughfall measurements and an
incomplete closure of the N budget at any given site (Sparks 2009). However, as pointed
out by Sparks (2009), the quantification of canopy N uptake separately from soil N
uptake is important since (i) canopy uptake leads to a direct addition of NO3- and NH4
+ to
the trees metabolism without competition with soil organisms, (ii) detrimental effects of
atmospheric N mainly occur in the forest soil, while canopy uptake may influence tree
growth and (iii) the partitioning of total deposition between canopy uptake and deposition
to other surfaces could be very different across environments due to varying transport
distances of N compounds.
10

Introduction
1.2.3 Canopy exchange processes of S
In general, forest canopy interactions of deposited S are small due to the counteracting
effects of foliar uptake and leaching (Lindberg and Lovett 1992). Uptake occurs most
likely in the form of dry deposited SO2, which is known to enter the substomatal cavity of
the leaf or needle (Winner et al. 1985) and which is mainly controlled by stomatal
conductance (Bache 1977). There is also some evidence for cuticular uptake (Winner et
al. 1985), which is strongly enhanced by wind and abrasive damage on the cuticle (Hoad
et al. 1992). Lindberg and Lovett (1992) estimated that annually 20-70 % of dry deposited
SO2 is fixed in tree canopies over North America and Europe. Foliar leaching of SO42-
results from root uptake and subsequent transport to the canopy. Garten (1990) and Cape
et al. (1992) estimated this leaching to contribute little to throughfall by means of
radioactive 35SO4 measurements, although the results of these studies were not conclusive
and they were conducted at regions with high S deposition. Lindberg and Lovett (1992)
concluded that canopy leaching of SO42- is unimportant at sites with high S deposition
where deposition wash off dominates the below canopy flux and cannot be detected in the
canopy balance because of uptake of SO2. This low canopy interaction of SO42- makes
throughfall plus stemflow an excellent indicator of total atmospheric S loading to forests
(Lindberg and Lovett 1992). However, as S deposition fluxes have decreased, canopy
leaching might contribute more significantly to SO42- fluxes in throughfall.
1.3 On the importance of studying processes at different spatio-temporal scales
To be able to quantify total atmospheric deposition of pollutants and to understand the
pathways by which airborne pollutants enter and react within ecosystems, measurements
at different spatio-temporal scales are highly valuable. Due to the complexity of forest
structure, measurements on particular components of it, such as leaves, branches, or a
horizontal canopy layer are often conducted (Nadkarni et al. 2008), leading to leaf area
based flux rates, such as for NH3 (Van Hove et al. 1989a; Bruckner et al. 1993; Gessler et
al. 2000; Gessler et al. 2002; Wang et al. 2011), NO2 (Nussbaum et al. 1993; Thoene et
al. 1996; Gessler et al. 2000; Gessler et al. 2002; Raivonen et al. 2009) and SO2 (Van
Hove et al. 1989a) and HNO3 (Vose and Swank 1990). For fluxes of dissolved NH4+ and
NO3- such experiments are relatively scarce (Wilson and Tiley 1998; Sparks 2009;
Umana and Wanek 2010), especially at realistic concentrations (Cape et al. 2003).
Research on a within canopy spatial scale allowed assessing the effect of local canopy
11
Chapter 1
structure on horizontal atmospheric deposition patterns (Beier et al. 1993b; Staelens et al.
2006). A few studies also compared vertical throughfall patterns within tree canopies, but
without quantifying canopy structure (Schaefer et al. 1988; Hansen 1996). Since it is
currently possible to more accurately quantify local canopy structure (Lefsky et al. 2005;
Van der Zande et al. 2006), such within canopy studies could be valuable to aid the
understanding of dry deposition and canopy exchange processes (Nadkarni and Sumera
2004). These leaf-level and canopy-level measurements should then be integrated in
stand-level estimates of atmospheric deposition fluxes, although this remains challenging
(Sparks 2009). Stand level estimates of atmospheric deposition are necessary to be able to
relate the total input of atmospheric pollutants to the ecosystem response (de Vries et al.
2007), to compare different forest types (De Schrijver et al. 2007) and to assess long term
trends (Neirynck et al. 2002; Vanguelova et al. 2010). It is also essential to conduct
studies at a fine temporal scale, since several studies have already demonstrated the
impact of leaf phenology (Houle et al. 1999; Hill et al. 2002; Staelens et al. 2007; Sase et
al. 2008; Wang et al. 2011) and varying canopy wetness due to temperature and relative
humidity differences (Cape et al. 1998; Neirynck et al. 2005) on canopy exchange and dry
deposition processes. Results of these studies should be integrated in annual deposition
estimates to evaluate long term trends.
1.4 Aims and outline of the thesis
The first general aim of this thesis was to gain better insight in spatio-temporal dry
deposition and canopy exchange processes in forest canopies, with the emphasis on
atmospheric N as knowledge is still lacking here. The second general aim was to evaluate
the often-used canopy budget model (Draaijers and Erisman 1995) to calculate total
atmospheric deposition of N and S from throughfall measurements. To achieve both aims,
experiments were conducted at several spatial and temporal scales with several tree
species and the relationship of the observed fluxes to chemical, physiological and
structural canopy parameters was assessed. The specific aims were:
- To quantify canopy N uptake for different tree species and phenological stages
and relate this N uptake to differences in leaf characteristics;
- To assess differences in dry deposition and canopy exchange along a vertical
gradient within the canopy of different tree species and relate these to differences
in canopy structure and canopy phenology;
12

Introduction
- To assess the effect of the considered canopy budget model on patterns of total N
and acidifying deposition.
We focused on temperate tree species common in Flanders (Belgium) where critical loads
(CL) are exceeded on large parts of the forested area. In 2010, CL for acidifying
deposition were exceeded at 67 % of the forested area (Flemisch Environmental Agency;
www.milieurapport.be), and in 2011, all forests in Flanders still received higher N
deposition than the CL for protection of biodiversity (Overloop et al. 2011).
These aims are addressed in the next six chapters, which are grouped in three main parts
based on the spatial scale of study (Fig. 1.5). In the first main part, which comprises
experiments conducted at the level of a foliated twig, the uptake of inorganic N from
wet (NH4+, NO3
-) and dry (NH3) deposition by foliage and twigs of four different tree
species, i.e. silver birch (Betula pendula Roth), European beech (Fagus sylvatica L.),
pedunculate oak (Quercus robur L.) and Scots pine (Pinus sylvestris L.), was assessed
by means of stable N isotope (15N) tracing. Both ambient and elevated N concentration
levels were used. Chapter 2 quantifies the foliar uptake of NH4+ and NO3
- at different leaf
phenological stages (period of leaf development, fully leafed period, period of leaf
senescence) and assesses whether this uptake is related with leaf wettability and leaf
water storage capacity. In Chapter 3 the uptake of NH3 by foliage and twigs is quantified
at three different treatment dates within the growing season and the relationship with leaf
characteristics was investigated. Chapter 4 assesses the NH4+ and NO3
- retention by twigs,
the retention process (adsorption vs absorption) and relates the NH4+ and NO3
- retention
of leaves and twigs to fluxes of NH4+, NO3
- and other major ions in throughfall water.
In the second main part, comprising two observational studies at the canopy level,
dry deposition and canopy exchange are studied along a vertical gradient within a
tree canopy. Chapter 5 assesses the variability of throughfall deposition and calculated
canopy exchange and dry deposition along a vertical gradient within a beech (Fagus
sylvatica L.) and two Norway spruce (Picea abies Karst.) canopies. In Chapter 6 the
calculated dry deposition by the canopy budget model is compared with dry deposition
calculated from air concentration measurements and from dry deposition onto artificial
foliage. Furthermore, the effect of canopy structure on dry deposition is assessed by
means of terrestrial laser scanning.
13

Chapter 1
14
In the third part of the thesis (Chapter 7), the effect of varying forms of the canopy
budget model, partly based on results derived from the previous chapters, on
patterns of total N and acidifying deposition are evaluated. A schematic overview of
the structure of the thesis is presented in Fig. 1.5.
Can
opy
leve
lB
ranc
h le
vel
Stan
d le
vel
Dry deposition and canopy exchange response variable
Forest canopy control
Throughfall deposition, dry deposition and canopy exchange
Dry deposition
Source of variation
Volume of canopy elements
Chapter 4
Variation between tree species, canopy
phenology and within canopy
variability
Chapter 5
Chapter 6
Chapter 7
Within canopy variability
Total nitrogen and potentially acidifying
deposition
Variation between tree species and
years
Calculation of forest canopy control: the
canopy budget model
Leaf wettability water storage capacity
Foliar nitrogen uptake from wet deposition
Chapter 2
Chemical and physiological leaf
properties
Canopy uptake of atmospheric NH3
Chapter 3
Variation between tree species and
phenological stages
Retention of dissolved inorganic nitrogen
Fig. 1.5 Outline of the thesis


17
2 Foliar nitrogen uptake from wet deposition and the relationship withleaf wettability and water storage capacity
After: Adriaenssens S, Staelens J, Wuyts K, De Schrijver A, Van Wittenberghe S, Wuytack T, Kardel F, Verheyen K, Samson R, Boeckx P (2011) Foliar nitrogen uptake from wet deposition and the relation with leaf wettability and water storage capacity. Water, Air and Soil Pollution 219, 43-57
2.1 Abstract
This study assessed the foliar uptake of 15N-labelled nitrogen (N) originating from wet
deposition along with leaf surface conditions, measured by wettability and water storage
capacity. Foliar 15N uptake was measured on saplings of silver birch, European beech,
pedunculate oak and Scots pine and the effect of nitrogen form (NH4+ or NO3
-), NO3- to
NH4+ ratio and leaf phenology on this N uptake was assessed. Next to this, leaf wettability
and water storage capacity were determined for each tree species and phenological stage,
and the relationship with 15NH4+ and 15NO3
- uptake was examined. Uptake rates were on
average five times higher (p < 0.05) for NH4+ than for NO3
- and four times higher for
deciduous species than for Scots pine. Developing leaves showed lower uptake than fully
developed and senescent leaves, but this effect was tree species dependent. The applied
NO3- to NH4
+ ratio did only affect the amount of N uptake by senescent leaves. The
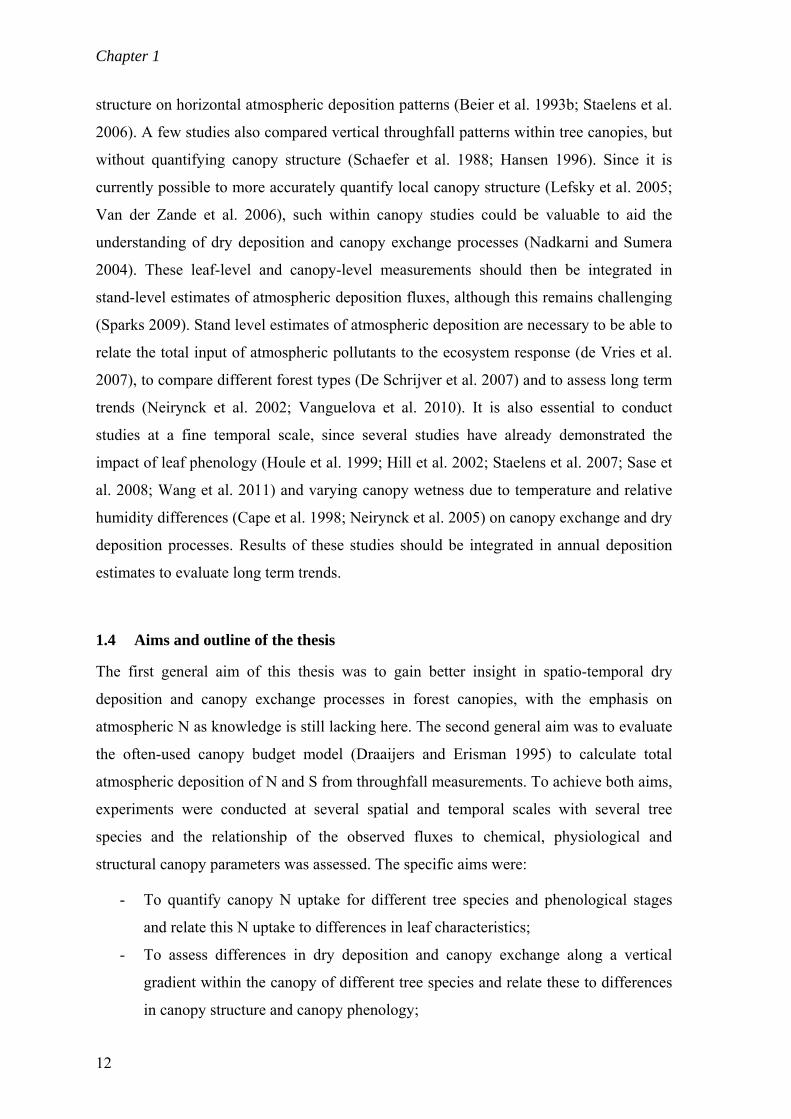
negative correlation between measured leaf contact angles and foliar N uptake
demonstrates that the observed effects of tree species and phenological stage are related
to differences in leaf wettability, and not to water storage capacity.

Chapter 2
2.2 Introduction
Increased deposition of atmospheric reactive nitrogen (N) oxides (NOy) and ammonia
(NH3) to forest ecosystems has significantly altered internal N cycling and other forest
ecosystem processes with potentially both beneficial and adverse consequences (Vitousek
et al. 1997). This atmospheric N can be taken up either by aboveground tree parts or by
the forest soil (Rennenberg and Gessler 1999), two pathways which have shown to be
interrelated (Bruckner et al. 1993; Rennenberg et al. 1998; Vallano and Sparks 2008).
Nitrogen incorporated through foliage is a direct addition to metabolism, while N
additions to the soil surface may also be incorporated into microbial biomass,
revolatilized, or leached (Rennenberg and Gessler 1999; Sparks 2009). Recent studies
show that canopy N retention can amount to up to 70 % of N deposition, providing as
much as one-third of tree N requirements without any competition from soil microbial
biomass (Gaige et al. 2007; Sievering et al. 2007). However, other canopy elements than
leaves, such as branches, boles and lichens can also provide a substantial sink for N
through physicochemical processes rather than by N assimilation (Dail et al. 2009;
Chapter 4). Next to this, Dail et al. (2009) showed that the vegetation and not the soil is
the most important short-term sink under increased N availability. This retained N can be
rapidly assimilated by the canopy (Calanni et al. 1999). Therefore, it is possible that
canopy uptake will favour the growth response of historically N limited forests (Sparks
2009).
Nitrogen uptake can occur via dry deposition (e.g. NH3 and NO2) and/or wet deposition
(NH4+, NO3
-) by foliage via stomata and the cuticle (Rennenberg and Gessler 1999).
Generally, gaseous retention of N compounds is driven by stomatal characteristics and
can be modelled well using a compensation model developed by Sutton et al. (1998). In
contrast, foliar uptake processes from wet deposition are stipulated by the surface
conditions of the leaves, i.e. surface roughness and wax chemistry, which can be
characterized by leaf wettability and water storage capacity (WSC) (Boyce et al. 1991).
Since the uptake of dissolved ions is assumed to occur mainly via the cuticle (Peuke et al.
1998), higher wettability could favour this process by enlarging the contact area between
incident rainwater droplets and the cuticle (Sase et al. 2008). Similarly, a higher WSC
would prolong the contact period between incident rainwater and leaves and as such the
time for exchange processes. These two parameters differ between tree species (Holloway
18

Foliar N uptake from wet deposition
1969; Hall and Burke 1974) but also between different phenological stadia within one
species (Sase et al. 2008). Moreover, they are easy to measure and could give clear
indications about the expected foliar uptake for a range of different tree species and
through the growing season.
An accurate quantification of canopy N uptake from wet deposition is frequently obtained
by applying 15N-labelled sources at tracer levels. In contrast to throughfall measurements
(Thimonier et al. 2005), it is possible with this technique to quantify direct foliar uptake
and, if the foliage is rinsed prior to analysis, to distinguish between N assimilated by
foliage or N adsorbed to the cuticle (see Chapter 4). This 15N pulse chase technique has
been used to investigate effects of tree species, N load and N form on foliar uptake, both
in field studies (Brumme et al. 1992; Eilers et al. 1992; Lumme 1994; Boyce et al. 1996;
Garten et al. 1998; Dail et al. 2009) and laboratory studies (Bowden et al. 1989; Garten
and Hanson 1990; Lumme 1994; Lumme and Smolander 1996; Wilson and Tiley 1998;
Chávez-Aguilar et al. 2006). However, most of these studies have used N loads far above
ambient levels.
In this study, the 15N pulse chase technique was used to quantify foliar N uptake from wet
deposition under ambient N load levels for four ecologically different tree species. We
hypothesize that foliar N uptake is influenced by tree species, N form, applied NO3- to
NH4+ ratio and leaf phenological stage (the periods of leaf development, fully developed
leaves and leaf senescence) and assessed the relative importance of these factors.
Moreover, we test the hypothesis whether this N uptake is related to leaf wettability and
leaf WSC.
2.3 Materials and methods
2.3.1 Plant material and climate
This study was performed using living, leafed twigs of 3-year old potted saplings of
European beech (Fagus sylvatica L.), pedunculate oak (Quercus robur L.), silver birch
(Betula pendula Roth) and Scots pine (Pinus sylvestris L.). These species are widespread
in temperate regions, but have a different ecological behaviour (i.e. pioneer vs climax
species, deciduous vs coniferous species, sun leaves vs shade leaves) (Fitter and Peat
1994; http://www.ecoflora.co.uk) and a different canopy structure (i.e. leaves vs needles),
which may have an influence on foliar nitrogen uptake. All saplings were grown in a tree
19

Chapter 2
nursery and were of known provenance. They were potted on February 27th 2008 in a
mixture of peat and slow releasing fertilizer (8.6 g N kg-1 dry soil year-1) in order to
eliminate the effect of varying soil nutrient availability on aboveground N uptake by
leaves. The saplings were placed at a wind sheltered location in the close vicinity of the
laboratory near Ghent (north of Belgium, approximately 60 km from the North Sea in the
prevailing wind direction; 50°58 N, 3°49 E). Mean annual precipitation (1980-2008) at a
nearby weather station operated by the Belgian Royal Meteorological Institute
(www.kmi.be) is 784 mm and is distributed equally over the year, and mean annual
temperature is 10.4°C. The region of Flanders is characterized by relatively high
atmospheric N and sulphur (S) deposition. In the period 2002-2006, average estimated
annual total deposition fluxes to a mixed beech forest nearby amounted to 30 kg N ha-1 yr-
1 and 20 kg S ha-1 yr-1 (Verstraeten et al. 2007).
2.3.2 Experimental setup and sample analysis
2.3.2.1 15N application
Two twigs with a length of approximately 30 cm were selected per tree (four replicated
trees per treatment) and were sprayed with an artificial rainwater solution of inorganic
salts in deionised water. It contained all major ions, with concentrations (in mg L-1) based
on average precipitation data for this area in 2002-2006 (VMM 2009): 0.82 (Na+), 0.09
(K+), 0.44 (Ca2+), 0.17 (Mg2+), 0.67 (SO42--S), and 2.07 (Cl-). The pH amounted to 5.5.
One twig was sprayed with a solution containing 15N-labelled (99 atom %) NH4+; the
other was sprayed with 15N-labelled (99 atom %) NO3-. Two types of solutions were
applied as separate treatments, subsequently called the ’low NO3- to NH4
+ ratio’ and the
’high NO3- to NH4
+ ratio’ treatments. The concentration of NH4+-N was similar in both
solutions (0.84 mg L-1). However, in the ’high NO3- to NH4
+ ratio ratio treatments, the
concentration of NO3--N (1.26 mg L-1) and Cl- (5.00 mg L-1) were 3 and 2.42 times higher
than those in the ’low NO3- to NH4
+ ratio treatments, (0.42 mg NO3--N L-1 and 2.07 mg
Cl- L-1). As such, the NO3- to NH4
+ ratio differed by a factor three between the treatments
(1:2 versus 3:2), hereby simulating increased future emissions of reactive N compounds
by combustion processes.
A preliminary test revealed that the 15N enrichment in sprayed leaves was similar 2 and
24 h after 15N application. Therefore, branches were removed 2 h after the first
application to ensure complete N uptake from plant surfaces while preventing meaningful
20

Foliar N uptake from wet deposition
transport of 15N containing assimilation products to other tree parts. Each twig was
sprayed two times with 100 ml of the rainwater solution with a 1-h interval to allow
leaves to dry, and was cut 1 h after the second application. The volume sprayed was
sufficient to start drainage from the twigs. All equipment was used in duplicate to avoid
any cross contamination between 15NH4+ and 15NO3
- treatments. The living twigs were
sprayed in boxes to prevent 15N contamination of other plant parts. To quantify the exact
amount of solution applied to each twig, the initial and final weights of the sprayer were
registered. The experiment was conducted on developing leaves (15-May-2008 for birch
and pine, 28-May-2008 for beech and oak), fully developed leaves (19-Aug-2008 for all
species) and senescent leaves (19-Sept-2008 for birch and pine, 16-Oct-2008 for beech
and oak) to assess the effect of leaf phenology on N uptake. The spring and autumn
experiments were done earlier for birch and pine than for beech and oak to account for the
different phenology of the species. Since needle sprouting of pine occurred late in the
growing season (June), no results are available for the developing stage of pine.
2.3.2.2 Measurement of leaf wettability and visualisation of leaf surface structure
Contact angles (CAs) of standardized water droplets with the leaf surface can be used as a
proxy for leaf wettability (Brewer et al. 1991). Low angles indicate the tendency to form
water films rather than droplets, high angles indicate water repellence. The CAs were
measured, using the software ImageJ, from digital photographs of a water droplet (7 µl
for the deciduous species; 3 µl for Scots pine) on the abaxial and adaxial leaf surfaces of
non-treated branches (Canon EOS 5D digital camera and Sigma macro lens EX DG 105
mm, f 2.8). Ten replicates per species, phenological stage and leaf side were measured.
Next to this, the leaf surface structure was visualized by digital photographs at different
magnifications. First, four samples of fresh leaf material of all species were taken and
kept in a 70 % ethanol solution. Later, they were mounted on aluminium stubs using a
double-sided adhesive tape and immediately dried in a critical point dryer (Balzers CPD-
010 unit). Afterwards, they were sputtered with gold (30-40 nm thick) using a sputter
coater (Cressington 108 auto) and transferred to the cold stage of a scanning electron
microscope (Philips 515 SEM) by means of a transfer rod under high vacuum, after
opening the transfer valve with an acceleration voltage of 20 kV.
21

Chapter 2
2.3.2.3 Estimation of leaf/needle biomass, water storage capacity and surface area
Before 15N application, a representative twig of each tree was sampled to measure leaf
biomass, WSC and surface area. The WSC of leaves, defined as the difference between
the wetted and dry biomass divided by leaf area, was determined to estimate interception
during a normal rain event. In contrast to leaf wettability, WSC is also influenced by leaf
orientation and could render a more realistic measurement under ambient conditions. For
this purpose, a laboratory experiment adapted from Aston (1979) and Herwitz (1985) was
conducted. The representative twig was severed at its base only seconds before the
experiment in order to prevent wilting. Next, each twig was suspended in turn from a
balance (precision of 0.001 g) at an angle to the vertical approximately the same as its
former angle to the stem. The weight of the branch was then recorded under the following
conditions: (a) non-wetted (fresh weight); (b) fully wetted by continuous spraying with a
garden sprayer; (c) after dripping. Next, the leaves were removed from the twigs and the
experiment was repeated. The WSC was calculated for fully wetted leaves and after
dripping, representing respectively calm and windy conditions, as the difference between
the WSC of fully leafed branches and the WSC of twigs only. After the experiment, the
remaining detained water was allowed to evaporate, the leaves and branches were
separated and the surface area was measured. Total one-sided leaf area of the deciduous
species was measured with a LI-3000 Portable Area Meter (LICOR, Lincoln, Nebraska).
Needle surface area was estimated assuming a half cylindrical shape and based on the
number of needles per branch and the mean needle length and diameter of ten randomly
selected needles.
2.3.2.4 Analysis of plant material
After harvesting, all twigs were washed thoroughly with deionised water in order to
remove any 15N adsorbed to the surface of leaves/needles or branches. Next, leaves,
needles and branches were separated, dried in paper bags for 48 h at 50°C, weighed and
ground to a fine powder (< 250 µm) using a centrifugal mill (Retsch ZM1, Germany).
Finally, samples were analyzed for total N and 15N in duplicate using an Elemental
Analyzer (EA) interfaced to an Isotope Ratio Mass Spectrometer (IRMS) (20-20, SerCon,
UK). Machine error (n = 10) of this EA-IRMS system is 0.2‰ for δ15N. Cross
contamination was avoided by including method blanks and analytical quality was
checked by the standard deviation of two replicate measurements.
22

Foliar N uptake from wet deposition
2.3.2.5 Analysis of plant available inorganic nitrogen
From April to October 2008, soil was sampled monthly from three different control pots
(without a tree) and frozen immediately. Plant available soil NH4+ was determined
colorimetrically in a KCl extract (1 M, soil:solution ratio 1:2, 1 h) by the salycilate-
nitroprusside method on an auto-analyzer (AA3, Bran & Luebbe, Germany). Nitrate was
determined colorimetrically (AA3) after reduction in a Cu-Cd column followed by
reaction of nitrite with N-1-napthylethylenediamine to produce a chromophore.
2.3.3 Data processing
Uptake of 15N per unit dry plant material (µg N g-1 DM) was calculated by accounting for
the natural abundance of 15N in untreated branches (Harrison et al. 2000):
% - %.% - %
treated untreated
solution untreated
at atY Xat at
= .10³ (2.1)
with Y being the 15N uptake (µg g-1 DM) and X the total N concentration (mg g-1 DM) in
the treated samples.
Differences in WSC for fully wetted leaves and for leaves after dripping and CA on the
abaxial and adaxial side were tested by analysis of variance (ANOVA) with tree species
and phenological stage as factors. Calculated N uptake for each combination of tree
species, NO3- to NH4
+ ratio, N form and leaf phenological stage was tested for significant
difference from zero by means of a one sample t-test. An ANOVA on the measured 15N
uptake was not possible due to heteroscedasticity across tree species, leaf phenology, N
form and NO3- to NH4
+ ratio according to Levene’s equality of variance test. However, by
splitting up the data according to the N form, three-way ANOVA allowed us to assess the
effect of the remaining factors on 15N uptake. Three-factor interaction was excluded from
the model because of insufficient degrees of freedom. Means were separated by Tukey’s
Honestly Significant Difference test and p values were calculated for each factor.
Afterwards, data were split up according to tree species, leaf phenology and NO3- to NH4
+
ratio to assess two-factor interactions. Data of WSC and 15N uptake were log-transformed
to meet normality conditions. The effect of N form was then tested by means of two-
tailed t-tests per tree species, NO3- to NH4
+ ratio and phenological stage. For pine, an
additional univariate analysis was done including needle age as extra factor. Correlations
between WSC, CA, foliar N content and 15NH4+ and 15NO3
- uptake were assessed by
23

Chapter 2
calculating Spearman rank coefficients. All statistical analyses were performed using
SPPS 15.0 with a minimum significance level of p < 0.05.
2.4 Results
2.4.1 Foliar N uptake
The foliar uptake of 15NH4+ ranged from 0.70 µg g-1 DM for pine to 3.76 µg g-1 DM for
birch, while the uptake of 15NO3- varied between 0.11 µg g-1 for pine and 0.86 µg g-1 DM
for birch. This uptake was significantly higher than zero in most cases (Table 2.1).
Table 2.1 Mean 15N-NH4+ and 15N-NO3
- uptake (µg g-1 DM) by the leaves of four tree species in three leaf phenological stages after applying artificial rainwater with low (1:2) or high (3:2) NO3
- to NH4+ ratio. Bold values indicate that N uptake is significantly
different from zero (p < 0.05)
Tree species Leaf phenology Low NO3- to NH4
+ ratio High NO3- to NH4
+ ratio 15N-NH4
+ 15N-NO3- 15N-NH4
+ 15N-NO3-
Silver birch Developing 2.78a 0.17b 6.88a 1.40b Fully developed 2.33a 0.40b 1.96a 0.59b Senescence 4.47a 0.71b 2.66a 1.90a European beech Developing 1.33a 0.00b 0.59a 0.62a Fully developed 2.87a 0.70b 1.76a 0.34b Senescence 2.68a 0.30b 2.50a 0.54b Pedunculate oak Developing 0.57a -0.37b 2.55a -0.06b Fully developed 3.14a 0.69b 2.00a 0.54b Senescence 3.21a 0.68b 2.22a 0.82b Scots pine Developing† 0.46a -0.13b 0.44a -0.02b Fully developed 0.59a 0.29a 0.21a 0.12a Senescence 1.78a 0.21b 0.70a 0.31b Negative values indicate higher 15N values in control samples than in treated samples. Different small letters within a row indicate significant (p < 0.05) differences between NH4
+ and NO3- uptake for a specific
tree species, phenological stage and NO3- to NH4
+ ratio. † Only last year’s needles
Generally, the uptake of 15NH4+ was significantly higher than the uptake of 15NO3
-, except
for the fully developed needles of pine under both the low and high NO3- to NH4
+ ratio
and senescent birch and developing beech leaves under low NO3- to NH4
+ ratio. On
average, the uptake of NH4+ was approximately seven and three times higher than the
24

Foliar N uptake from wet deposition
uptake of NO3- in the low (2:1) and high (2:3) NO3
- to NH4+ ratios, respectively, but
varied with tree species and phenological stage.
According to the univariate analysis, both the 15NH4+ and 15NO3
- uptake were
significantly influenced, in decreasing order of importance, by tree species, leaf
phenology and NO3- to NH4
+ ratio and by the two-factor interactions of these three factors
(Table 2.2). Under both the low and high NO3- to NH4
+ ratio, the tree species effect on 15NH4
+ uptake was pronounced by a higher uptake for deciduous species vs pine (Table
2.1). For 15NO3-, the uptake was significantly larger for birch and beech than for oak and
pine. In general, 15NH4+ uptake was significantly higher for senescent leaves than for
developing and fully developed leaves (p < 0.0001), but this effect was species
dependent. For example, in the leaf developing stage birch showed the highest uptake
rates while beech, oak and pine showed the lowest uptake rates. Nitrate uptake of all
species was significantly lower for developing leaves compared to fully developed and
senescent leaves. The effect of NO3- to NH4
+ ratio is largely manifested on senescent
leaves which showed a lower 15NH4+ uptake and a higher 15NO3
- uptake under the high
NO3- to NH4
+ ratio. However, the ratio of 15NH4+ to 15NO3
- uptake was 7.4 in the low
NO3- to NH4
+ ratio treatment and only 3.4 in the high NO3- to NH4
+ ratio treatment.
Table 2.2 Degrees of freedom (df) and F and p values of a three-way ANOVA: effect of tree species, leaf phenology and NO3
- to NH4+ ratio on the observed foliar 15N uptake of
NH4+ and NO3
-. Bold values are significant at p < 0.05
Source of variation 15NH4+ uptake 15NO3
- uptake
df F p df F p Tree species 3 71.68 < 0.001 3 32.07 < 0.001 Leaf phenology 2 17.94 < 0.001 2 47.63 <0.001 NO3
- to NH4+ ratio 1 4.34 0.040 1 27.07 < 0.001
Tree species * leaf phenology 6 9.05 < 0.001 6 12.53 < 0.001 Tree species * NO3
- to NH4+ ratio 3 3.23 0.027 3 7.61 <0.001
Leaf phenology * NO3- to NH4
+ ratio 2 16.21 < 0.001 2 17.91 < 0.001
Univariate ANOVA for pine reveals a significant effect of needle age on the observed 15NO3
- uptake (p = 0.029). The higher 15NO3- uptake by current year needles compared to
last year needles was only visible during summer (Fig. 2.1). For the developing stage,
however, no comparison could be made. Ammonium uptake was not found to be affected
by needle age, which was probably due to the relatively large standard deviation of the 15NH4
+ uptake. The effect of leaf phenology and the NO3- to NH4
+ ratio was significant
25

Chapter 2
for both the 15NH4+ and NO3
- uptake of current and last year needles and similar to the
effects described in the univariate analysis for all species.
Developing Fully developed SenescingDeveloping Fully developed SenescingDeveloping Fully developed Senescing
-1
0
1
2
315
N u
ptak
e (µ
g g-1
DM
)15NH4
+ - current year needles15NH4
+ - last year needles15NO3- - current year needles15NO3- - last year needles
Fig. 2.1 15N uptake (µg g-1 DM) (± standard deviation) by current and last year needles of Scots pine per phenological stage
2.4.2 Leaf characteristics
The foliar N content of the deciduous tree species decreased from spring (3.91 %) to
autumn (2.62 %), whereas for current year and last year needles of pine foliar N increased
slightly from 1.36 to 1.58 % (Fig. 2.2).
The contact angle (CA) of droplets (Table 2.3) on the abaxial side of leaves was
significantly lower for birch than for the other species, while the highest CA was
observed for oak, although differences were not significant for all species. At the adaxial
side, birch also showed the lowest CA, but differences between species were less
significant. Pine showed the highest adaxial CA in the stages with fully developed and
senescent leaves. At the abaxial side, CA of oak and pine was lower at the developing
stage than at the later stages. The same pattern was observed at the adaxial side for pine,
but for birch and oak, a lower CA and thus higher wettability can be seen towards the end
of the growing season (at senescence) and, for beech, at the stage of fully developed
leaves.
26

Foliar N uptake from wet deposition
April May June July Aug Sept Oct
0
1
2
3
4
5
leaf
/nee
dle
N c
onte
nt (%
)
0
100
200
300
400
500
soil
N (m
g N
kg-1
) con
tent
of c
ontro
l pot
s
BirchBeechOakPineN-NH4
+
N-NO3-
Fig. 2.2 Total N content (%) of birch, beech and oak leaves and pine needles in the different phenological stages and KCl-extractable soil NH4
+ and NO3- content (mg N kg-1
dry soil) in the control pots through the growing season of 2008
Table 2.3 Contact angle (CA; °) of water droplets on the adaxial and abaxial leaf side and water storage capacity (WSC; g m-2) of fully wetted leaves and leaves after dripping per phenological stage and tree species
Leaf phenology Tree species CA adaxial side
CA abaxial side
WSC fully wetted
WSC after dripping
Developing Silver birch 54.8aB 44.8a 162.5bB 86.2B European beech 73.7bB 75.7b 156.6b 88.7 Pedunculate oak 74.8bB 94.7cA 180.7b 76.4 Scots pine† 104.2aA 68.4 Fully developed Silver birch 52.7aB 49.7a 117.5A 58.8aA European beech 55.0aA 73.7b 157.7 82.3b Pedunculate oak 77.1bB 120.8dB 168.7 79.4ab Scots pine 88.6c 84.4c 158.1B 74.2ab Senescence Silver birch 38.0aA 46.0a 125.3aA 68.0aAB European beech 69.4bB 75.6b 165.3ab 88.8ab Pedunculate oak 60.6bA 106.8dA 227.0b 120.4b Scots pine 84.2c 85.0c 136.9aAB 59.4a Small letters within a column indicate significant (p < 0.05) differences between tree species in a specific phenological stage, capitals indicate significant (p < 0.05) differences between phenological stages for a specific tree species. † Only last year’s needles
27

Chapter 2
Birch and beech show a smooth leaf surface structure, both on the adaxial and on the
abaxial side, with no outgrowing hairs or trichomes visible (Fig. 2.3). In contrast, oak
leaves have distinct crystalline epicuticular wax structures on the abaxial side, which also
cover the stomatal guard cells and trichomes. On the adaxial side, the same crystalline
wax structures are visible, but less abundant. Pines have a sinuate needle surface structure
orientated perpendicular to the length axis of the needles, along which the stomata are
situated. Pine stomata are raised above the surface, which is covered with a wax layer that
has some crystalline structures.
The water storage capacity (WSC) of fully wetted leaves and WSC after dripping differed
significantly between tree species, but the ranking depends on the phenological stage
(Table 2.3). Nonetheless, at each phenological stage, we observed the lowest WSC values
for pine or birch and the highest for beech or oak. WSC for fully wetted leaves and WSC
after dripping were significantly correlated (correlation coefficient = 0.72), with the
highest difference between both values for oak.
Relating the CA data of the adaxial leaf side to the N uptake rates found in this
experiment yielded a correlation coefficient of -0.70 for 15NH4+ (p = 0.019) and -0.73 for
15NO3- (p = 0.011) (Fig. 2.4). Next to this, 15NH4
+ uptake was positively correlated to the
foliar N content (p < 0.0001; r = 0.391). However, on a species basis, we found a negative
relationship between 15NH4+ uptake and foliar N content for beech (p < 0.001; r = -0.72)
and oak (p = 0.048; r = -0.407) and no significant relationship (p > 0. 05; r < 0.418) for
birch and pine. The CA of the abaxial leaf side and WCS after dripping were not
significantly correlated with 15NH4+ or 15NO3
- uptake (p > 0.05; r < 0.57).
Plant available inorganic N in the control pots decreased through the growing season (Fig.
2.2). The NH4+ availability, in particular, decreased from April (456 mg N kg-1 soil)
towards October, to the same level as the NO3- availability (± 120 mg N kg-1 soil).
28

Foliar N uptake from wet deposition
Fig. 2.3 Scanning electron microscope images taken from the (a) abaxial and (b-c) adaxial leaf side of respectively (1) birch (x 1200; x 4780), (2) beech (x 2620; x 2720; x 10900), (3) oak (x 2500; x 1010; x 9600) and (4) pine (x 2500; x 625; x 8400)
29
Chapter 2
0 20 40 60 80 100
Contact angle (°) adaxial side
0
1
2
3
4
515
NH
4+ upt
ake
(µg
g-1 D
M)
0 20 40 60 80 1
Contact angle (°) adaxial side
00-0.4
0
0.4
0.8
1.2
1.6
15N
O3- u
ptak
e (µ
g g-1
DM
)
BirchBeechOakPine
Fig. 2.4 Relationship between the leaf contact angles (°) measured at the adaxial leaf side and the 15NH4
+ (p = 0.019; r = -0.70) and 15NO3- uptake (p = 0.011; r = -0.73; n=11) (µg
g-1 DM)
2.5 Discussion
2.5.1 Effect of N form
In our study, NH4+ was more readily taken up than NO3
-, even when the NO3-
concentration in the solution was higher than that of NH4+. One reason may be that the
transport of NO3- and NH4
+ primarily occurs through cuticular diffusion (Peuke et al.
1998). Cations are transported much more readily through cuticles than anions because of
the presence of hydrophilic pores within the cuticle. These small pores are lined with
fixed negative charges (presumably mainly from polygalacturonic acids), with increasing
density from the outside of the cuticle to the inside. Accordingly, permeation of cations
along this gradient is enhanced whereas anions are repulsed from this region (Tyree et al.
1990). There is also evidence of a stomatal pathway for the uptake of polar and ionic
solutes, which is located at the surface of the stomatal pores and is not affected at all by
the charge of the N compound entering (Eichert and Goldbach 2008). However, the
importance of this stomatal pathway is low in comparison with the cuticular uptake
pathway.
The preferential N uptake of NH4+ compared to NO3
- is consistent with previous studies
for both deciduous (Garten and Hanson 1990; Brumme et al. 1992) and coniferous trees
30

Foliar N uptake from wet deposition
(Bowden et al. 1989; Eilers et al. 1992; Lumme 1994; Boyce et al. 1996; Lumme and
Smolander 1996; Wilson and Tiley 1998). The ratio of 15NH4+ uptake to 15NO3
- uptake
varied from 7.9 for pine under the low NO3- to NH4
+ ratio treatment to 3.0 for oak under
the high NO3- to NH4
+ ratio treatment, which is concordant with most of these literature
data (Bowden et al. 1989; Garten and Hanson 1990; Eilers et al. 1992; Boyce et al. 1996;
Lumme and Smolander 1996; Wilson and Tiley 1998), but not with all (Garten and
Hanson 1990; Brumme et al. 1992; Dail et al. 2009). All these studies applied a NO3- to
NH4+ ratio of one.
Significant uptake of both NH4+ and NO3
- occurs through leaves when rainwater is
passing the canopy, and this uptake should be accounted for when calculating canopy
uptake from throughfall measurements. It is also clear from this experiment that the
proposed efficiency factor by de Vries et al. (2001) of NH4+ vs NO3
- uptake with a value
of 6 is not applicable for all tree species and throughout the year. In addition, it is
necessary to account for retention by branches and boles as well (Dail et al. 2009) and for
dry deposition processes to determine the value of this efficiency factor.
2.5.2 Tree species effect
Next to the analogous studies of Brumme et al. (1992) and Eilers et al. (1992) with
European beech and Norway spruce, respectively, to our knowledge the present report is
the only experimental comparison of foliar 15N uptake by deciduous and coniferous
species under similar conditions. We found that the mean NH4+ uptake rates of silver
birch, European beech and oak were respectively six, three and four times higher than for
pine. For NO3- uptake, this ratio was respectively six, three and three. Brumme et al.
(1992) found that NH4+ uptake by beech leaves was 1.8 times higher than spruce needles,
and NO3- uptake 2.7 times. In that experiment, however, the applied N concentration was
much higher than ambient levels, which could explain the different result.
Several explanations can be put forward for the observed tree species effect on N uptake.
Firstly, the tree species showed significant differences in wettability, which relates to N
uptake (see 2.5.5), with higher wettability for birch and lower for pine. Secondly,
although of less importance, broadleaf trees are found to differ in internal resistance for
NO3- compared to conifers (Ammann et al. 1999). Thirdly, the N demand of coniferous
tree species is thought to be relatively low, owing to lengthy needle retention, efficient
internal N recycling and the ability of these species to produce large amounts of
31

Chapter 2
aboveground biomass per unit N assimilated (Dail et al. 2009). The latter is supported by
the N content in the pine needles (1.4 %), which is less than half of that in the leaves of
the three deciduous species (3.2 %) (Fig. 2.2). Fourthly, the cuticular pore density (see
2.5.1) is higher in cell walls between guard cells of stomata and subsidiary cells (Maier-
Maercker 1983). Positive relationships between the number or distribution of stomata and
the intensity of mineral nutrient uptake from foliar sprays have been observed (Levy and
Horesh 1984).
Despite this large difference in uptake rates, it is likely that the annual foliar N uptake of
pine will be higher than for the deciduous species, considering the presence of needles
throughout the year compared to only six months for deciduous species. Extrapolating the
average results of the low NO3- to NH4
+ ratio treatment from one branch to mature stands
with a LAI of 1.4 for silver birch (Wuyts et al. 2008a), 5.5 for beech (Mussche et al.
2001), 2.4 for oak and 2.9 for pine (Sampson et al. 2006) results in an annual foliar
uptake of 0.08, 0.43, 0.24 and 2.23 kg N ha-1, respectively, from wet deposition under
ambient levels. Leaf surface area of the treated branches, was calculated from their leaf
biomass and the specific leaf area of the control branches, which was respectively 203,
302, 239 and 369 cm² g-1 DM for birch, beech, oak and pine. Considering a wet N
deposition of 10 kg-1 N ha-1 yr-1 (N level as in the low NO3- to NH4
+ ratio and a mean
annual precipitation of 791 mm), the fraction of N taken up by foliage from wet
deposition would equal 0.8 % for birch, 4.3 % for beech, 2.4 % for pedunculate oak and
22.3 % for pine. These annual uptake values suggest that the contribution of foliar uptake
from wet deposition by deciduous species is of minor importance in the total canopy N
uptake of 4-5 kg N ha-1 yr-1 calculated from throughfall measurements (Thimonier et al.
2005; Staelens et al. 2008). However, on a canopy level, it is also important to consider
the role of woody plant surfaces (see 2.5.1), since these have been shown to contribute
significantly to the total water storage capacity (Herwitz 1985; André et al. 2008), and the
effect of varying rain intensity (Hansen et al. 1994).
2.5.3 Effect of leaf phenology
Generally, the highest uptake rates were observed for fully developed and senescent
leaves. This is in line with observations from throughfall studies for both coniferous
(Houle et al. 1999) and deciduous stands (Neary and Gizyn 1994; Houle et al. 1999). One
reason that N uptake occurs at leaf senescence, is that it is probably linked to N
32

Foliar N uptake from wet deposition
retranslocation by trees (Houle et al. 1999; Hagen-Thorn et al. 2006). Species with early
leaf fall seem to resorb nutrients at a higher rate, thereby exhibiting a trade-off between
early leaf fall and efficient nutrient resorption (Niinemets and Tamm 2005). This also
held true in the present study, where the N content of birch decreased by 17 % from fully
developed leaves towards senescent leaves, whereas for beech and oak this was 16 and 13
% respectively.
However, there are some arguments that indicate that plant N status may not be the only
driving factor for foliar N uptake. Firstly, for both the current and last year needles of
pine a higher 15NH4+ uptake was observed in the senescence stage, which was not coupled
with a decrease in needle N content. Current year needles are fully developed at the end
of the growing season, and, as indicated by studies on other evergreen species, will serve
as main N storage site during winter (Millard and Proe 1993), which can explain their
higher uptake. For last year needles no clear mechanism can be put forward. Secondly,
beech and oak showed an increased 15NH4+ uptake with decreasing N content, with the
lowest uptake rates occurring during leaf emergence, whereas birch and pine did not show
this pattern. The difference during leaf emergence could be due to the higher
photosynthetic capacity of the sunlit leaves/needles of birch and pine compared to the
shadow leaves of beech and oak (Hikosaka 2005). It is also possible that the higher N
availability in the pots during leaf emergence had an influence the foliar N uptake,
although it has been shown that leaf growth in spring is largely determined by the N
stored in plant tissue during the previous year (Millard and Thompson 1989). So,
although plant N status can partly explain the differences between the different
phenological stadia, there is an interaction with leaf wettability and species-specific
photosynthetic capacity.
2.5.4 Effect of NO3- to NH4
+ ratio
In the present study, no distinct effect of the applied NO3- to NH4
+ ratio was found, except
for senescent leaves, in contrast to previous reports for European beech (Brumme et al.
1992), sacred fir (Abies religiosa) (Chávez-Aguilar et al. 2006) and Norway spruce
(Eilers et al. 1992; Lumme and Smolander 1996). In the experiments of Eilers et al.
(1992) and Brumme et al. (1992), however, the low and high dose differed by a factor of
seven, compared to the factor of three used in this experiment. In the other studies
33

Chapter 2
mentioned, NO3- and NH4
+ were applied separately, thereby not accounting for
preferential uptake.
The absence of a clear effect of the applied NO3- concentration on the measured 15N
uptake, and consequently of the NO3- to NH4
+ ratio, indicates that the affinity of leaves
and needles for NH4+ is much higher than for NO3
- (see 2.5.1), and that the ratios of NO3-
to NH4+ used in this experiment are not sufficient to counter this balance. This implies
that the potentially increasing future NOx emissions in industrialized regions (Carslaw et
al. 2007) with simultaneously decreasing NH3 emissions (Monks et al. 2009) will result in
higher N deposition fluxes to the forest floor. So, although total N emissions may
decrease in the near future, ecosystems will still be subject to N saturation and enhanced
soil acidification and consequent changes in vitality and biodiversity.
2.5.5 Leaf surface characteristics and N uptake
Leaf wettability is species-dependent, since the physicochemical characteristics of the
epicuticular wax deposit and epidermal cell morphology differ between species
(Holloway 1969; Hall and Burke 1974; Haines et al. 1985). Therefore, the SEM images
(Fig. 2.3) partly explain the observed differences in wettability through visible differences
in surface structure: the smooth surface of birch and beech causes water droplets to
spread, while the crystalline epicuticular wax structures for oak and pine retain droplets as
a sphere. Although the WSC of leaves is also generally indicative of wettability, we found
no relationship between the CA and laboratory estimates of WSC after dripping, which is
in contrast to the negative relationship observed by Haines et al. (1985). We hypothesize
that this lack of relationship can be attributed to the use of other tree species in this study
and the difference in leaf orientation of the deciduous species. Birch leaves have a lower
WSC than oak leaves because they tend to hang down vertically compared to the
horizontally orientated oak leaves, which causes water to drip off faster. The vertical
orientation of pine needles causes WSC to be low. With regard to the foliar N uptake,
adaxial leaf wettability appears to be a more determinant factor than WSC. This could be
explained by the fact that permeability through cuticular pores increases with leaf surface
humidity. Therefore, a higher leaf surface covered by water, as in the case of low CAs,
causes a higher permeability for inorganic ions (Schreiber et al. 2001). The WSC is a
static parameter, measuring only the water amount that remains on the leaf surface after a
rain event, while during this event more water makes contact with a leaf but then drips
34

Foliar N uptake from wet deposition
35
off. This suggests that the process of leaf N uptake occurs very fast, since the WSC, and
as such the contact time, is less for birch than for oak leaves though N uptake is higher for
birch than for oak.
To our knowledge, this is the first study relating foliar uptake of N originating from wet
deposition to leaf surface properties. Our finding is concordant with the work of Sase et
al. (2008) indicating a positive correlation between the net fluxes of NH4+ and NO3
- from
throughfall water and the leaf CA for Japanese cedar through the growing season. In their
case, however, N uptake may have occurred through wet and dry deposition. It should be
mentioned that possibly a similar pattern exists for dissolved N uptake by branches,
which remains to be investigated. Also, within one species, leaf wettability can vary
according to canopy height (Boyce et al. 1991) and stand characteristics (Hall et al. 1965)
as an adaption to different microclimatic conditions such as light availability and relative
humidity, and to the degree of leaf surface contamination (Barthlott and Neinhuis 1997).
Since in this study the relationship between N uptake and wettability was only observed
for saplings growing in the same climatic conditions, it is important to further assess this
relationship within one species under varying conditions.
2.6 Conclusion
This study demonstrates that N assimilation of wet deposited NH4+ and NO3
- occurs
through foliage of deciduous and coniferous trees and that it is significantly influenced by
N form, tree species, leaf phenology and NO3- to NH4
+ ratio. Uptake of NH4+ and NO3
- is
strongly related to leaf wettability, and not to water storage capacity, a relationship which
enables the indirect estimation of N uptake from this easy to measure parameter.
However, there is still not much known about within-species dependence of N uptake on
leaf wettability. In this study, the N uptake was small, so, it should be further examined to
what extent N uptake from wet deposition contributes to total canopy N uptake.
Furthermore, more research is needed to understand how this N uptake is related to
throughfall deposition as easy and inexpensive technique for assessing total deposition
fluxes.

3 Canopy retention of 15NH3 by four temperate tree species and the interaction with leaf properties
After: Adriaenssens S, Staelens J, Wuyts K, Van Wittenberghe S, Wuytack T, Verheyen K, Boeckx P, Samson R. Canopy uptake of 15NH3 by four temperate tree species and the interaction with leaf properties. Submitted to Water, Air and Soil Pollution
3.1 Abstract
Tree canopies are believed to act as a sink of atmospheric ammonia (NH3). However, few
studies have compared the retention efficiency of different tree species. This study
assessed the retention of 15N-labelled NH3 at 5, 20, 50 and 100 ppbv by leaves and twigs
of potted silver birch, European beech, pedunculate oak and Scots pine saplings in June,
August and September 2008. Additionally, foliar retention of 13C-labelled carbon dioxide
(13CO2) and leaf stomatal characteristics were determined per species and treatment date
and the relationship with 15NH3 retention was assessed. Both 15NH3 and 13CO2 retention
were affected by tree species and treatment date, but only 15NH3 retention was influenced
by the applied NH3 concentration. Depending on the treatment date, optimal 15NH3
retention by leaves and twigs was at 5 (September), 20 (June) or 50 (August) ppb. Birch,
beech and oak leaves showed the highest retention in August, while for pine needles this
was in June, and except at 5 ppb in June the 15NH3 retention was always higher for the
deciduous species than for pine. For all species except beech 13CO2 retention was highest
in August and on every treatment date the 13CO2 retention by leaves of deciduous species
was significantly higher than by pine needles. Leaf characteristics and 13CO2 retention did
not provide a strong explanation for the observed differences in 15NH3 retention. This
study shows that on the short term a high interspecific variability exists in NH3 retention,
which depends on the time in the growing season.
37

Chapter 3
3.2 Introduction
At the global scale, ammonia (NH3) is considered to be the most important nitrogen (N)
component in the atmosphere deposited to terrestrial vegetation (Krupa 2003). It
originates mainly from intensive agriculture and to a lesser extent from biomass burning
(Fangmeier et al. 1994). Since NH3 is either deposited to surfaces or converted into
ammonium (NH4+), high concentrations and consequently high deposition rates of NH3
are only found close to emission sources (Ferm 1998; Krupa 2003). Particularly forest
ecosystems are exposed to high dry deposition levels of NH3, related to their surface
roughness, leaf area index and physiological leaf characteristics (Erisman and Draaijers
2003). In contrast to fertilized agricultural ecosystems which are known to emit NH3
(Sutton et al. 1995), historically N-limited forests are considered to act as a net sink of
NH3 (Duyzer et al. 1992) although there is also evidence of net emission under high N
deposition levels (Neirynck and Ceulemans 2008).
This anthropogenic NH3 input can have several adverse acute effects on plant functioning
when the rate of foliar uptake of NH3 is greater than the rate and capacity for in vivo
detoxification by the plants (see Krupa (2003) for an overview). Dry deposited NH3 that
is not taken up by foliage, contributes as NH4+ to throughfall deposition to the forest floor
(Lindberg et al. 1986). This increased NHx input, as N input in general, can significantly
affect forest functioning, with both adverse and beneficial consequences (see Chapter 1).
The deposition and uptake of atmospheric NH3 to vegetation is controlled by stomatal
characteristics, but also by non-stomatal characteristics such as those of the leaf cuticle
(Bruckner et al. 1993; Sutton et al. 1998; Wyers and Erisman 1998; Gessler et al. 2002).
Stomatal NH3 uptake is determined by stomatal conductance, which is considered to be
an active process, and the concentration gradient between the atmosphere and the
substomatal cavities where NH3 is dissolved in the water film of the mesophyll cells,
which is a passive diffusion process (Farquhar et al. 1980; Van Hove et al. 1987). No
internal mesophyll resistance to NH3 uptake has been detected (Van Hove et al. 1987).
Stomatal opening depends on microclimatic parameters such as temperature and
photosynthetic photon flux rate (Gessler et al. 2000), internal CO2 concentration
(Farquhar et al. 1980) and plant water status. The concentration gradient determining the
direction of the NH3 flux depends on the atmospheric NH3 concentration and on the ratio
between the apoplastic NH4+ concentration and pH (Asman et al. 1998). As the apoplastic
38

Canopy retention of 15NH3
NH4+ concentration is very sensitive to leaf N status and external N supply, plants
receiving high N inputs may emit NH3 while those receiving low N inputs take up NH3 at
the same ambient concentrations (Husted and Schjoerring 1996). Deposition to the cuticle
is a passive process, occurring either to thin cuticular water films formed by hygroscopic
dry deposited particles at relative humidity (RH) values as low as 50 % (Burkhardt and
Eiden 1994; Van Hove and Adema 1996), or directly onto dry plant surfaces, adsorbed to
surface waxes (Jones et al. 2007). Dissolved NH4+ can then be assimilated via cuticular
diffusion (Peuke et al. 1998) or can be re-emitted. Cuticular deposition velocity has been
found to be affected by RH (Wyers and Erisman 1998; Gessler et al. 2000), leaf wetness
(Neirynck et al. 2005), atmospheric NH3 concentration (Jones et al. 2007), leaf surface
chemistry (Burkhardt 2010), temperature (Neirynck et al. 2005) and atmospheric acid
concentration (Neirynck et al. 2011). Variation in foliar retention capacity, i.e. cuticular
adsorption and stomatal uptake, between species is observed (Morikawa et al. 1998; Jones
et al. 2007) and can be explained to some extent by variation in stomatal dynamics and
surface waxes (Vallano and Sparks 2007). Next to tree species, leaf development stage
has a clear influence on NH3 exchange between plants and the atmosphere. Peaks in NH3
emission have been observed due to a higher apoplast pH (Hill et al. 2002) and NH4+
concentration (Wang et al. 2011), which are related to N mobilization during leaf
establishment (Millard and Proe 1993) and N remobilization during leaf senescence
(Schjoerring et al. 1998). It is likely that tree species with different leaf structure and
longevity, e.g., deciduous vs coniferous trees, exhibit different NH3 patterns throughout
the year.
Therefore, the first aim of this study was to assess canopy retention, i.e. adsorption to the
canopy surface and uptake, of NH3 by four different tree species under increasing NH3 air
concentration levels and to examine how this varies over the growing season. For this
purpose, retention of 15N-labelled NH3 was measured, which is an accurate and
convincing method that correlates well to flux chamber experiments (Jones et al. 2008).
The second aim was to relate on the one hand photosynthetic activity through 13CO2
retention and on the other hand stomatal characteristics and theoretical maximal
conductance to the observed 15NH3 retention.
39

Chapter 3
3.3 Materials and methods
3.3.1 Plant material and experimental site
A full description of the plant material and experimental site is given in Section 2.3.1.
3.3.2 Experimental setup and sample analysis
3.3.2.1 15NH3 and 13CO2 application
Two twigs with a length of approximately 30 cm each were selected per tree and sealed
with an air-tight polyethylene bag of 15 L, which was then filled completely with ambient
air. Next, a mixture of 15N-labelled NH3 (99 atom %), 13C-labelled CO2 (99 atom %) and
unlabelled CO2 were injected in the plastic bag with a syringe. In total 12 ml of CO2 (13.3
atom %) was added to keep photosynthetic activity possible during the experiment. The 13C-labelled CO2 allowed determining the photosynthetic level. The volume of added CO2
was determined after a preliminary test on other twigs where the decrease in CO2
concentrations in the 15-L bag during one hour was measured. Four different
concentrations of NH3 were used, representing 1, 4, 10 and 20 times the average (2002-
2006) ambient NH3 concentration in Ghent, which is 5.1 ppbv and ranges from 1.9 to 9.8
ppbv NH3-N (VMM 2009). The first and second level (5 and 20 ppbv NH3-N) were
applied on the same tree, and the third and fourth level (50 and 100 ppbv NH3-N) on
another tree. Four replicated trees were used per NH3 level. The plastic bags were
removed 1 h after the gas mixture addition, and branches were cut off 2 h after the start of
the experiment. Just before the removal of the plastic bags, a gas sample was taken and
air temperature and RH were recorded with a portable digital temperature/RH meter
(DM509, Eijkelkamp Agrisearch Equipment, Giesbeek, the Netherlands). The experiment
took place on sunny days between 11 am and 3 pm to ensure optimal conditions for
photosynthesis. However, during the 2-h experiment the trees were put in the shadow to
prevent condensation due to excessive transpiration. The air inside the bags was mixed
regularly by means of a syringe. The experiment was conducted three times, i.e., in June,
August and September 2008, to assess the effect of leaf development stage on N
retention. During the experiment, air temperature inside the bags increased on average
with 0.1°C (± 0.6 °C standard deviation) and RH with 17.3 % (±6 % standard deviation)
in comparison with the temperature outside the bags, with no differences between species
and NH3 concentration levels. Before each experiment, a representative twig of each tree
40

Canopy retention of 15NH3
was sampled to measure natural abundance of 15N and 13C (Harrison et al. 2000) and the
total surface area exposed to 15NH3. Total one-sided leaf area of the deciduous species
was measured with a LI-3000 Portable Area Meter (LICOR, Lincoln, Nebraska). Needle
surface area was estimated assuming a half cylindrical shape and based on the number of
needles per branch and the mean needle length and diameter of ten randomly selected
needles. Twig surface area was estimated assuming a cylindrical shape and based on the
mean twig diameter and length. Mean leaf/needle and twig surface area per tree species
and treatment date are presented in Table 3.1, as for the air temperature and RH.
Table 3.1 Mean air temperature (°C), relative humidity (RH, %) and leaf and twig area (cm2) exposed to 15NH3 per tree species at the different treatment dates in 2008. Standard deviation is given in brackets.
June August September Air temperature 24.4 (1.8) 21.7 (1.0) 18.2 (1.0) RH air 50.3 (5.1) 58.4 (4.2) 56.7 (3.7) Leaf area exposed to 15NH3 Birch 261 (77) 252 (97) 213 (108) Beech 608 (184) 423 (133) 420 (115) Oak 973 (244) 401 (152) 441 (200) Pine 1574 (309) 1723 (608) 2113 (694) Twig area exposed to 15NH3 Birch 63 (7) 64 (7) 67 (9) Beech 99 (8) 103 (7) 106 57) Oak 53 (7) 55 (9) 68 (25) Pine 49 (15) 50 (29) 68 (32)
3.3.2.2 Analysis of plant material and gas samples
After harvesting, leaves and needles were separated from branches, and needles were
separated into current-year and last-year age classes. All plant material was dried in paper
bags for 48 h at 50°C, weighed and ground to a fine powder (< 250 µm) using a
centrifugal mill (Retsch ZM1, Germany). The samples were analysed in duplicate for
total N, total C, 15N and 13C using an Elemental Analyzer (EA) connected to an Isotope
Ratio Mass Spectrometer (IRMS) (20-20, SerCon, UK). The standard deviation (n = 10)
of internal standards measured by this EA-IRMS system is 0.2‰ for δ15N and 0.3‰ for
δ13C. Carry-over effects were avoided by measuring one or two blanks in between natural
abundance samples or enriched samples, respectively. The laboratory annually
participates successfully in joint proficiency ring tests of WEPAL-IAEA on total N, C,
41

Chapter 3
15N and 13C analysis of plant material. The CO2 concentration of the gas samples was
analysed by means of a gas chromatograph (Shimadzu GC-14B, Germany) equipped with
an Electron Capture Detector.
3.3.2.3 Measurement of stomatal characteristics
Stomatal imprints were collected at the abaxial leaf side to determine stomatal density
(SD), i.e. the number of stomata per mm2 leaf area, and stomatal pore surface (SPS, μm2),
i.e. the surface area of a widely opened stomatal pore. Colourless nail varnish was applied
over an area of 6 cm2 next to the main vein of the leaves and over a length of 3 cm in the
middle of the needles. Next, the nail varnish was peeled off the surface with a transparent
adhesive tape, which was then fixed on a microscope slide. The imprints were analysed
with a light microscope (Olympus BX51, UK) connected with a camera (Soft Imaging
System’s Colorview III) at a magnification of 40 x 10 for SD and 100 x 10 for SPS
(Balasooriya et al. 2009). The SPS (μm2) was calculated by measuring length (L, µm) and
width (W, µm) of widely opened stomata, and by assuming an elliptical shape.
3.3.3 Data analysis
Retention of 15N and 13C per unit dry plant material (µg N or C g-1 DM) was calculated,
similar to Chapter 2, by accounting for the natural abundance of 15N and 13C in untreated
branches (Harrison et al. 2000):
% - %. .10³% - %
treated untreated
gas untreated
at atY Xat at
= (3.1)
with Y being the 15N or 13C retention (µg g-1 DM) and X the total N or C concentration
(mg g-1 DM) in the treated samples.
The theoretical maximal stomatal resistance Rs (s m-1) was calculated as (Balasooriya et
al. 2009):
44s
l L WRSD LWD SDLWDπ
+= + (3.2)
with l the depth of the stomatal pore (m), SD the stomatal density (m-2), and D the
diffusion coefficient of water vapour in the air (0.242 × 10⁻⁴ m2
s-1 at 20°C). The depth of
the stomatal pore was assumed to be 10 µm (Balasooriya et al. 2009). Rs was then
42

Canopy retention of 15NH3
inverted to a maximal stomatal conductance (gsmax, m s-1), and converted to mol H2O m-2
s-1 (Pearcy et al. 1989).
The effect of tree species, treatment date and applied NH3 concentration on 15NH3 and 13CO2 retention by leaves and twigs was tested by means of a three-way factor analysis. A
Generalized Least Squares Model was used to account for heteroscedasticy in 15NH3
retention across the different treatment dates and concentrations levels. Due to a three-
way interaction effect between species, treatment dates and applied NH3 concentration for 15NH3 retention, the analysis was conducted for each species separately. For Scots pine
the effect of needle age was included. To test for differences in SPS, SD, gsmax, N and C
content across species and treatment dates, a two-way factor analysis was performed.
Means of SPS, SD, gsmax and 13CO2 retention were separated by Tukey’s Honestly
Significant Difference test and p values were calculated for each factor. Correlations
between SPS, SD, gsmax, N content, 13CO2 retention and 15NH3 by leaves and twigs were
assessed by Pearson or Spearman rank correlation coefficients, depending on whether the
variables were normally distributed. All statistical tests were performed in R 2.10.1 (R
Development Core Team 2011).
3.4 Results
3.4.1 15NH3 retention
The 15NH3 retention (µg N g-1 DM) by leaves and twigs of each tree species was
significantly affected by treatment date, the applied initial NH3 concentration level and
their interaction, except for the effect of applied NH3 concentration on the retention by
twigs (Table 3.2). In June, the highest NH3 retention by leaves was found at 20 ppbv NH3,
while in August this was at 50 ppbv (Fig. 3.1a). In September, retention was highest at 5
ppbv for pine and oak and at 20 ppbv for birch. No significant differences between applied
NH3 concentration levels were found for beech leaves in September. Furthermore, for
birch, beech and oak leaves, the retention at 20 and 50 ppbv was highest in August, while
at 5 ppbv the highest retention was observed in September. For pine needles, retention
was generally highest in June. Current year needles generally assimilated more 15NH3
than last year needles of the same branch, however, the difference was not always found
to be significant (Fig. 3.2). Similar to the leaves, 15NH3 retention by twigs was
significantly higher in June at 20 ppbv and in August at 50 ppbv (Fig. 3.1b). However, in
43

Chapter 3
contrast to the leaves, the highest retention was observed in June, while in September
retention approached zero.
0
4
8
12
16 Birch a
0
2
4
65 ppb20 ppb50 ppb100 ppb
b
0
4
8
12
16
15N
H3 r
eten
tion
(µg
N g
-1 D
M)
Beech
0
2
4
6
0
4
8
12
16 Oak
0
2
4
6
June August SeptemberJune August September0
4
8
12
16 Pine
June August SeptemberJune August September0
2
4
6
Fig. 3.1 Average 15NH3 retention (µg N g-1 DM) by leaves/needles (a) and twigs (b) of birch (1), beech (2), oak (3) and pine (4) per treatment date and applied NH3 concentration level. Error bars represent standard error. Negative values indicate a lower 15N atom % in the treated than in the non-treated branches
44

Canopy retention of 15NH3
Table 3.2 Degrees of freedom (df), F and P values for the significance of the effect of applied initial NH3 concentration level, treatment date and their interaction on 15NH3 retention by foliage and twigs of four tree species Bold values are significant at p < 0.05
Tree species
Concentration Treatment date Interaction df F P df F P df F P
Leaves Birch 3 13.73 < 0.001 2 11.62 < 0.001 6 11.87 < 0.001 Beech 3 5.57 0.003 2 12.78 < 0.001 6 3.33 0.010 Oak 3 82.75 < 0.001 2 50.52 < 0.001 6 13.34 < 0.001 Pine 3 31.90 < 0.001 2 35.31 < 0.001 6 54.47 < 0.001 Twigs Birch 3 14.32 < 0.001 2 47.83 < 0.001 6 34.48 < 0.001 Beech 3 12.96 0.001 2 47.95 < 0.001 6 5.76 0.002 Oak 3 1.63 0.315 2 18.68 < 0.001 6 12.99 < 0.001 Pine 3 33.81 < 0.001 2 120.43 < 0.001 6 28.69 < 0.001
June August September
-0.5
0.0
0.5
1.0
1.5
2.0
2.5
15N
H3 u
ptak
e (µ
g N
g-1 D
M)
5 ppb - current year needles5 ppb - last year needles20 ppb - current year needles20 ppb - last year needles50 ppb - current year needles50 ppb - last year needles100 ppb - current year needles100 ppb - last year needles
*
*
*
**
Fig. 3.2 Average 15NH3 retention (µg N g-1 DM) by current and last year needles of pine per treatment date and applied NH3 concentration level. Error bars represent standard error. Significant differences between current and last year needles are indicates by ‘*’. Negative values indicate a lower 15N atom % in the treated than in the non-treated branches.
3.4.2 13CO2 retention and leaf characteristics
The 13CO2 retention (µg C g-1 DS) by leaves was significantly affected by species,
treatment date and the interaction between both (p < 0.001), but not by the applied NH3
concentration (p = 0.121). For all species, 13CO2 retention was significantly lower in June
45

Chapter 3
compared to August and September, and except for beech highest values were found in
August (Fig. 3.3). With respect to tree species, the 13CO2 retention by leaves of deciduous
species was higher than by the pine needles and from June to September 13CO2 retention
by beech leaves became significantly higher than oak and birch. Current year pine needles
took up significantly more 13CO2 than last year needles in all cases (data not shown). No
retention by branches was detected. The observed 13CO2 retention by leaves was
significantly correlated (p < 0.001; Spearman rho = 0.733; n=174) to the decrease in CO2
concentration measured in the plastic bags at the end of the experiment.
Birch Beech Oak Pine0
1000
2000
3000
13C
O2 r
eten
tion
(µg
C g
-1 D
M)
JuneAugustSeptember
Fig. 3.3 Average 13CO2 retention (µg C g-1 DM) by leaves/needles of birch, beech, oak and pine per treatment date. Error bars represent standard error
Leaf N content was significantly affected by tree species, treatment date and their
interaction. For beech and oak N content decreased significantly from June to September,
while for pine needles it was lowest in August and increased slightly in September (Fig.
3.4). Leaf C content remained stable between June and August, but decreased thereafter
for beech, birch and pine. For oak leaves, the C content increased in September.
Stomatal density (SD), pore surface (SPS) and conductance (gsmax) were significantly
influenced by tree species, treatment date and the interaction between both factors (p <
0.001), with a higher variation between species than within one species. Generally, SPS
increased from beech and oak over birch to pine, with a maximum in August for birch
and oak and in September for pine (Table 3.3). In contrast, stomatal density was highest
for beech and oak and lowest for pine and birch.
46

Canopy retention of 15NH3
June August September0
1
2
3
4%
N c
onte
nt
BirchBeechOakPine
June August September0
45
50
55
% C
con
tent
Fig. 3.4 Average N and C content (%) of birch, beech and oak leaves and pine needles at different treatment dates
The correlation coefficient between SPS and stomatal density amounted to -0.72 (p <
0.0001; n = 39), indicating a trade-off between both parameters. The highest gsmax was
observed for pine and the lowest for beech and oak. Maximum gsmax was found in August
for birch, oak and pine, while no differences between treatment dates were found for
beech.
Table 3.3 Average stomatal length, width (µm, n = 32), pore surface (SPS, µm2, n = 32) and density (SD, number of stomata m-2, n = 36-88 depending on the tree species) and theoretical maximal stomatal conductance (gsmax, mol H2O m-2 s-1, n = 32) per species and treatment date. Standard deviation is given in parentheses
Tree species Date Length Width SPS SD gsmax Birch June 18.35 (2.10) 6.63 (0.93) 96.27 (21.42) 198 (50) 1.28 (0.24) August 22.39 (3.57) 8.41 (1.15) 148.65 (33.91) 160 (29) 1.48 (0.27) September 21.87 (4.64) 7.26 (1.49) 128.13 (49.76) 190 (56) 1.53 (0.48) Beech June 9.52 (1.27) 5.06 (0.55) 38.01 (7.69) 383 (55) 1.13 (0.20) August 9.59 (1.01) 5.17 (0.62) 39.19 (7.87) 383 (50) 1.17 (0.21) September 10.27 (1.06) 5.15 (0.5) 41.72 (6.95) 341 (33) 1.09 (0.16) Oak June 9.76 (1.69) 3.39 (0.54) 26.31 (7.97) 451 (116) 0.94 (0.25) August 14.79 (1.63) 4.75 (0.53) 55.49 (10.51) 343 (47) 1.38 (0.23) September 13.41 (1.35) 4.06 (0.64) 43.02 (9.13) 370 (45) 1.19 (0.23) Pine June n.a. n.a. n.a. n.a. n.a. August 22.06 (2.97) 13.62 (2.41) 235.67 (51.09) 155 (24) 2.15 (0.37) September 25.50 (3.01) 15.31 (2.91) 308.74 (75.98) 110 (22) 1.89 (0.38) n.a.: not available
47

Chapter 3
3.4.3 Relationship between 15NH3 retention and leaf characteristics
At 20 ppbv, total 15NH3 retention and retention by leaves was significantly correlated to
the N content of both leaves and twigs (Table 3.4). A significant correlation was also
found between 15NH3 retention of leaves plus twigs and the N content of twigs at 5 ppbv
(Fig. 3.5).
Table 3.4 Spearman correlation coefficient (n = 48) between the 15NH3 retention (µg g-1 DM) by leaves, twigs and leaves plus twigs (total retention) at different NH3 concentration levels on the one hand, and the N content (%) of leaves and twigs, the
13CO2 retention (µg g-1 DM) and the C content (%) of leaves on the other hand. Bold values are significant at p < 0.01, underlined values at p < 0.05
5 ppbv 20 ppbv 50 ppbv 100 ppbv 15NH3 retention leaves N content leaves -0.095 0.335 -0.002 0.026
N content twigs 0.270 0.390 0.043 0.131 13C retention leaves 0.001 0.258 0.411 0.410
15NH3 retention twigs N content leaves 0.349 0.271 -0.032 0.382
N content twigs 0.164 0.324 0.071 0.070 13C retention leaves -0.032 -0.020 0.000 0.000
Total 15NH3 retention N content leaves 0.037 0.414 0.050 0.101 N content twigs 0.297 0.346 0.014 0.046 13C retention leaves -0.17 0.192 0.328 0.389
0 0.5 1 1.5 2 2.5
N content twigs (%)
0
1
2
3
4
5
Tota
l 15N
H3 r
eten
tion
(µg
g-1 D
M) 5 ppb
0 0.5 1 1.5 2 2N content twigs (%)
.5-1
0
1
2
3
4
5BirchBeechOakPine
20 ppb
r = 0.297 r = 0.346
Fig. 3.5 Relationship between total 15NH3 retention by leaves/needles and twigs and the N content of twigs at 5 (a) and 20 ppb (b) NH3
48

Canopy retention of 15NH3
At 50 and 100 ppbv, branch N status did not influence total 15NH3 retention and 15NH3
retention by leaves. However, at these NH3 concentrations a weak but significant
relationship was found between the foliar 15N retention and 13CO2 retention (Fig. 3.6).
Stomatal pore surface, density and conductance showed no significant relationship with 15NH3 retention by leaves (Table 3.5). We also found a significant correlation between 13CO2 retention and the N content of the leaves (p < 0.001; r = 0.352).
0 1000 2000 3000 400013CO2 retention leaves (µg g-1 DM)
0
4
8
12
16
20
15N
H3 r
eten
tion
leav
es (µ
g g-1
DM
) 50 ppb
0 1000 2000 3000 400013CO2 retention leaves (µg g-1 DM)
-0.5
0
0.5
1
1.5
2
20 BirchBeechOakPine
100 ppb
r = 0.411 r = 0.410
Fig. 3.6 Relationship between 15NH3 retention by leaves and the 13CO2 retention at 50 and 100 ppbv NH3
Table 3.5 Pearson correlation coefficients (n = 12) between the 15NH3 retention (µg g-1 DM) by leaves at different NH3 concentration levels and the stomatal pore surface (SPS, µm2), density (number of stomata m-2) and conductance (gsmax, mol H2O m-2 s-1). Bold values are significant at p < 0.01, underlined values at p < 0.05
15NH3 retention
5 ppbv 20 ppbv 50 ppbv 101 ppbv
SPS 0.044 -0.348 -0.112 -0.081 density -0.152 0.136 -0.110 -0.204 gsmax -0.057 -0.312 -0.006 0.037
49

Chapter 3
3.5 Discussion
3.5.1 Tree species effect
To our knowledge, this is the first study that compares NH3 retention between deciduous
and coniferous canopies. Except for the retention at 5 ppbv in June, 15NH3 and 13CO2
retention by Scots pine were always lower than those by the deciduous species. This also
held true for the 15NH4+ retention from rainwater by saplings of the same four species
(Chapter 2). Just as in Chapter 2, this can be explained by the low N demand of
coniferous tree species, owing to lengthy needle retention, efficient internal N recycling
and the ability of these species to produce large amounts of aboveground biomass per unit
N assimilated (Dail et al. 2009). Next to this, during the in-leaf season, coniferous species
have lower assimilation rates than deciduous species. However, on a yearly basis,
coniferous species are expected to grow faster because they start to assimilate earlier in
the year and continue longer (Schulze et al. 2005).
Furthermore, the 15NH3 retention by birch in June and September was higher than by
beech and oak. This could be explained by a different susceptibility to NH3 toxicity of
birch compared to beech and oak. Birch is a fast growing species which generally
assimilates nitrate by the roots. Assimilation of nitrate releases hydroxyl ions and hereby
increases the physiological buffering potential of the leaves (Pearson and Stewart 1993),
making them less prone to the acidifying effect of ammonia assimilation (Raven 1988). In
contrast, beech and oak are slow growing species, which rely mostly on root ammonium
assimilation for their N source (Smirnoff et al. 1984) and have therefore less buffering
potential to assimilate NH3. Additionally, birch was found to retrieve only 48-54 % of the
N for new growth from storage, while for oak this was 80-100 % (Millard and Grelet
2010). This indicates that birch trees need to retrieve more N from external sources.
3.5.2 Effect of treatment date
We observed significant differences in the 15NH3 retention between the treatment dates,
which can be attributed to several internal and external parameters influencing
photosynthesis rate and the apoplastic NH4+ concentration. External parameters include
temperature, water supply and photosynthetic active radiation (PAR), while internal
factors determine metabolic activity such as C skeletons, energy, and reduction
equivalents (NAD(P)H, ferredoxin), which vary significantly between tissue
developmental stages (Krupa 2003). The difference in air temperature of 5°C between
50

Canopy retention of 15NH3
June and August or September could have doubled the stomatal compensation point
(Farquhar et al. 1980; Schjoerring et al. 1998), which is the NH3 concentration in the
substomatal cavity when net uptake is zero. Increased stomatal compensation points
decrease the concentration gradient necessary for passive diffusion and could potentially
lead to higher net re-emission after the removal of the plastic bags. This could explain
why 15NH3 retention already decreased at concentrations higher than 20 ppbv in June.
The net photosynthesis rate, measured by 13CO2 retention, was higher by current year
needles of Scots pine than by last year needles, and so was 15NH3 retention. Ammonia
retention at 20 and 50 ppbv by the deciduous species was also highest in August when 13CO2 retention was highest, although in this case the apoplastic NH4
+ concentration
influenced by internal factors might be as important: Wang et al. (2011) observed
increased apoplastic and bulk tissue NH4+ levels in beech leaves during leaf development
and senescence and low levels of glutamine synthetase during leaf development
compared to other growth stages. This seasonal pattern was related to N mobilization
during early leaf establishment and remobilization during late leaf senescence. The
treatment dates used in this study did not coincide completely with leaf development and
senescence, but there is some evidence that these processes were important. In June, the
N content of leaves and twigs was highest for all species, indicating higher apoplastic or
bulk tissue NH4+ concentrations (Schjoerring et al. 1998), while in September the N
content of deciduous leaves had substantially decreased due to N remobilization (Fig.
3.4). Resorption of N has been found to coincide with the decomposition of the
photosynthetic apparatus, including chlorophyll, thereby resulting in a decreased net CO2
assimilation (Wang et al. 2011). Lower 13CO2 assimilation in September compared to
August was observed for birch and oak, but not for beech. This is possibly due to the fact
that the senescence stage must be rather advanced before net CO2 assimilation decreases
and NH4+ accumulation starts (Mattsson and Schjoerring 2003). Leaves of beech were
visually less discoloured than those of birch and oak.
For both current and last year needles of Scots pine no decrease in N content was
observed with treatment date. Current year needles of Scots pine were fully developed at
the end of the growing season, and, as indicated by other studies on Scots pine and by
their increasing N content (Fig. 3.4), will serve as main N storage site during winter
(Millard and Proe 1993). This higher N content might give rise to higher apoplastic NH4+
concentrations at this stage (Schjoerring et al. 1998).
51

Chapter 3
3.5.3 Effect of increasing NH3 concentration
Unlike many other studies (Farquhar et al. 1980; Van Hove et al. 1987; Bruckner et al.
1993; Gessler et al. 2000; Gessler et al. 2002), no increased 15NH3 retention with
increasing NH3 concentration was observed in this study through both leaves and twigs.
We assume that this cannot be attributed to a toxic effect at 100 ppbv, since no decrease in 13CO2 retention was observed at this level. Instead, an explanation for this unexpected
effect might be found in the two-step retention process of atmospheric NH3. Generally,
the driving force for the first step in the retention of gaseous compounds through stomata
or the cuticle is the concentration gradient between the gas phases inside and outside the
leaf. The gas phase in the leaf is in equilibrium with the concentration of NH3 and NH4+
in the aqueous phase of the apoplast (Rennenberg and Gessler 1999). There, NH4+
strongly dominates NH3 (Krupa 2003) and is assimilated via the enzymes of the
glutamine synthetase/glutamate synthase system (Pearson et al. 2002), which is the
second step in the retention process. Although it is possible that some of the measured 15N
retention by twigs could be due to physicochemical adsorption rather than by actual
assimilation (Dail et al. 2009; see Chapter 4), it is likely that the unexpected effect of the
applied NH3 concentration can be attributed to the second step in the retention process of
atmospheric NH3 due to the following arguments.
In the first step, NH3 retention through stomata is mainly controlled by stomatal aperture,
and at high ambient NH3 concentrations more NH3 will enter through the stomata
compared to low ambient concentration levels at a given stomatal conductance (Gessler et
al. 2000; Gessler et al. 2002). Furthermore, it is expected that at increasing NH3
concentrations and RH, more NH3 is deposited to the plant cuticle (Gessler et al. 2002),
although at increasing NH3 concentrations the total leaf conductance, i.e. the sum of
stomatal and cuticular conductance, will decrease due to a saturation of the cuticle
(Hanstein et al. 1999; Jones et al. 2007). The cuticle has been found to be nearly
impermeable for NH3 (Van Hove et al. 1989a,b), but the gas can be dissolved in thin
water films present on the leaf cuticle at RH > 50 % (Van Hove and Adema 1996), from
where it can be transported as NH4+ via cuticular diffusion (Peuke et al. 1998). Based on
these observations found in previous studies and the assumption that stomatal aperture
was sufficient for gaseous exchange (see 3.5.5), we hypothesize that also in this
experiment more 15NH3 has diffused into the substomatal cavities or deposited to the
cuticle at increasing atmospheric NH3 concentrations. However, it is likely that the NH3
52

Canopy retention of 15NH3
captured inside the leaves or deposited as NH4+ to the plant cuticle was not all assimilated
during the experiment (i.e., an interruption of the second step in the retention process) and
possible re-emitted when the plastic bags were removed, for which we propose two
explanations. First, Grundmann et al. (1993) reported a two-phase NH3-N after exposure
to 15NH3 of maize plants, one which was immediately assimilated during exposure and a
second corresponding to a reversible storage compartment in the apoplast or in cellular
vacuoles. In their experiment, the second phase was not retrieved immediately after the
experiment but after a few days. Since the study by Grundmann et al. (1993) was
conducted at very high concentrations and since no other studies reported such a storage
at realistic concentrations, this phenomenon may be linked to higher NH3 concentrations
and we would have found higher 15NH3 in the plant material at the 100 ppbv level after a
longer time period between the removal of the bags and the harvest of plant material.
Second - this applies to both leaves and twigs - all leaves and twigs were after the
removal of the polyethylene bags during the following hour again exposed to the ambient
NH3 concentration and RH before they were cut off. Ammonium dissolved in the thin
water films on the plant cuticle could then be re-emitted as NH3 from drying water films
(Sutton et al. 1995; Husted and Schjoerring 1996) and NH4+/NH3 in the substomatal
cavities could be re-emitted if atmospheric NH3 concentrations were lower than the
concentration inside the leaf. Especially plants that were exposed to a period of high NH3
deposition may emit significant amounts of NH3 when atmospheric NH3 concentrations
are low (Rennenberg and Gessler 1999; Gessler et al. 2002), which could explain why
very little 15NH3 was retained in the leaves and twigs exposed to the highest NH3
concentration.
Nevertheless, from this study we observed that all studied tree species were not able to
instantaneously assimilate the higher NH3 availability. Depending on the treatment date
and the tree species, as discussed in Sections 3.5.1 and 3.5.2, the maximum NH3
assimilation occurred at 5, 20 or 50 ppbv, while at 100 ppbv, leaves and twigs almost
assimilated no NH3. Further research combining a 15NH3 tracing study with NH3 flux
measurements could help to explain these results.
3.5.4 Leaf characteristics
In contrast to 15NH3 and 13CO2 retention, gsmax was found to be higher for pine compared
to the deciduous species. This can largely be attributed to its high SPS, since SD was
53

Chapter 3
lowest for pine and highest for beech and birch. No relationship between stomatal
characteristics or gsmax and 15NH3 retention was observed, in contrast to other studies
where stomatal conductance was found to influence NH3 fluxes (Van Hove et al. 1987;
Gessler et al. 2000; Gessler et al. 2002). One explanation might be that stomatal
conductance of pine needles was overestimated due to stomatal wax plugs or imbricacy
(Brodribb and Hill 1997). Removing pine from the correlation analysis increased
correlation coefficients, but they were still not found to be significant (data not shown).
Additionally, towards the end of the growing season, it is possible that more stomata will
stop functioning due to air pollutants (Paoletti and Grulke 2005), a process that cannot be
determined by measuring gsmax. From this we can conclude that stomatal characteristics
and gsmax are not suitable parameters to explain differences in NH3 retention between
species and throughout the growing season.
We only found a weak relationship of total 15NH3 retention with N content of twigs (Fig.
3.5) at 5 and 20 ppbv and with N content of leaves at 20 ppbv (Table 3.4). The N content
of both leaves and twigs can be considered as an indicator of the N status of the plant (Ma
et al. 2005). Husted and Schjoerring (1996) showed that the ratio between leaf
conductance for NH3 and H2O depends on the plant N status, with a relatively higher H2O
conductance in low-N plants, a similar conductance in medium-N plants and a much
higher relative NH3 conductance in high-N plants.
At 50 and 100 ppbv NH3, foliar 15NH3 retention was related to 13CO2 retention. One
explanation for this observation might be that at higher NH3 concentrations, 13CO2
assimilation was restricting to the N assimilation process, although plants are shown to
detoxify NH3 by storing N in compounds with low C:N ratios (Krupa 2003). No
relationship was found between measured stomatal characteristics and 15NH3 retention,
which is probably due to the fact that gsmax was not a good proxy for actual stomatal
conductance to explain differences between tree species and tissue developmental stages.
3.5.5 Methodological considerations
This experiment was performed in closed chambers where temperature, RH and PAR
could not be controlled. However, per treatment date the experiment was performed at the
same moment for all species, subjecting them to similar PAR intensities. Moreover, the
increase in temperature inside the bags was overall very low and the increase in RH (with
17 %) did not differ between tree species and NH3 concentration levels (see 3.3.2.1).
54

Canopy retention of 15NH3
Furthermore, all saplings were watered sufficiently, so differences in plant water status
should be limited. We can assume that stomata were not closed, since significant 13CO2
assimilation and transpiration (indicated by an increase in RH) occurred.
However, it is possible that RH increase affected the NH3 retention by different species
differently through a different response of stomatal and cuticular conductance. For
example, stomatal aperture of fast growing species like birch has been shown to be less
sensitive to changes in RH than for slow growing species (Aasamaa and Sõber 2011). RH
had a significant effect on NH3 fluxes to a beech canopy which was attributed to
increased surface deposition (Gessler et al. 2000), but only a marginal effect on NH3
fluxes to a Norway spruce canopy (Gessler et al. 2002). Especially at high RH, the
capacity of leaf cuticles to adsorb NH3 is linked to leaf surface chemistry and different
species likely show a different interaction (Asman et al. 1998). Additionally, the leaf
surface area exposed to 15NH3 also differed between the tree species and the different
treatment dates (Table 3.1), which may have influenced cuticular conductance. In general,
when NH3 availability is constant, NH3 deposition increases with the leaf area exposed
(Massad et al. 2010), but not in all cases (Loubet and Cellier 2001). In this study, a fixed
amount of NH3 was applied, which may not have been sufficient for trees with a large
biomass such as the pines. However, in case of insufficient NH3 availability, increased 15N retention would have been measured at increasing NH3 concentrations, which was not
the case. The retention of 15NH3 did not increase with increasing surface area (results not
shown), so it is likely that the effect of leaf area was negligible.
Although no differences in 13CO2 retention were found between the treatments with
different NH3 concentrations, it is possible that stomatal conductance varied between the
concentration levels since stomata only marginally limit C gain (Farquhar and Sharkey
1982). However, no reduction in stomatal conductance caused by an increased NH3
concentration has been reported yet. Contrary, Van Hove et al. (1989b) reported an
increased stomatal conductance and CO2 assimilation rate in poplar leaves after NH3
exposure at 144 ppbv for 6 to 8 weeks, but it is not likely that such an effect occurred
during our experiments within one hour. Therefore, stomatal conductance may have
varied randomly among individual trees and tree species, but likely without distinct
differences between the applied different NH3 concentrations levels.
55

Chapter 3
56
3.6 Conclusion
To the best of our knowledge, this is the first study that compares the short-term 15NH3
retention by leaves and twigs of four temperate tree species at different NH3
concentration levels. We clearly observed a higher 15NH3 retention by birch, beech and
oak compared to pine, related to their net 13CO2 assimilation. Further research based on
long-term monitoring needs to clarify if this also holds true on a yearly basis, since
needles may also assimilate during the dormant season. Furthermore, the capacity of all
species to assimilate 15NH3 reached a maximum at 5, 20 or 50 ppbv NH3 depending on the
treatment date, which we attributed to increasing temporal storage of NH3 or strong re-
emission at increasing initial NH3 concentration levels. The mechanism of temporal
storage has been suggested in the past at high external NH3 concentrations. This study
suggests that this may also occur at lower NH3 concentrations. However, this needs to be
confirmed by further research. The relationships between 15NH3 retention on the one hand
and 13CO2 retention and N content of leaves and twigs on the other hand were significant
but weak. Probably a more extensive experiment focussing on one tree species could help
to reveal the exact interaction between N and C processes.


4 Retention of dissolved inorganic nitrogen by foliage and twigs offour temperate tree species
After: Adriaenssens S, Staelens J, Wuyts K, Samson R, Verheyen K, Boeckx P. Retention of dissolved inorganic nitrogen by foliage and twigs of four temperate tree species. Submitted to Ecosystems
4.1 Abstract
Nitrogen (N) retention by tree canopies is believed to be an important process for tree
nutrient uptake, and its quantification is a key issue in determining the impact of total
atmospheric N deposition on forest ecosystems. Due to dry deposition and retention by
canopy elements, the actual uptake and assimilation by the tree canopy is often obscured
in throughfall studies. In this study, 15N-labelled solutions (15NH4+ and 15NO3
-) were used
to assess dissolved inorganic N retention by leaves/needles and twigs of European beech,
pedunculate oak, silver birch and Scots pine saplings. The effects of N form, tree species,
leaf phenology and applied NO3- to NH4
+ ratio on the N retention were assessed.
Retention patterns were mainly determined by foliar uptake, except for Scots pine. In
twigs, a small but significant 15N enrichment was detected for NH4+, which was found to
be mainly due to physicochemical adsorption to the woody plant surface. The mean 15NH4
+/15NO3- uptake ratio varied considerably among species and phenological stadia,
which indicates that the use of a fixed ratio in the canopy budget model could lead to an
over- or underestimation of the total N retention. In addition, throughfall water under
each branch was collected and analysed for 15NH4+, 15NO3
- and all major ions. Net
throughfall of 15NH4+ was, on average, 20 times higher than the actual retention of 15NH4
+
by the plant material, indicating that a large part of the applied 15NH4+ could not be
attributed to measured pools and fluxes. The retention of 15NH4+ was correlated with the
net throughfall of K+, Mg2+, Ca2+ and weak acids during leaf development and the fully-
leafed period, while no significant relationships were found for 15NO3- retention. This
suggests that the main driving factors for NH4+ retention might be ion-exchange processes
during the start and middle of the growing season and passive diffusion at leaf
senescence.
59

Chapter 4
4.2 Introduction
The ability of forest canopies to retain and assimilate inorganic nitrogen (N) from wet and
dry deposition is well known (Rennenberg and Gessler 1999; Harrison et al. 2000; Sparks
2009). In contrast to N uptake from the soil, canopy N retention is a direct addition to a
tree’s metabolism; there is no competition from soil microbial biomass involved (Gaige et
al. 2007; Sievering et al. 2007). The contribution of canopy retention to the N cycling
within a forest canopy, particularly in photosynthetically active foliage, may be
substantial (Sievering et al. 2007). Estimates based on dry deposition measurements and
throughfall analyses indicate a net canopy retention of 10 to 90 % of the atmospheric
input (Lovett and Lindberg 1993; Sievering et al. 2007). The wide range of canopy
retention values can be caused by differences in tree species and leaf phenology (Tukey
1970; Fritsche 1992; Van Ek and Draaijers 1994; Chapter 2), but also by differences in
atmospheric N deposition. As N deposition increases, canopy N consumption also
increases (Schaefer et al. 1988; Lovett and Lindberg 1993; Gaige et al. 2007). Therefore,
canopy retention under high N deposition levels might meet a larger portion of the whole
tree demand of N (Gaige et al. 2007) and cause growth responses in historically N-limited
forests (Sparks 2009). This higher N retention might thus enhance carbon (C)
sequestration, although the magnitude and the direction of this effect is still under
discussion (Magnani et al., 2007; Sievering et al., 2007; Dail et al., 2009; Högberg, 2011).
Canopy N retention, i.e. the atmospheric N input to the canopy not reaching the forest
soil, is usually attributed to assimilation by tree foliage (Eilers et al., 1992; Harrison et al.,
2000; Gessler et al., 2002) and epiphytic lichens (Reiners and Olson, 1984; Bowden et al.,
1989; Friedland et al., 1991), microbial activity (Papen et al., 2002), to physical uptake by
twigs and stems (Schoenherr, 1982; Katz et al., 1989) and to physicochemical adsorption
processes to twigs and branches (Dail et al., 2009). The variety of potential N sinks in tree
canopies complicates the accurate quantification of canopy N uptake and its relative
magnitude compared to other N sources for trees (Sparks 2009). The quantification
uncertainty may then propagate into larger uncertainties when calculating the impact of
enhanced N deposition on forest ecosystem processes, such as eutrophication by N, soil
acidification and on shifts in biodiversity (Aber et al. 1998; Gilliam 2006; Gundersen et
al. 2006; Bowman et al. 2008) and C sequestration (Nadelhoffer et al. 1999; Magnani et
al. 2007; de Vries et al. 2009).
60

Canopy retention of dissolved inorganic N
A widely used approach to measure N retention by tree canopies is to examine the
differences in N composition of rainfall and throughfall water (Parker 1983; Gaige et al.
2007). Throughfall measurements are well suited for large-scale and long-term
monitoring purposes. Canopy N retention is then calculated with the canopy budget
model, in which N fluxes are assumed to be related to fluxes of protons (H+) and base
cations (Draaijers and Erisman 1995; Staelens et al. 2008). Although the results of this
model generally correspond with the results of other methods, there is a relatively large
uncertainty in the estimated canopy N retention (Draaijers et al. 1996) and no information
on the actual sinks and processes involved. Moreover, direct gaseous uptake is not taken
into account (Draaijers et al. 1997; Thimonier et al. 2005). A more mechanistic and
sensitive method to measure canopy N retention is the application of 15N-labelled sources
in solution or as gaseous form. Yet, this approach is usually limited to short-term
exposure (Bruckner et al. 1993; Gessler et al. 2002; Jones et al. 2008) and application to
saplings (Bowden et al. 1989; Brumme et al. 1992; Eilers et al. 1992; Lumme and
Smolander 1996; Garten et al. 1998; but see Gaige et al. 2007) or specific plant parts
(Garten and Hanson 1990; Boyce et al. 1996). A combination of the two approaches, i.e.,
a comparison between the chemical composition of throughfall water and the canopy
retention of 15N-labelled sources, might yield new insights into the relationship between
canopy N retention and throughfall N composition.
Furthermore, none of the 15N studies so far has attempted to quantify N retention during
winter, when deciduous species are leafless and coniferous trees are physiologically less
active. Increasing evidence suggests that twig, branch and stem surfaces are an important
sink of dissolved N in the canopy (Bowden et al. 1989; Boyce et al. 1996; Wilson and
Tiley 1998; Dail et al. 2009), although it is not clear whether this retention results from an
actual assimilation process or abiotic uptake process (absorption) or a physicochemical
process (adsorption) (Dail et al. 2009).
In the present study, we applied artificial rainwater containing 15N-labelled inorganic N to
determine the N retention from wet deposition by the foliage (leaves or needles) and
twigs of four temperate tree species, i.e., one coniferous and three deciduous species. We
also compared the canopy N retention with the chemical composition of the throughfall
water. The aims were (i) to determine 15NH4+ and 15NO3
- retention by twigs from wet
deposition with a low vs high NO3- to NH4
+ ratio at four dates throughout the year, (ii) to
assess the relative importance of 15N retention by twigs compared to foliage, (iii) to
61

Chapter 4
determine whether the observed 15N retention results from assimilation or from
adsorption to the plant surface and (iv) to relate the observed 15N retention to the net
throughfall of 15N and other ions.
4.3 Materials and methods
4.3.1 Plant material and experimental site
A full description of the plant material and experimental site is given in Section 2.3.1.
4.3.2 Experimental set-up and sample analysis
4.3.2.1 15N application
A detailed description of the 15N application is given in Section 2.3.2.1. Additionally,
throughfall water under each branch was collected and weighed. To quantify the exact
amount of solution applied to each branch, the initial and final weights of the sprayer
were registered. The experiment was conducted in the same three phenological periods
and on the same dates as Chapter 2 and additionally in the leafless period (6 Feb 2009 for
all species) to assess the effect of plant phenological state on N retention.
In the leafless period, a dead twig of each species was included in each treatment to
assess whether the observed 15N retention resulted from actual assimilation or
physicochemical adsorption. For this purpose, living twigs were cut from the study
sapling, dried in the oven (24 h at 70°C) to stop all physiological activity, and placed back
outside to moisten them again.
4.3.2.2 Analysis of plant material
After harvesting, all twigs were washed thoroughly with deionised water in order to
remove any 15N adsorbed to the surface of foliage or branches. To test if all surface 15N
was removed from the twig surface and if the measured 15N retention represents actual
assimilation, half of each twig, i.e. dead as well as living twigs, from the 15N applications
in the leafless period was rinsed with 0.05 M KCl. Potassiumchloride is a more thorough
rinsing solution than deionised water since 15NH4+ or 15NO3
- adsorbed to the twig surface
can be exchanged for K+ or Cl- ions. Next, leaves, needles and twigs were dried, weighed,
ground to a fine powder and analysed in duplicate for total N and 15N as described in
Section 2.3.2.4.
62

Canopy retention of dissolved inorganic N
4.3.2.3 Analysis of water samples
Within 24 h after sampling, pH (ion-specific electrode) and electric conductivity were
measured. After filtering through a 0.45-µm nylon membrane filter, NO3-, SO4
2-, PO43-
and Cl- were determined with ion chromatography (Dionex, Sunnyvale, USA) within one
week after sampling. Ammonium concentrations were assessed by the photometric
determination of a reaction product of NH4+ at 660 nm (Dutch standard method NEN
6567), while K+, Ca2+, Mg2+ and Na+ were determined by flame atomic absorption
spectrophotometry (AA240FS, Varian, USA). Proton concentrations were derived from
the pH measurements. The quality of the chemical analyses was checked by including
method blanks and repeated measurements of internal standards and certified reference
samples. Repeated measurements of certified reference water samples (CRM 409)
performed during the study period yielded coefficients of variation less than 5 % and
recovery rates higher than 90 % for all ions.
The 15N contents of NH4+ and NO3
- in the water samples were analysed after conversion
to N2O (Saghir et al. 1993; Stevens and Laughlin 1994). Ammonium was converted by
adding MgO to the samples and absorbing NH3 into H2SO4, after which N2O was
produced by reaction with NaOBr (Saghir et al. 1993). Nitrate was reduced by Cd-Cu at
pH 4.7 to produce nitrite and hydroxylamine as intermediates of N2O (Stevens and
Laughlin 1994). Nitrous oxide was determined using a trace gas preparation unit (ANCA-
TGII, SerCon, UK) coupled to an IRMS (20-20, SerCon, UK). Instrument error (n = 10)
of this TG-IRMS system is 0.3‰ for δ15N-N2O. For the fully leafed periods (2008), all
water samples were individually analysed for 15N content. For the other periods, a mixed
sample per treatment was analysed.
4.3.3 Data processing
Retention of 15N per unit dry plant material (µg N g-1 DM) was calculated according to
equation 2.1. The total 15N retention by foliage and twigs together was calculated as the
mass-weighted mean of the retention by foliage and twigs separately. Throughfall (TF)
and wet deposition (WD) fluxes (µmolc g-1 DM) for each sample were calculated as the
product of molar ion concentration (µmol l-1) and the collected or sprayed volume,
respectively, divided by the weight of the sprayed dry plant material (g DM). Throughfall
deposition of weak acids (WA, µmolc g-1 DM) was calculated as the difference between
63

Chapter 4
cations and anions. Net throughfall fluxes (NTF) for all ions, including 15NH4+ and 15NO3
-
, were calculated as the difference between TF and WD fluxes.
For each combination of tree species, NO3- to NH4
+ ratio, N form and leaf phenological
stage, a one sample t test was used to test whether the calculated N retention by foliage
and twigs and the NTF of all ions were significantly different from zero. The effect of N
form on the N retention by leaves and twigs was tested by means of t tests per tree
species, NO3- to NH4
+ ratio and phenological stage. A three-way ANOVA was performed
to assess the effect of tree species, leaf phenology and NO3- to NH4
+ ratio on the measured 15NH4
+ and 15NO3- retention. The three-factor interaction was excluded from the model
because of insufficient degrees of freedom. Means were separated by Tukey’s honestly
significant difference post-hoc tests. Data of 15N retention were log-transformed to meet
normality conditions. Significant differences in 15N retention between twigs rinsed with
distilled H2O or with KCl were tested by means of a general linear model including
rinsing method as fixed effect and twig ID as random effect. The relationship between 15N retention and NTF of different ions was assessed by Spearman rank correlation
coefficients (rs). All analyses were performed with SPSS 15.0.
4.4 Results
4.4.1 15N retention by plant material
Retention of 15NH4+ and 15NO3
- by leaves and needles during the growing season was
already reported in Section 2.4.1. In the present study, the effects of leaf phenology and
the NO3- to NH4
+ ratio on the canopy N retention were recalculated including the leafless
period, during which needles of Scots pine were still present (Table 4.1). The retention of 15NO3
- by needles in the leafless period was significantly lower than in the fully leafed
and leaf senescence period, while 15NH4+ retention was lowest in the leaf senescence
period.
The mean 15NH4+ retention by twigs (Fig. 4.1) ranged from 0.54 for oak to 1.76 µg N g
DM-1 for pine and was significantly different from zero in most cases. The retention of 15NO3
- ranged from -0.07 for birch to 0.32 µg N g DM-1 for oak but did not always differ
from zero. Nitrogen uptake by twigs was higher for NH4+ than NO3
-, except under the
high NO3- to NH4
+ ratio for beech, oak (leaf development) and birch (fully leafed period)
64

Canopy retention of dissolved inorganic N
and under the low NO3- to NH4
+ ratio for oak (fully leafed period) and pine (leafless
period).
In general, the calculated 15NH4+ and 15NO3
- retention by twigs (Fig.4.1) was significantly
influenced by tree species, the applied NO3- to NH4
+ ratio and the two-way interactions
between these factors between tree species, leaf phenology and the applied NO3- to NH4
+
ratio (Table 4.1). In contrast to the foliage (see Chapter 2), 15NH4+ retention by the twigs
of pine was always higher than for the deciduous species. For beech, 15NH4+ retention
was lowest in the leafless period compared with the growing season, while no significant
differences between phenological periods were found for the other tree species. The
applied NO3- to NH4
+ ratio only influenced the 15NH4+ retention by pine twigs. Birch
twigs retained less 15NO3- than the other species during the growing season, while there
was no difference in the leafless period. Both beech and oak twigs showed a higher 15NO3
- uptake in the ‘high NO3- to NH4
+ ratio’ treatment, particularly during leaf
development.
Table 4.1 P values of a three-way ANOVA: effects of tree species, leaf phenology and NH4
+ to NO3- ratio on the observed 15NH4
+ and 15NO3- retention by foliage, twigs and the
sum of foliage and twigs (total). Bold values are significant at p < 0.05
Source of variation 15NH4+ retention 15NO3
- retention Foliage Twigs Total Foliage Twigs TotalTree species < 0.001 < 0.001 < 0.001 < 0.001 < 0.001 < 0.001Leaf phenology < 0.001 0.147 < 0.001 <0.001 0.140 < 0.001NO3
- to NH4+ ratio 0.537 0.174 0.061 < 0.001 < 0.001 < 0.001
Tree species * leaf phenology < 0.001 < 0.001 < 0.001 < 0.001 < 0.001 < 0.001Tree species * NO3
- to NH4+
ratio 0.021 0.001 0.293 <0.001 0.005 0.018Leaf phenology * NO3
- to NH4+ ratio < 0.001 < 0.001 < 0.001 < 0.001 < 0.001 < 0.001
Since the N retention by foliage exceeded the retention by twigs, total (i.e. foliage +
twigs) N retention patterns were mainly determined by the foliage, except for 15NH4+
retention by pine (Fig. 4.2). Total 15NH4+ retention by foliated twigs was three to ten
times higher than total 15NO3- retention and was two to three times higher for the
deciduous species than for pine. All species showed the lowest total retention during the
leafless season, which was driven by the difference between foliated and non-foliated
twigs for the deciduous species and by the difference between growing and dormant
season for pine. Within the growing season, all species showed the highest 15N retention
at leaf senescence and the lowest in the fully leafed period (birch and pine) or at leaf
65

Chapter 4
development (beech and oak). The high NO3- to NH4
+ ratio treatment generally resulted in
a 1.3 times higher 15NO3- uptake and had no effect on 15NH4
+ uptake. Total 15NH4+ and
15NO3- uptake by foliated twigs amounted to 2.27 ± 1.01 and 0.52 ± 0.44 % of the applied
15N, respectively.
0
2
4
6
8
10
15N
H4+ r
eten
tion
(µg
N g
-1 D
M)
Low NO3- to NH4
+ ratio
Birch Beech Oak PineBirch Beech Oak Pine-1
0
1
2
3
15N
O3- r
eten
tion
(µg
N g
-1 D
M)
0
2
4
6
8
10DevelopingFully leafedSenescentLeafless
High NO3- to NH4
+ ratio
Birch Beech Oak PineBirch Beech Oak Pine-1
0
1
2
3
Fig. 4.1 Mean 15NH4+ and 15NO3
- retention (µg N g-1 DM) by twigs of birch, beech, oak and pine in the ‘low NO3
- to NH4+ ratio’ treatment and in the ‘high NO3
- to NH4+ ratio’
treatment in different phenological stages (developing leaves, fully developed leaves, senescent leaves and the leafless stage)
4.4.2 Rinsing experiment in the leafless period
The δ15N values and 15N retention of birch, oak and current year pine twigs sprayed with 15NH4
+ were significantly lower when rinsed with KCl than with distilled water (Fig. 4.3).
No significant differences were found for twigs sprayed with 15NO3- and for current and
last year pine needles sprayed with 15NH4+ or 15NO3
- (results not shown). The 15N
enrichment of dead pine twigs sprayed with 15NH4+ was also lower when rinsed with KCl
than with distilled water. However, it was not possible to test the significance of this
difference due to a lack of replicates. For both rinsing methods, 15NH4+ retention by the
66

Canopy retention of dissolved inorganic N
0
2
4
6
15N
rete
ntio
n (µ
g N
g D
M-1)
Birch15NH4
+ foliage15NH4
+ twigs
0
2
4
6
15NO3- foliage
15NO3- twigs
Beech
Developing
Fully leafed
Senescing
Leafless
0
1
2
3
4
15N
rete
ntio
n (µ
g N
g D
M-1)
Oak
Developing
Fully leafed
Senescing
Leafless0
1
2
3
4Pine
4.9
3.6
12.622.6
2.14.7
7.7 5.6
2.94.1 3.9
5.1 93.64.0 9.2
39.6
Fig. 4.2 Mean 15NH4+ and 15NO3
- retention (µg N g-1 DM) by foliage and twigs of birch, beech, oak and pine in different phenological stages. Numbers in the graph represent the ratio of 15NH4
+ to 15NO3- retention
. Birch Beech Oak PineBirch Beech Oak Pine0
1
2
3
4
15N
rete
ntio
n (µ
g N
g-1
DM
) H2O living twigKCl living twigH2O dead twigKCl dead twig
NH4+
Birch Beech Oak PineBirch Beech Oak Pine0
0.1
0.2
0.3
0.4NO3
-
Fig. 4.3 Mean 15N retention (µg N g-1 DM) of living and dead twigs of birch, beech, oak and pine sprayed with 15NH4
+ and 15NO3- and subsequently rinsed with distilled water or
KCl. Vertical bars represent standard deviations
67

Chapter 4
dead twigs ranged from 0.19 for beech to 0.63 µg g-1 DM for pine, and 15NO3- retention
from 0.03 for birch to 0.11 µg g-1 DM for pine
4.4.3 Water samples
The observed NTF of NH4+-N, NO3
--N, Na+, Cl- and SO42--S differed significantly from
zero in half of the cases (Fig. 4.4; p < 0.05), depending on the tree species, phenological
period or NO3- to NH4
+ ratio considered. Generally, NTF was significantly higher than
zero, except for NH4+-N during leaf development of beech and oak and for NO3
--N during
leaf development of beech. The NTF of H+ was always significantly lower than zero.
-8
-4
0
4
8
12
NTF
flux
(µm
olc g
-1 D
M)
Birch
-8
-4
0
4
8
12
Mg2+
Ca2+
K+
Cl-
Na+
SO42--S
H+
NO3--N
NH4+-N
Beech
Developing
Fully leafed
Senescing
Leafless
Developing
Fully leafed
Senescing
Leafless
Developing
Fully leafed
Senescing
Leafless
Developing
Fully leafed
Senescing
Leafless-2
0
2
4
6
8
NTF
flux
(µm
olc g
-1 D
M)
Oak
Developing
Fully leafed
Senescing
Leafless
Developing
Fully leafed
Senescing
Leafless
Developing
Fully leafed
Senescing
Leafless
Developing
Fully leafed
Senescing
Leafless-2
0
2
4
6
8Pine
Fig. 4.4 Mean net throughfall fluxes (NTF, µmolc g-1 DM) for all major ions per tree species and phenological stage
68

Canopy retention of dissolved inorganic N
The 15N enrichment in TF ranged from 58.2 ± 19.6 atom % 15N for NH4+ to 71.8 ± 11.4
atom % for NO3-. This corresponded to a mean recovery of 58.3 ± 17.5 % and 99.0 ± 12.8
%, respectively, of the applied 15N (Fig. 4.5). So, based on the 15N accounted for in the
NTF, on average 41.7 % of the applied 15NH4+ and 1.0 % of 15NO3
- had been retained by
the foliage and twigs.
Birch
0
20
40
60
80
100
% 15
N re
cove
ry
Beech
0
20
40
60
80
100
Oak
Developing
Fully leafed
Senescing
Leafless0
20
40
60
80
100
% 15
N re
cove
ry
15NH4+ foliage + twigs
15NH4+ throughfall
15NH4+ not accounted for
Pine
Developing
Fully leafed
Senescing
Leafless0
20
40
60
80
100
15NO3- foliage + twigs
15NO3- throughfall
15NO3- not accounted for
Fig. 4.5 Percentage recovery of 15N applied as NH4+ or NO3
- in foliage, twigs and throughfall water of birch, beech, oak and pine for the different phenological stages
The 15NH4+ retention by foliage and twigs was significantly correlated with the NTF of
K+, Ca2+, Mg2+ and WA during leaf development and the fully leafed period (Fig. 4.6)
and with the NTF of H+ during the fully leafed period (Table 4.2). There was also a
significant correlation with NTF of inorganic 15N (Table 4.2). The 15NO3- uptake was
69

Chapter 4
correlated with the NTF of K+ during the leafless period only and with the NTF of Na+
during leaf development and leaf senescence. Furthermore, the NTF of the sum of base
cations (K+ + Ca2+ + Mg2+) was significantly correlated with the NTF of WA during leaf
development (p < 0.001; rs = 0.81), the fully leafed period (p < 0.001; rs = 0.88), leaf
senescence (p < 0.001; rs = 0.59) and the leafless period (p = 0.014; rs = 0.31).
0 2.4 2.6 2.8 3ln(NTF base cations
(µmolc N g-1 DM))
02.3
2.304
2.308
2.312
2.316
2.32
ln(p
lant
15N
H4+ r
eten
tion
(µm
olc g
-1 D
M))
K+
Mg2+
Ca2+
a
0 2.4 2.6 2.8 3ln(NTF weak acids (µmolc N g-1 DM))
02.3
2.304
2.308
2.312
2.316
2.32b
Fig. 4.6 Relationship between 15NH4+ uptake by foliage and twigs and (a) net throughfall
(NTF) of K+ (rs = 0.55), Mg2+ (rs = 0.63) and Ca2+ (rs = 0.48) and (b) net throughfall of weak acids (rs = 0.59) during the fully leafed period
4.5 Discussion
According to Gaige et al. (2007), N deposited on a forest canopy has the following
possible fates: (1) retention and/or assimilation by foliar and bark surfaces within the
canopy, (2) bypassing of the canopy at the time of the application, (3) wash off during
subsequent rain events, followed by recovery as NO3-, NH4
+or dissolved organic N
(DON) in throughfall or stemflow and (4) gaseous loss by volatilization. Retention
includes assimilation by tree foliage, twigs and stems, epiphytic lichens, microbial
activity and physicochemical adsorption processes to twigs and branches. As no epiphytic
lichens were observed on the young saplings, their contribution can be considered
negligible. During leaf development, beech leaves were infested by woolly beech aphid
(Phyllaphis fagi L.), which could have increased the presence of micro-
70

Canopy retention of dissolved inorganic N
Tabl
e 4.
2 Sp
earm
an c
orre
latio
n co
effic
ient
s be
twee
n th
e ob
serv
ed to
tal (
folia
ge a
nd tw
igs)
15N
H4+ a
nd
15N
O3- r
eten
tion
(n =
126
) an
d th
e ne
t th
roug
hfal
l flu
xes
of d
iffer
ent
ions
(n
= 25
6).
Bol
d va
lues
are
si
gnifi
cant
at p
< 0
.01,
und
erlin
ed v
alue
s at p
< 0
.05
WA
b 0.
51
0.59
0.
28
0.06
0.
42
-0.0
4 0.
29
0.47
0.
26
0.28
a In
cas
e of
NH
4+ , NTF
of 15
NH
4+ ; in
case
of N
O3- , N
TF o
f 15N
O3-
b Wea
k ac
ids
SO42-
0.
44
0.31
0.
01
0 0.02
-0
.2
-0.0
1 -0
.2
0.26
-0
.18
Mg2+
0.
47
0.63
-0
.06
0 0.29
0.
02
0.25
0.
28
0.21
0.
13
Ca2+
0.
43
0.48
0.
11
0.26
0.
44
0.19
0.
33
0.1
0.29
0.
28
K+
0.28
0.
55
0.05
0.
08
0.38
0.
03
0.14
0.
27
0.56
0.
20
Cl-
-0.3
3 0.
28
-0.0
9 0.
06
-0.1
7 -0
.23
-0.0
1 -0
.18
0.16
-0
.18
Na+
0.12
0.
26
-0.1
3 0.
21
-0.0
4 -0
.65
0.02
-0
.46
0.03
-0
.43
H+
0.3
0.43
-0
.09
-0.4
0 0.
05
-0.1
5 -0
.13
-0.0
6 -0
.13
-0.1
6
NO
3- -0
.26
0.06
-0
.31
-0.0
4 -0
.13
-0.3
4 0 -0
.51
0.32
-0
.29
NH
4+ -0
.16
-0.1
6 0.
26
-0.2
3 -0
.13
-0.1
6 -0
.15
-0.1
4 0.
30
-0.1
3
15N
a -0
.21
-0.2
2 -0
.64
-0.6
6 -0
.40
-0.6
0 0.
24
-0.6
2 -0
.39
-0.2
5
15N
trea
tmen
t and
tim
e pe
riod
N
H4+
Leaf
dev
elop
men
t
Fu
lly d
evel
oped
Lea
f sen
esce
nce
L
eafle
ss
Y
ear
NO
3-
Lea
f dev
elop
men
t
Ful
ly d
evel
oped
Lea
f sen
esce
nce
L
eafle
ss
Y
ear
71

Chapter 4
organisms and their contribution to inorganic N assimilation later in the growing season
(Stadler et al. 2001). In contrast to the studies of Gaige et al. (2007) and Dail et al. (2009),
the possible fates (1) and (2) were measured almost instantaneously after one-time
application in the present study while (3) was measured by analysing the rinsing water in
a supplementary experiment (see 4.7 Appendix), which made it possible to recover N in
all possible sinks, except for gaseous losses by volatilization. Nitrogen that bypassed the
canopy is here referred to as throughfall, while wash off is used for N in rinsing water.
4.5.1 Nitrogen retention processes by canopy components
Several 15N-labelling studies have indicated N retention by woody plant surfaces to be at
least as important as foliar uptake (Bowden et al. 1989; Boyce et al. 1996; Wilson and
Tiley 1998; Dail et al. 2009). Klemm (1989) demonstrated the existence of pathways for
the absorption of water and solutes in the region of radial rays across the twig bark and
suggested that the contribution of ion exchange via these water pathways may be
significant for the whole plant ion balance. Boyce and McCune (1992) suggested that the
bulk of intercepted precipitation remains on twig surfaces far longer than on foliage,
which may provide more opportunity for ion uptake by twigs. In the field, the mass flow
process through twigs should be most significant in the early phases of each precipitation
event, because rainwater then generally has the highest concentration of elements
(Hansen et al. 1994) and the xylem water potential of trees is lower than later in the
precipitation event (Katz et al. 1989). Therefore, in this study we would expect a
significant retention of NH4+ and NO3
- after one spraying event. This was observed for
NH4+ but not for NO3
-. It is not clear whether tree bark has a negative charge like the leaf
cuticle, but many studies have shown that bark has a high cation exchange capacity
(Levia and Frost 2003), suggesting that cations are more easily retained by the bark
surface. However, when relatively more NO3- was available, the beech and oak twigs
retained more NO3-. So, by increasing the concentration gradient between the external
mineral solution and the plant, anion diffusion may be enhanced for some species. On
average, we found a 1.3 times higher NO3- uptake when the applied concentration was
three times higher, in contrast to Brumme et al. (1992) and Eilers et al. (1992), who
observed a proportional increase of NO3- with increasing concentration in the spray
solution.
72

Canopy retention of dissolved inorganic N
The higher N retention by twigs vs needles for Scots pine is concordant with the findings
for Norway spruce (Wilson and Tiley 1998), red spruce (Bowden et al. 1989; Boyce et al.
1996) and hemlock (Dail et al. 2009). However, Eilers et al. (1992) found the opposite for
10-year-old Norway spruce trees. In the present study, the retention by the twigs of the
three deciduous species, including beech, was lower than the foliar retention, which
confirms the findings of Brumme et al. (1992) for beech twigs.
Furthermore, the ratio of NO3- to NH4
+ retention by foliage and twigs was highly variable
among the tree species and the phenological periods considered (Fig. 4.2), as was
concluded in Chapter 2 for foliage only. For beech and oak, the mean ratio amounted to
4.7 and 4.0 respectively, while for birch and pine the ratio was significantly higher during
leaf development and the leafless period compared to the other two periods. This
indicates that the proposed efficiency factor of six suggested by de Vries et al. (2001) is
not applicable for all species throughout the year. Using this fixed factor value could thus
overestimate or underestimate total atmospheric N deposition to forest ecosystems.
Bulk tissue analysis does not allow distinguishing between physiological uptake into cells
and adsorption to or diffusion into non-living bark. The higher 15N retention values
calculated for pine twigs compared to twigs of the deciduous species could be due to 15N
lodged in micro-crevices of the rough bark surface, as suggested for Norway spruce
(Wilson and Tiley 1998). The bark of birch, beech and oak twigs is less rough, may have
a smaller surface area and therefore has less potential adsorption sites. The hypothesis of
physicochemical adsorption of N to the bark is confirmed by a decrease in 15NH4+
enrichment when twigs were rinsed with KCl compared to distilled water. This indicates
that part of the 15NH4+ was only weakly adsorbed to the woody surface and was easily
exchangeable for K+. Moreover, dead twigs also showed an enrichment, which cannot be
attributed to active assimilation. This leads to the conclusion that biological or
physiological uptake by twigs was generally low, but that significant amounts of NH4+
were adsorbed to the bark surface. Since no difference in 15N retention was found
between needles of Scots pine rinsed with distilled water or with KCl in the leafless
period or between the beech leaves rinsed with distilled water, KCl or artificial rainwater
in 2010 (see supplementary experiment in 4.7. Appendix), it may be assumed that 15N
retention by leaves and needles results from actual uptake and assimilation processes.
This was not verified for birch and oak in the present study, but can be confirmed by the
findings of Garten and Hanson (1990) for red maple and white oak leaves.
73

Chapter 4
Total 15N retention by foliated twigs after this one-time application was generally low,
e.g. 1-5 % of the applied 15N for 15NH4+ and 0-2 % for 15NO3
-. In general, higher retention
was found in other previously performed 15N studies with saplings (Brumme et al., 1992;
Eilers et al., 1992; Garten et al., 1998; Wilson and Tiley, 1998), but these studies used
higher N concentration levels comparable to throughfall deposition instead of wet
deposition. Only the study of Bowden et al. (1989) applied similar N amounts to saplings
of red spruce and found 15N retention comparable to this study. In addition, it is possible
that tree age might have an effect on the observed results. Until now, 15N labelled
rainwater has only been applied to a mature forest in an experiment by Dail et al. (2009),
where 3-6 % of the applied 15N was retrieved in living plant biomass but 20-25 % in
twigs, branches and bark, of which the latter was also suggested to occur through
physicochemical adsorption processes. So, mature forest trees may retain more N than
saplings due to their higher bark surface area, but possibly also due to microbial activity
or the presence of epiphytic lichens, which have been shown to occur mainly on older
trees (Fritz et al., 2008; Ranius et al., 2008). Nitrogen assimilation by epiphytic lichens
may contribute significantly to total canopy retention in coniferous forests (Lang et al.
1976; Johansson et al. 2010), although this fate was estimated to amount to only 5% of
the applied 15N for a spruce-fir forest (Friedland et al., 1991). Nitrogen uptake by lichens
has yet not been assessed for deciduous stands.
4.5.2 Throughfall water
In several throughfall studies a reduced concentration of inorganic N was found in
throughfall water compared to precipitation, indicating N retention by the canopy (Parker
1983; Neary and Gizyn 1994; Lovett et al. 1996). However, this canopy N retention is
often obscured by the wash off of dry deposition, resulting in a positive NTF. This was
also observed in the present experiment, except for beech and oak during the leaf
development period (Fig. 4.5). The quantification of 15NH4+ and 15NO3
- retention by
foliage and twigs and the concentrations of 15N in the throughfall water allowed for
discrimination between canopy retention from wet deposition and dry deposition. To our
knowledge, only the analogous studies of Brumme et al. (1992) and Eilers et al. (1992)
for beech and spruce and the study of Umana and Wanek (2010) in tropical rainforest
have accomplished this previously.
74

Canopy retention of dissolved inorganic N
Based on the calculated NTF of 15N, we should have retrieved 42 % of the applied NH4+
and 1 % of the applied NO3- in foliage and twigs. This was confirmed by the 15N analysis
in plant tissue for NO3-. For NH4
+, in contrast, only 1-3 % of the applied 15NH4+ was
detected in leaves and twigs, leaving ca. 40 % NH4+ not accounted for. Similarly,
Brumme et al. (1992) for beech and Umana and Wanek (2010) for tropical forest reported
a difference of 15 % and 25.8 %, respectively, between 15N retrieved in plant parts and
the estimated value based on NTF. Several possible fates can be put forward to explain
the difference between the calculated NTF and the actual retention values of 15N. Firstly,
N adsorbed to the plant surfaces, especially NH4+ could be washed off by rinsing solution
(distilled water or KCl). Analysis of the rinsing water, however, explained only 2.8 % of
the missing 15NH4+ (see 4.7. Appendix). Secondly, the N assimilated by the leaves may
partly have been transported to stems and roots during the 2 h before they were harvested.
After 72 h, Gessler et al. (2002) retrieved 15NH3 taken up by adult spruce trees in plant
parts at 17 cm distance from the fumigation chambers. After 24 h, however, this distance
was only 5.5 cm. Therefore, we assume that transport of N assimilated into amino
compounds is negligible after 2 h. Thirdly, gaseous losses of NH3 from the canopy to the
atmosphere can occur. Significant NH3 emission from evaporating water layers to the
atmosphere has been observed if atmospheric NH3 concentrations are low (Rennenberg
and Gessler 1999). Fourthly, dissolved inorganic N may convert rapidly into dissolved
organic N within tree canopies, which is then released to the throughfall water (Gaige et
al. 2007; Wu et al. 2010). Since the last two pathways were not measured in this study,
the relative magnitude of these sinks remains to be investigated. In addition, the 15NH4+
retrieved in leaves and twigs was significantly correlated with the NTF of 15NH4+. Yet,
the low correlation coefficient indicates that losses during the experiment vary among tree
species and phenological periods.
We observed a significant correlation between 15NH4+ uptake and NTF of K+, Mg2+ and
Ca2+ during the fully leafed period. Uptake of NH4+ and H+ in tree canopies is usually
considered as an ion exchange process, accompanied by the release of base cations, which
is necessary to maintain the ionic balance within the leaf (Staelens et al. 2008). Several
studies have indicated a relationship between the loss of NH4+ (Stachurski and Zimka
2002; Umana and Wanek 2010) or H+ (Schaefer et al. 1988; Lovett et al. 1996; Chiwa et
al. 2004) and the leaching of base cations in throughfall water. This is supported by the
relationship found in this study. Since NTF fluxes comprise the sum of wash off of dry
75

Chapter 4
deposition and canopy exchange processes, the relationship observed in this study may be
obscured by K+, Mg2+ and Ca2+ present on the plant surface prior to the experiment. For
K+, canopy leaching is the main mechanism of enrichment in throughfall water (Houle et
al. 1999; Staelens et al. 2007), while for Ca2+ and Mg2+ dry deposition has been estimated
to contribute up to 38 and 25 % during the growing season for an adult beech tree
(Staelens et al. 2007). The NTF of the summed base cations exceeded by far the measured 15NH4
+ uptake by leaves and twigs, indicating that base cation leaching was caused by
factors in addition to NH4+ uptake. Previous research attributed base cation leaching
partly to the leaching of weak organic acids (Chiwa et al. 2004; Zhang et al. 2006;
Staelens et al. 2007). This was also observed in the present study. Furthermore, 15NH4+
uptake was also related to NTF of WA during leaf development and the fully leafed
period, supporting the hypothesis that canopy uptake of NH4+ is related to the difference
between canopy leaching of base cations and WA.
No relationship between NTF of base cations and 15NH4+ uptake was observed during leaf
senescence and the leafless period. Several explanations can be put forward to explain
this lack of correlation. During the leafless period, the positive NTF of K+ and Ca2+ can
be attributed to wash off of dry deposition and leaching from twigs and branches (Levia
and Herwitz 2002); the NTF of Mg2+ is considered to be only due to wash off of dry
deposition (Levia and Herwitz 2002; Staelens et al. 2007). Furthermore, it is likely that
NH4+ is mainly adsorbed to the negatively charged plant surface during the leafless
period, as discussed above, and is not exchanged for base cations. During leaf senescence,
passive diffusion might be more important for NH4+ uptake than ion exchange. Firstly, the
N content, which is a proxy for leaf apoplast NH4+ concentrations (Schjoerring et al.
1998), of senescing leaves decreases compared to fully developed leaves, thereby
increasing the concentration gradient between the leaf and rainwater. Secondly, the
contact surface between the leaf and the rainwater, defined as leaf wettability, increases
significantly during leaf senescence (Chapter 2). However, it is important to further assess
the relationship between NH4+ uptake and base cation leaching under varying NH4
+
deposition levels, since increasing NH4+ deposition will likely increase NH4
+ uptake
(Schaefer et al. 1988), and for rain events with different intensity and duration.
76

Canopy retention of dissolved inorganic N
4.6 Conclusion
This study demonstrated that dissolved inorganic N retention by foliage and twigs of tree
saplings amounts to 1-3 % of the N in incident precipitation and is significantly
influenced by N form, tree species, leaf phenology and the applied NO3- to NH4
+ ratio.
The observed canopy N retention patterns were mainly determined by the foliage for the
deciduous species. For Scots pine, twigs were more important. Yet, the rinsing
experiment indicated that the observed 15NH4+ enrichment of the twigs could mainly be
attributed to adsorption to the woody plant surface rather than assimilation. Furthermore,
the amount of 15NH4+ retrieved in plant material could not fully explain the loss of 15N
between the artificial rainwater and throughfall water, indicating that other possible sinks
exist, which should be investigated in further research. Measured 15NH4+ retention by
foliage and twigs was significantly correlated with base cation leaching during the leaf
development and fully leafed period but not during the period of leaf senescence and the
leafless period, indicating that different processes might prevail in different phenological
periods. We conclude that, for the studied tree species, N is mainly assimilated by foliage,
although a large amount of N can be temporally adsorbed to woody parts of the canopy.
Further research should focus on assessing the relationship between throughfall
measurements and N canopy retention for other tree species, tree ages and varying N
deposition levels. Given the small amount of biological or physiological uptake measured
in this study, the contribution of canopy N uptake from wet deposition to forest
productivity is likely to be small. The contribution of canopy N uptake from gaseous
deposition still remains to be assessed.
77

Chapter 4
4.7 Appendix: Supplementary experiment
4.7.1 Aims and description
Since during the experiment conducted in 2008 a large amount of the applied 15NH4+
could not be retrieved in throughfall water and plant material (see 4.4.3), the 15N spraying
experiment was repeated on beech twigs only in June 2010. The aim of this experiment
was to assess (i) if the “lost 15NH4+” could be attributed to the rinsing of leaves and twigs
after the experiment and (ii) if this rinsing loss is affected by the type of rinsing solution,
i.e. distilled water, KCl or a non-labelled rainwater solution.
For this experiment 3-year-old beech saplings were used of the same provenance as in
2008. They were planted on 16 March 2010 in a 1:1 mixture of river sand (1-5 mm) and
sandy soil from a mature Corsican pine stand (20-100 cm depth). The saplings were also
placed at a wind sheltered location in the close vicinity of the laboratory near Ghent
(north of Belgium, approximately 60 km from the North Sea in the prevailing wind
direction; 50°58 N, 3°49 E).
Similar to the experiment conducted in 2008, twelve foliated beech twigs were selected
and sprayed with the low NO3- to NH4
+ ratio treatment (only 15N-labeled NH4+), after
which the throughfall solution was collected. After harvesting, one-third of the treated
beech twigs was rinsed with deionised water, one-third with 0.05 M KCl and one-third
with an unlabeled artificial rainwater solution and subsequently the rinsing solution was
collected. Plant material and water samples were analysed as described in 4.3.2.2. and
4.3.2.3.
4.7.2 Results
Foliar 15NH4+ retention did not differ between the three different rinsing methods (results
not shown; p = 0.22). Average NH4+-N concentrations of the rinsing water collected in
2010 were 1.22 ± 3.15 µg N g-1 DM for deionised water, 10.40 ± 7.74 µg N g-1 DM for
KCl and 32.24 ± 4.08 µg N g-1 DM for the artificial rainwater solution, with an average 15N enrichment of 8.24, 4.29 and 1.45 atom %, respectively. This resulted in an average 15N recovery of 0.5, 1.3 and 1.8 % for deionised water, KCl and artificial rainwater,
respectively (Fig. 4.7). No significant differences in 15NH4+ concentration were found
between the three different rinsing methods (p = 0.966).
78

Canopy retention of dissolved inorganic N
79
Distilled water KCl Artificial rainwater0
10
20
30
40
15 N
H4+ (
µg N
g D
M-1)
Foliage + twigsThroughfall waterRinsing water
15N applied
Fig. 4.7 Average 15NH4+ (µg N g DM-1) retrieved in leaves + twigs, throughfall water and
rinsing water compared with the 15NH4+ applied to foliated beech twigs


5 Throughfall deposition and canopy exchange processes along avertical gradient within the canopy of beech and Norway spruce
After: Adriaenssens S, Hansen K, Staelens J, Wuyts K, De Schrijver A, Baeten L, Boeckx P, Samson R, Verheyen K. Throughfall deposition and canopy exchange processes along a vertical gradient within the canopy of beech (Fagus sylvatica L.) and Norway spruce (Picea abies (L.) Karst.). Science of the Total Environment 420, 168-182
5.1 Abstract
To assess the impact of air pollution on forest ecosystems, the canopy is usually
considered as a constant single layer in interaction with the atmosphere and incident
rainwater, which could influence the measurement accuracy. In this study the variation of
througfall deposition and derived dry deposition and canopy exchange were studied along
a vertical gradient in the canopy of one European beech (Fagus sylvatica L.) tree and two
Norway spruce (Picea abies (L.) Karst) trees. Throughfall and net throughfall deposition
of all ions other than H+ increased significantly with canopy depth in the middle and
lower canopy of the beech tree and in the whole canopy of the spruce trees. Moreover,
throughfall and net throughfall of all ions in the spruce canopy decreased with increasing
distance to the trunk. Dry deposition occurred mainly in the upper canopy and was
highest during the growing season for H+, NH4+, NO3
- and highest during the dormant
season for Na+, Cl-, SO42- (beech and spruce) and K+, Ca2+ and Mg2+ (spruce only).
Canopy leaching of K+, Ca2+ and Mg2+ was observed at all canopy levels and was higher
for the beech tree compared to the spruce trees. Canopy uptake of inorganic nitrogen and
H+ occurred mainly in the upper canopy, although significant canopy uptake was found in
the middle canopy as well. Canopy exchange was always higher during the growing
season compared to the dormant season. This spatial and temporal variation indicates that
biogeochemical deposition models would benefit from a multilayer approach for shade-
tolerant tree species such as beech and spruce.
81

Chapter 5
5.2 Introduction
During the last decades, atmospheric deposition of pollutants such as nitrogen dioxide
(NO2), ammonia (NH3) and sulphur dioxide (SO2) on forest ecosystems has dramatically
increased due to anthropogenic activities. Reduced emissions have again decreased the
deposition of SO2 during the last decade. By means of deposition monitoring it is possible
to (a) estimate deposition effects, (b) determine ecosystems at risk, (c) evaluate temporal
and spatial trends, and (d) develop numerical models (Erisman et al. 1994). Wet
deposition can be measured with wet-only or bulk precipitation collectors (Staelens et al.
2005). Methods to measure dry deposition can be divided in two categories, i.e.
micrometeorological techniques such as the eddy correlation and the gradient method and
surface wash techniques such as the throughfall method (Draaijers et al. 1997; see
Chapter 6 for an overview), which each have their advantages and drawbacks. For long
term monitoring programmes preferably throughfall measurements are used (de Vries et
al. 2003), although here a distinction needs to be made between dry deposition and
canopy exchange (Parker 1983).
One major drawback of the currently used deposition methods is the assumption that
forest canopies consist of a homogenous array of components or one “big leaf”, which is
in contact with homogenous throughfall water (Schaefer et al. 1988) or with
homogenously distributed gaseous compounds. However, several arguments suggest that
dry deposition and canopy exchange processes are likely to vary along a vertical gradient
in a tree canopy. Firstly, foliar nitrogen (N) content per leaf area (NA, g N m-2), stomatal
conductance and photosynthetic capacity strongly increase with height due to increasing
light availability (Niinemets 2007; Eensalu et al. 2008). In addition, leaf wettability, i.e.
water repellence by the leaf surface, decreased from the bottom to the top of a red spruce
(Boyce et al. 1991) and European beech (Van Wittenberghe 2009) canopy. Dry
deposition processes were found to be affected by surface wetness chemistry, wettability
and stomatal opening (Erisman and Draaijers 2003). Differences in leaf wettability and
physiological activity (determined by processes such as photosynthesis rate, transpiration
and respiration) between tree species and phenological stages have been related to
accelerated canopy leaching of K+ and Mg2+ (Tukey 1970; Fritsche 1992) and enhanced
canopy uptake of NH4+ and NO3
- (Eilers et al. 1992; Sase et al. 2008; Chapter 2).
Secondly, throughfall water is likely to be enriched for most elements on its way through
82
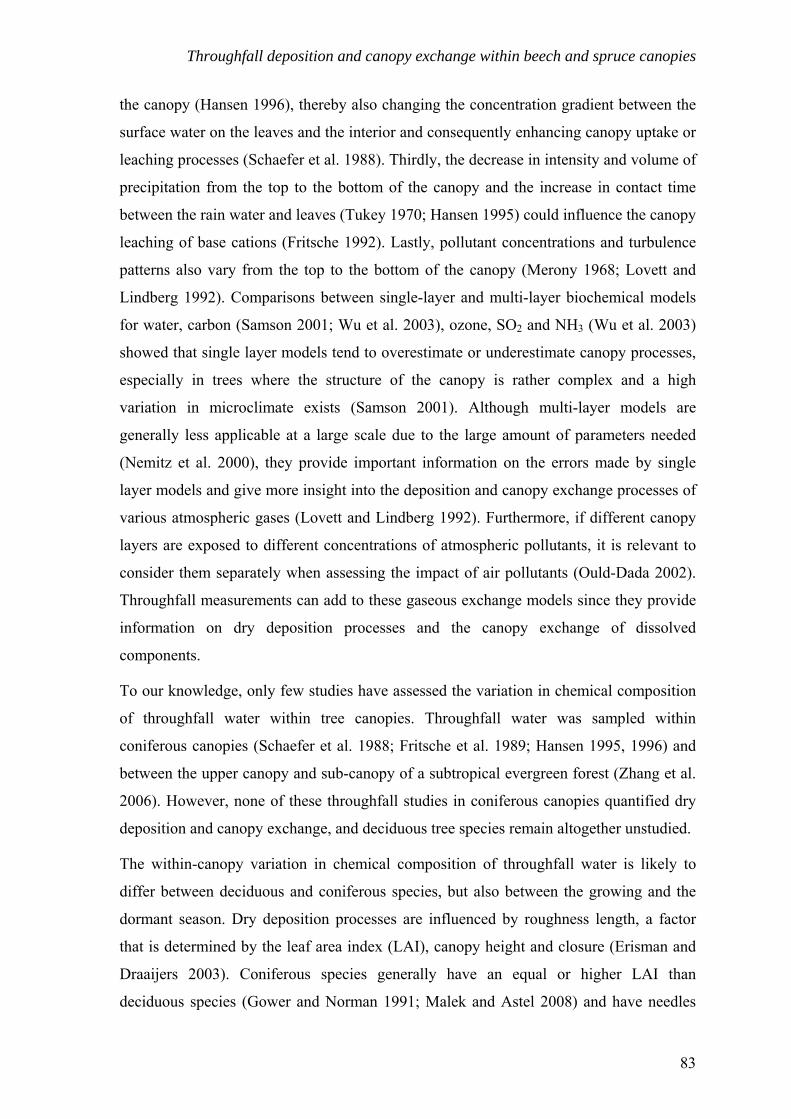
Throughfall deposition and canopy exchange within beech and spruce canopies
the canopy (Hansen 1996), thereby also changing the concentration gradient between the
surface water on the leaves and the interior and consequently enhancing canopy uptake or
leaching processes (Schaefer et al. 1988). Thirdly, the decrease in intensity and volume of
precipitation from the top to the bottom of the canopy and the increase in contact time
between the rain water and leaves (Tukey 1970; Hansen 1995) could influence the canopy
leaching of base cations (Fritsche 1992). Lastly, pollutant concentrations and turbulence
patterns also vary from the top to the bottom of the canopy (Merony 1968; Lovett and
Lindberg 1992). Comparisons between single-layer and multi-layer biochemical models
for water, carbon (Samson 2001; Wu et al. 2003), ozone, SO2 and NH3 (Wu et al. 2003)
showed that single layer models tend to overestimate or underestimate canopy processes,
especially in trees where the structure of the canopy is rather complex and a high
variation in microclimate exists (Samson 2001). Although multi-layer models are
generally less applicable at a large scale due to the large amount of parameters needed
(Nemitz et al. 2000), they provide important information on the errors made by single
layer models and give more insight into the deposition and canopy exchange processes of
various atmospheric gases (Lovett and Lindberg 1992). Furthermore, if different canopy
layers are exposed to different concentrations of atmospheric pollutants, it is relevant to
consider them separately when assessing the impact of air pollutants (Ould-Dada 2002).
Throughfall measurements can add to these gaseous exchange models since they provide
information on dry deposition processes and the canopy exchange of dissolved
components.
To our knowledge, only few studies have assessed the variation in chemical composition
of throughfall water within tree canopies. Throughfall water was sampled within
coniferous canopies (Schaefer et al. 1988; Fritsche et al. 1989; Hansen 1995, 1996) and
between the upper canopy and sub-canopy of a subtropical evergreen forest (Zhang et al.
2006). However, none of these throughfall studies in coniferous canopies quantified dry
deposition and canopy exchange, and deciduous tree species remain altogether unstudied.
The within-canopy variation in chemical composition of throughfall water is likely to
differ between deciduous and coniferous species, but also between the growing and the
dormant season. Dry deposition processes are influenced by roughness length, a factor
that is determined by the leaf area index (LAI), canopy height and closure (Erisman and
Draaijers 2003). Coniferous species generally have an equal or higher LAI than
deciduous species (Gower and Norman 1991; Malek and Astel 2008) and have needles
83

Chapter 5
present throughout the whole year, compared to only the leafed period for deciduous
species. Moreover, leaf wetness and stomatal opening are absent for deciduous species
during winter, but also vary significantly for coniferous trees (Neirynck and Ceulemans
2008). Along a vertical gradient, the variation in physical, physiological and chemical
leaf characteristics will vary between deciduous and coniferous species due to their
different leaf longevity (one leafed period vs multiple years) (Niinemets 2007).
In the present study, we determined the amount and chemical composition of throughfall
water throughout the year within the canopy of a European beech (Fagus sylvatica L.)
tree in Belgium and included the data of an earlier study in the canopy of two Norway
spruce (Picea abies (L.) Karst) trees in Denmark (Hansen 1996). We applied a canopy
budget model (Draaijers and Erisman 1995) to the throughfall data of both studies in
order to distinguish the processes of dry deposition and canopy exchange. Based on the
literature reviewed above, we hypothesized that within one species (i) dry deposition is
highest in the upper canopy but canopy exchange is highest in the lower canopy and (ii)
dry deposition and canopy exchange fluxes will differ between the growing season and
winter. Furthermore, without testing this statistically, we expect that (iii) the lower
canopy contributes more to dry deposition and canopy exchange in the cone-shaped
spruce trees than in the beech tree where the highest leaf area density is found in the
upper canopy (Fleck 2001; Samson 2001) and (iv) differences between the growing
season and winter will be larger for beech than for spruce due to the absence of leaves
during winter.
5.3 Materials and methods
5.3.1 Site description
Part of the study was conducted in the Aelmoeseneie forest (50°58.5’N, 3°48’E, 16 m
a.s.l.), which is a mixed deciduous forest located near Ghent in northern Belgium,
approximately 60 km from the North Sea. Climate variables are the same as in Chapter 2-
4 (see 2.3.1). The region of Ghent is characterized by high atmospheric N and sulphur (S)
deposition. In 2002-2006, average annual throughfall deposition fluxes to the forest stand
amounted to 24 kg N ha-1 yr-1 and 20 kg S ha-1 yr-1 (Verstraeten et al. 2008).
The studied tree was located in a stand dominated by pedunculate oak (Quercus robur L.)
and European beech. Mean stand basal area was 30 m2 ha-1 and mean tree height was 25
84

Throughfall deposition and canopy exchange within beech and spruce canopies
m in 2007 (Verstraeten et al. 2008) and LAI was 5.52 in 1996 (Mussche et al. 2001). The
stand is located on a poorly drained sandy loam soil containing a partly degraded B
horizon and a clay substrate at 60 cm depth (Haplic Glossudalf) (Roskams et al. 1997).
The studied beech tree was 29 m high with a diameter at breast height (dbh) of 64 cm and
standing next to a measuring tower. Crown length and width were 21 and 13.42 m,
respectively. The tree was foliated from 15 April 2009 until 19 November 2009 and from
9 May 2010 until 10 November 2010. The leafed and leafless period will subsequently be
referred to as the growing and the dormant season to use the same terminology as for
spruce. Within the growing season, three phenological periods were visually determined,
i.e. leaf development, fully leafed and leaf senescence period.
The second part of the study was performed in an even-aged Norway spruce stand (74
years old at the study time) at Klosterhede Plantation (56°29’N, 8°24’E, 27 m a.s.l.) near
Lemvig in the western part of Jutland, Denmark. The annual precipitation and
temperature at the time of the study were 860 mm and 8.3°C, respectively. The mean total
throughfall deposition (1988-1992) was approximately 23 kg N ha-1 yr-1 and 33 kg S ha-1
yr-1. The forest is located 15 km from the North Sea coast and dominated by relatively
strong, westerly winds, which resulted in high deposition of sea salt. The soil type is a
Typic Haplorthod (podzol) developed on the sandy, nutrient poor deposits of an outwash
plain (Hansen et al. 1995). The mean leaf area index, tree height and dbh were 4.8 m2 m-2,
20 m and 21.9 cm, respectively (Beier et al. 1993a).
The study was conducted in two spruce trees of 18 m height with a dbh of 23 cm. Crown
length and width were 9 and 3.6 m for tree A and 8 and 3.0 m for tree B, respectively.
Since Na+ in throughfall water mainly originates from dry deposition (Ulrich 1983) and
K+ from the leaching of physiologically active canopy components (Tukey 1970), the K+
to Na+ ratio in the throughfall water can indicate the start and end of the growing period
in coniferous stands. For the spruce stand the growing period derived in this way was
from 8 May to 18 November 1993.
5.3.2 Data collection
5.3.2.1 Water fluxes and plant material
In Belgium, throughfall in the beech canopy could be measured using a 35-m high open
tower with platforms at every 7 m. At 1.5, 15, and 22 m each, six funnels with a
collecting area of 0.0460 m2 were installed on two rails attached to the measuring tower
85

Chapter 5
(Fig. 5.1). Two additional funnels were installed in the top of the canopy at 28 m. Above
the canopy, at 36 m height, two similar funnels collected bulk precipitation. Placement of
the rails was mainly constrained by the branch structure. We did not organize the funnels
according to a spatial pattern around the stem, since the spatial variability of throughfall
deposition under beech is mainly determined by canopy structure (Staelens et al. 2006),
rather than by the distance from the stem. Care was taken not to place funnels below each
other to avoid the influence of an upper funnel on the water volume of a lower one. In
each funnel, a nylon 1-mm wire mesh was placed to minimize sample contamination by
organic material. The throughfall water was led through black polyethylene tubes to the
nearest platform where it was stored in polyethylene 5-L bottles in a wooden box to
protect the samples from heat and sunlight. Stemflow was collected through a spiral
gauge around the stem at 2 m above ground level and was led into three connected 200-L
barrels at the ground level. All samples were collected every fortnight from 22 April 2009
to 21 May 2010. Funnels, wire meshes and bottles were replaced by equipment rinsed by
demineralised water. Additionally, on several heights along the beech canopy (3.5, 8,
10.5, 15, 17.5, 22, 24.5 and 28 m), four twigs per height were collected on 9 June 2011
for the analysis of leaf N content.
In Denmark, data collection took place during 1992 and 1993 and has been thoroughly
described by Hansen (1995, 1996). Horizontal girders were mounted at four levels (9.5,
11, 13 and 15 m above the ground where the lowest level was beneath the canopies) of an
18-m high tower located in between the two study trees (Fig. 5.1). The girders pointed
towards the trunks of two trees (A and B). The girders were displaced in relationship to
each other in order to avoid influence of a layer on its underlying layer. On the horizontal
girders, 25 polyethylene funnels were installed at four distances from the trunks (0.1, 0.5,
0.9 and 1.3 m). Here, the funnels were installed in a specific spatial pattern (Fig. 5.1)
since earlier research pointed to typical spatial variation in spruce forests (Beier et al.
1993b). The funnels had collecting areas of 0.0200 m2. Two filters (mesh sizes of 1 and
0.3 mm) were placed in the funnels. One additional funnel was mounted in the top of the
tower above the forest to collect bulk precipitation. The throughfall water was led through
black polyethylene tubing to the ground where it was sampled in polyethylene bottles,
stored in thermo-boxes which were placed in soil pits to protect the samples from heat
and sunlight. From January 1992 to January 1994 sampling was performed approximately
every fortnight, or when enough water was available for chemical analyses. The data
86

Throughfall deposition and canopy exchange within beech and spruce canopies
analysis in Hansen (1996) was restricted to 270 days in 1993, so the annual fluxes are
presented here for the first time. The throughfall data of 1993 were used, since these had
the least missing data.
-10 -5 0 5 10Distance (m)
-10
-5
0
5
10
Dis
tanc
e (m
)
Tree trunksCrown projectionTowerThroughfall collector 0 mThroughfall collector 21 mThroughfall collector 14 mThroughfall collector 28 m
-4 -2 0 2-4
-2
0
2 b
a
A B
Fig. 5.1 Orthogonal overview (a) and detail (b) of the experimental set-up in the beech canopy (left side) and orthogonal view (top figure) and side-view of the set-up in the spruce canopy (right side; copyright iStockphoto & DeGarmo Creative)
5.3.2.2 Chemical analysis
Immediately after collection, sample volumes were determined and subsamples were
stored at 4°C for chemical analysis. Water samples for the Belgian site and H+, NO3-,
SO42-, PO4
3-, and Cl- for the Danish site were analysed as described in Section 4.3.2.3.
NH4+ concentrations for the Danish site were assessed by continuous flow colorimetry on
an autoanalyser, while K+, Ca2+, Mg2+, and Na+ were determined by flame emission
spectrophotometry. Leaf material from the beech tree was dried at 70°C for 24 h, grinded,
and analysed for total N content after total destruction (modified Kjeldahl method).
The quality of the analysed water samples was validated by checking the ion balance, the
Na+ to Cl- ratio and by comparing the measured electric conductivity with a calculated
electric conductivity. Next to this, samples of which the PO43- concentration was 50 %
higher than those of the surrounding collectors were excluded from further analysis since
87

Chapter 5
contamination by bird droppings was expected then. Missing data (e.g. wind-blown
funnels) or rejected samples (3.8 %) for the Belgian site were estimated by the average of
four products between the value of a nearby collector and the ratio of the missing
collector to this nearby collector in a previous or subsequent collection time. For the
Danish site, missing data (13.7 %) were estimated by regression analysis of throughfall
water amount or ion concentration between the missing collector and the collector with
which it had the highest Pearson correlation.
5.3.3 Data analysis
5.3.3.1 Ion fluxes
Biweekly bulk deposition (BD; mmolc m-2) above the canopy and throughfall deposition
(TF; mmolc m-2) and stemflow deposition (SF, mmolc m-2) for each collector within the
canopy were calculated by multiplying the ion concentration with the collected volume
divided by the collecting area. Stemflow volume of the whole beech tree was calculated
by multiplying the collected volume with the surface area of the orthogonal canopy
projection, determined to be 149 m2. Weak acids (WA; mmolc m-2) in throughfall and
bulk deposition were estimated from the difference between the sum of cations and the
sum of anions. Net throughfall fluxes (NTF) were calculated as the difference between
throughfall and bulk deposition. The contribution of SF to TF+SF for the beech canopy
was low (see 5.4.1), and therefore not included in the NTF calculations.
5.3.3.2 Canopy budget modelling
The NTF of an ion is defined as the difference between TF and BD, and equals the sum of
dry deposition (DD) and canopy exchange (CE; mmolc m-2).
NTF TF BD DD CE= − = + (5.1)
A distinction between the importance of these processes for the growing and the dormant
season is made by means of a modified canopy budget model developed by Draaijers and
Erisman (1995). Various approaches of this model have been reported, of which an
overview is given in Chapter 7. Here, two particular approaches were chosen that are
justified in the following Section and in Section 5.5.5. Positive CE represents canopy
leaching (CL) and negative canopy uptake (CU). However, when we refer to CL or CU
specifically, positive values are used. Furthermore, the calculated CU and CL gives no
information on the actual sinks and processes involved (Chapter 4) and therefore the term
88

Throughfall deposition and canopy exchange within beech and spruce canopies
“canopy retention” would be more appropriate. However, to be in line with literature, the
terms CU and CL are kept in this Chapter 5-7.
In the canopy budget model, a filtering approach is used to estimate the DD of base
cations (K+, Ca2+ and Mg2+) (Ulrich 1983). In this approach, aerosols containing base
cations are assumed to be deposited with equal efficiency to the forest canopy as particles
containing an inert tracer ion. This tracer ion is assumed not to be subject to canopy
leaching. Na+ is considered most suitable as tracer ion but also Cl- and SO42- have been
used in the past, although they may overestimate DD of base cations if significant
gaseous deposition of HCl or SO2 occurs (Staelens et al. 2008). Because of the assumed
negligible canopy exchange, the DD of Na+, Cl- and SO42- equals their NTF. The DD of a
base cation X (DDX) is then calculated as:
. tracer ionX X
tracer ion
NTFDD BDBD
= (5.2)
Sodium was used as a tracer ion for the beech canopy; however, SO42- was chosen for the
spruce canopy for the following reasons. Firstly, NTF of Na+ under the spruce canopy
was found to be rather high (see 5.4.2) due to the close proximity of the sea (15 km). It
was shown by Ten Harkel (1997) that the diameter of Na+ particles close to the sea is
significantly larger (20 µm) than for base cations in general (1.6-7.7 µm; Ruijgrok et al.
1997) and as such are deposited more easily (Gallagher et al. 1999). Therefore, Na+ was
not a reliable tracer to estimate DD to the spruce canopies. Secondly, chloride depletion
of NaCl particles with the formation of gaseous HCl is a significant process in coastal
areas (Ten Harkel 1997), excluding also Cl- as a suitable tracer ion. Thirdly, due the close
proximity to the sea SO42- aerosols contribute more to total S deposition (Lindberg and
Lovett 1992), hereby reducing the bias caused by SO2 deposition when SO42 is used as a
tracer. Canopy leaching of K+, Ca2+ and Mg2+ (CLX) was obtained from the difference
between NTFX and DDX. Canopy uptake of NH4+ (CUNH4) in the beech canopy was
estimated from the CL of base cations (CLBC) corrected for the simultaneous CL of weak
acids (CLWA).
4-BC WANH
CU CL CL+ = (5.3)
The CLWA is calculated by subtracting the DD of WA from NTF of WA. The DD of WA
is assumed to be equal to their BD, multiplied with the estimated percentage LAI above
each canopy level. In the spruce canopy, the calculated CLWA was found to be negative
89

Chapter 5
and CUNH4 was set equal to the CLBC. Several field studies (Stachurski and Zimka 2002;
Dail et al. 2009) and laboratory studies (Bowden et al. 1989; Chapter 2) have
demonstrated that forest canopies can incorporate NO3-, but that preferentially NH4
+ is
retained. De Vries et al. (2001) suggested to calculate the CU of NH4+ and NO3
- based on
the TF of NH4+ and NO3
-, using an efficiency factor of NH4+ vs NO3
- uptake (xNH4) with
a proposed value of six:
( )-
4-
4 3
4
4
4
.
.NH NO
NH NONH
3xNH TF TF
CUxNH TF
+
+
+
+
++
+= (5.4)
To maintain the charge balance, CU of H+ was set equal to the uptake of NO3- (Stachurski
and Zimka 2002; Staelens et al. 2008). Dry deposition of NH4+, NO3
- and H+ were
calculated as the difference between NTF and CE.
5.3.3.3 Statistical analysis
For each tree species the canopy level, precipitation volume and sampling time were
related to the biweekly TF and NTF by means of a generalized additive mixed model. An
additive model applies a smoothing method to model a non-linear relationship between
the response variable and one or more explanatory variables, in this case the sampling
time and the precipitation volume. This approach was chosen over an ANOVA repeated
measures analysis because of the non-linear nature of throughfall data over time.
Furthermore, in a repeated measures ANOVA analysis we would need to pool the data
points per month in order to have sufficient power (Von Ende 2001), thereby removing
relevant information on the bi-weekly variation. The factor “canopy level” was added to
the model as a parametric term. Since the distance to the trunk affects the TF in Norway
spruce stands (Beier et al. 1993b), this variable was also added to the spruce model. The
use of a mixed model allowed the inclusion of the random factor “collector” for beech
and “tree” for spruce in the model (since by the interaction of canopy level and distance
to the trunk all collectors within one spruce tree were already captured). Data were log
transformed to obtain homogeneity of variance for the model residuals. We used the mgcv
package (Wood 2006) in R version 2.11.1 statistical software (R Development Core Team
2010), in which splines are used to fit a smoothing curve through the data without
defining the functional form and the amount of smoothing in advance. The explanatory
variable is divided in several segments, where a polynomial function is fit to the data.
Where the different segments connect, a regression spline ensures that the different
90

Throughfall deposition and canopy exchange within beech and spruce canopies
polynomial functions connect smoothly by imposing criteria on the function derivatives.
We used a thin plate regression spline, which involves high order derivates (Wood 2003).
The optimal amount of smoothing, defined by the number of segments, is determined
automatically by minimizing the generalised cross-validation criterion. A Bonferroni
post-hoc test was performed to assess the differences between the canopy levels.
We assessed the influence of leaf phenology (i.e., leaf development, fully leafed, leaf
senescence and leafless periods) on the average NTF per canopy level in the beech tree by
applying a linear mixed model (nlme package; Pinheiro et al. 2011) with phenological
stage and canopy level as fixed effects and collector as random effect to account for the
repeated observations on the same collector. Next, a similar linear mixed model was used
both for the beech and spruce data to assess the effect of season (growing vs dormant),
canopy level and distance to the trunk (spruce only) on the calculated DD and CE
(multcomp package; Hothorn et al. 2008). Prior to that, DD and CE at the highest canopy
level were tested to be significantly different from zero with a t test. Differences in leaf N
content between canopy levels were assessed by means of a one-way ANOVA. The
significance of differences between the levels of each factor was tested by means of
Tukey’s honestly significant difference test.
5.4 Results
5.4.1 Bulk deposition, throughfall deposition and leaf N content
The annual precipitation to the beech and the spruce canopy was 647 and 693 mm,
respectively, of which 40 and 31 %, respectively, was evaporated after interception by the
canopy (Table 5.1). The stemflow volume for beech amounted to 2 % of the total
precipitation volume. The highest interception loss occurred in the top canopy layer and
amounted to 22 % for beech (between 28 and 22 m height) and 28 % for spruce (between
bulk deposition and 15 m) (Table 5.1). Although this trend was the same for the growing
and the dormant season, the total interception for beech was higher in the growing period
(50 %) than in the dormant period (26 %). For spruce the total interception was the same
in both seasons (data not shown).
91

Chapter 5
Table 5.1 Annual bulk deposition (BD), throughfall (TF) and stemflow (SF) (in mm yr-1 for water volume and mmolc m-2 yr-1 for ion fluxes) and TF/BD ratio at different heights (m) in the canopy of one beech and two spruce trees
BD TF at canopy height (m) SF TF/BD at canopy height (m) SF/ Beech 28 22 15 1.5 28 22 15 1.5 (TF+SF) Volume 647 590 446 351 401 14.4 0.91 0.69 0.54 0.62 0.03 H+ 1.20 0.31 0.34 0.19 0.24 0.20 0.26 0.28 0.16 0.20 0.45 NH4
+-N 42.2 44.7 57.7 59.0 72.3 3.15 1.06 1.37 1.40 1.71 0.04 Cl- 31.1 67.7 72.5 73.9 86.9 2.48 2.18 2.34 2.38 2.80 0.03 NO3
--N 21.5 35.3 32.2 34.6 34.7 1.61 1.65 1.50 1.61 1.61 0.04 SO4
2--S 24.3 83.4 75.0 91.2 114 3.06 3.43 3.08 3.74 4.67 0.03 K+ 2.5 27.6 67.7 70.8 94.7 1.96 11.0 27.0 28.2 37.7 0.02 Na+ 25.1 53.3 53.3 52.3 58.1 1.87 2.13 2.13 2.08 2.32 0.03 Ca2+ 18.0 40.1 38.9 48.5 63.3 1.11 2.22 2.16 2.69 3.51 0.02 Mg2+ 7.1 18.5 20.2 25.2 32.1 0.39 2.60 2.84 3.54 4.51 0.01 WAb 17.8 3.76 51.8 50.7 77.4 1.48 0.21 2.90 2.84 4.34 0.02 Sprucea 15 13 11 9.5 15 13 11 9.5 Volume 693 496 557 488 476 n.a. 0.72 0.80 0.70 0.69 n.a. H+ 26.7 11.9 8.70 7.33 8.26 n.a. 0.44 0.33 0.27 0.31 n.a. NH4
+-N 21.3 24.0 29.0 32.2 35.9 n.a. 1.13 1.37 1.52 1.69 n.a. Cl- 137 379 486 522 530 n.a. 2.76 3.54 3.80 3.86 n.a. NO3
--N 36.8 42.4 42.1 47.3 61.4 n.a. 1.15 1.15 1.29 1.67 n.a. SO4
2--S 98.5 116 158 163 184 n.a. 1.17 1.61 1.66 1.86 n.a. K+ 4.03 46.9 55.8 68.4 71.6 n.a. 11.7 13.9 17.0 17.8 n.a. Na+ 88.5 308 403 448 440 n.a. 3.48 4.55 5.06 4.97 n.a. Ca2+ 7.02 24.3 31.3 37.5 41.7 n.a. 3.46 4.45 5.34 5.93 n.a. Mg2+ 23.7 67.2 91.8 99.7 104 n.a. 2.84 3.88 4.21 4.40 n.a. WAb 0 0 0 0 0 n.a. 0 0 0 0 n.a. n.a.: not available aAverage of the two trees bWA: Weak Acids, negative values are set to zero
The bulk deposition (BD) of H+, inorganic N (NH4+ + NO3
-) and SO42--S in Belgium
(beech) amounted to 1.20, 63.7 and 24.3 mmolc m-2 yr-1, respectively, and to 26.7, 57.9
and 98.5 mmolc m-2 yr-1 in Denmark (spruce), respectively. The throughfall (TF) of all
ions except H+ and NO3- (beech only) increased with canopy depth for both species.
Consequently, the TF/BD ratio was larger than one for all ions except H+ and generally
increased with canopy depth, except for NO3- in the beech canopy where it remained
constant (Table 5.1). For H+, the TF/BD ratio in the top canopy layer was 0.26 and 0.44
for beech and spruce, respectively, and decreased slightly to 0.20 and 0.31 at the ground
level. The fraction of stemflow deposition (SF) to TF of the dissolved ions was only small
(< 4 %) beneath beech, except for H+ (45 %) (Table 5.1). Leaf N content in the beech
92

Throughfall deposition and canopy exchange within beech and spruce canopies
canopy increased significantly (p < 0.001) from 2.25 % at 28 m height to 2.67 % at 3.5 m
(Fig. 5.2).
0 2 2.2 2.4 2.6 2.8Leaf nitrogen content (%)
3
0
5
10
15
20
25
30
Hei
ght (
m)
Fig. 5.2 Leaf nitrogen content (%) at various heights in the beech canopy. Error bars represent standard error (n = 4)
Throughfall fluxes were significantly (p < 0.048) influenced by sampling time and
precipitation volume for all ions for both beech and spruce, and by canopy level for all
ions except NO3- in the beech canopy. The interaction between time and canopy level was
not significant (p > 0.07), indicating that TF at all canopy levels followed a similar
pattern over time. Consequently, parallel smoothing curves were estimated for each
canopy level, but with a different intercept. For beech (Fig. 5.3), this intercept was found
to differ significantly between TF at 22 and 1.5 m for all ions, and additionally between
22 and 15 m for H+ and Mg2+ and between 15 and 1.5 m for SO42-, K+ and Mg2+. Only for
the TF of K+, the intercepts differed significantly between 28 and 22 m in the beech
canopy. The temporal pattern indicates an increased TF during leaf senescence and the
leafless period for NH4+, H+, Cl-, SO4
2- and Na+, while higher values were found during
leaf development for K+ and WA and during leaf senescence for K+, WA, Ca2+ and Mg2+.
The TF of NO3- was lower during leaf development and approximately constant during
the rest of the year.
93

Chapter 5
-12
-10
-8-6
-4-2
log(
H)
June 2009 Sept 2009 Dec 2009 March 2010
-2-1
01
23
log(
NH
4)
1.5 m15 m22 m28 m
K+ NH4+
Na+ H+
-4-3
-2-1
01
23
log(
K)
-3-2
-10
12
3
log(
Na)
June 2009 Sept 2009 Dec 2009 March 2010 Fig. 5.3 Measured and modelled throughfall deposition (TF, log (mmolc m-2 2 weeks-1)) of K+, NH4
+, Na+ and H+ within the studied beech canopy at the ground level (1.5 m) and at different canopy levels (15, 22 and 28 m). The non-linear relationship between the log transformed TF response variable and the sampling time was modelled using a generalized additive mixed model
Throughfall increased significantly between 15 and 13 m for SO42-, K+, Na+, Ca2+ and
Mg2+ and between 13 and 11 m for K+, Ca2+ and Mg2+ in the spruce canopies (Fig. 5.4).
An increase in TF between 11 and 9.5 m was found for K+, Ca2+, SO42-, Na+ and NO3
-.
Furthermore, TF within the spruce canopies was influenced by the distance to the trunk,
but the interaction between distance to the trunk and canopy level was only significant (p
< 0.006) for the throughfall water volume, H+, NH4+ and Cl- fluxes. The water volume
decreased with canopy depth, but increased with increasing distance to the trunk. The
slope of the relationship between the water volume and distance to the trunk increased
with canopy level. In contrast, TF of NH4+ and Cl- increased with canopy depth and
decreased with increasing distance to the trunk, but here also the slope was higher for the
upper canopy levels. Throughfall deposition of H+ increased with canopy depth at 0.1 m
94

Throughfall deposition and canopy exchange within beech and spruce canopies
from the spruce trunk, but decreased with canopy depth further away from the trunk. In
general, higher TF was found during the dormant season in January 1994 for Na+, H+,
Ca2+, Mg2+, SO42- and Cl-, while for NH4
+ an increased TF was observed at the beginning
of the growing season and for K+ both at the beginning and at the end of the growing
season.
K+ NH4+
Na+ H+
-10
12
3
log(
NH
4+1)
9.5 m11 m13 m15 m
-2-1
01
23
4
log(
K)
-10
12
34
56
log(
Na)
Feb 1994 May 1994 Aug 1994 Nov 1994
-10
12
3
log(
H)
Feb 1994 May 1994 Aug 1994 Nov 1994
Fig. 5.4 Measured and modelled throughfall deposition (TF, log (mmolc m-2 2 weeks-1)) of K+, NH4
+, Na+ and H+ within the studied spruce canopy at 0.1 m from the trunk and at different canopy levels (9.5, 11, 13, and 15 m). The non-linear relationship between the log transformed TF response variable and the sampling time was modelled using a generalized additive mixed model
5.4.2 Net throughfall
Net throughfall (NTF) in the beech canopy was significantly influenced by time and
precipitation volume for all ions and influenced by canopy level for almost all ions.
95

Chapter 5
Average NTF increased significantly towards the ground level (1.5 m) for all ions other
than H+, NO3- and Na+, with a significant increase between 28 and 22 m for K+ (Fig. 5.5),
between 22 and 15 m for Mg2+ and between 15 and 1.5 m for SO42-, K+, Ca2+ and Mg2+.
The difference in NTF was significant for NH4+ between 28 and 1.5 m and for Cl-
between 22 and 1.5 m. Net throughfall of H+, NO3- and Na+ did not change significantly
after passing the canopy at 28 m.
For spruce, NTF of all ions differed according to the sampling time, precipitation volume,
canopy level and distance to the trunk (Table 5.2), but only for the volume, H+ and Cl-
deposition the interaction between canopy level and distance to the trunk was significant
(p < 0.006). The NTF patterns in the canopy were the same as for TF for all ions except
NH4+. Instead, the NTF of NH4
+ increased significantly between 15 and 13 m and
between 13 and 9.5 m.
Average NTF per canopy level of the beech tree (Fig. 5.5) differed significantly between
the phenological stages and the different canopy levels for all variables, except for the
volume and H+ where only the effect of phenological stage was significant. The
interaction between both factors was also significant for all ions except SO42-. The NTF
was generally highest during the leaf senescence period, intermediate during the leafless
period and lowest for the leaf development and fully leafed periods. This pattern was
reversed for H+ while NTF of NH4+ was highest during the leafless period (Fig. 5.5).
Net throughfall of NO3-in the upper canopy was positive and significantly different from
the negative values in the lower canopy during leaf development. Since no differences in
NTF volume were observed between the different canopy levels, this was caused by a
decrease in NO3- concentration between 28 and 22 m (data not shown). Next to this, a
negative NTF of NH4+ was detected in the upper canopy during the period of leaf
development and the fully leafed period (Fig. 5.5).
96

Throughfall deposition and canopy exchange within beech and spruce canopies
Tabl
e 5.
2 A
vera
ge b
iwee
kly
net t
hrou
ghfa
ll vo
lum
e (m
m 2
wee
ks-1
) and
net
thro
ughf
all d
epos
ition
(mm
olc m
-2 2
wee
ks -1
) at d
iffer
ent h
eigh
ts (H
, m) a
nd d
ista
nces
to th
e tru
nk in
the
cano
py o
f one
beec
h an
d tw
o sp
ruce
tree
s
Mg2+
0.
42 a
0.49
a 0.
67 b
0.93
c 2.
09 a
4.86
b
4.70
c
7.41
d
2.27
3.
3 5.
19
4.75
2.
06
2.59
5.
08
1.66
2.
23
$ Ave
rage
of t
he tw
o tre
es
Smal
l let
ters
with
in a
col
umn
and,
in c
ase
of sp
ruce
, with
in o
ne d
ista
nce
to th
e tru
nk in
dica
te si
gnifi
cant
diff
eren
ces (
p <
0.05
) bet
wee
n th
e di
ffer
ent c
anop
y le
vels
for o
ne sp
ecie
s. If
no
inte
ract
ion
was
foun
d w
ith d
ista
nce
to th
e tru
nk,
sign
ifica
nces
are
onl
y gi
ven
for 0
.1 m
to th
e tru
nk.
Ca2+
0.
81 a
0.77
a 1.
13 a
1.67
b 0.
96 a
1.65
b
1.77
c
2.86
d
0.77
1.
21
2.2
1.96
0.
77
1.05
2.
42
0.63
0.
91
Na+
1.04
1.
04
1.01
1.
22
10.7
4 a
22.1
9 b
24.9
8 b
33.3
2 c
11.2
3 15
.41
22.6
6 20
.69
9.58
11
.51
21.6
5 7.
54
9.95
K+
0.83
a 2.
42 b
2.53
b 3.
42 c
2.39
a
3.05
b
3.20
c
5.54
d
1.9
2.9
4.46
3.
62
1.82
2.
63
3.94
1.
93
2.17
SO42-
-S
2.19
a 1.
88 a
2.48
a 3.
31 b
0.41
a
3.90
b
3.19
b
6.65
c
1.31
2.
95
5.31
3.
41
2.09
2.
12
5.84
1.
41
2.14
NO
3—N
0.
52
0.4
0.49
0.
49
-0.0
2 a
0.63
a
0.55
a
0.61
b
0.59
0.
2 1.
52
-0.0
2 -0
.03
-0.0
9 0.
76
-0.2
5 0.
53
Cl-
1.36
a 1.
54 a
1.59
ab
2.07
b 11
.68 a
22
.85 b
25
.46 b
c 38
.96 c
12
.48 a
18
.29 b
24
.08 c
22
.20 b
c 11
.12 a
13
.51 a
20
.24 b
8.
61
11.6
3
NH
4+ -N
0.1
a 0.
58 ab
0.
62 ab
1.
12 b
0.02
a 0.
76 b
0.73
b
1.20
c
0.25
0.
42
1.14
0.
46
-0.0
1 0.
01
1.48
0.
08
0.24
H+
-0.0
3 -0
.03
-0.0
3 -0
.03
-1.0
4 -0
.94
-1.0
4 -0
.73
-0.4
4 b
-0.9
2 a
-0.8
9 a
-0.8
8 a
-0.8
4 b
-1.0
3 a
-0.8
2 ab
-0.8
8 -1
.02
Vol
ume
-2.1
1 b
-7.4
6 a
-10.
97 a
-9.1
2 a
-14.
66
-13.
33
-17.
04
-14.
04
-4.9
9 b
-5.9
9 ab
-9.5
2 ab
-16.
90 a
-1.0
7 b
-7.4
0 a
-8.7
1 a
-3.7
9 b
-7.2
5 a
H
28
22
15
1.5
15
13
11
9.5
15
13
11
9.5
13
11
9.5
11
9.5
D
0.1
0.5
0.9
1.3
Bee
ch
Spru
ce$
97

Chapter 5
0 2 4 6 8 10
Leaf developmentFully leafedLeaf senescenseLeafless
K+
-0.8 -0.4 0 0.4 0.8 1.2NTF (mmolc m-2 2 weeks-1)
NO3-
-0.5 0 0.5 1 1.5 2 2.5NTF (mmolc m-2 2 weeks-1)
1.5
15
22
28
1.5
15
22
28
Can
opy
leve
l (m
)
NH4+
-0.08 -0.06 -0.04 -0.02 0 0.02NTF (mmolc m-2 2 weeks-1)
H+
0 1 2 3
1.5
15
22
28
1.5
15
22
28
Can
opy
leve
l (m
)Na+
Fig. 5.5 Net throughfall deposition (NTF) with standard error of Na+, K+, NH4+, NO3
- and H+ in the beech tree as a function of canopy height for the four phenological stages considered. Error bars represent standard error
5.4.3 Dry deposition and canopy exchange
Annual dry deposition (DD) and canopy exchange (CE) at each canopy level are
presented in Table 5.3. Net throughfall fluxes of K+, Mg2+, Ca2+and H+ were mainly
determined by CE processes, while for the other ions DD was found to be more
important. The DD to the beech canopy was higher during the growing season compared
to the dormant season for K+, Ca2+, and H+, while this was reversed for Na+ (Table 5.4;
Fig. 5.6). Dry deposition of K+, Mg2+, Ca2+, Cl- and NH4+ was significantly higher at 1.5
m than at 15 m and for NH4+ also higher at 15 m than at 22 m. In contrast, CE of all
elements was significantly (p < 0.05) affected by canopy level and season (except for
NH4+; p = 0.06 for season). Canopy leaching (CL) was significantly different between 28
and 22 m and between 15 and 1.5 m for K+, Ca2+ and weak acids and between 22 and 15
m for Ca2+ and Mg2+. Significant canopy uptake (CU) was detected for NH4+, NO3
- and
98

Throughfall deposition and canopy exchange within beech and spruce canopies
H+ between 22 and 15 m. At 22 m, only the calculated CE of Mg2+ in the dormant season
and of Ca2+ in the growing season was not significantly different from zero.
Table 5.3 Annual bulk deposition (BD) and estimated dry deposition (DD) and canopy exchange (CE) (mmolc m-2 yr-1) at different heights (m) in the canopy of one beech and two spruce trees
BD DD at canopy height (m) CE at canopy height (m) Beech 28 22 15 1.5 28 22 15 1.5 H+ 1.20 4.37 3.52 5.79 5.51 -5.26 -4.39 -6.79 -6.46 NH4
+-N 42.2 40.1 58.1 85.3 108 -37.7 -42.6 -68.6 -77.6 Cl- 31.1 36.7 41.5 42.9 55.9 0 0 0 0 NO3
--N 21.5 19.1 15.1 19.9 19.7 -5.26 -4.39 -6.79 -6.46 SO4
2--S 24.3 59.1 50.6 66.8 89.2 0 0 0 0 K+ 2.50 2.79 2.48 2.48 3.34 19.6 62.7 65.9 88.8 Na+ 25.1 28.3 28.2 27.2 33.1 0 0 0 0 Ca2+ 18.0 20.1 18.0 18.0 24.0 1.98 2.87 12.5 20.9 Mg2+ 7.10 7.99 7.70 7.51 9.41 3.37 5.36 10.6 15.5 WAb 17.8 0.96 11.6 17.4 19.3 -12.7 28.3 20.3 47.7 Sprucea WD 15 13 11 9.5 15 13 11 9.5 H+ 26.7 11.1 6.79 14.4 18.6 -26.0 -25.1 -33.8 -37.1 NH4
+-N 21.3 92.8 122 146 151 -90.0 -113 -135 -137 Cl- 137 242 360 385 392 0 0 0 0 NO3
--N 36.8 31.6 29.4 44.4 61.7 -26.0 -25.1 -33.8 -37.1 SO4
2--S 98.5 24.2 59.0 65.3 85.1 0 0 0 0 K+ 4.03 1.39 3.64 3.68 4.72 41.5 50.5 60.7 62.9 Na+ 88.5 220 327 360 352 0 0 0 0 Ca2+ 7.02 2.12 5.41 5.64 7.28 15.2 19.8 24.8 27.4 Mg2+ 23.7 10.3 27.7 26.8 34.1 33.3 43.1 49.3 46.4 WA 0 0 0 0 0 0 0 0 0
aAverage of the two trees bWA: Weak Acids, negative values are set to zero
In the spruce canopy, canopy level and season significantly affected the DD fluxes of
NH4+, Cl-, K+, Ca2+, Mg2+, Na+ and SO4
2+ (Table 5.4; Fig. 5.7). The DD of NO3- was only
affected by season. For NH4+ and NO3
- the DD was highest during the growing season,
while for the other elements DD was highest in the dormant season. Generally, the
highest differences could be found between the upper two canopy levels, except for Na+,
Cl- and Ca2+, for which a significant increase was also observed between 13 and 9.5 m.
However, calculated DD fluxes at 15 m did not differ significantly from zero, except for
Na+ and Cl-. At 13 m, DD fluxes were significantly different from zero. Only for NH4+,
Cl- and Na+, DD decreased with increasing distance to the trunk.
99

Chapter 5
0 20 40 60 80 100Base cation DD and CE (mmolc m-²)
1.5
15
22
28
1.5
15
22
28
Can
opy
leve
l (m
)DD growing seasonCE growing season
K+ + Ca2+ + Mg2+
DD dormant seasonCE dormant season
-40 0 40Nitrogen DD and CE (mmolc m-²)
1.5
15
22
28
1.5
15
22
28
Can
opy
leve
l (m
)
NH4+ + NO3-
-6 -4 -2 0 2 4 6H+ DD and CE (mmolc m-²)
H+
0 4 8 12 16Na+ DD (mmolc m-²)
20
Na +
Fig. 5.6 Calculated dry deposition (DD) and canopy exchange (CE) of base cations (K+ + Ca2+ + Mg2+), Na+, inorganic N (NH4
+ + NO3-) and H+ within a beech canopy at different
canopy levels (1.5, 15, 22 and 28 m). Error bars represent standard error
For spruce, all ions that are assumed to be leached or taken up by the canopy were
affected by canopy level and season. Leaching of K+, Ca2+, Mg2+ and uptake of NH4+
occurred mainly between 15 and 11 m in the upper and middle canopy and decreased
with increasing distance to the trunk. Uptake of H+ and NO3- was detected between 13
and 9.5 m in the middle and lower canopy. Calculated CE fluxes at 15 m differed
significantly from zero, except for Mg2+ during the dormant season.
100

Throughfall deposition and canopy exchange within beech and spruce canopies
5.5 Discussion
5.5.1 Volume
An extensive discussion on the partitioning of throughfall volume within the tree canopies
is beyond the scope of this study. However, for beech an increase in volume (50 mm yr-1)
could be observed between 15 m and the ground level (1.5 m), which had an impact on
the calculated DD of K+, Mg2+, Ca2+, Cl- and NH4+ between these levels (Fig. 5.6). This
increased volume at 1.5 m is possibly due to the diversion of stemflow to throughfall due
to a low-hanging branch at 7 m. Stemflow of the beech tree amounted to 2 % of
precipitation, which is markedly below the range of 7-20 % reported for beech (Chang
and Matzner 2000). Assuming that the stemflow volume actually amounts to 10 % of the
incident precipitation, as observed for a similar beech tree in the studied forest stand
(Staelens et al. 2007), the annual stemflow volume would increase by 52 mm, which is
exactly the observed increase in throughfall volume between 15 and 1.5 m. Since it is
expected that the throughfall volume would decrease between 15 and 1.5 m, stemflow
likely exceeds this 10 %.
5.5.2 Sodium, chloride and sulphate
Spatial and temporal throughfall variations of Na+ and Cl- are only driven by DD of
particles and are therefore the easiest to interpret. As hypothesized, vertical patterns of
both ions were similar during the growing season and reflect the impact of canopy
structure on the DD processes (Erisman and Draaijers 2003). Significant DD was found in
the top canopy of both species, and increased only little with canopy depth in the beech
tree but significantly in the spruce tree (Fig. 5.6 and 5.7). The beech forest has a rather
closed canopy with the majority of the leaves in the upper canopy layer (Samson 2001),
while the spruce forest is more open at the top of the canopy due to the triangle-shaped
tree contour of spruce causing a non-uniform distribution of the collecting surface, which
enhances atmospheric turbulence within the canopy (Wuyts et al. 2008b). The same
pattern was observed in the dormant season as in the growing season but with slightly
higher fluxes for beech and doubled fluxes for
101

Chapter 5
Tabl
e 5.
4 P
valu
es o
f the
eff
ect o
f sea
son,
can
opy
leve
l, di
stan
ce to
the
trunk
and
thei
r int
erac
tions
on
the
estim
ated
dry
dep
ositi
on(D
D) a
nd c
anop
y ex
chan
ge (C
E) o
f bee
ch a
nd sp
ruce
acc
ordi
ng to
line
ar m
ixed
mod
els
M
g2+
0.57
6 0.
059
0.14
2 <0
.001
<0
.001
0.
003
<0.0
01
0.08
7 0.
0001
0.
028
0.45
0.
008
<0.0
01
0.00
1 0.
373
0.13
2 Si
gnifi
cant
val
ues a
re in
dica
ted
in b
old
/: P
valu
es n
ot c
alcu
late
d be
caus
e C
E of
Cl- , S
O42-
and
Na+ a
nd D
D o
f WA
wer
e as
sum
ed to
be
zero
Ca2+
<0.0
01
0.02
0.
064
0.02
5 <0
.001
0.
012
<0.0
01
0.04
6 <0
.001
0.
336
0.74
0.
623
<0.0
01
<0.0
01
0.43
6 0.
821
Na+
<0.0
01
0.14
8 0.
247
/ / / <0.0
01
<0.0
01
<0.0
01
0.27
0.
164
/ / / / /
K+
<0.0
01
0.01
9 0.
059
<0.0
01
<0.0
01
0.00
9 <0
.001
0.
053
<0.0
01
0.11
2 0.
776
<0.0
01
<0.0
01
<0.0
01
0.45
2 0.
834
SO42-
-S
0.04
<0
.001
0.
885
/ / / 0.01
7 0.
058
<0.0
01
0.78
8 0.
723
/ / / / /
NO
3- -N
0.68
2 0.
056
0.05
7 0.
009
0.04
3 0.
073
0.00
1 0.
47
0.09
7 0.
204
0.78
1 <0
.001
0.
076
0.03
7 0.
116
0.95
1
Cl-
0.3
0.00
5 0.
659
/ / / <0.0
01
<0.0
01
0.00
1 0.
465
0.34
3 / / / / /
NH
4+ -N
0.55
4 <0
.001
0.
519
0.05
9 <0
.001
0.
183
<0.0
01
<0.0
01
<0.0
01
0.64
3 0.
516
<0.0
01
<0.0
01
<0.0
01
0.46
4 0.
631
H+
<0.0
01
0.05
0.
064
0.00
9 0.
043
0.07
3 0.
084
0.07
1 0.
128
0.14
0.
518
<0.0
01
0.07
6 0.
037
0.11
6 0.
951
Seas
on
Can
opy
leve
l Se
ason
: can
opy
leve
l Se
ason
C
anop
y le
vel
Seas
on: c
anop
y le
vel
Seas
on
Dis
tanc
e C
anop
y le
vel
Seas
on: c
anop
y le
vel
Dis
tanc
e: c
anop
y le
vel
Seas
on
Dis
tanc
e C
anop
y le
vel
Seas
on: c
anop
y le
vel
Dis
tanc
e: c
anop
y le
vel
DD
be
ech
CE
be
ech
DD
sp
ruce
C
E
spru
ce
102

Dry deposition Canopy exchange
Na+
K++ Mg2+ + Ca2+
NH4+ + NO3
-
H+
Fig. 5.7 Calculated dry deposition and canopy exchange of base cations (K+ + Ca2+ + Mg2+),Na+, inorganic N (NH4
+ + NO3-) and H+ within a spruce canopy at different canopy levels
(9.5, 11, 13 and 15 m) and as a function of the distance to the trunk. Error bars representstandard error
Throughfall deposition and canopy exchange within beech and spruce canopies
103

Chapter 5
spruce in all canopy layers. Deposition fluxes of Na+ and Cl- are generally higher during
winter (Neary and Gizyn 1994; Houle et al. 1999; Staelens et al. 2007) due to more
frequent storms and generally higher wind speeds (Beckett et al. 2000) and enhanced
atmospheric sea-salt aerosol concentrations (Gong et al. 1997). Since the canopy
structure remains the same all year for the spruce trees, the higher fluxes in the dormant
than the growing season can hereby be explained. For the beech tree, however, leaves are
absent during the dormant season, which decreases the plant area index and thereby the
collecting surface from a value of 5.2 to 1.1 (Holst et al. 2004). The observed high DD
can then be explained by the greater capture efficiency of a large number of small twigs
and branches at the top of the defoliated canopy, compared to large simply structured
stems or leaves (Freer-Smith et al. 2004).
Since atmospheric concentrations of Na+, Cl- and SO42- aerosols generally start to increase
in autumn, NTF and thus DD is higher during the leaf senescence period compared to the
leafless period in the beech canopy due to the higher collecting surface of leaves and
stems compared to stems only.
Dry deposition of SO42- occurs mainly as SO2 in most forests, however, close to the sea,
as for the studied spruce forest, an important sea-salt aerosol component can be present
(Lindberg and Lovett 1992). Yet, in contrast to Na+ and Cl-, DD of SO42- occurred mainly
in the upper canopy for both species, indicating that plant physiology and surface wetness
also influenced the deposition process. As stated in Section 5.5.4, these parameters were
higher in the upper canopy, thereby favouring DD of gases.
5.5.3 Base cations
Net throughfall fluxes of base cations are determined by canopy leaching (CL) and DD of
particles and are generally found to be positive. Throughfall fluxes of K+ increased 17-37
times compared to bulk deposition in the beech and the spruce canopy, respectively,
while for Ca2+ and Mg2+ the increase was 3-6 times (Table 5.1). This is concordant with
previous findings (e.g. Houle et al. 1999; Staelens et al. 2007) and can be explained by
the fact that K+ forms only weak complexes in cells and is readily exchangeable, while
Ca2+ and Mg2+ are bound tighter in cell walls, chloroplasts and enzymes (Marschner
1995). The difference in TF and CL of K+ between spruce and beech was also found by
Rothe et al. (2002) who compared 16 spruce-beech pairs in Europe, and is furthermore in
line with results of a review of 24 case studies of coniferous/deciduous forest stands at
104

Throughfall deposition and canopy exchange within beech and spruce canopies
comparable sites (De Schrijver et al. 2007). As the LAI of spruce trees is generally equal
to or larger than for beech (Gower and Norman 1991; Mussche et al. 2001), higher K+
leaching from beech canopies indicates that beech foliage is highly susceptible to
leaching processes. One explanation for this can be the higher K+ and Mg2+ content of
beech leaves compared to spruce needles (unpublished results). Next to this, beech leaves
show a higher wettability than spruce needles (Boyce et al. 1991; Van Wittenberghe
2009), which enhances foliar leaching (Tukey 1970; Parker 1983). This implicates a
higher input of base cations to the forest floor in beech stands than in spruce stands.
However, this applies only to the growing season, since during the dormant season base
cation leaching in the beech canopy is strongly reduced (-60 % compared to the growing
season), in contrast to spruce (-18 %) while DD is decreased in the beech canopy (-37 %)
and strongly increased in the spruce canopy (+532 %) (Fig. 5.6 and 5.7). Thus, seasonal
differences in CE are larger for beech compared to spruce for ions originating from the
canopy.
Throughfall and NTF of base cations increased with canopy depth, as for CL in the beech
canopy. In the spruce canopy, differences in CL were mainly found in the upper and
middle canopy, although an increase was still visible in the lower canopy close to the tree
trunk (Fig. 5.7). This contrasts with the findings by Schaefer et al. (1988) in a balsam fir
canopy where NTF did not change substantially between the upper and the lower canopy,
but agrees with Lovett et al. (1989). These patterns indicate that the canopy pools are not
depleted when the throughfall water reaches the lower canopy, and that the concentration
gradient between lower leaves and throughfall is still high enough to induce an additional
release of base cations. It is also possible that the effect of a lower concentration gradient
in the lower canopy is compensated by the higher wettability of leaves and needles
(Boyce et al. 1991; Van Wittenberghe 2009).
Due to the assumptions of the canopy budget model, DD patterns of base cations in the
beech and spruce canopy followed the patterns of Na+ and SO42-, respectively (see 5.5.2).
Since base cations are only deposited as particles, these patterns are considered to be
reliable, although it is difficult to verify this because NTF fluxes are mainly determined
by leaching processes.
105

Chapter 5
5.5.4 Nitrogen and hydrogen
Net throughfall fluxes of NH4+, NO3
- and H+ are the result of canopy uptake (CU) and dry
gaseous and particulate deposition. Despite the uncertainty in the modelled CU and DD of
N, this study provides valuable indications on the main driving factors for and the relative
importance of these processes. In contrast to our first hypothesis, both NTF and the
canopy model calculations indicate that a large part of total uptake of NH4+ and NO3
-
occurred in the upper canopy layer (Fig. 5.6 and 5.7). During the growing season, the
upper canopy of beech and spruce accounted for 69 and 68 % of the NH4+ uptake and 100
and 87 % of the NO3- uptake, respectively. During the dormant season, 37 and 62 % of
the NH4+ uptake and 48 and 64 % of the NO3
- uptake occurred in the upper layers of
beech and spruce, respectively. Higher inorganic N uptake by the upper canopy was
confirmed by Schaefer et al. (1988) for balsam fir and by Zhang et al. (2006) for a
tropical rain forest. Additionally, in the beech canopy, a strongly negative NTF was
observed for NO3- during leaf development (Fig. 5.5), which is concordant with the
findings of Koyama et al. (2008) who stated that the leaf expansion period in broadleaved
species is the most important period for NO3--N assimilation. Also, DD of NO3
- may have
been lower during the leaf development period, but measured DD fluxes of NO3- aerosols
to surrogate surfaces indicate similar deposition fluxes as during the rest of the growing
season (Adriaenssens unpublished results).
Canopy N uptake is generally believed to be controlled by passive diffusion processes
(Schaefer et al. 1988; Hansen 1996; Lovett et al. 1996) and by leaf physiological activity
(Parker 1983; Marschner 1995; Lovett et al. 1996; Krupa 2003), of which the latter is
characterized by e.g. stomatal opening and photosynthesis rate (Krupa 2003). From the
present study it is not possible to determine which mechanism has the highest impact and
determines the higher N uptake in the upper canopy. In the studied beech tree, both the N
content per dry matter in the leaves and the throughfall inorganic N concentration
increased from the top to the bottom of the canopy. However, the relative increase in
inorganic N throughfall concentration (+147 %) from top to bottom was meaningfully
higher than for the leaf N content (+19 %). Assuming that N per dry matter is a proxy for
the foliar NH4+ and NO3
- concentration (Schjoerring et al. 1998), this would indicate a
higher concentration gradient between the throughfall water and the leaf interior at 28 m
compared to lower canopy levels, which would favour passive diffusion. However, leaf
thickness, chlorophyll content and chlorophyll fluorescence were highest at 22 m,
106

Throughfall deposition and canopy exchange within beech and spruce canopies
indicating a high physiological activity, and lowest at 28 m, where leaves were exposed to
high light conditions (Van Wittenberghe 2009).
In spruce trees, the upper canopy contains a higher proportion of young needles, which
take up more N compared to older needles (Eilers et al. 1992) due to the higher
physiological activity of young needles (Niinemets 2007). However, needles in the upper
canopy also more easily form thin water films during a dry period than those in the lower
canopy (Burkhardt and Eiden 1994). These water films are formed by dry deposited
particles at relative humidity values as low as 50 % and decrease cuticular resistance.
Consequently, gaseous deposition of NH3, NOy and SO2 from the atmosphere to the plant
surface increases and the concentration of these dissolved gases in the water film rises,
driving passive diffusion into the needle. It is likely that this mechanism also exists for
beech leaves. Van Hove and Adema (1996) found a water film on poplar leaves at a
relative humidity exceeding 60 %, but no such water films have been reported for beech
yet.
Based on the observed patterns in this study and the fact that the CU of N for spruce was
higher in the growing season than in the dormant season, it seems likely that passive
diffusion processes can drive CU of N, but only in case of sufficient metabolic activity.
Significant CU for both NH4+ and NO3
- was calculated during the dormant season of the
beech tree, amounting to 80 and 68 %, respectively, of the CU in the growing season.
Although the main pathway of N uptake is generally believed to be via foliage, increasing
evidence suggests that uptake via twig, branch and stem surfaces may be equally
important (Bowden et al. 1989; Brumme et al. 1992; Dail et al. 2009). However, this may
occur through physicochemical processes rather than by N assimilation (Dail et al. 2009;
Chapter 4). Especially during the dormant season DD and CUof gases as NH3, NO2 and
HNO3 are determined by the ability of the plant surface to absorb the specific chemical
species, including the presence of water films or the chemical nature of the surface
(Erisman and Draaijers 2003). The distinction between actual assimilation or
physicochemical adsorption by twigs during the dormant season remains to be
investigated, since this may cause an overestimation of the contribution of canopy N
uptake to tree growth or carbon sequestration by the current deposition models.
For both spruce and beech, the modelled DD of NH4+ increased with canopy depth, in
contrast to the more constant DD of NO3-. The same pattern was observed for the
107

Chapter 5
measured NTF fluxes in the beech canopy. We hypothesize that this may be due to a
difference in the relative importance of gases and aerosols contributing to the NTF of
NH4+ and NO3
-. Dry deposition of NHx may be attributed to gaseous NH3 and particulate
NH4+, while NOx is deposited as gaseous NO2 and HNO3 and particulate NO3
- (Erisman
et al. 1997). Dry deposition and CU of NH3 and HNO3 are controlled by both stomatal
and cuticular conductance (Vose and Swank 1990; Sutton et al. 1998), while for NO2
stomatal conductance is the main pathway (Chaparro-Suarez et al. 2001). Since stomatal
uptake of gases cannot be retrieved in throughfall water, it is likely that the net NTF flux
of NH4+ is due to the deposition of both gas (NH3) and aerosols (NH4
+), while for NO3-
this is mainly due to aerosols (HNO3 and NO3-). Since aerosol deposition occurs mainly
in the upper canopy (see 5.5.2) and since HNO3 deposition is relatively unimportant in the
beech study region (Neirynck et al. 2007), this may explain the observed NO3- pattern for
the beech canopy. Cuticular deposition of NH3 that subsequently will be washed off to the
throughfall water can occur over the whole canopy but is likely to be enhanced in the
lower canopy due to higher leaf wettability and leaf wetness. In a spruce canopy HNO3
deposition was more significant (Andersen and Hovmand 1995) and could increase NTF
fluxes in the lower canopy. The fact that this was not observed in the calculated DD
fluxes is possibly due to the weaker model reliability for NO3-.
A higher DD of NH4+ and NO3
- was found for spruce during the growing season, while
the opposite was observed for other elements. This can be due to higher atmospheric
concentrations of NH3 and HNO3 (Andersen and Hovmand 1995; Andersen et al. 1999)
and an increased physiological activity of the needles during the growing season, while
DD of other elements is closely linked to sea-salt aerosol deposition which is higher
during the dormant season (see 5.5.2). Calculated DD of NH4+ and NO3
- was for both
species more closely correlated to Na+, Cl- and SO42- during the dormant season than
during the growing season (data not shown), indicating that gaseous deposition was the
prevailing process in the growing season while aerosol deposition was more important in
the dormant season.
In contrast to N, TF of H+ decreased from the top to the bottom of the canopy in both
species, with a reduction of 60 % for spruce and 80 % for beech (Table 5.1). The highest
CU of H+ was also found in the upper canopy. Although we cannot compare beech and
spruce in this study, these results confirm previous comparisons of beech and spruce
(Rothe et al. 2002) that revealed a negative NTF of H+ for both species with the same
108

Throughfall deposition and canopy exchange within beech and spruce canopies
bulk deposition. However, as mentioned in Section 5.4.1, an increase in the TF of H+ was
observed for spruce at 0.1 m to the trunk. Closer to the stem, more old needles can be
found, which have been shown to leach more H+ than current year needles (Fritsche
1992). So, it is likely that leaf longevity can also influence the spatial variation of
throughfall water within a tree canopy.
5.5.5 Limitations and implications of the study
This is the first study presenting estimates of DD and CE patterns within the canopy of
two contrasting tree species based on throughfall measurements. The canopy budget
model is based on several assumptions with regard to the DD and CE of base cations, N
components and H+. This can result in small errors that propagate further through the
model into larger errors (Staelens et al. 2008). Previous studies have observed leaching of
Na+ (Reiners and Olson 1984; Staelens et al. 2007), Cl- (Neary and Gizyn 1994; Houle et
al. 1999; Staelens et al. 2007) and SO42- (Houle et al. 1999; Staelens et al. 2007) from
coniferous canopies or from deciduous canopies during leaf development or leaf
senescence periods through increased throughfall to bulk deposition ratios (Talkner et al.
2010). We did not observe this, hereby justifying the assumption that these ions are inert
in the canopy budget model. Furthermore, the filtering approach assumes that base
cations are deposited with equal efficiency as the tracer ion used, which mainly depends
on particle size. By using a different tracer ion between the beech and the spruce site, we
tried to account for this assumption. The weakest results of the model are obtained for
NH4+, NO3
- and H+. For this reason, the calculated fluxes were always compared with
actual throughfall and net throughfall measurements and only used to compare relative
differences between canopy levels and seasons.
With respect to the number of study trees, beech crowns have been found to have a
deterministic growth pattern and an unidirectional development (Fleck 2001), suggesting
that similar patterns can be found for other individuals, while for spruce trees this
variability in growth pattern was accounted for by studying two trees. However, because
both species were studied in different regions and different periods and because they were
not replicated, the observed differences between beech and spruce can be related to a
species or a regional effect. Furthermore, it is likely that light availability, tree age
(Niinemets 2010) or N deposition will influence the observed patterns. Therefore, similar
studies in other tree canopies in different forest stands could strengthen the conclusions
109

Chapter 5
drawn from this study. It is also difficult to extrapolate these results to other species.
Beech and spruce are shade-tolerant species where light availability, relative humidity
and air temperature decrease sharply in the canopy, and where leaves and needles are
acclimated to this variation in microclimate (Herbinger et al. 2005; Niinemets 2010). In
fast growing species such as silver birch (Betula pendula Roth) or Scots pine (Pinus
sylvestris L.), this gradient will be less pronounced (Niinemets 2010), possibly resulting
in less distinct DD and CE patterns.
The present study clearly showed that the upper canopy contributes most to the DD and
CU of atmospheric components, although the patterns differed between beech and spruce
due to their difference in canopy structure. In contrast, all canopy components contribute
equally to the leaching of base cations. Despite the limitations of our study, important
implications can be formulated. Firstly, atmospheric pollutants will have the highest
impact on the upper canopy, where the physiological activity of leaves is highest and
where often reproductive structures are situated (Lovett and Lindberg 1992). Many
studies have assessed the physiological effects of air pollution (see Bytnerowicz and
Grulke 1992 for an overview). From this study, it is likely that air pollution impact only
accounts for the upper canopy layer, however, due to the importance of this layer, it will
influence the whole tree. The sensitivity of reproductive structures to air pollution
(Chauhan et al. 2004) has not yet been proven for tree species, but could have important
consequences for forest regeneration. Secondly, inferential models using only one
stomatal and one cuticular resistance to determine DD velocities are likely to
overestimate or underestimate the DD to the forest ecosystem, depending if these values
are based on sun or shade leaves. A multilayer approach as used by Pieterse et al. (2007)
could help to improve their measure accuracy. Thirdly, the use of small artificial trees in
combination with throughfall sampling in the field (Ignatova and Dambrine 2000;
Stachurski and Zimka 2002) will probably overestimate DD, since these trees lack the
structural heterogeneity that causes turbulence intensity and consequently DD to decrease
from the top to the bottom of the canopy.
5.6 Conclusion
This study demonstrates that the chemical composition of throughfall and net throughfall
changed significantly between the different canopy levels of beech and spruce trees,
which can be linked to differences in dry deposition and canopy exchange. The observed
110

Throughfall deposition and canopy exchange within beech and spruce canopies
111
patterns in throughfall, net throughfall, dry deposition and canopy exchange depended
upon the ion considered, the season and the canopy structure of the studied tree species.
Dry deposition of ions originating from gases (NH4+, NO3
- and SO42-) and canopy uptake
of inorganic N was concentrated in the upper canopy of both species and could be linked
to the higher physiological activity of this canopy layer, governed by stomatal
conductance and photosynthesis. This implies that for these components multilayer
models are highly recommended for tree species with a strong vertical light gradient in
the canopy, such as beech and spruce. Whether this holds true for other tree species and
under more increased N deposition levels remains to be investigated, as well as the actual
processes determining this higher N uptake in the upper canopy. Surface wash
experiments applying throughfall water with the same chemical composition to the
different canopy layers could potentially reveal the exact mechanism occurring.
Furthermore, ions originating from the canopy (K+, Ca2+ and Mg2+) were found to
contribute to throughfall water at all levels, with a substantially reduced contribution in
the dormant season for beech. Dry deposition of ions deposited as aerosols (K+, Ca2+,
Mg2+, Na+ and Cl-) occurred mainly in the upper canopy for beech, but increased with
canopy depth and decreased with distance to the trunk for spruce, clearly reflecting the
canopy structure of beech and spruce. However, further research is needed to verify if this
can be related to a species effect and if the observed patterns also hold true for other tree
species and under varying deposition levels.


6 Dry deposition along a vertical gradient within a beech canopy: comparison of methods and dependence on canopy structure
After: Adriaenssens S, Staelens J, Van der Zande D, Coppin P, Boeckx P, Samson R, Verheyen K. Dry deposition along a vertical gradient within a beech (Fagus sylvatica L.) canopy: comparison of methods and dependence on canopy structure. Submitted to Journal of Geophysical Research – Biogeoscience
6.1 Abstract
Dry deposition measurements using three different methods were conducted along a
vertical gradient within a beech (Fagus sylvatica L.) canopy, and the effect of canopy
structure measured by Terrestrial Laser Scanning (TLS) was assessed. Dry deposition
calculated from throughfall measurements by the canopy budget model was compared
with the deposition of aerosols on single and multi layer artificial foliage and with dry
deposition calculated from air concentration measurements of NH3, NO2 and SO2
multiplied with a literature-based deposition velocity. Air concentrations of NH3 and SO2
decreased with canopy depth, while this was not the case for NO2. The multi-layered
artificial foliage within the canopy yielded more realistic results than the single-layered
foliage above the canopy and showed a good agreement with the canopy budget model
for coarse aerosol deposition. Dry deposition of SOx estimated by the canopy budget
model was higher than estimated from air concentration measurements, especially during
the leafless season. For NHy, the canopy budget model and the air concentration
measurements yielded similar results, but for NOx dry deposition calculated by the
canopy budget model was lower. A combination of throughfall measurements and multi-
layered artificial foliage could aid to quantify dry deposition of NOx. For all variables
except throughfall volume, H+ and NO3-, a significant correlation was found with the
volume of canopy elements above the throughfall collectors, as measured by TLS, hereby
contributing to current knowledge on spatial throughfall variability and deposition
patterns.
113

Chapter 6
6.2 Introduction
Dry deposition is an important pathway by which pollutants from anthropogenic origin
such as nitrogen (N) dioxide (NO2), ammonia (NH3) and sulphur (S) dioxide (SO2) enter
ecosystems (Duyzer et al. 1992). Forest ecosystems in particular receive a high dry
deposition compared with other vegetation types due to their higher surface roughness,
leaf area index (LAI) and physiological leaf characteristics (Erisman and Draaijers 2003).
The quantification of dry deposition is, therefore, essential to assess the complete impact
of air pollution on these ecosystems.
Several methods have been developed yielding moderately to highly accurate estimates of
dry deposition, with monitoring efforts and costs concordant to the measurement accuracy
(Draaijers et al. 1997). The first group of methods are direct, micrometeorological
techniques such as the eddy correlation and the gradient method, which are considered to
be the most accurate but are often restricted to short term measuring periods and
homogeneous surfaces. Therefore, gas and particle specific deposition velocities (vd) have
been derived from these micrometeorological techniques based on a resistance analogy.
Those velocities can be multiplied by air concentration measurements in inferential
models to obtain a dry deposition estimate on a regional scale for longer time periods and
with lower monitoring efforts (Wesely and Hicks 2000; Zhang et al. 2002; Wu et al.
2003). However, these inferential models still suffer from large uncertainties, and
depending on the model used, the dry deposition can differ with a factor of 2-3 (Flechard
et al. 2011). Furthermore, the models typically require air concentration measurements at
least 1 m above the canopy. Yet, at forest sites, air concentrations are often measured in
clearings or in the trunk space for practical reasons (Flechard et al. 2011), which leads to
a consistent underestimation of dry deposition fluxes, as was shown by Hicks (2006) for
SO2 and HNO3. For NH3 and HNO3, very few vertical concentration profiles exist in
literature (Flechard et al. 2011), while such data are necessary in the currently used multi-
layer deposition models (Cox 2003; Pieterse et al. 2007).
Surface wash techniques are indirect, less intensive and less costly methods to quantify
dry deposition. Of these techniques, the throughfall method, in which the amount and
composition of water above and beneath the canopy are compared, is most often applied
in long term monitoring networks such as the ICP Forests (de Vries et al. 2003). Total
atmospheric deposition is then quantified by the so-called canopy budget model
114

Dry deposition within a beech canopy
(Draaijers and Erisman 1995), which estimates ion-exchange reactions between the
canopy and throughfall water. However, different forms of this canopy budget model
have been reported to yield different deposition estimates, e.g. for two deciduous plots
(Staelens et al. 2008). Furthermore, direct gaseous uptake of NH3, NO2 and SO2 is not
taken into account, which may lead to an underestimation of the actual dry deposition
when compared with an inferential method (Draaijers et al. 1997; Thimonier et al. 2005;
Zimmermann et al. 2006). Nevertheless, advantages of the throughfall method are that it
can be used in heterogeneous terrain and that it also provides useful information about
processes in the canopy and the variation of fluxes within a stand (Erisman et al. 1994;
Staelens et al. 2006).
Next to throughfall measurements, surrogate surfaces are used as an analogue to real trees
to quantify dry deposition. Estimates of dry deposition are obtained by comparing
throughfall fluxes under the surrogate surface (e.g., plastic trees) with rainfall (Ferm and
Hultberg 1999; Ignatova and Dambrine 2000; Stachurski and Zimka 2002). These
surrogate surfaces or artificial trees have proven to yield reasonable results for aerosols
(Ferm and Hultberg 1999; Ignatova and Dambrine 2000). However, to our knowledge,
the method has never been compared with the canopy budget model or with inferential
models. Furthermore, it is likely that this method will overestimate dry deposition since
the surrogate surfaces lack the structural heterogeneity of real canopies that causes dry
deposition to decrease from the top to the bottom (Chapter 5).
On a within-stand spatial scale, surface wash experiments (Beier et al. 1993b; Draaijers et
al. 1997; Whelan et al. 1998; Raat et al. 2002) and deposition models (Meyers et al. 1998)
suggested that dry deposition on forests is related to their LAI. Although this influence of
LAI on dry deposition seems obvious, it is more difficult to establish such relationships in
heterogeneous forests because of the difficulty in practically relating LAI to, e.g.,
throughfall inputs observed in individual gauges (Levia and Frost 2006). Current methods
of estimating canopy cover or LAI, such as hemispherical photographs, fail to operate on
the same spatial resolution as throughfall orifice areas, so that the exact area of the
canopy that affects the throughfall beneath it cannot be determined (Staelens et al. 2006).
Only Nadkarni and Sumera (2004) managed to establish a relationship between
throughfall volume and the canopy structure directly above the sampler by means of
vertical canopy cylinder transects. Light Detection And Ranging (LiDAR) technology
used by Terrestrial Laser Scanners (TLS) provides a novel tool for generating an accurate
115

Chapter 6
and comprehensive 3D mathematical description of tree and canopy structure (Lefsky et
al. 2005; Van der Zande et al. 2006; Huang and Pretzsch 2010; Kane et al. 2010). This
technique allows assessing the relationship between 3D canopy structure and spatial
variability of throughfall chemistry on a detailed scale (i.e. cm-level).
In this study, we aimed to i) compare dry deposition estimates obtained by the canopy
budget model with aerosol deposition on artificial foliage and gaseous deposition
obtained by air concentration measurements along a vertical gradient in a European beech
(Fagus sylvatica L.) tree, and ii) to relate the variability in throughfall fluxes and
consequently dry deposition to 3D canopy structure by means of TLS data.
6.3 Materials and methods
6.3.1 Site description
A description of the Aelmoeseneie forest and the studied beech tree was given in Section
5.3.1.
6.3.2 Sample collection and analysis
6.3.2.1 Air concentrations of NH3, NO2 and SO2
Air concentrations of NH3, NO2 and SO2 were obtained four-weekly by means of passive
samplers at 36, 22, 15 and 1.5 m height along the measuring tower (Fig. 6.1). Ammonia
was measured with PK20 Radiello cartridges (Sigma Aldrich, St-Louis, USA), while NO2
and SO2 were measured with diffusive sampler types of IVL (Gothenburg, Sweden) (see
Ferm and Rodhe 1997, for more detailed information). All measurements were made in
duplicate.
Within one week after exposure, NH3 samplers were desorbed with ultrapure water,
which was then analysed using spectrophotometry (Eurofins, Oostkamp, Belgium). The
air concentration of NH3 was calculated from the measured ion concentration corrected
for the average air temperature during the measuring period, as determined
experimentally by Swaans et al. (2005). Air temperature at each canopy level was
measured with Thermistor sensors (Omega, Manchester, UK). The IVL diffusive
samplers for NO2 and SO2 were sent to Sweden for chemical analysis by
spectrophotometry (NO2) and ion chromatography (SO2), from which air concentrations
116

Dry deposition within a beech canopy
were determined accounting for temperature-dependent diffusivity (Ferm and Rodhe
1997; Ferm and Svanberg 1998).
6.3.2.2 Throughfall water
Throughfall fluxes inside the beech canopy were measured by means of two different
types of throughfall collectors. The first type was a normal funnel of which the
arrangement within the beech canopy is described in Section 5.3.2.1.
At 15, 22, 28 and 36 m each, two replicates of the second type, i.e., funnels with artificial
tree foliage above it, were placed on the same rails as the throughfall collectors (Fig. 6.1).
They were used to measure dry deposition between 36-28, 28-22, 21-15 and 15-0 m,
according to an adapted version of the method described by Stachurski and Zimka (2002).
The artificial foliage was shaped as Norway spruce (Picea abies (L.) Karst.) trees and
consisted of one iron spiral (representing the ‘stem’) with attached shorter spirals
(‘branches’) and polyethylene ribbon, densely woven into the spirals and cut into every 1
mm (‘the needles’) (Wuyts et al. 2008b). Stachurski and Zimka (2000) pointed out that
polyethylene imitated the natural smoothness of beech leaves well and that a spruce
surrogate yielded the same ionic load as a beech surrogate. The artificial foliage above
each funnel had a LAI similar to the canopy layer below it, e.g., the LAI of the artificial
tree foliage at 28 m equalled that of the canopy layer from 28 to 22 m. Consequently, the
artificial foliage captured the same amount of dry deposition as this canopy layer, but no
canopy exchange processes occurred. The stand LAI of 5.5 (Mussche et al. 2001) was
divided into 0.3 (36-28 m), 3.0 (28-22 m), 1.7 (22-15 m) and 0.6 (15-0 m) based on
Samson (2001) and visual observations. This method is subsequently referred to as the
multi-layer approach. Additionally, two collectors with artificial foliage having a LAI
equal to the whole stand (5.5) were placed at 36 m, subsequently referred to as the single-
layer approach.
Throughfall water of the two different collector types and stemflow was collected as
described in Section 5.3.2.1. All samples were collected every fortnight from 22 April
2009 to 21 May 2010. Samples from throughfall collectors without artificial foliage were
analysed over the whole study period, while those from collectors with artificial foliage
were only analysed from 7 May to 19 November 2009, because after that period they
were no longer representative for the leafless tree. Analysis was conducted as in Section
4.3.2.3.
117

Chapter 6
TFnormal (6)TFAF,multi (2)NH3, NO2, SO2
TFnormal (6)TFAF,multi (2)NH3, NO2, SO2
TFnormal (6)TFAF,multi (2)NH3, NO2, SO2
TFnormal (2)TFAF,multi (2)
BD (2)TFAF,multi (2)TFAF,single (2)
Fig. 6.1 3D view indicating the location of normal throughfall collectors (TFnormal), throughfall collectors with single- and multi-layered artificial foliage (TFAFsingle; TFAFmulti), bulk deposition collectors (BD) and air concentration measurements in the beech canopy. The 3D point cloud of the studied tree was obtained after merging 14 Terrestrial Laser Scans taken at different heights and separating the tree from the surrounding forest scene.
6.3.2.3 Terrestrial Laser Scanning (TLS)
If a detailed 3D structure description of a forest canopy is needed at an ecologically
significant scale, TLS systems prove to be very valuable (Van der Zande et al. 2009). Its
fine spatial resolution and small beam size allow measurements of the inner canopies of
trees from the ground. In this study, the FARO LS880 was used to collect large quantities
of range data, which is most commonly described as a cartesian LiDAR point cloud in
which the 3D structure information is embedded. The non-contact optical active sensor
uses Continuous Wave (CW) technology to determine the distance to a scanned object,
e.g., leave or branch, by emitting light beams with a wavelength of 785 nm (near-
118

Dry deposition within a beech canopy
infrared). These beams are deflected in a panoramic field of view (FOV) of 320° x 360°
using a mechanical direction system with an angular resolution of 0.018° both in the
vertical and horizontal axis. This TLS system is therefore able to create 3D structure
datasets with high point densities.
The FARO LS880 typically only registers the first object encountered by the beam. This
means that spatial information related to the position of the vegetative elements located
behind this first object therefore is not available. This is called shadowing and is a major
obstacle when extracting structure information from the LiDAR datasets. Consequently,
these background objects have to be measured from different angles to obtain
comprehensive laser coverage (Van der Zande et al. 2006). To minimize this shadow
effect, which can be high in dense beech stands (van Leeuwen and Nieuwenhuis 2010),
scans were performed at the ground level (1.5m) and at the different platforms of the
measuring tower at heights of 8.5, 15.5, 22.5 and 29.5 m in September 2009.
6.3.3 Data analysis
6.3.3.1 Air-concentration-based dry deposition (DDvd)
The ‘time stability’ (Raat et al. 2002; Staelens et al. 2006) of four-weekly air
concentrations at the different canopy levels was assessed for both the leafed and the
leafless period. For m periods and n locations, the method calculates the temporal mean
(δj) and standard deviation of the relative difference δt,j of a variable S at time t and
location j:
,1
1 mj tm t jδ δ
== ∑ (6.1)
Where
,,
-t j tt j
t
S SS
δ = (6.2)
and
,1
1 nt j
Sn =
= ∑ t jS (6.3)
By plotting δj for each canopy level, the time-averaged ranking of the air concentration at
a certain canopy level can be observed.
119

Chapter 6
Dry deposition of inorganic N and S for the year, the leafed and the leafless period and
for the artificial foliage period (see 6.3.3.3) was obtained by multiplying the air
concentration derived from passive samplers with a fixed gas-specific deposition velocity
(vd). This vd depends on the vegetation type and can vary considerably throughout the
year due to varying meteorological and derived conditions such as wind speed, irradiance,
relative humidity and leaf wetness. In case of a compensation point, as for NH3, the
ambient air concentration also determines whether emission or uptake occurs (Neirynck
et al. 2005). Based on a literature survey of peer-reviewed gradient or inferential model
studies, a range and mean of vd values on deciduous forest in Flanders were determined
for NH3, SO2, and NO2 (Staelens et al. in press; Table 6.1). We multiplied these vd values
with the measured air concentrations at 36 m to calculate dry deposition onto the entire
canopy (0-36 m). Dry deposition onto the lower canopy levels (0-22 m, 0-15 m, 0-1.5 m)
was calculated by multiplying the air concentration at 22, 15 and 1.5 with an adjusted vd,
calculated as a percentage of vd at 36 m based on the wind speed profile (Samson 2001).
To evaluate the effect of vd, dry deposition calculated as the measured air concentrations
multiplied with a minimum, average and maximum vd (DDvd,min, DDvd,avg, DDvd,max)was
compared with dry deposition derived by the canopy budget model (see 6.3.3.2).
6.3.3.2 Ion fluxes and dry deposition derived by the canopy budget model (DDCBM)
Biweekly wet deposition (WD; mmolc m-2), throughfall deposition (TF, mmolc m-2), weak
acid deposition (mmolc m-2) and net throughfall fluxes (NTF) were calculated as in
Section 5.3.3.1. Dry deposition (DD) and canopy exchange (mmolc m-2) for the whole
year, the leafed and the leafless period and for the artificial foliage period (see 6.3.3.3)
were calculated by means of the canopy budget model described in Section 5.3.3.2.
6.3.3.3 Dry deposition calculated from the artificial foliage (DDAF)
Ion dry deposition (DDAF) for a canopy layer Y (mmolc m-2 2 weeks-1) was calculated as
the average of the two differences (one for each rail) in TF between a collector with
artificial foliage and the average of the three collectors without artificial foliage located
on the same rail. The dry deposition estimate of Y was summed with all canopy layers
above Y for comparison with the canopy budget model. In this way, the multi-layer
approach resulted in a dry deposition (DDAF,multi) between 28-36 m, 22-36 m, 15-36 and
1.5-36 m and the single-layer approach in a dry deposition (DDAF,single) between 1.5-36 m.
120

Dry deposition within a beech canopy
Table 6.1 Percentage (%) of full wind speed as measured by Samson (2001) and dry deposition velocity (vd, cm s-1; minimum, maximum, and mean value) above and inside the canopy of the beech tree for NH3, NO2 and SO2. Values of vd at 36 m were derived from a literature study and used by Staelens et al. (in press), while values at 22, 15 and 1.5 m were calculated as a percentage from those at 36 m based on the wind speed profile
Height (m) 36 22 15 1.5 % Wind speed* 100 36 27 17 NH3 Min. 0.80 0.28 0.22 0.14 Max. 3.00 1.05 0.81 0.51 Avg. 1.90 0.67 0.51 0.32 NO2 Min. 0.10 0.04 0.03 0.02 Max. 0.40 0.14 0.11 0.07 Avg. 0.25 0.09 0.07 0.04 SO2 Min. 0.30 0.11 0.08 0.05 Max. 1.50 0.53 0.41 0.26 Avg. 0.90 0.32 0.24 0.15
*Measured by cup anemometers above the canopy and at the respective canopy level
Since Na+ in NTF is assumed to originate only from dry deposition, DDAF,multi and
DDAF,single of Na+ was compared with the NTF at each canopy level over the growing
period. Both methods were significantly correlated (p < 0.001) at 0-36 (Spearman rs =
0.809 for the multi-layer approach; rs = 0.923 for the single-layer approach), 15-36 (rs =
0.760), 22-36 (rs = 0.870) and 28-36 m (rs = 0.890). However, both DDAF,multi and
DDAF,single of Na+ above the stand were always higher than the NTF measurements (Fig.
6.2). This could be due to the fact that sea-salt particles are retained more efficiently on
artificial foliage than on real foliage (Draaijers et al. 1997). Moreover, at the end of the
growing period, when the top of the beech tree was already leafless, the difference
between both methods became increasingly larger. Therefore, the period for comparison
of the dry deposition methods was taken from 7 May to 9 October 2009, subsequently
referred to as the artificial foliage period. The data of all ions other than Na+ were
corrected by multiplying the dry deposition with the mean ratio of Na+ NTF to dry
deposition at each canopy level, which was 0.52 (1.5-36 m), 0.40 (15-36 m), 0.27 (22-36
m) and 0.56 (28-36 m) for the multi-layer approach and 0.16 for the single-layer
approach.
121

Chapter 6
20-May-2009 2-Jul-2009 13-Aug-2009 24-Sep-2009 5-Nov-2009
0
2
4
6
8
10
12
14
16
Na+ (
mm
olc m
-2 2
wee
ks-1) DD multi-layer artificial foliage
Net throughfallDD single-layer artificial foliage
Fig. 6.2 Dry deposition of Na+ (mmolc m-2 2 weeks-1) on the canopy of a beech tree measured by net throughfall, multilayer artificial foliage and single-layer artificial foliage between 20 May and 19 November 2009
6.3.3.4 Terrestrial Laser Scanning
Prior to structure extraction, raw TLS datasets were pre-processed using the following
procedure. First, TLS data were transformed from polar to Cartesian coordinates. Then
the datasets of the 11 scans were registered and merged into one central coordinate
system using the Iterative Closest Point Algorithm (Besl and McKay 1992). Clearly
recognizable features of the measuring tower were used as reference points for the
registration procedure. Next, a transformation of vector to raster data was performed with
cubic voxels of 0.05 m side. A voxel is defined as a volume element in a regular grid in a
3D space and can be interpreted as the 3D variant of a 2D pixel. Each voxel was
characterized by its laser beam/voxel interaction: attribute F (filled) for voxels with at
least one intercepted laser beam, attribute E (empty) for intersections by laser beams
without interception. Afterwards, the voxels describing the tree were separated from the
voxels describing the surrounding forest scene by segmentation using manual in situ
measurements of the canopy size and visual interpretation of the TLS data, resulting in a
3D representation of the tree (Fig. 6.1). Finally, a filter procedure was performed enabling
the extraction of a cuboid with a ground surface of 1, 2 and 3 m in side around each
collector which was located manually in the 3D point cloud. The cuboid reached from the
122

Dry deposition within a beech canopy
height of the collector to the top of the canopy. For each cuboid a vertical profile was
generated describing the number of filled voxels, which can be considered as a proxy of
the vegetation biomass present in that specific column.
6.3.3.5 Statistical analysis
Spearman rank correlation coefficients (rs) were calculated between the biweekly NTF of
Na+ and DDAF,multi and DDAF,single of Na+, and between NTF, dry deposition and canopy
exchange of all ions and the number of filled voxels above each throughfall collector.
6.4 Results
6.4.1 Vertical profiles of NH3, NO2 and SO2
During the leafed period, the air concentrations of SO2 and NH3 increased from 1.5 m (0.8
µg SO2 m-3; 1.8 µg NH3 m-3) to 36 m (2.8 µg SO2 m-3; 3.0 µg NH3 m-3). The largest
differences were found between 1.5 and 15 and between 22 and 36 m (Fig. 6.3). The
concentrations of SO2 at 1.5 and 36 m had a larger deviation from the mean than those of
NH3. During the leafless period, the difference in concentration between 36 and 22 m
persisted for NH3 (2.5 and 2.3 µg m-3, at 36 and 22 m respectively), but almost
disappeared for SO2 (3.3 and 3.2 µg m-3, respectively). For SO2 the concentration
difference between 1.5 m (1.7 µg m-3) and 15 m (3.3 µg m-3) decreased compared with
the leafed period, but for NH3 the difference increased (1.8 and 2.5 µg m-3 at 1.5 and 15
m, respectively). Mean concentrations of NO2 amounted to 15.9 and 23.6 µg m-3 in the
leafed and the leafless period, respectively, and showed little differences along the
vertical profile. Only at 1.5 m NO2 concentrations were slightly lower than within and
above the canopy, particularly during the leafless period.
6.4.2 Effect of deposition velocity on semi-annual (leafed and leafless period) and
yearly dry deposition
Fig. 6.4 compares the semi-annual and yearly DD of N and S gases at the different
canopy levels calculated from air concentration measurements multiplied with a
minimum, average and maximum vd (DDvd,min, DDvd,avg, DDvd,max) with DD calculated by
the CBM (DDCBM). Since the actual DD could not be measured and the throughfall
123

Chapter 6
measurements were conducted with a higher temporal and spatial resolution than the air
concentration measurements, DDvd was tested against DDCBM.
-0.8 -0.4 0 0.4 0.8
δt
0
10
20
30
40
Hei
ght (
m)
SO2
-0.8 -0.4 0 0.4 0.8
δt
NO2
-0.8 -0.4 0 0.4 0.8
δt
leafedleafless
NH3
Fig. 6.3 Time stability plots for the air concentration of SO2, NO2 and NH3 at 1.5, 15 and 22 m within the beech canopy and at 36 m above the canopy. δt represents the time-averaged relative difference from the mean for the leafed and the leafless period. Error bars represent standard deviations
In the leafed period, DDCBM of SOx onto the 22-36 m canopy layer equalled DDvd,max, but
for 15-36 and 0-36 m the CBM always yielded higher values. In the leafless period,
DDCBM of SOx was, on average, 138 % higher than DDvd,max, while this was 65 % for the
yearly DD. Assuming that particulate SO42- (pSO4
2-) amounts to on average 30 % of total
dry S deposition (Erisman et al. 1997), total SOx deposition would be 16, 48 and 80
mmolc m-2 yr-1 for the beech canopy with a minimum, average and maximum vd,
respectively, of which only the result obtained with a maximum vd approaches the CBM
(87 mmolc m-2 yr-1).
Furthermore, the DDCBM of NHx during the leafed period was intermediate between
DDvd,min and DDvd,avg. A slightly higher DDCBM was obtained in the leafless period
compared with the leafed period, in contrast to DDvd which was 50 % lower, resulting in
approximately equal DDCBM and DDvd,max. Yearly DDCBM of NHx is generally equal to
DDvd,avg, except for 22-36 m. In both the leafed period and the leafless period, DDCBM of
NOy was intermediate between DDvd,min and DDvd,avg (Fig. 6.4a and b). Consequently, the
annual DD of NOy showed the same pattern (Fig. 6.4c). For the entire canopy (0-36 m),
the DDCBM was similar to DDvd,min for NOy.
124

Dry deposition within a beech canopy
0 40 80 120
1
15
22
1
15
22
1
15
22
NHx
0 40 80 120
1
15
22
1
15
22
1
15
22
0 10 20 30
NOy
0 10 20 30
0 10 20 30 40 50
SOx
0 10 20 30 40 5
0
a
b
0 40 80 120 160 200mmolc m-2 period-1
1
15
22
1
15
22
1
15
22
0 20 40 60mmolc m-2 period-1
Passive samplers, min vd
Passive samplers, avg vd
Passive samplers, max vd
Canopy budget model
0 20 40 60 80 10mmolc m-2 period-1
0
c
Fig. 6.4 Dry deposition of NHx, NOy and SOx in the (a) leafed and (b) leafless period and (c) over the whole year, calculated by the canopy budget model, and air concentrations measured by passive samplers multiplied by a minimum, average and maximum deposition velocity (vd)
6.4.3 Comparison of the three dry deposition methods
Table 6.2 compares dry deposition according to the CBM, multi- and single-layered
artificial foliage and air concentration measurements for the artificial foliage perod. For
Cl-, NOy, K+, Ca2+, and WA, the dry deposition according to the multi-layer artificial
125

Chapter 6
foliage (DDAF,multi) was on average 16, 63, 70, 43 and 9 % lower, respectively, than the
DDCBM, while for Mg2+ it was 22 % higher. DDAF,multi of K+ was lower than DDCBM in the
upper canopy (15-36 m), while in the lowest canopy layer (1.5-15 m) this was reversed.
The multi-layer approach yielded very low DD values for H+, NHx and SOx. Dry
deposition measured by the single-layer artificial foliage (DDAF,single) was 13 % lower
than the DDCBM for Cl-, 32 % for Ca2+ and NO3- and 22 % higher for Mg2+. Values for the
other ions amounted to less than 50 % of those by the CBM.
DDvd,avg of NHx was on average 76 % higher than the DDCBM. Especially in the upper
canopy (22-36 m) this method yielded a more than double DD value, but for the whole
canopy (0-36 m) it was only 58 % higher. For NOy, DDvd,avg was on average 36 % higher
than DDCBM, but for the whole canopy (0-36 m) it was 50 % higher. In contrast to the DD
of N compounds, DDvd,avg of SOx was 48 % lower than DDCBM.
Total (wet + dry) N deposition (mmolc m-2) for this period was highest for the air
concentration based method and 25 % lower for the CBM (Table 6.2). For total N+S
deposition, the air concentration based method still yielded the highest values, but here
the CBM was only 8 % lower. Total N and N+S deposition obtained by the multi-layer
and single-layer approach was less than 50 % of the values derived by both other
methods.
6.4.4 Influence of local canopy structure on throughfall variability and dry deposition
Net throughfall fluxes of NH4+, Cl-, Na+, SO4
2-, K+, Mg2+, Ca2+ and WA (mmolc m2
period-1) were significantly correlated (p < 0.01) with the number of filled voxels above
the collector during the leafed period (Fig. 6.5, Table 6.3). Correlations were significant
for cuboids with a base of 1, 4 and 9 m2, but the highest coefficients were obtained for
cuboids with a base of 4 m2. No significant correlation was observed for NTF volume and
NTF of H+ and NO3- in the leafed period. The DDCBM showed the same trends (Table
6.3).
126

Dry deposition within a beech canopy
Ta
ble
6.2
Com
paris
on o
f dry
dep
ositi
on, t
otal
(wet
+ dr
y) in
orga
nic
nitro
gen
(N) a
nd to
tal i
norg
anic
N a
nd s
ulph
ur (S
)de
posi
tion
(mm
olc m
-2 5
mon
ths-1
; 7 M
ay 2
009
– 9
Oct
ober
200
9, i.
e., t
he a
rtific
ial f
olia
ge p
erio
d) o
nto
cano
py la
yers
estim
ated
by
(1)
prec
ipita
tion
and
thro
ughf
all
mea
sure
men
ts c
ombi
ned
with
the
can
opy
budg
et m
odel
(C
BM
), (2
)th
roug
hfal
l of
mul
ti- a
nd s
ingl
e-la
yer
artif
icia
l fo
liage
(A
F) a
nd (
3) m
easu
red
air
conc
entra
tions
mul
tiplie
d by
an
aver
age
depo
sitio
n ve
loci
ty (
Tabl
e 6.
1) (
v d,a
vg).
Neg
ativ
e va
lues
ind
icat
e a
low
er t
hrou
ghfa
ll de
posi
tion
on t
heth
roug
hfal
l col
lect
ors
with
arti
ficia
l tre
es th
an o
n th
ose
with
out.
Val
ues
diff
erin
g m
ore
than
50
% f
rom
thos
e of
the
CB
M a
re p
ut in
bol
d
Tota
l N+S
97.7
42
45.1
105.
7
Tota
l N
64.4
33.6
33.1
86.3
WA
0.48
5.8
8.69
9.66
0.58
2.49
5.91
12.7
6
3.85
Mg2+
2.05
1.61
2.2
3.2
1.38
1.88
3.33
4.92
3.91
Ca2+
7.42
5.84
7.98
11.5
9
2.11
3.77
6.8
10.2
6
7.88
K+
1.32
1.04
1.42
2.06
-0.6
4
-0.6
5
0.31
4.31
8.7
SOx
20.5
7
11.3
2
17.4
4
24.0
7
0.41
-0.4
9
-1.4
-0.8
9
0.65
7.85
8.46
10.1
1
Na+
5.46
4.3
5.88
8.53
4.45
3.36
5.87
9.37
2.8
Cl-
8.91
6.4
9.61
13.3
3
5.21
5.21
8.83
13.6
4
4.54
NO
y
10.6
9
5 8.34
6.74
1.67
1.32
2.53
5.02
11.5
3
7.32
8.05
10.9
5
NH
x
19.1
6
15.9
26.7
30.8
2
0.61
0.1
-0.7
1.81
1.71
36.6
2
38.7
1
48.4
9
H+
3.72
1.61
2.84
2.18
0.01
-0.0
1
-0.0
2
-0.0
1
-0.0
1
Laye
r (m
)
28-3
6
22-3
6
15-3
6
0-36
28-3
6
22-3
6
15-3
6
0-36
0-36
22-3
6
15-3
6
0-36
CB
M
AF,
mul
ti
AF,
sing
le
v d,a
vg
127

Chapter 6
-280
-240
-200
-160
-120
-80
-40 Water
-0.22
-0.2
-0.18
-0.16
-0.14 H+
-10
0
10
20
30
Net
thro
ughf
all f
lux
(mm
olc m
-2 p
erio
d-1)
NH4+
10
15
20
25
30
35
40 Cl-
0 40000 80000 120000
Number of filled voxels
0
4
8
12 NO3-
0
10
20
30
40
50 SO42-
0
20
40
60
80
100 K+
0
4
8
12
16
20 Na+
0
10
20
30
40 Ca2+
0 40000 80000 120000
4
8
12
16
20 Mg2+
r = 0.045
r = 0.125
r = 0.695**
r = 0.694**
r = 0.257
r = 0.833**
r = 0.657**
r = 0.658**
r = 0.815**
r = 0.827**
Fig. 6.5 Relationship between net throughfall volume (l m-2 period-1) or ion deposition (mmolc m-2 period-1) and the number of filled voxels above a throughfall collector in the leafed period. The number of filled voxels is calculated from a cuboid with a ground surface of 4 m2 and a resolution of 0.05 m extracted from Terrestrial Laser Scanning data. Spearman rank correlation coefficient rs is given
128

Dry deposition within a beech canopy
Table 6.3 Pearson correlation coefficients between net throughfall and dry deposition (mmolc m-2 period-1) and the number of filled voxels above a throughfall collector during the leafed period. The number of filled voxels is calculated from a cuboid with a ground surface of 4 m2 and a resolution of 0.05 m extracted from Terrestrial Laser Scanning data. Bold values are significant at p < 0.01, underlined values at p < 0.05
Variable Net throughfall Dry deposition Volume 0.045 / H+ 0.123 -0.015 NH4
+ 0.695 0.854 NO3
- 0.257 0.220 Cl- 0.694 0.694 Na+ 0.658 0.658 SO4
2- 0.833 0.833 K+ 0.657 0.658 Ca2+ 0.815 0.658 Mg2+ 0.827 0.658 Weak acids 0.624 /
6.5 Discussion
6.5.1 Vertical profiles of NH3, NO2 and SO2
Remarkably few studies have reported gaseous concentration profiles within tree
canopies. Andersen et al. (1999) reported lower NH3 concentrations within than above a
spruce canopy, which is in agreement with our observations. For SO2, concentrations also
decreased with increasing canopy depth, in agreement with decreasing SO42-
concentrations on filter papers with canopy depth reported by Lovett and Lindberg
(1992), although the latter could be due to a decrease in either SO2 or pSO42- deposition.
The absence of a clear vertical profile for NO2 can be attributed to the gaseous emission
of NO from forest soils, which then reacts with O3 in the trunk space and within the
canopy to form NO2 beneath the canopy (Duyzer et al. 2004). As NO2 rises through the
canopy, radiation levels increase and NO2 converts into NO through photolysis. Higher
NO2 emission can be expected at lower radiation levels and higher wind speed. However,
at high ambient NO2 concentrations (20 ppbv) the flux is completely downward (Duyzer
et al. 2004), which may explain why during the leafless period, when above canopy NO2
concentrations were 24.5 ppbv, concentrations within the canopy slightly decreased.
Gaseous concentration profiles in this study were obtained by means of passive samplers,
which are considered as an inexpensive, accurate, easy to use method that is also
129

Chapter 6
applicable for remote locations (Cox 2003; Salem et al. 2009). On the negative side, this
method quantifies cumulative exposure and cannot identify short-term pollutant episodes
nor can it account for the stochasticity and dynamics of air pollutant exposure and plant
response (Krupa and Legge 2000). Yet, our passive sampler measurements clearly
indicated a concentration profile along the studied canopy for NH3 and SO2, but not for
NO2. Conclusions on forest exposure based on air concentration measurements made at
ground level may therefore underestimate the actual exposure to NH3 and SO2.
6.5.2 Dry deposition measurements
6.5.2.1 Single-layer versus multi-layer approach
The results of the single-layer and multi-layer approach differed significantly, with a
higher DD to the single-layer artificial foliage for NOy and K+, but a lower DD for Na+,
Cl-, Ca2+, Mg2+ and WA. The single-layer approach was used by Ignatova and Dambrine
(2000), Stachurski and Zimka (2002) and Kram (2008, 2010) but has never been
compared to other dry deposition measurements. In this study, the results for the multi-
layer approach agreed well with CBM calculations for ions deposited as aerosols (Na+,
Cl-, Ca2+, Mg2+, NOy and K+), which indicates that the multi-layer approach likely yields
more realistic results, assuming that the CBM accurately quantifies DD of aerosols.
Turbulence patterns and atmospheric concentrations decrease significantly with canopy
depth (Merony 1968; Lovett and Lindberg 1992; Hofschreuder et al. 1997), and
consequently, DD of aerosols and gases also decreases (Lovett and Lindberg 1992;
Hofschreuder et al. 1997; Chapter 5). Our study showed that this vertical variability can
be better integrated by a multi-layer approach, which is therefore recommended.
6.5.2.2 Aerosol deposition: base cations, sodium and chloride
The deposition of Na+, Cl-, K+, Mg2+ and Ca2+ increased little from 28 to 15 m for both
the CBM and the multi-layer approach. However, from 15 to 1.5 m, DD for all ions
increased substantially according to both methods. In Chapter 5 the increased DDCBM was
attributed to an additional stemflow input in the throughfall collectors due to a low
hanging branch. However, since the DDAF,multi was also high between 15 and 1.5 m, two
additional explanations can be given. First, Fritsche et al. (1989) observed increased dry
deposition of Na+, Mg2+, Ca2+ and NO3- to surrogate surfaces in the lower canopy of a
Norway spruce tree and attributed this to the wind speed profile, which increased slightly
130

Dry deposition within a beech canopy
from the middle to the lower canopy. A slight increase in wind speed between 18 and 12
m has also been measured in the studied beech tree (Samson 2001) due the lower leaf area
density. Second, and this only holds true for Ca2+, Mg2+ and particularly K+, Lovett and
Lindberg (1992) observed an increasing deposition with canopy depth for K+ aerosols
within a mixed oak forest and attributed this to an important in-canopy source of K+ salt
crystals exuded from leaves. This was confirmed by the absence of such profile during
the leafless period (Chapter 5).
Artificial foliage generally captures well coarse particles that settle gravitationally, but it
is less efficient in capturing smaller sized particles that are deposited by impaction
(Rodrigo and Avila 2002). No deposition of K+ particles, which have a mean mass
diameter of approximately 32 % of those of Na+ particles (Ruijgrok et al. 1997), was
found on the artificial foliage at the top of the canopy. However, K+ leached by leaves
resides on coarse particles (Lindberg et al. 1986) and will be more easily deposited on the
artificial foliage. This indicates that the assumption of equal deposition efficiency as used
in the CBM will largely overestimate DD of K+. The same conclusion was made by
Ruijgrok et al. (1997), who found a good agreement between DD of particles on artificial
branches and DD calculated by the model of Slinn (1982), except for K+.
6.5.2.3 Sulphur
In the CBM, the net throughfall flux of SO42- is assumed to be a good estimate of dry
deposited SOx (SO2 and pSO42-) because stomatal uptake of SO2 is balanced by foliar
leaching of SO42- (Draaijers and Erisman 1995). This holds true in most studies (Cape et
al. 1992; Draaijers et al. 1997), although significantly higher leaching than uptake also
has been observed (Neary and Gizyn 1994; Cappellato et al. 1998). In this study, DDCBM
was significantly higher than DDvd, especially during the leafless period. This difference
could be attributed to DD of pSO42-, but negligible DD was observed to the artificial
foliage during for the artificial foliage period. However, these low values may also be due
to the fact that pSO42- generally consists of fine particles (Ruijgrok et al. 1997) that are
not deposited well on artificial foliage (see 6.5.2.2.). So, the observed differences between
the methods implicate that (i) significant SO42- leaching occurs from the beech canopy,
(ii) the contribution of pSO42- to total DD exceeds 30 % (see 6.4.2), and/or (iii) a higher
vd(SO2) needs to be used. From this study we cannot distinguish between these factors.
However, since current deposition estimates are overestimated by the CBM (as used in
131

Chapter 6
the ICP network) or underestimated by the air concentration based method (as used in the
regional environmental monitoring network by the Flemish Environmental Network),
causes for this discrepancy between both methods should be assessed in further research.
6.5.2.4 Nitrogen compounds
The estimated DD of nitrogen compounds based on throughfall measurements and the
CBM is less precise than the estimated DD of other elements due to the complexity of the
processes determining the nitrogen composition of throughfall water and due to the
possible propagation of errors through the model (Staelens et al. 2008). Dry deposition of
NHx and NOy may occur through gaseous and particulate deposition and substantial
canopy uptake of both gaseous and dissolved compounds occurs in the canopy.
Furthermore, stomatal uptake of gases cannot be retrieved via throughfall data. The air
concentration based method and the artificial foliage used in this study can aid the
understanding of total dry deposition of nitrogen, although both methods also have
drawbacks. As is also the case for K+ and SO42-, fine particles (±0.6 µm) of NO3
- and
especially of NH4+ will not be captured well by the artificial foliage (Ruijgrok et al.
1997), while HNO3 may also be deposited to the artificial foliage (Lovett and Lindberg
1992; Ferm and Hultberg 1999). Furthermore, the passive sampler measurements are
cumulative measurements multiplied by a fixed vd, hereby ignoring regional differences
in, e.g., plant N status that may influence the deposition process.
In the leafed period, the DDCBM of NHx was slightly lower than DDvd,avg, and particulate
NHx (pNHx) deposition to the artificial foliage was rather low, indicating that DD
consisted mainly of NH3. Assuming that the uncertainty is 40 % on DD estimates by the
CBM (Draaijers et al. 1996) and 30-50 % on DD estimates by an inferential model
(Erisman et al. 1994), differences between the results of both methods can be considered
negligible. The dominance of NH3 in the DD of NHx during the leafed period is
confirmed by Neirynck et al. (2007), although in this study pNH4+ amounted to 30 % of
gaseous DD. The ratio of gaseous and particulate NHx deposition largely depends on the
distance to the nearest emission source (Asman et al. 1998). In the leafless period, DDvd
decreased significantly due to lower NH3 air concentrations, while DDCBM remained
constant. Since pNH4+
was not measured in the leafless period, we cannot distinguish if a
higher pNH4+ then occurred or if the CBM yields inaccurate estimates for this period. The
15N-labelling study in Chapter 4 showed that during the leafless period, canopy uptake of
132

Dry deposition within a beech canopy
NH4+ is not related to base cation leaching, hereby suggesting that the CBM might not be
valid in this period and that DDCBM is not correctly estimated. However, this remains to
be investigated.
For NOy, DDCBM decreased with canopy depth, which is not possible and may point to
inconsistencies in the model. Despite this, the sum of the DDAF,multi measuring particulate
NO3- (pNO3
-) and gaseous HNO3 and DDvd measuring NO2 was 1.5 to 2 times higher
than DDCBM. This difference can be explained by the stomatal uptake of NO2 or HNO3 by
the beech canopy. The DD of NO2 in particular is driven by stomatal characteristics
(Chaparro-Suarez et al. 2011) while HNO3 deposition was found to be either surface
(Ferm and Hultberg 1999) or stomata deposited (Garten et al. 1998) or both (Hanson and
Garten 1992). However, DDvd of NO2 may be significantly overestimated, since Neirynck
et al. (2007) observed a net upward flux of NO2 for a mixed coniferous forest nearby. Net
throughfall of NO3- at 1.5 m amounts to 4.5 mmolc m2 for the artificial foliage period,
which is slightly smaller than the DDAF,multi and the DDCBM and could be due to canopy
uptake. The same was observed by Ferm and Hultberg (1999) for a coniferous forest. This
indicates that a combination of NTF measurements and artificial foliage may be a more
suitable method to estimate DD of NOy. During the leafless period, DDCBM was lower
than DDvd of NO2. However, DDvd of NO2 was likely lower than modelled due to the
absence of stomatal conductance.
6.5.3 Role of canopy structure
Within-canopy variability of dry deposition can be attributed to physiological leaf
characteristics, including surface wetness chemistry, external leaf wetness and stomatal
opening, atmospheric concentrations and local canopy structure (Erisman and Draaijers
2003). As stomatal conductance (Van Wittenberghe 2009) and atmospheric
concentrations (Fig. 6.3; Lovett and Lindberg 1992) decrease with canopy depth for most
pollutants, the lower canopy may contribute little to dry deposition. Due to the
complexity of measuring the 3D forest canopy structure, most studies have explained
spatial throughfall variability, dry deposition and canopy exchange fluxes using a
surrogate for the 2D or 3D structure, such as LAI measured by hemispherical
photography (Whelan et al. 1998; Staelens et al. 2006) or aboveground biomass measured
by litter fall (Potter et al. 1991). However, these methods cannot quantify the contribution
of different canopy layers. The present study meets the need for a better characterisation
133

Chapter 6
134
of canopy structure to improve our understanding of its role in throughfall variability
(Levia and Frost 2006).
Net throughfall and DDCBM of all variables except throughfall volume, H+ and NO3- were
significantly correlated to the number of filled voxels above each collector, with the
highest correlation for a cuboid with a base of 4 m2. This indicates that all canopy layers
contribute to DD, but also that within one layer, patterns are determined by the volume of
canopy components vertically above the throughfall collector. Average net throughfall of
H+ and NO3- did not change significantly between the different canopy levels, and the
average net throughfall volume only differed between 28 and 22 m (Chapter 5), which
can explain the absence of a significant correlation for these elements.
6.6 Conclusion
In this study, the DD estimated by the canopy budget model was compared with the DD
determined by an air-concentration-based method, for NH3, NO2 and SO2, and with the
DD of aerosols on artificial foliage. A good agreement was found between the CBM and
the multi-layer artificial foliage for Na+, Cl-, Ca2+ and Mg2+, at least after correction,
while the CBM likely overestimates the DD of K+. Passive sampler measurements
showed a profile of decreasing NH3 and SO2 concentrations with canopy depth, but no
profile for NO2. This difference in concentrations between the atmosphere, the canopy
and the trunk space can serve as input data for multi-layer deposition models, although
additional measurements within tree canopies of other species are recommended to
confirm the observed profiles. Estimated S deposition differed significantly between the
air-concentration-based method and the CBM, and no particle deposition on the artificial
foliage was detected. Causes for this discrepancy should further be assessed, as both
methods are currently used to measure DD on a local and regional scale. Estimated DD of
N was comparable for the air-concentration-based method and the CBM during the leafed
period, but for NO2 it should be assessed whether deposition or emission occurs.
Furthermore, for the first time a relationship was found between net throughfall or DD
and volume of canopy components obtained by Terrestrial Laser Scanning on a collector
basis. This finding can be strengthened by improved processing of the multiple scans to
canopy structure parameters, such as leaf area density, and a comparison with data in the
leafless period.


7 Atmospheric deposition to forests based on throughfallmeasurements: effect of canopy budget model approaches on standdeposition, forest type effect and time trend analysis
After: Adriaenssens S, Staelens J, Baeten L, Verstraeten A, Boeckx P, Samson R, Verheyen K. Atmospheric deposition to forests based on throughfall measurements: effect of canopy budget model approaches on stand deposition, forest type effect and time trend analysis. To be submitted to an international peer reviewed journal
7.1 Abstract
Throughfall measurements are frequently used to quantify total atmospheric deposition to
forest ecosystems. The canopy budget model is then used to calculate ion-exchange
fluxes between the forest canopy and incident rainfall water. Various approaches for each
model step have been reported and compared, but combinations of different approaches
were not yet assessed. Therefore, the present study estimated the range of estimated dry
and total deposition obtained by combining canopy budget model approaches for three
typical case studies: (i) total nitrogen and potentially acidifying deposition onto a forest
canopy, (ii) the ratio of these deposition variables between a coniferous and a deciduous
stand and (iii) the parameters of a deposition time trend analysis. Furthermore, the effect
of each step in the canopy budget model on the obtained range was assessed. The time
step, type of precipitation data and tracer ion used in the model had a significant effect on
the derived deposition in the three case studies. In addition, including or excluding
canopy leaching of weak acids and canopy uptake of ammonium and nitrate during the
leafless season largely affected the results, while including or excluding canopy uptake of
nitrate generally showed no effect. We conclude that further research should focus on the
assumptions of inertness of the tracer ion and the equal deposition efficiency of base
cations and the tracer ion and on the quantification of weak acids in rainfall and
throughfall water. Since local or tree-species specific effects might influence the results
obtained in this study, a similar analysis is recommended for other tree species and
regions when using the canopy budget model.
137

Chapter 7
7.2 Introduction
The quantification of total deposition (TD) of sulphur (S) and nitrogen (N) is a key issue
in determining potential effects of these pollutants on the diversity and functioning of
forests. Furthermore, it allows to assess temporal and spatial trends and to evaluate the
effect of emission abatement strategies (Erisman et al. 1994). Wet deposition can be
measured with reasonable accuracy using wet-only or bulk collectors (Staelens et al.
2005), whereas for dry deposition a trade-off needs to be made between measurement
accuracy and monitoring effort/costs (see Chapter 6 for an overview). The choice of a
certain dry deposition method depends on the purpose of the study and throughfall
measurements are considered to be more suitable for long-term monitoring purposes and
large scale monitoring networks than micrometeorological measurements (Erisman et al.
1994; de Vries et al. 2003). Several studies report the use of throughfall measurements to
evaluate trends in atmospheric deposition on forest ecosystems (Vanguelova et al. 2010;
Pannatier et al. 2011). Furthermore, the method has often been used to compare
deposition on different forest types, and deciduous vs coniferous forest stands in
particular (de Vries et al. 2007; De Schrijver et al. 2007). An additional advantage of the
throughfall method is that it also gives information on the internal nutrient cycle in forest
ecosystems (Parker 1983; Friedland et al. 1991; Emmet et al. 1998; Ferm and Hultberg
1999; Neirynck et al. 2008).
When incident precipitation passes through the canopy it is altered by wash-off of gases
and particles deposited in dry periods prior to the precipitation event and by ion
exchange, e.g. uptake or leaching, between canopy surfaces and the solutions passing
over them (Draaijers et al. 1997). Therefore, to quantify total atmospheric deposition with
throughfall measurements it is necessary to distinguish dry deposition (DD) from canopy
exchange (CE) (Parker 1983). This distinction is made by the canopy budget model of
Draaijers and Erisman (1995), in which ion-exchange processes between the canopy and
throughfall water are estimated. However, various approaches of this model with respect
to the time step, type of open-field precipitation data, tracer ion and the ion exchange
processes have been reported, of which an overview was given by Staelens et al. (2008).
This review also assessed the sensitivity of atmospheric deposition onto two deciduous
canopies to each approach compared to the reference model of Draaijers and Erisman
(1995). Dry deposition of base cations was meaningfully affected by the type of
138

Atmospheric deposition from throughfall measurements
precipitation data and the tracer ion used, while canopy uptake of ammonium (NH4+) and
protons (H+) was influenced by accounting for canopy leaching of weak acids. However,
the authors suggested that future applications of the model could benefit from combining
different approaches with each other to quantify the range of estimated DD and CE. This
would also allow testing the relative influence of each approach on total N and potentially
acidifying deposition.
Furthermore, Staelens et al. (2008) indicated that assuming no canopy uptake of nitrate
(NO3-) (Harrison et al. 2000) had little effect on the total N deposition when the relative
uptake efficiency of NO3- was considered to be low, but that more research was needed
with regard to the uptake efficiency of NH4+ compared to NO3
- for varying tree species
and environmental conditions. In Chapter 4, NH4+/NO3
- retention ratios from wet
deposition were established by means of 15N-labelled sources for four different tree
species and phenological stadia. In this chapter, it was also observed that inorganic N
compounds are merely adsorbed to woody plant surfaces instead of actually assimilated
and that no relationship between 15NH4+ uptake and net throughfall of base cations was
observed during the leafless season. This indicates that other processes than ion-exchange
processes might play a role during the leafless season of deciduous species and that the
ion-exchange assumptions made in the model might not be valid.
Therefore, in this study we applied a combination of the various assumptions that can be
made at each step in the canopy budget model (Draaijers and Erisman 1995) to the
rainfall and throughfall data of three case studies. The steps containing the approaches
that showed a high impact on canopy exchange and dry deposition calculations according
to Staelens et al. (2008) were included again. In addition, the effects of two new
assumptions that emerged from the previous chapters in this thesis were tested. Our aim
was to assess the effect of the different approaches and assumptions on (i) the range of
canopy exchange, dry deposition and total N and acidifying deposition fluxes to a single
forest stand (represented by data of an individual tree), (ii) the ratio of total N and
acidifying deposition on a coniferous and deciduous plot and (iii) a time trend analysis of
total N and acidifying deposition.
139

Chapter 7
7.3 Materials and methods
7.3.1 Study sites
7.3.1.1 Individual beech canopy and time trend analysis
A full description of the Aelmoeseneie forest containing the mixed oak-beech stand of the
time trend analysis and the studied beech tree is given in Section 5.3.1.
7.3.1.2 Deposition ratio between a coniferous and deciduous forest
The study site is located in the nature reserve ‘Heidebos’ in northern Belgium
(Wachtebeke-Moerbeke) (51°11’N, 3°55’E, 11 m a.s.l.). The mean (1980–2007) annual
precipitation is 873 mm year-1 and the mean annual temperature is 10.4°C (Royal
Meteorological Institute of Belgium). Adjacent monospecific forest stands of pedunculate
oak (Quercus robur L.) and Scots pine (Pinus sylvestris L.) were selected with the same
soil type, stand history and tree age. The area has been continuously forested since at least
1775, and in 1947 the current tree species were planted. In 2007, tree density was similar
in both stands (823 oaks ha-1 and 920 pines ha-1). However, basal area was more than
twice as large in the pine stand (42 m2 ha-1) as in the oak stand (20 m2 ha-1) due to the
higher mean diameter at breast height of pines (23.4 cm) compared to oaks (17.1 cm).
Mean tree height was 15.6 and 18.2 m for oaks and pines, respectively. The soil in both
stands was a well-drained acid podzol (sandy texture) with a groundwater level below 1
m depth.
7.3.2 Sample collection and analysis
7.3.2.1 Individual beech canopy
A description of the throughfall sampling under the beech tree is given in Section 5.3.2.1.
In the present chapter, only the results of the collectors at ground level are used. Samples
were analyzed chemically as described in Section 4.3.2.3. Based on visual observations of
the beech canopy, the following phenological periods were distinguished: leaf
development (22 April to 20 May), fully leafed period (21 May to 24 September), leaf
senescence (25 September to 19 November 2009) and leafless period (20 November 2009
to 22 April 2010).
140

Atmospheric deposition from throughfall measurements
7.3.2.2 Deposition ratio between a coniferous and deciduous forest
Bulk precipitation and throughfall water were sampled biweekly from 7 December 2007
until 3 December 2008. Bulk precipitation was measured in an open field 200 m from the
forest stands using four collectors with a funnel diameter of 14.2 cm (158 cm2). The
funnels were set at 1.2 m height above the forest floor, had a sharp-edged rim, a slope of
45° and drained into polyethylene 2-L bottles placed below ground level to avoid the
growth of algae and to keep the samples cool. A nylon 1-mm mesh placed in the funnels
prevented contamination by large particles. Throughfall was sampled using similar
devices as for bulk precipitation. Per stand 15 collectors were set randomly. Stemflow
water was not sampled because of the relatively low contribution (< 1 %) to nutrient
deposition to the forest floor reported for these rough-barked tree species (Genouw et al.
2005). Water volumes were measured biweekly in the field and aliquots were transported
and stored in darkness at 5°C. For bulk precipitation, a composite sample was made in the
field, while throughfall samples were analysed per individual collector. All funnels, wire
meshes, and bottles were replaced biweekly by equipment rinsed by demineralised water.
Biweekly water samples were pooled volume-weighted to fourweekly samples for
chemical analysis. The same methods were used as for the individual beech tree (see
4.3.2.3). Based on visual observations of the oak canopy, the following phenological
periods were distinguished for the oak throughfall data: leaf development (8 May to 5
June), fully leafed period (6 June to 8 October) and leaf senescence (9 October to 3
December 2008).
7.3.2.3 Trend analysis
Data of precipitation, throughfall and stemflow were collected according to the guidelines
of the manual of the UNECE ICP Forests intensive monitoring programme (ICP Forests
2010). Precipitation, throughfall and stemflow were sampled biweekly from 1994 till
2010 in the oak-beech stand. Precipitation and throughfall were sampled using similar
devices as described in Section 7.3.2.2, except for the fact that the funnels had a wider
rim (4 mm). Bulk precipitation collectors (n = 4) were set up in an open field at less than
500 m from the forest. Throughfall was sampled with ten bulk collectors in a 0.25 ha plot,
distributed on two crossing lines with a distance of 10 m between two collectors on the
same line. Both for precipitation and throughfall, samples from all collectors were bulked
together for chemical analysis at every sampling event. Stemflow sampling was
141

Chapter 7
conducted only for beech because stemflow amounts were negligible for oak trees during
a preceding testing period. Stemflow was sampled for three beech trees that were selected
according to stem diameter (mean dbh and mean ±1 times the standard deviation of the
dbh of the trees in the plot in 1994). Stemflow collectors consisted of flexible
polyvinylchloride collars/gutters (7 cm diameter) attached horizontally to the stem at 1 m
height, draining to a series of 200-L polyethylene storage containers mounted in serial.
Stemflow samples were taken from the container nearest to each tree, with sample
volumes weighted to tree diameters, and bulked together for chemical analysis at every
sampling event. The different phenological stages in this study were delineated based on
K+ throughfall deposition, which was shown to increase during leaf development and leaf
senescence (Neary and Gizyn 1994; Houle et al. 1999; Staelens et al. 2007). Since this
approach agreed well with visual observations made in the other two case studies, this is
considered to be reliable.
Water samples were kept cool during transport and stored in darkness at 4°C after
filtration (0.45 µm). Samples were treated and analysed as prescribed by ICP Forests
(2010). Water pH (Multi 340i-glass electrode, WTW) and conductivity (Multi 340i-
Tetracon®325, WTW) were measured before and after filtration within one week after
sampling. Water concentrations of cations (Ca2+, K+, Mg2+, Na+, NH4+) and anions (NO3
-,
SO42-, Cl-) were measured with ion chromatography, (Dionex, Sunnyvale,USA).
Alkalinity was determined by means of potentiometric titration. Quality control included
analysis of blanks and participation to yearly ICP Forests water ring tests.
7.3.3 Canopy budget models
Although one specific version of the canopy budget model was already presented in
Section 5.3.3.2, this section and Fig. 7.1 provide a more extensive overview of the canopy
budget model and the assumptions tested in this chapter (Table 7.1).
The chemical composition of throughfall (TF) and stemflow (SF) water under a forest
canopy is the result of incident precipitation, wash-off of dry deposited gases, particles or
cloud droplets prior to the precipitation event, and the exchange between the canopy
surfaces and the solutions passing over them (Lovett et al. 1996):
TF SF TD CE PD DD CE+ = + = + + (7.1)
where TD is the total deposition, PD the precipitation deposition, DD the dry deposition
and CE the canopy exchange.
142

Atmospheric deposition from throughfall measurements
Total potentially acidifying deposition (TDac) can then be defined as the sum of TD of
NO3- and NH4
+ (TDN), SO42- (TDS) and Cl- (TDCl) corrected for the neutralizing effect of
base cations (TDBC; Na+, K+, Ca2+ and Mg2+) (UBA 2004):
-ac N S Cl BCTD TD TD TD TD= + + (7.2)
The net throughfall (NTF) of an ion is defined as the difference between TF (+ SF; if
available) and PD, and equals the sum of DD and CE.
( ) -NTF TF SF PD DD CE= + = + (7.3)
The aim of the canopy budget model is to distinguish DD from CE for all major ions.
Positive values for CE represent canopy leaching (CL) and negative canopy uptake (CU).
However, when we refer to CL or CU specifically, positive values are used. In the model,
all fluxes are expressed on an equivalent basis (molc) per unit ground surface area and
time. Further on, SF is not explicitly mentioned, but is included in TF for datasets where
this flux is available. In the following subsections, the various approaches for each time
step are discussed. Similar to Chapter 5 and 6, the term canopy uptake (CU) is used for N
compounds, although the term canopy retention would be more appropriate (see Chapter
4).
7.3.3.1 Time step
The canopy budget model is usually applied at an annual time step, although some studies
have used it on a semi-annual (Chapter 5-6), phenological (Staelens et al. 2007) or 1-
week time step (Duchesne et al. 2001). Although the effect of the time step as such was
not found to be very high for the two cases considered by Staelens et al. (2008), a higher
temporal resolution allows to introduce different NH4+/NO3
- uptake ratios and to exclude
canopy uptake (CU) of NH4+ and NO3
- during the leafless season (see below). Therefore,
the model was applied on a phenological, semi-annual and annual basis.
143

Chapter 7
TF (+ SF)
NTF = (TF + SF) - PD DD CE= +
DD = NTF
Na+, Cl-, SO42-
(NO3-), (WA)
DDF = NTF/PD
DD = DDF * PD CE = NTF - DDK+, Ca2+, Mg2+
PD- Bulk- Wet-only
Time Step- Annual- Semi-annual- Phenological
Tracer ion:- Na+
- Na+ adj.- SO4
2-
Yes
CENH4+H = CEBC – CEWAH+ included?
NH4+, (H+) Exchange eq. xH
WA- cation-anion balance- DOC + Alk.- DOC + pH
NO3-, (H+)
CEH= CENO3
Yes
CEDD
Exchange eq.- xNH4 = 6- xNH4 = f(phenology, tree species)
No
No
NO3-, WA
CE = 0 ?
Na+, Cl-, SO42-
CE = 0
Fig. 7.1 Flow chart of the canopy budget model, extended from Staelens et al. (2008). The measured deposition of major ions in precipitation deposition (PD) and throughfall (+ stemflow) deposition (TF (+SF)) is used to calculate net throughfall deposition (NTF), which consists of dry deposition (DD) and canopy exchange (CE). Ellipses are used to indicate model assumptions about the deposition factor (DDF) and on CE processes. Rounded rectangles indicate model assumptions for which various approaches were tested. Dotted horizontal lines separate equations used for different ions or ion groups. WA: weak acids; Na+ adj.: Na+ as tracer ion with adjusted dry deposition of K+; BC: base cations; DOC: dissolved organic carbon; xH: exchange efficiency of H+ relative to NH4
+; xNH4: exchange efficiency of NH4
+ relative to NO3-
144

Atmospheric deposition from throughfall measurements
Table 7.1 Overview of the different tested approaches at each step of the canopy budget model (see also Fig. 7.1). The number of approaches at each step is given in parentheses, which resulted in a total of 600 different canopy budget models
Step Tested approaches Time step (3) Phenological Semi-annual Annual Precipitation deposition (2) Wet-only data derived from bulk deposition measurements Bulk deposition measurements Tracer ion (3) Na+ Na+ with adjustment for a lower dry deposition rate of K+ SO4
2- Canopy leaching of weak acids (4)
Not included
Weak acids estimated based on cation-anion balance Weak acids estimated based on DOC measurements and alkalinity Weak acids estimated based on DOC measurements and pH Canopy uptake of NO3
- (5) Not included CU(NH4+H)=CL(BC); xNH4=6 xNH4=f(phenology, tree species) (Table 7.1) CU(NH4)=CL(BC); xNH4=6 xNH4=f(phenology, tree species) (Table 7.1) Canopy uptake of NH4
+ and NO3- Included
in the leafless season (2)* Not included *Not applicable to coniferous species. CU: canopy uptake, BC: base cations, xNH4: relative uptake efficiency of NH4
+ compared to NO3-
7.3.3.2 Precipitation deposition
Precipitation deposition can be measured by wet-only and bulk deposition devices. In
general, bulk deposition measurements are less accurate due to dry deposition of particles
and gases onto the collecting surfaces, hereby overestimating PD and underestimating
NTF (see Eq. 7.3). In this chapter, wet-only to bulk ratios determined at the beech site in
2003 (Staelens et al. 2005) were used to correct bulk precipitation data at the beech and
oak-pine sites: 0.68 (Na+), 0.66 (Cl-), 0.44 (K+), 0.54 (Ca2+), 0.67 (Mg2+), 0.76 (SO42--S),
0.79 (NO3--N), 2.70 (H+) and 0.78 (NH4
+-N).
7.3.3.3 Tracer ion
A filtering approach is used to estimate the DD of base cations K+, Ca2+ and Mg2+ (Ulrich
1983). In this approach, aerosols containing base cations are assumed to be deposited
with equal efficiency to the forest canopy as particles containing an inert tracer ion. This
145

Chapter 7
tracer ion is assumed not to be subject to canopy leaching (CE = 0). The DD of a base
cation X (DDX) is then calculated as:
. tracer ionX X
tracer ion
NTFDD BDBD
= (7.4)
Na+ is considered most suitable as tracer ion but also Cl- (Bouya et al. 1999) and SO42-
(Ignatova and Dambrine 2000; Ukonmaanaho and Starr 2002; Berger et al. 2008; Chapter
5) have been used, although Cl- and SO42- may overestimate DDX if significant gaseous
deposition of HCl or SO2 occurs (Staelens et al. 2008). In Chapter 5, Na+ was used for the
beech site and SO42- for a Danish spruce site. Therefore, the effect of these two ions as
tracer ion was tested. In addition, it has been suggested (Draaijers and Erisman 1995;
Ruijgrok et al. 1997; Staelens et al. 2008) that the deposition efficiency of K+, Ca2+, Mg2+
and Na+ may differ according to their mean mass diameter (MMD). Especially for K+ this
may hold since its MMD amounts to only 30 % of that of Na+. Results of DD
measurements of K+ on artificial foliage deviated from calculated DD by the canopy
budget model on the beech site, in contrast to Ca2+ and Mg2+ (Chapter 6). Therefore, in a
third approach the DD of K+ was adjusted by the ratio of the MMD of K+ to that of Na+,
measured to be 0.32 in the Netherlands in 1993 (Ruijgrok et al. 1997). Because of the
assumed negligible CE, the DD of Na+, Cl- and SO42- equals their NTF. Canopy leaching
of K+, Ca2+ and Mg2+ (CLX) was obtained from the difference between NTFX and DDX
(Eq. 7.3).
7.3.3.4 Canopy leaching of weak acids
Ion uptake of NH4+ and H+ is modelled based on the assumption that ion exchange is the
main process at the plant-water interface (Staelens et al. 2008). Several studies have
indicated a relationship between the loss of NH4+ (Stachurski and Zimka 2002; Umana
and Wanek 2010) or H+ (Schaefer et al. 1988; Lovett et al. 1996; Chiwa et al. 2004) and
the leaching of base cations in throughfall water. This is also supported by a relationship
between 15NH4+ uptake and NTF of base cations in Chapter 4. In the reference approach,
CU of NH4+ (CUNH4) and H+ (CUH) is estimated from the CL of base cations (CLBC):
4BCNH H
CU CL+ ++= (7.5)
However, several studies have indicated that CLBC cannot only be attributed to CU of
NH4+ and H+, but also to CL of weak organic acids (CLWA) (Chiwa et al. 2004; Zhang et
146

Atmospheric deposition from throughfall measurements
al. 2006; Staelens et al. 2007), which was also observed in Chapter 4. Eq. 7.5 then
becomes:
4-BC WANH H
CU CL CL+ ++= (7.6)
The inclusion of weak acid leaching also requires an estimate of the concentration of
weak acids (WA), i.e. the sum of organic acids and bicarbonate, in both precipitation and
throughfall water. De Vries et al. (2001) suggested that a calculation based on pH and
DOC measurements is the most reliable approach. The measured pH of a water sample is
then used to calculate its HCO3- concentration. When no DOC data are available, a mixed
approach including the calculation of HCO3- based on pH and of DOC based on the
charge balance has been recommended (de Vries et al. 2001). Alternatively, the
concentration of HCO3- can be estimated from the measured alkalinity. In this study,
these three approaches of estimating weak acids were tested, along with the approach of
excluding CLWA. Canopy leaching of weak acids is obtained by subtracting weak acid dry
deposition (DDWA) from NTF. Dry deposition is generally assumed to equal the PD of
WA (Staelens et al. 2008).
To separate the uptake of NH4+ and H+, a relative uptake efficiency factor is used. Based
on a laboratory experiment for Douglas fir, it is assumed that H+ has per mol an exchange
capacity that is six times larger than NH4+ (Van der Maas et al. 1991).
4
4
4
..
NHBCNH
NH H
TFCU CL
TF xH TF+
+
+ +
=+
(7.7)
Canopy uptake of H+ (CUH) is then calculated by subtracting the CUNH4 from the
CUNH4+H.
7.3.3.5 Canopy uptake of NO3-
Several field (Stachurski and Zimka 2002; Dail et al. 2009) and laboratory studies
(Bowden et al. 1989; Chapter 4) have demonstrated that forest canopies can incorporate
NO3-, but that preferentially NH4
+ is retained. However, in the reference canopy budget
model, no CU of NO3- (CUNO3) is generally included so that the DD of NO3
- equals its
NTF. De Vries et al. (2001) suggested to calculate the CU of NH4+ and NO3
- based on the
throughfall fluxes of NH4+ and NO3
-, using an efficiency factor of NH4+ vs NO3
- canopy
uptake (xNH4) with a proposed value of six:
147

Chapter 7
( )-
4-
4 3
4
4
4
.
.NH NO
NH NONH
3xNH TF TF
CUxNH TF
+
+
+
+
++
+= (7.8)
However, in Chapter 4 a highly variable NH4+/NO3
- uptake ratio among tree species and
phenological stages was observed. Therefore, a tree species specific xNH4, which also
varied for the different phenological stages, was tested in this study (Table 7.2). In case of
a semi-annual or annual time step, a time-weighted average of xNH4 was used in the
calculations.
A disadvantage of including CUNO3 in the model is that the charge balance of the canopy
is not maintained (Staelens et al. 2008). A modification of the model could be to set
CUNO3 equal to the CUH, in accordance with previous observations for beech (Stachurski
and Zimka 2002). Eq. 7.6 then becomes:
4-BC WANH
CU CL CL+ = (7.9)
The CUNO3 can then again be calculated by Eq. 7.8 and will result in a higher value, as for
NH4+. This leads to five possible variations to calculate CUNO3. Dry deposition of NH4
+,
NO3- and H+ is obtained by subtracting the CU from the NTF.
Table 7.2 Ammonium to nitrate uptake ratios used for the calculation of the different canopy budget model versions, based on the results of Chapter 4. For semi-annual and annual time steps a time-weighted average of the ratios was used. For the oak-beech stand a weighted average of values for beech and pendunculate oak was used, based on basal area reported by De Couck. (2011)
Beech Pedunculate oak Scots pine Oak-beech
Leaf development 2.1 2.9 93.6 2.6 Fully leafed 4.7 4.1 4 4.3 Leaf senescence 7.7 3.9 9.2 5.3 Leafless 4.3 5.1 39.6 4.8 Leafed 5 4.2 16.7 4.5* Annual 4.8 3.7 49.2 4.1* *approximate value, ratios used in the time trend analysis vary between years depending on the length of each period
148

Atmospheric deposition from throughfall measurements
7.3.3.6 Canopy uptake of NH4+ and NO3
- during the leafless period
Several studies have demonstrated retention of 15NH4+ and 15NO3
- by the woody plant
surface (Bowden et al. 1989; Boyce et al. 1996; Wilson and Tiley 1998; Dail et al. 2009;
see also Chapter 4). However, Chapter 4 also indicated that inorganic N retention by
woody surfaces could be due to physicochemical adsorption rather than to actual
assimilation. Moreover, in Chapter 4 no relationship between NTF of K+, Ca2+ and Mg2+
and 15NH4+ uptake was observed during the leafless season, in contrast to the fully leafed
and leaf development periods. This indicates that likely no ion-exchange reaction occurs
between plant and atmosphere during the leafless season for deciduous species (CU = 0)
and hence that Eq. 7.5, 7.6 and 7.9 are not valid. Since N adsorbed to the plant surface
cannot be measured from throughfall measurements, but was generally low compared to
retention by leaves (Chapter 4), adsorbed N was assumed to be zero during the leafless
season for deciduous species (beech and pedunculate oak).
7.3.4 Data analysis
The combination of all approaches listed above (Table 7.2) resulted in 720 model
versions. Since the approach of no canopy uptake of NH4+ and NO3
- during the leafless
period could not be calculated with an annual time step, 600 models remained. For the
case studies on the beech tree and the coniferous vs. deciduous forest stands no DOC data
were available, hereby resulting in 300 different models. For the comparison of forest
types, deposition ratios between the coniferous and deciduous stand were evaluated. Time
trends in annual deposition fluxes on the oak-beech stand were investigated through
Kendall tests (Kendall 1975) to detect monotonically increasing or decreasing trends.
This non-parametric regression method is based on the ranks of the observations and does
not assume a fixed relationship in the time trend. Kendall’s tau statistic represents the
non-parametric correlation between a time series of data and time. When a linear trend
can be assumed, the median slope and trend line is calculated non-parametrically.
The effect of different model versions was evaluated for two summarizing variables, i.e.
the total N deposition (NH4+ + NO3
-) (TDN) and the potentially acidifying deposition
(TDac; Eq. 7.2 in Section 7.3.3). Per considered time step (Table 7.2), the effect of
different steps in the model, i.e. the type of precipitation data, the tracer ion, the CL of
weak acids, the NO3- uptake and the CU of N during the leafless season (Table 7.2) was
assessed by means of a multi-way Analysis of Variance (ANOVA). To evaluate model
149

Chapter 7
steps for the time trend analysis, a nonparametric Permanova test was performed on
Kendall’s tau and the median slope (Anderson 2001). The effect of time step was
assessed by a one-way ANOVA. All calculations and statistical analyses were performed
with R version 2.13.0 (R Development Core Team 2011). The obtained range in TDN and
TDac of the different stands in this study was compared with site-specific critical loads of
acidity and nutrient N (eutrophication), determined with the widely-used simple mass
balance model (UBA, 2004). Input data were as much as possible derived from site-
specific measurements or regional data, as described by Staelens et al. (2009).
7.4 Results
7.4.1 Deposition onto an individual beech canopy
Application of the 300 different canopy budget models on the data for the beech canopy
resulted in a canopy exchange (CE) ranging from -20 to 0 kg N ha-1 yr-1 and a dry
deposition (DD) ranging from 6 to 28 kg N ha-1 yr-1 (Fig. 7.2). The highest canopy uptake
(CU; first frequency class in Fig. 7.2) was calculated using Na+ as a tracer (without
adjustment for a different dry deposition rate of K+), excluding CL of weak acids (WA)
and including CU of N during the leafless season. The lowest CU (last frequency class in
Fig. 7.2) was obtained with SO42- as a tracer ion, including CL of WA, using bulk
precipitation data and with a phenological time step. This lower CU of N was caused by
occasionally negative canopy leaching (CL) of base cations or a high value for the
estimated CL of WA, especially during leaf development. Lowest DD of N was
calculated using SO42- as a tracer ion, including CL of WA and using bulk precipitation
data, while the highest DD was obtained with Na+ as a tracer ion (with or without
adjustment for K+), excluding CL of WA, using wet-only precipitation data and including
CU of N during the leafless season. When using a phenological time step, calculated DD
of N during the leaf development period was negative when CL of WA was included.
The highest variance in total N deposition (TDN) could be explained by CL of WA,
followed by CU of N during the leafless season (in case of a phenological or semi-annual
time step), the tracer ion used and the precipitation data. For total acidifying deposition
(TDac) the highest variance could be explained by the tracer ion used, CL of WA and CU
of N during the leafless season (Table 7.3). For TDN, all factors were found to be
significant, while for TDac the effect of NO3- uptake was not significant in the semi-
150

Atmospheric deposition from throughfall measurements
annual and annual time step. Time step itself also had no significant effect both on TDN (p
= 0.838) and TDac (p = 0.998).
Including CL of WA significantly lowered CU of NH4+ and consequently lowered DDN,
TDN and TDac (Fig. 7.3). The use of SO42- as a tracer ion increased estimated DD of base
cations compared to Na+, hereby decreasing CL of these base cations and CU and DD of
NH4+. This decreased TDN but increased TD of base cations resulted in a greatly reduced
TDac. Using bulk precipitation data decreased TDN and TDac estimates. The CU of NO3-
explained the least variance in the model results. A significant difference between
excluding and including CU of NO3- was only found for TDN.
Table 7.3 Degrees of freedom (df), F values, Sum of Squares and p values of the multi-way ANOVA analysis assessing the effect of different steps in the canopy budget model on total nitrogen (N) and total acidifying deposition to an individual beech tree. Bold values are significant at p < 0.05
Total N deposition Total acidifying deposition Source of variation Df Sum of
Squares F p Sum of
Squares F p
a) Phenological time step Precipitation 1 215 142.9 < 0.001 1237285 97.2 < 0.001 Tracer ion 2 749 248.6 < 0.001 18150635 712.7 < 0.001 Weak acids 1 2308 1532.1 < 0.001 11760662 923.6 < 0.001 NO3
- uptake 4 29 4.9 0.001 150065 3.0 0.023 Canopy uptake leafless 1 507 336.5 < 0.001 2581627 202.7 < 0.001 b) Semi-annual time step Precipitation 1 237 153.9 < 0.001 1447603 8.3 < 0.001 Tracer ion 2 798 258.7 < 0.001 19108368 14.4 < 0.00 Weak acids 1 1472 954.4 < 0.001 7499000 60.8 < 0.001 NO3
- uptake 4 22 3.6 0.008 113115 2.1 0.084 Canopy uptake leafless 1 507 328.5 < 0.001 2583094 93.2 < 0.001 c) Annual time step Precipitation 1 147 12.5 < 0.001 906756 3.0 < 0.001 Tracer ion 2 864 46.1 < 0.001 15011633 74.2 < 0.001 Weak acids 1 576 54.9 < 0.001 2936651 26.4 < 0.001 NO3
- uptake 4 17 4.9 0.002 84886 1.7 0.163
151
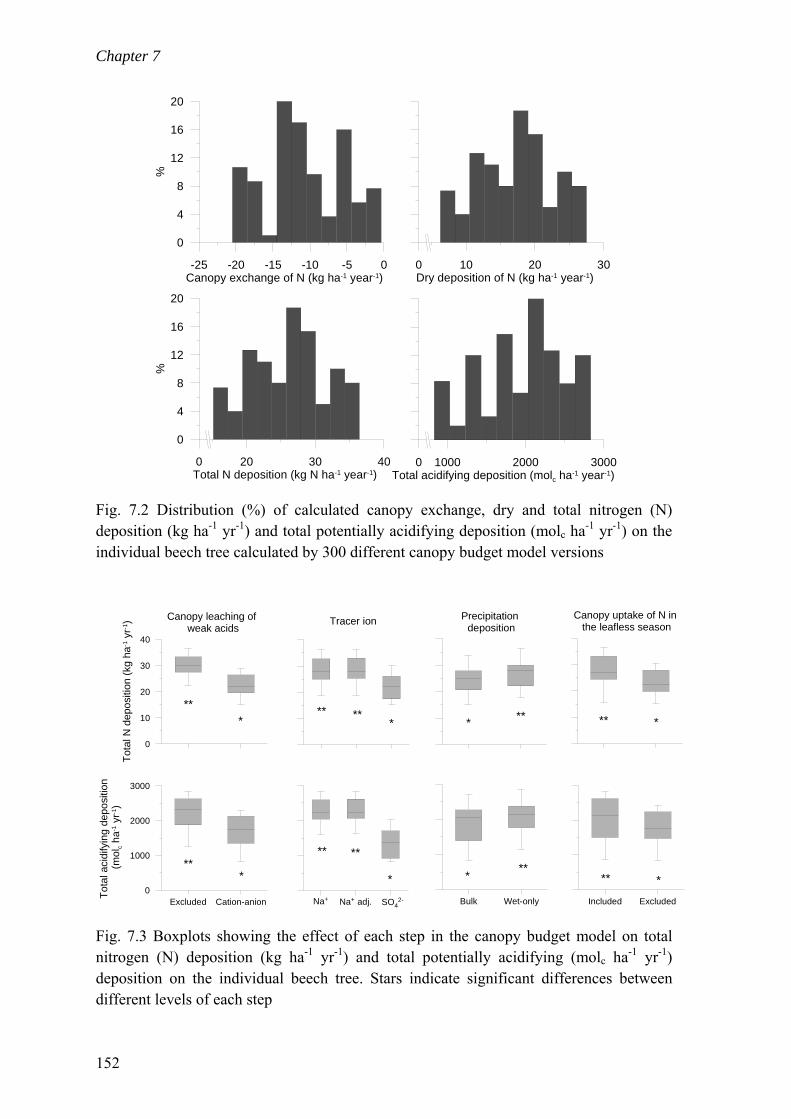
Chapter 7
-25 -20 -15 -10 -5 0Canopy exchange of N (kg ha-1 year-1)
0
4
8
12
16
20
%
0 10 20Dry deposition of N (kg ha-1 year-1)
30
0 20 30 40Total N deposition (kg N ha-1 year-1)
0
4
8
12
16
20
%
0 1000 2000 3000Total acidifying deposition (molc ha-1 year-1)
Fig. 7.2 Distribution (%) of calculated canopy exchange, dry and total nitrogen (N) deposition (kg ha-1 yr-1) and total potentially acidifying deposition (molc ha-1 yr-1) on the individual beech tree calculated by 300 different canopy budget model versions
Tracer ion
0
10
20
30
40
Tota
l N d
epos
ition
(kg
ha-1 y
r-1) Canopy leaching of
weak acidsPrecipitation
depositionCanopy uptake of N in
the leafless season
0
1000
2000
3000
Tota
l aci
dify
ing
depo
sitio
n (m
olc h
a-1 y
r-1)
Excluded Cation-anion Bulk Wet-only Included Excluded
***
** *** * ** ** *
** ** ***
** **
***
SO42-Na+ adj.Na+
Fig. 7.3 Boxplots showing the effect of each step in the canopy budget model on total nitrogen (N) deposition (kg ha-1 yr-1) and total potentially acidifying (molc ha-1 yr-1) deposition on the individual beech tree. Stars indicate significant differences between different levels of each step
152

Atmospheric deposition from throughfall measurements
7.4.2 Deposition ratio between a coniferous and a deciduous stand
Application of the 300 canopy budget models resulted in a ratio of TDN (coniferous to
deciduous forest stand) between 1.02 and 1.75 and a ratio of TDac (coniferous to
deciduous) between 0.68 and 1.46 (Fig. 7.4). The highest variance on the ratios of TDN
and TDac could be explained by CU of N in the leafless season followed by the CL of WA
the tracer ion and the (Table 7.4). No significant effect of NO3- uptake was found (except
with an annual time step), and the type of precipitation data only significantly affected
TDN deposition ratios for a annual time step. Time step had a significant effect on TDac (p
< 0.001) but not on TDN (p = 0.128). Including CL of WA increased the coniferous to
deciduous ratio of TDN and TDac because TDN of pedunculate oak decreased more
relative to Scots pine (Fig. 7.5). The use of SO42- also increased the ratio of TDN and TDac
because the deposition ratio of SO42- was lower than of Na+. Excluding CU of N during
the leafless season significantly decreased TDN on the pedunculate oak stand and
consequently increased the ratio of TDN and TDac. Wet-only precipitation data yielded a
higher TDac ratio than bulk precipitation data and a phenological time step significantly
decreased the TDac ratio compared to an annual or semi-annual time step.
1 1.2 1.4 1.6 1.8Total N deposition ratio
(Scots pine / pedunculate oak)
0
10
20
30
40
%
0.6 0.8 1 1.2 1.4 1.6Total acidifying deposition ratio(Scots pine / pedunculate oak)
Fig. 7.4 Distribution (%) of the ratio of total nitrogen (N) deposition and total potentially acidifying deposition between a Scots pine and a pedunculate oak stand calculated by 300 different canopy budget model versions
153

Chapter 7
It needs to be mentioned that in the pedunculate oak stand calculated DD values of N
during leaf development were negative when CL of WA was included. For the Scots pine
stand, CE of Ca2+ and/or Mg2+ was always negative during leaf development and
senescence and CE of NO3-, NH4
+ and H+ was always positive during leaf development
and when CL of WA was included also during other phenological periods.
Table 7.4 Degrees of freedom (df), F values, Sum of Squares and p values of the multi-way ANOVA analysis assessing the effect of different steps in the canopy budget model on the ratio of total N and total acidifying deposition to a coniferous and a deciduous stand. Bold values are significant at p < 0.05
Total N deposition Total acidifying deposition Source of variation Df Sum of
Squares F p Sum of
Squares F P
a) Phenological time step Precipitation 1 0.00 0.5 0.479 0.19 208.0 < 0.001 Tracer ion 2 0.02 7.4 < 0.001 0.97 525.0 < 0.001 Weak acids 1 1.69 1067.8 < 0.001 0.53 577.8 < 0.001 NO3
- uptake 4 0.01 1.8 0.143 0.01 1.5 0.216 Canopy uptake leafless 1 2.22 1398.9 < 0.001 1.20 1304.3 < 0.001 b) Semi-annual time step Precipitation 1 0.00 0.7 0.418 0.16 133.02 < 0.001 Tracer ion 2 0.01 2.3 0.103 0.08 35.4 < 0.001 Weak acids 1 2.82 1155.8 < 0.001 1.23 1034.7 < 0.001 NO3
- uptake 4 0.00 0.4 0.780 0.00 0.5 0.705 Canopy uptake leafless 1 2.47 1009.9 < 0.001 1.53 1282.9 < 0.001 c) Annual time step Precipitation 1 0.01 28.9 < 0.001 0.18 1270.3 < 0.001 Tracer ion 2 0.01 13.0 < 0.001 0.09 308.6 < 0.001 Weak acids 1 3.55 1244.5 < 0.001 0.79 12775.2 < 0.001 NO3
- uptake 4 0.00 2.8 0.038 0.00 3.6 0.011
154

Atmospheric deposition from throughfall measurements
1
1.2
1.4
1.6
1.8To
tal N
dep
ositi
on ra
tio(S
cots
pin
e / p
endu
ncul
ate
oak)
Canopy leaching of weak acids
Precipitation deposition Tracer ion
Canopy uptake of N in the leafless season
0.6
0.8
1
1.2
1.4
1.6
Tota
l aci
dify
ing
depo
sitio
n ra
tio(S
cots
pin
e / p
edun
cula
te o
ak)
Excluded Cation-anion Bulk Wet-only Included ExcludedNa+ Na+ adj. SO42-
*
** * ** * * **
*
***
*** *
**
*
**
*
**
Fig. 7.5 Boxplots showing the effect of each step in the canopy budget model on the ratio of total nitrogen (N) deposition and total potentially acidifying deposition between a Scots pine and a pedunculate oak stand. Stars indicate significant differences between different levels of each step
7.4.3 Determination of trends in deposition
According to the Kendall tests, yearly TDN on the beech site calculated by the 600
different canopy budget models showed a significant (p < 0.05) time trend over 1999-
2010 for 66 % of the models (Fig. 7.6). Kendall’s tau value varied from -0.76 for the
highly significant time trends to -0.03 for non-significant time trends. The median slope
varied from -1.75 to -0.05 molc N ha-1 yr-1 (Fig. 7.6). Yearly TDac showed a significant (p
< 0.05) time trend for 58 % of the tested models. Kendall’s tau value varied from -0.70 to
-0.12 and the median slope from -197 to -26 molc N ha-1 yr-1 (Fig. 7.6).
155

Chapter 7
-0.8 -0.6 -0.4 -0.2 0
0
10
20
30
40%
0 0.2 0.4 0.6 0.8 1
0
20
40
60
80
100
-2 -1.6 -1.2 -0.8 -0.4 0
0
10
20
30
40
-0.8 -0.6 -0.4 -0.2 0Kendall's Tau
0
10
20
30
40
%
0 0.2 0.4 0.6 0.8Kendalls p-value
0
20
40
60
80
100
-200 -160 -120 -80 -40 0Median slope
0
10
20
30
40
Fig. 7.6 Distribution (%) of Kendalls tau, estimated median slope (a: kg N ha-1 yr-1; b: molc ha-1 yr-1) and p values obtained by applying Kendall tests on time series of (a) total nitrogen (N) deposition (kg ha-1 yr-1) and (b) total potentially acidifying deposition (molc ha-1 yr-1) calculated by 600 canopy budget model versions
The variation in Kendall’s tau values for TDN and TDac could mainly be explained by the
CL of WA followed by the type of precipitation data, the tracer ion and the CU of N in
the leafless season, although the last factor was not significant for a semi-annual time step
(Table 7.5). Choices regarding the CU of NO3- had no significant effect on the tau value
of TDN and TDac. Using wet-only precipitation data decreased TDN by 13 % from 1999 to
2010, while TDN reduced by 11 % with bulk precipitation data. Similarly, TDac decreased
by 22 and 19 % using wet-only and bulk data, respectively (Fig. 7.7). Using SO42- as a
tracer reduced TDN and TDac with 21 and 34 %, respectively, compared to 8 and 13 %,
respectively, for Na+. No significant difference was observed between Na+ and Na+
adjusted to reduce dry K+ deposition. Furthermore, no significant trend was found for
TDN and TDac when CL of weak acids was estimated from the difference between cations
and anions (−15 % TDN and −3.5 % TDac; in 12 years). In contrast, this trend was highly
significant when WA were estimated from DOC and alkalinity measurements (−25 %
TDN and −30 % TDac). Excluding CL of WA and including WA estimated from DOC and
pH measurements showed intermediate but significant trends. Estimated WA in TF are
156

Atmospheric deposition from throughfall measurements
approximately the same for the cation-anion balance and DOC combined with alkalinity
measurements, while in PD estimated WA from DOC combined with alkalinity
measurements were approximately four times higher. Excluding CU of N during the
leafless season reduced TDN and TDac with 12 and 20 %, respectively, and including with
14 and 22 %, respectively.
Table 7.5 Degrees of freedom (df), F values, Sum of Squares and P values of the multi-way ANOVA analysis assessing the effect of different steps in the canopy budget model on Kendalls tau of total N and total acidifying deposition on a deciduous oak-beech stand. Bold values are significant at p < 0.05
Total N deposition Total acidifying deposition Source of variation Df Sum of
Squares F p Sum of
Squares F P
a) Phenological time step Precipitation 1 0.04 21.0 < 0.001 0.04 35.6 < 0.001 Tracer ion 2 0.43 107.1 < 0.001 0.71 285.5 < 0.001 Weak acids 1 1.92 316.4 < 0.001 1.40 375.8 < 0.001 NO3
- uptake 4 0.01 1.0 0.374 0.00 0.5 0.777 Canopy uptake leafless 1 0.38 185.8 < 0.001 0.11 89.0 < 0.001 b) Semi-annual time step Precipitation 1 1.03 180.2 < 0.001 0.06 58.9 < 0.001 Tracer ion 2 5.02 440.2 < 0.001 1.02 485.6 < 0.001 Weak acids 1 22.55 1317.9 < 0.001 2.47 784.7 < 0.001 NO3
- uptake 4 0.03 1.2 0.316 0.01 1.4 0.220 Canopy uptake leafless 1 0.01 0.9 0.320 0.09 89.9 < 0.001 c) Annual time step Precipitation 1 0.97 172.2 < 0.001 0.03 34.7 < 0.001 Tracer ion 2 3.81 337.2 < 0.001 0.54 308.8 < 0.001 Weak acids 1 18.00 1060.7 < 0.001 1.33 505.4 < 0.00 NO3
- uptake 4 0.05 2.1 0.084 0.00 0.9 0.495
157

Chapter 7
010
2030
4050
60
Bulk: K = -1.2Wet-only: K = -1.32 0
1000
3000
Bulk: K = -116Wet-only: K = -143
Tota
lNde
posi
tio
010
2030
4050
60
Na : K = -1.14+
Na adj: K = -1.17+
SO : K = -1.4442-
Tota
laci
dify
ing
depo
sitio
n
010
0030
0050
00
Na : K = -112+
Na adj: K = -117+
SO : K = -15342-
010
2030
4050
60
Exluded: K = -1.39Cation-anion: K = -0.67DOC + alk.: K = -1.22DOC + pH : K = -1.38 0
1000
3000
5000
Exluded: K = -148Cation-anion: K = -73DOC + alk.: K = -148DOC + pH : K = -148
Time
010
2030
4050
60
2000 2002 2004 2006 2008 2010
Included : K = -1.28Excluded : K = -1.34
Time
010
0030
0050
00
2000 2002 2004 2006 2008 2010
Included : K = -137Excluded : K = -119
(kg
N h
a y
r)
-1- 1
n
(mol
ha
yr
)c
-1-1
d
c
b
a
Fig. 7.7 Time series of total nitrogen (N) deposition and total potentially acidifying deposition calculated with canopy budget models using varying (a) precipitation data, (b) tracer ion, (c) canopy leaching of weak acids and (d) canopy uptake of N during the leafless season. The estimated median slope K (kg N ha-1 yr-1) of each approach is given
7.5 Discussion
7.5.1 Effect of time step, type of precipitation data and tracer ion
Using different time steps in the canopy budget model allowed introducing different
canopy exchange (CE) approaches, which are discussed further in this paragraph.
However, there was also an effect of time step as such, with phenological or semi-annual
time steps generally resulting in lower nitrogen and potentially acidifying deposition
158

Atmospheric deposition from throughfall measurements
(TDN and TDac, respectively), lower TDac ratios between a coniferous and deciduous
stand and in steeper decreasing deposition time trends, i.e. lower Kendall tau values and
median slopes. The negative DD values of NO3-, NH4
+ and H+ calculated during the
period of leaf development may be caused by 1) underestimated CL of base cations which
is in turn caused by overestimated DD of base cations or 2) overestimated canopy
leaching (CL) of weak acids (WA) by the cation-anion balance. The first cause was
confirmed by negative CE values of Ca2+ and Mg2+ during the period of leaf
development. This indicates that both Na+ and SO42- may be subject to leaching during
leaf development (Reiners and Olson 1984; Staelens et al. 2007), which makes them less
suitable as tracer ion. Staelens et al. (2007, 2008) suggested solving this by using the
DDF of Na+ calculated for the fully leafed period in the leaf development and senescence
period. However, for the Scots pine stand this will not be sufficient as CE of Ca2+ and
Mg2+ was also negative during the leafless period. Hence, more research is needed on the
assumption of inertness for the tracer ion and the deposition efficiency of different
particles.
Although the type of precipitation data was generally not the main source of variance
between model versions, it did have a significant effect on the calculated TDN and TDac in
the three case studies. In particular for Na+, Cl-, K+, Ca2+ and Mg2+, which have high wet-
only to bulk ratios, the NTF was significantly reduced when bulk instead of wet-only
precipitation deposition was used. This in turn reduced CE of base cations and
consequently CE of DD of N compounds. In general, the difference in TDN or TDac
between bulk and wet-only precipitation data increased when throughfall deposition
increased, i.e. throughfall of Scots pine was higher than of pedunculate oak and higher in
1999 compared to 2010.
Wet-only to bulk deposition ratios used in this study were measured during nine months
in 2003 on the beech site. As this ratio between wet-only and bulk deposition
measurements depends on local gas and aerosol concentrations, turbulence intensities and
the collection efficiency of the samplers (Staelens et al. 2005), they could have changed
in 2010 due to e.g. decreasing base cation deposition (Verstraeten et al. 2010) or different
meteorological conditions. For the trend analysis, wet-only to bulk ratios may also have
varied throughout the years. This will reduce the effect of the type of precipitation data on
TDN and TDac for the individual beech tree. However, the aim of this study was to
simulate the effect of using bulk deposition measurements instead of wet-only deposition
159

Chapter 7
measurements. As the ratios used in this study were generally well in range with other
studies (Table 1 in Staelens et al. 2005), they may serve as a valuable input for
simulation.
As indicated in Section 7.3.3.3, using SO42- as tracer ion may significantly overestimate
DD of base cations if significant gaseous SO2 deposition occurs, and consequently
underestimate DD of N. This is confirmed by the present study: TDN to the beech canopy
was significantly lower with SO42- than with Na+ as a tracer ion; and SO2 deposition at
this site was estimated to be 50 mmolc m2 yr-1, while almost no particulate SO42- was
deposited on artificial foliage (see Chapter 6). The ratio of TDN and TDac between a
coniferous and deciduous stand were significantly affected by the tracer ion due to the
fact that in this case the throughfall deposition ratio of SO42- was lower than of Na+. An
opposite effect is expected if the throughfall deposition ratio of SO42- would be higher
than of Na+. In the time trend analysis of the oak-beech stand, steeper decreasing trends
were observed with SO42- as tracer ion since both the precipitation and throughfall
deposition of SO42- decreased more significantly from 1999 to 2010 than for Na+. It is
clear that for regions with high SO2 deposition, Na+ can be considered to be a more
reliable tracer ion. In some cases, such as in coastal regions (Chapter 5) the use of SO42-
may be justified if particle deposition dominates DD of S, but then still the generally finer
SO42- particles (Lindberg et al. 1986; Ruijgrok et al. 1997) will be deposited with lower
deposition efficiency (Slinn 1982) and results need to be handled with care.
We did not observe a significant effect between using Na+ as a tracer ion and using Na+
adjusted for a lower DD of K+ in the three case studies. This was mainly due to the fact
that atmospheric K+ deposition is generally low, so that the impact of a reduced DD of K+
was not detectable in the output of the canopy budget model (here summarized by TDN
and TDac). However, TDac for the individual beech tree and the ratio of TDac between the
coniferous and deciduous stand were slightly increased when using Na+adj. We only
adjusted the DDF of K+ as this was suggested by several authors (Ruijgrok et al. 1997;
Staelens et al. 2008) and also concluded from Chapter 6. Furthermore, the ratio between
the MMD of K+ and Na+ was based on data of Ruijgrok et al. (1997) assuming a linear
relationship between particle diameter and deposition efficiency for particles larger than
0.5 µm (Slinn 1982). However, this relationship may be inadequate under some
circumstances, e.g. particular meteorological conditions or different geometry of the
surface (Garland 2001). Further research could help to reveal these questions and maybe
160

Atmospheric deposition from throughfall measurements
suggest an adjusted DDF for Ca2+ and Mg2+ too, which will increase the impact on TDN
and particularly TDac.
7.5.2 Effect of canopy exchange calculations: canopy leaching of weak acids, NO3-
uptake and canopy uptake of N during the leafless season
In the three case studies, a strong effect of including or excluding CL of WA estimated by
the cation-anion balance was observed. Especially for beech and oak significant CL of
WA was calculated, while this was less important for the pine stand, i.e. leaching of WA
was on average 37 % higher in the oak stand than in the pine stand. This is in agreement
with base cation leaching in the studied pair of coniferous-deciduous stands, i.e. 53 %
higher in the oak than in the pine stand, and in literature (Rothe et al. 2002; De Schrijver
et al. 2007). In the trend analysis, CL of WA decreased significantly from 1999 to 2010,
hereby decreasing the downward trend of TDN. This high impact of including WA in the
canopy budget model illustrates its importance, especially in deciduous stands where CL
of WA contributed on average 50 % to CL of base cations. Estimating WA by means of
the cation-anion balance was considered to be a reliable approach by de Vries et al.
(2001), given that all other major ions are analysed precisely and accurately (Staelens et
al. 2008). However, in the trend analysis the cation-anion approach differed significantly
from the two DOC-based approaches. Using DOC measurements combined with HCO3-
estimated from pH yielded very low WA estimates and resulted in similar TDN and TDac
values as excluding WA from the canopy budget model. In contrast, DOC measurements
combined with HCO3- estimated from measured alkalinity decreased TDN and TDac, but
to a lesser extent than by using the cation-anion balance for WA. Weak acids in
throughfall and PD estimated by the DOC approaches showed no time trend and
consequently the trend analysis of TDN and TDac estimated by this approach did not differ
from the approach where CL of WA was excluded. In general, measuring WA can be
preferred above estimating them. However, estimated HCO3- from alkalinity may contain
some organic acids and calculated HCO3- from pH may be less accurate due to an
uncertainty in pH measurements on weakly buffered water samples like precipitation
samples (INBO, personal communication). Hence, more research is needed with regard to
the estimation of WA in precipitation and throughfall samples.
In Chapter 2 and 5, a low but significant uptake of wet deposited NO3- by tree leaves was
observed, particularly during the period of leaf development. Incorporating this NO3-
161

Chapter 7
uptake in the canopy budget model increased the calculated TDN on the individual beech
tree significantly and is recommended given the clear experimental evidence.
Nevertheless, this factor had neither effect on the comparison between a coniferous and a
deciduous stand nor on the trend analysis and might be less important here. Also, TDN did
not differ between the different calculation approaches of NO3- uptake, suggesting that
the proposed xNH4 efficiency factor of six by de Vries et al. (2001) may also be suitable
and that no differentiation according to leaf phenology is necessary. However, the studied
tree species in this thesis were all shown to preferentially retain NH4+ compared to NO3
-.
The effect of the different calculation approaches of NO3- uptake will likely increase for
species that have been shown to preferentially retain NO3- in their foliage instead of
NH4+, such as red spruce (Picea rubens Sarg.) (Gómez-Guerrero et al. 2008; Dail et al.
2009). Therefore, it is still suggested to use a tree species specific xNH4 at a phenological
time step when available. Furthermore, calculating CE of H+ by Eq. 7.5 or 7.6, often
resulted in (impossible) negative DD values for the individual beech tree and the trend
analysis, while this was generally not the case when CE of H+ was determined via the CE
of NO3-.
In this chapter we introduced the new concept of excluding the CU of NH4+ and NO3
-
during the leafless season for deciduous species, based on previous observations (Chapter
4). As expected, this approach significantly reduced TDN and TDac for the individual
beech tree (Fig. 7.3) and the ratios of TDN and TDac between a coniferous and deciduous
stand (Fig. 7.5). It also decreased the estimated tau value and estimated slope in the trend
analysis for TDN (Fig. 7.7). This approach may be suitable for deciduous trees that were
found to retain almost no N in the twigs and stems (Chapter 4). Still, it should be taken
into account that in mature temperate deciduous stands, some N can be retained by
lichens and microbial assimilation processes (Reiners and Olson 1984), which were
shown to occur mainly on older trees (Fritz et al. 2008; Ranius et al. 2008). Several
studies have reported the significant contribution of N assimilation by epiphytic lichens to
total CU in coniferous (Lang et al. 1976; Johansson et al. 2010) and tropical forests
(Clark et al. 2005; Umana and Wanek 2010), but not in deciduous stands. If the latter is
also significant, which needs to be investigated, attributing all NTF of N to DD during the
leafless period will likely underestimate TDN. For the Scots pine stand used in this study,
CU of N in winter was not excluded since needles are then still present and since
significant amounts of 15N were found to be adsorbed to the bark surface, as was
162

Atmospheric deposition from throughfall measurements
suggested by Wilson and Tiley (1998) and Dail et al. (2009). This retained N is likely not
subject to ion exchange processes with K+, Ca2+ and Mg2+ as assumed in the canopy
budget model. However, this remains to be investigated.
7.5.3 Comparison with literature data
Based on this thesis and other literature data (Ignatova and Dambrine 2000; Staelens et al.
2008; Zhang et al. 2006), some canopy budget model approaches can be considered more
reliable than others, e.g. Na+ is a more suitable tracer ion than SO42-, and the use of wet-
only precipitation data and including CL of WA is recommended. If we only consider
these models, DD to the beech canopy was 10-20 kg N ha-1 yr-1,TDN was 19-29 kg N ha-1
yr-1 and TDac 1664-2285 molc ha-1 yr-1. This was comparable to the range at the Heidebos
site for the oak stand (DDN: 8-16 kg N ha-1 yr-1; TDN: 20-28 kg N ha-1 yr-1; TDac: 1357-
1902 molc ha-1 yr-1) but higher for the pine stand with regard to N (DDN: 23-24 kg N ha-1
yr-1; TDN: 34-35 kg N ha-1 yr-1; TDac: 1612-1895 molc ha-1 yr-1). For the oak-beech stand
at the Aelmoeseneie forest in 2010 this was 15-31 kg N ha-1 yr-1, 25-41 kg N ha-1 yr-1 and
2228-3382 molc ha-1 yr-1, respectively, for DDN, TDN and TDac, respectively. Neirynck et
al. (2008) reported much higher DDN and TDN for a Scots pine stand in the same region,
however, this stand was 70 years old and consequently had a higher collecting surface for
dry deposition. The ratio of TDN between a coniferous and deciduous stand was also
within the range reported in a meta-analysis on this topic (Rothe et al. 2002; De Schrijver
et al. 2007). To our knowledge, no such comparison has been done for TDac.
The modelled critical load of acidification was 1960-2285 molc ha-1 yr-1 for the deciduous
species at the two sites and 1294 eq ha-1 yr-1 for pine at the Heidebos site. For
eutrophication, the critical loads amounted to 13-14 (deciduous species) and 8 (pine) kg N
ha-1 yr-1. The above-mentioned ranges for TDN, all exceed the critical loads for
eutrophication, while critical loads for acidification are not all exceeded by the ranges of
TDac, i.e. for the Heidebos site the obtained ranges are below the critical loads and for the
beech canopy approximately around the critical load values. This highlights again the
importance of the canopy budget model approach used to calculate total atmospheric
deposition on forest ecosystems and the need to verify some of the assumptions made.
7.5.4 Local effects
The three case studies for which the different canopy exchange approaches were tested
are all situated in the region of Flanders. In the majority of the forests in this region,
163

Chapter 7
critical loads for acidifying and eutrophying deposition are exceeded (Craenen et al.
2000; Staelens et al. 2009). It is therefore certainly relevant to quantify total deposition,
evaluate trends or compare different forest types for mitigation strategies in this region
and this study can be considered as an important contribution to this aim. However,
different effects of the canopy exchange calculations might be observed in regions such
as China or India, where N and particularly S deposition have more recently started to rise
than in Western Europe (Fowler et al. 2009) or in unpolluted boreal forests as Northern
Europe (Ukonmaanaho and Starr 2002). The canopy budget model has not been properly
evaluated for subtropical and tropical forest types, where large amounts of N are shown to
be assimilated by epiphytic and bryophytic lichens (Umana and Wanek 2010).
Furthermore, even within temperate forests different results might be obtained for
different tree species, e.g. when NO3- is retained preferentially compared to NH4
+ (see
7.5.2).
7.6 Conclusion
In this study varying approaches to parameterize the canopy budget model were used. As
such we obtained a range in total and potentially acidifying deposition onto a deciduous
forest canopy, deposition ratios between a coniferous and deciduous forest stand and the
characteristics (Kendall’s tau and median slope) of a deposition time trend analysis. The
time step, type of precipitation data, tracer ion, canopy leaching of weak acids and canopy
uptake of N during the leafless season all had a significant effect, whereas the canopy
uptake of NO3- generally had no influence. A correction of bulk to wet-only precipitation
data is recommended when available. Sodium can be considered as the most suitable
tracer ion, but more research is needed on the assumption of inertness during the period of
leaf development for different tree species. Furthermore, an adjustment according to the
mean mass diameter for each base cation could improve the estimated DD of these
elements. Including canopy leaching of weak acids in the canopy budget model had
usually the highest impact in all three case studies, but this could mainly be attributed to
the fact that weak acid concentrations in water samples were estimated from a cation-
anion balance. However, the strong effect of including weak acid leaching disappeared
when weak acids were calculated from DOC and bicarbonate measurements, indicating
that the accuracy of analytical measurements is of high importance, especially for rainfall
where ion concentrations are generally low. This study presents evidence of the
164

Atmospheric deposition from throughfall measurements
165
importance of canopy exchange calculations for three relevant case studies in Flanders, a
region with enhanced N deposition due to anthropogenic emissions. Since local and tree
species-specific effects might also play a role here, similar studies in other regions are
recommended. Some indications with regard to the most suitable approach were derived,
but it is important to compare this approach to results obtained by other methods to
estimate atmospheric deposition.


8 General discussion and conclusions
Human-induced atmospheric deposition of nitrogen (N) and sulphur (S) compounds has
significantly altered nutrient cycling in temperate forest ecosystems and caused soil
acidification and eutrophication (Chapter 1). As a consequence, the quantification of
atmospheric deposition has gained importance to establish cause-effect relationships and
evaluate abatement measures and mitigation strategies (Erisman et al. 1994; de Vries et
al. 2003; Driscoll et al. 2003). Unfortunately, atmospheric deposition processes of gases
and aerosols to forest ecosystems are highly complex and are further complicated by
exchange reactions within the canopy (Lovett 1994). Different methods to estimate dry
deposition and canopy exchange have been developed the last decades, which are
applicable at different spatio-temporal scales. However, it is still a challenge to reconcile
differences among existing methods, and a better understanding of the effect of canopy
structure, species composition and retention processes is needed (Lovett 1994). Since
atmospheric deposition data are aimed to have a direct influence on public policy (Shaver
et al. 1994) and since the planetary boundaries for human perturbation of the N cycle are
significantly exceeded, research addressing these issues remains important (Rockström et
al. 2009; Sutton et al. 2011).
This thesis aimed to address existing knowledge gaps on dry deposition and canopy
exchange processes, in particular of N, and to gain a better understanding on the influence
the forest canopy exerts on these processes. To this aim, different methods were used to
quantify dry deposition and canopy exchange response variables at the branch-, canopy-
and stand-level and the effect of the forest canopy on these response variables was
assessed. The study focussed on five important tree species, i.e. European beech (Fagus
sylvatica L.), pedunculate oak (Quercus robur L.), silver birch (Betula pendula Roth),
Scots pine (Pinus sylvestris L.) and Norway spruce (Picea abies (L.) Karst.). The first
four tree species cover a range of sandy to more loamy soils and are widespread in
Flanders and North-West Europe (Brus et al. 2011). Norway spruce has been planted
throughout North-West and Central Europe since the 19th century to reforest devastated
forest land (Berger et al. 2008). In Flanders, much research has been devoted to the
conversion of homogeneous Scots pine stands to the closer-to-natural silver birch or
pedunculate oak stands to mitigate the effects of atmospheric deposition (De Schrijver
167
Chapter 8
2007; Wuyts 2009). In the surrounding regions, research has often focused on the
conversion of homogeneous Norway spruce stands that are vulnerable to drought, insect
attacks, storm events and other impacts of climate change to closer-to-natural European
beech stands or mixed spruce-beech stands (Berger et al. 2008; Hojjati et al. 2009).
Therefore, the considered tree species were chosen with the aim of providing results
relevant to forest ecology and management in Flanders and its surrounding regions.
As a second aim, this thesis intended to evaluate the canopy budget model by Draaijers
and Erisman (1995) which is used to calculate total atmospheric deposition from
throughfall and precipitation measurements. This method is indirect, less costly and less
intensive than other deposition methods (see Chapter 6 for an overview) and has the
advantage of giving information on internal nutrient cycling as well (Erisman et al. 1994).
This canopy budget model was evaluated by using the model at different spatio-temporal
scales, comparing it with other methods and conducting a sensitivity analysis.
The results of this thesis led to i) methodological considerations on the quantification of
canopy exchange and dry deposition of N, with a focus on the canopy budget model, ii)
more insight into the control of the forest canopy on dry deposition and canopy exchange
in general and iii) a better understanding of the control of the atmospheric N
concentration on dry deposition and canopy exchange. After discussing these three topics,
suggestions for further research are provided at the end of this concluding chapter.
8.1 Quantifying canopy exchange and dry deposition of N: methodological
considerations
In this thesis, several methods at different spatial scales were used to quantify canopy
exchange and dry deposition of inorganic N. This section aims to summarize and discuss
the results obtained by these different methods. It needs to be mentioned that the
distinction between dry deposition and canopy exchange differs somewhat between the
different methods. In Chapter 3 and 4, we refer to “retention” as the sum of actual 15N
uptake through the cuticle, bark or stomata on the one hand and 15N adsorption to the
plant material on the other hand. This adsorbed 15N is dry deposited 15NH3 (Chapter 3) or
resulting 15NH4+ of 15NO3
- from a dried water film. The rinsing experiment in Chapter 4
revealed that 15N measured in leaves and needles represents actual uptake, while 15N in
twigs mainly consists of 15N adsorbed to the bark surface. Therefore, in Chapter 2, which
168

General discussion and conclusions
only considers foliage, the term “uptake” is used. In Chapter 3, foliage and twigs were not
rinsed and thus no distinction could be made between uptake and dry deposition. Canopy
uptake calculated from the canopy budget model in Chapter 5-7 represents the ion-
exchange reaction between the water layer on the forest canopy and the canopy itself,
while dry deposition is the sum of particulate and gaseous compounds deposited to the
canopy surface. The “canopy” here consists of foliage, twigs and stems, microbiota and
epiphytic lichens. The water layer on the forest canopy contains both wet deposited N and
dissolved dry deposited N. Dry deposition and immediate stomatal uptake of gaseous
compounds is not included in the model. Dry deposition measured by air concentration
measurements multiplied with an average deposition velocity (Chapter 6) comprises both
surface deposition and direct stomatal uptake.
In Chapter 2-4, the retention of dissolved NH4+ and NO3
- and gaseous NH3 by foliage and
twigs of different tree species was accurately quantified with stable N isotope (15N)
tracing. The observed retention in foliage and twigs of dissolved 15NH4+ and 15NO3
- from
wet deposition agreed well with other studies using the same method (Brumme et al.
1992; Eilers et al. 1992; Garten et al. 1998; Wilson and Tiley 1998; Dail et al. 2009).
When these results were extrapolated to a mature stand, the obtained range of 0.08-2.23
kg N ha-1 yr-1 was generally below the dissolved inorganic N retention extrapolated from 15N measurements of 9 kg N ha-1 yr-1 for Norway spruce (Eilers et al. 1992) and 3-10 kg
N ha-1 yr-1 for beech (Brumme et al. 1992), and at the lower edge of the 1-5 kg N ha-1 yr-1
reported by Dail et al. (2009). However, N deposition levels used in these studies were
generally higher than ambient levels. Based on net throughfall (NTF) measurements of 15NH4
+ and 15NO3-, canopy retention of dissolved N ranged from 2 to 19 kg N ha-1 yr-1
(Chapter 4). The large difference between 15N retrieved in foliage and twigs and 15N
calculated from throughfall was mainly due to a loss of NH4+, which could have been re-
emitted to the atmosphere, transported to other plant parts, washed off with the rinsing
water or converted to dissolved organic N (DON). Total canopy retention, i.e. from dry
and wet deposition, has been calculated to range from 1-57 kg N ha-1 yr-1 (Lovett and
Lindberg 1993; Harrison et al. 2000; Sievering et al. 2007; Neirynck et al. 2008; Kreutzer
et al. 2009). Only few studies have compared retention from dry and wet deposition and
concluded that foliar retention from the liquid phase is much more important than from
the gaseous phase (Harrison et al. 2000; Sievering et al. 2007), although dry deposited N
may significantly contribute to canopy retention (Horvath 2004). Dry deposited N during
169

Chapter 8
the antecedent dry period prior to a wet deposition event is mobilized by canopy wetness,
after which the dissolved N is available to canopy foliage for use in photosynthesis
(Sievering et al. 2007). Since no detailed data on stomatal conductance, meteorological
conditions and turbulence were available in the present study, the observed 15N retention
of gaseous NH3 in Chapter 3 could not be extrapolated to mature stands. Nevertheless, a
significant cuticular deposition and stomatal uptake of NH3 was observed, as found in
other 15N studies (Bruckner et al. 1993; Pérez-Soba and Van der Eerden 1993; Gessler et
al. 2002; Jones et al. 2008) and gas flux experiments (Gessler et al. 2000, 2002; Neirynck
et al. 2005; and many others). For a Scots pine stand in the study region, Neirynck et al.
(2008) concluded that direct stomatal uptake of NH3 contributed to a lesser extent to the
observed canopy retention of dissolved inorganic N, which was estimated to be 7 kg N
ha-1 yr-1. Net fluxes of NO2 were found to be mainly upward (Neirynck et al. 2007). The
various canopy budget models in Chapter 7 yielded a canopy N retention by the studied
individual beech tree of 4-14 kg N ha-1 yr-1.
Based on the observations made in this thesis and from literature, we may conclude that
the canopy budget model is a suitable method to calculate canopy retention of N, given
that direct stomatal uptake of gaseous compounds does not contribute to a great extent to
total canopy retention. However, canopy N retention calculated by the canopy budget
model is generally higher than the N which is actually taken up or adsorbed to foliage and
twigs, as measured by 15N labelling experiments. This may be due to additional
assimilation by epiphytic lichens, re-emission of N from drying water layers or
conversion of inorganic N to DON. Since 15N labelling experiments are generally
conducted on saplings or young trees, it is possible that tree age might also have an
influence on these results, although this seems unlikely. Until now, 15N-labelled rainwater
has only been applied to a mature forest in the experiment of Gaige et al. (2007) and Dail
et al. (2009), but also here a discrepancy between 15N in the different plant parts and NTF
has been observed.
In Chapter 6 a comparison was made between three different dry deposition methods, i.e.
the canopy budget model by Draaijers and Erisman (1995), single layer and multi-layer
artificial foliage (method adjusted from Stachurski and Zimka 2000) and measured air
concentrations multiplied by an average deposition velocity. According to the latter
approach, annual dry deposition of NH3 and NO2, which may be partly taken up through
the stomata, was estimated to be 14.9 and 5.0 kg N ha-1 yr-1, respectively (Table 8.1). If
170

General discussion and conclusions
dry deposition on the multi-layer artificial foliage, which mainly originates from
particulate deposition, was extrapolated to a whole year and added to the NH3 and NO2
deposition to obtain total dry deposition of reduced and oxidised N, this amounted to 15.5
and 6.7 kg N ha-1 yr-1, respectively (Table 8.1). However, as indicated in Chapter 6, the
calculated NO2 deposition might be a significant overestimation since net upward fluxes
were observed for a forest in the same region (Neirynck et al. 2007). Consequently, dry
deposition of oxidised N might be lower, and in the range of 1.7 kg ha-1 yr-1 as measured
by the artificial foliage or 2.0-4.6 kg ha-1 yr-1 as calculated from the canopy budget model.
Dry deposition on the beech canopy calculated from the range of canopy budget models
in Chapter 7 amounted to 10-20 kg N ha-1 yr-1 (Table 8.1). This range covers well the dry
deposition fluxes according to the other two methods and suggests that the canopy budget
model might also be suitable to estimate dry deposition. However, the discussion in
Chapter 7 still addressed some important inconsistencies in this model with regard to the
assumption of inertness of the tracer ion, the equal deposition efficiency of aerosols and
estimated canopy leaching of weak acids. These factors may significantly underestimate
or overestimate dry deposition of N compounds and need to be clarified further.
Additionally, Chapter 6 revealed a discrepancy between the dry deposition of SO42-
calculated by the canopy budget model and estimated from air concentration
measurements (Chapter 6). Therefore, it is suggested 1) to combine the canopy budget
model with other dry deposition methods, if possible, and 2) to conduct a similar
sensitivity analysis as in Chapter 7 when using the canopy budget model in different
regions or for different tree species.
Table 8.1 Summary of dry deposition (kg N ha-1 yr-1) obtained by different dry deposition methods in this thesis, i.e. measured air concentrations multiplied by an average deposition velocity (vdavg), dry deposition measured on multi-layered artificial foliage (AFmulti) and the various approaches of the canopy budget model
Method Measured N compound Dry deposition Chapter vdavg NH3 14.9 6 NO2 5.0 6 AFmulti pNH4, (NH3) 0.6 6 pNO3, (HNO3) 1.7 6 Canopy budget model NH3
*, pNH4 4.2 - 22.9 7 NO2
*, pNO3 2.0 – 4.6 7 *not taken up by stomata
171

Chapter 8
8.2 Forest canopy control on dry deposition and canopy exchange processes
Forest canopies affect dry deposition and canopy exchange processes in different ways.
We first discuss the impact of leaf wettability, water storage capacity and bark roughness,
then chemical and morphological leaf properties, and finally the physical structure of the
canopy itself.
8.2.1 Leaf wettability, water storage capacity and bark roughness
The retention mechanism of dissolved inorganic N (DIN) through plant cuticles is an
existing knowledge gap (Sparks 2009). With this thesis we attempted to partly fill this
gap by assessing the role of leaf characteristics such as leaf wettability and water storage
capacity on DIN retention. A significant correlation between leaf wettability, measured as
the contact angle between a droplet on the leaf surface and the surface itself, and foliar 15NH4
+ and 15NO3- uptake was observed (Chapter 2). Consequently, variations in leaf
wettability could partly explain the observed differences in DIN uptake between tree
species and phenological stages. No relationship with water storage capacity was found,
suggesting that the contact time is less important for DIN uptake than the contact surface.
As in other studies (Holloway 1969; Hall and Burke 1974; Neinhuis and Barthlott 1998),
the differences in leaf wettability between tree species could partly be explained by visual
differences in epicuticular wax structure, which was assessed by Scanning Electron
Microscopy. On a within-canopy level, leaf wettability was found to increase from the top
to the bottom of beech (Van Wittenberghe 2009) and Norway spruce canopies (Boyce et
al. 1991). This increased wettability in the lower canopy could have contributed to the
leaching of base cations that was observed (Chapter 5). However, no higher canopy
uptake of N was observed at the bottom than at the top of the beech and spruce canopies,
indicating that other factors than wettability explain differences in dissolved N uptake
along a canopy gradient.
In Chapter 4, a high retention of 15NH4+ by twigs of Scots pine was observed, while this
was less apparent for the three deciduous species. The rinsing experiment revealed that
this retained N was adsorbed to the bark surface of pine and not assimilated. Many studies
have suggested this mechanism (Bowden et al. 1989; Boyce et al. 1996; Wilson and Tiley
1998; Dail et al. 2009) but could not provide experimental evidence. Although bark
roughness was not explicitly quantified in this thesis, the higher 15NH4+ retention by pine
twigs can likely be attributed to the more rough bark surface that provides a lot of
172

General discussion and conclusions
potential adsorption places. This implicates that especially tree species with a rough bark
surface, such as Scots pine and Norway spruce, can temporarily store meaningful
amounts of N that are not assimilated by the tree.
8.2.2 Leaf chemical and physiological characteristics
In Chapter 2-3, the observed retention of dissolved and gaseous 15N was related to the
plant N status, measured as the N content of leaves and twigs. In both chapters, a
significant positive relationship between plant N and N retention was found, although not
for all concentration levels of NH3. However, this relationship was rather weak and could
not fully explain the variation in N retention. Also within the beech canopy, the variation
in leaf N content along the vertical gradient could not be linked directly to higher canopy
N uptake (Chapter 5). A difficulty with the parameters leaf and twig N content is that they
may reflect both plant physiological activity, i.e. a higher N content is associated with
higher chlorophyll content and photosynthetic capacity (Evans et al. 2001; Niinnemets
2007) as well as plant N status with regard to passive diffusion-driven N uptake from the
atmosphere. These two viewpoints may cause opposite effects on N retention. On the one
hand, leaves with a higher physiological activity will be able to convert more inorganic N
into amino acids. This is confirmed by the higher retention of the sunlit birch leaves
having a higher photosynthetic capacity compared to shadow leaves of beech and oak
during leaf emergence for both dissolved and gaseous N (Hikosaka 2005). Also the higher
canopy uptake of N during the growing season compared to the dormant season and of
the upper canopy compared to the lower canopy (Chapter 5) confirms this viewpoint, as
well as the weak but significant correlation between 13CO2 and 15NH3 uptake in Chapter
3. On the other hand, a lower leaf N status may represent lower leaf mineral N
(Schjoerring et al. 1998), which can enhance passive diffusion of N and hence increase N
retention. However, during leaf senescence of the deciduous tree species, apoplastic NH4+
concentrations are generally high (Wang et al. 2011) but leaf N content low (Chapter 2
and 3). An increased retention of NH4+ and NO3
- was observed but not of NH3, indicating
that DIN retention is not controlled by foliar apoplast concentrations. Based on the
observations in this thesis, we may conclude that both dissolved and gaseous N uptake are
controlled by leaf physiological activity during the fully leafed period, but that during leaf
development and leaf senescence passive diffusion may become more important.
173

Chapter 8
Many studies have linked stomatal conductance to NH3 uptake (Van Hove et al. 1987;
Gessler et al. 2000; and many others). In Chapter 3 an attempt was made to link easy-to-
measure stomatal characteristics, i.e. stomatal density and pore surface and a theoretically
derived maximum stomatal conductance gsmax, to the observed 15NH3 retention to explain
differences between tree species and phenological stages, but no relationship was found.
Thus, these stomatal characteristics are not suitable parameters to explain variation in
NH3 uptake. However, in the beech canopy they may explain canopy exchange processes
to some extent, since stomatal pore surface significantly decreased from the top to the
bottom of the canopy (Van Wittenberghe 2009) along with canopy uptake of N.
8.2.3 Canopy structure
Canopy structure can be described at several spatial scales by several variables (Sinoquet
et al. 2009), such as leaf area density, branch inclination angle, leaf and plant area index,
leaf shape and orientation (Fleck 2001; Van der Zande et al. 2006). Several of these
variables have been shown to affect dry deposition processes (Erisman and Draaijers
2003) and throughfall variability both in space and time (see Levia and Frost 2006 for an
overview). In Chapter 5, canopy structure of beech and spruce was not explicitly
measured, but the clear differences in canopy structure between the two tree species could
explain the vertical patterns in dry deposition of aerosols containing Na+, Cl-, K+, Ca2+
and Mg2+ (Fig. 5.6 and 5.7; Section 5.4.3). A large difference in dry deposition of these
aerosols was expected between the leafed and the leafless season for the beech tree
(Chapter 5) due to a decrease in plant area index, however, this was not the case. The high
dry deposition of these aerosols during the leafless season can likely be attributed to
increased atmospheric concentrations and a high capture efficiency of fine twigs. In
Chapter 6, a 3D image of the beech tree was taken during the leafed season (Fig. 6.1) by
means of the Light Detection and Ranging (LiDAR) Technology of terrestrial laser
scanners. This LiDAR technology provides a new tool to generate a 3D description of
canopy structure (Lefsky et al. 2005; Van der Zande et al. 2006), which allowed relating
dry deposition and net throughfall fluxes within the beech canopy on a collector basis to
the canopy structure. A significant positive relationship between the number of filled
voxels above a throughfall collector, which may serve as a proxy for the volume of
canopy elements, and fluxes of all elements except H+, NO3- and net throughfall volume
was found. This strengthens previous observations on the relationship between
174

General discussion and conclusions
throughfall deposition and canopy structure estimated by less precise methods, such as
hemispherical photographs (Staelens et al. 2006).
8.3 Control of atmospheric N concentration on dry deposition and canopy
exchange
Several studies have reported increased fluxes of dissolved NH4+ and NO3
- and gaseous
NH3 to the canopy with increasing N concentration of the solution or gas (Van Hove et al.
1987; Schaefer et al. 1988; Brumme et al. 1992; Eilers et al. 1992; Lumme and
Smolander 1996; Gessler et al. 2000; Gessler et al. 2002). In Chapter 2 and 4 a 1.3-fold
higher 15NO3- retention was observed for a 3-fold higher 15NO3
- concentration available in
the applied solution, hereby confirming literature observations. This effect might have
been larger if the 15NH4+ availability in the solution was increased, since all tree species
studied showed a higher affinity for NH4+ uptake compared to NO3
-. In contrast, the
short-term 15NH3 experiment (Chapter 3) differed in this regard from previously
conducted experiments since 15NH3 deposition was not found to increase with increasing
atmospheric NH3 concentration. This observation was explained by the short-term
exposure of the foliated twigs to 15NH3 and subsequent exposure to ambient air which
could have caused a temporal storage (Grundmann et al. 1993; Stulen et al. 1998) or
significant re-emission of NH3 at increasing initial NH3 levels (Rennenberg and Gessler
1999). Despite the fact that the cause is unknown, the results of Chapter 3 clearly
indicated that all tree species were not able to instantaneously assimilate NH3 at increased
availability. Since no different NH4+ levels were applied (Chapter 2), we cannot verify
whether this also holds true for dissolved NH4+. However, based on previous studies
(Brumme et al. 1992; Eilers et al. 1992; Chávez-Aguilar et al. 2006) and a recent
experiment (unpublished results), it is likely that more NH4+ is retained at increased
availability. On the within-canopy level, no higher canopy N retention was observed at
the bottom of the beech and spruce canopy, where DIN concentrations in throughfall were
higher compared to the top of the canopy (Chapter 5), indicating that the atmospheric N
concentration is not the only driving factor for canopy retention of N (see also Section
8.2.1).
175

Chapter 8
8.4 Suggestions for further research
This thesis has contributed to current knowledge on dry deposition and canopy exchange
processes for temperate tree species and has formulated some important recommendations
on the use of the canopy budget model. Nevertheless, there remain issues that could be
addressed in future research, in addition to the research suggestions mentioned in the
previous chapters.
Firstly, a shortcoming of this thesis was that no dissolved organic N (DON) was
measured in the rainfall and throughfall samples, mainly due to the difficulty to
accurately measure this fraction (Vandenbruwane et al. 2007). A significant fraction of
DON in throughfall deposition and bulk deposition is ubiquitous (Michalzik et al. 2001;
Gaige et al. 2007; Neirynck et al. 2007; Benitez et al. 2009; Wu et al. 2010), particularly
in unpolluted regions. Several studies have indicated that canopy processes may convert
atmospheric deposition of DIN to DON (Stadler et al. 2001; Gaige et al. 2007; Cape et al.
2010), but the exact processes are still largely unknown. Furthermore, it is still a
challenge to incorporate DON into the canopy budget model (Neirynck et al. 2007;
Staelens et al. 2008).
Secondly, stable N isotopes have been proven a highly valuable tool to gain more insight
into dissolved and gaseous N exchange processes (Chapter 2-4). Likewise, tree labelling
with stable isotopes of K+, Ca2+ and Mg2+ could improve the understanding of 1) ion
exchange between N and base cations, especially during the leafless season and 2) dry
deposition of these base cations. This approach has recently been initiated by Augusto et
al. (2011) and can still be further developed.
Thirdly, in Section 1.2., the interaction between shoot and root uptake of N was
highlighted. In this thesis soil N availability was kept constant in the pot experiments of
Chapter 2-4. An increasing N availability via the soil will likely increase foliar N (Berger
and Glatzel 2001) and hence increase the influence of plant N status on canopy N
retention (see 8.2.2.). It also remains to be investigated whether such increased soil N
availability will be affect the leaching of base cations.
Finally, further development of the LiDAR technology could gain new insights in dry
deposition and canopy exchange of atmospheric pollutants. Using this innovative
technique, the effect of canopy structure on turbulence patterns within tree canopies can
be assessed for real and complex canopies within a forest instead of saplings or model
176

General discussion and conclusions
177
canopies in wind tunnels (Beckett et al. 2000; Ould-Dada 2002; Freer-Smith et al. 2004).
Furthermore, the high spatial resolution can be used to scale up measurements from the
leaf level to a canopy level, as has been done for transpiration measurements (Van der
Zande et al. 2009).

Summary
Increased deposition of atmospheric nitrogen (N) and sulphur (S) on forest ecosystems
has caused changes in biogeochemical processes, which may have adverse effects on
forest structure and functioning. Therefore, an accurate quantification of total atmospheric
deposition is required to establish cause-effect relationships and evaluate abatement
measures and mitigation strategies. However, measurements of dry deposition, which is a
major fraction of total deposition on forests, are still subject to several problems and are
complicated by canopy exchange processes in tree canopies. This study aimed to address
existing knowledge gaps on dry deposition and canopy exchange, in particular of N, and
to gain a better understanding of the influence the forest canopy exerts on these processes.
Next to this, we aimed to evaluate the often-used canopy budget model to calculate total
atmospheric deposition from throughfall measurements. Dry deposition and canopy
exchange processes were examined at different spatio-temporal scales for five temperate
tree species widespread in Western Europe, a region with a high N deposition load. The
effect of forest canopy characteristics, i.e. leaf characteristics and canopy structure, on the
measured response variable was examined.
Retention of inorganic N from wet (ammonium (NH4+), nitrate (NO3
-)) and dry (ammonia
(NH3)) deposition by foliage and twigs was quantified for saplings of European beech
(Fagus sylvatica L.), pedunculate oak (Quercus robur L.), silver birch (Betula pendula
Roth.) and Scots pine (Pinus sylvestris L.) by means of stable N isotope (15N) tracing.
Retention patterns for dissolved inorganic N were mainly determined by foliar uptake,
except for Scots pine. In general, retention rates were 3-10 times higher for 15NH4+ than
for 15NO3-, 2-3 times higher for deciduous species than for Scots pine and lower for
developing leaves, although this was tree species dependent. The observed effects of tree
species and phenological stage in foliar retention could be related to differences in leaf
wettability, and not to water storage capacity. The small 15NH4+ retention by twigs was
mainly due to physicochemical adsorption to the woody plant surface. Retention of 15NH4
+ calculated from throughfall water was, on average, 20 times higher than retention
by the plant material, indicating that a large part of the applied 15NH4+ could not be
accounted for. The 15NH3 retention by leaves and twigs was affected by tree species,
treatment date, applied NH3 concentration and the interaction between these factors.
179

Summary
Maximum 15NH3 retention occurred at 5, 20 or 50 ppb, depending on the treatment date,
but never at the highest NH3 concentration level. Birch, beech and oak leaves showed the
highest 15NH3 retention in August, while for pine needles this was in June, and was
generally higher for the deciduous species than for pine. Both leaf characteristics as well
as measured 13CO2 retention did not provide a strong explanation for the observed
differences in 15NH3 retention.
Throughfall deposition, dry deposition and canopy exchange of major ions calculated by
the canopy budget model were studied along a vertical gradient within a beech and two
Norway spruce (Picea abies Karst.) canopies, located in forests in Belgium and Denmark,
respectively. Throughfall and net throughfall deposition of all ions other than H+
increased significantly with canopy depth in the middle and lower canopy of the beech
tree and in the whole canopy of the spruce trees. Dry deposition of all ions and canopy
uptake of inorganic N and H+ occurred mainly in the upper canopy, while canopy
leaching of K+, Ca2+ and Mg2+ was observed at all canopy levels. Canopy exchange was
always higher during the growing season compared to the dormant season. This
observational study illustrated that biogeochemical deposition models would benefit from
a multilayer approach for shade-tolerant tree species such as beech and spruce.
For the beech canopy, a comparison of dry deposition calculated by the canopy budget
model was made with dry deposition calculated from air concentration measurements and
dry deposition onto multi- and single-layered artificial foliage. The multi-layered artificial
foliage showed a good agreement with the canopy budget model for coarse aerosol
deposition. For NHx, the canopy budget model and the air concentration measurements
yielded similar results, however, for SOx the canopy budget model yielded higher dry
deposition than estimated from air concentration measurements and for NOy the model
resulted in lower estimates. Combining throughfall measurements with multi-layered
artificial foliage could aid to quantify dry deposition of NOy. Net throughfall and dry
deposition of all variables except throughfall volume, H+ and NO3-, were significantly
correlated with the volume of canopy elements above the throughfall collectors, which
was measured by terrestrial laser scanning.
To determine the effect of different canopy budget model approaches on atmospheric
deposition estimates, we calculated the range of atmospheric deposition obtained by
combining canopy budget model approaches for three typical case studies: (i) total N and
potentially acidifying deposition onto a forest canopy, (ii) the ratio of these deposition
180

Summary
181
variables between a coniferous and a deciduous stand and (iii) the parameters of a
deposition time trend analysis. The effect of each step in the canopy budget model on the
obtained range was assessed. The time step, type of precipitation data and tracer ion used
in the model had a significant effect on the derived deposition in the three case studies. In
addition, including or excluding canopy leaching of weak acids and canopy uptake of
NH4+ and NO3
- during the leafless season largely affected the results, while including or
excluding canopy uptake of NO3- generally showed no effect.
Our results provided more insight into the role of the forest canopy on dry deposition and
canopy exchange of major ions. Furthermore, canopy retention of N was accurately
quantified and methodological recommendations with regard to the quantification of dry
deposition and canopy exchange for N compounds from the canopy budget model could
be formulated.


Samenvatting
Bosecosystemen zijn onderhevig aan een verhoogde atmosferische depositie van stikstof-
(N) en zwavel-componenten (S), die veranderingen in biogeochemische processen
veroorzaken. Deze veranderingen kunnen negatieve effecten hebben op het functioneren
van bosecosytemen. Een accurate kwantificering van de totale atmosferische depositie
van deze polluenten is dan ook noodzakelijk om oorzaak-gevolg relaties vast te kunnen
stellen en het effect van emissiereducerende en mitigerende maatregelen te evalueren.
Metingen van droge depositie zijn echter nog steeds onderhevig aan verschillende
problemen. Daarnaast wordt de kwantificering van de totale depositie bemoeilijkt door
kroonuitwisselingsprocessen in boomkronen. Deze studie had als eerste doel om meer
inzicht te verkrijgen in droge depositie en kroonuitwisselingsprocessen, met de focus op
N, en in de rol van boomkronen op deze processen. Het tweede doel was om het vaak
gebruikte kroonbudgetmodel te evalueren dat de totale atmosferische depositie op basis
van doorvalmetingen schat. Droge depositie en kroonuitwisselingsprocessen werden
onderzocht op verschillende spatio-temporele niveaus bij vijf gematigde boomsoorten die
wijdverspreid zijn in West-Europa, een regio met een hoge stikstofdepositielast. Het
effect van verschillende kroonkarakteristieken, i.e. bladkarakteristieken en
kroonstructuur, op de gemeten responsvariabelen werd onderzocht.
De retentie van anorganische N uit natte (ammonium (NH4+), nitraat (NO3
-)) en droge
(ammoniak (NH3)) depositie door bladeren en twijgen werd gekwantificeerd d.m.v.
stabiele isotopen (15N) voor jonge beuken (Fagus sylvatica L.), zomereiken (Quercus
robur L.), ruwe berken (Betula pendula Roth.) en grove dennen (Pinus sylvestris L.).
Verschillen in retentie van opgeloste anorganische N tussen soorten en fenologische
stadia werden vooral bepaald door bladopname, behalve voor grove den. Algemeen was
de retentie 3-10 keer hoger voor NO3- dan voor NH4
+, 2-3 keer hoger voor de
loofboomsoorten dan voor grove den en steeds lager voor ontluikende bladeren, hoewel
dit laatste boomsoortafhankelijk was. Verschillen in NH4+ en NO3
- retentie tussen
boomsoorten en fenologische stadia konden gerelateerd worden aan verschillen in
bladbevochtigbaarheid. De lage NH4+ retentie door twijgen vond plaats door fysico-
chemische adsorptie aan het plantoppervlak. Ammoniumretentie, berekend op basis van
doorvalmetingen, was gemiddeld 20 keer hoger dan deze gemeten in het plantmateriaal.
183

Samenvatting
Een aanzienlijk deel van de NH4+ in de natte depositie kon dus niet teruggevonden
worden. De 15NH3 retentie door bladeren en twijgen werd significant beïnvloed door de
factoren boomsoort, tijdstip, toegepaste NH3 concentratie en de interactie tussen deze
factoren. Optimale retentie vond plaats bij 5, 20 or 50 ppbv, afhankelijk van het tijdstip in
het groeiseizoen, maar nooit bij 100 ppbv. Bladeren van berk, beuk en eik vertoonden de
hoogste retentie in augustus, terwijl dit voor naalden van grove den in juni was.
Ammoniakretentie was meestal hoger voor de loofboomsoorten dan voor grove den.
Zowel de bladkarakteristieken als de simultaan gemeten 13CO2 opname vormden geen
verklaring voor de geobserveerde verschillen in 15NH3 retentie.
In een observationele studie bestudeerden we doorvaldepositie, droge depositie en
kroonuitwisseling van ionen berekend door het kroonbudgetmodel langsheen een
vertikale gradiënt in de kroon van één beuk en twee fijnsparren (Picea abies Karst.).
Doorval- en netto-doorvaldepositie van alle ionen behalve H+ namen significant toe met
de diepte in de kroon in de middelste en onderste laag van de beukenkroon en in alle
kroonlagen van fijnspar. Droge depositie voor alle ionen en kroonopname voor
anorganische N en H+ vond vooral in de bovenste kroonlaag plaats, terwijl kroonuitloging
van K+, Ca2+ and Mg2+ in alle kroonlagen werd geobserveerd. Kroonuitwisseling was
steeds hoger tijdens het groeiseizoen dan tijdens het dormant seizoen. Deze studie
illustreert dat biogeochemische depositiemodellen gebaat zouden zijn bij een meerlagige
benadering voor schaduwtolerante soorten zoals beuk en fijnspar.
Voor de beukenkroon werd een vergelijking gemaakt tussen de droge depositie berekend
door het kroonbudgetmodel en deze berekend via luchtconcentratiemetingen en via droge
depositie op één- en meerlagig artificiële boomkronen. De meerlagige artificiële
boomkronen vertoonden een goed overeenkomst met het kroonbudgetmodel voor grove
aerosoldepositie. Voor NHy leverden het kroonbudgetmodel en de
luchtconcentratiemetingen gelijkaardige resultaten, maar voor SOx leverde het
kroonbudgetmodel een hogere droge depositie dan deze geschat via
luchtconcentratiemetingen terwijl het model lagere droge depositie voor NOy schatte. Een
combinatie van doorvalmetingen met meerlagige artificiële boomkronen kan helpen om
de droge depositie van NOy nauwkeurig te kwantificeren. De netto-doorval en droge
depositie van alle variabelen, behalve het doorvalvolume, H+ en NO3-, was significant
gecorreleerd met het volume van kroonelementen boven elke doorvalcollector gemeten
via grondgebaseerde laser scanning.
184

Samenvatting
185
Om het effect van verschillende benaderingen van het kroonbudgetmodel op de schatting
van atmosferische depositie te bepalen, werd de grootteorde van atmosferische depositie
bepaald d.m.v. het combineren van alle verschillende kroonbudgetmodelbenaderingen.
Dit werd uitgevoerd voor drie typische case studies: (i) totale N en potentieel verzurende
depositie op een boomkroon, (ii) de ratio van deze depositie variabelen tussen een naald-
en een loofbestand en (iii) de parameters van een trendanalyse op deze
depositievariabelen. Voor elke stap in het kroonbudgetmodel werd het effect op de
berekende grootteorde nagegaan. In alle drie de case studies was er een significant effect
van de gebruikte tijdstap, het type neerslagdata en het gebruikte tracer ion. Daarnaast
beïnvloedde het in- of uitsluiten van kroonuitloging van zwakke zuren en van
kroonopname van NH4+ en NO3
- (enkel tijdens de onbebladerde periode) de resultaten,
terwijl meestal geen effect werd teruggevonden van het in- of uitsluiten van kroonopname
van NO3- (over het hele jaar).
De resultaten van deze studie hebben meer inzicht verschaft in de rol van boomkronen in
de droge depositie en kroonuitwisseling van ionen. Daarnaast konden enkele
methodologische beschouwingen geformuleerd worden met betrekking tot de
kwantificering van droge depositie en kroonuitwisseling van N componenten.


References
Aasamaa K, Sõber A (2011) Stomatal sensitivities to changes in leaf water potential, air humidity, CO2 concentration and light intensity, and the effect of abscisic acid on the sensitivities in six temperate deciduous tree species. Environmental and Experimental Botany 71, 72-78
Aber J, McDowell W, Nadelhoffer K, Magill A, Berntson G, Kamakea M et al. (1998) Nitrogen saturation in temperate forest ecosystems - Hypotheses revisited. Bioscience 48, 921-934
Aber JD, Goodale CL, Ollinger SV, Smith ML, Magill AH, Martin ME et al. (2003) Is nitrogen deposition altering the nitrogen status of northeastern forests? Bioscience 53, 375-389
Aber JD, Nadelhoffer KJ, Steudler P, Melillo JM (1989) Nitrogen saturation in northern forest ecosystems. Bioscience 39, 378-386
Ammann M, Siegwolf R, Pichlmayer F, Suter M, Saurer M, Brunold C (1999) Estimating the uptake of traffic-derived NO2 from 15N abundance in Norway spruce needles. Oecologia 118, 124-131
Andersen HV, Hovmand MF (1995) Ammonia and nitric acid dry depositon and throughfall. Water Air and Soil Pollution 85, 2211-2216
Andersen HV, Hovmand MF, Hummelshøj P, Jensen NO (1999) Measurements of ammonia concentrations, fluxes and dry deposition velocities to a spruce forest 1991-1995. Atmospheric Environment 33, 1367-83
Anderson MJ (2001) A new method for non-parametric multivariate analysis of variance. Austral Ecology 26, 32-46
André F, Jonard M, Ponette Q (2008) Precipitation water storage capacity in a temperate mixed oak-beech canopy. Hydrological Processes 22, 4130-4141
Asman WAH, Sutton MA, Schjoerring JK (1998) Ammonia: emission, atmospheric transport and deposition. New Phytologist 139, 27-48
Aston AR (1979) Rainfall interception by eight small trees. Journal of Hydrology 42, 383-396 Augusto L, Zeller B, Midwood AJ, Swanston C, Dambrine E, Schneider A et al. (2011) Two-year
dynamics of foliage labelling in 8-year-old Pinus pinaster trees with 15N, 26Mg and 42Ca-simulation of Ca transport in xylem using an upscaling approach. Annals of Forest Science 68, 169-178
Bache DH (1977) Sulfur-dioxide uptake and leaching of sulfates from a pine forest. Journal of Applied Ecology 14, 881-895
Balasooriya BLWK, Samson R, Mbikwa F, Vitharana UWA, Boeckx P, Van Meirvenne M (2009) Biomonitoring of urban habitat quality by anatomical and chemical leaf characteristics. Environmental and Experimental Botany 65, 386-394
Barthlott W, Neinhuis C (1997) Purity of the sacred lotus, or escape from contamination in biological surfaces. Planta 202, 1-8
Beckett KP, Freer-Smith PH, Taylor G (2000) Particulate pollution capture by urban trees: effect of species and windspeed. Global Change Biology 6, 995-1003
Beier C, Bredemeier M, Collins JE, Cummins T, de Visser PHB, Farrell EE et al. (1993a) EXMAN - Experimental manipulation of forest ecosystems in Europe - Project period 1988-1991. In: Beier C, Rasmussen L (eds) Forest Ecosystem Report 7. CEC, Brussels, Belgium
Beier C, Hansen K, Gundersen P (1993b) Spatial variability of throughfall fluxes in a spruce forest. Environmental Pollution 81, 257-267
187

References
Benitez JMG, Cape JN, Heal MR, van Dijk N, Diez AV (2009) Atmospheric nitrogen deposition in south-east Scotland: Quantification of the organic nitrogen fraction in wet, dry and bulk deposition. Atmospheric Environment 43, 4087-4094
Berger TW, Glatzel G (2001) Response of Quercus petraea seedlings to nitrogen fertilization. Forest Ecology and Management 149, 1-14
Berger TW, Untersteiner H, Schume H, Jost G (2008) Throughfall fluxes in a secondary spruce (Picea abies), a beech (Fagus sylvatica) and a mixed spruce-beech stand. Forest Ecology and Management 255, 605-618
Besl PJ, McKay ND (1992) A method for registration of 3-D shapes. IEEE Transactions on Pattern Analysis and Machine Intelligence 14, 239-255
Beverland IJ, Crowther JM, Srinivas MSN, Heal MR (1998) The influence of meteorology and atmospheric transport patterns on the chemical composition of rainfall in south-east England. Atmospheric Environment 32, 1039-1048
Bobbink R, Hornung M, Roelofs JGM (1998) The effects of air-borne nitrogen pollutants on species diversity in natural and semi-natural European vegetation. Journal of Ecology 86, 717-738
Bouya D, Myttenaere C, Weissen F, Van Praag HJ (1999) Needle permeability of Norway spruce (Picea abies (L.) Karst.) as influenced by magnesium nutrition. Belgian Journal of Botany 132, 105-118
Bowden RD, Geballe GT, Bowden WB (1989) Foliar uptake of 15N from simulated cloud water by red spruce (Picea rubens) seedlings. Canadian Journal of Forest Research 19, 382-386
Bowman WD, Cleveland, CC, Halada L, Hresko J, Baron JS (2008) Negative impact of nitrogen deposition on soil buffering capacity. Nature Geoscience 1, 767-770
Boyce RL, Friedland AJ, Chamberlain CP, Poulson SR (1996) Direct canopy nitrogen uptake from 15N-labeled wet deposition by mature red spruce. Canadian Journal of Forest Research 26, 1539-1547
Boyce RL, McCune DC (1992) Water holdup capacity and residence time of red spruce and balsam fir branches. Trees-Structure and Function 6, 19-27
Boyce RL, McCune DC, Berlyn GP (1991) A comparison of foliar wettability of red spruce and balsam fir growing at high elevation. New Phytologist 117, 543-555
Brewer CA, Smith WK, Vogelmann TC (1991) Functional interaction between leaf trichomes, leaf wettability and the optical properties of water droplets. Plant, Cell and Environment 14, 955-962
Brodribb T, Hill RS (1997) Imbricacy and stomatal wax plugs reduce maximum leaf conductance in Southern Hemisphere conifers. Australian Journal of Botany 45, 657-668
Bruckner G, Gebauer G, Schulze E-D (1993) Uptake of 15NH3 by Picea abies in closed-chamber experiments. Isotopenpraxis 29, 71-76
Brumme R, Leimcke U, Matzner E (1992) Interception and uptake of NH4+ and NO3
- from wet deposition by aboveground parts of young beech (Fagus sylvatica L.) trees. Plant and Soil 142, 273-279
Brus DJ, Hengeveld GM, Walvoort DJJ, Goedhart PW, Heidema AH, Nabuurs GJ, Gunia K (2011). Statistical mapping of tree species over Europe. Special Issue European Journal of Forest Research, in press
Burkhardt J (2010) Hygroscopic aerosols on leaves: Nutrients or desiccants? Ecological Monographs 80, 369-399
Burkhardt J, Eiden R (1994) Thin water films on coniferous needles. Atmospheric Environment 28, 2001-2011
Butterbach-Bahl K, Gundersen P (2011) Nitrogen processes in terrestrial ecosystems. In: Sutton M, Howard CM, Erisman JW, Billen G, Bleeker A, Grennfelt P et al. (eds) The European Nitrogen Assessment. Cambridge University Press, Cambridge, UK, pp 99-125
188

References
Bytnerowicz A, Grulke NE (1992) Physiological effects of air pollutants on western trees. In: Olson RK, Binkley D, Böhm M (eds) The response of western forests to air pollution. Ecological Studies 97. Springer-Verlag, New York, pp 183-234
Calanni J, Berg E, Wood M, Mangis D, Boyce R, Weathers W et al. (1999) Atmospheric nitrogen deposition at a conifer forest: response of free amino acids in Engelmann spruce needles. Environmental Pollution 105, 79-89
Cape JN (1998) Uptake and fate of gaseous pollutants in leaves. New Phytologist 139, 221-223 Cape JN, Sheppard LJ, Binnie J, Dickinson AL (1998) Enhancement of the dry deposition of
sulphur dioxide to a forest in the presence of ammonia. Atmospheric Environment 32, 519-524
Cape JN, Fowler D, Davison A (2003) Ecological effects of sulfur dioxide, fluorides, and minor air pollutants: recent trends and research needs. Environment International 29, 201-211
Cape JN, Sheppard LJ, Crossley A, van Dijk N, Tang YS (2010) Experimental field estimation of organic nitrogen formation in tree canopies. Environmental Pollution 158, 2926-2933
Cape JN, Sheppard LJ, Fowler D, Harrison AF, Parkinson JA, Dao P et al. (1992) Contribution of canopy leaching to sulfate deposition in a Scots pine forest. Environmental Pollution 75, 229-236
Cappellato R, Peters NE, Meyers TP (1998) Above-ground sulfur cycling in adjacent coniferous and deciduous forests and watershed sulfur retention in the Georgia Piedmont, USA. Water Air and Soil Pollution 103, 151-171
Cappellato R, Peters NE, Ragsdale HL (1993) Acidic atmospheric deposition and canopy interactions of adjacent deciduous and coniferous forests in the Georgia Piedmont. Canadian Journal of Forest Research 23, 1114-1124
Carslaw DC, Beevers SD, Bell MC (2007) Risks of exceeding the hourly EU limit value for nitrogen dioxide resulting from increased road transport emissions of primary nitrogen dioxide. Atmospheric Environment 41, 2073-2082
Chang SC, Matzner E (2000) The effect of beech stemflow on spatial patterns of soil solution chemistry and seepage fluxes in a mixed beech/oak stand. Hydrological Processes 14, 135-144
Chaparro-Suarez IG, Meixner FX, Kesselmeier J (2011) Nitrogen dioxide (NO2) uptake by vegetation controlled by atmospheric concentrations and plant stomatal aperture. Atmospheric Environment 45, 5742-5750
Chauhan SVS, Chaurasia L, Rana A (2004) Impact of air pollution on floral morphology of Cassia siamea Lamk. Journal of Environmental Biology 25, 291-297
Chávez-Aguilar G, Fenn ME, Gómez-Guerrero A, Vargas-Hernández J, Horwath WR (2006) Foliar nitrogen uptake from simulated wet deposition in current-year foliage of Abies religiosa (H. B. K.) Schl. et Cham. Agrociencia 40, 373-381
Chiwa M, Crossley A, Sheppard LJ, Sakugawa H, Cape JN (2004) Throughfall chemistry and canopy interactions in a Sitka spruce plantation sprayed with six different simulated polluted mist treatments. Environmental Pollution 127, 57-64
Clark KL, Nadkarni NM, Gholz HL (2005) Retention of inorganic nitrogen by epiphytic bryophytes in a tropical montane forest. Biotropica 37, 328-336
Cox RM (2003) The use of passive sampling to monitor forest exposure to O3, NO2 and SO2: a review and some case studies. Environmental Pollution 126, 301-311
Craenen H, Van Ranst E, Tack FMG, Verloo MG (2000) Calculation and mapping of critical loads of sulfur and nitrogen in Flanders, Belgium. Science of the Total Environment 254, 55-64
Dail DB, Hollinger DY, Davidson EA, Fernandez I, Sievering HC, Scott NA et al. (2009) Distribution of nitrogen-15 tracers applied to the canopy of a mature spruce-hemlock stand, Howland, Maine, USA. Oecologia 160, 589-599
189

References
Davidson CI, Miller JM, Pleskow MA (1982) The influence of surface-structure on predicted particle dry deposition to natural grass canopies. Water Air and Soil Pollution 18, 25-43
Davidson CI, Wu YL (1991) Dry deposition of particles and vapors. In: Lindberg SE, Page AL, Norton SA (eds) Acidic precipitation vol 3: Sources, deposition, and canopy interactions. Springer-Verlag, New York, pp 103-216
De Couck N (2011) Veranderingen in de boomlaag in het Aelmoeseneiebos en de impact op strooisel, bodem en kruidlaag. M.Sc. thesis, Ghent University
De Schrijver A (2007) Acidification and eutrophication of forests on sandy soil: effects of forest type and deposition load. Ph.D thesis. Ghent University, Ghent, Belgium.
De Schrijver A, Geudens G, Augusto L, Staelens J, Mertens J, Wuyts K et al. (2007) The effect of forest type on throughfall deposition and seepage flux: a review. Oecologia 153, 663-674
De Schrijver A, Mertens J, Geudens G, Staelens J, Campforts E, Luyssaert S et al. (2006) Acidification of forested podzols in North Belgium during the period 1950-2000. Science of the Total Environment 361, 189-195
de Vries W, Reinds GJ, van der Salm C, Draaijers G, Bleeker A, Erisman JW (2001) Intensive monitoring of forest ecosystems in Europe. Technical report 2001. UNECE/EC, Geneva, Brussels, Switzerland, Belgium
de Vries W, Solberg S, Dobbertin M, Sterba H, Laubhann D, van Oijen M et al. (2009) The impact of nitrogen deposition on carbon sequestration by European forests and heathlands. Forest Ecology and Management 258, 1814-1823
de Vries W, van der Salm C, Reinds GJ, Erisman JW (2007) Element fluxes through European forest ecosystems and their relationships with stand and site characteristics. Environmental Pollution 148, 501-513
de Vries W, Vel EM, Reinds GJ, Deelstra H, Klap JM, Leeters EEJM et al. (2003) Intensive monitoring of forest ecosystems in Europe. 1. Objectives, set-up and evaluation strategy. Forest Ecology and Management 174, 77-95
Dise NB, Rothwell JJ, Gauci V, van der Salm C, de Vries W (2009) Predicting dissolved inorganic nitrogen leaching in European forests using two independent databases. Science of the Total Environment 407, 1798-1808
Draaijers G, Erisman JW (1995) A canopy budget model to assess atmospheric deposition from throughfall measurements. Water Air and Soil Pollution 85, 2253-2258
Draaijers G, Erisman JW, Spranger T Wyers GP (1996) The application of throughfall measurements for atmospheric deposition monitoring. Atmospheric Environment 30, 3349-3361
Draaijers GPJ, Erisman JW, Van Leeuwen NFM, Romer FG, te Winkel BH, Veltkamp AC et al. (1997) The impact of canopy exchange on differences observed between atmospheric deposition and throughfall fluxes. Atmospheric Environment 31, 387-397
Driscoll CT, Whitall D, Aber J, Boyer E, Castro M, Cronan C et al. (2003) Nitrogen pollution in the northeastern United States: Sources, effects, and management options. Bioscience 53, 357-374
Duchesne L, Ouimet R, Camire C, Houle D (2001) Seasonal nutrient transfers by foliar resorption, leaching, and litter fall in a northern hardwood forest at Lake Clair Watershed, Quebec, Canada. Canadian Journal of Forest Research 31, 333-344
Duyzer JH, Dorsey JR, Gallagher MW, Pilegaard K, Walton S (2004) Oxidized nitrogen and ozone interaction with forests. II: Multi-layer process-oriented modelling results and a sensitivity study for Douglas fir. Quarterly Journal of the Royal Meteorological Society 130, 1957-1971
Duyzer JH, Verhagen HLM, Weststrate JH, Bosveld FC (1992) Measurement of the dry deposition flux of NH3 on to coniferous forest. Environmental Pollution 75, 3-13
190

References
Dyckmans J, Flessa H (2001) Influence of tree internal N status on uptake and translocation of C and N in beech: a dual 13C and 15N labeling approach. Tree Physiology 21, 395-401
Eensalu E, Kupper P, Sellin A, Rahi M, Sober A, Kull O (2008) Do stomata operate at the same relative opening range along a canopy profile of Betula pendula? Functional Plant Biology 35, 103-110
Eichert T, Goldbach HE (2008) Equivalent pore radii of hydrophilic foliar uptake routes in stomatous and astomatous leaf surfaces - further evidence for a stomatal pathway. Physiologia Plantarum 132, 491-502
Eilers G, Brumme R, Matzner E (1992) Aboveground N-uptake from wet deposition by Norway spruce (Picea abies Karst.). Forest Ecology and Management 51, 239-249
Emmett BA (2007) Nitrogen saturation of terrestrial ecosystems: some recent findings and their implications for our conceptual framework. Water Air and Soil Pollution Focus 7, 99-109
Emmett BA, Boxman D, Bredemeier M, Gundersen P, Kjonaas OJ, Moldan F et al. (1998). Predicting the effects of atmospheric nitrogen deposition in conifer stands: Evidence from the NITREX ecosystem-scale experiments. Ecosystems 1, 352-360
Erisman JW, Beier C, Draaijers G, Lindberg S (1994) Review of deposition monitoring methods. Tellus Series B-Chemical and Physical Meteorology 46, 79-93
Erisman JW, Draaijers G (2003) Deposition to forests in Europe: most important factors influencing dry deposition and models used for generalisation. Environmental Pollution 124, 379-388
Erisman JW, Draaijers G, Duyzer J, Hofschreuder P, Van Leeuwen N, Römer F et al. (1997) Particle deposition to forests – summary of results and application. Atmospheric Environment 31, 321-332
Erisman JW, Vermeulen A, Hensen A, Flechard C, Dammgen U, Fowler D et al. (2005) Monitoring and modelling of biosphere/atmosphere exchange of gases and aerosols in Europe. Environmental Pollution 133, 403-413
Evans CA, Miller EK, Friedland AJ (2001) Effect of nitrogen and light on nutrient concentrations and associated physiological responses in birch and fir seedlings. Plant and Soil 236, 197-207
Fangmeier A, Hadwigerfangmeier A, Vandereerden L, Jager HJ (1994) Effects of atmospheric ammonia on vegetation - a review. Environmental Pollution 86, 43-82
Farquhar GD, Firth PM, Wetselaar R, Weir B (1980) On the gaseous exchange of ammonia between leaves and the environment - determination of the ammonia compensation point. Plant Physiology 66, 710-714
Farquhar GD, Sharkey TD (1982) Stomatal conductance and photosynthesis. Annual Review of Plant Physiology and Plant Molecular Biology 33, 317-345
Ferm M (1998) Atmospheric ammonia and ammonium transport in Europe and critical loads: a review. Nutrient Cycling in Agroecosystems 51, 5-17
Ferm M, Hultberg H (1999) Dry deposition and internal circulation of nitrogen, sulphur and base cations to a coniferous forest. Atmospheric Environment 33, 4421-4430
Ferm M, Rodhe H (1997) Measurements of air concentrations of SO2, NO2 and NH3 at rural and remote sites in Asia. Journal of Atmospheric Chemistry 27, 17-29
Ferm M, Svanberg P-A (1998) Cost-efficient techniques for urban- and background measurements of SO2 and NO2. Atmospheric Environment 32, 1377-1381
Fitter AH, Peat HJ (1994) The Ecological Flora Database. Journal of Ecology 82, 415-425 Flechard CR, Nemitz E, Smith RI, Fowler D, Vermeulen AT, Bleeker A et al. (2011) Dry
deposition of reactive nitrogen to European ecosystems: a comparison of inferential models across the NitroEurope network. Atmospheric Chemistry and Physics 11, 2703-2728
191

References
Fleck S (2001) Integrated analysis of relationships between 3D-structure, leaf photosynthesis and branch transpiration of mature Fagus sylvatica and Quercus petraea trees in a mixed forest stand. PhD thesis. University of Bayreuth, Bayreuth, Germany
Fowler D, O'Donoghue M, Muller JBA, Smith RI, Dragosits U, Skiba U et al. (2004). A chronology of nitrogen deposition in the UK between 1900 and 2000. Water Air and Soil Pollution: Focus 4, 9-23
Fowler D, Coyle M, Apsimon HM, Ashmore MR, Bareham SA, Battarbee RW et al. (2001) Transboundary air pollution: acidification, eutrophication and ground-level ozone in the UK. National Expert Group on Transboundary Air Pollution, UK
Fowler D, Cape JN, Coyle M, Flechard C, Kuylenstierna J, Hicks K et al. (1999) The global exposure of forests to air pollutants. Water Air and Soil Pollution 116, 5-32
Fowler D, Pilegaard K, Sutton MA, Ambus P, Raivonen M, Duyzer J et al. (2009) Atmospheric composition change: Ecosystems-Atmosphere interactions. Atmospheric Environment 43, 5193-5267
Fowler D, Smith RI, Muller JBA, Hayman G, Vincent KJ (2005) Changes in the atmospheric deposition of acidifying compounds in the UK between 1986 and 2001. Environmental Pollution 137, 15-25
Freer-Smith PH, El-Khatib AA, Taylor G (2004) Capture of particulate pollution by trees: A comparison of species typical of semi-arid areas (Ficus nitida and Eucalyptus globulus) with European and North American species. Water Air and Soil Pollution 155, 173-187
Friedland AJ, Miller EK, Battles JJ, Thorne JF (1991) Nitrogen deposition, distribution and cycling in a subalpine spruce-fir forest in the Adirondacks, New York, USA. Biogeochemistry 14, 31-55
Fritsche U (1992) Studies on leaching from spruce twigs and beech leaves. Environmental Pollution 75, 251-257
Fritsche U, Gernert M, Schindler C (1989) Vertical profiles of air-pollutants in a spruce forest - analysis of adherent water, throughfall and deposits on surrogate surfaces. Atmospheric Environment 23, 1807-1814
Fritz O, Niklasson M, Churski M (2008) Tree age is a key factor for the conservation of epiphytic lichens and bryophytes in beech forests. Applied Vegetation Science 12, 93-106
Gaige E, Dail DB, Hollinger DY, Davidson EA, Fernandez IJ, Sievering H et al. (2007) Changes in canopy processes following whole-forest canopy nitrogen fertilization of a mature spruce-hemlock forest. Ecosystems 10, 1133-1147
Gallagher M, Fontan J, Wyers P, Ruijgrok W, Duyzer J, Hummelsjoj P et al. (1999) Atmospheric particles and their interaction with natural surfaces. In: Slanina S (ed) Biosphere-atmosphere exchange of pollutants and trace substances. Springer, New York, pp 47-79
Galloway JN, Aber JD, Erisman JW, Seitzinger SP, Howarth RW, Cowling EB et al. (2003) The nitrogen cascade. Bioscience 53, 341-356
Garland JA (2001) On the size dependence of particle deposition. Water Air and Soil Pollution: Focus 1, 323-332
Garten CT (1990) Foliar leaching, translocation, and biogenic emission of 35S in radiolabeled loblolly pines. Ecology 71, 239-251
Garten CT, Hanson PJ (1990) Foliar retention of 15N-nitrate and 15N-ammonium by red maple (Acer rubrum) and white oak (Quercus alba) leaves from simulated rain. Environmental and Experimental Botany 30, 333-342
Garten CT, Schwab AB, Shirshac TL (1998) Foliar retention of 15N tracers: implications for net canopy exchange in low- and high-elevation forest ecosystems. Forest Ecology and Management 103, 211-216
192

References
Genouw G, Neirynck J, Roskams P. (2005). Intensieve monitoring van het bosecosysteem in het Vlaamse Gewest. Technisch rapport Eindverslag. Europees nummer.: 2002.60.BL/1. Institute for Forest and Game Management, Geraardsbergen, Belgium
Gessler A, Rienks M, Rennenberg H (2000) NH3 and NO2 fluxes between beech trees and the atmosphere - correlation with climatic and physiological parameters. New Phytologist 147, 539-560
Gessler A, Rienks M, Rennenberg H (2002) Stomatal uptake and cuticular adsorption contribute to dry deposition of NH3 and NO2 to needles of adult spruce (Picea abies) trees. New Phytologist 156, 179-194
Gilliam FS (2006) Response of the herbaceous layer of forest ecosystems to excess nitrogen deposition. Journal of Ecology 94, 1176-1191
Gómez-Guerrero A, Chávez-Aguilar G, Fenn ME, Vargas-Hernández J, Horwath WR (2008) Foliar nitrogen uptake in simulated wet deposition in Abies religiosa. Interciencia 33, 429-434
Gong SL, Barrie LA, Prospero JM, Savoie DL, Ayers GP, Blanchet JP et al. (1997) Modelling sea-salt aerosols in the atmosphere. 2. Atmospheric concentrations and fluxes. Journal of Geophysical Research-Atmospheres 102(D3), 3819-3830
Gower ST, Norman JM (1991) Rapid estimation of leaf-area index in conifer and broad-leaf plantations. Ecology 72, 1896-1900
Grundmann GL, Lensi R, Chalamet A (1993) Delayed NH3 and N2O uptake by maize leaves. New Phytologist 124, 259-263
Gundersen P, Schmidt IK, Raulund-Rasmussen K (2006) Leaching of nitrate from temperate forests - effects of air pollution and forest management. Environmental Reviews 14, 1-57
Hagen-Thorn A, Varnagiryte I, Nihlgard B, Armolaitis K (2006) Autumn nutrient resorption and losses in four deciduous forest tree species. Forest Ecology and Management 228, 33-39
Haines BL, Jernstedt JA, Neufeld HS (1985) Direct foliar effects of simulated acid-rain. II. Leaf surface characteristics. New Phytologist 99, 407-416
Hall DM, Burke W (1974) Wettability of leaves of a selection of New Zealand plants. New Zealand Journal of Botany 12, 283-228
Hall DM, Matus AI, Lamberto J, Barber HN (1965) Infra-specific variation in wax on leaf surfaces. Australian Journal of Biological Science 18, 323-332
Hansen K (1995) In-canopy throughfall measurements in Norway spruce: Water flow and consequences for ion fluxes. Water Air and Soil Pollution 85, 2259-2264
Hansen K (1996) In-canopy throughfall measurements of ion fluxes in Norway spruce. Atmospheric Environment 30, 4065-4076
Hansen K, Beier C, Gundersen P, Rasmussen L (1995) Experimental manipulations of water and nutrient input to a Norway spruce plantation at Klosterhede, Denmark. III. Effects on throughfall, soil-water chemistry and decomposition. Plant and Soil 169, 623-632
Hansen K, Draaijers GPJ, Ivens WPMF, Gundersen P, Vanleeuwen NFM (1994) Concentration variations in rain and canopy throughfall collected sequentially during individual rain events. Atmospheric Environment 28, 3195-3205
Hanson PJ, Garten CT (1992) Deposition of H15NO3 vapor to white oak, red maple and loblolly-pine foliage: experimental observations and a generalized model. New Phytologist 122, 329-337
Hanson PJ, Lindberg SE (1991) Dry deposition of reactive nitrogen-compounds - a review of leaf, canopy and non-foliar measurements. Atmospheric Environment Part a-General Topics 25, 1615-1634
Hanstein S, Mattsson M, Jaeger HJ, Schjoerring JK (1999) Uptake and utilization of atmospheric ammonia in three native Poaceae species: leaf conductances, composition of apoplastic solution and interactions with root nitrogen supply. New Phytologist 141, 71-83
193

References
Harrison AF, Schulze E-D, Gebauer G, Bruckner G (2000) Canopy uptake and utilization of atmospheric pollutant nitrogen. In: Schulze E-D (ed) Carbon and Nitrogen Cycling in European Forest Ecosystems. Ecological Studies 142. Springer-Verlag, New York, pp 171-188
Herbinger K, Then C, Low M, Haberer K, Alexous M, Koch N et al. (2005) Tree age dependence and within-canopy variation of leaf gas exchange and antioxidative defence in Fagus sylvatica under experimental free-air ozone exposure. Environmental Pollution 137, 476-482
Hertel O (2011) Nitrogen processes in the atmosphere. In: Sutton M, Howard CM, Erisman JW, Billen G, Bleeker A, Grennfelt P et al (eds) The European Nitrogen Assessment. Cambridge University Press, Cambridge, pp 177-207
Herwitz SR (1985) Interception storage capacities of tropical rainforest canopy trees. Journal of Hydrology 77, 237-252
Hicks BB (2006) Dry deposition to forests - On the use of data from clearings. Agricultural and Forest Meteorology 136, 214-221
Hicks BB, Baldocchi DD, Meyers TP, Hosker RP, Matt DR (1987) A preliminary multiple resistance routine for deriving dry deposition velocities from measured quantities. Water Air and Soil Pollution 36, 311-330
Hikosaka K (2005) Leaf canopy as a dynamic system: Ecophysiology and optimality in leaf turnover. Annals of Botany 95, 521-533
Hill PW, Raven JA, Sutton MA (2002) Leaf age-related differences in apoplastic NH4+
concentration, pH and the NH3 compensation point for a wild perennial. Journal of Experimental Botany 53, 277-286
Hoad SP, Jeffree CE, Grace J (1992) Effects of wind and abrasion on cuticular integrity in Fagus sylvatica L. and consequences for transfer of pollutants through leaf surfaces. Agriculture Ecosystems & Environment 42, 275-289
Högberg P (2011). What is the quantitative relation between nitrogen deposition and forest carbon sequestration? Global Change Biology 18, 1-2
Hofschreuder P, Römer FG, Van Leeuwen NFM, Arends BG (1997) Deposition of aerosol on Speulder forest: Accumulation experiments. Atmospheric Environment 31, 351-357
Hojjati SM, Hagen-Thorn A, Lamersdorf NP (2009) Canopy composition as a measure to identify patterns of nutrient input in a mixed European beech and Norway spruce forest in central Europe. European Journal of Forest Research 128, 13-25
Holloway PJ (1969) Effects of superficial wax on leaf wettability. Annals of Applied Biology 63, 145-153
Holst T, Hauser S, Kirgäβner A, Matzarakis A, Mayer H, Schindler D (2004) Measuring and modelling plant area index in beech stands. International Journal of Biometeorology 48, 192-201
Horvath L (2004) Determination of the nitrogen compound balance between the atmosphere and a Norway spruce forest ecosystem. Nutrient Cycling in Agroecosystems 70, 143-146
Hothorn T, Bretz F, Westfall P (2008) Simultaneous inference in general parametric models. Biometrical Journal 50, 346-363
Houle D, Ouimet R, Paquin R, Laflamme J (1999) Interactions of atmospheric deposition with a mixed hardwood and a coniferous forest canopy at the Lake Clair Watershed (Duchesnay, Quebec). Canadian Journal of Forest Research 29, 1944-1957
Huang P, Pretzsch H (2010) Using terrestrial laser scanner for estimating leaf areas of individual trees in a conifer forest. Trees-Structure and Function 24, 609-619
Husted S, Schjoerring JK (1996) Ammonia flux between oilseed rape plants and the atmosphere in response to changes in leaf temperature, light intensity, and air humidity - Interactions
194

References
with leaf conductance and apoplastic NH4+ and H+ concentrations. Plant Physiology 112,
67-74 Hutchinson GL, Millington RJ, Peters DB (1972) Atmospheric ammonia - absorption by plant
leaves. Science 175, 771-772 ICP Forests (2010) Manual on methods and criteria for harmonized sampling, assessment,
monitoring and analysis of the effects of air pollution on forests. UNECE ICP Forests Programme Co-ordinating Centre, Hamburg, Germany [www.icp-forests.org/Manual.htm]
Ignatova N, Dambrine E (2000) Canopy uptake of N deposition in spruce (Picea abies L. Karst) stands. Annals of Forest Science 57, 113-120
Johansson O, Nordin A, Olofsson J, Palmqvist K (2010) Responses of epiphytic lichens to an experimental whole-tree nitrogen-deposition gradient. New Phytologist 188, 1075-1084
Johnson DW, Lindberg SE (1992). Atmospheric deposition and forest nutrient cycling. New York, Springer-Verlag
Jones MR, Leith ID, Fowler D, Raven JA, Sutton MA, Nemitz E et al. (2007) Concentration-dependent NH3 deposition processes for mixed moorland semi-natural vegetation. Atmospheric Environment 41, 2049-2060
Jones MR, Raven JA, Leith ID, Cape JN, Smith RI, Fowler D (2008) Short-term flux chamber experiment to quantify the deposition of gaseous 15N-NH3 to Calluna vulgaris. Agriculture and Forest Meteorology 148, 893-901
Kane VR, McGaughey RJ, Bakker JD, Gersonde RF, Lutz JA, Franklin JF (2010) Comparisons between field- and LiDAR-based measures of stand structural complexity. Canadian Journal of Forest Research 40, 761-773
Katul GG, Gronholm T, Launiainen S, Vesala T (2011) The effects of the canopy medium on dry deposition velocities of aerosol particles in the canopy sub-layer above forested ecosystems. Atmospheric Environment 45, 1203-1212
Katz C, Oren R, Schulze ED, Milburn JA (1989) Uptake of water and solutes through twigs of Picea abies (L.) Karst. Trees-Structure and Function 3, 33-37
Kendall M (1975) Multivariate analysis. Charles Griffin & Company, London, UK Klemm O (1989) Leaching and uptake of ions through above-ground Norway spruce tree parts.
In: Schulze E-D, Lange OL, Oren R (eds) Forest decline and air pollution. A study of spruce on acid soils. Springer, New York, pp 210-233
Koyama L, Tokuchi N, Fukushima K, Terai M, Yamamoto Y (2008) Seasonal changes in nitrate use by three woody species: the importance of the leaf-expansion period. Trees-Structure and Function 22, 851-859
Kram KJ (2008) Nitrogen deposition and flux through birch stands (Betula pubescens Ehrh.) in the Kampinos National Park (Central Poland). Polish Journal of Ecology 56, 605-612
Kram KJ (2010) Modification of the atmospheric load of elements during passage through foliaged canopies of five tree species of temperate zone forests. Polish Journal of Ecology 58, 87-101
Kreutzer K, Butterbach-Bahl K, Rennenberg H, Papen H (2009) The complete nitrogen cycle of an N-saturated spruce forest ecosystem. Plant Biology 11, 643-649
Krupa SV (2003) Effects of atmospheric ammonia (NH3) on terrestrial vegetation: a review. Environmental Pollution 124, 179-221
Krupa SV, Legge AH (2000) Passive sampling of ambient, gaseous air pollutants: an assessment from an ecological perspective. Environmental Pollution 107, 31-45
Lang GE, Reiners WA, Heier RK (1976) Potential alteration of precipitation chemistry by epiphytic lichens. Oecologia 25, 229-241
195

References
Laubhann D, Sterba H, Reinds GJ, De Vries W (2009) The impact of atmospheric deposition and climate on forest growth in European monitoring plots: An individual tree growth model. Forest Ecology and Management 258, 1751-1761
Lefsky MA, Hudak AT, Cohen WB, Acker SA (2005) Geographic variability in lidar predictions of forest stand structure in the Pacific Northwest. Remote Sensing of Environment 95, 532-548
Levia DF, Frost EE (2003) A review and evaluation of stemflow literature in the hydrologic and biogeochemical cycles of forested and agricultural ecosystems. Journal of Hydrology 274, 1-29
Levia DF, Frost EE (2006) Variability of throughfall volume and solute inputs in wooded ecosystems. Progress in Physical Geography 30, 605-632
Levia DF, Herwitz SR (2002) Winter chemical leaching from deciduous tree branches as a function of branch inclination angle in central Massachusetts. Hydrological Processes 16, 2867-2879
Levy Y, Horesh I (1984) Importance of penetration through stomata in the correction of chlorosis with iron salts and low-surface-tension surfactants. Journal of Plant Nutrition 7, 279-281
Lindberg SE, Lovett GM (1992) Deposition and forest canopy interactions of airborne sulfur - Results from the integrated forest study. Atmospheric Environment Part A-General Topics 26, 1477-1492
Lindberg SE, Lovett GM, Richter DD, Johnson DW (1986) Atmospheric deposition and canopy interactions of major ions in a forest. Science 231, 141-145
Loubet B, Cellier P. (2001). Experimental assessment of atmospheric ammonia dispersion and short range dry deposition in a maize canopy. Water Air and Soil Pollution: Focus 1, 157-166
Lovett GM (1994) Atmospheric deposition of nutrients and pollutants in North-America - an ecological perspective. Ecological Applications 4, 629-650
Lovett GM, Goodale CL (2011) A new conceptual model of nitrogen saturation based on experimental nitrogen addition to an oak forest. Ecosystems 14, 615-631
Lovett GM, Lindberg SE (1992) Concentration and deposition of particles and vapors in a vertical profile through a forest canopy. Atmospheric Environment 26, 1469-1476
Lovett GM, Lindberg SE (1993) Atmospheric deposition and canopy interactions of nitrogen in forests. Canadian Journal of Forest Research 23, 1603-1616
Lovett GM, Nolan SS, Driscoll CT, Fahey TJ (1996) Factors regulating throughfall flux in a New Hampshire forested landscape. Canadian Journal of Forest Research 26, 2134-2144
Lovett GM, Reiners WA, Olson RK (1989) Factors controlling throughfall chemistry in a balsam fir canopy: A modelling approach. Biogeochemistry 8, 239-264
Lumme I (1994) Nitrogen uptake of Norway spruce (Picea abies Karst.) seedlings from simulated wet deposition. Forest Ecology and Management 63, 87-96
Lumme I, Smolander A (1996) Effect of nitrogen deposition level on nitrogen uptake and bud burst in Norway spruce (Picea abies Karst.) seedlings and nitrogen uptake by soil microflora. Forest Ecology and Management 89, 197-204
Ma BL, Subedi KD, Costa C (2005) Comparison of crop-based indicators with soil nitrate test for corn nitrogen requirement. Agronomy Journal 97, 462-471
Magnani F, Mencuccini M, Borghetti M, Berbigier P, Berninger F, Delzon S et al. (2007) The human footprint in the carbon cycle of temperate and boreal forests. Nature 447, 848-850
Maier-Maercker U (1983) The role of peristomatal transpiration in the mechanism of stomatal movement. Plant, Cell and Environment 6, 369-380
Malek S, Astel A (2008) Throughfall chemistry in a spruce chronosequence in southern Poland. Environmental Pollution 155, 517-527
Marschner H (1995) Mineral nutrition of higher plants. Academic Press, London, UK
196

References
Martin A (1984) Sulfate and nitrate related to acidity in rainwater. Water Air and Soil Pollution 21, 271-277
Massad RS, Nemitz E, Sutton MA (2010) Review and parameterisation of bi-directional ammonia exchange between vegetation and the atmosphere. Atmospheric Chemistry and Physics 10, 10359-10386
Mattsson M, Schjoerring JK (2003) Senescence-induced changes in apoplastic and bulk tissue ammonia concentrations of ryegrass leaves. New Phytologist 160, 489-499
McAinsh MR, Evans NH, Montgomery LT, North KA (2002) Calcium signalling in stomatal responses to pollutants. New Phytologist 153, 441-447
Merony RN (1968) Characteristics of wind and turbulence in and above model forests. Journal of Applied Meteorology 7, 780-788
Meyers TP, Finkelstein P, Clarke J, Ellestad TG, Sims PF (1998) A multilayer model for inferring dry deposition using standard meteorological measurements. Journal of Geophysical Research-Atmospheres 103(D17), 22645-22661
Michalzik B, Kalbitz K, Park JH, Solinger S, Matzner E (2001) Fluxes and concentrations of dissolved organic carbon and nitrogen - a synthesis for temperate forests. Biogeochemistry 52, 173-205
Millard P, Grelet GA (2010) Nitrogen storage and remobilization by trees: ecophysiological relevance in a changing world. Tree Physiology 30, 1083-1095
Millard P, Proe MF (1993) Nitrogen uptake, partitioning and internal cycling in Picea sitchensis (Bong.) Carr. as influenced by nitrogen supply. New Phytologist 125, 113-119
Millard P, Thompson CM (1989) The effect of the autumn senescence of leaves on the internal cycling of nitrogen for the spring growth of apple trees. Journal of Experimental Botany 40, 1285-1289
Monks PS, Granier C, Fuzzi S, Stohl A, Williams ML, Akimoto H et al. (2009) Atmospheric composition change - global and regional air quality. Atmospheric Environment 43, 5268-5350
Morikawa H, Higaki A, Nohno M, Takahasi M, Kamada M, Nakata M et al. (1998) More than a 600-fold variation in nitrogen dioxide assimilation among 217 plant taxa. Plant Cell and Environment 21, 180-190
Muller B, Touraine B, Rennenberg H (1996) Interaction between atmospheric and pedospheric nitrogen nutrition in spruce (Picea abies L. Karst) seedlings. Plant Cell and Environment 19, 345-355
Mussche S, Samson R, Nachtergale L, De Schrijver A, Lemeur R, Lust N (2001) A comparison of optical and direct methods for monitoring the seasonal dynamics of leaf area index in deciduous forests. Silva Fennica 35, 373-384
Nadelhoffer KJ, Emmett BA, Gundersen P, Kjonaas OJ, Koopmans CJ, Schleppi P et al. (1999) Nitrogen deposition makes a minor contribution to carbon sequestration in temperate forests. Nature 398, 145-148
Nadkarni NM, McIntosh ACS, Cushing JB (2008) A framework to categorize forest structure concepts. Forest Ecology and Management 256, 872-882
Nadkarni NM, Sumera MM (2004) Old-growth forest canopy structure and its relationship to throughfall interception. Forest Science 50, 290-298
Neary AJ, Gizyn WI (1994) Throughfall and stemflow chemistry under deciduous and coniferous forest canopies in south-central Ontario. Canadian Journal of Forest Research 24, 1089-1100
Neighbour EA, Cottam DA, Mansfield TA (1988) Effects of sulfur dioxide and nitrogen dioxide on the control of water loss by birch (Betula spp.). New Phytologist 108, 149-157
Neinhuis C, Barthlott W (1998) Seasonal changes of leaf surface contamination in beech, oak, and ginkgo in relation to leaf micromorphology and wettability. New Phytologist 138, 91-98
197

References
Neirynck J, Ceulemans R (2008) Bidirectional ammonia exchange above a mixed coniferous forest. Environmental Pollution 154, 424-438
Neirynck J, Flechard CR, Fowler D (2011) Long term (13 years) measurements of SO2 fluxes over a forest and their control by surface chemistry. Agricultural and Forest Meteorology 151, 1768-1780
Neirynck J, Janssens IA, Roskams P, Quataert P, Verschelde P, Ceulemans R (2008) Nitrogen biogeochemistry of a mature Scots pine forest subject to high nitrogen loads. Biogeochemistry 91, 201-222
Neirynck J, Kowalski AS, Carrara A, Ceulemans R (2005) Driving forces for ammonia fluxes over mixed forest subjected to high deposition loads. Atmospheric Environment 39, 5013-5024
Neirynck J, Kowalski AS, Carrara A, Genouw G, Berghmans P, Ceulemans R (2007) Fluxes of oxidised and reduced nitrogen above a mixed coniferous forest exposed to various nitrogen emission sources. Environmental Pollution 149, 31-43
Neirynck J, Van Ranst E, Roskams P, Lust N (2002) Impact of decreasing throughfall depositions on soil solution chemistry at coniferous monitoring sites in northern Belgium. Forest Ecology and Management 160, 127-142
Nemitz E, Sutton MA, Schjoerring JK, Husted S, Wyers GP (2000) Resistance modelling of ammonia exchange over oilseed rape. Agricultural and Forest Meteorology 105, 405-25
Niinemets U (2007) Photosynthesis and resource distribution through plant canopies. Plant Cell and Environment 30, 1052-1071
Niinemets U (2010) A review of light interception in plant stands from leaf to canopy in different plant functional types and in species with varying shade tolerance. Ecological Research 25, 693-714
Niinemets U, Tamm U (2005) Species differences in timing of leaf fall and foliage chemistry modify nutrient resorption efficiency in deciduous temperate forest stands. Tree Physiology 25, 1001-1014
Nilsson J, Grennfelt P. (1988) Critical loads for sulphur and nitrogen. MiljØ rapport 1988: 15. Copenhagen Denmark Nordic Council of Ministers
Nussbaum S, Vonballmoos P, Gfeller H, Schlunegger UP, Fuhrer J, Rhodes D et al. (1993) Incorporation of atmospheric 15NO2-nitrogen into free amino acids by Norway spruce Picea abies (L.) Karst. Oecologia 94, 408-414
Ould-Dada Z (2002) Dry deposition profile of small particles within a model spruce canopy. Science of the Total Environment 286, 83-96
Overloop S., Bossuyt M., Claeys D., D'hooghe J., Elsen A., Eppinger R., Wustenberghs H. (2011) Milieurapport Vlaanderen. Achtergronddocument 2011. Vermesting.
Pannatier EG, Thimonier A, Schmitt M, Walthert L, Waldner P (2011) A decade of monitoring at Swiss Long-Term Forest Ecosystem Research (LWF) sites: can we observe trends in atmospheric acid deposition and in soil solution acidity? Environmental Monitoring and Assessment 174, 3-30
Paoletti E, Grulke NE (2005) Does living in elevated CO2 ameliorate tree response to ozone? A review on stomatal responses. Environmental Pollution 137, 483-493
Papen H, Gessler A, Zumbusch E, Rennenberg H (2002) Chemolithoautotrophic nitrifiers in the phyllosphere of a spruce ecosystem receiving high atmospheric nitrogen input. Current Microbiology 44, 56-60
Parker GG (1983) Throughfall and stemflow in the forest nutrient cycle. Advances in Ecological Research 13, 57-133
Pearcy RW, Schulze ED, Zimmerman R (1989) Measurement of transpiration and leaf conductance. In: Pearcy RW, Ehleringer JR, Mooney HA, Rundel PW (eds) Plant
198

References
physiological ecology. Field methods and instrumentation. Chapman and Hall, London, UK, pp 37-60
Pearson J, Stewart GR (1993) The deposition of atmospheric ammonia and its effects on plants. New Phytologist 125, 283-305
Pearson J, Woodall J, Clough ECM, Nielsen KH, Schjoerring JK (2002) Production and consumption of NH4
+ and NH3 in trees. In: Gasche R, Papen H, Rennenberg H (eds) Trace gas exchange in forest ecosystems. Tree Physiology. Kluwer Academic Publishers, Dordrecht, the Netherlands, pp 53-77
Pérez-Soba M, Van der Eerden LJM (1993) Nitrogen uptake in needles of Scots pine (Pinus sylvestris L.) when exposed to gaseous ammonia and ammonium fertilizer in the soil. Plant and Soil 153, 231-242
Petroff A, Mailliat A, Amielh M, Anselmet F (2008) Aerosol dry deposition on vegetative canopies. Part I: Review of present knowledge. Atmospheric Environment 42, 3625-3653
Peuke AD, Jeschke WD, Dietz KJ, Schreiber L, Hartung W (1998) Foliar application of nitrate or ammonium as sole nitrogen supply in Ricinus communis - I. Carbon and nitrogen uptake and inflows. New Phytologist 138, 675-687
Pieterse G, Bleeker A, Vermeulen AT, Wu Y, Erisman JW (2007) High resolution modelling of atmosphere-canopy exchange of acidifying and eutrophying components and carbon dioxide for European forests. Tellus B 59, 412-424
Pilegaard K, Skiba U, Ambus P, Beier C, Brüggemann N, Butterbach-Bahl K et al. (2006) Factors controlling regional differences in forest soil emission of nitrogen oxides (NO and N2O). Biogeosciences 3, 651-661
Pinheiro J, Bates D, DebRoy S, Sarkar D, R Development Core Team (2011) nlme: Linear and Nonlinear Mixed Effects Models. R package version 3. 1-101
Potter CS, Ragsdale HL, Swank WT (1991) Atmospheric deposition and foliar leaching in a regenerating southern Appalachian forest canopy. Journal of Ecology 79, 97-115
R Development Core Team (2011) R: A language and environment for statistical computing. R Foundation for Statistical Computing, Vienna, Austria [www.R-project.org]
Raat KJ, Draaijers GPJ, Schaap MG, Tietema A, Verstraten JM (2002) Spatial variability of throughfall water and chemistry and forest floor water content in a Douglas fir forest stand. Hydrology and Earth System Sciences 6, 363-374
Raivonen M, Vesala T, Pirjola L, Altimir N, Keronen P, Kulmala M et al. (2009) Compensation point of NOx exchange: Net result of NOx consumption and production. Agricultural and Forest Meteorology 149, 1073-1081
Ranius T, Johansson P, Berg N, Niklasson M (2008) The influence of tree age and microhabitat quality on the occurrence of crustose lichens associated with old oaks. Journal of Vegetation Science 19, 653-662
Raven JA (1988) Acquisition of nitrogen by the shoots of land plants - its occurrence and implications for acid-base regulation. New Phytologist 109, 1-20
Reiners WA, Olson RK (1984) Effects of canopy components on throughfall chemistry - an experimental-analysis. Oecologia 63, 320-330
Rennenberg H, Gessler A (1999) Consequences of N deposition to forest ecosystems - Recent results and future research needs. Water Air and Soil Pollution 116, 47-64
Rennenberg H, Kreutzer K, Papen H, Weber P (1998) Consequences of high loads of nitrogen for spruce (Picea abies) and beech (Fagus sylvatica) forests. New Phytologist 139, 71-86
Rockström J, Steffen W, Noone K, Persson Å, Chapin FS III, Lambin E et al. (2009) A safe operating space for humanity. Nature 461, 472-475
Rodrigo A, Avila A (2002) Dry deposition to the forest canopy and surrogate surfaces in two Mediterranean holm oak forests in Montseny (NE Spain). Water Air and Soil Pollution 136, 269-288
199

References
Roskams P, Sioen G, Overloop S (1997) Meetnet voor de intensieve monitoring van het bosecosysteem in het Vlaamse Gewest. Resultaten 1991-1992. Instituut voor Bosbouw en Wildbeheer, Geraardsbergen, Belgium
Rothe A, Huber C, Kreutzer K, Weis W (2002) Deposition and soil leaching in stands of Norway spruce and European beech: Results from the Hoglwald research in comparison with other European case studies. Plant and Soil 240, 33-45
Ruijgrok W, Tieben H, Eisinga P (1997) The dry deposition of particles to a forest canopy: a comparison of model and experimental results. Atmospheric Environment 31, 399-415
Saghir NS, Mulvaney RL, Azam F (1993) Determination of nitrogen by microdiffusion in mason jars. 1. Inorganic nitrogen in soil extracts. Communication in Soil Science and Plant Analyses 24, 1745-1762
Salem AA, Soliman AA, El-Haty IA (2009) Determination of nitrogen dioxide, sulfur dioxide, ozone, and ammonia in ambient air using the passive sampling method associated with ion chromatographic and potentiometric analyses, Air Quality, Atmosphere & Health 2, 133-145
Sampson DA, Janssens IA, Ceulemans R (2006) Under-story contributions to stand level GPP using the process model SECRETS. Agricultural and Forest Meteorology 139, 94-104
Samson R (2001) An experimental and modelling approach to the actual evapotranspiration in a mixed forest ecosystem (Experimental forest Aelmoeseneie at Gontrode). PhD thesis. Ghent University, Ghent, Belgium
Sase H, Takahashi A, Sato M, Kobayashi H, Nakata M, Totsuka T (2008) Seasonal variation in the atmospheric deposition of inorganic constituents and canopy interactions in a Japanese cedar forest. Environmental Pollution 152, 1-10
Schaefer DA, Reiners WA, Olson RK (1988) Factors controlling the chemical alteration of throughfall in a subalpine balsam fir canopy. Environmental and Experimental Botany 28, 175-189
Schjoerring JK, Husted S, Mattsson M (1998) Physiological parameters controlling plant-atmosphere ammonia exchange. Atmospheric Environment 32, 491-498
Schoenherr J (1982) Resistance of plant surfaces to water loss: transport properties of cutin, suberin and associated lipids. In: Lange OL, Nobel PS, Osmond CB, Ziegler H (eds) Physiological plant ecology II. Springer, New York, pp 154-179
Schreiber L, Skrabs M, Hartmann KD, Diamantopoulos P, Simanova E, Santrucek J (2001) Effect of humidity on cuticular water permeability of isolated cuticular membranes and leaf disks. Planta 214, 274-282
Schulze E-D, Beck E, Müller-Hohnenstein K (2005) Plant ecology. Springer-Verlag, New York Shaver CL, Tonnessen KA, Maniero TG (1994) Clearing the air at Great Smoky Mountains
National Park. Ecological Applications 4, 690-701 Sievering H, Tomaszewski T, Torizzo J (2007) Canopy uptake of atmospheric N deposition at a
conifer forest: part I - canopy N budget, photosynthetic efficiency and net ecosystem exchange. Tellus B 59, 483-492
Sinoquet H, Pincebourde S, Adam B, Donès N, Phattaralerphong J, Combes D et al. (2009) 3-D maps of tree canopy geometrics at leaf scale. Ecology 90, 283-283
Slinn WGN (1982) Predictions for particle deposition to vegetative canopies. Atmospheric Environment 16, 1785-1794
Smirnoff N, Todd P, Stewart GR (1984) The occurrence of nitrate reduction in the leaves of woody plants. Annals of Botany 54, 363-374
Solberg S, Dobbertin M, Reinds GJ, Lange H, Andreassen K, Fernandez PG et al. (2009) Analyses of the impact of changes in atmospheric deposition and climate on forest growth in European monitoring plots: A stand growth approach. Forest Ecology and Management 258, 1735-1750
200

References
Sparks JP (2009) Ecological ramifications of the direct foliar uptake of nitrogen. Oecologia 159, 1-13
Stachurski A, Zimka JR (2000) Atmospheric input of elements to forest ecosystems: a method of estimation using artificial foliage placed above rain collectors. Environmental Pollution 110, 345-356
Stachurski A, Zimka JR (2002) Atmospheric deposition and ionic interactions within a beech canopy in the Karkonosze Mountains. Environmental Pollution 118, 75-87
Stadler B, Solinger S, Michalzik B (2001) Insect herbivores and the nutrient flow from the canopy to the soil in coniferous and deciduous forests. Oecologia 126, 104-113
Staelens J, De Schrijver A, Van Avermaet P, Genouw G, Verhoest N (2005) A comparison of bulk and wet-only deposition at two adjacent sites in Melle (Belgium). Atmospheric Environment 39, 7-15
Staelens J, De Schrijver A, Verheyen K (2007) Seasonal variation in throughfall and stemflow chemistry beneath a European beech (Fagus sylvatica) tree in relation to canopy phenology. Canadian Journal of Forest Research 37, 1359-1372
Staelens J, De Schrijver A, Verheyen K, Verhoest NEC (2006) Spatial variability and temporal stability of throughfall deposition under beech (Fagus sylvatica L.) in relationship to canopy structure. Environmental Pollution 142, 254-263
Staelens J, Houle D, De Schrijver A, Neirynck J, Verheyen K (2008) Calculating dry deposition and canopy exchange with the canopy budget model: Review of assumptions and application to two deciduous forests. Water Air and Soil Pollution 191, 149-169
Staelens J, Neirynck J, Genouw G, Roskams P (2009) Dynamic modelling of target loads of acidifying deposition for forest ecosystems in Flanders (Belgium). iForest-Biogeosciences and Forestry 2, 30-33
Staelens J, Wuyts K, Adriaenssens S, Buysse H, Van den Bril B, Verheyen K et al. (in press) Trends in atmospheric nitrogen and sulphur deposition in northern Belgium. Atmospheric Environment
Stevens RJ, Laughlin RJ (1994) Determining nitrogen-15 in nitrite and nitrate by producing nitrous oxide. Soil Science Society of America Journal 58, 1108-1116
Stulen I, Pérez-Soba M, De Kok LJ, Van der Eerden L (1998) Impact of gaseous nitrogen deposition on plant functioning. New Phytologist 139, 61-70
Sutton M, Fowler D, Burkhardt J, Milford C (1995) Vegetation atmosphere exchange of ammonia: canopy cycling and the impacts of elevated nitrogen inputs. Water Air and Soil Pollution 85, 2057-2063
Sutton MA, Burkhardt JK, Guerin D, Nemitz E, Fowler D (1998) Development of resistance models to describe measurements of bi-directional ammonia surface-atmosphere exchange. Atmospheric Environment 32, 473-480
Swaans W, Damen E, Goelen E, De Fré R (2005) Validatie van de Radiello NH3 passieve sampler. Study on the authority of the Flemish Environment Agency. Final Report 2005/MIM/R/045. VITO, Belgium
Talkner U, Krämer I, Hölscher D, Beese FO (2010) Deposition and canopy exchange processes in central-German beech forests differing in tree species diversity. Plant and Soil 336, 405-420
Tateno R, Takeda H (2010) Nitrogen uptake and nitrogen use efficiency above and below ground along a topographic gradient of soil nitrogen availability. Oecologia 163, 793-804
Ten Harkel MJ (1997) The effects of particle-size distribution and chloride depletion of sea-salt aerosols on estimating atmospheric deposition at a coastal site. Atmospheric Environment 31, 417-427
201

References
Thimonier A, Schmitt M, Waldner P, Rihm B (2005) Atmospheric deposition on Swiss long-term forest ecosystem research (LWF) plots. Environmental Monitoring and Assessment 104, 81-118
Thoene B, Rennenberg H, Weber P (1996) Absorption of atmospheric NO2 by spruce (Picea abies) trees. II. Parameterization of NO2 fluxes by controlled dynamic chamber experiments. New Phytologist 134, 257-266
Thoene B, Schröder P, Papen H, Egger A, Rennenberg H (1991) Absorption of atmospheric NO2 by spruce (Picea abies L. Karst.) trees. I. NO2 influx and its correlation with nitrate reduction. New Phytologist 117, 575-585
Thomas RQ, Canham CD, Weathers KC, Goodale CL (2010) Increased tree carbon storage in response to nitrogen deposition in the US. Nature Geoscience 3, 13-17
Tukey HB (1970) Leaching of substances from plants. Annual Review of Plant Physiology 21, 305-324
Tyree MT, Scherbatskoy TD, Tabor CA (1990) Leaf cuticles behave as asymmetric membranes: evidence from the measurement of diffusion potentials. Plant Physiology 92, 103-109
UBA (2004) Manual on methodologies and criteria for modelling and mapping critical loads & levels and air pollution effects, risks and trends. Federal Environmental Agency, Berlin, Germany [www.icpmapping.org]
Ukonmaanaho L, Starr M (2002) Major nutrients and acidity: budgets and trends at four remote boreal stands in Finland during the 1990s. Science of the Total Environment 297, 21-41
Ulrich B (1983) Interaction of forest canopies with atmospheric constituents: SO2, alkali and earth alkali cations and chloride. In: Ulrich B, Pankrath J (eds) Effects of accumulation of air pollutants in forest ecosystems. Reidel Publishing, Dordrecht, pp 33-45
Umana HNN, Wanek W (2010) Large canopy exchange fluxes of inorganic and organic nitrogen and preferential retention of nitrogen by epiphytes in a tropical lowland rainforest. Ecosystems 13, 367-381
Vallano DM, Sparks JP (2007) Foliar δ15N values as indicators of foliar uptake of atmospheric nitrogen pollution. In: Dawson TE, Siegwolf R (eds) Stable isotopes as indicators of ecological change. Elsevier Academic Press, San Diego, pp 93-109
Vallano DM, Sparks JP (2008) Quantifying foliar uptake of gaseous nitrogen dioxide using enriched foliar δ15N values. New Phytologist 177, 946-955
Van der Maas MP, Van Breemen N, Van Langenvelde I (1991) Estimation of atmospheric deposition and canopy exchange in two Douglas forest stands in the Netherlands. Internal publication. Department of Soil Science and Geology, Agricultural University of Wageningen, The Netherlands. In: Draaijers G, Erisman J, Lövblad G, Spranger T, Vel E (eds) Quality and uncertainty aspects of forest deposition estimation using throughfall, stemflow and precipitation measurements. TNO-MEP-Report 98/003. TNO Institute of Environmental Sciences, Energy Research and Process Innovation, Apeldoorn, the Netherlands
Van der Zande D, Hoet W, Jonckheere L, van Aardt J, Coppin P (2006) Influence of measurement set-up of ground-based LiDAR for derivation of tree structure. Agricultural and Forest Meteorology 141, 147-160
Van der Zande D, Mereu S, Nadezhdina N, Cermak J, Muys B, Coppin P et al. (2009) 3D upscaling of transpiration from leaf to tree using ground-based LiDAR: Application on a Mediterranean holm oak (Quercus ilex L.) tree. Agricultural and Forest Meteorology 149, 1573-1583
Van Ek R, Draaijers GPJ (1994) Estimates of atmospheric deposition and canopy exchange for three common tree species in the Netherlands. Water Air and Soil Pollution 73, 61-82
Van Hove LWA, Adema EH (1996) The effective thickness of water films on leaves. Atmospheric Environment 30, 2933-2936
202

References
Van Hove LWA, Adema EH, Vredenberg WJ, Pieters GA (1989a) A study of the adsorption of NH3 and SO2 on leaf surfaces. Atmospheric Environment 23, 1479-1486
Van Hove LWA, Koops AJ, Adema EH, Vredenberg WJ, Pieters GA (1987) Analysis of the uptake of atmospheric ammonia by leaves of Phaseolus vulgaris L. Atmospheric Environment 21, 1759-1763
Van Hove LWA, Vankooten O, Adema EH, Vredenberg WJ, Pieters GA (1989b) Physiological effects of long-term exposure to low and moderate concentrations of atmospheric NH3 on poplar leaves. Plant Cell and Environment 12, 899-908
Van Hove LWA, Vredenberg WJ, Adema EH (1990) The effect of wind velocity, air temperature and humidity on NH3 and SO2 transfer into bean leaves (Phaseolus vulgaris L.). Atmospheric Environment Part a-General Topics 24, 1263-1270
van Leeuwen M, Nieuwenhuis M (2010) Retrieval of forest structural parameters using LiDAR remote sensing. European Journal of Forest Research 129, 749-770
Van Wittenberghe S (2009) Karakterisatie van anatomische en fysiologische bladeigenschappen bij loof- en naaldboomsoorten en langsheen een vertikale gradiënt bij beuk (Fagus sylvatica L.). M.Sc thesis. Ghent University, Ghent, Belgium
Vandenbruwane J, De Neve S, Qualls RG, Sleutel S, Hofman G (2007) Comparison of different isotherm models for dissolved organic carbon (DOC) and nitrogen (DON) sorption to mineral soil. Geoderma 139, 144-153
Vanguelova EI, Benham S, Pitman R, Moffat AJ, Broadmeadow M, Nisbet T et al. (2010) Chemical fluxes in time through forest ecosystems in the UK - Soil response to pollution recovery. Environmental Pollution 158, 1857-1869
Verstraeten A, Sioen G, Neirynck J, Coenen S, Roskams P (2008) Bosgezondheid in Vlaanderen. Bosvitaliteitsinventaris, meetnet Intensieve Monitoring Bosecosystemen en meetstation luchtverontreiniging. Resultaten 2007. Report INBO.R.2008.30. Instituut voor Natuur- en Bosonderzoek, Brussel, Belgium
Verstraeten A, Sioen G, Neirynck J, Corluy J, Dhaluin P, De Geest L et al. (2010) Bosgezondheid in Vlaanderen. Bosvitaliteitsinventaris, meetnet Intensieve Monitoring Bosecosystemen en meetstation luchtverontreiniging. Resultaten 2008-2009. Report INBO.R.2010.50. Instituut voor Natuur- en Bosonderzoek, Brussel, Belgium
Verstraeten A, Sioen G, Neirynck J, Genouw G, Coenen S, Van der Aa B et al. (2007) Bosvitaliteitsinventaris, meetnet Intensieve Monitoring Bosecosystemen en meetstation luchtverontreiniging. Resultaten 2006. Report INBO.R.2007.47. Instituut voor Natuur- en Bosonderzoek, Geraardsbergen, Belgium
Vestreng V, Myhre G, Fagerli H, Reis S, Tarrasón L (2007) Twenty-five years of continuous sulphur dioxide emission reduction in Europe. Atmospheric Chemistry and Physics 7, 3663-3681
Vitousek PM, Aber JD, Howarth RW, Likens GE, Matson PA, Schindler DW et al. (1997) Human alteration of the global nitrogen cycle: sources and consequences. Ecological Applications 7, 737-750
VMM (2009) 'Zure regen' in Vlaanderen. Depositiemeetnet verzuring 2007. Vlaamse Milieumaatschappij, Belgium
Von Ende CN (2001) Repeated-measures analysis. Growth and other time-dependent measures. In: Scheiner SM, Gurevitch J (eds) Design and analysis of ecological experiments. Oxford University Press, New York, pp 134-157
Vose JM, Swank WT (1990) Preliminary estimates of foliar absorption of 15N labeled nitric acid vapor (HNO3) by mature eastern white pine (Pinus strobus). Canadian Journal of Forest Research 20, 857-860
Wang L, Xu YC, Schjoerring JK (2011) Seasonal variation in ammonia compensation point and nitrogen pools in beech leaves (Fagus sylvatica). Plant and Soil 343, 51-66
203

References
204
Wellburn AR (1990) Why are atmospheric oxides of nitrogen usually phytotoxic and not alternative fertilizers. New Phytologist 115, 395-429
Wesely ML, Hicks BB (2000) A review of the current status of knowledge on dry deposition. Atmospheric Environment 34, 2261-2282
Whelan MJ, Sanger LJ, Baker M, Anderson JM (1998) Spatial patterns of throughfall and mineral ion deposition in a lowland Norway spruce (Picea abies) plantation at the plot scale. Atmospheric Environment 32, 3493-3501
Wilson EJ (1992) Foliar uptake and release of inorganic nitrogen compounds in Pinus sylvestris L. and Picea abies (L.) Karst. New Phytologist 120, 407-416
Wilson EJ, Tiley C (1998) Foliar uptake of wet-deposited nitrogen by Norway spruce: An experiment using 15N. Atmospheric Environment 32, 513-518
Winner WE, Mooney HA, Goldstein RA (1985) Sulfur dioxide and vegetation. Physiology, ecology and policy issues. Stanford University Press, Stanford, California
Wood SN (2003) Thin plate regression splines. Journal of the Royal Statistical Society: Series B 65, 95-114
Wood SN (2006) Generalized Additive Models: An Introduction with R. Chapman and Hall/CRC Wu J, Brashers B, Finkelstein PL, Pleim JE (2003) A multilayer biogeochemical dry deposition
model. 1. Model formulation. Journal of Geophysical Research-Atmospheres 108 (D1), 4013
Wu Y, Clarke N, Mulder J (2010) Dissolved organic nitrogen concentrations and ratios of dissolved organic carbon to dissolved organic nitrogen in throughfall and soil waters in Norway spruce and Scots pine forest stands throughout Norway. Water Air and Soil Pollution 210, 171-186
Wu Z, Wang X, Chen F, Turnipseed AA, Guenther AB, Niyogi D et al. (2011) Evaluating the calculated dry deposition velocities of reactive nitrogen oxides and ozone from two community models over a temperate deciduous forest. Atmospheric Environment 45, 2663-2674
Wuyts K (2009) Patterns of throughfall deposition, nitrate seepage and soil acidification in contrasting forest edges. PhD thesis. Ghent University, Ghent, Belgium
Wuyts K, De Schrijver A, Staelens J, Gielis M, Geudens G, Verheyen K (2008a) Patterns of throughfall deposition along a transect in forest edges of silver birch and Corsican pine. Canadian Journal of Forest Research 38, 449-461
Wuyts K, Verheyen K, De Schrijver A, Cornelis WM, Gabriels D (2008b) The impact of forest edge structure on longitudinal patterns of deposition, wind speed, and turbulence. Atmospheric Environment 42, 8651-8660
Wyers GP, Erisman JW (1998) Ammonia exchange over coniferous forest. Atmospheric Environment 32, 441-451
Zhang G, Zeng GM, Jiang YM, Du CY, Huang GH, Zeng M et al. (2006) Exchange of proton and major elements in two-layer canopies under acid rain in a subtropical evergreen forest in central-south China. Journal of Integrative Plant Biology 48, 1154-1162
Zhang L, Moran MD, Makar PA, Brook JR, Gong SL (2002) Modelling gaseous dry deposition in AURAMS: a unified regional air-quality modelling system. Atmospheric Environment 36, 537-360
Zimmermann F, Plessow K, Queck R, Bernhofer C, Matschullat J (2006) Atmospheric N- and S-fluxes to a spruce forest - Comparison of inferential modelling and the throughfall method. Atmospheric Environment 40, 4782-4796

Curriculum vitae
Personal data
Name Sandy M.I. Adriaenssens
Place of birth Sint-Niklaas Date of birth 30th of June 1983
Nationality Belgian Home address Pol de Vischstraat 28, 9050 Ledeberg, Belgium
Phone Private: 0472/91 17 67
E-mail [email protected]
Education and academic records
2007 12-day course in Vegetation Science, Inverde Institute, Groenendaal
2001 – 2006 MSc in Bioscience engineering, Land and Forest Management Faculty of Bioscience Engineering, Ghent University
1995 – 2001 Secondary School Sciences – Mathematics Berkenboom Humaniora Sint-Niklaas
Professional experience
Jan 2012 – Present Scientific worker at the Belgian Interregional Environment Agency (IRCEL) on the Interreg IV-B project Joaquin
Jan 2008 – Dec 2011 PhD-research at Ghent University, Faculty of Bioscience Engineering, Laboratory of Forestry; financed by the Research Foundation - Flanders (FWO)
Nov 2006 – Dec 2007 Project manager of the section Water and Ecology in the firm of consulting engineers Libost-Groep NV
Aug 2006 – Sept 2006 Scientific worker at Ghent University, Faculty of Bioscience Engineering, Laboratory of Forestry on a project financed by the province of Limburg
August 2004 Fieldworker for the Flemish Institute of Nature Conservation, Brussels, Belgium
205

Curriculum vitae
Scientific publications
Publications in international journals with peer review cited in the Science Citation Index (IF = impact factor for 2010)
Adriaenssens S, Staelens J, Van der Zande D, Coppin P, Boeckx P, Samson R, Verheyen K. Dry deposition along a vertical gradient within a beech (Fagus sylvatica L.) canopy: comparison of methods and dependence on canopy structure. Submitted to Journal of Geophysical Research-Biogeosciences (IF = 3.303)
Adriaenssens S, Staelens J, Wuyts K, Samson R, Verheyen K, Boeckx P. Retention of dissolved inorganic nitrogen by foliage and twigs of four temperate tree species. Submitted to Ecosystems (IF = 3.679)
Adriaenssens S, Staelens J, Wuyts K, Van Wittenberghe S, Wuytack T, Verheyen K, Boeckx P, Samson R. Canopy uptake of 15NH3 by four temperate tree species and the interaction with leaf properties. Submitted to Water Air and Soil Pollution (IF = 1.765)
Wuytack T, Verheyen K, Wuyts K, Adriaenssens S, Staelens J, Samson R. Leaf characteristics of common oak (Quercus robur L.) are not affected by ambient atmospheric NH3 concentrations. Submitted to Ecological Indicators (IF = 2.967)
Van Wittenberghe S, Adriaenssens S, Staelens J, Verheyen K, Samson R. Microclimate and tree age effects on European beech (Fagus sylvatica L.) leaf properties related to gaseous and dissolved compound exchange. Trees – Structure and Function, in press (IF = 1.900)
Adriaenssens S, Hansen K, Staelens J, Wuyts K, De Schrijver A, Baeten L, Boeckx P, Samson R, Verheyen K (2012) Throughfall deposition and canopy exchange processes along a vertical gradient within the canopy of beech (Fagus sylvatica L.) and Norway spruce (Picea abies (L.) Karst). Science of the Total Environment 420, 168-182 (IF = 3.190)
Staelens J, Wuyts K, Adriaenssens S, Buysse H, Van den Bril B, Verheyen K, Thas O, Ottoy JP, Deschepper E (2012) Trends in atmospheric nitrogen and sulphur deposition in northern Belgium. Atmospheric Environment 49, 186-196 (IF = 3.226)
Kardel F, Wuyts K, Babanezhad M, Wuytack T, Adriaenssens S, Samson R (2012) Tree leaf wettability as passive bio-indicator of urban habitat quality. Environmental and Experimental Botany 75, 277-285 (IF = 2.699)
Adriaenssens S, Staelens J, Wuyts K, De Schrijver A, Van Wittenberghe S, Wuytack T, Kardel F, Verheyen K, Samson R, Boeckx P (2011) Foliar nitrogen uptake from wet deposition and its interaction with leaf wettability and water storage capacity. Water Air and Soil Pollution 219, 43-57 (IF = 1.765)
Vanden Broek A, Gruwez R, Cox K, Adriaenssens S, Michalczyk IM, Verheyen K (2011) Tree response to fragmentation: the case of the threatened Juniperus communis. BMC Genetics 12:73 (IF = 2.49)
Wuyts K, De Schrijver A, Staelens J, Van Nevel L, Adriaenssens S, Verheyen K (2011) Soil inorganic nitrogen leaching in edges of different forest types subject to high N deposition loads. Ecosystems 14, 818-834 (IF = 3.679)
206

Curriculum vitae
Verheyen K, Adriaenssens S, Gruwez R, Michalczyck IM, Ward L, Rosseel Y, Vanden Broeck A, Garcia D (2009) Juniperus communis: victim of a combined action of climate change and nitrogen deposition? Plant Biology 11, 49-59 (IF = 2.409)
Wuytack T, Verheyen K, Wuyts K, Adriaenssens S, Kardel F, Samson R (2009) The potential of biomonitoring of air quality by using leaf characteristics of white willow (Salix alba L.). Environmental Monitoring and Assessment 171, 197-204 (IF = 1.436)
National publications without peer review
Verheyen K, Adriaenssens S, Crabbe S, Baeten L (2007) Haalt de jeneverbes het jaar 2025 in Limburg? Likona jaarboek
Publications in proceedings of scientific congresses
Adriaenssens S, Staelens J, Van Wittenberghe S, Samson R, Boeckx P, Verheyen K (2010) Seasonal canopy uptake of dry deposited 15N-NH3 under different N loads and the interaction with leaf physical properties. In: Wuyts K, Samson R, De Maerschalck B, Kardel F, Janssen S, Engelen M (eds) Proceedings of the international conference on “Local air quality and it’s interactions with vegetation”, 21 – 22 January 2010, CCC Elzenveld, Antwerp, Belgium, pp 131-134
Adriaenssens S, Staelens J, Van Wittenberghe S, Samson R, Boeckx P, Verheyen K (2009) Seasonal canopy uptake of dry deposited 15N-NH3 under different N loads and the interaction with leaf physical properties. In: Lüers J, Foken T (eds) Proceedings of the International conference of “Atmospheric transport and chemistry in forest ecosystems”, 5 – 8 October 2009, Castle of Thurnau, Germany, p 38
Abstracts of presentations at scientific congresses
Adriaenssens S, Staelens J, Wuyts K, Samson R, Boeckx P, Verheyen K (2011) Opname van stikstof uit regenwater door boomkronen in relatie tot doorvalmetingen. Oral presentation in: Starters voor Bosonderzoek 2011, 17 March 2011, Brussels, Belgium, p 3
Vanden Broek A, Gruwez R, Cox K, Adriaenssens S, Verheyen K (2010) Integratie van genetische variatie in het soortbeschermingsplan Jeneverbes. Poster abstract in: Studiedag Genetica in Natuurbeleid en Beheer, 18 November 2010, Brussels, Belgium
Adriaenssens S, Staelens J, Samson R, Verheyen K, Boeckx P (2010) Canopy uptake of dissolved 15N: a validation of the canopy budget model. Oral presentation in: BASIS annual meeting 2010, 15 – 16 April 2010, Arnhem, the Netherlands. Winner of the Young Scientist Award
Adriaenssens S, Staelens J, Samson R, Boeckx P, Verheyen K (2010) Spatial and temporal variability of throughfall water and dry deposition along a vertical gradient in a beech canopy. Oral presentation in: 24th IUFRO conference for specialists in air pollution and climate change effects on forest ecosystems “Adaption of forest ecosystems to air pollution and climate change”, 22 – 26 March 2010, Antalya, Turkey, p 23
207

Curriculum vitae
Adriaenssens S, Staelens J, Van den Bilcke N, Boeckx P, Samson R, Verheyen K (2009) Quantifying aboveground nitrogen uptake from wet deposition: impact of tree species, N load and leaf phenology. Poster abstract in: Ukonmaanaho L, Nieminen TM, Starr M (eds) 6th International Symposium on Ecosystem Behaviour: Biogeomon Conference 2009, 29 June – 3 July 2009, Helsinki, Finland, p 192
Adriaenssens S, Staelens J, Van den Bilcke N, Boeckx P, Samson R, Verheyen K (2009) Quantifying aboveground N uptake from wet deposition: impact of tree species, N load and leaf phenology. Poster abstract in: BASIS annual meeting 2009, 2 – 3 April 2009, Bruges, Belgium
Adriaenssens S, Staelens J, Verheyen K, Boeckx P, Samson R (2009) Bepaling van de bovengrondse stikstofopname door bladeren: effect van boomsoort, stikstoflast en bladfenologie. Poster abstract in: Starters voor Bosonderzoek 2009, 19 March 2009, Brussels, Belgium
Scientific reports
Verheyen K, De Schrijver A, Staelens J, Baeten L, De Frenne P, Adriaenssens S, Verstraeten G, Ampoorter E, Van Nevel L, Demey A, Wuyts K, Gruwez G (2010) Pilootstudie naar kwantificering van de relaties tussen de achteruitgang van biodiversiteit en chronische overschrijding van kritische lasten. Studie in opdracht van het Instituut voor Natuur- en Bosonderzoek (Natuurrapportering), 76 p
Adriaenssens S, Baeten L, Crabbe S, Verheyen K (2006) Evolutie (1985-2006) en toekomst van de jeneverbes (Juniperus communis L.) in de provincie Limburg, Universiteit Gent & Likona, 83 p
MSc thesis
Adriaenssens S (2006) Vergelijkend onderzoek naar de productie en kiemkracht van jeneverbeszaden in Vlaanderen en omliggende regio’s. MSc thesis, Universiteit Gent, 134 p
Scientific activities
Participation in congresses, symposia or workshops
Participation with oral presentation
17 March 2011. Opname van stikstof uit regenwater door boomkronen in relatie tot doorvalmetingen. Starters voor Bosonderzoek 2011, Brussels, Belgium
15 – 16 April 2010. Canopy uptake of dissolved 15N: a validation of the canopy budget model. BASIS annual meeting 2010, Arnhem, the Netherlands. Winner of the Young Scientist Award
22 – 26 March 2010. Spatial and temporal variability of throughfall water and dry deposition along a vertical gradient in a beech canopy. 24th IUFRO conference for specialists in air pollution and climate change effects on forest ecosystems “Adaption of forest ecosystems to air pollution and climate change”, Antalya, Turkey
208

Curriculum vitae
209
Participation with poster presentation
21 – 22 January 2010. Seasonal canopy uptake of dry deposited 15N-NH3 under different N loads and the interaction with leaf physical properties. CLIMAQS workshop “Local air quality and it’s interactions with vegetation”, CCC Elzenveld, Antwerp, Belgium
5 – 8 October 2009. Seasonal canopy uptake of dry deposited 15N-NH3 under different N loads and the interaction with leaf physical properties. International conference of “Atmospheric transport and chemistry in forest ecosystems”, Castle of Thurnau, Germany
29 June – 3 July 2009. Quantifying aboveground nitrogen uptake from wet deposition: impact of tree species, N load and leaf phenology. 6th International Symposium on Ecosystem Behaviour: Biogeomon Conference 2009, Helsinki, Finland
2 – 3 April 2009. Quantifying aboveground N uptake from wet deposition: impact of tree species, N load and leaf phenology. BASIS annual meeting 2009, Bruges, Belgium
19 March 2009. Bepaling van de bovengrondse stikstofopname door bladeren: effect van boomsoort, stikstoflast en bladfenologie. Starters voor Bosonderzoek 2009, Brussels, Belgium
Supervision of M.Sc.thesis students 2009-2009 Van Wittenberghe Shari. Karakterisatie van anatomische en fysiologische
bladeigenschappen bij loof- en naaldboomsoorten en langsheen een verticale gradiënt bij beuk. Supervisors: Prof. dr. ir. Kris Verheyen and Prof. dr. ir. Roeland Samson
Participation in scientific projects
2006 Evolutie (1985-2006) en toekomst van de jeneverbes (Juniperus communis L.) in de provincie Limburg
2010 Pilootstudie naar kwantificering van de relaties tussen de achteruitgang van biodiversiteit en chronische overschrijding van kritische lasten
Review tasks for international journals
2011: Science of the Total Environment (1), Hydrological Processes (1), African Journal of Biotechnology (1)