Analytical Modeling of the Mechanics of Re-Torque
9
1 Copyright © 2011 by ASME Proceedings of the ASME 2011 Pressure Vessel and Piping Conference PVP2011 July 17-21, 2011, Baltimore, MD, USA PVP2011-57 ANALYTICAL MODELING OF THE MECHANICS OF RE-TORQUE Ali P. Gordon 1 and James Williams Department of Mechanical, Materials & Aerospace Engineering, University of Central Florida Orlando, FL, USA Maricela De Santiago Weapon Systems Integration Lockheed Martin Aeronautics Company Marietta, GA, USA 1 Corresponding Author: Prof. Ali P. Gordon (Email: [email protected] | +1-407-823-4986) ABSTRACT A secondary torque, i.e., re-torque, is generally applied in order to confer long term bolt tightness of certain gasketed- flange configurations that have undergone a primary torque with some relaxation. In some sense, the initial torque conditions the viscoelastic gasket material for long term performance under service loading. While prior research has been carried out to analytically model the mechanical response of gasket materials under either creep, stress relaxation, or creep relaxation, the mechanics of gasket re-torque has received much less attention. In the current study, a candidate fiber-glass reinforced gasket material is subjected to creep relaxation after a series of primary and secondary torques. Test variables considered here include values of either torque, dwell period, or gasket thickness. The over-arching goal addressed in this study is the identification of the conditions that confer the minimal initial dwell period without loss of long term load retention. In all cases, specimen-sized samples were used on a raised-face, serrated flange assembly. Based on the experimental test data and observations from scanning electron microscopy, an viscoelasticity model is developed to analytically predict the response of the time-dependent solid. 1. INTRODUCTION Gaskets are applied as a low cost solution to fill the gaps between mating surfaces involved in threaded connections. Gasket materials, therefore, must display ability to not only undergo time-dependent relaxation for conformability, but also load retention attributes to prevent leaks over the long term. Such gasket materials are commonly reinforced for improved compressive strength, improved abrasion resistance, lower thermal expansion, increased chemical resistance, and higher thermal conductivity compared to pure materials. Polytetrafluorethylene (PTFE), equivalently referred to as Teflon ®, filled with particles of glass, graphite, barium sulfate, carbon, bronze, molybdenum disulphide, or other hard materials is considered as the gasketing material of choice for shuttle transport system (STS) applications involving cryogenic fluids. Standard reinforcement volume fraction is typically 25%, but 15% and 20% are also common. Accurately modeling the behavior of viscoelastic materials is a key element in predicting gasket material performance. A variety of rheological models have been developed to predict the responses of linear viscoelastic materials. Four common models used to correlate the response of this class of solids are: Maxwell, Voigt (also referred to as Kelvin), Linear, and Burger. The Burger-type response of a material has been written as [1]: 2 1 1 2 2 1 exp Et t E E (1) Here E 1 (or K 1 ) and E 2 (or K 2 ) are the elastic moduli and 1 (or C 1 ) and 2 (or C 2 ) refer to viscosities of the material. The physical interpretation of the components on the stress-strain model are analogous to those shown in the force-deflection model, as shown in Fig. 1. Upon initial loading, the first term in the relation corresponds to the time-independent (elastic) portion and the latter terms correspond to steady state and transient creep, respectively. The Maxwell model is a special case of the Burger model with terms having the subscript 2 in Eq. (2) eliminated. The Voigt model is a special case of Eq. (2) with terms having subscript 1 eliminated. It is said to account for retarded elasticity. The linear model has the 1 (or C 1 ) term eliminated. It is clear that the Maxwell and Voigt models can be connected in series to obtain the Burger model. Constitutive modeling constants are generally identified for these materials using constant stress (i.e., creep) and/or constant strain (i.e., stress relaxation) experiments. In application, however, a transient stress-strain condition Proceedings of the ASME 2011 Pressure Vessels & Piping Division Conference PVP2011 July 17-21, 2011, Baltimore, Maryland, USA PVP2011-57718 Downloaded From: http://proceedings.asmedigitalcollection.asme.org/ on 08/05/2015 Terms of Use: http://www.asme.org/about-asme/terms-of-use
Transcript of Analytical Modeling of the Mechanics of Re-Torque
1 Copyright © 2011 by ASME
Proceedings of the ASME 2011 Pressure Vessel and Piping Conference PVP2011
July 17-21, 2011, Baltimore, MD, USA
PVP2011-57
ANALYTICAL MODELING OF THE MECHANICS OF RE-TORQUE
Ali P. Gordon1 and James Williams Department of Mechanical, Materials & Aerospace
Engineering, University of Central Florida Orlando, FL, USA
Maricela De Santiago Weapon Systems Integration
Lockheed Martin Aeronautics Company Marietta, GA, USA
1 Corresponding Author: Prof. Ali P. Gordon (Email: [email protected] | +1-407-823-4986)
ABSTRACT A secondary torque, i.e., re-torque, is generally applied in
order to confer long term bolt tightness of certain gasketed-flange configurations that have undergone a primary torque with some relaxation. In some sense, the initial torque conditions the viscoelastic gasket material for long term performance under service loading. While prior research has been carried out to analytically model the mechanical response of gasket materials under either creep, stress relaxation, or creep relaxation, the mechanics of gasket re-torque has received much less attention. In the current study, a candidate fiber-glass reinforced gasket material is subjected to creep relaxation after a series of primary and secondary torques. Test variables considered here include values of either torque, dwell period, or gasket thickness. The over-arching goal addressed in this study is the identification of the conditions that confer the minimal initial dwell period without loss of long term load retention. In all cases, specimen-sized samples were used on a raised-face, serrated flange assembly. Based on the experimental test data and observations from scanning electron microscopy, an viscoelasticity model is developed to analytically predict the response of the time-dependent solid.
1. INTRODUCTION
Gaskets are applied as a low cost solution to fill the gaps between mating surfaces involved in threaded connections. Gasket materials, therefore, must display ability to not only undergo time-dependent relaxation for conformability, but also load retention attributes to prevent leaks over the long term. Such gasket materials are commonly reinforced for improved compressive strength, improved abrasion resistance, lower thermal expansion, increased chemical resistance, and higher thermal conductivity compared to pure materials. Polytetrafluorethylene (PTFE), equivalently referred to as
Teflon ®, filled with particles of glass, graphite, barium sulfate, carbon, bronze, molybdenum disulphide, or other hard materials is considered as the gasketing material of choice for shuttle transport system (STS) applications involving cryogenic fluids. Standard reinforcement volume fraction is typically 25%, but 15% and 20% are also common.
Accurately modeling the behavior of viscoelastic materials is a key element in predicting gasket material performance. A variety of rheological models have been developed to predict the responses of linear viscoelastic materials. Four common models used to correlate the response of this class of solids are: Maxwell, Voigt (also referred to as Kelvin), Linear, and Burger. The Burger-type response of a material has been written as [1]:
2
1 1 2 2
1 expE tt
E E
(1)
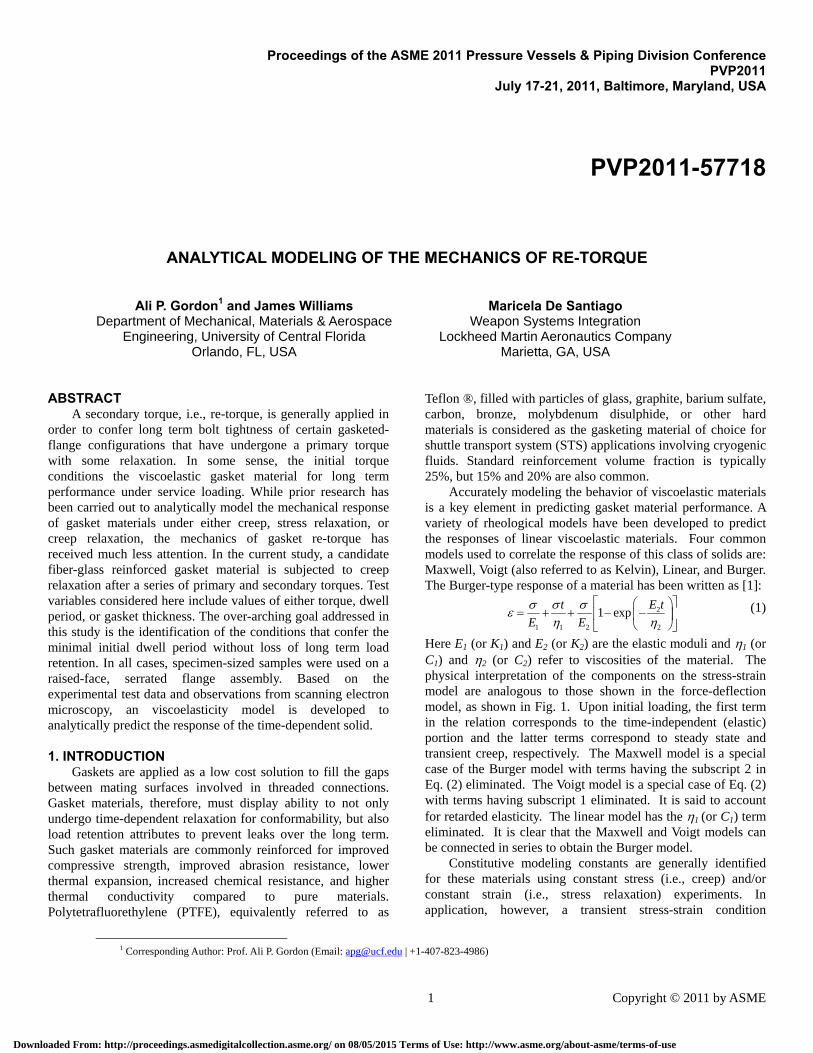
Here E1 (or K1) and E2 (or K2) are the elastic moduli and 1 (or C1) and 2 (or C2) refer to viscosities of the material. The physical interpretation of the components on the stress-strain model are analogous to those shown in the force-deflection model, as shown in Fig. 1. Upon initial loading, the first term in the relation corresponds to the time-independent (elastic) portion and the latter terms correspond to steady state and transient creep, respectively. The Maxwell model is a special case of the Burger model with terms having the subscript 2 in Eq. (2) eliminated. The Voigt model is a special case of Eq. (2) with terms having subscript 1 eliminated. It is said to account for retarded elasticity. The linear model has the 1 (or C1) term eliminated. It is clear that the Maxwell and Voigt models can be connected in series to obtain the Burger model.
Constitutive modeling constants are generally identified for these materials using constant stress (i.e., creep) and/or constant strain (i.e., stress relaxation) experiments. In application, however, a transient stress-strain condition
Proceedings of the ASME 2011 Pressure Vessels & Piping Division Conference PVP2011
July 17-21, 2011, Baltimore, Maryland, USA
PVP2011-57718
Downloaded From: http://proceedings.asmedigitalcollection.asme.org/ on 08/05/2015 Terms of Use: http://www.asme.org/about-asme/terms-of-use
2 Copyright © 2011 by ASME
develops in which the compressive strain increases concurrently with decay in stress. In the load-deflection analogy of the gasketed flange connection, the viscoelastic compressive deflection of the gasket allows the elastically loaded bolt to relax from a primary torquing. Constitutive modeling provides a means to simulating gasket creep relaxation response for this initial step load. This paper focuses on extending these models for applicability to subsequent torques.
2. MODELING GASKET RELAXATION Load evolution is expressed as a function of stiffness and
deflection, i.e.,
eff total eff B GF t K t t K t t t . (2)
For a bolted member, the effective stiffness, Keff, is established with the spring stiffness of the gasket component and the bolt acting in parallel, e.g.
B Geff
B G
K K tK t
K K t
, (3)
where the bolt stiffness, interchangeably referred to as stud stiffness, modified from Kobayahsi and coworkers [2] can be employed, e.g.
2
4B
Btotal
d EK
L
. (4)
Here EB is the elastic modulus of the bolt, and Ltotal is the grip length. The stiffness of the gasket is, therefore, the most
complex of the stiffness parameters since (1) the material undergoes viscoelastic relaxation, (2) the material has strong temperature-dependence, and (3) gasket thickness and cross-sectional area have non-linear effects on performance. A Burger-type model for KG is needed to capture the time-dependence once the compressive force is applied and relaxation occurs. The equivalent gasket stiffness at any time t after compressing the gasket has been given by Alkelani and co-authors [3]:
1
1 2 2
1 2 1 2 2 ,
1expG
G total
F tK K K ttK t
K K C K C t
. (5)
Time-dependence of the system, therefore, is wholly captured in the gasket material. Constants presented in this model refer to elastic response (K1, K2) and viscous response (C1, C2) for a specific gasket. They vary with gasket thickness and temperature, and they can be determined experimentally.
The initial response of the gasket, with t equal to 0, is solely determined by the elastic constant, K1. At very long times, KG reduces to zero. The remaining properties, K2, C1, and C2 determine the behavior in between.
The framework overviewed in Eqs. (2) through (5), has been applied in the modeling of gasket materials subject to a primary torque, but not a secondary one. 3. EXPERIMENTAL APPROACH
The Gaseous Hydrogen (GH2) Vent interface Quick Disconnect (QD) associated with the Ground Umbilical Carrier Plate (GUCP) includes a gasketed ASME-type flange assembly that transfers pressurized, cryogenic hydrogen from the Shuttle Transport System (STS). Although the threaded stud material is nominally elastic under service conditions, the gasket material undergoes strain hardening deformation.
The candidate gasket for the current investigation is a fluorocarbon-based material reinforced with fiberglass (Fig. 2)
K C2
C1
K1
F
Figure 1: Burger-type viscoelastic rheological model for force versus deflection.
Figure 2: Microstructure of PTFE-based gasket with 25% fiberglass prior to application of mechanical loading.
Downloaded From: http://proceedings.asmedigitalcollection.asme.org/ on 08/05/2015 Terms of Use: http://www.asme.org/about-asme/terms-of-use
3 Copyright © 2011 by ASME
originally developed in the 1960’s. The reinforcement particles take the form of short, white glass fibers having volume fraction of approximately 25%. Particles are approximately 20 micron in diameter, but vary in length. It is considered as the material of choice for NASA's liquid oxygen and liquid nitrogen applications. Its desirability as a gasket material is derived from its high capacity for low deformation at high
stress and due to its non-reactivity in very caustic environments and at cryogenic temperatures.
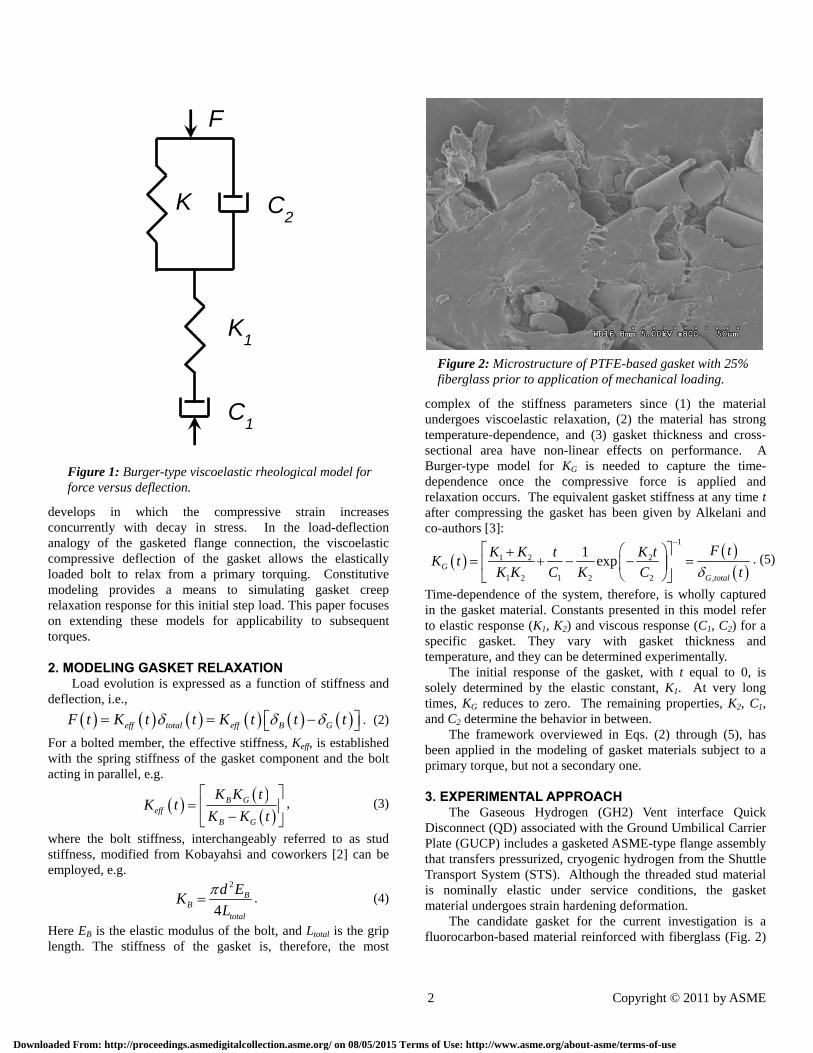
A single-bolt test stand has been developed to characterize the viscoelastic material under the condition of creep relaxation. Similar to that designated in the ASTM standard [4], the current system consists of a single stud, nuts, members, washers, and gasket designed to match the materials and thickness used in components of the GUCP flange. The device is mounted on an optical grade, vibration isolation table, as shown in Fig. 3. A load cell measures decay of the compressive load.
A variety of experiments is carried out to characterize the response of the material. The tests are collected in phases, termed Phase 1 through 6, as listed in Table 1. While Phases 1, 2, and 3 were designed to generate a broad collection of results for constitutive modeling, the latter phases were expected to identify threshold behavior of the material. In all cases, specimens were subjected to a primary and secondary torque. A digital torque wrench (CompuTorque Model No. II) was used to ensure that a torque close to the desired value was applied to the joint.
4. INITIAL RESPONSE The glass-filled PTFE material displays mechanical
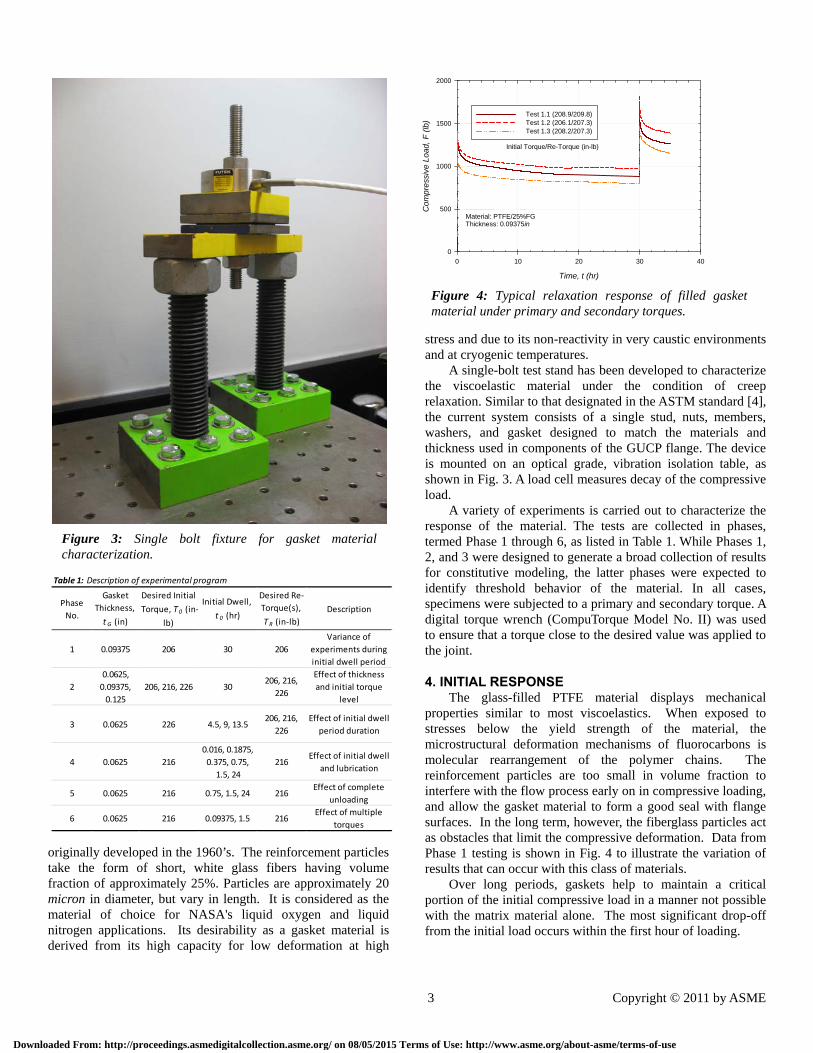
properties similar to most viscoelastics. When exposed to stresses below the yield strength of the material, the microstructural deformation mechanisms of fluorocarbons is molecular rearrangement of the polymer chains. The reinforcement particles are too small in volume fraction to interfere with the flow process early on in compressive loading, and allow the gasket material to form a good seal with flange surfaces. In the long term, however, the fiberglass particles act as obstacles that limit the compressive deformation. Data from Phase 1 testing is shown in Fig. 4 to illustrate the variation of results that can occur with this class of materials.
Over long periods, gaskets help to maintain a critical portion of the initial compressive load in a manner not possible with the matrix material alone. The most significant drop-off from the initial load occurs within the first hour of loading.
Figure 3: Single bolt fixture for gasket material characterization.
Table 1: Description of experimental program
Phase
No.
Gasket
Thickness,
t G (in)
Desired Initial
Torque, T0 (in‐
lb)
Initial Dwell,
t 0 (hr)
Desired Re‐
Torque(s),
TR (in‐lb)
Description
1 0.09375 206 30 206
Variance of
experiments during
initial dwell period
2
0.0625,
0.09375,
0.125
206, 216, 226 30206, 216,
226
Effect of thickness
and initial torque
level
3 0.0625 226 4.5, 9, 13.5206, 216,
226
Effect of initial dwell
period duration
4 0.0625 216
0.016, 0.1875,
0.375, 0.75,
1.5, 24
216Effect of initial dwell
and lubrication
5 0.0625 216 0.75, 1.5, 24 216Effect of complete
unloading
6 0.0625 216 0.09375, 1.5 216Effect of multiple
torques
Figure 4: Typical relaxation response of filled gasket material under primary and secondary torques.
Time, t (hr)
0 10 20 30 40
Com
pres
sive
Loa
d, F
(lb
)
0
500
1000
1500
2000
Test 1.1 (208.9/209.8)Test 1.2 (206.1/207.3)Test 1.3 (208.2/207.3)
Material: PTFE/25%FGThickness: 0.09375in
Initial Torque/Re-Torque (in-lb)
Downloaded From: http://proceedings.asmedigitalcollection.asme.org/ on 08/05/2015 Terms of Use: http://www.asme.org/about-asme/terms-of-use
4 Copyright © 2011 by ASME
t=0hr
1840
1920
1920
1880
1840
1760
1720
1680
1640
1560
1880
1520
1840
1480
1440
1840
1800
1600
Initial Gasket Thickness, tG (in)
0.0625 0.0781 0.0938 0.1094 0.1250
Initi
al T
orqu
e, T
0 (in
-lb)
206
211
216
221
226
t=0.0117hr
1560
1680
1640
1560
1520
1480
1440
1640
1360
13201280
1600
1600
1400
1600
Initial Gasket Thickness, tG (in)
0.0625 0.0781 0.0938 0.1094 0.1250
Initi
al T
orqu
e, T
0 (
in-lb
)
206
211
216
221
226
t=0hr (Post)
1920
1960
1960
1920
1880
1840
1760
1720
1680
1640
1960
1560
1920
1520
19201960
2000
2000
1800
1600
Initial Gasket Thickness, tG (in)
0.0625 0.0781 0.0938 0.1094 0.1250
Initi
al T
orqu
e, T
0 (in
-lb)
206
211
216
221
226
t=3hr (Post)
1560
1640
1640
1560
1520
1480
1440
1360
1320
1280
1240
1560
1240
1600
1600
1400
1600
1200
Initial Gasket Thickness, tG (in)
0.0625 0.0781 0.0938 0.1094 0.1250
Initi
al T
orqu
e, T
0 (
in-lb
)
206
211
216
221
226
t=24hr
960
1040
960
920
880
840840
1000
1000
1000
Initial Gasket Thickness, tG (in)
0.0625 0.0781 0.0938 0.1094 0.1250
Initi
al T
orqu
e, T
0 (
in-lb
)
206
211
216
221
226
t=3hr
1120
1160
1160
1120
1080
1040
960
920
1000
Initial Gasket Thickness, tG (in)
0.0625 0.0781 0.0938 0.1094 0.1250
Initi
al T
orqu
e, T
0 (in
-lb)
206
211
216
221
226
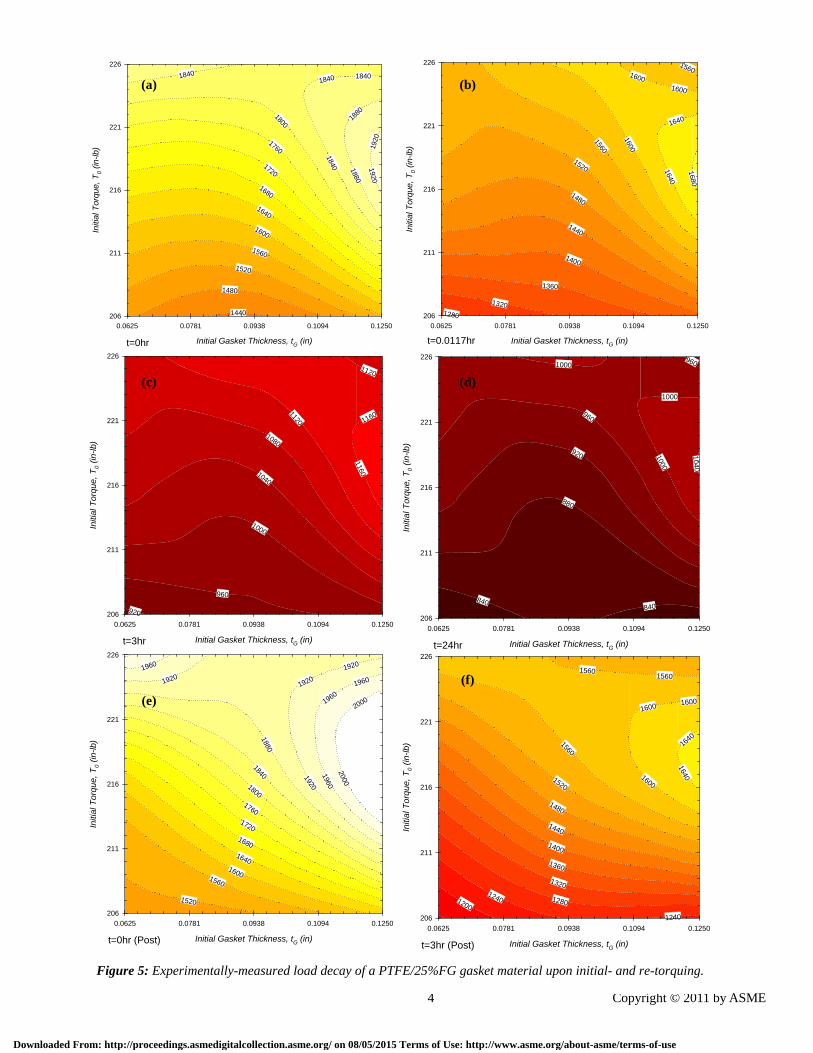
Figure 5: Experimentally-measured load decay of a PTFE/25%FG gasket material upon initial- and re-torquing.
(a) (b)
(c) (d)
(e)
(f)
Downloaded From: http://proceedings.asmedigitalcollection.asme.org/ on 08/05/2015 Terms of Use: http://www.asme.org/about-asme/terms-of-use
5 Copyright © 2011 by ASME
There is an average of 38% drop-off in load during the first 4.5 hr. For the second 4.5 hr, however, the load decay is 2%. The majority of the load decay, in actuality, occurs during the first few minutes. A secondary torque will help to recapture a fraction of the lost load. As shown in Fig. 4, the load response 4.5 hr after a secondary torque is approximately 25% greater than the relaxed load 4.5 hr after the initial torque.
Phase 2 tests (Fig. 5) were designed to determine the effect of initial torque and gasket thickness on initial load decay response. Using the nine combinations of gasket thickness and initial torque levels shown, a quadratic fit predicts the load decay response for intermediate combinations. Each graph in Fig. 5 represents the experimentally-obtained and interpolated load decay response at a given increment of time (1) at or beyond intial tightening (Fig. 5a through 5d) or (2) at or beyond re-torque (5e and 5f).
Based on literature, the main factors affecting relaxation and recovery of gasket materials are as follows [5]: temperature, gasket thickness, and load. Service considerations such as cyclic torquing, bolt stiffness, flange detail and geometry can make the strong load-dependence of gasket relaxation more challenging to carry over to constitutive modeling. Other factors that affect gasket behavior are: bending loads on the flange, gasket width, flange friction, temperature cycling, and uniformity of load in a multi-bolt system.
For the current test setup, equally-spaced gasket thicknesses and equally-spaced initial torques were applied (Table 1) under constant temperature conditions. Results from this second phase of testing confirm that regardless of these variables after a period of a few hours, nearly 40% of the initial load is lost. This trend is consistent with that found by Waterland and Frew [6] who relaxation responses of particle reinforced materials. Comparatively, gasket thickness and initial torque have much weaker influences.
Features that make Eqs. (2) through (5) an attractive model for gasket relaxation are as follows: (1) the formulation is expressed in “load-deflection” space and not “stress-strain” space, (2) the mechanical modeling constants from the framework are mechanics-based and easily determined from experiments, and (3) the linear form of the model allows various modes of superposition to be taken into accounted.
Neither strain nor deflection is physically measured on the testbed employed in the current study. The formulation in its native configuration, however, includes an initial deflection difference. This factor can be re-expressed as an initial condition of the applied load, i.e.,
00 0 0
0B G
B GB G
K KF
K K
(6)
The term KG, when evaluated at the initial time (t = 0), can be shown to be equivalent to K1. The initial load can be expressed in terms of the initial torque:
00N
TF
C d , (7)
where CN is the nut factor and d is the nominal diameter of the stud. The initial torque, T0, is that which is applied to the assembly after the tightening procedure is completed (i.e., 206, 216, or 226 in-lb in the current study). Substituting Eqs. (3), (6), and (7) into Eq. (2) results in an expression for the load history of a linear viscoelastic solid under creep relaxation conditions, e.g.
0 0
0B G B G
RN B G B G
T K K K K tF t
C dK K K K t
. (8)
This expression makes no assumption of the displacements of the system nor its components (i.e., bolt or gasket). Displacement behavior of the individual elements can be determined through analysis of their respective stiffness elements KB and KG, respectively. In Eq. (8), it is also clear that
not only does RF t decay with time, but it is also completely
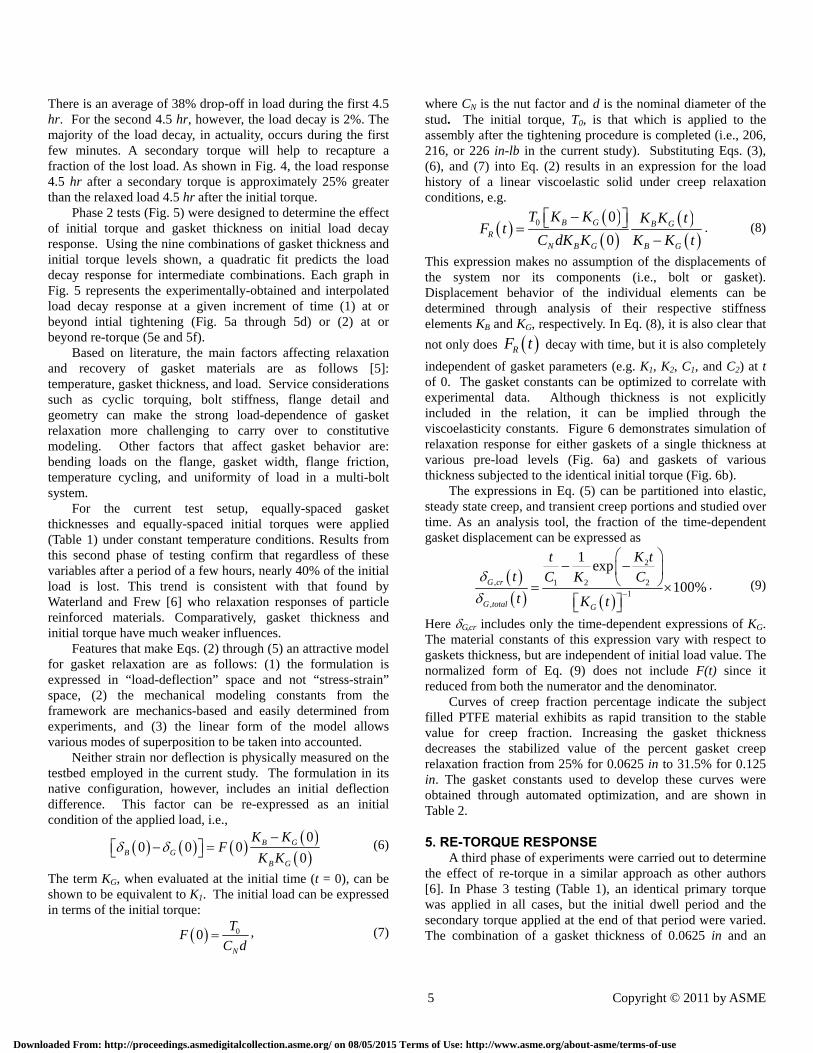
independent of gasket parameters (e.g. K1, K2, C1, and C2) at t of 0. The gasket constants can be optimized to correlate with experimental data. Although thickness is not explicitly included in the relation, it can be implied through the viscoelasticity constants. Figure 6 demonstrates simulation of relaxation response for either gaskets of a single thickness at various pre-load levels (Fig. 6a) and gaskets of various thickness subjected to the identical initial torque (Fig. 6b).
The expressions in Eq. (5) can be partitioned into elastic, steady state creep, and transient creep portions and studied over time. As an analysis tool, the fraction of the time-dependent gasket displacement can be expressed as
2
, 1 2 21
,
1exp
100%G cr
G total G
K ttt C K C
t K t
. (9)
Here G,cr includes only the time-dependent expressions of KG. The material constants of this expression vary with respect to gaskets thickness, but are independent of initial load value. The normalized form of Eq. (9) does not include F(t) since it reduced from both the numerator and the denominator.
Curves of creep fraction percentage indicate the subject filled PTFE material exhibits as rapid transition to the stable value for creep fraction. Increasing the gasket thickness decreases the stabilized value of the percent gasket creep relaxation fraction from 25% for 0.0625 in to 31.5% for 0.125 in. The gasket constants used to develop these curves were obtained through automated optimization, and are shown in Table 2.
5. RE-TORQUE RESPONSE A third phase of experiments were carried out to determine
the effect of re-torque in a similar approach as other authors [6]. In Phase 3 testing (Table 1), an identical primary torque was applied in all cases, but the initial dwell period and the secondary torque applied at the end of that period were varied. The combination of a gasket thickness of 0.0625 in and an
Downloaded From: http://proceedings.asmedigitalcollection.asme.org/ on 08/05/2015 Terms of Use: http://www.asme.org/about-asme/terms-of-use
6 Copyright © 2011 by ASME
initial torque level of 226 in-lb were selected as the optimal paring due to the load retention compared to other cases (Fig. 5a through d).
The main goal of subjecting a gasketed flange to re-torque is to not only recapture a portion of the load lost during initial relaxation, but also to maximize the stabilized load after the torquing process is complete. Bolt tightness during the initial dwell period has been lost due to accumulation of creep deformation within the gasket material. Retightening bolts allows for additional creep deformation to occur, but it eliminates a portion of the elastic deformation of the gasket. Figure 7 shows the response of the glass fiber filled PTFE material after a secondary (e.g. final) torque. Similar to the data shown in Fig. 5, each graph in Fig. 7 contains 9 combinations of experimentally-obtained data at levels of torque level and initial dwell period. Data support the observation that initial dwell period does not greatly impact the long term performance of the gasket
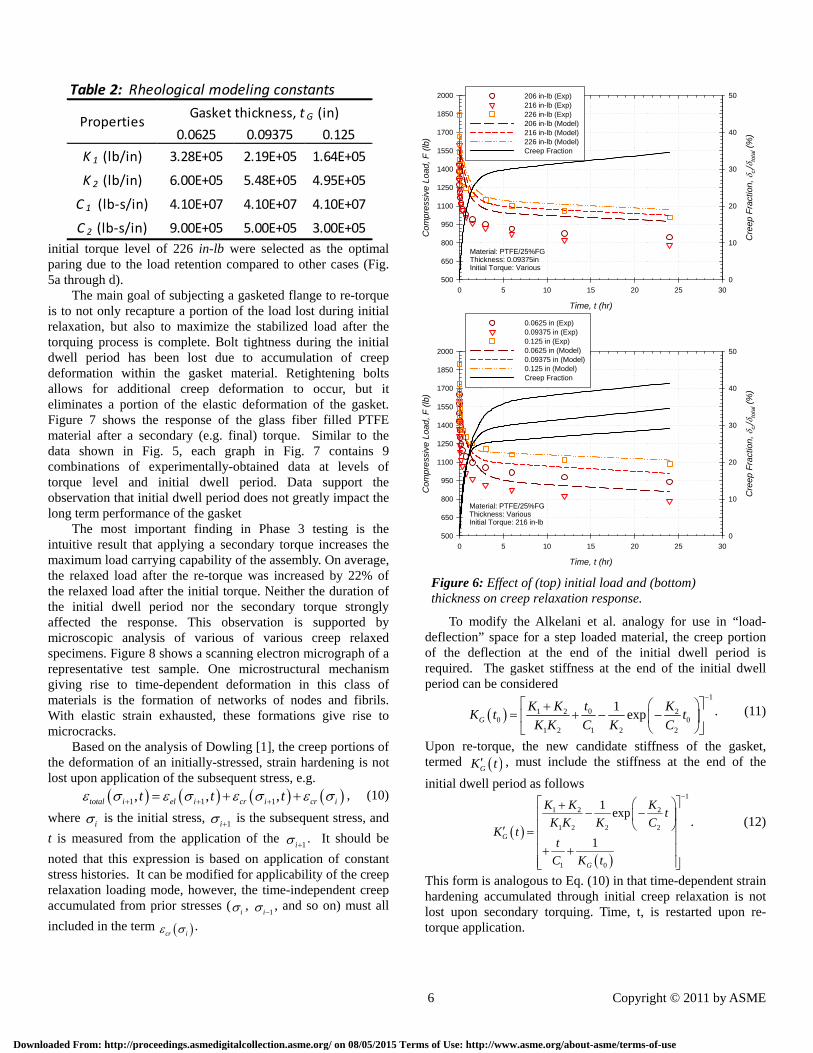
The most important finding in Phase 3 testing is the intuitive result that applying a secondary torque increases the maximum load carrying capability of the assembly. On average, the relaxed load after the re-torque was increased by 22% of the relaxed load after the initial torque. Neither the duration of the initial dwell period nor the secondary torque strongly affected the response. This observation is supported by microscopic analysis of various of various creep relaxed specimens. Figure 8 shows a scanning electron micrograph of a representative test sample. One microstructural mechanism giving rise to time-dependent deformation in this class of materials is the formation of networks of nodes and fibrils. With elastic strain exhausted, these formations give rise to microcracks.
Based on the analysis of Dowling [1], the creep portions of the deformation of an initially-stressed, strain hardening is not lost upon application of the subsequent stress, e.g.
1 1 1, , ,total i el i cr i cr it t t , (10)
where i is the initial stress,
1i is the subsequent stress, and
t is measured from the application of the 1i . It should be
noted that this expression is based on application of constant stress histories. It can be modified for applicability of the creep relaxation loading mode, however, the time-independent creep accumulated from prior stresses (
i , 1i , and so on) must all
included in the term cr i .
To modify the Alkelani et al. analogy for use in “load-deflection” space for a step loaded material, the creep portion of the deflection at the end of the initial dwell period is required. The gasket stiffness at the end of the initial dwell period can be considered
1
01 2 20 0
1 2 1 2 2
1expG
tK K KK t t
K K C K C
. (11)
Upon re-torque, the new candidate stiffness of the gasket, termed GK t , must include the stiffness at the end of the
initial dwell period as follows
1
1 2 2
1 2 2 2
1 0
1exp
1G
G
K K Kt
K K K CK t
t
C K t
. (12)
This form is analogous to Eq. (10) in that time-dependent strain hardening accumulated through initial creep relaxation is not lost upon secondary torquing. Time, t, is restarted upon re-torque application.
Figure 6: Effect of (top) initial load and (bottom) thickness on creep relaxation response.
Time, t (hr)
0 5 10 15 20 25 30
Com
pre
ssiv
e L
oad,
F (
lb)
500
650
800
950
1100
1250
1400
1550
1700
1850
2000
Cre
ep F
ract
ion,
cr
/to
tal (
%)
0
10
20
30
40
50206 in-lb (Exp)216 in-lb (Exp)226 in-lb (Exp)206 in-lb (Model)216 in-lb (Model)226 in-lb (Model)Creep Fraction
Material: PTFE/25%FGThickness: 0.09375inInitial Torque: Various
Time, t (hr)
0 5 10 15 20 25 30
Com
pre
ssiv
e Lo
ad,
F (
lb)
500
650
800
950
1100
1250
1400
1550
1700
1850
2000
Cre
ep F
ract
ion
, c
r/to
tal (
%)
0
10
20
30
40
50
0.0625 in (Exp)0.09375 in (Exp)0.125 in (Exp)0.0625 in (Model)0.09375 in (Model)0.125 in (Model)Creep Fraction
Material: PTFE/25%FGThickness: VariousInitial Torque: 216 in-lb
Table 2: Rheological modeling constants
0.0625 0.09375 0.125
K 1 (lb/in) 3.28E+05 2.19E+05 1.64E+05
K 2 (lb/in) 6.00E+05 5.48E+05 4.95E+05
C 1 (lb‐s/in) 4.10E+07 4.10E+07 4.10E+07
C 2 (lb‐s/in) 9.00E+05 5.00E+05 3.00E+05
PropertiesGasket thickness, t G (in)
Downloaded From: http://proceedings.asmedigitalcollection.asme.org/ on 08/05/2015 Terms of Use: http://www.asme.org/about-asme/terms-of-use

7 Copyright © 2011 by ASME
t=0hr (Post)
19601920
1880
1840
1760
1720
1680
1880
2000
1800
Initial Dwell Period, t0 (hr)
4.5 6.8 9.0 11.3 13.5
Re-
Tor
que,
TR (
in-lb
)
206
211
216
221
226
t=0.0058hr (Post)
1880
1840
1760
1720
1680
1640
1800
1600
1800
1800
Initial Dwell Period, t0 (hr)
4.5 6.8 9.0 11.3 13.5
Re-
Tor
que,
TR (
in-lb
)
206
211
216
221
226
t=0.047hr (Post)
1760
1720
1680
1640
1560
1720
1600
Initial Dwell Period, t0 (hr)
4.5 6.8 9.0 11.3 13.5
Re-
Tor
que,
TR (
in-lb
)
206
211
216
221
226
t=12.0hr (Post)
1440
1440
1360
1320
1320
1360
1400
1400
1400
Initial Dwell Period, t0 (hr)
4.5 6.8 9.0 11.3 13.5
Re-
Tor
que,
TR (
in-lb
)
206
211
216
221
226
t=1.5hr (Post)
15601520
1480
1560
1440
1360
1480
1520
1560
1400
Initial Dwell Period, t0 (hr)
4.5 6.8 9.0 11.3 13.5
Re-
Tor
que,
TR (
in-lb
)
206
211
216
221
226
t=0.188hr (Post)
1680
1640
1560
1520
1480
1640 1600
Initial Dwell Period, t0 (hr)
4.5 6.8 9.0 11.3 13.5
Re-
Tor
que,
TR (
in-lb
)
206
211
216
221
226
Figure 7: Experimentally-measured load decay of a PTFE/25%FG gasket material upon re-torquing. For each case tG = 0.0625in and T0 = 226 in-lb.
Final Dwell Period, t0 (hr) Final Dwell Period, t0 (hr)
Final Dwell Period, t0 (hr) Final Dwell Period, t0 (hr)
Final Dwell Period, t0 (hr) Final Dwell Period, t0 (hr)
Downloaded From: http://proceedings.asmedigitalcollection.asme.org/ on 08/05/2015 Terms of Use: http://www.asme.org/about-asme/terms-of-use
8 Copyright © 2011 by ASME
The mechanical properties of the gasket material, namely K1, K2, C1, and C2, do not change upon the application of subsequent loads. This candidate expression is used in the determination of the compressive load history, i.e.,
0 0
0R B G B G
RB G B G
F K K K K tF t
K K K K t
. (13)
The term 0RF is based on the re-torque that is applied to the
assembly, e.g.
0 RR
N
TF
C d . (14)
Both CN and d take on the identical values used earlier. Data from the current test program and from Waterland and Frew [6] support the observation that 0RF is independent of gasket
behavior. The candidate formulation of Eqs. (11) through (14) were
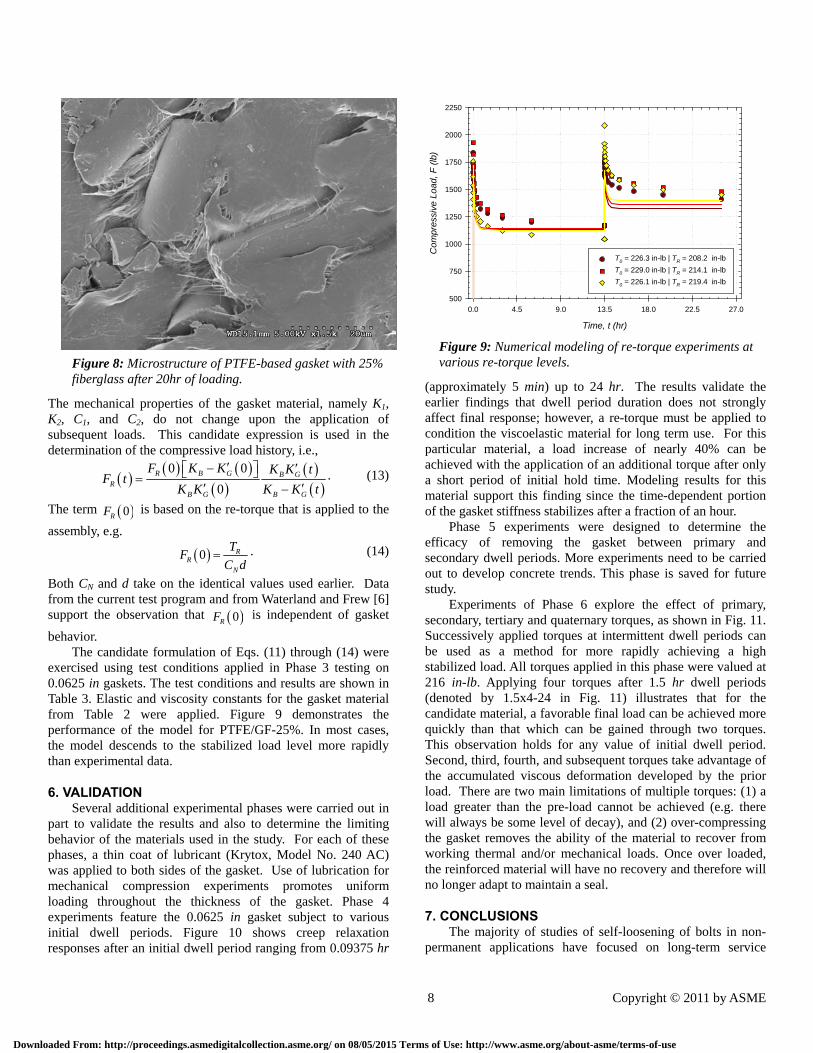
exercised using test conditions applied in Phase 3 testing on 0.0625 in gaskets. The test conditions and results are shown in Table 3. Elastic and viscosity constants for the gasket material from Table 2 were applied. Figure 9 demonstrates the performance of the model for PTFE/GF-25%. In most cases, the model descends to the stabilized load level more rapidly than experimental data.
6. VALIDATION Several additional experimental phases were carried out in
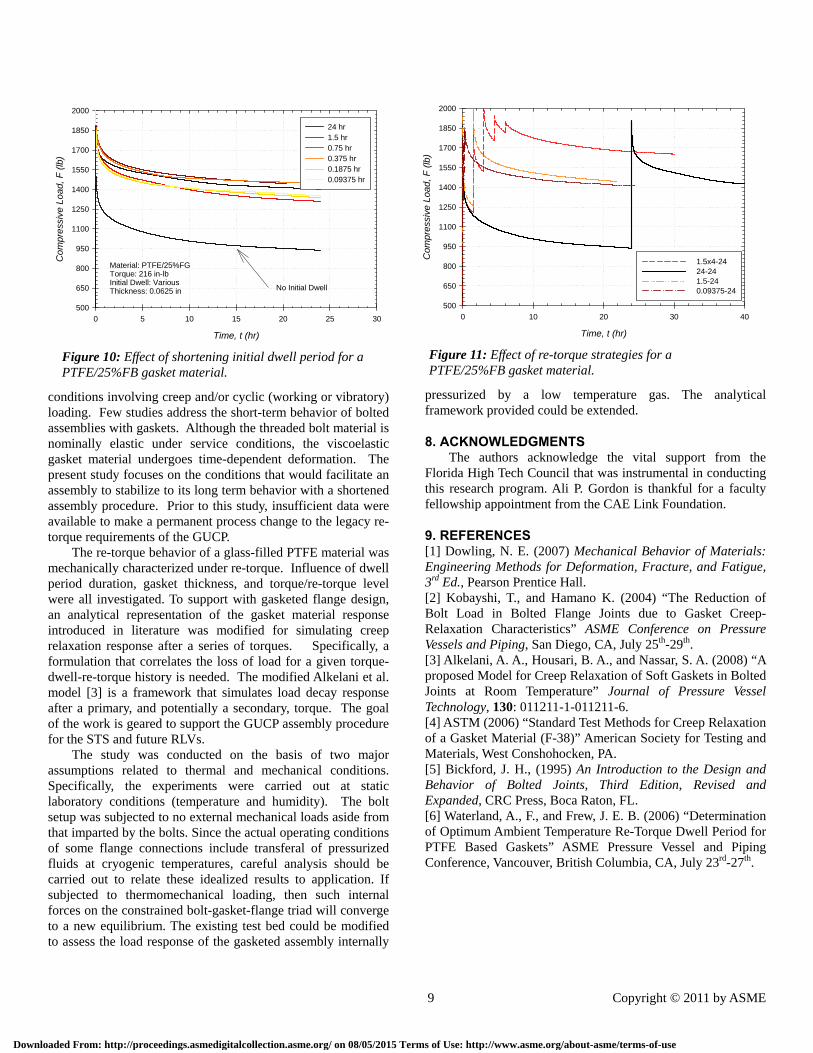
part to validate the results and also to determine the limiting behavior of the materials used in the study. For each of these phases, a thin coat of lubricant (Krytox, Model No. 240 AC) was applied to both sides of the gasket. Use of lubrication for mechanical compression experiments promotes uniform loading throughout the thickness of the gasket. Phase 4 experiments feature the 0.0625 in gasket subject to various initial dwell periods. Figure 10 shows creep relaxation responses after an initial dwell period ranging from 0.09375 hr
(approximately 5 min) up to 24 hr. The results validate the earlier findings that dwell period duration does not strongly affect final response; however, a re-torque must be applied to condition the viscoelastic material for long term use. For this particular material, a load increase of nearly 40% can be achieved with the application of an additional torque after only a short period of initial hold time. Modeling results for this material support this finding since the time-dependent portion of the gasket stiffness stabilizes after a fraction of an hour.
Phase 5 experiments were designed to determine the efficacy of removing the gasket between primary and secondary dwell periods. More experiments need to be carried out to develop concrete trends. This phase is saved for future study.
Experiments of Phase 6 explore the effect of primary, secondary, tertiary and quaternary torques, as shown in Fig. 11. Successively applied torques at intermittent dwell periods can be used as a method for more rapidly achieving a high stabilized load. All torques applied in this phase were valued at 216 in-lb. Applying four torques after 1.5 hr dwell periods (denoted by 1.5x4-24 in Fig. 11) illustrates that for the candidate material, a favorable final load can be achieved more quickly than that which can be gained through two torques. This observation holds for any value of initial dwell period. Second, third, fourth, and subsequent torques take advantage of the accumulated viscous deformation developed by the prior load. There are two main limitations of multiple torques: (1) a load greater than the pre-load cannot be achieved (e.g. there will always be some level of decay), and (2) over-compressing the gasket removes the ability of the material to recover from working thermal and/or mechanical loads. Once over loaded, the reinforced material will have no recovery and therefore will no longer adapt to maintain a seal.
7. CONCLUSIONS The majority of studies of self-loosening of bolts in non-
permanent applications have focused on long-term service
Figure 8: Microstructure of PTFE-based gasket with 25% fiberglass after 20hr of loading.
Time, t (hr)
0.0 4.5 9.0 13.5 18.0 22.5 27.0
Co
mpr
essi
ve L
oa
d, F
(lb
)
500
750
1000
1250
1500
1750
2000
2250
T0 = 226.3 in-lb | TR = 208.2 in-lb
T0 = 229.0 in-lb | TR = 214.1 in-lb
T0 = 226.1 in-lb | TR = 219.4 in-lb
Figure 9: Numerical modeling of re-torque experiments at various re-torque levels.
Downloaded From: http://proceedings.asmedigitalcollection.asme.org/ on 08/05/2015 Terms of Use: http://www.asme.org/about-asme/terms-of-use
9 Copyright © 2011 by ASME
conditions involving creep and/or cyclic (working or vibratory) loading. Few studies address the short-term behavior of bolted assemblies with gaskets. Although the threaded bolt material is nominally elastic under service conditions, the viscoelastic gasket material undergoes time-dependent deformation. The present study focuses on the conditions that would facilitate an assembly to stabilize to its long term behavior with a shortened assembly procedure. Prior to this study, insufficient data were available to make a permanent process change to the legacy re-torque requirements of the GUCP.
The re-torque behavior of a glass-filled PTFE material was mechanically characterized under re-torque. Influence of dwell period duration, gasket thickness, and torque/re-torque level were all investigated. To support with gasketed flange design, an analytical representation of the gasket material response introduced in literature was modified for simulating creep relaxation response after a series of torques. Specifically, a formulation that correlates the loss of load for a given torque-dwell-re-torque history is needed. The modified Alkelani et al. model [3] is a framework that simulates load decay response after a primary, and potentially a secondary, torque. The goal of the work is geared to support the GUCP assembly procedure for the STS and future RLVs.
The study was conducted on the basis of two major assumptions related to thermal and mechanical conditions. Specifically, the experiments were carried out at static laboratory conditions (temperature and humidity). The bolt setup was subjected to no external mechanical loads aside from that imparted by the bolts. Since the actual operating conditions of some flange connections include transferal of pressurized fluids at cryogenic temperatures, careful analysis should be carried out to relate these idealized results to application. If subjected to thermomechanical loading, then such internal forces on the constrained bolt-gasket-flange triad will converge to a new equilibrium. The existing test bed could be modified to assess the load response of the gasketed assembly internally
pressurized by a low temperature gas. The analytical framework provided could be extended.
8. ACKNOWLEDGMENTS The authors acknowledge the vital support from the
Florida High Tech Council that was instrumental in conducting this research program. Ali P. Gordon is thankful for a faculty fellowship appointment from the CAE Link Foundation.
9. REFERENCES [1] Dowling, N. E. (2007) Mechanical Behavior of Materials: Engineering Methods for Deformation, Fracture, and Fatigue, 3rd Ed., Pearson Prentice Hall. [2] Kobayshi, T., and Hamano K. (2004) “The Reduction of Bolt Load in Bolted Flange Joints due to Gasket Creep-Relaxation Characteristics” ASME Conference on Pressure Vessels and Piping, San Diego, CA, July 25th-29th. [3] Alkelani, A. A., Housari, B. A., and Nassar, S. A. (2008) “A proposed Model for Creep Relaxation of Soft Gaskets in Bolted Joints at Room Temperature” Journal of Pressure Vessel Technology, 130: 011211-1-011211-6. [4] ASTM (2006) “Standard Test Methods for Creep Relaxation of a Gasket Material (F-38)” American Society for Testing and Materials, West Conshohocken, PA. [5] Bickford, J. H., (1995) An Introduction to the Design and Behavior of Bolted Joints, Third Edition, Revised and Expanded, CRC Press, Boca Raton, FL. [6] Waterland, A., F., and Frew, J. E. B. (2006) “Determination of Optimum Ambient Temperature Re-Torque Dwell Period for PTFE Based Gaskets” ASME Pressure Vessel and Piping Conference, Vancouver, British Columbia, CA, July 23rd-27th.
Time, t (hr)
0 5 10 15 20 25 30
Co
mpr
ess
ive
Loa
d, F
(lb
)
500
650
800
950
1100
1250
1400
1550
1700
1850
2000
24 hr1.5 hr0.75 hr0.375 hr0.1875 hr0.09375 hr
Material: PTFE/25%FGTorque: 216 in-lbInitial Dwell: VariousThickness: 0.0625 in No Initial Dwell
Figure 10: Effect of shortening initial dwell period for a PTFE/25%FB gasket material.
Time, t (hr)
0 10 20 30 40
Com
pre
ssiv
e L
oad
, F
(lb
)
500
650
800
950
1100
1250
1400
1550
1700
1850
2000
1.5x4-2424-241.5-240.09375-24
Figure 11: Effect of re-torque strategies for a PTFE/25%FB gasket material.
Downloaded From: http://proceedings.asmedigitalcollection.asme.org/ on 08/05/2015 Terms of Use: http://www.asme.org/about-asme/terms-of-use