ANALYSIS OF SIX-YEAR OUTCOMES FALL 2008 COHORT …fnl)-6-18-15.pdfANALYSIS OF SIX-YEAR OUTCOMES:...
46
ANALYSIS OF SIX-YEAR OUTCOMES FALL 2008 COHORT TRANSFER RATES COLLEGE-WIDE AND BY REGION Wendy Lin Emilee Purcell May, 2015 IR# 15068
Transcript of ANALYSIS OF SIX-YEAR OUTCOMES FALL 2008 COHORT …fnl)-6-18-15.pdfANALYSIS OF SIX-YEAR OUTCOMES:...
ANALYSIS OF SIX-YEAR OUTCOMES FALL 2008 COHORT
TRANSFER RATES COLLEGE-WIDE
AND BY REGION
Wendy Lin Emilee Purcell
May, 2015
IR# 15068
Table of Contents
Contents Executive Summary ...................................................................................................................................... 3
Key Findings ............................................................................................................................................. 4Introduction ................................................................................................................................................... 5Methodology ................................................................................................................................................. 5Findings ........................................................................................................................................................ 6
Statewide Three- and Six-Year Transfer Rate Trends .............................................................................. 7National Community College Benchmark Project Data ........................................................................... 8Six Year Outcomes by Enrollment Intensity ............................................................................................ 9Six-year Outcomes by Ivy Tech Region ................................................................................................. 11Three- and Six-Year Outcomes by Ivy Tech Region .............................................................................. 13Transfer Rate by Ivy Tech Region and Enrollment Intensity ................................................................. 15Transfer Rates by Student Characteristics .............................................................................................. 17Ivy Tech Credentials Earned by Out-bound Transfers ........................................................................... 20Transfer and Cumulative Hours Earned at Ivy Tech .............................................................................. 21Timing of Transfer .................................................................................................................................. 22Transfer Destinations .............................................................................................................................. 22Post-Transfer Outcomes at External Institutions .................................................................................... 26
Implications/Recommendations .................................................................................................................. 27References ................................................................................................................................................... 28
ANALYSIS OF SIX-YEAR OUTCOMES: FALL 2008 COHORT IR # 15068 Page 3
Executive Summary
This report focuses on Ivy Tech Community College’s first-time to college, full- and part-time, degree-seeking students from the summer and fall terms of 2008 followed for six years from their college start:
Within six years, 4,385 out of 15,727 (27.9 percent) transferred to another institution, a 0.6 percentage point increase from the 2007 cohort Six-Year Outcomes:
o Earned Ivy Tech credential, did not transfer: 13.3 percent. o Earned Ivy Tech credential, transferred: 5.0 percent. o Still enrolled at Ivy Tech: 3.3 percent. o Did not complete at Ivy Tech, transferred: 22.9 percent. o Overall success rate: 44.5 percent.
It is important to note that transfer and completion rates in this report are different from that reported to the Integrated Postsecondary Education Data System (IPEDS). Transfer is defined as any enrollment activity at an institution that is not Ivy Tech, regardless of completing an Ivy Tech degree. Completion rate in this report took into account any degree or certificate completed at Ivy Tech within the six-year period and is not restricted by the 150 percent completion time frame that is used by IPEDS.
Success rates are lowest for older, part-time, African American and Hispanic students. Ivy Tech’s three- and six-year transfer rates for full-time and part-time students were well above the national 50th percentile. Six-year transfer rates for Ivy Tech’s full-time students, in particular, were above the 75th percentile. Within six years, 1,133 out of 4,385 (26 percent) of Ivy Tech students who transferred earned a credential at another institution, with the majority of them being a bachelor’s degree. Transfer rates varied across Ivy Tech regions. Regions with the highest six-year transfer rates are Bloomington (35.3 percent), Northwest (33.5 percent), and Central Indiana (33.1 percent). Central Indiana accounts for 25 percent of all Ivy Tech transfers (1,105 out of 4,385). Students tended to transfer to an institution that is of close proximity to their Ivy Tech home campus. Transfer students tended to leave Ivy Tech early, as more than a third of all transfers occurred within the first two years. IUPUI, IU-Bloomington and Ball State University were the top three receiving institutions. More than half of students who transferred attended four-year public institutions. About a third transferred to a private four-year institution, while 12 percent transferred to a two-year public institution. Only a handful attended two-year private institutions. Institutions with prominent online programs, such as University of Phoenix, were popular choices among students who transferred to private schools. Transfer rates were highest for students who were:
o Pursuing an AA (40.1 percent) and AS (33.2 percent) degree at Ivy Tech. o Enrolled in School of Liberal Arts and Sciences (39.5 percent), School of Education (35.6
percent) and School of Applied Science and Engineering Technology (32.7 percent). o Black, non-Hispanic (37.2 percent) and other minorities (36.8 percent), which includes
Asian or Pacific Islander, American Indian and Alaskan Native’s.
ANALYSIS OF SIX-YEAR OUTCOMES: FALL 2008 COHORT IR # 15068 Page 4
o Age 19 and under (34.6 percent). o Placed college-ready at first term (32.3 percent). o Earned cumulative Ivy Tech GPA of 3.00 to 3.99 (34.3 percent). o Earned cumulative Ivy Tech credits of 30 to 44.9 (34.3 percent). o Dependent (31.9 percent). o Not first generation (31.3 percent). o Enrolled full-time at first term (31.1 percent). o Not Pell-eligible (30.6 percent). o Has household adjusted gross income (AGI) of $50,000 or more (30.4 percent). o Female (29.5 percent).
Transfer rates were the lowest for students who were: o Enrolled in School of Technology (14.1 percent). o Age 50 or older (11.1 percent). o Pursuing a CT at Ivy Tech (10.5 percent).
Only 14 percent of students who transferred earned an Ivy Tech credential before transferring. Among these, a majority obtained an Associate of Science (AS) or Associate of Applied Science (AAS), with business administration being the most popular Ivy Tech major, followed by general studies. Approximately 60 percent of students who transferred without an Ivy Tech credential earned less than 30 Ivy Tech credit hours, while 6.6 percent earned 60 or more.
Key Findings
In 2008, there was a 35.6 percent increase in total number of students compared to the prior year (15,727 versus 11,597). The 2008 cohort is also comprised of older students. Both could be driven by the economic recession. The overall success rate for the 2008 cohort dropped by 1.5 percentage points compared to the prior year, much of it is observed in older and part-time students. It is also the lowest for African American and Hispanic students. Ivy Tech’s six-year transfer rate surpasses its six-year completion rate. The six-year transfer rate is above the national 50th percentile. Within six years, 1,133 out of 4,385 (26 percent) of Ivy Tech students who transferred earned a credential at another institution, with the majority of them being a bachelor’s degree. Students tended to transfer early, with the majority transferring within the first two years without an Ivy Tech credential. Most transferred with less than 30 Ivy Tech credit hours. A considerable proportion of students (over 50 percent) in the cohort were “lost” in the educational system as they did not transfer, complete a credential nor were they found to be enrolled at any school by the end of the six-year period. Interventions targeted toward leavers could benefit these students. Students tended to transfer to an institution that is of close proximity to their Ivy Tech home campus. As a result, having a strong partnership with these programs and/or institutions may help facilitate initiatives such as reverse transfer.
ANALYSIS OF SIX-YEAR OUTCOMES: FALL 2008 COHORT IR # 15068 Page 5
ANALYSIS OF SIX-YEAR OUTCOMES FALL 2008 COHORT
TRANSFER RATES COLLEGE-WIDE AND BY REGION
Introduction
Studies have shown that students are taking an increasingly diverse set of educational pathways to bachelor’s degree attainment. For example, students are acquiring credits from different institutions to meet academic and financial needs and taking more than four years to acquire a bachelor’s degree (Hossler et al., 2012). As students pursue their educational objectives, the role a community college plays in bachelor’s degree attainment is becoming increasingly important, as is emphasized in Ivy Tech’s transfer mission.
Current state performance funding metrics do not recognize the role of transfer in the success of Ivy Tech students. However, by creating systems whereby these students can be tracked throughout their postsecondary career, we will be in a better position to demonstrate the important role Ivy Tech plays within the Indiana higher education system.
First-time, degree seeking students who first enrolled at Ivy Tech in the fall of 2008 were followed for six years to identify:
1. the three- and six-year outcomes for students in this cohort and to compare Ivy Tech transfer rates to that of national benchmarks;
2. who are Ivy Tech out-bound transfer students, where do they transfer, and when; and 3. post-transfer outcomes, including credentials earned.
The results from this report will help provide a more comprehensive look at what occurs throughout a student’s academic career and help identify intervention points for senior leadership, policymakers and stakeholders to facilitate student success.
Methodology
The cohort in this study included all first-time, degree-seeking students who were new to Ivy Tech in the fall 2008 semester, including both full-time and part-time students (n=15,727) – the Fall 2008 IPEDS cohort. The sample excluded deceased students, high school students, guest students and students from the apprenticeship program.
Student demographic information, enrollment characteristics, course work information and degree information at Ivy Tech were extracted from Banner/ODS. Each student’s demographic and enrollment characteristics such as enrollment intensity (i.e. full- versus part-time) and major, as well as the student’s home region, were captured when the student first started at the college. Subsequent enrollment and external degree information were provided by the National Student Clearinghouse (NSC) and Indiana Commission for Higher Education (ICHE).
ANALYSIS OF SIX-YEAR OUTCOMES: FALL 2008 COHORT IR # 15068 Page 6
This report defines transfer as any enrollment activity at an institution that is not Ivy Tech. Each student is counted once, regardless of whether the student attended multiple institutions. Completion in this report is defined as obtaining either a credential (i.e., CT or TC) or an associate degree at any time within the six-year time span and is not restricted by the 150 percent completion time frame. This allows our completion counts to include more students, particularly those that earned certificates.
The research timeframe is between the student’s first term at Ivy Tech (summer or fall 2008) and the end of the six-year period (spring semester of 2013). This report does not examine any transfer or completion activity that falls outside this timeframe.
Findings
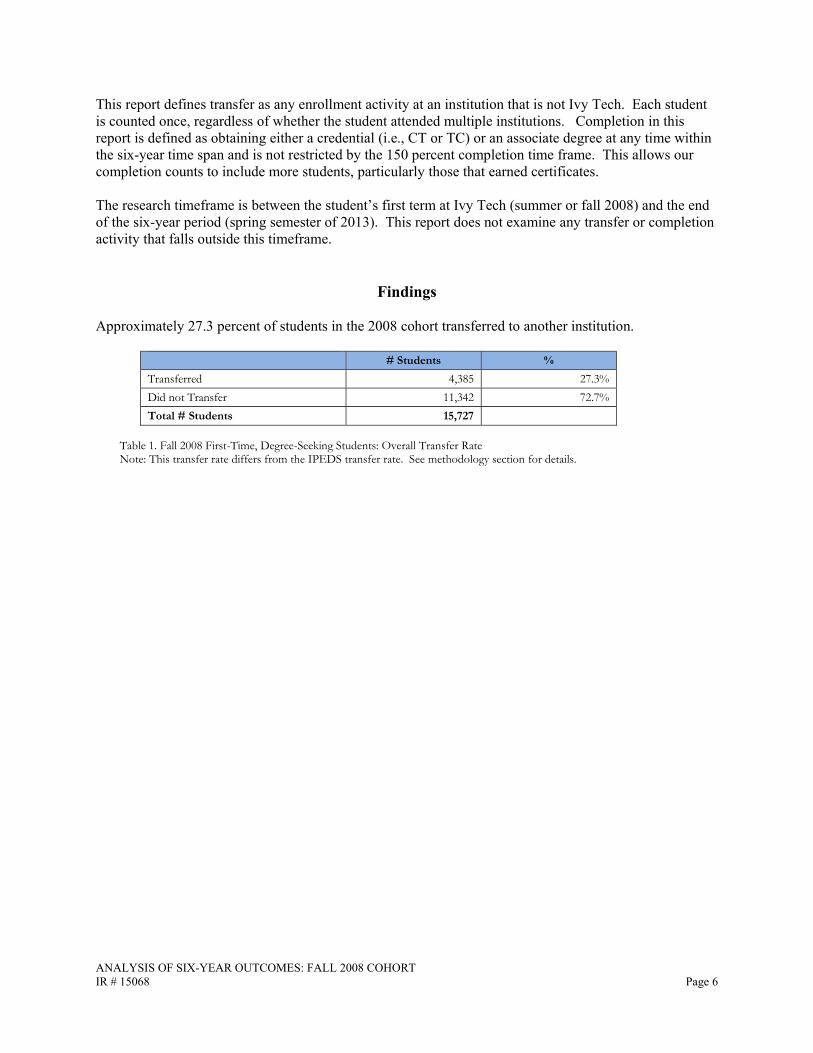
Approximately 27.3 percent of students in the 2008 cohort transferred to another institution.
# Students % Transferred 4,385 27.3%Did not Transfer 11,342 72.7%Total # Students 15,727
Table 1. Fall 2008 First-Time, Degree-Seeking Students: Overall Transfer Rate Note: This transfer rate differs from the IPEDS transfer rate. See methodology section for details.
ANALYSIS OF SIX-YEAR OUTCOMES: FALL 2008 COHORT IR # 15068 Page 7
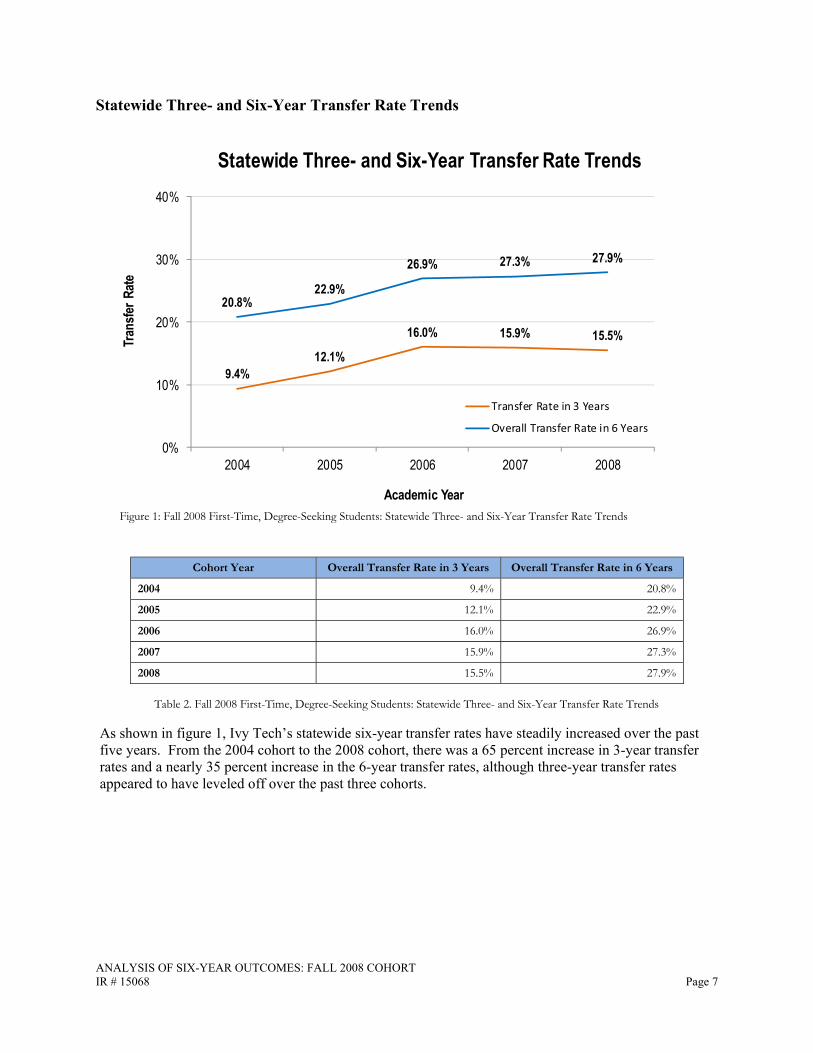
Statewide Three- and Six-Year Transfer Rate Trends
Figure 1: Fall 2008 First-Time, Degree-Seeking Students: Statewide Three- and Six-Year Transfer Rate Trends
Cohort Year Overall Transfer Rate in 3 Years Overall Transfer Rate in 6 Years
2004 9.4% 20.8%
2005 12.1% 22.9%
2006 16.0% 26.9%
2007 15.9% 27.3%
2008 15.5% 27.9%
Table 2. Fall 2008 First-Time, Degree-Seeking Students: Statewide Three- and Six-Year Transfer Rate Trends
As shown in figure 1, Ivy Tech’s statewide six-year transfer rates have steadily increased over the past five years. From the 2004 cohort to the 2008 cohort, there was a 65 percent increase in 3-year transfer rates and a nearly 35 percent increase in the 6-year transfer rates, although three-year transfer rates appeared to have leveled off over the past three cohorts.
ANALYSIS OF SIX-YEAR OUTCOMES: FALL 2008 COHORT IR # 15068 Page 8
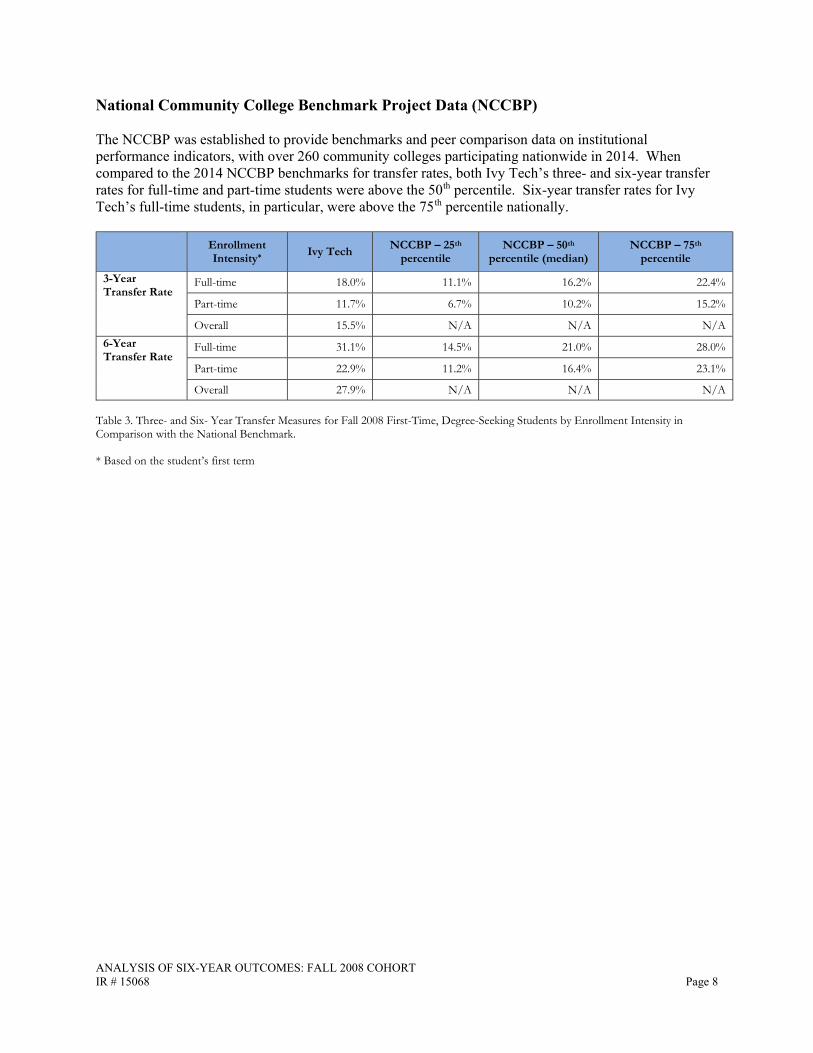
National Community College Benchmark Project Data (NCCBP)
The NCCBP was established to provide benchmarks and peer comparison data on institutional performance indicators, with over 260 community colleges participating nationwide in 2014. When compared to the 2014 NCCBP benchmarks for transfer rates, both Ivy Tech’s three- and six-year transfer rates for full-time and part-time students were above the 50th percentile. Six-year transfer rates for Ivy Tech’s full-time students, in particular, were above the 75th percentile nationally.
Enrollment Intensity* Ivy Tech NCCBP – 25th
percentile NCCBP – 50th
percentile (median) NCCBP – 75th
percentile 3-Year Transfer Rate
Full-time 18.0% 11.1% 16.2% 22.4%
Part-time 11.7% 6.7% 10.2% 15.2%
Overall 15.5% N/A N/A N/A6-Year Transfer Rate
Full-time 31.1% 14.5% 21.0% 28.0%
Part-time 22.9% 11.2% 16.4% 23.1%
Overall 27.9% N/A N/A N/A
Table 3. Three- and Six- Year Transfer Measures for Fall 2008 First-Time, Degree-Seeking Students by Enrollment Intensity in Comparison with the National Benchmark.
* Based on the student’s first term
ANALYSIS OF SIX-YEAR OUTCOMES: FALL 2008 COHORT IR # 15068 Page 9
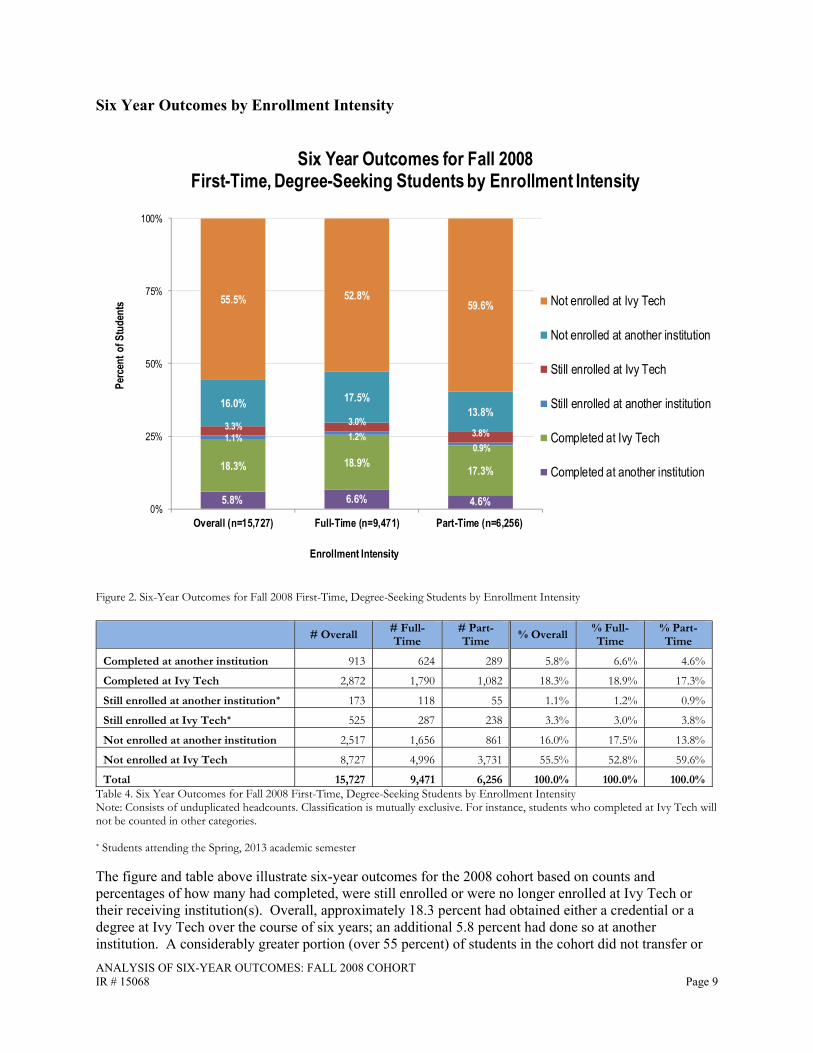
Six Year Outcomes by Enrollment Intensity
Figure 2. Six-Year Outcomes for Fall 2008 First-Time, Degree-Seeking Students by Enrollment Intensity
# Overall # Full-Time
# Part-Time % Overall % Full-
Time % Part-Time
Completed at another institution 913 624 289 5.8% 6.6% 4.6%
Completed at Ivy Tech 2,872 1,790 1,082 18.3% 18.9% 17.3%
Still enrolled at another institution* 173 118 55 1.1% 1.2% 0.9%
Still enrolled at Ivy Tech* 525 287 238 3.3% 3.0% 3.8%
Not enrolled at another institution 2,517 1,656 861 16.0% 17.5% 13.8%
Not enrolled at Ivy Tech 8,727 4,996 3,731 55.5% 52.8% 59.6%
Total 15,727 9,471 6,256 100.0% 100.0% 100.0%Table 4. Six Year Outcomes for Fall 2008 First-Time, Degree-Seeking Students by Enrollment Intensity Note: Consists of unduplicated headcounts. Classification is mutually exclusive. For instance, students who completed at Ivy Tech will not be counted in other categories.
* Students attending the Spring, 2013 academic semester
The figure and table above illustrate six-year outcomes for the 2008 cohort based on counts and percentages of how many had completed, were still enrolled or were no longer enrolled at Ivy Tech or their receiving institution(s). Overall, approximately 18.3 percent had obtained either a credential or a degree at Ivy Tech over the course of six years; an additional 5.8 percent had done so at another institution. A considerably greater portion (over 55 percent) of students in the cohort did not transfer or
ANALYSIS OF SIX-YEAR OUTCOMES: FALL 2008 COHORT IR # 15068 Page 10
complete a credential nor were they found to have been enrolled at any school at the end of the six year period.
Full-timer students tended to perform better than part-timer students, as slightly more full-timer students completed a credential at Ivy Tech or at another institution at the end of the six year period. Moreover, fewer part-timer students were found to be enrolled at Ivy Tech at the end of the six year period.
Finally, almost 700 students were still actively enrolled at Ivy Tech or at another institution at the end of the six-year period, suggesting perhaps a traditional three or six-year measure of success may cover a time period that is too short to sufficiently capture the success of community college students. In fact, the average time to completion for Ivy Tech students is 16 semesters, that is, 5 years and 1 semester from the time of first enrollment. IPEDS will begin collecting an 8-year graduation rate in the 2014-2015 year, which will provide us an opportunity to receive peer comparison data for this period of time.
ANALYSIS OF SIX-YEAR OUTCOMES: FALL 2008 COHORT IR # 15068 Page 11
Six-year Outcomes by Ivy Tech Region
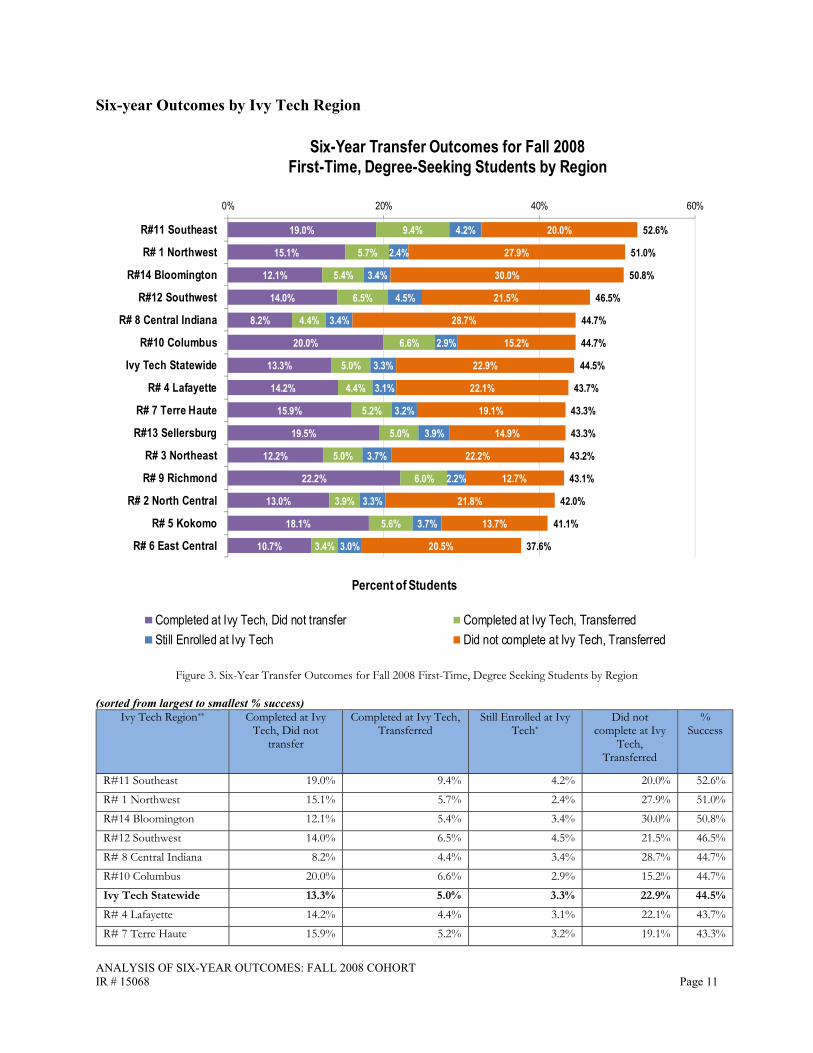
Figure 3. Six-Year Transfer Outcomes for Fall 2008 First-Time, Degree Seeking Students by Region
(sorted from largest to smallest % success) Ivy Tech Region** Completed at Ivy
Tech, Did not transfer
Completed at Ivy Tech, Transferred
Still Enrolled at Ivy Tech*
Did not complete at Ivy
Tech, Transferred
% Success
R#11 Southeast 19.0% 9.4% 4.2% 20.0% 52.6%R# 1 Northwest 15.1% 5.7% 2.4% 27.9% 51.0%R#14 Bloomington 12.1% 5.4% 3.4% 30.0% 50.8%R#12 Southwest 14.0% 6.5% 4.5% 21.5% 46.5%R# 8 Central Indiana 8.2% 4.4% 3.4% 28.7% 44.7%R#10 Columbus 20.0% 6.6% 2.9% 15.2% 44.7%Ivy Tech Statewide 13.3% 5.0% 3.3% 22.9% 44.5%R# 4 Lafayette 14.2% 4.4% 3.1% 22.1% 43.7%R# 7 Terre Haute 15.9% 5.2% 3.2% 19.1% 43.3%
19.0%
15.1%
12.1%
14.0%
8.2%
20.0%
13.3%
14.2%
15.9%
19.5%
12.2%
22.2%
13.0%
18.1%
10.7%
9.4%
5.7%
5.4%
6.5%
4.4%
6.6%
5.0%
4.4%
5.2%
5.0%
5.0%
6.0%
3.9%
5.6%
3.4%
4.2%
2.4%
3.4%
4.5%
3.4%
2.9%
3.3%
3.1%
3.2%
3.9%
3.7%
2.2%
3.3%
3.7%
3.0%
20.0%
27.9%
30.0%
21.5%
28.7%
15.2%
22.9%
22.1%
19.1%
14.9%
22.2%
12.7%
21.8%
13.7%
20.5%
52.6%
51.0%
50.8%
46.5%
44.7%
44.7%
44.5%
43.7%
43.3%
43.3%
43.2%
43.1%
42.0%
41.1%
37.6%
0% 20% 40% 60%
R#11 Southeast
R# 1 Northwest
R#14 Bloomington
R#12 Southwest
R# 8 Central Indiana
R#10 Columbus
Ivy Tech Statewide
R# 4 Lafayette
R# 7 Terre Haute
R#13 Sellersburg
R# 3 Northeast
R# 9 Richmond
R# 2 North Central
R# 5 Kokomo
R# 6 East Central
Percent of Students
Six-Year Transfer Outcomes for Fall 2008 First-Time, Degree-Seeking Students by Region
Completed at Ivy Tech, Did not transfer Completed at Ivy Tech, TransferredStill Enrolled at Ivy Tech Did not complete at Ivy Tech, Transferred
ANALYSIS OF SIX-YEAR OUTCOMES: FALL 2008 COHORT IR # 15068 Page 12
Ivy Tech Region** Completed at Ivy Tech, Did not
transfer
Completed at Ivy Tech, Transferred
Still Enrolled at Ivy Tech*
Did not complete at Ivy
Tech, Transferred
% Success
R#13 Sellersburg 19.5% 5.0% 3.9% 14.9% 43.3%R# 3 Northeast 12.2% 5.0% 3.7% 22.2% 43.2%R# 9 Richmond 22.2% 6.0% 2.2% 12.7% 43.1%R# 2 North Central 13.0% 3.9% 3.3% 21.8% 42.0%R# 5 Kokomo 18.1% 5.6% 3.7% 13.7% 41.1%R# 6 East Central 10.7% 3.4% 3.0% 20.5% 37.6%
Table 5. Six-Year Transfer Outcomes for Fall 2008 First-Time, Degree Seeking Students by Region (See Table 1-A, 1-B in the appendix for details)
* Students attending the Spring, 2013 academic semester ** Based on the student’s first term
Figure 3 and table 5 show six-year outcomes for the 2008 cohort broken out by Ivy Tech region. Regions that ranked top in overall six-year success rates are Southeast (52.6 percent), Northwest (51.0 percent) and Bloomington (50.8 percent).
Approximately a quarter of students from the Richmond and Columbus regions, respectively, completed at Ivy Tech and did not transfer. The Bloomington and Central Indiana regions had the highest proportion of students transferring without completing an Ivy Tech credential, whereas Southeast had the highest proportion of students transferring with an Ivy Tech credential. Consistent with findings from past transfer studies (Lin, 2014), a considerably large proportion of students transferred before completing at Ivy Tech. This is the most apparent in the Bloomington (30.0 percent) and Central Indiana regions (28.7 percent).
It is important to note the 2008 cohort differed from the 2007 cohort in both size and types of students enrolled. In 2008, there was a drastic 35.6 percent increase in total IPEDS enrollment numbers compared to the prior year (15,727 versus 11,597). The 2008 cohort is also comprised of higher numbers of older students, as the percentage of students between the ages of 20 and 24 increased by 19 percentage points and 4.5 percentage points for those who were 25 or older. The sudden growth in enrollment numbers and number of older students could be driven by the economic recession, as reported by several studies (Barr and Turner, 2013 and Shapiro et al., 2014).
The overall success rate for the 2008 cohort was 44.5 percent, a 1.5 percentage points drop from the 2007 cohort. A deeper examination among different student groups indicated that success rate for full-time students remained fairly consistent compared to the prior year; however, the success rate for part-time enrollees dropped by 3.3 percent. A decline in the success rate was also observed in older students, particularly those in the 20 to 24 age group and 50 or older. Success rates were also lowest for African American and Hispanic students. A recent National Student Clearinghouse study on national completion rates of new, first-time students who began in Fall, 2008 also reported a decline in completion rates nationally, with declines observed mostly in part-time and older students (Shapiro et al., 2014).
ANALYSIS OF SIX-YEAR OUTCOMES: FALL 2008 COHORT IR # 15068 Page 13
Three- and Six-Year Outcomes by Ivy Tech Region
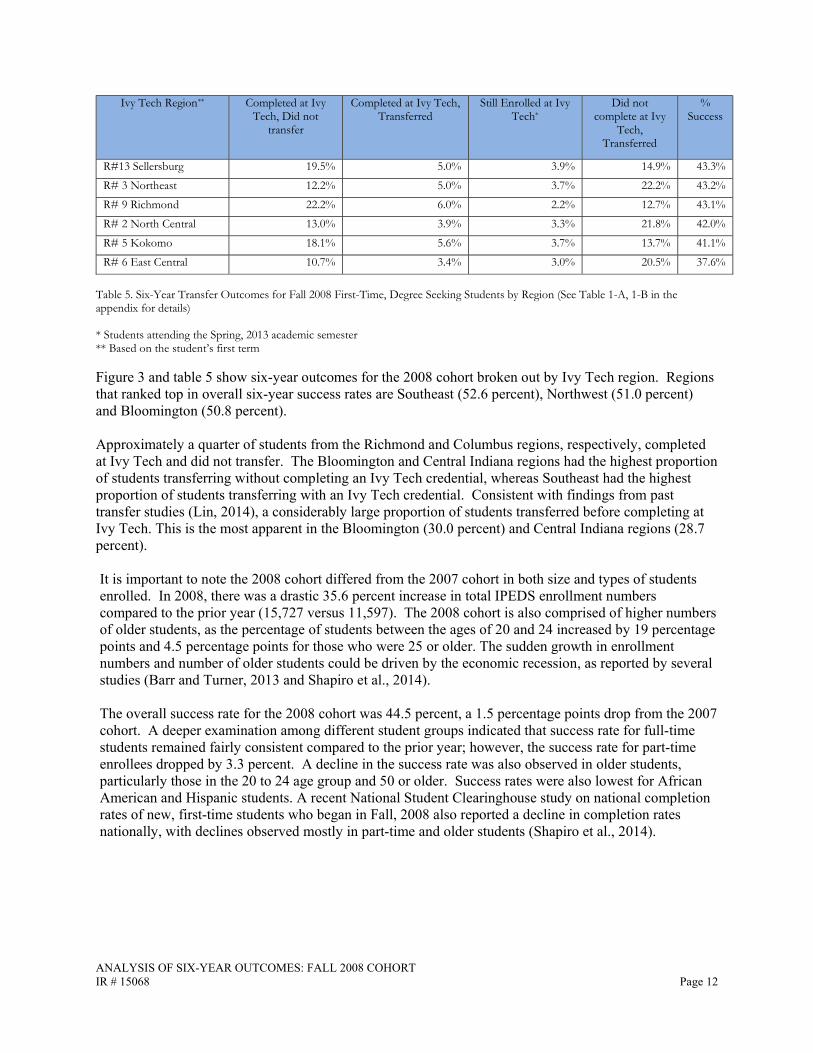
Figure 4. Fall 2008 First-Time, Degree-Seeking Students: Three- and Six- year Transfer Rates by Ivy Tech Region
Region Name*# in
Cohort
# Transferred 1-3 Years
# Transferred 4-6 Years
# Transferred
within 6 years
Transfer Rate Years
1-3
Transfer Rate years 4-
6
Transfer Rate within
6 years
R# 1 Northwest 1115 228 138 374 20.4% 12.4% 33.5%R# 2 North Central 1060 160 106 272 15.1% 10.0% 25.7%R# 3 Northeast 1479 219 170 403 14.8% 11.5% 27.2%R# 4 Lafayette 1192 182 123 315 15.3% 10.3% 26.4%R# 5 Kokomo 708 63 68 137 8.9% 9.6% 19.4%R# 6 East Central 1571 209 152 376 13.3% 9.7% 23.9%R# 7 Terre Haute 870 109 95 211 12.5% 10.9% 24.3%R# 8 Central Indiana 3339 612 451 1105 18.3% 13.5% 33.1%R# 9 Richmond 401 40 35 75 10.0% 8.7% 18.7%R#10 Columbus 580 74 45 126 12.8% 7.8% 21.7%R#11 Southeast 405 55 60 119 13.6% 14.8% 29.4%R#12 Southwest 785 103 112 220 13.1% 14.3% 28.0%R#13 Sellersburg 861 92 75 171 10.7% 8.7% 19.9%R#14 Bloomington 1,361 293 176 481 21.5% 12.9% 35.3%Ivy Tech Statewide 15,727 2,439 1,806 4,385 15.5% 11.5% 27.9%
Table 6. Fall 2008 First Time, Degree-Seeking Students: Three- and Six- year Transfer Rates by Ivy Tech Region * Based on the student’s first term
ANALYSIS OF SIX-YEAR OUTCOMES: FALL 2008 COHORT IR # 15068 Page 14
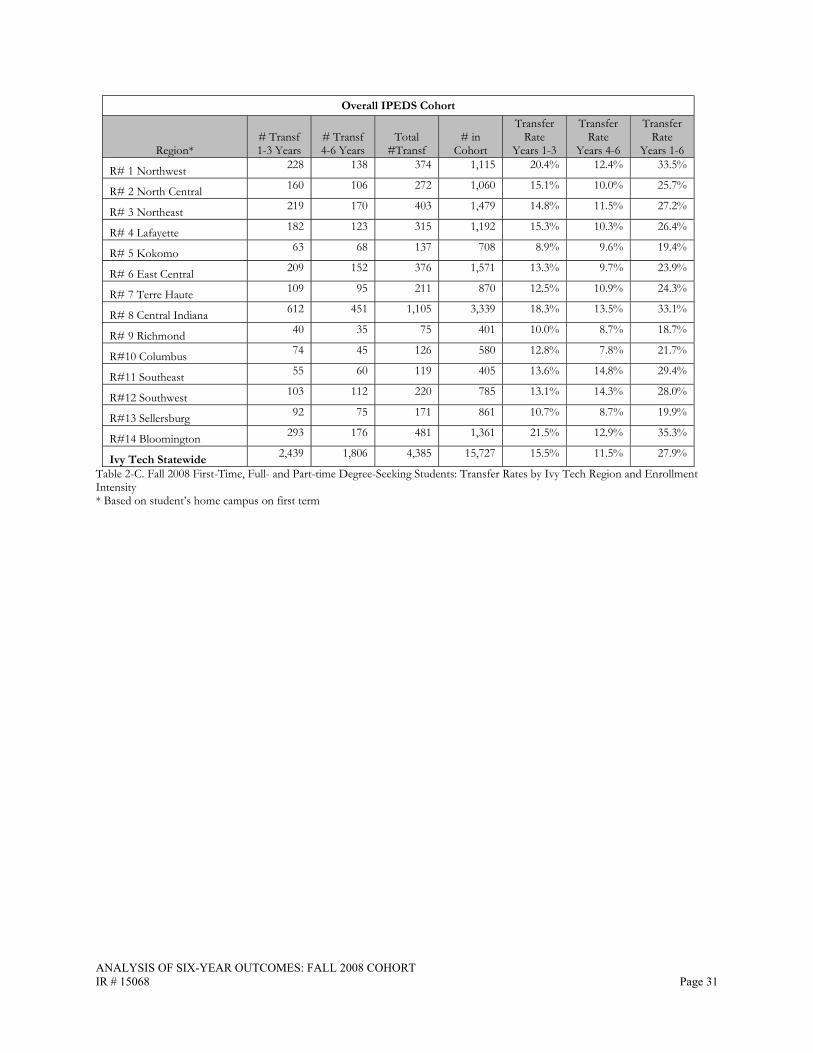
The figure above shows three- and six-year transfer rates by Ivy Tech region. Transfer rates for years one to three surpassed that of years four to six, indicating that the majority of students transfer fairly early in their academic career.
Studying transfer activity across Ivy Tech regions identifies vast differences across regions, with six-year transfer rates ranging between 18.7 percent and 35.3 percent. Some Ivy Tech regions are more transfer-oriented than others. Such differences could be contributed to the nature of programs offered, the student body that was served, the four-year institution that is in close proximity to the Ivy Tech campus, or the strength of any transfer agreements with nearby institutions.
Ivy Tech Regions with the highest three-year transfer rates are: R#14 Bloomington (21.5 percent) R# 1 Northwest (20.4 percent) R# 8 Central Indiana (18.3 percent)
Ivy Tech Regions with the highest four- to six-year transfer rates are: R#11 Southeast (14.8 percent) R#12 Southwest (14.3 percent) R# 8 Central Indiana (13.5 percent)
Ivy Tech Regions with the highest overall six-year transfer rates are: R#14 Bloomington (35.3 percent) R# 1 Northwest (33.5 percent) R# 8 Central Indiana (33.1 percent)
Ivy Tech Regions with the lowest overall six-year transfer rates are: R#13 Sellersburg (19.9 percent) R# 5 Kokomo (19.4 percent) R# 9 Richmond (18.7 percent)
ANALYSIS OF SIX-YEAR OUTCOMES: FALL 2008 COHORT IR # 15068 Page 15
Transfer Rate by Ivy Tech Region and Enrollment Intensity
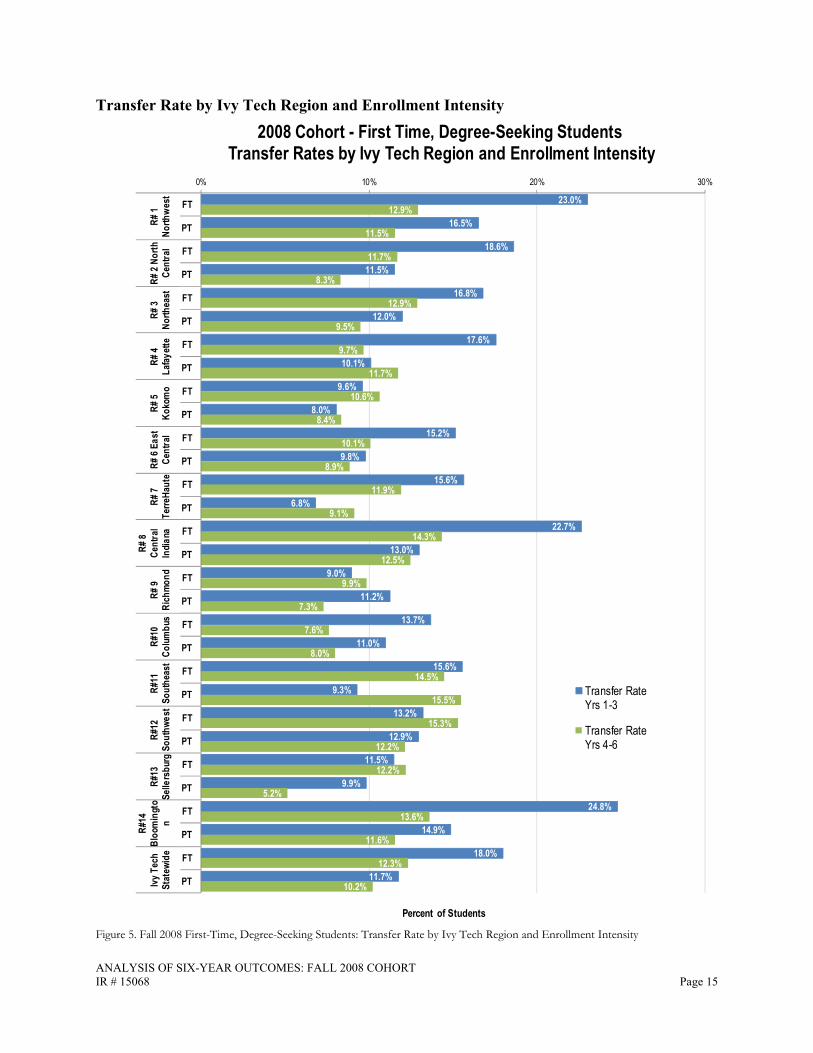
Figure 5. Fall 2008 First-Time, Degree-Seeking Students: Transfer Rate by Ivy Tech Region and Enrollment Intensity
23.0%
16.5%
18.6%
11.5%
16.8%
12.0%
17.6%
10.1%
9.6%
8.0%
15.2%
9.8%
15.6%
6.8%
22.7%
13.0%
9.0%
11.2%
13.7%
11.0%
15.6%
9.3%
13.2%
12.9%
11.5%
9.9%
24.8%
14.9%
18.0%
11.7%
12.9%
11.5%
11.7%
8.3%
12.9%
9.5%
9.7%
11.7%
10.6%
8.4%
10.1%
8.9%
11.9%
9.1%
14.3%
12.5%
9.9%
7.3%
7.6%
8.0%
14.5%
15.5%
15.3%
12.2%
12.2%
5.2%
13.6%
11.6%
12.3%
10.2%
0% 10% 20% 30%
FT
PT
FT
PT
FT
PT
FT
PT
FT
PT
FT
PT
FT
PT
FT
PT
FT
PT
FT
PT
FT
PT
FT
PT
FT
PT
FT
PT
FT
PT
Percent of Students
2008 Cohort - First Time, Degree-Seeking Students Transfer Rates by Ivy Tech Region and Enrollment Intensity
Transfer RateYrs 1-3
Transfer RateYrs 4-6
ANALYSIS OF SIX-YEAR OUTCOMES: FALL 2008 COHORT IR # 15068 Page 16
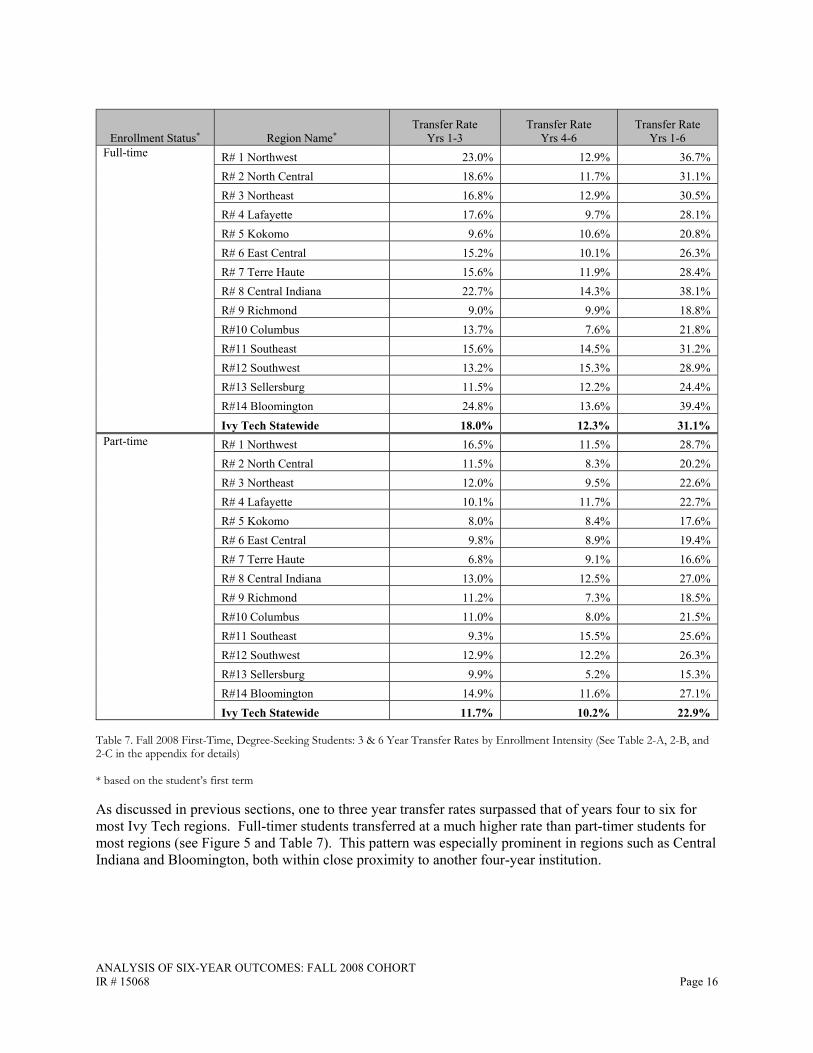
Enrollment Status* Region Name*Transfer Rate
Yrs 1-3 Transfer Rate
Yrs 4-6 Transfer Rate
Yrs 1-6 Full-time R# 1 Northwest 23.0% 12.9% 36.7%
R# 2 North Central 18.6% 11.7% 31.1% R# 3 Northeast 16.8% 12.9% 30.5% R# 4 Lafayette 17.6% 9.7% 28.1% R# 5 Kokomo 9.6% 10.6% 20.8% R# 6 East Central 15.2% 10.1% 26.3% R# 7 Terre Haute 15.6% 11.9% 28.4% R# 8 Central Indiana 22.7% 14.3% 38.1% R# 9 Richmond 9.0% 9.9% 18.8% R#10 Columbus 13.7% 7.6% 21.8% R#11 Southeast 15.6% 14.5% 31.2% R#12 Southwest 13.2% 15.3% 28.9% R#13 Sellersburg 11.5% 12.2% 24.4% R#14 Bloomington 24.8% 13.6% 39.4% Ivy Tech Statewide 18.0% 12.3% 31.1%
Part-time R# 1 Northwest 16.5% 11.5% 28.7% R# 2 North Central 11.5% 8.3% 20.2% R# 3 Northeast 12.0% 9.5% 22.6% R# 4 Lafayette 10.1% 11.7% 22.7% R# 5 Kokomo 8.0% 8.4% 17.6% R# 6 East Central 9.8% 8.9% 19.4% R# 7 Terre Haute 6.8% 9.1% 16.6% R# 8 Central Indiana 13.0% 12.5% 27.0% R# 9 Richmond 11.2% 7.3% 18.5% R#10 Columbus 11.0% 8.0% 21.5% R#11 Southeast 9.3% 15.5% 25.6% R#12 Southwest 12.9% 12.2% 26.3% R#13 Sellersburg 9.9% 5.2% 15.3% R#14 Bloomington 14.9% 11.6% 27.1% Ivy Tech Statewide 11.7% 10.2% 22.9%
Table 7. Fall 2008 First-Time, Degree-Seeking Students: 3 & 6 Year Transfer Rates by Enrollment Intensity (See Table 2-A, 2-B, and 2-C in the appendix for details)
* based on the student’s first term
As discussed in previous sections, one to three year transfer rates surpassed that of years four to six for most Ivy Tech regions. Full-timer students transferred at a much higher rate than part-timer students for most regions (see Figure 5 and Table 7). This pattern was especially prominent in regions such as Central Indiana and Bloomington, both within close proximity to another four-year institution.

ANALYSIS OF SIX-YEAR OUTCOMES: FALL 2008 COHORT IR # 15068 Page 17
Transfer Rates by Student Characteristics
Figure 6-a. Fall 2008 First-time, Degree-Seeking Students: Rate at which Students Transfer by Student and Enrollment Characteristics.
ANALYSIS OF SIX-YEAR OUTCOMES: FALL 2008 COHORT IR # 15068 Page 18
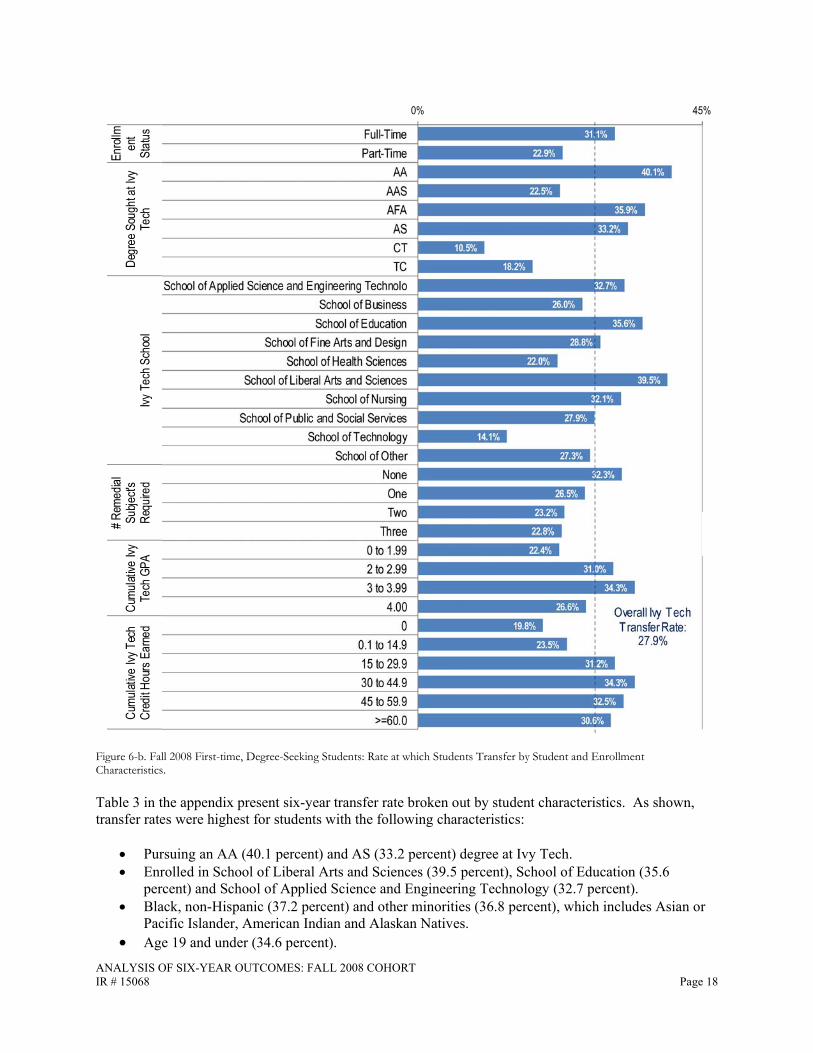
Figure 6-b. Fall 2008 First-time, Degree-Seeking Students: Rate at which Students Transfer by Student and Enrollment Characteristics.
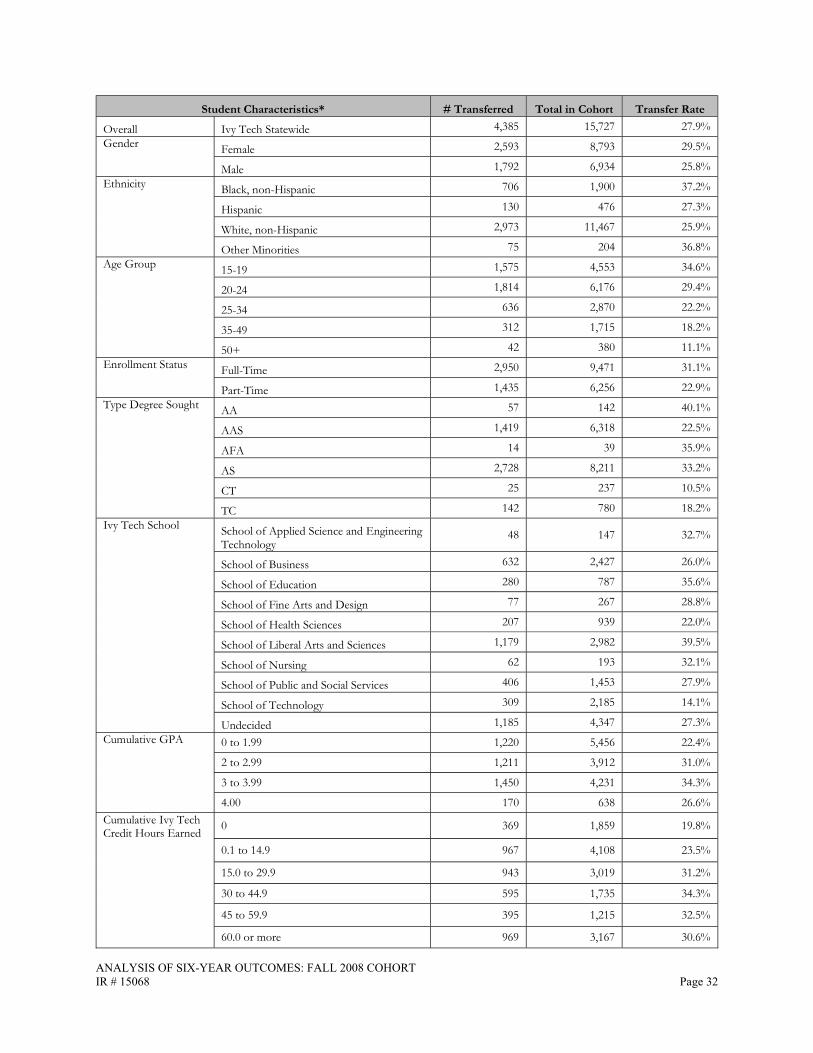
Table 3 in the appendix present six-year transfer rate broken out by student characteristics. As shown, transfer rates were highest for students with the following characteristics:
Pursuing an AA (40.1 percent) and AS (33.2 percent) degree at Ivy Tech. Enrolled in School of Liberal Arts and Sciences (39.5 percent), School of Education (35.6 percent) and School of Applied Science and Engineering Technology (32.7 percent). Black, non-Hispanic (37.2 percent) and other minorities (36.8 percent), which includes Asian or Pacific Islander, American Indian and Alaskan Natives. Age 19 and under (34.6 percent).
ANALYSIS OF SIX-YEAR OUTCOMES: FALL 2008 COHORT IR # 15068 Page 19
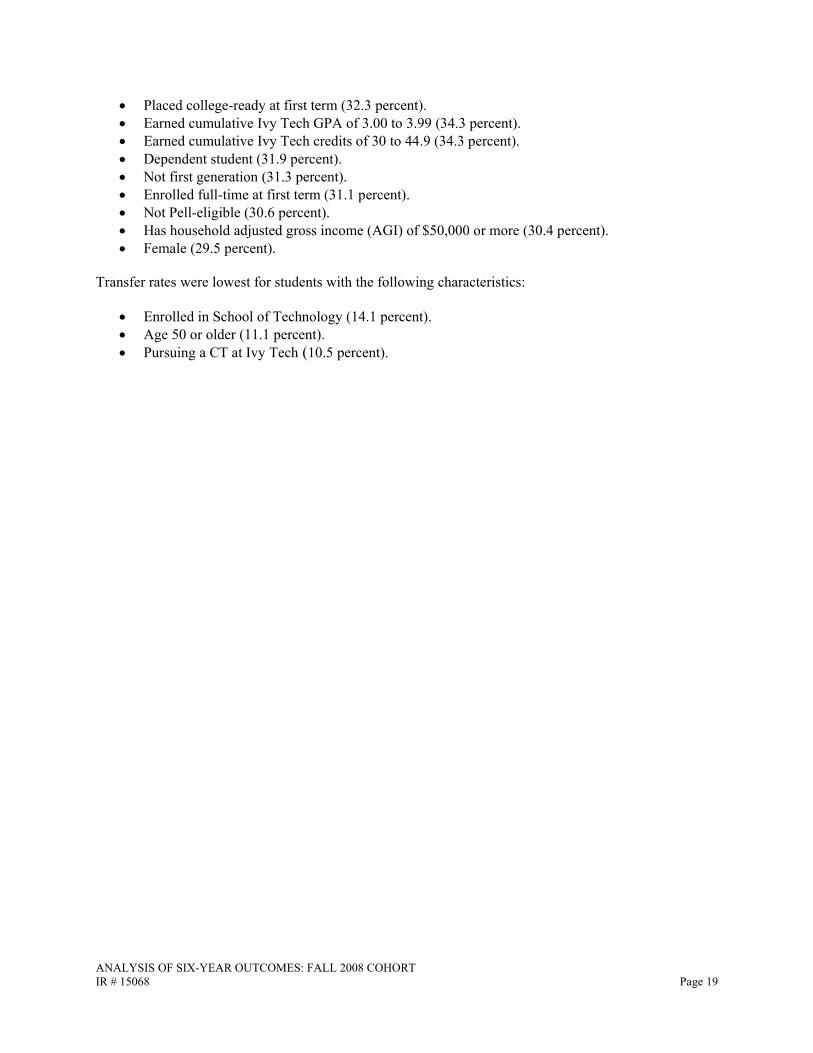
Placed college-ready at first term (32.3 percent). Earned cumulative Ivy Tech GPA of 3.00 to 3.99 (34.3 percent). Earned cumulative Ivy Tech credits of 30 to 44.9 (34.3 percent). Dependent student (31.9 percent). Not first generation (31.3 percent). Enrolled full-time at first term (31.1 percent). Not Pell-eligible (30.6 percent). Has household adjusted gross income (AGI) of $50,000 or more (30.4 percent). Female (29.5 percent).
Transfer rates were lowest for students with the following characteristics:
Enrolled in School of Technology (14.1 percent). Age 50 or older (11.1 percent). Pursuing a CT at Ivy Tech (10.5 percent).
ANALYSIS OF SIX-YEAR OUTCOMES: FALL 2008 COHORT IR # 15068 Page 20
Ivy Tech Credentials Earned by Out-bound Transfers
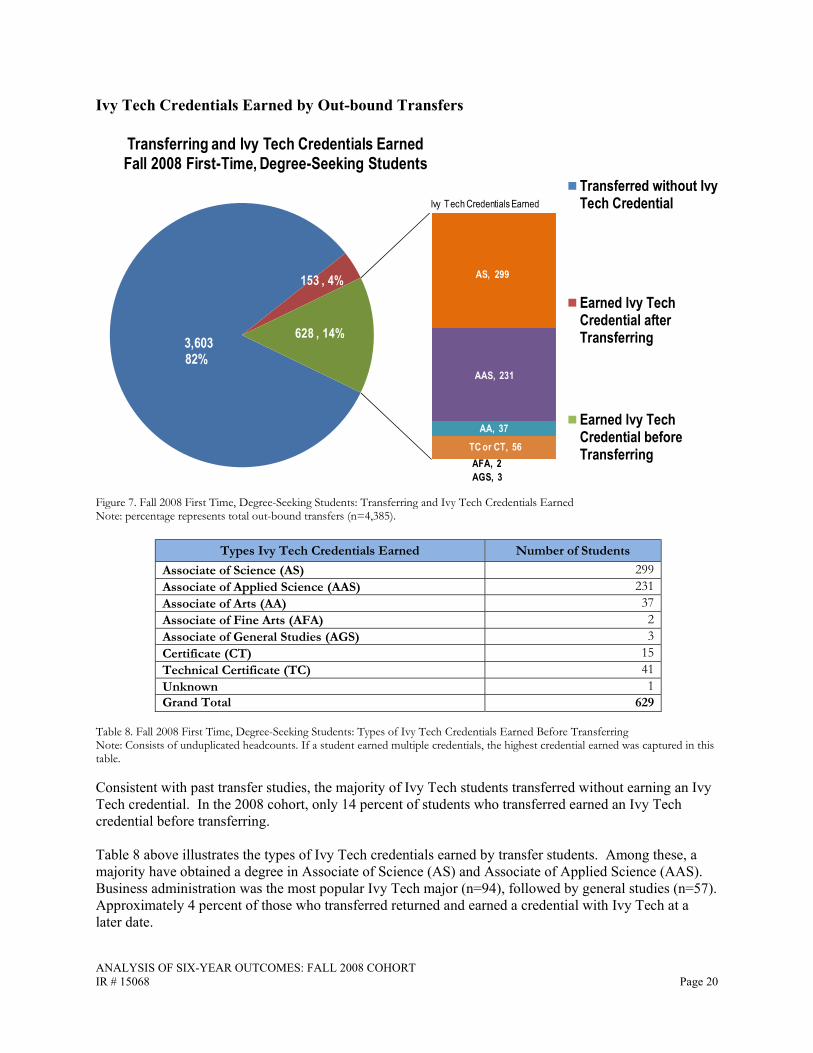
Figure 7. Fall 2008 First Time, Degree-Seeking Students: Transferring and Ivy Tech Credentials Earned Note: percentage represents total out-bound transfers (n=4,385).
Types Ivy Tech Credentials Earned Number of Students Associate of Science (AS) 299 Associate of Applied Science (AAS) 231 Associate of Arts (AA) 37 Associate of Fine Arts (AFA) 2 Associate of General Studies (AGS) 3 Certificate (CT) 15Technical Certificate (TC) 41Unknown 1Grand Total 629
Table 8. Fall 2008 First Time, Degree-Seeking Students: Types of Ivy Tech Credentials Earned Before Transferring Note: Consists of unduplicated headcounts. If a student earned multiple credentials, the highest credential earned was captured in this table.
Consistent with past transfer studies, the majority of Ivy Tech students transferred without earning an Ivy Tech credential. In the 2008 cohort, only 14 percent of students who transferred earned an Ivy Tech credential before transferring.
Table 8 above illustrates the types of Ivy Tech credentials earned by transfer students. Among these, a majority have obtained a degree in Associate of Science (AS) and Associate of Applied Science (AAS). Business administration was the most popular Ivy Tech major (n=94), followed by general studies (n=57). Approximately 4 percent of those who transferred returned and earned a credential with Ivy Tech at a later date.
ANALYSIS OF SIX-YEAR OUTCOMES: FALL 2008 COHORT IR # 15068 Page 21
Transfer and Cumulative Hours Earned at Ivy Tech
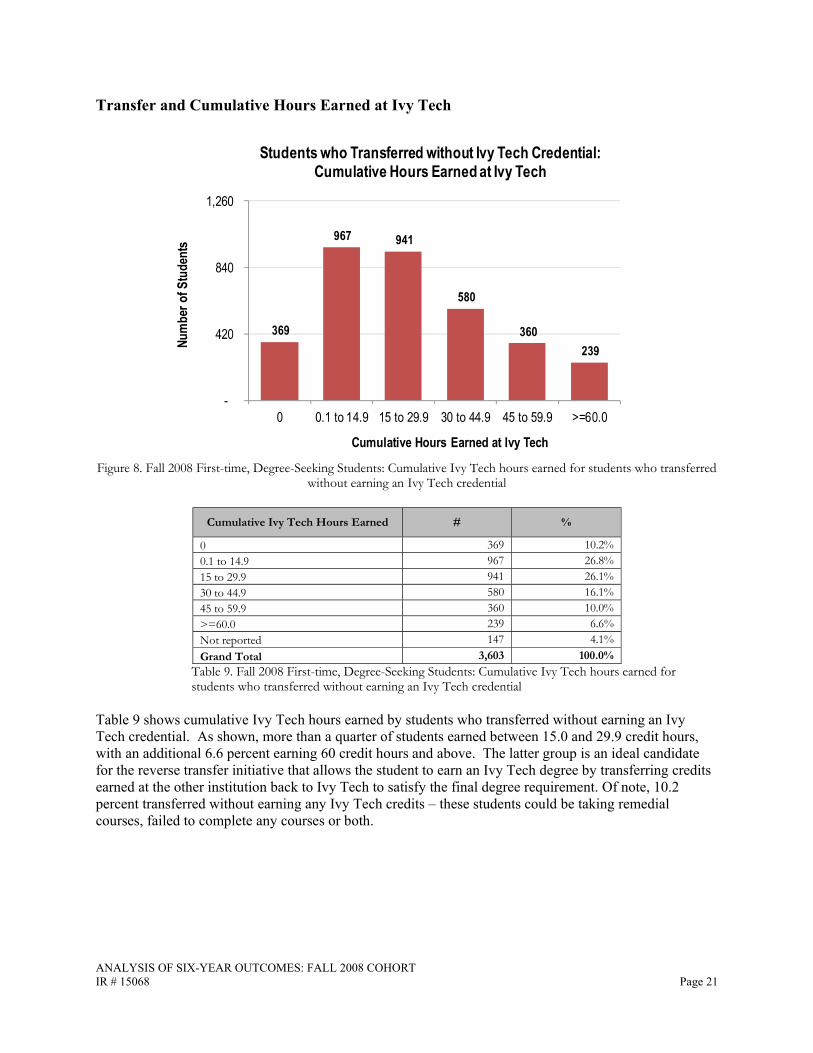
Figure 8. Fall 2008 First-time, Degree-Seeking Students: Cumulative Ivy Tech hours earned for students who transferred without earning an Ivy Tech credential
Cumulative Ivy Tech Hours Earned # %
0 369 10.2%0.1 to 14.9 967 26.8%15 to 29.9 941 26.1%30 to 44.9 580 16.1%45 to 59.9 360 10.0%>=60.0 239 6.6%Not reported 147 4.1%Grand Total 3,603 100.0%
Table 9. Fall 2008 First-time, Degree-Seeking Students: Cumulative Ivy Tech hours earned for students who transferred without earning an Ivy Tech credential
Table 9 shows cumulative Ivy Tech hours earned by students who transferred without earning an Ivy Tech credential. As shown, more than a quarter of students earned between 15.0 and 29.9 credit hours, with an additional 6.6 percent earning 60 credit hours and above. The latter group is an ideal candidate for the reverse transfer initiative that allows the student to earn an Ivy Tech degree by transferring credits earned at the other institution back to Ivy Tech to satisfy the final degree requirement. Of note, 10.2 percent transferred without earning any Ivy Tech credits – these students could be taking remedial courses, failed to complete any courses or both.

ANALYSIS OF SIX-YEAR OUTCOMES: FALL 2008 COHORT IR # 15068 Page 22
Timing of Transfer
Figure 9. Fall 2008 First-time, Degree-Seeking Students: Last Term Enrolled at Ivy Tech
Figure 9 shows the academic year of which transfer activity occurred. Students who transferred tended to leave Ivy Tech early, as more than a quarter of all transfers occurred within the first two years. Although there is a high proportion of students who transferred early in their academic career, transfer numbers remain high throughout the six-year period, suggesting Ivy Tech students are active in the education system for more than the 150 percent completion time.3
Transfer Destinations
424
1,104
911
770
592
444
-
420
840
1,260
2008 2009 2010 2011 2012 2013Academic Year
Timing of Transfer
Four-Year Private1,271 29%
Four-Year Public2,490 57%
Two-Year Private50
1%
Two-Year Public542 12%
Less than Two Year Private
32 1%
"Transfer-to" Institutions by Sector and Control
Four-Year Private
Four-Year Public
Two-Year Private
Two-Year Public

ANALYSIS OF SIX-YEAR OUTCOMES: FALL 2008 COHORT IR # 15068 Page 23
Figure 10. Fall 2008 First-Time, Degree-Seeking Students: “Transfer-to” Institutions by Sector and Control
Figures 10 and 11 describe in-state and out-of-state initial “transfer-to” destinations by sector and control. More than half of the students transferred to four-year public institutions. About a third transferred to a private four-year institution, while 12 percent transferred to a two-year public institution. Two-year private institutions were less popular transfer destinations. Among those that transferred to a two-year institution, most attended a public, two-year institution that is out-of-state. It is important to note that many multi-state, private institutions report to NSC from the main branch, which may not be where the student attended classes - which may inflate out-of-state transfer counts.
Figure 11. Fall 2008 First-Time, Degree-Seeking Students: In-State and Out-of-State “Transfer-to” Institutions by Sector and Control
16
681
2331
734
542
590
159
250
1000
2000
3000
Private Public Private Public Private
Two-Year Four-Year Less than Two Year
Out-stateIn-state
ANALYSIS OF SIX-YEAR OUTCOMES: FALL 2008 COHORT IR # 15068 Page 24
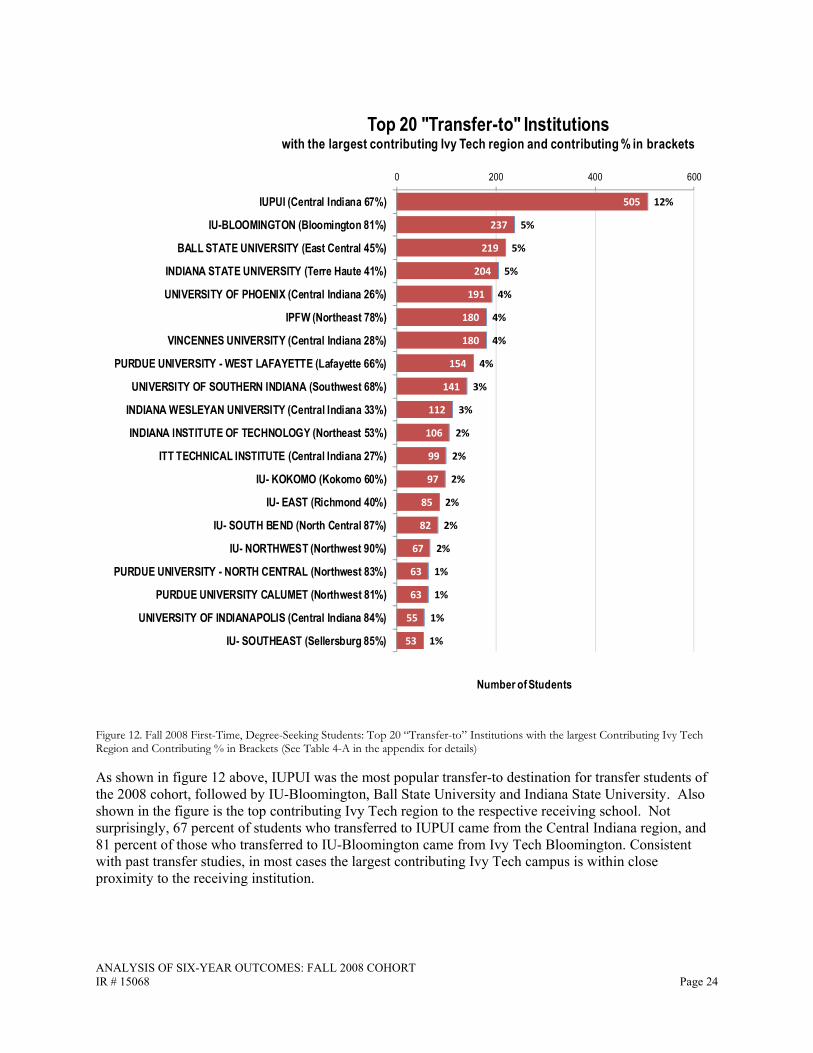
Figure 12. Fall 2008 First-Time, Degree-Seeking Students: Top 20 “Transfer-to” Institutions with the largest Contributing Ivy Tech Region and Contributing % in Brackets (See Table 4-A in the appendix for details)
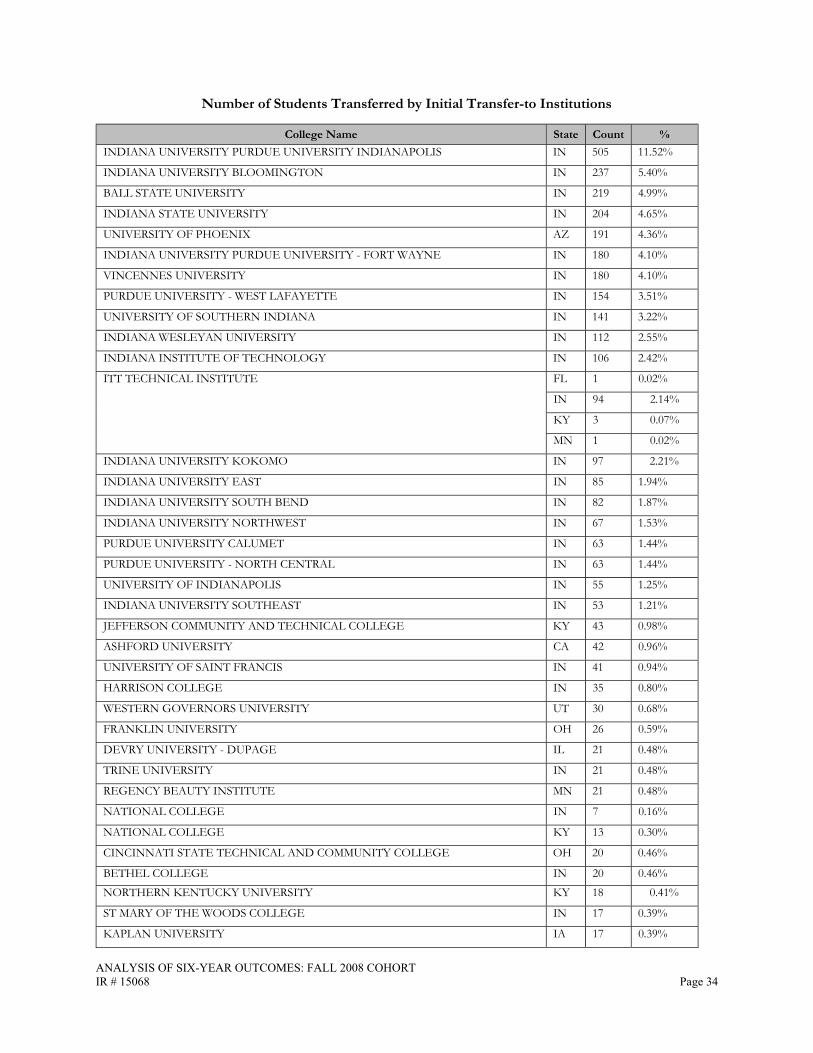
As shown in figure 12 above, IUPUI was the most popular transfer-to destination for transfer students of the 2008 cohort, followed by IU-Bloomington, Ball State University and Indiana State University. Also shown in the figure is the top contributing Ivy Tech region to the respective receiving school. Not surprisingly, 67 percent of students who transferred to IUPUI came from the Central Indiana region, and 81 percent of those who transferred to IU-Bloomington came from Ivy Tech Bloomington. Consistent with past transfer studies, in most cases the largest contributing Ivy Tech campus is within close proximity to the receiving institution.
ANALYSIS OF SIX-YEAR OUTCOMES: FALL 2008 COHORT IR # 15068 Page 25
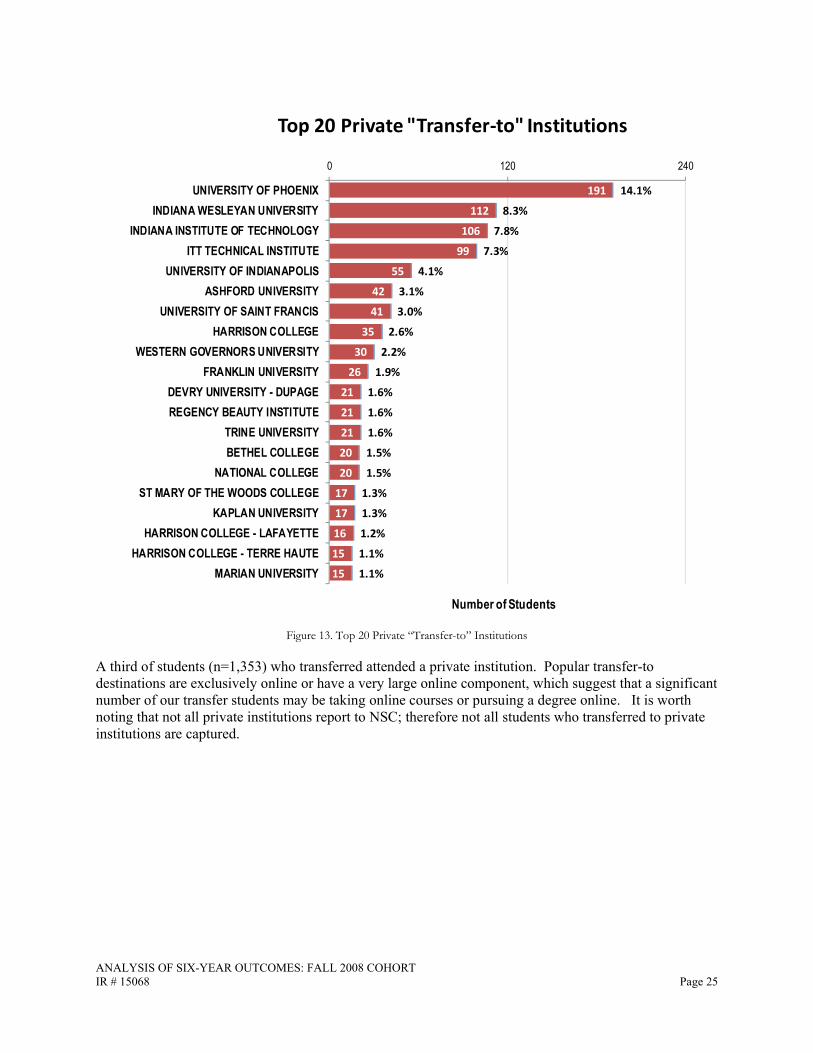
Figure 13. Top 20 Private “Transfer-to” Institutions
A third of students (n=1,353) who transferred attended a private institution. Popular transfer-to destinations are exclusively online or have a very large online component, which suggest that a significant number of our transfer students may be taking online courses or pursuing a degree online. It is worth noting that not all private institutions report to NSC; therefore not all students who transferred to private institutions are captured.
ANALYSIS OF SIX-YEAR OUTCOMES: FALL 2008 COHORT IR # 15068 Page 26
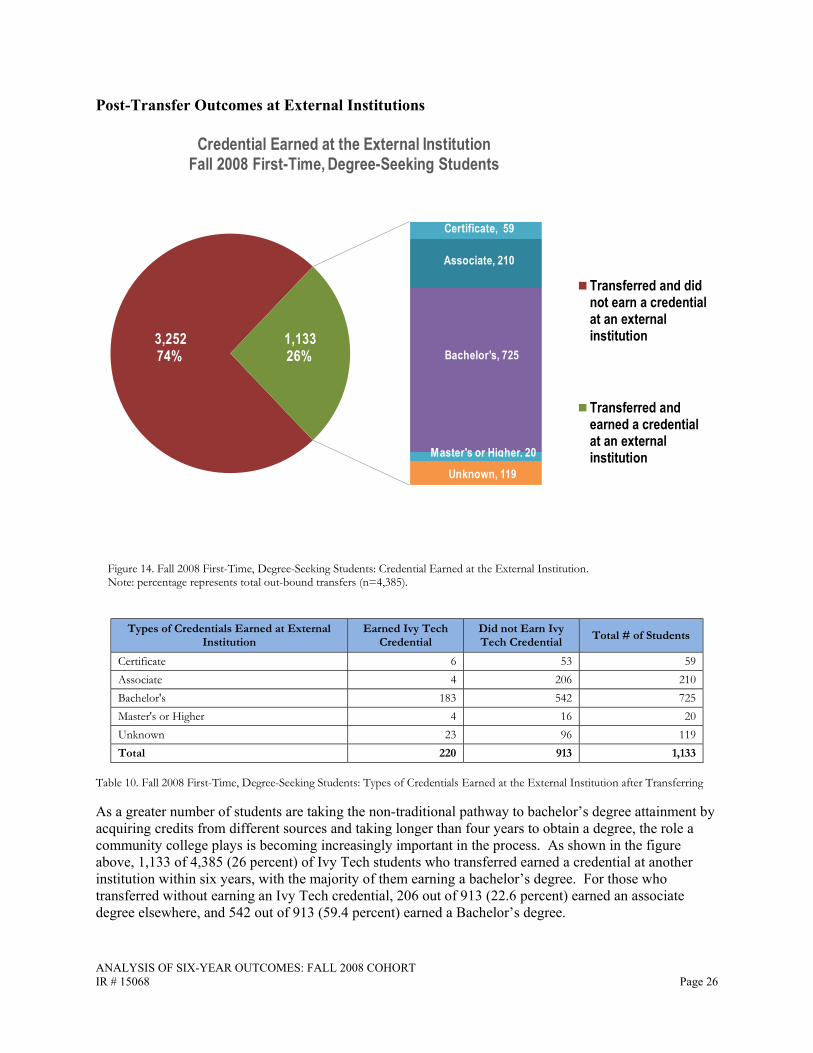
Post-Transfer Outcomes at External Institutions
Figure 14. Fall 2008 First-Time, Degree-Seeking Students: Credential Earned at the External Institution. Note: percentage represents total out-bound transfers (n=4,385).
Types of Credentials Earned at External Institution
Earned Ivy Tech Credential
Did not Earn Ivy Tech Credential Total # of Students
Certificate 6 53 59Associate 4 206 210Bachelor's 183 542 725Master's or Higher 4 16 20Unknown 23 96 119Total 220 913 1,133
Table 10. Fall 2008 First-Time, Degree-Seeking Students: Types of Credentials Earned at the External Institution after Transferring
As a greater number of students are taking the non-traditional pathway to bachelor’s degree attainment by acquiring credits from different sources and taking longer than four years to obtain a degree, the role a community college plays is becoming increasingly important in the process. As shown in the figure above, 1,133 of 4,385 (26 percent) of Ivy Tech students who transferred earned a credential at another institution within six years, with the majority of them earning a bachelor’s degree. For those who transferred without earning an Ivy Tech credential, 206 out of 913 (22.6 percent) earned an associate degree elsewhere, and 542 out of 913 (59.4 percent) earned a Bachelor’s degree.
ANALYSIS OF SIX-YEAR OUTCOMES: FALL 2008 COHORT IR # 15068 Page 27
Implications/Recommendations
In 2008, there was a 35.6 percent increase in total number of students compared to the prior year and was comprised of a greater number of older students, both of which could be driven by the economic recession. The overall success rate for the 2008 cohort dropped by 1.5 percent compared to the prior year, although much of this decrease was observed in older and part-time students. Consistent with the 2007 cohort, success rates were also lowest for African American and Hispanic students. Continuous efforts to support these student groups through programs such as Achieving the Dream (ATD) may help close the achievement gap.
One major finding from this study is that more than 3,500 students from the Fall 2008 cohort transferred without earning an Ivy Tech credential, with more than a quarter of students earning between 15.0 and 29.9 Ivy Tech credit hours. Perhaps “2+2” or “3+1” programs with partnering four-year schools and the newly established TGEC, along with transfer-orientated advising, could lead to better completion rates for Ivy Tech in future cohorts, as well as help improve success rates for Ivy Tech transfer students. In addition, more than 200 students earned 60 credit hours or more, which suggests that collaborative efforts with four-year institutions, such as reverse transfer that will allow Ivy Tech credentials to be earned retroactively, may help increase completion. Forming a stronger data-sharing relationship with partnering four-year institutions may aid these efforts.
More than half of students in the cohort were “lost” in the educational system as they did not transfer, complete a credential, or continue to be enrolled at any school at the end of the six-year period. Continued attention to strategies that re-enroll students with some college credit or prior enrollment activity may be an important way to support overall attainment of career and educational goals for these students.
Lastly, 26 percent of transfer students earned a credential at another institution within six years, with the majority earning a bachelor’s degree. This highlights the important role Ivy Tech plays in a student’s educational career.

ANALYSIS OF SIX-YEAR OUTCOMES: FALL 2008 COHORT IR # 15068 Page 28
References
Barr, A. & Turner, S. (2013). Expanding enrollments and contracting state budgets: The effect of the Great Recession on higher education. The ANNALS of the American Academy of Political and Social Science 650(1), 168-193
Hossler, D., Shapiro, D., Dundar, A., Ziskin, M., Chen, J., Zerquera, D., & Torres, V. (2012, February). Transfer & mobility: A national view of pre-degree student movement in postsecondary institutions [Signature Report 2].Reston, VA: National Student Clearinghouse Research Center and the Project on Academic Success at Indiana University. Available from http://pas.indiana.edu/pdf/Transfer & Mobility.pdf
Lin, W. (2014, August). Analysis of Six-Year Outcomes, Fall 2008 Cohort. Transfer Rates College-Wide and by Region. Available from http://ivytech.edu/institutionalresearch/2007_IPEDS_Transfer_Report_Final_9-2-2014.pdf
Shapiro, D., Dundar, A., Yuan, X., Harrell, A. & Wakhungu, P.K. (2014, November). Completing College: A National View of Student Attainment Rates – Fall 2008 Cohort [Signature Report No. 8]. Herndon, VA: National Student Clearinghouse Research Center. Available from http://nscresearchcenter.org/signaturereport8/
ANALYSIS OF SIX-YEAR OUTCOMES: FALL 2008 COHORT IR # 15068 Page 29
Appendix
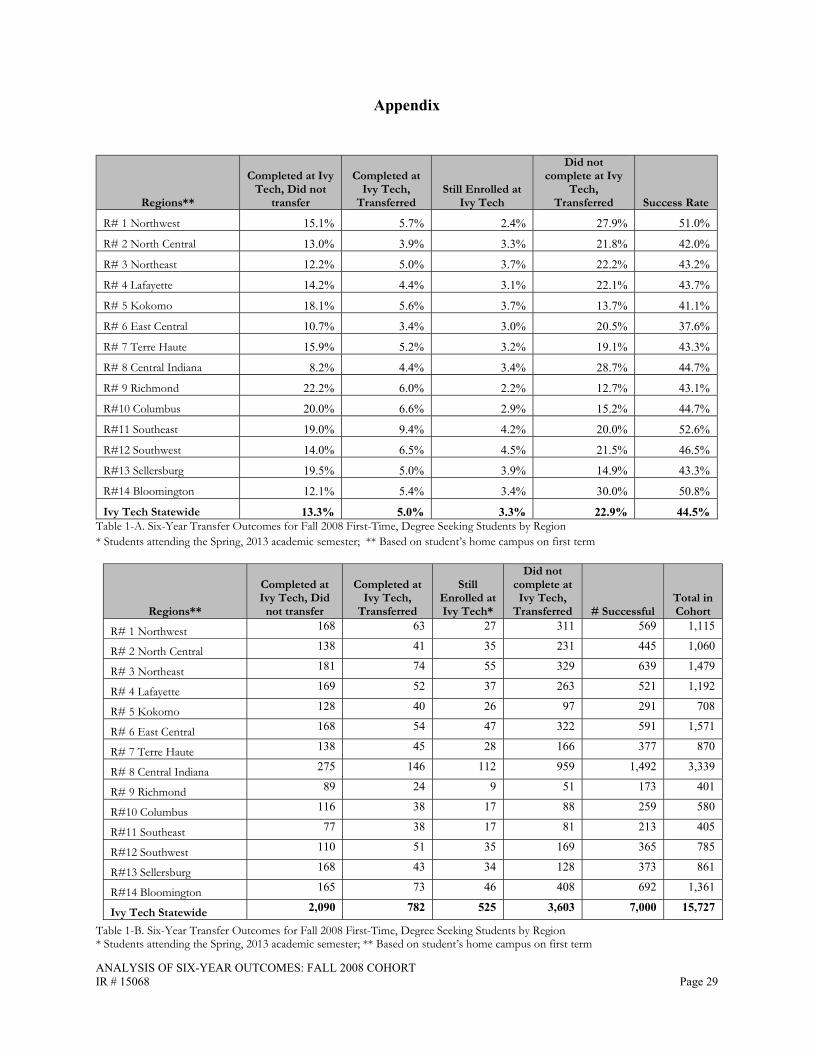
Table 1-A. Six-Year Transfer Outcomes for Fall 2008 First-Time, Degree Seeking Students by Region * Students attending the Spring, 2013 academic semester; ** Based on student’s home campus on first term
Regions**
Completed at Ivy Tech, Did
not transfer
Completed at Ivy Tech,
Transferred
Still Enrolled at Ivy Tech*
Did not complete at Ivy Tech,
Transferred # Successful Total in Cohort
R# 1 Northwest 168 63 27 311 569 1,115
R# 2 North Central 138 41 35 231 445 1,060
R# 3 Northeast 181 74 55 329 639 1,479
R# 4 Lafayette 169 52 37 263 521 1,192
R# 5 Kokomo 128 40 26 97 291 708
R# 6 East Central 168 54 47 322 591 1,571
R# 7 Terre Haute 138 45 28 166 377 870
R# 8 Central Indiana 275 146 112 959 1,492 3,339
R# 9 Richmond 89 24 9 51 173 401
R#10 Columbus 116 38 17 88 259 580
R#11 Southeast 77 38 17 81 213 405
R#12 Southwest 110 51 35 169 365 785
R#13 Sellersburg 168 43 34 128 373 861
R#14 Bloomington 165 73 46 408 692 1,361
Ivy Tech Statewide 2,090 782 525 3,603 7,000 15,727
Regions**
Completed at Ivy Tech, Did not
transfer
Completed at Ivy Tech,
Transferred Still Enrolled at
Ivy Tech
Did not complete at Ivy
Tech, Transferred Success Rate
R# 1 Northwest 15.1% 5.7% 2.4% 27.9% 51.0%
R# 2 North Central 13.0% 3.9% 3.3% 21.8% 42.0%
R# 3 Northeast 12.2% 5.0% 3.7% 22.2% 43.2%
R# 4 Lafayette 14.2% 4.4% 3.1% 22.1% 43.7%
R# 5 Kokomo 18.1% 5.6% 3.7% 13.7% 41.1%
R# 6 East Central 10.7% 3.4% 3.0% 20.5% 37.6%
R# 7 Terre Haute 15.9% 5.2% 3.2% 19.1% 43.3%
R# 8 Central Indiana 8.2% 4.4% 3.4% 28.7% 44.7%
R# 9 Richmond 22.2% 6.0% 2.2% 12.7% 43.1%
R#10 Columbus 20.0% 6.6% 2.9% 15.2% 44.7%
R#11 Southeast 19.0% 9.4% 4.2% 20.0% 52.6%
R#12 Southwest 14.0% 6.5% 4.5% 21.5% 46.5%
R#13 Sellersburg 19.5% 5.0% 3.9% 14.9% 43.3%
R#14 Bloomington 12.1% 5.4% 3.4% 30.0% 50.8%
Ivy Tech Statewide 13.3% 5.0% 3.3% 22.9% 44.5%
Table 1-B. Six-Year Transfer Outcomes for Fall 2008 First-Time, Degree Seeking Students by Region * Students attending the Spring, 2013 academic semester; ** Based on student’s home campus on first term
ANALYSIS OF SIX-YEAR OUTCOMES: FALL 2008 COHORT IR # 15068 Page 30
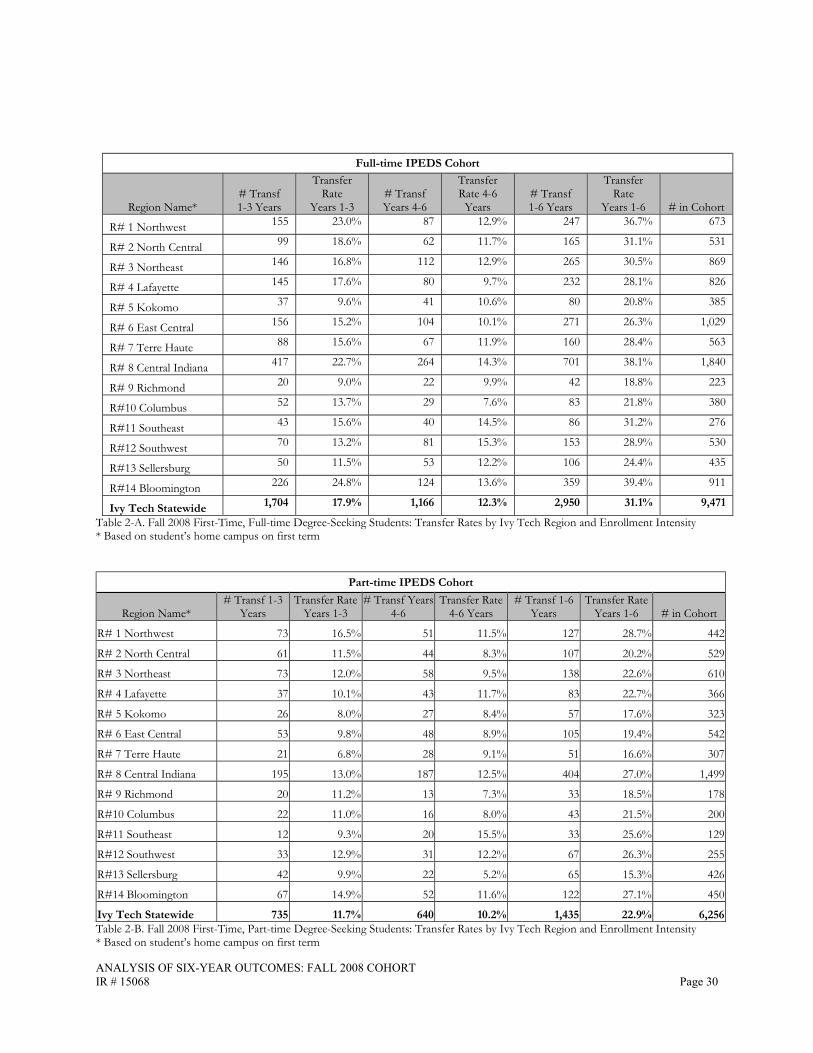
Full-time IPEDS Cohort
Region Name* # Transf 1-3 Years
Transfer Rate
Years 1-3 # Transf Years 4-6
Transfer Rate 4-6
Years # Transf 1-6 Years
Transfer Rate
Years 1-6 # in Cohort
R# 1 Northwest 155 23.0% 87 12.9% 247 36.7% 673
R# 2 North Central 99 18.6% 62 11.7% 165 31.1% 531
R# 3 Northeast 146 16.8% 112 12.9% 265 30.5% 869
R# 4 Lafayette 145 17.6% 80 9.7% 232 28.1% 826
R# 5 Kokomo 37 9.6% 41 10.6% 80 20.8% 385
R# 6 East Central 156 15.2% 104 10.1% 271 26.3% 1,029
R# 7 Terre Haute 88 15.6% 67 11.9% 160 28.4% 563
R# 8 Central Indiana 417 22.7% 264 14.3% 701 38.1% 1,840
R# 9 Richmond 20 9.0% 22 9.9% 42 18.8% 223
R#10 Columbus 52 13.7% 29 7.6% 83 21.8% 380
R#11 Southeast 43 15.6% 40 14.5% 86 31.2% 276
R#12 Southwest 70 13.2% 81 15.3% 153 28.9% 530
R#13 Sellersburg 50 11.5% 53 12.2% 106 24.4% 435
R#14 Bloomington 226 24.8% 124 13.6% 359 39.4% 911
Ivy Tech Statewide 1,704 17.9% 1,166 12.3% 2,950 31.1% 9,471Table 2-A. Fall 2008 First-Time, Full-time Degree-Seeking Students: Transfer Rates by Ivy Tech Region and Enrollment Intensity * Based on student’s home campus on first term
Part-time IPEDS Cohort
Region Name* # Transf 1-3
Years Transfer Rate
Years 1-3 # Transf Years
4-6 Transfer Rate
4-6 Years # Transf 1-6
Years Transfer Rate
Years 1-6 # in Cohort
R# 1 Northwest 73 16.5% 51 11.5% 127 28.7% 442
R# 2 North Central 61 11.5% 44 8.3% 107 20.2% 529
R# 3 Northeast 73 12.0% 58 9.5% 138 22.6% 610
R# 4 Lafayette 37 10.1% 43 11.7% 83 22.7% 366
R# 5 Kokomo 26 8.0% 27 8.4% 57 17.6% 323
R# 6 East Central 53 9.8% 48 8.9% 105 19.4% 542
R# 7 Terre Haute 21 6.8% 28 9.1% 51 16.6% 307
R# 8 Central Indiana 195 13.0% 187 12.5% 404 27.0% 1,499
R# 9 Richmond 20 11.2% 13 7.3% 33 18.5% 178
R#10 Columbus 22 11.0% 16 8.0% 43 21.5% 200
R#11 Southeast 12 9.3% 20 15.5% 33 25.6% 129
R#12 Southwest 33 12.9% 31 12.2% 67 26.3% 255
R#13 Sellersburg 42 9.9% 22 5.2% 65 15.3% 426
R#14 Bloomington 67 14.9% 52 11.6% 122 27.1% 450
Ivy Tech Statewide 735 11.7% 640 10.2% 1,435 22.9% 6,256Table 2-B. Fall 2008 First-Time, Part-time Degree-Seeking Students: Transfer Rates by Ivy Tech Region and Enrollment Intensity * Based on student’s home campus on first term
ANALYSIS OF SIX-YEAR OUTCOMES: FALL 2008 COHORT IR # 15068 Page 31
Overall IPEDS Cohort
Region* # Transf 1-3 Years
# Transf 4-6 Years
Total #Transf
# in Cohort
Transfer Rate
Years 1-3
Transfer Rate
Years 4-6
Transfer Rate
Years 1-6
R# 1 Northwest 228 138 374 1,115 20.4% 12.4% 33.5%
R# 2 North Central 160 106 272 1,060 15.1% 10.0% 25.7%
R# 3 Northeast 219 170 403 1,479 14.8% 11.5% 27.2%
R# 4 Lafayette 182 123 315 1,192 15.3% 10.3% 26.4%
R# 5 Kokomo 63 68 137 708 8.9% 9.6% 19.4%
R# 6 East Central 209 152 376 1,571 13.3% 9.7% 23.9%
R# 7 Terre Haute 109 95 211 870 12.5% 10.9% 24.3%
R# 8 Central Indiana 612 451 1,105 3,339 18.3% 13.5% 33.1%
R# 9 Richmond 40 35 75 401 10.0% 8.7% 18.7%
R#10 Columbus 74 45 126 580 12.8% 7.8% 21.7%
R#11 Southeast 55 60 119 405 13.6% 14.8% 29.4%
R#12 Southwest 103 112 220 785 13.1% 14.3% 28.0%
R#13 Sellersburg 92 75 171 861 10.7% 8.7% 19.9%
R#14 Bloomington 293 176 481 1,361 21.5% 12.9% 35.3%
Ivy Tech Statewide 2,439 1,806 4,385 15,727 15.5% 11.5% 27.9%
Table 2-C. Fall 2008 First-Time, Full- and Part-time Degree-Seeking Students: Transfer Rates by Ivy Tech Region and Enrollment Intensity * Based on student’s home campus on first term
ANALYSIS OF SIX-YEAR OUTCOMES: FALL 2008 COHORT IR # 15068 Page 32
Student Characteristics* # Transferred Total in Cohort Transfer Rate Overall Ivy Tech Statewide 4,385 15,727 27.9%Gender Female 2,593 8,793 29.5%
Male 1,792 6,934 25.8%Ethnicity Black, non-Hispanic 706 1,900 37.2%
Hispanic 130 476 27.3%
White, non-Hispanic 2,973 11,467 25.9%
Other Minorities 75 204 36.8%Age Group 15-19 1,575 4,553 34.6%
20-24 1,814 6,176 29.4%
25-34 636 2,870 22.2%
35-49 312 1,715 18.2%
50+ 42 380 11.1%Enrollment Status Full-Time 2,950 9,471 31.1%
Part-Time 1,435 6,256 22.9%Type Degree Sought AA 57 142 40.1%
AAS 1,419 6,318 22.5%
AFA 14 39 35.9%
AS 2,728 8,211 33.2%
CT 25 237 10.5%
TC 142 780 18.2%Ivy Tech School School of Applied Science and Engineering
Technology 48 147 32.7%
School of Business 632 2,427 26.0%
School of Education 280 787 35.6%
School of Fine Arts and Design 77 267 28.8%
School of Health Sciences 207 939 22.0%
School of Liberal Arts and Sciences 1,179 2,982 39.5%
School of Nursing 62 193 32.1%
School of Public and Social Services 406 1,453 27.9%
School of Technology 309 2,185 14.1%
Undecided 1,185 4,347 27.3%Cumulative GPA 0 to 1.99 1,220 5,456 22.4%
2 to 2.99 1,211 3,912 31.0%
3 to 3.99 1,450 4,231 34.3%
4.00 170 638 26.6%Cumulative Ivy Tech Credit Hours Earned 0 369 1,859 19.8%
0.1 to 14.9 967 4,108 23.5%
15.0 to 29.9 943 3,019 31.2%
30 to 44.9 595 1,735 34.3%
45 to 59.9 395 1,215 32.5%
60.0 or more 969 3,167 30.6%
ANALYSIS OF SIX-YEAR OUTCOMES: FALL 2008 COHORT IR # 15068 Page 33
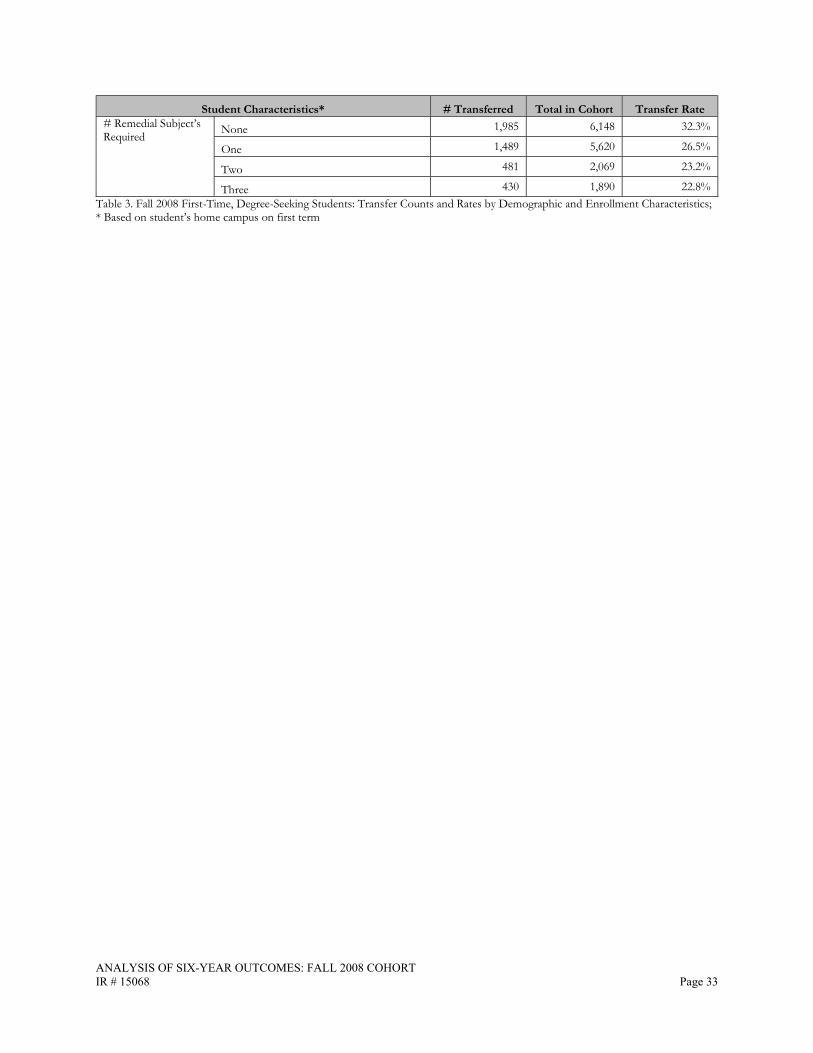
Student Characteristics* # Transferred Total in Cohort Transfer Rate # Remedial Subject’s Required None 1,985 6,148 32.3%
One 1,489 5,620 26.5%
Two 481 2,069 23.2%
Three 430 1,890 22.8%Table 3. Fall 2008 First-Time, Degree-Seeking Students: Transfer Counts and Rates by Demographic and Enrollment Characteristics; * Based on student’s home campus on first term
ANALYSIS OF SIX-YEAR OUTCOMES: FALL 2008 COHORT IR # 15068 Page 34
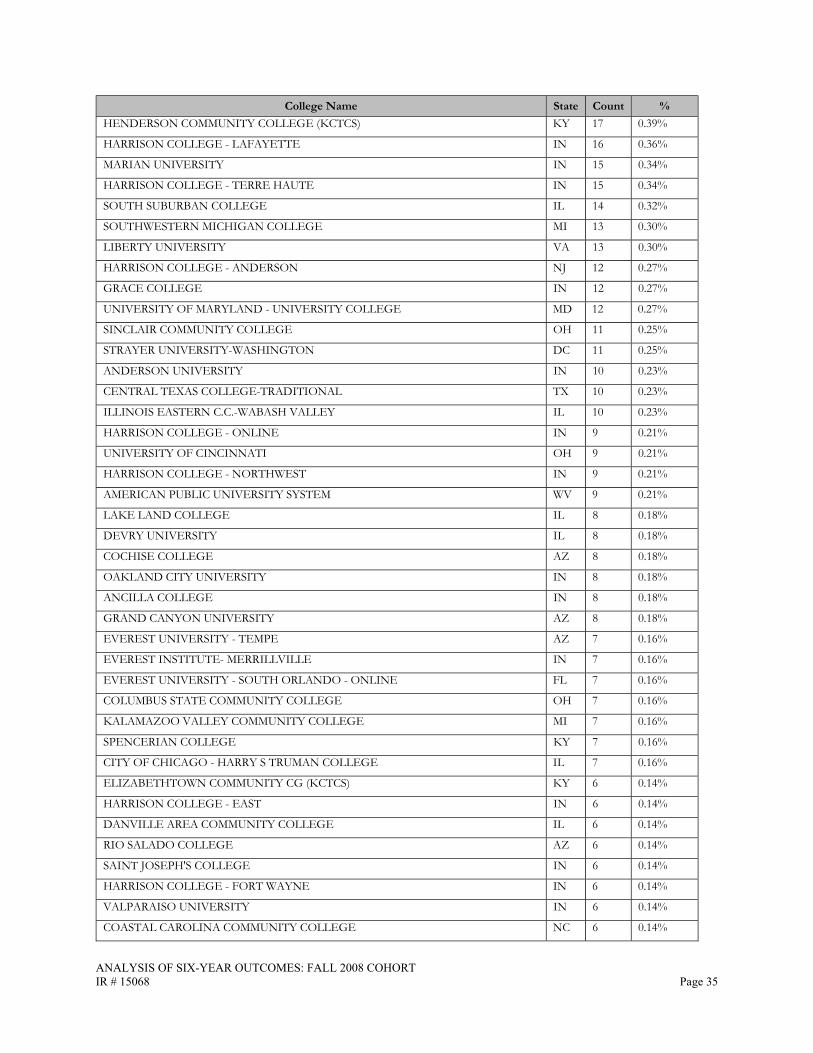
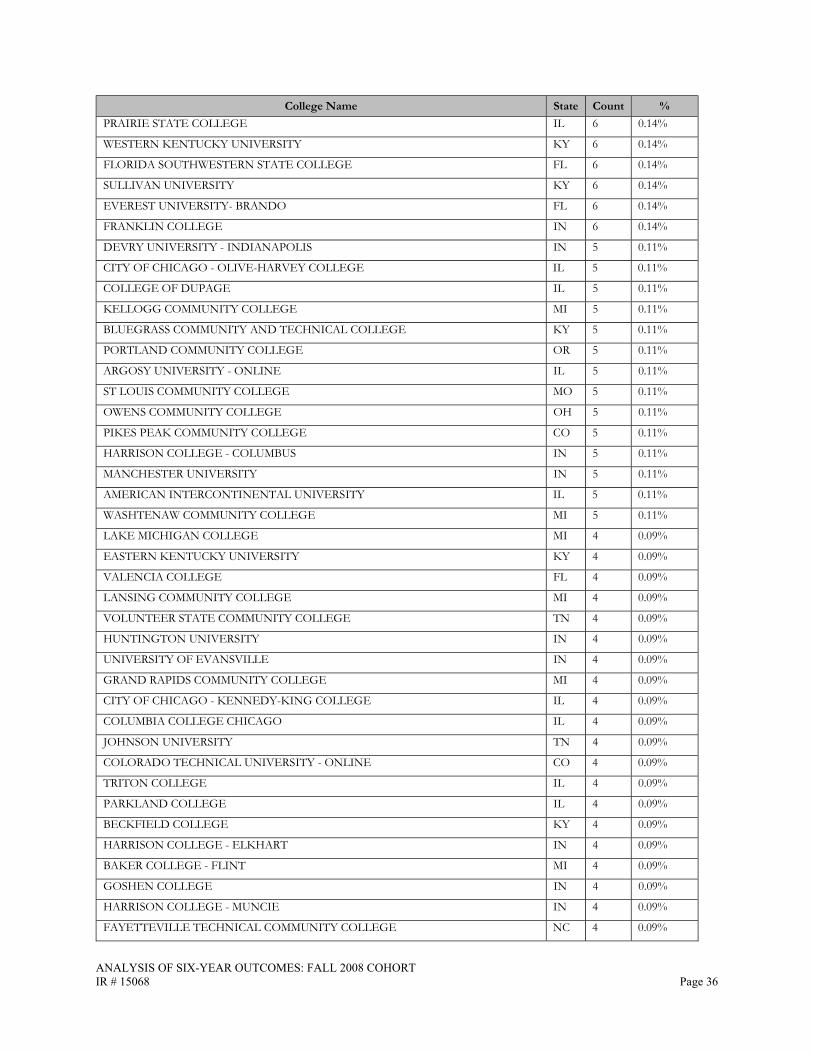
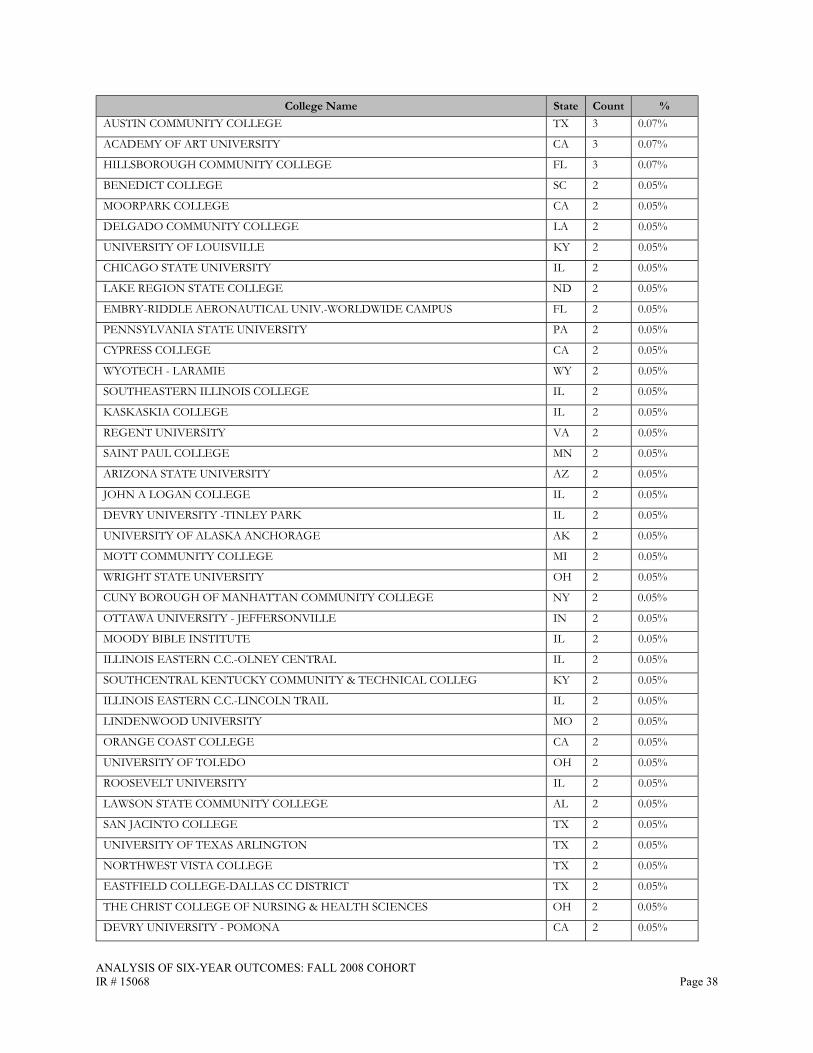
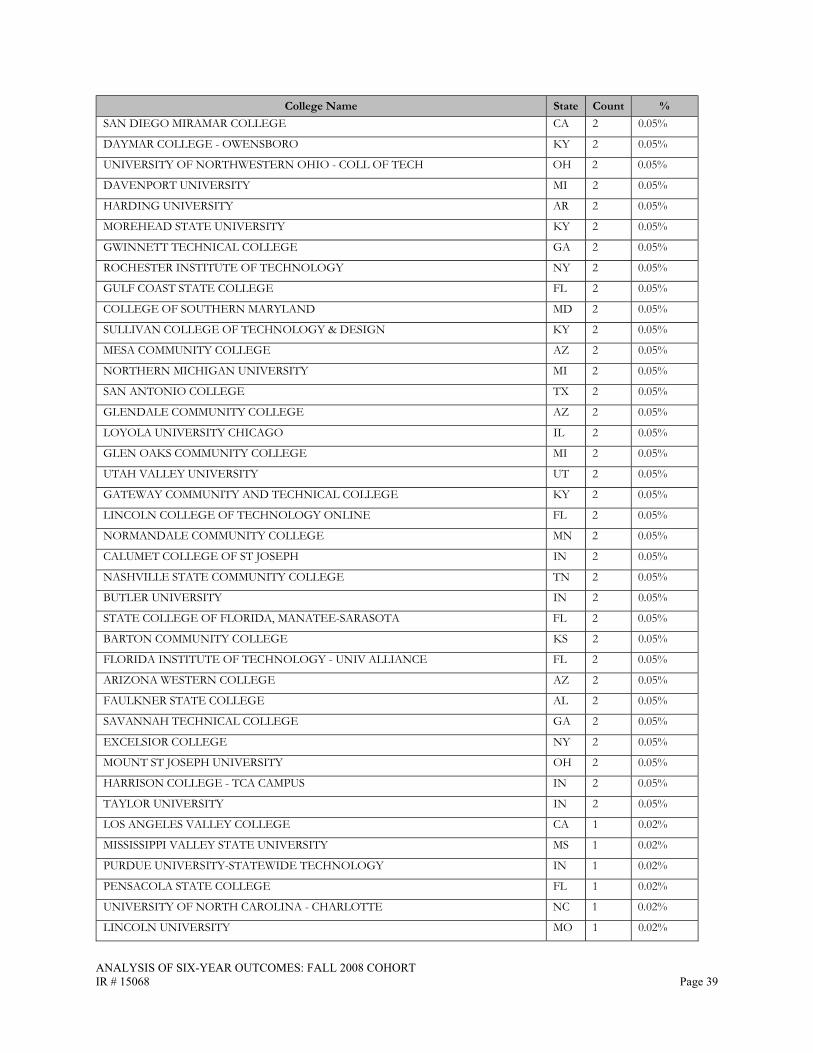
Number of Students Transferred by Initial Transfer-to Institutions
College Name State Count % INDIANA UNIVERSITY PURDUE UNIVERSITY INDIANAPOLIS IN 505 11.52%
INDIANA UNIVERSITY BLOOMINGTON IN 237 5.40%
BALL STATE UNIVERSITY IN 219 4.99%
INDIANA STATE UNIVERSITY IN 204 4.65%
UNIVERSITY OF PHOENIX AZ 191 4.36%
INDIANA UNIVERSITY PURDUE UNIVERSITY - FORT WAYNE IN 180 4.10%
VINCENNES UNIVERSITY IN 180 4.10%
PURDUE UNIVERSITY - WEST LAFAYETTE IN 154 3.51%
UNIVERSITY OF SOUTHERN INDIANA IN 141 3.22%
INDIANA WESLEYAN UNIVERSITY IN 112 2.55%
INDIANA INSTITUTE OF TECHNOLOGY IN 106 2.42%
ITT TECHNICAL INSTITUTE FL 1 0.02%
IN 94 2.14%
KY 3 0.07%
MN 1 0.02%
INDIANA UNIVERSITY KOKOMO IN 97 2.21%
INDIANA UNIVERSITY EAST IN 85 1.94%
INDIANA UNIVERSITY SOUTH BEND IN 82 1.87%
INDIANA UNIVERSITY NORTHWEST IN 67 1.53%
PURDUE UNIVERSITY CALUMET IN 63 1.44%
PURDUE UNIVERSITY - NORTH CENTRAL IN 63 1.44%
UNIVERSITY OF INDIANAPOLIS IN 55 1.25%
INDIANA UNIVERSITY SOUTHEAST IN 53 1.21%
JEFFERSON COMMUNITY AND TECHNICAL COLLEGE KY 43 0.98%
ASHFORD UNIVERSITY CA 42 0.96%
UNIVERSITY OF SAINT FRANCIS IN 41 0.94%
HARRISON COLLEGE IN 35 0.80%
WESTERN GOVERNORS UNIVERSITY UT 30 0.68%
FRANKLIN UNIVERSITY OH 26 0.59%
DEVRY UNIVERSITY - DUPAGE IL 21 0.48%
TRINE UNIVERSITY IN 21 0.48%
REGENCY BEAUTY INSTITUTE MN 21 0.48%
NATIONAL COLLEGE IN 7 0.16%
NATIONAL COLLEGE KY 13 0.30%
CINCINNATI STATE TECHNICAL AND COMMUNITY COLLEGE OH 20 0.46%
BETHEL COLLEGE IN 20 0.46% NORTHERN KENTUCKY UNIVERSITY KY 18 0.41%
ST MARY OF THE WOODS COLLEGE IN 17 0.39%
KAPLAN UNIVERSITY IA 17 0.39%
ANALYSIS OF SIX-YEAR OUTCOMES: FALL 2008 COHORT IR # 15068 Page 35
College Name State Count % HENDERSON COMMUNITY COLLEGE (KCTCS) KY 17 0.39%
HARRISON COLLEGE - LAFAYETTE IN 16 0.36%
MARIAN UNIVERSITY IN 15 0.34%
HARRISON COLLEGE - TERRE HAUTE IN 15 0.34%
SOUTH SUBURBAN COLLEGE IL 14 0.32%
SOUTHWESTERN MICHIGAN COLLEGE MI 13 0.30%
LIBERTY UNIVERSITY VA 13 0.30%
HARRISON COLLEGE - ANDERSON NJ 12 0.27%
GRACE COLLEGE IN 12 0.27%
UNIVERSITY OF MARYLAND - UNIVERSITY COLLEGE MD 12 0.27%
SINCLAIR COMMUNITY COLLEGE OH 11 0.25%
STRAYER UNIVERSITY-WASHINGTON DC 11 0.25%
ANDERSON UNIVERSITY IN 10 0.23%
CENTRAL TEXAS COLLEGE-TRADITIONAL TX 10 0.23%
ILLINOIS EASTERN C.C.-WABASH VALLEY IL 10 0.23%
HARRISON COLLEGE - ONLINE IN 9 0.21%
UNIVERSITY OF CINCINNATI OH 9 0.21%
HARRISON COLLEGE - NORTHWEST IN 9 0.21%
AMERICAN PUBLIC UNIVERSITY SYSTEM WV 9 0.21%
LAKE LAND COLLEGE IL 8 0.18%
DEVRY UNIVERSITY IL 8 0.18%
COCHISE COLLEGE AZ 8 0.18%
OAKLAND CITY UNIVERSITY IN 8 0.18%
ANCILLA COLLEGE IN 8 0.18%
GRAND CANYON UNIVERSITY AZ 8 0.18%
EVEREST UNIVERSITY - TEMPE AZ 7 0.16%
EVEREST INSTITUTE- MERRILLVILLE IN 7 0.16%
EVEREST UNIVERSITY - SOUTH ORLANDO - ONLINE FL 7 0.16%
COLUMBUS STATE COMMUNITY COLLEGE OH 7 0.16%
KALAMAZOO VALLEY COMMUNITY COLLEGE MI 7 0.16%
SPENCERIAN COLLEGE KY 7 0.16%
CITY OF CHICAGO - HARRY S TRUMAN COLLEGE IL 7 0.16%
ELIZABETHTOWN COMMUNITY CG (KCTCS) KY 6 0.14%
HARRISON COLLEGE - EAST IN 6 0.14%
DANVILLE AREA COMMUNITY COLLEGE IL 6 0.14%
RIO SALADO COLLEGE AZ 6 0.14%
SAINT JOSEPH'S COLLEGE IN 6 0.14%
HARRISON COLLEGE - FORT WAYNE IN 6 0.14%
VALPARAISO UNIVERSITY IN 6 0.14%
COASTAL CAROLINA COMMUNITY COLLEGE NC 6 0.14%
ANALYSIS OF SIX-YEAR OUTCOMES: FALL 2008 COHORT IR # 15068 Page 36
College Name State Count % PRAIRIE STATE COLLEGE IL 6 0.14%
WESTERN KENTUCKY UNIVERSITY KY 6 0.14%
FLORIDA SOUTHWESTERN STATE COLLEGE FL 6 0.14%
SULLIVAN UNIVERSITY KY 6 0.14%
EVEREST UNIVERSITY- BRANDO FL 6 0.14%
FRANKLIN COLLEGE IN 6 0.14%
DEVRY UNIVERSITY - INDIANAPOLIS IN 5 0.11%
CITY OF CHICAGO - OLIVE-HARVEY COLLEGE IL 5 0.11%
COLLEGE OF DUPAGE IL 5 0.11%
KELLOGG COMMUNITY COLLEGE MI 5 0.11%
BLUEGRASS COMMUNITY AND TECHNICAL COLLEGE KY 5 0.11%
PORTLAND COMMUNITY COLLEGE OR 5 0.11%
ARGOSY UNIVERSITY - ONLINE IL 5 0.11%
ST LOUIS COMMUNITY COLLEGE MO 5 0.11%
OWENS COMMUNITY COLLEGE OH 5 0.11%
PIKES PEAK COMMUNITY COLLEGE CO 5 0.11%
HARRISON COLLEGE - COLUMBUS IN 5 0.11%
MANCHESTER UNIVERSITY IN 5 0.11%
AMERICAN INTERCONTINENTAL UNIVERSITY IL 5 0.11%
WASHTENAW COMMUNITY COLLEGE MI 5 0.11%
LAKE MICHIGAN COLLEGE MI 4 0.09%
EASTERN KENTUCKY UNIVERSITY KY 4 0.09%
VALENCIA COLLEGE FL 4 0.09%
LANSING COMMUNITY COLLEGE MI 4 0.09%
VOLUNTEER STATE COMMUNITY COLLEGE TN 4 0.09%
HUNTINGTON UNIVERSITY IN 4 0.09%
UNIVERSITY OF EVANSVILLE IN 4 0.09%
GRAND RAPIDS COMMUNITY COLLEGE MI 4 0.09%
CITY OF CHICAGO - KENNEDY-KING COLLEGE IL 4 0.09%
COLUMBIA COLLEGE CHICAGO IL 4 0.09%
JOHNSON UNIVERSITY TN 4 0.09%
COLORADO TECHNICAL UNIVERSITY - ONLINE CO 4 0.09%
TRITON COLLEGE IL 4 0.09%
PARKLAND COLLEGE IL 4 0.09%
BECKFIELD COLLEGE KY 4 0.09%
HARRISON COLLEGE - ELKHART IN 4 0.09%
BAKER COLLEGE - FLINT MI 4 0.09%
GOSHEN COLLEGE IN 4 0.09%
HARRISON COLLEGE - MUNCIE IN 4 0.09%
FAYETTEVILLE TECHNICAL COMMUNITY COLLEGE NC 4 0.09%

ANALYSIS OF SIX-YEAR OUTCOMES: FALL 2008 COHORT IR # 15068 Page 37
College Name State Count % NORTHERN VIRGINIA COMMUNITY COLLEGE VA 4 0.09%
HARRISON COLLEGE - EVANSVILLE IN 4 0.09%
HOUSTON COMMUNITY COLLEGE TX 4 0.09%
HOLY CROSS COLLEGE IN 4 0.09%
KENTUCKY STATE UNIVERSITY KY 4 0.09%
CHAMBERLAIN COLLEGE OF NURSING IL 3 0.07%
DAYMAR COLLEGE - ONLINE KY 3 0.07%
GOOD SAMARITAN COLLEGE OF NURSING OH 3 0.07%
ROBERT MORRIS UNIVERSITY IL 2 0.05%
ROBERT MORRIS UNIVERSITY PA 1 0.02%
SOUTHERN NEW HAMPSHIRE- 09WEEK NH 3 0.07%
OWENSBORO COMMUNITY AND TECHNICAL COLLEGE KY 3 0.07%
CALHOUN COMMUNITY COLLEGE AL 3 0.07%
OAKLAND COMMUNITY COLLEGE MI 3 0.07%
WAKE TECHNICAL COMMUNITY COLLEGE NC 3 0.07%
MORAINE VALLEY COMMUNITY COLLEGE IL 3 0.07%
COLUMBIA COLLEGE ADULT8WK UNDERGRAD MO 3 0.07%
MADISON AREA TECHNICAL COLLEGE WI 3 0.07%
CITY OF CHICAGO - MALCOLM X COLLEGE IL 3 0.07%
LONE STAR COLLEGE SYSTEM DISTRICT TX 3 0.07%
CAPELLA UNIVERSITY MN 3 0.07%
WEST KENTUCKY COMMUNITY & TECHNICAL COLLEGE KY 3 0.07%
TARRANT COUNTY COLLEGE TX 3 0.07%
LE CORDON BLEU COLLEGE OF CULINARY ARTS IN PORTLND OR 3 0.07%
FRONT RANGE COMMUNITY COLLEGE CO 3 0.07%
LATTER-DAY SAINTS BUSINESS COLLEGE UT 3 0.07%
EVEREST UNIVERSITY - COLORADO SPRINGS (ONLINE) FL 3 0.07%
KIRKWOOD COMMUNITY COLLEGE IA 3 0.07%
CUYAHOGA COMMUNITY COLLEGE OH 3 0.07%
KENT STATE UNIVERSITY OH 3 0.07%
COLLEGE OF SOUTHERN NEVADA NV 3 0.07%
JOHNSON COUNTY COMMUNITY COLLEGE KS 3 0.07%
SOUTHERN BAPTIST THEOLOGICAL SEMINARY KY 3 0.07%
WAUBONSEE COMMUNITY COLLEGE IL 3 0.07%
CITY OF CHICAGO - HAROLD WASHINGTON COLLEGE IL 3 0.07%
TRIDENT TECHNICAL COLLEGE SC 3 0.07%
CASPER COLLEGE WY 3 0.07%
TIDEWATER COMMUNITY COLLEGE VA 3 0.07%
CAMPBELLSVILLE UNIVERSITY KY 3 0.07%
HOPKINSVILLE COMMUNITY COLLEGE (KCTCS) KY 3 0.07%
ANALYSIS OF SIX-YEAR OUTCOMES: FALL 2008 COHORT IR # 15068 Page 38
College Name State Count % AUSTIN COMMUNITY COLLEGE TX 3 0.07%
ACADEMY OF ART UNIVERSITY CA 3 0.07%
HILLSBOROUGH COMMUNITY COLLEGE FL 3 0.07%
BENEDICT COLLEGE SC 2 0.05%
MOORPARK COLLEGE CA 2 0.05%
DELGADO COMMUNITY COLLEGE LA 2 0.05%
UNIVERSITY OF LOUISVILLE KY 2 0.05%
CHICAGO STATE UNIVERSITY IL 2 0.05%
LAKE REGION STATE COLLEGE ND 2 0.05%
EMBRY-RIDDLE AERONAUTICAL UNIV.-WORLDWIDE CAMPUS FL 2 0.05%
PENNSYLVANIA STATE UNIVERSITY PA 2 0.05%
CYPRESS COLLEGE CA 2 0.05%
WYOTECH - LARAMIE WY 2 0.05%
SOUTHEASTERN ILLINOIS COLLEGE IL 2 0.05%
KASKASKIA COLLEGE IL 2 0.05%
REGENT UNIVERSITY VA 2 0.05%
SAINT PAUL COLLEGE MN 2 0.05%
ARIZONA STATE UNIVERSITY AZ 2 0.05%
JOHN A LOGAN COLLEGE IL 2 0.05%
DEVRY UNIVERSITY -TINLEY PARK IL 2 0.05%
UNIVERSITY OF ALASKA ANCHORAGE AK 2 0.05%
MOTT COMMUNITY COLLEGE MI 2 0.05%
WRIGHT STATE UNIVERSITY OH 2 0.05%
CUNY BOROUGH OF MANHATTAN COMMUNITY COLLEGE NY 2 0.05%
OTTAWA UNIVERSITY - JEFFERSONVILLE IN 2 0.05%
MOODY BIBLE INSTITUTE IL 2 0.05%
ILLINOIS EASTERN C.C.-OLNEY CENTRAL IL 2 0.05%
SOUTHCENTRAL KENTUCKY COMMUNITY & TECHNICAL COLLEG KY 2 0.05%
ILLINOIS EASTERN C.C.-LINCOLN TRAIL IL 2 0.05%
LINDENWOOD UNIVERSITY MO 2 0.05%
ORANGE COAST COLLEGE CA 2 0.05%
UNIVERSITY OF TOLEDO OH 2 0.05%
ROOSEVELT UNIVERSITY IL 2 0.05%
LAWSON STATE COMMUNITY COLLEGE AL 2 0.05%
SAN JACINTO COLLEGE TX 2 0.05%
UNIVERSITY OF TEXAS ARLINGTON TX 2 0.05%
NORTHWEST VISTA COLLEGE TX 2 0.05%
EASTFIELD COLLEGE-DALLAS CC DISTRICT TX 2 0.05%
THE CHRIST COLLEGE OF NURSING & HEALTH SCIENCES OH 2 0.05%
DEVRY UNIVERSITY - POMONA CA 2 0.05%
ANALYSIS OF SIX-YEAR OUTCOMES: FALL 2008 COHORT IR # 15068 Page 39
College Name State Count % SAN DIEGO MIRAMAR COLLEGE CA 2 0.05%
DAYMAR COLLEGE - OWENSBORO KY 2 0.05%
UNIVERSITY OF NORTHWESTERN OHIO - COLL OF TECH OH 2 0.05%
DAVENPORT UNIVERSITY MI 2 0.05%
HARDING UNIVERSITY AR 2 0.05%
MOREHEAD STATE UNIVERSITY KY 2 0.05%
GWINNETT TECHNICAL COLLEGE GA 2 0.05%
ROCHESTER INSTITUTE OF TECHNOLOGY NY 2 0.05%
GULF COAST STATE COLLEGE FL 2 0.05%
COLLEGE OF SOUTHERN MARYLAND MD 2 0.05%
SULLIVAN COLLEGE OF TECHNOLOGY & DESIGN KY 2 0.05%
MESA COMMUNITY COLLEGE AZ 2 0.05%
NORTHERN MICHIGAN UNIVERSITY MI 2 0.05%
SAN ANTONIO COLLEGE TX 2 0.05%
GLENDALE COMMUNITY COLLEGE AZ 2 0.05%
LOYOLA UNIVERSITY CHICAGO IL 2 0.05%
GLEN OAKS COMMUNITY COLLEGE MI 2 0.05%
UTAH VALLEY UNIVERSITY UT 2 0.05%
GATEWAY COMMUNITY AND TECHNICAL COLLEGE KY 2 0.05%
LINCOLN COLLEGE OF TECHNOLOGY ONLINE FL 2 0.05%
NORMANDALE COMMUNITY COLLEGE MN 2 0.05%
CALUMET COLLEGE OF ST JOSEPH IN 2 0.05%
NASHVILLE STATE COMMUNITY COLLEGE TN 2 0.05%
BUTLER UNIVERSITY IN 2 0.05%
STATE COLLEGE OF FLORIDA, MANATEE-SARASOTA FL 2 0.05%
BARTON COMMUNITY COLLEGE KS 2 0.05%
FLORIDA INSTITUTE OF TECHNOLOGY - UNIV ALLIANCE FL 2 0.05%
ARIZONA WESTERN COLLEGE AZ 2 0.05%
FAULKNER STATE COLLEGE AL 2 0.05%
SAVANNAH TECHNICAL COLLEGE GA 2 0.05%
EXCELSIOR COLLEGE NY 2 0.05%
MOUNT ST JOSEPH UNIVERSITY OH 2 0.05%
HARRISON COLLEGE - TCA CAMPUS IN 2 0.05%
TAYLOR UNIVERSITY IN 2 0.05%
LOS ANGELES VALLEY COLLEGE CA 1 0.02%
MISSISSIPPI VALLEY STATE UNIVERSITY MS 1 0.02%
PURDUE UNIVERSITY-STATEWIDE TECHNOLOGY IN 1 0.02%
PENSACOLA STATE COLLEGE FL 1 0.02%
UNIVERSITY OF NORTH CAROLINA - CHARLOTTE NC 1 0.02%
LINCOLN UNIVERSITY MO 1 0.02%
ANALYSIS OF SIX-YEAR OUTCOMES: FALL 2008 COHORT IR # 15068 Page 40
College Name State Count % UNIVERSITY OF NORTH CAROLINA-WILMINGTON NC 1 0.02%
LINCOLN LAND COMMUNITY COLLEGE IL 1 0.02%
UNIVERSITY OF THE DISTRICT OF COLUMBIA DC 1 0.02%
SAM HOUSTON STATE UNIVERSITY TX 1 0.02%
CENTRAL COMMUNITY COLLEGE-HASTINGS NE 1 0.02%
PENINSULA COLLEGE WA 1 0.02%
BELLARMINE UNIVERSITY KY 1 0.02%
LEWIS & CLARK COMMUNITY COLLEGE IL 1 0.02%
NEW MEXICO STATE UNIVERSITY-MAIN NM 1 0.02%
LEE UNIVERSITY TN 1 0.02%
DEPAUW UNIVERSITY IN 1 0.02%
PELLISSIPPI STATE COMMUNITY COLLEGE TN 1 0.02%
COUNTY COLLEGE OF MORRIS NJ 1 0.02%
ROCK VALLEY COLLEGE IL 1 0.02%
PRINCE GEORGES COMMUNITY COLLEGE MD 1 0.02%
PALMER COLLEGE OF CHIROPRACTIC IA 1 0.02%
MINOT STATE UNIVERSITY ND 1 0.02%
LARAMIE COUNTY COMMUNITY COLLEGE WY 1 0.02%
METROPOLITAN COMMUNITY COLLEGE MO 1 0.02%
SALT LAKE COMMUNITY COLLEGE UT 1 0.02%
SOUTH CENTRAL LOUISIANA TECHNICAL COLLEGE LA 1 0.02%
LANDMARK COLLEGE VT 1 0.02%
MACOMB COMMUNITY COLLEGE MI 1 0.02%
LAKELAND COMMUNITY COLLEGE OH 1 0.02%
LORAIN COUNTY COMMUNITY COLLEGE OH 1 0.02%
SAN BERNARDINO VALLEY COLLEGE CA 1 0.02%
SPRINGFIELD COLLEGE MA 1 0.02%
UNIVERSITY OF KENTUCKY KY 1 0.02%
SPALDING UNIVERSITY KY 1 0.02%
UNIVERSITY OF KANSAS KS 1 0.02%
DAYTONA STATE COLLEGE FL 1 0.02%
LAKE FOREST COLLEGE IL 1 0.02%
CUNY LAGUARDIA COMMUNITY COLLEGE NY 1 0.02%
RIVERSIDE COMMUNITY COLLEGE CA 1 0.02%
COMMUNITY COLLEGE OF DENVER CO 1 0.02%
XAVIER UNIVERSITY OF LOUISIANA LA 1 0.02%
COLORADO MOUNTAIN COLLEGE CO 1 0.02%
SAINT LEO UNIVERSITY FL 1 0.02%
SOUTHWEST GEORGIA TECHNICAL COLLEGE GA 1 0.02%
KENNESAW STATE UNIVERSITY GA 1 0.02%
ANALYSIS OF SIX-YEAR OUTCOMES: FALL 2008 COHORT IR # 15068 Page 41
College Name State Count % CITY UNIVERSITY OF SEATTLE WA 1 0.02%
KENDALL COLLEGE IL 1 0.02%
CHICAGO SCHOOL OF PROFESSIONAL PSYCHOLOGY IL 1 0.02%
WAYNE COUNTY COMMUNITY COLLEGE MI 1 0.02%
MIDDLE TENNESSEE STATE UNIVERSITY TN 1 0.02%
OLYMPIC COLLEGE WA 1 0.02%
CALIFORNIA STATE UNIVERSITY - SAN MARCOS CA 1 0.02%
UNIVERSITY OF HAWAII AT MANOA HI 1 0.02%
BRIGHAM YOUNG UNIVERSITY -IDAHO WINTER/SPRING ID 1 0.02%
KANSAS CITY ART INSTITUTE MO 1 0.02%
BEREA COLLEGE KY 1 0.02%
UNIVERSITY OF FINDLAY OH 1 0.02%
VALLEY FORGE MILITARY COLLEGE PA 1 0.02%
JOLIET JUNIOR COLLEGE IL 1 0.02%
SEATTLE CENTRAL COMMUNITY COLLEGE WA 1 0.02%
WAYNE COMMUNITY COLLEGE NC 1 0.02%
ANDREWS UNIVERSITY MI 1 0.02%
OLIVET NAZARENE UNIVERSITY UG IL 1 0.02%
ALABAMA SOUTHERN COMMUNITY COLLEGE AL 1 0.02%
OKLAHOMA CITY COMMUNITY COLLEGE OK 1 0.02%
EDISON STATE COMMUNITY COLLEGE OH 1 0.02%
JEFFERSON STATE COMMUNITY COLLEGE AL 1 0.02%
EAST MISSISSIPPI COMMUNITY COLLEGE MS 1 0.02%
WAYLAND BAPTIST UNIVERSITY-EXTERNAL CAMPUS TX 1 0.02%
RARITAN VALLEY COMMUNITY COLLEGE NJ 1 0.02%
JACKSONVILLE UNIVERSITY FL 1 0.02%
WICHITA AREA TECHNICAL COLLEGE KS 1 0.02%
JACKSON COLLEGE MI 1 0.02%
MUSICIANS INSTITUTE CA 1 0.02%
UNIVERSITY OF ARKANSAS COMMUNITY COLLEGE AT HOPE AR 1 0.02%
MT. SAN JACINTO COLLEGE CA 1 0.02%
IOWA CENTRAL COMMUNITY COLLEGE IA 1 0.02%
UNIVERSITY OF WISCONSIN - STEVENS POINT WI 1 0.02%
OKLAHOMA BAPTIST UNIVERSITY OK 1 0.02%
CRAVEN COMMUNITY COLLEGE NC 1 0.02%
UNIVERSITY OF ALASKA - SOUTHEAST AK 1 0.02%
COPIAH-LINCOLN COMMUNITY COLLEGE MS 1 0.02%
UNIVERSITY OF ALASKA - FAIRBANKS AK 1 0.02%
COLUMBIA STATE COMMUNITY COLLEGE TN 1 0.02%
UNIVERSITY OF AKRON OH 1 0.02%
ANALYSIS OF SIX-YEAR OUTCOMES: FALL 2008 COHORT IR # 15068 Page 42
College Name State Count % COLORADO TECHNICAL UNIVERSITY CO 1 0.02%
UNIVERSITY OF ADVANCING TECHNOLOGY AZ 1 0.02%
COLLIN COUNTY COMMUNITY COLLEGE TX 1 0.02%
UNITY COLLEGE ME 1 0.02%
COLLEGE OF MARIN CA 1 0.02%
UNION INSTITUTE AND UNIVERSITY OH 1 0.02%
COCONINO COMMUNITY COLLEGE AZ 1 0.02%
TULSA COMMUNITY COLLEGE OK 1 0.02%
CLEVELAND STATE UNIVERSITY OH 1 0.02%
OHLONE COLLEGE CA 1 0.02%
MISSISSIPPI GULF COAST COMMUNITY COL - PERKINSTON MS 1 0.02%
TRINIDAD STATE JUNIOR COLLEGE CO 1 0.02%
WHATCOM COMMUNITY COLLEGE WA 1 0.02%
WILLIAM RAINEY HARPER COLLEGE IL 1 0.02%
SOUTH PUGET SOUND COMMUNITY COLLEGE WA 1 0.02%
INDIAN HILLS COMMUNITY COLLEGE IA 1 0.02%
CENTRAL ARIZONA COLLEGE AZ 1 0.02%
OHIO UNIVERSITY OH 1 0.02%
CAPITAL UNIVERSITY - LAW OH 1 0.02%
OCEAN COUNTY COLLEGE NJ 1 0.02%
CAMERON UNIVERSITY OK 1 0.02%
RHODES STATE COLLEGE OH 1 0.02%
CALIFORNIA LUTHERAN UNIVERSITY CA 1 0.02%
ILLINOIS EASTERN C.C. - FRONTIER C.C IL 1 0.02%
BUCKS COUNTY COMMUNITY COLLEGE PA 1 0.02%
ILLINOIS CENTRAL COLLEGE IL 1 0.02%
BRANDMAN UNIVERSITY CA 1 0.02%
WEST VIRGINIA NO CC - WHEELING WV 1 0.02%
SOMERSET COMMUNITY COLLEGE (KCTCS) KY 1 0.02%
THOMAS EDISON STATE COLLEGE NJ 1 0.02%
UNIVERSITY OF MISSOURI-COLUMBIA MO 1 0.02%
HORRY-GEORGETOWN TECHNICAL COLLEGE SC 1 0.02%
UNIVERSITY OF TAMPA FL 1 0.02%
NOVA SOUTHEASTERN UNIVERSITY FL 1 0.02%
AUSTIN PEAY STATE UNIVERSITY MAIN CAMPUS TN 1 0.02%
HONOLULU COMMUNITY COLLEGE HI 1 0.02%
AUGUSTA TECHNICAL COLLEGE GA 1 0.02%
THE STATE UNIVERSITY OF NEW YORK COLLEGE @ BUFFALO NY 1 0.02%
ARKANSAS STATE UNIVERSITY AR 1 0.02%
HOCKING TECHNICAL COLLEGE OH 1 0.02%

ANALYSIS OF SIX-YEAR OUTCOMES: FALL 2008 COHORT IR # 15068 Page 43
College Name State Count % SCOTTSDALE COMMUNITY COLLEGE AZ 1 0.02%
HINDS COMMUNITY COLLEGE MS 1 0.02%
SANTA MONICA COLLEGE CA 1 0.02%
REND LAKE COLLEGE IL 1 0.02%
ALPENA COMMUNITY COLLEGE MI 1 0.02%
HERZING UNIVERSITY-ORLANDO FL 1 0.02%
UNIVERSITY OF ST THOMAS MN 1 0.02%
HENRY FORD COLLEGE MI 1 0.02%
ST CATHARINE COLLEGE KY 1 0.02%
THE OHIO STATE UNIVERSITY OH 1 0.02%
NEW MEXICO STATE UNIVERSITY-ALAMOGORDO NM 1 0.02%
HEIDELBERG UNIVERSITY OH 1 0.02%
EAST WEST UNIVERSITY IL 1 0.02%
HEARTLAND COMMUNITY COLLEGE IL 1 0.02%
DIABLO VALLEY COLLEGE CA 1 0.02%
HAZARD COMMUNITY COLLEGE (KCTCS) KY 1 0.02%
DEVRY UNIVERSITY CENTER IL 1 0.02%
HAYWOOD COMMUNITY COLLEGE NC 1 0.02%
VIRGINIA COLLEGE - BIRMINGHAM AL 1 0.02%
HARRIS-STOWE STATE UNIVERSITY MO 1 0.02%
DEVRY UNIVERSITY - COLUMBUS OH 1 0.02%
THE NEW YORK CONSERVATORY FOR DRAMATIC ARTS NY 1 0.02%
DES MOINES AREA COMMUNITY COLLEGE IA 1 0.02%
NORTHWEST MISSISSIPPI COMMUNITY COLLEGE MS 1 0.02%
DELTA COLLEGE MI 1 0.02%
NORTHWEST IOWA COMMUNITY COLLEGE IA 1 0.02%
DE ANZA COLLEGE CA 1 0.02%
TEXAS STATE UNIVERSITY - SAN MARCOS TX 1 0.02%
DAYMAR COLLEGE - ROCKPORT IN 1 0.02%
TEXAS COUNTY TECHNICAL COLLEGE MO 1 0.02%
QUINEBAUG VALLEY COMMUNITY COLLEGE CT 1 0.02%
TEXAS CHRISTIAN UNIVERSITY TX 1 0.02%
SOUTHWESTERN INDIAN POLYTECHNIC INSTITUTE NM 1 0.02%
TECHNICAL COLLEGE OF THE LOWCOUNTRY SC 1 0.02%
SADDLEBACK COLLEGE CA 1 0.02%
NORTHWEST FLORIDA STATE COLLEGE FL 1 0.02%
MORAINE PARK TECHNICAL COLLEGE WI 1 0.02%
REGIS UNIVERSITY-SEMESTERS CO 1 0.02%
CRAFTON HILLS COLLEGE CA 1 0.02%
TALLAHASSEE COMMUNITY COLLEGE FL 1 0.02%

ANALYSIS OF SIX-YEAR OUTCOMES: FALL 2008 COHORT IR # 15068 Page 44
College Name State Count % COPPER MOUNTAIN COLLEGE CA 1 0.02%
SUSQUEHANNA UNIVERSITY PA 1 0.02%
COMMUNITY COLLEGE OF PHILADELPHIA PA 1 0.02%
SUNY SUFFOLK COUNTY CC - BRENTWOOD NY 1 0.02%
SOUTHWESTERN ILLINOIS COLLEGE IL 1 0.02%
SUNY ONONDAGA COMMUNITY COLLEGE NY 1 0.02%
SOUTHWESTERN COLLEGE CA 1 0.02%
WESTERN MICHIGAN UNIVERSITY MI 1 0.02%
SOUTHWEST TENNESSEE COMMUNITY COLLEGE TN 1 0.02%
HANOVER COLLEGE IN 1 0.02%
COLORADO STATE UNIVERSITY CO 1 0.02%
UNIVERSITY OF NORTHERN COLORADO CO 1 0.02%
COLORADO CHRISTIAN UNIVERSITY CO 1 0.02%
NORTHERN ILLINOIS UNIVERSITY IL 1 0.02%
COLLEGE OF THE MAINLAND TX 1 0.02%
GROSSMONT COLLEGE CA 1 0.02%
MONTGOMERY COLLEGE MD 1 0.02%
GREENVILLE TECHNICAL COLLEGE SC 1 0.02%
COLLEGE OF LAKE COUNTY IL 1 0.02%
GRANTHAM UNIVERSITY KS 1 0.02%
COLLEGE OF COASTAL GEORGIA GA 1 0.02%
SUNY MONROE COMMUNITY COLLEGE NY 1 0.02%
MONTCALM COMMUNITY COLLEGE MI 1 0.02%
GRAND CANYON UNIVERSITY-TRADITIONAL AZ 1 0.02%
CLOVIS COMMUNITY COLLEGE NM 1 0.02%
GRAND CANYON UNIVERSITY TRACK AZ 1 0.02%
CLACKAMAS COMMUNITY COLLEGE OR 1 0.02%
SUNY JEFFERSON COMMUNITY COLLEGE NY 1 0.02%
MISSISSIPPI STATE UNIVERSITY MS 1 0.02%
WALDEN UNIVERSITY MN 1 0.02%
SOUTHEASTERN COMMUNITY COLLEGE IA 1 0.02%
NORTHEASTERN UNIVERSITY - LAW/SPCS MA 1 0.02%
MINNESOTA SCHOOL OF BUSINESS MN 1 0.02%
NORTHEASTERN ILLINOIS UNIVERSITY IL 1 0.02%
MILWAUKEE AREA TECH COLLEGE WI 1 0.02%
NORTHEAST IOWA COM COL PEOSTA IA 1 0.02%
MIDLANDS TECHNICAL COLLEGE SC 1 0.02%
NORTHEAST COMMUNITY COLLEGE NE 1 0.02%
CENTRAL STATE UNIVERSITY-OH OH 1 0.02%
GEORGIA PIEDMONT TECHNICAL COLLEGE GA 1 0.02%
ANALYSIS OF SIX-YEAR OUTCOMES: FALL 2008 COHORT IR # 15068 Page 45
College Name State Count % CENTRAL CAROLINA TECHNICAL COLLEGE SC 1 0.02%
GEORGIA PERIMETER COLLEGE GA 1 0.02%
CEDAR VALLEY COLLEGE-DALLAS CC DISTRICT TX 1 0.02%
GEORGIA MILITARY COLLEGE GA 1 0.02%
CARRINGTON COLLEGE OF CALIFORNIA-SACRAMENTO CA 1 0.02%
GEORGIA GWINNETT COLLEGE GA 1 0.02%
MIAMI UNIVERSITY OH 1 0.02%
GEORGIA COLLEGE AND STATE UNIVERSITY GA 1 0.02%
CAMPBELL UNIVERSITY NC 1 0.02%
GATEWAY TECHNICAL COLLEGES WI 1 0.02%
ROSE-HULMAN INSTITUTE OF TECHNOLOGY IN 1 0.02%
NORTHEAST ALABAMA COMMUNITY COLLEGE AL 1 0.02%
CALIFORNIA STATE UNIVERSITY - DOMINGUEZ HILLS CA 1 0.02%
NORTH HENNEPIN COMMUNITY COLLEGE MN 1 0.02%
MCPHERSON COLLEGE KS 1 0.02%
NORTH DAKOTA STATE COLLEGE OF SCIENCE ND 1 0.02%
BUTLER COMMUNITY COLLEGE KS 1 0.02%
STEVENS-HENAGER - INDEPENDENCE UNIVERSITY UT 1 0.02%
BRYANT & STRATTON COLLEGE - MILWAUKEE WEST WI 1 0.02%
FOUR-D COLLEGE CA 1 0.02%
BRIGHAM YOUNG UNIVERSITY - IDAHO SPRING/FALL ID 1 0.02%
FLORIDA STATE COLLEGE AT JACKSONVILLE FL 1 0.02%
BOSSIER PARISH COMMUNITY COLLEGE LA 1 0.02%
NORTH CENTRAL UNIVERSITY MN 1 0.02%
BLACK RIVER TECHNICAL COLLEGE AR 1 0.02%
NORTH CENTRAL TEXAS COLLEGE TX 1 0.02%
BERKELEY CITY COLLEGE CA 1 0.02%
FLORIDA CAREER COLLEGE - JACKSONVILLE FL 1 0.02%
BENNINGTON COLLEGE VT 1 0.02%
FLORIDA ATLANTIC UNIVERSITY FL 1 0.02%
BELLEVUE COLLEGE WA 1 0.02%
ST. CATHERINE UNIVERSITY MN 1 0.02%
SKAGIT VALLEY COLLEGE WA 1 0.02%
UTAH STATE UNIVERSITY UT 1 0.02%
BAPTIST BIBLE COLLEGE OF PENNSYLVANIA PA 1 0.02%
NORFOLK STATE UNIVERSITY VA 1 0.02%
SIMPSON UNIVERSITY CA 1 0.02%
EVERETT COMMUNITY COLLEGE WA 1 0.02%
AUSTIN PEAY @ FORT CAMPBELL TN 1 0.02%
EVEREST UNIVERSITY-POMPANO BEACH FL 1 0.02%
ANALYSIS OF SIX-YEAR OUTCOMES: FALL 2008 COHORT IR # 15068 Page 46
College Name State Count % AUGUSTANA COLLEGE IL 1 0.02%
ST PETERSBURG COLLEGE FL 1 0.02%
ASHLAND UNIVERSITY OH 1 0.02%
WICHITA STATE UNIVERSITY KS 1 0.02%
ASBURY UNIVERSITY KY 1 0.02%
EVEREST UNIVERSITY - TAMPA FL 1 0.02%
POLK STATE COLLEGE FL 1 0.02%
VIRGINIA COMMONWEALTH UNIVERSITY VA 1 0.02%
ARGOSY UNIVERSITY-PHX-ONLINE IL 1 0.02%
NEW RIVER COMMUNITY AND TECHNICAL COLLEGE WV 1 0.02%
ANNE ARUNDEL COMMUNITY COLLEGE MD 1 0.02%
ST JOHNS UNIVERSITY NY 1 0.02%
LOS ANGELES TRADE TECHNICAL CA 1 0.02%
EVEREST INSTITUTE - GRAND RAPIDS MI 1 0.02%
SANTA FE COLLEGE FL 1 0.02%
EVEREST COLLEGE-MESA AZ 1 0.02%
AMARILLO COLLEGE TX 1 0.02%
EVEREST COLLEGE - SEATTLE WA 1 0.02%
ALCORN STATE UNIVERSITY MS 1 0.02%
EVEREST COLLEGE - MERRIONETE PARK IL 1 0.02%
LONG BEACH CITY COLLEGE CA 1 0.02%
EVEREST COLLEGE - GARDENA CA 1 0.02%
EVEREST COLLEGE - CHESAPEAKE VA 1 0.02%
Grand Total 4,385 100.00%
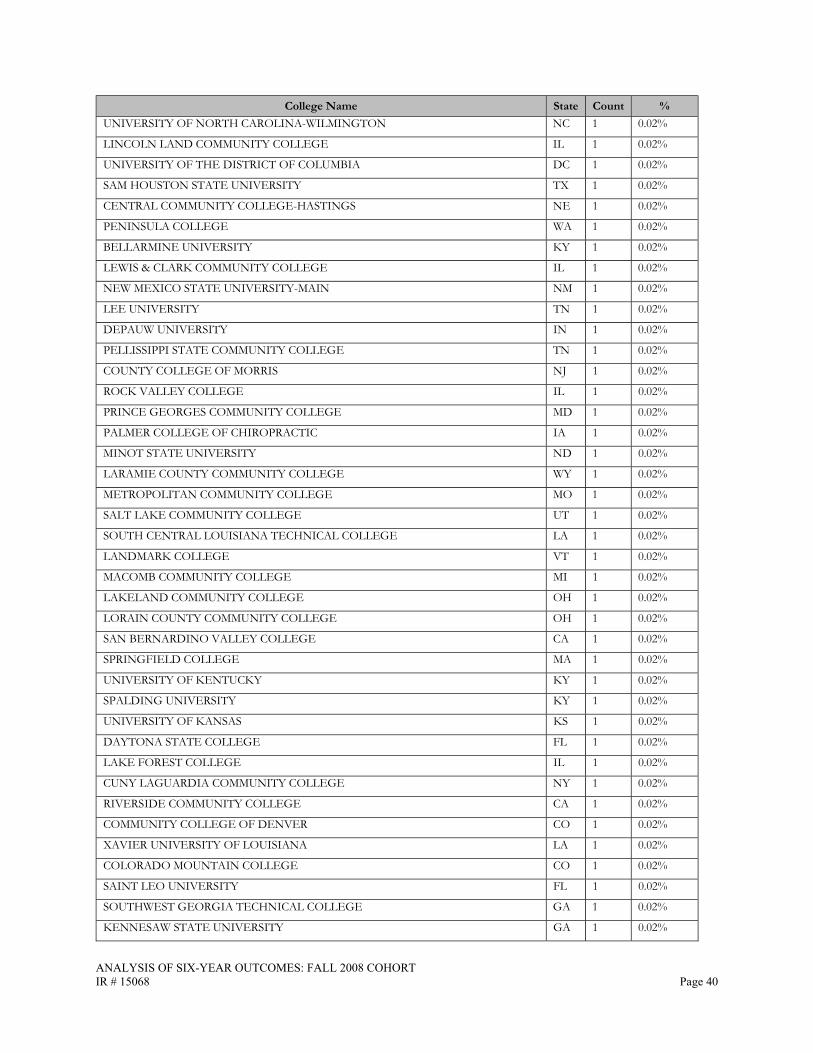
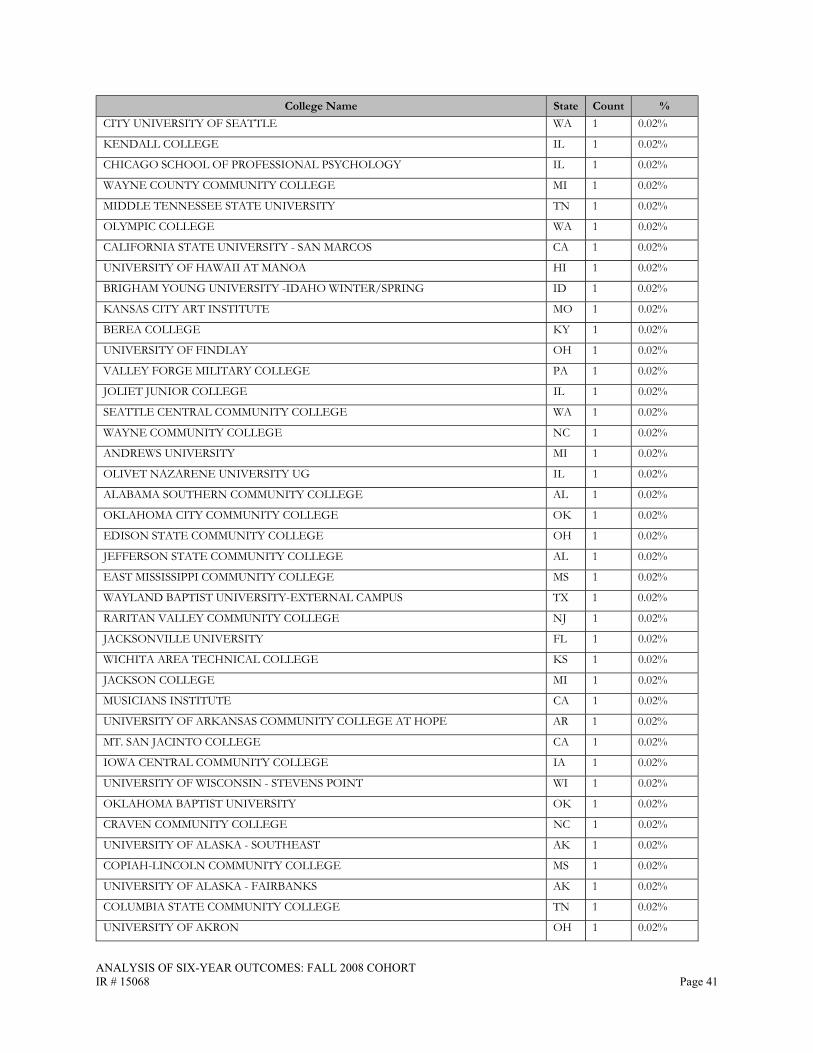
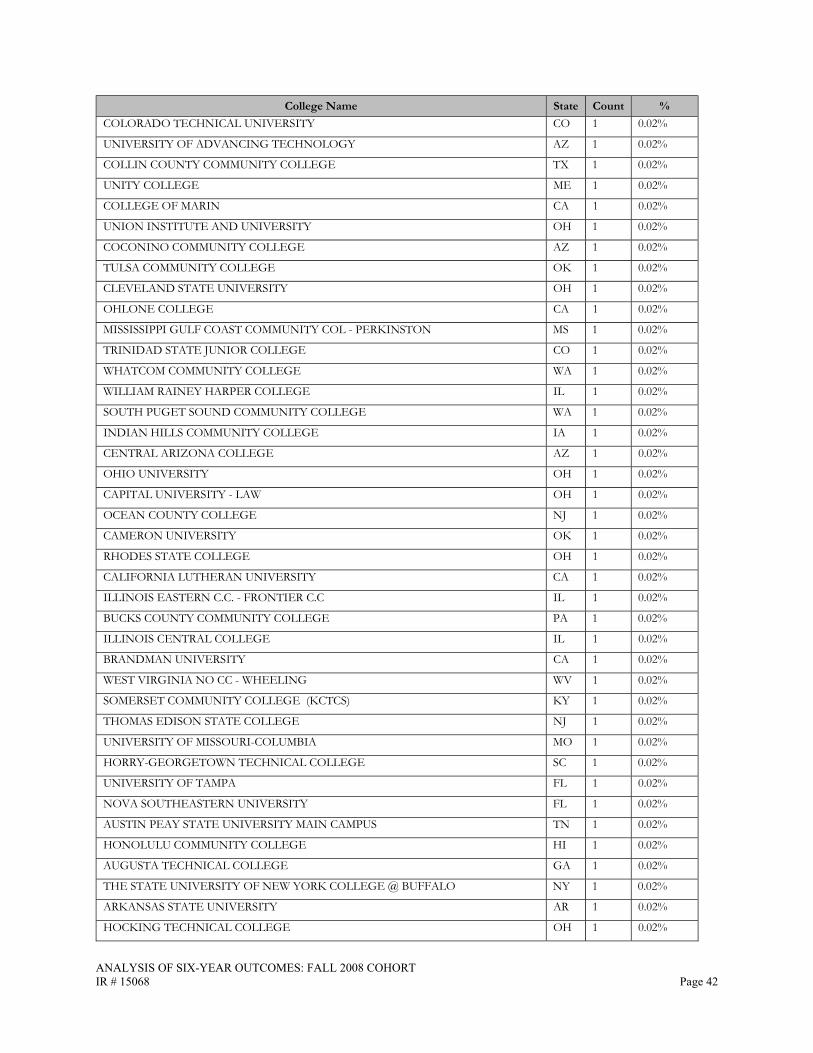
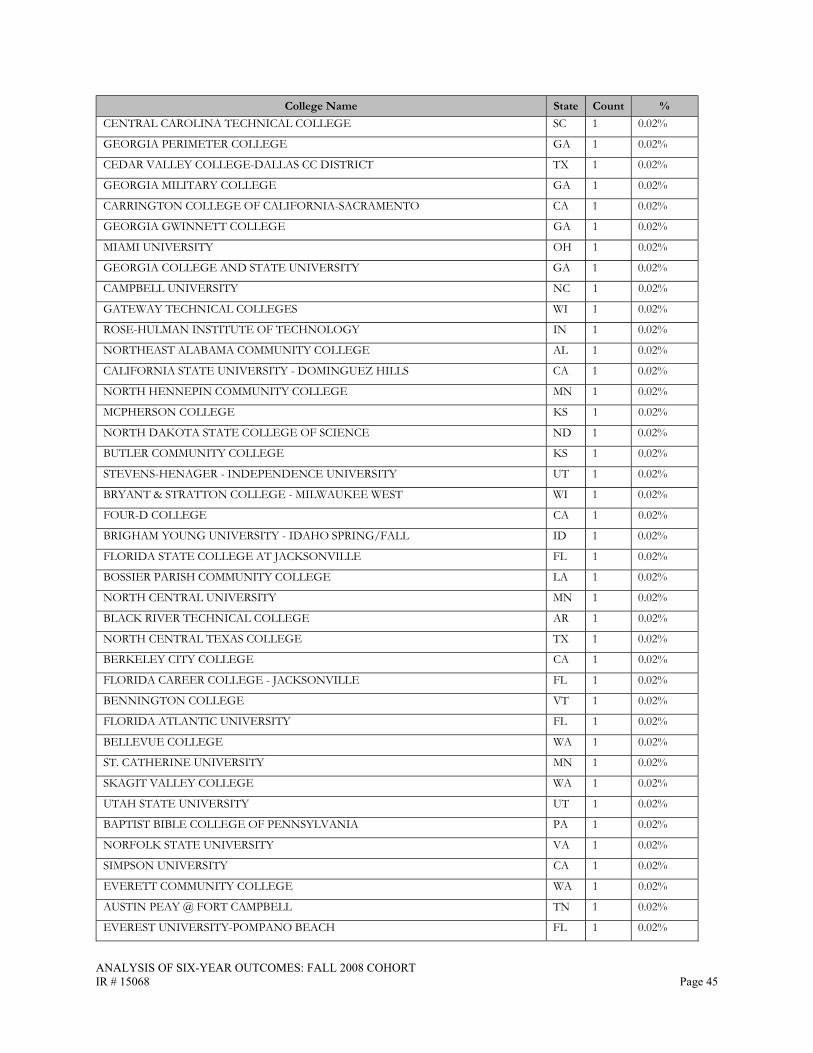
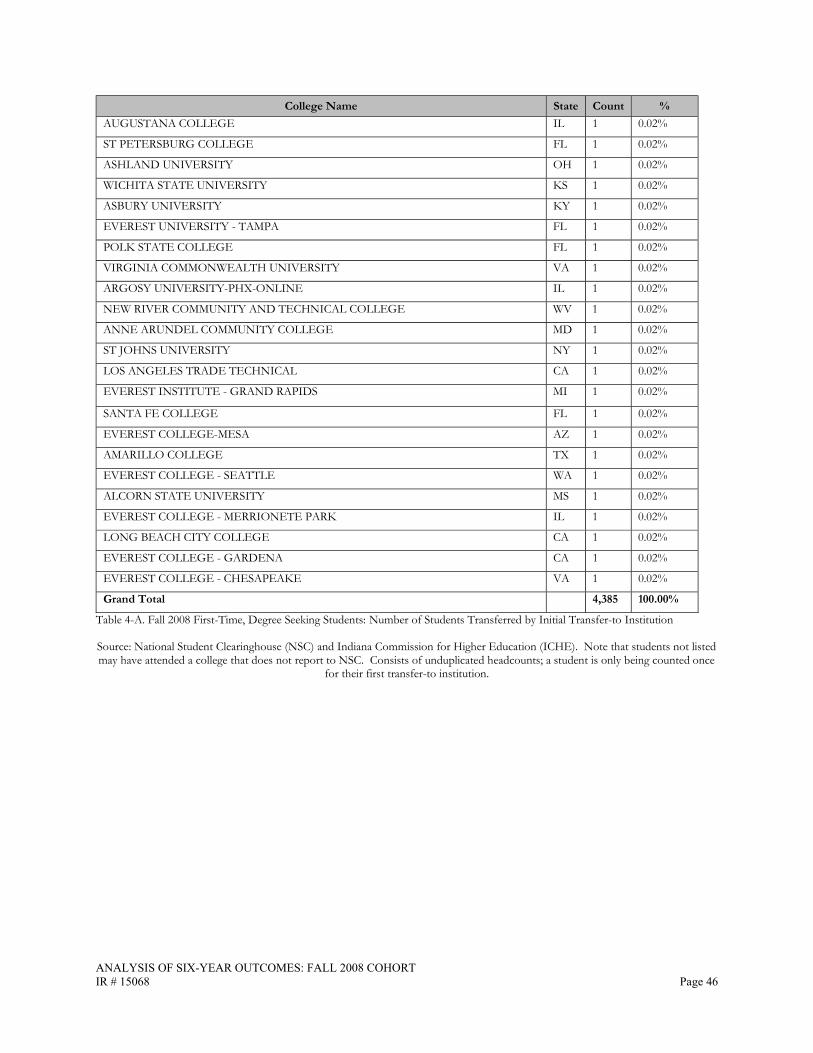
Table 4-A. Fall 2008 First-Time, Degree Seeking Students: Number of Students Transferred by Initial Transfer-to Institution
Source: National Student Clearinghouse (NSC) and Indiana Commission for Higher Education (ICHE). Note that students not listed may have attended a college that does not report to NSC. Consists of unduplicated headcounts; a student is only being counted once
for their first transfer-to institution.