Contemporary comparison between photovoltaic solar panels and large solar collector installations.

ANALYSIS OF PHOTOVOLTAIC INSTALLATIONS: A COMMERCIAL OWNER PERSPECTIVE ON PV PLANT OPERATION AND OPTIMIZATION
Alexander Bradley, John Reimers, Babak Hamzavy, James Kopchick
DUPONT PHOTOVOLTAIC SOLUTIONS
February 25, 2014
NREL Reliability Conference

Introduction
• Review and analysis of commercial installations provides insight and learning to help the industry’s continued growth
• Address technical risk to commercial/industrial projects, from design through decommission
• Simple quality management actions/processes minimize safety and performance risks and improve financial returns
• Identify and share learnings and best practices regarding distributed generation projects
• Gather data to identify durability challenges and trends
• Observed degradation and failure modes associated with module/material design, manufacturing, installation, weather, and operation & maintenance (O&M). • The importance of module material design and manufacturing consistency is critical
Copyright © 2014 DuPont.

DuPont Role in Photovoltaics
Broadest materials portfolio in the PV industry System owner & PV electricity consumer
Shenzhen, China Taoyuan, Taiwan Hyderabad, India Rooftop Thin Film Rooftop c-Si Rooftop Thin Film & c-Si
Waimea, HI Tlalnepantla, Mexico Parlin, NJ Ground Mount c-Si Ground Mount TF Ground Mount c-Si
Wilmington, DE Wilmington, DE Wilmington, DE Ground Mount c-Si Rooftop Thin Film Rooftop c-Si
3 Continents and 7 Countries 7 kW to 5 MW
Provide a unique industry perspective: largest material supplier and growing PV system owner
Copyright © 2014 DuPont.
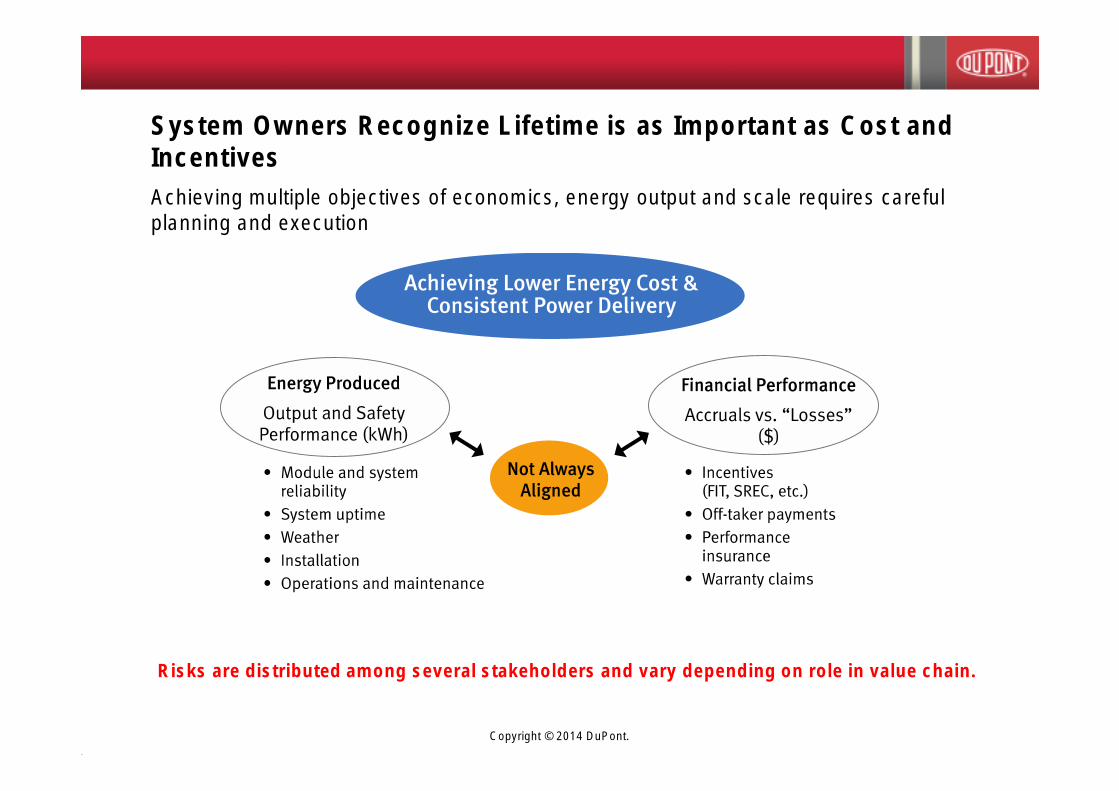
System Owners Recognize Lifetime is as Important as Cost and Incentives Achieving multiple objectives of economics, energy output and scale requires careful planning and execution
Risks are distributed among several stakeholders and vary depending on role in value chain.
Copyright © 2014 DuPont.

Project Lifecycle: Risk Assessment and Valuation Over Time
• Performance and safety over 25 years needs appropriate upfront consideration
• Importance of PV system optimization increases as subsidies are reduced
Risks are distributed among several stakeholders and vary depending on role in value chain.
Copyright © 2014 DuPont.

Overview
Background
Observations
Recommendations
• Inspected/Characterized >30 global installations (>100MW) in NA, EU, & AP ranging from newly commissioned to 30 years to gain technical learnings
• In last 36 months lab analyzed > 300 modules from service environment
• Observed and characterized over 30 different degradation modes
• Partnered with over 25 installers, developers, EPC, utilities, financial and academic institutions
• Module overcapacity and race to grid parity is driving dramatic changes
• Safety and performance issues are typically underreported, but are arising and being identified through industry publications.
• A proliferation of new materials combined with multivariate stresses and concurrent phenomena requires careful analysis and assessment.
• Once commissioned options for mitigation are limited
• Better understanding of product quality and qualification is needed
• Development of enhanced durability test methodology is required
• Use best practices and processes to optimize in-field performance
• Adopt improved risk mitigation strategies and technical specifications
Copyright © 2014 DuPont.
6

Bil l of Mat er ial s & Design
appl icat ion
instal l at ion
Weat her
Manufact ur ing
o&M
Copyright © 2014 DuPont.
Quality Management Process: Storyboard the Performance Risk Issues
Identify and catalog degradation modes: mitigate risk with control plans
“Lifetime-prediction tests appropriate for full-sized modules would be possible only when a final module design is defined, all failure modes are identified for that module design, and acceleration parameters for each relevant environmental stress are known.
The development of a universal 30-year pass/fail certification for all PV module types cannot be expected.”
Module 30 Year Life: What Does it Mean and Is it Predictable/Achievable? T. J. McMahon, G. J. Jorgensen, R. L. Hulstrom, D. L. King and M. A. Quintana
25-Year Operating Lifetime
Bill of Materials & Design
Application
Installation
Weather
Manufacturing
O&M

Identify and Catalog Degradation Modes: Bill of Materials & Design
Material durability issues are widespread in modules less than 5 years in operation in the service environment
• Outer backsheet polyester • Backsheet with embrittlement, • Inner backsheet PE tie-layer cracked and delaminating cracking, and erosion of outer discoloration (PVDF backsheet)
• 2.3 MW field estimated that ½ FEVE coated surface ° 5 different countries (>10MW) the field or approximately 5,000 • 1% of modules indicated early ° 5 different manufacturers modules in the park affected signs of degradation or gross ° Different certifying agencies
• 2-year warranty on materials damage after 3 years in service and workmanship elapsed, with no replacement of the panels
Backsheet and Module Durability and Performance and Comparison of Accelerated Testing to Long Term Fielded Modules. Gambogie, W., et. al. EUPVSEC 2013. Copyright © 2014 DuPont.

Identify and Catalog Degradation Modes: Installation
Errors due to improper installation methods are typically localized
Shim between glass and frame
Extra drill hole at grounding bar
Copyright © 2014 DuPont.

Copyright © 2014 DuPont.
Bent bus bar and misaligned cells
Safety and performance issues due to inconsistent manufacturing
Non-uniform solder
Identify and Catalog Degradation Modes: Manufacturing
Uneven Pb / Sn coated Cu

Identify and Catalog Degradation Modes: Application Environment
Varied site-specific requirements present different operating environments for distributed generation
BIPV/BAPV delamination Ground mount, open vs. closed rack, operating temperature differences
Copyright © 2014 DuPont.

Identify and Catalog Degradation Modes: Weather
Wide range of issues from instantaneous catastrophic failure to slow degradation
Hail damage Soiling (temporary) Glass Etching (permanent)
Copyright © 2014 DuPont.

Identify and Catalog Degradation Modes: Operation & Maintenance
Remote monitoring systems are needed in combination with thermal imaging and visual inspection
Thermal imaging used to identify underperforming Visual inspection: Necessary, but not sufficient. modules: Average backside cell temperature is not always representative.
E. Kaplani, Detection of Degradation Effects in Field-Aged c-Si Solar Cells through IR Thermography and Digital, Image Processing. International Journal of Photoenergy (2012).
Copyright © 2014 DuPont.

174171168165162
18
16
14
12
10
8
6
4
2
0
Pmax
Fre
qu
ency
173169.6
169.6 2.499 46
173.0 1.438 46
Mean StDev N
Six Years
Initial
Time
Histogram of PmaxNormal
Defect Category
Module
s
Copyright © 2014 DuPont.
Pareto process & criticality analysis
• Degradation (Blue) modes with high frequency show a low degree of severity
• Degradations (Red) with low frequency have high degree of severity
• Ability to detect enhanced through thermal imaging
Quantitative Assessment: DuPont PV Installation Case Study 1
Project evaluation & documentation after six years
174171168165162
18
16
14
12
10
8
6
4
2
0
Pmax
Fre
qu
ency
173169.6
169.6 2.499 46
173.0 1.438 46
Mean StDev N
Six Years
Initial
Time
Histogram of Pmax Normal
Safety and Performance Analysis of a Commercial Photovoltaic Installation. Bradley, A. Z., et. al. SPIE 2013.
CellCr
ack
Hot S
pots
Other
Dirt
Build
up
Edge
Disc
olor
ationOnCe
ll("Fr
aming"
)
Busb
ar/T
abbing
Wire
sDiscolor
ation
Backsh
eet C
halking
Back
shee
t Disc
oloration
Backsh
eet D
elam
ination
DelaminationAt
Tabb
ingW
ires
Fron
t-Side
Enca
psulan
t Bro
wning
50
40
30
20
10
0
Performance: Pmax distribution
• Minimal power loss
• Mean change in power is -3.4 W (-2% drop); 95% confidence
• Degradation rate = 0.3% per year (assumed linear)
Safety: Electrical Insulation
• EVA encapsulant and TPE backsheet maintained electrical insulation
46.7 kW System

Copyright © 2014 DuPont.
Electroluminescence and Thermal Imaging of Modules Indicated Different Degradation Modes Yield Similar Power Loss
35 30 25 20 15 10 50
8
7
6
5
4
3
2
1
0
Voltage (V)
C u
r r e n
t (A
)
0.2% 6.2%
7.0%
% Loss in Pmax
Change in Pmax is correlated to -2.7% loss in the fill factor.
Some cracks are identifiable in the thermal image (damage location is at an elevated temperature)

Qualitative Assessment: DuPont PV Installation Case Study 2
• Reliability issue (37.8 kW system): Six 180W modules out of 210 have broken glass (2.8% broken) after 3 years ° Mechanical/structural issues associated with installation ° Broken interconnect on cells
• Current situation: Developer, module and inverter manufacturer are all out of business
• Mitigation: Cannibalize a smaller string of the array (6.6% decommissioned)
• Control plan: Semiannual inspection and thermal imaging
Analysis of Photovoltaic Installations: A Commercial Owner Perspective on PV Plant Operation and Optimization; Bradley, A., et. al. EuPVSEC, 2013.
Copyright © 2014 DuPont.

O&M is Not a Fixed Cost and Can Dramatically Increase Over the Lifetime of the System
• O&M costs were up 235% in year 3 due to system issues
• Revenue loss due to system availability (short term) & kW size (long term)
Copyright © 2014 DuPont.

Thermal Imaging Assessment: DuPont PV Installation Case 3
EL image of replacement module before installation Hot spot identified immediately after installation
• Reliability issue (43 kW System): Seven 205W modules out of 210 have cell hot spots (3.3%) ° Safety: Overheated cells accelerate degradation of encapsulant and backsheet materials ° Performance: The use of thermal imaging is critical to the inspection process and has been instituted
as a best practice to improve safety and performance
• Remote string level monitoring combined with thermal imaging identified underperforming modules • One percent of modules do not meet performance warranty after 3 years.
• Poor manufacturing initially characterized by EL imaging detected as a hot spot using thermal imaging Bradley, A.Z. submitted SPIE 2014 Copyright © 2014 DuPont.

Minimizing PV Performance Risk and Optimizing Energy Harvest
• Visual Inspection
• Thermal Imaging • Power Output Measurement (IV Curve)
• FTIR Analysis • Electroluminescence (EL) Imaging
• Criticality Matrix • Thermal Imaging Under Forward Bias
• Pareto Chart • Wet Leakage Current or Dry
Insulation Test
Apply Lessons Learned to Future PV Installations
• Institute Best Practices
• Control Plans
• Technical Specification
• Continuous Improvement
• Energy Harvest
• System Optimization
Stage One�
Field Assessment�
Stage Four�
Closed Loop�
Learning/Application
Stage Two
Non Destructive Analysis�
Stage Three�
Destructive Analysis�
• Sample Extraction Via Back Side Core
• Physical Layer Profile (SEM)
• Chemical Layer Profile (IR/SEM)
• Defect Pathways (X-Ray)
• Mechanical Properties
Failure Modes and Effects Analysis used to improve component and system design.
Copyright © 2014 DuPont.

There are Straightforward Options to Mitigate Risk�
PV System Best Practices Key Actions P
roje
ct D
esi
gn
Ensure Selection of Quality
Modules
Specify a proven module BOM that eliminates common module failure
modes (e.g. electrical insulation materials)
Require transparency of BOM to be provided in project solicitations
Specify Manufacturing Process Controls that ensure design consistency,
BOM & Process conditions
Require Letter of Conformance & closed loop verification of modules vs.
proposed/contracted
Co
ntr
act
ing Assess Contractor Experience
& Ensure Quality Asset
Optimization Management
Improve visibility of contractor past performance (beyond 5 years &
problem resolution capabilities)
Require/develop detailed plan for long-term optimization &
management of the asset in project solicitations
Co
mm
issi
on
ing Enable Ongoing Safety &
Performance Monitoring of
the Asset
Require open access to the facility, BOMs, plant designs and records
Project Commissioning process to ensure conformance & establish
baseline performance
Ongoing data analysis of system (requirement of weather collection
system to normalize data)
Copyright © 2014 DuPont.

Summary
Documented material durability and module manufacturing issues in systems less than 5 years in operation in the service environment
O&M is not a fixed cost and can be significant
Difficult to standardize distributed generation systems – no one size fits all approach to global commercial/industrial installations
Simple best practices and quality management actions/processes minimize risk, optimize safety/performance, and improve financial returns
Copyright © 2014 DuPont.

-
-
Alexander Z. Bradley, Ph.D. DuPont Photovoltaic Solutions (302) 999 4734 [email protected]
Acknowledgments T. John Trout, James Berry, Corey Phillips, William Griswold, Lucie
Garreau Iles, William Gambogi, Kate Stika, Eric Romano, Conrad Burke, Jill Cohen