Analysis of New Electoral Boundaries
84
2019 Redistribution Western Australia Analysis of New Electoral Boundaries Election Paper Series No. 1/2019 Parliament of Western Australia
Transcript of Analysis of New Electoral Boundaries

2019 Redistribution Western Australia
Analysis of New Electoral Boundaries
Election Paper SeriesNo. 1/2019
Parliament of Western Australia
2019
Except to the extent of the uses permitted under the Copyright Act 1968, no part of this document may be reproduced or transmitted in any form or by any means including information storage and retrieval systems, without the prior written consent from the Librarian, Western Australian Parliamentary Library, other than by Members of the Western Australian Parliament in the course of their official duties. The views expressed in this paper are those of the author and do not necessarily reflect those of the Western Australian Parliamentary Library.
Western Australian Parliamentary Library Parliament House Harvest Terrace Perth WA 6000
ISBN 978-0-9875969-2-5
December 2019
Related Publications
Western Australian State Election 2017: Analysis of Results / by Antony Green. Election paper series 1/2017.
2015 Redistribution Western Australia – Analysis of Final Electoral Boundaries / by Antony Green. Election paper series 1/2015.
Western Australian State Election 2013: Analysis of Results / by Antony Green. Election paper series 1/2013.
2011 Redistribution Western Australia – Analysis of Final Electoral Boundaries / by Antony Green. Election paper series 1/2011
WA State Election 2008 - Final Analysis of Results / by Antony Green. Election paper series 1/2008
2007 Redistribution Western Australia - Analysis of Draft Electoral Boundaries / by Antony Green. Election papers series 1/2007.
WA State Election 2005 - Final Analysis of Results / by Antony Green. Election papers series 2/2005.
WA State Election 2005 - Preliminary Analysis of Results by / Antony Green. Election papers series 1/2005.
2003 Electoral Distribution Western Australia: Analysis of Final Boundaries / by Antony Green. Election papers series 2/2003.
2003 Electoral Distribution Western Australia: Analysis of Draft Boundaries / by Antony Green. Election papers series 1/2003.
Western Australian State Elections 2001 / by Antony Green. Election papers series 2/2001.
Western Australian State Elections 1996 / by Antony Green. Election papers series 1/2001.

2019 REDISTRIBUTION WESTERN AUSTRALIA
ANALYSIS OF NEW ELECTORAL BOUNDARIES
by
Antony Green
for the
WESTERN AUSTRALIAN PARLIAMENTARY LIBRARY
Western Australian Parliamentary Library Election Papers Series No. 1 / 2019
December 2019
© 2019
IBRAR YP A R L I A M E N T A R Y
wes te rn australia

2019 WESTERN AUSTRALIAN REDISTRIBUTION
ANALYSIS OF NEW ELECTORAL BOUNDARIES
CONTENTS PAGE
Introduction 1
Summary of Political Impact 5
Variation in Enrolment by District and Region 7
New Legislative Assembly Electoral Pendulum 10
Summary of Changes to Assembly Districts 11
Detail of Legislative Assembly Districts 15
Transfers of Old District Enrolments 76
2019 REDISTRIBUTION WESTERN AUSTRALIA
ANALYSIS OF NEW ELECTORAL BOUNDARIES

2019 WA Redistribution
The Author
Antony Green is an Election Analyst with the Australian Broadcasting Corporation and has worked for the ABC on every federal, state and territory election coverage since 1989.
Antony studied at Sydney University, obtaining a Bachelor of Science in mathematics and computing, and a Bachelor of Economics with Honours in politics. He is an Adjunct Professor in the Department of Government and International Relations at the University of Sydney.
Antony produces regular publications on electoral matters for the New South Wales and Western Australian Parliamentary Libraries.
Party Abbreviations
ALP Labor Party GRN The Greens IND Independents L/NP Liberal and/or National Party (used for two-party totals) LIB Liberal Party NAT The Nationals ONP Pauline Hanson's One Nation OTH Others
Comments and Feedback
This publication has been prepared using the electoral maps made available by the Electoral Distribution Commission, and with reference to the transfers of enrolment from old to new boundaries. However, without access to registered voter lists indicating where people cast their vote, re-allocating polling places to new electorates is an inexact science. This is especially the case when roll transfers suggest a polling places needs to be split between new districts. Comments and suggestions on the transfer of polling places is most welcome. Messages can be e-mailed to me at [email protected].

2019 WA Redistribution 2019 WA Redistribution
1
INTRODUCTION
This publication contains an assessment of the political impact of the new state electoral boundaries for Western Australia. The final determination of the boundaries was released by the Electoral Distribution Commission (EDC) on 27 November 2019. The new boundaries will apply for the March 2021 election.
As described below, the EDC draws electoral boundaries based on criteria set down in the Electoral Act. The political consequences of electoral boundaries are not an issue taken into consideration by the EDC, but clearly the decisions made have political consequences. The aim of this publication is to assess the political impact of the Commission's final boundaries.
The Redistribution Process
The Electoral Distribution Commission commences a re-drawing of electoral boundaries two years after each state election. The redistribution is designed to bring enrolments in lower house electorates back within the permitted variation from the state average.
Enrolments for the 59 districts drawn by the EDC must be within 10% of the average state enrolment or quota, except for large districts greater than 100,000 square kilometres in area. These districts are granted a large district allowance (LDA), 'notional' voters calculated as 1.5% of the area of the electorate. For these districts, enrolment plus the LDA must be between 20% under and 10% over the quota.
The primary task of the EDC is to meet the enrolment criteria set out in the previous paragraph. Within this restriction, the EDC may also take into consideration:
community of interest land use patterns means of communication; means of travel and distance from Perth physical features existing boundaries of regions and districts existing local government boundaries the trend of demographic changes.
The requirement that the 59 Legislative Assembly districts lie within the six Legislative Council regions requires the EDC to take into account:
the region known as North Metropolitan is generally north of the Swan River the South Metropolitan region is generally south of the Swan River the East Metropolitan region includes the hills and foothills of the Darling Escarpment each metropolitan region contains approximately the same number of districts the three metropolitan regions together generally equate to the metropolitan area the Mining and Pastoral region is an area remote from Perth and whose land is mainly
used for mining and pastoralism the Agricultural region is an area south, or southwest of, and adjacent to, the Mining
and Pastoral region and whose land is used mainly for agriculture the South West region includes coastal and forest areas in the south west of the state.
The second-year anniversary of the election set 11 March 2019 as the base enrolment date for the redistribution. The EDC established an indicative timeline for the redistribution, and the process was completed using the following dates.
30 March – public call for suggestions 29 April – closing date for suggestions 13 May – closing date for comments on suggestions 26 July – draft boundaries released 26 August – Closing date for objections to draft boundaries 27 November – release of final boundaries.
01

2019 WA Redistribution 02
2019 WA Redistribution
2
The Task before the Commission
The EDC established that the average district enrolment (or quota) for the redistribution was 27,573. With the exception of districts where the LDA applied, all districts drawn by the EDC were required to have an enrolment between 24,816 and 30,330. In districts with an LDA, the enrolment plus the LDA was required to be between 22,058 and 30,330.
The 2015 redistribution had been required to make major changes to boundaries after the EDC chose to abolish a country seat and create a new Perth seat. In 2019 the EDC chose not to alter the balance of seats, which limited the scope of required changes.
Eleven districts were outside of the permitted variation from average, nine metropolitan districts over quota and two country districts under quota. Seven of the nine over-quota seats were on Perth's fringes, with Baldivis (+22.0%), Butler (+24.6%), Darling Range (+19.4%) and Swan Hills (+26.4%) the outliers. In the far north of the state, Kimberley (-21.7%) was well under quota after including its LDA.
Full details of variance from quota for districts, both before and after the redistribution, can be found in tables beginning on page 7. For districts eligible for an LDA, the variation from quota is shown for both enrolment and enrolment plus LDA.
The Solution Adopted
The 2019 redistribution was incremental compared to the major changes undertaken in 2015. Ten districts remained unchanged. Another 14 districts retained 100% of their former enrolment and expand in area. Seventeen districts retained 90% of enrolment, 10 retained 80%, while only eight districts underwent more significant change. Only one district changed name, Girrawheen re-named Landsdale.
The most significant changes flowed from adjusting the boundary between North and East Metropolitan regions, giving West Swan more sensible boundaries. This had consequences for Wanneroo, Girrawheen/Landsdale and Swan Hills. Dealing with the surplus of voters in Butler cascaded down districts along Perth's northern beaches.
Darling Range was given more compact boundaries, while in Perth's outer south, there were major changes to Kwinana and Baldivis. Only minor changes were required to bring country seats back within quota.
Details of Calculations and Methodology in this Publication
To calculate the political impact of the new boundaries, the results of the 2017 election have been re-assigned to match the new electoral boundaries. This requires a series of assumptions to be made as part of the calculations. These assumptions concern whether votes are cast for candidates or parties, how to transfer polling places between old and new electorates, and how to deal with the declaration vote from old electorates.
Candidate versus Party Vote
An assumption has been made that votes are cast for parties rather than candidates. This is a reasonable assumption, but ignores the importance of popular sitting members. A well-known sitting member may poll higher than his or her party would have with a different candidate. New electoral boundaries can add areas to an electorate where the party vote was not influenced at the last election by the presence of a sitting member.
Transferring Polling Places to Match the New Boundaries
The Electoral Distribution Commission released lists of statistical area enrolments for both old and new districts. This data has been used to calculate transfers of enrolment between old and new electorates. The transfer of polling place results from old to new electorates was guided

2019 WA Redistribution
2019 WA Redistribution
3
by the enrolment transfers as well as the published maps. Where the transfers and maps suggest the catchment area of a polling place should be divided, an estimate has been made to divide the results of a polling place between new districts.
Dealing with the Declaration Vote
For calculation purposes, all declaration votes (pre-poll, postal, absent, provisional) have been accumulated into a single total for transfer. Special Institutions, Hospital and Remote totals have been treated as an ordinary polling place and transferred to new electorates as appropriate.
Declaration votes have been transferred to new electorates in proportion to the transfer of enrolment from old to new electorates. However, the vote by party in the declaration vote has been weighted to reflect the vote by party in polling places transferred between electorates.
As an example, the polling places in those parts of Albany transferred to Roe recorded a much higher Nationals vote than other parts of Albany. As a result, in dividing the declaration vote between Albany and Roe, the pattern of polling place results is reflected in the declaration vote transferred from Albany to Roe having a higher proportion of National vote than the declaration vote remaining with the new Albany.
By-elections and Changes in Party Membership
This publication is based on 2017 election result. Calculations do not take account of the Darling Range by-election in June 2018.
However, the Liberal Party's defeat of Labor at the Darling Range is acknowledged in the new electoral pendulum with the use of the by-election margin. Similarly, the pendulum acknowledges the switch of Geraldton MP Ian Blayney from the Liberal to the National Party.
Two-Party Preferred versus Two-Candidate Preferred Results
The two-candidate preferred count for an electorate is defined as the final count of votes between the two remaining candidates after the exclusion and distribution as preferences of votes for all other candidates. At each stage of the distribution of preferences, the candidate with the fewest votes is excluded and his or her ballot papers re-examined to determine the candidate with the next available preference. To achieve victory, a candidate must receive more than 50% of the total two-candidate preferred vote. Where a candidate achieves more than 50% of the vote before the final distribution, the two-candidate preferred count is completed for information purposes.
The two-party preferred count represents a distribution of preferences between candidates representing the Labor Party and the Liberal or National Party. Candidates are again excluded based on lowest progressive vote, though at some point the second lowest candidate is excluded to retain candidates representing Labor and the Liberal or National Party. The two-party preferred count plays no part in determining the winning candidate but is useful for information purposes.
At the 2017 Western Australian election, 56 of the 59 districts finished as two-party preferred contests, 51 as Labor-Liberal counts and five as Labor-National counts (Albany, Central Wheatbelt, North West Central, Pilbara, Warren-Blackwood). There were two Liberal-National contests (Moore, Roe) and one Labor-Independent contest (Baldivis).
Estimated two-party preferred counts have been calculated for all polling places in Baldivis, Moore and Roe.
03

2019 WA Redistribution 2019 WA Redistribution
4
Legislative Council
There have been only very small change to Legislative Council boundaries. None would have changed the party vote shares by region.
Acknowledgements and Disclaimer
All estimates have been calculated based on the results of the 2017 election and with reference to data and maps published by the Electoral Distribution Commission. My thanks go to the staff of the Western Australian Electoral Commission for providing results of the 2017 election, and to the staff of the Electoral Distribution Commission.
However, responsibility for all calculations, and the assumption underlying them, must rest with the author.
Antony Green December 2019
04

2019 WA Redistribution
2019 WA Redistribution
5
Summary of the Political Impact Party Composition of Legislative Assembly based on Old and New Boundaries S e a t s H e l d B y P a r t y Labor Liberal National Total Old Boundaries 41 13 5 59 New Boundaries 41 13 5 59 By-elections and Party Changes 40 13 6 59
No district changed party status based on the new electoral boundaries, though the seats of Hillarys and Joondalup are much more marginal on their new boundaries. There is only one change of seat name with Girrawheen re-named Landsdale.
The change in seats held by party derives from – The Liberal Party winning Darling Range from Labor at a June 2018 by-election. Geraldton MP Ian Blayney switching from the Liberal Party to the National Party in
mid-2019.
In 16 districts the estimated new margin differs from the old margin by one percentage point or more. The districts are listed below.
Summary of Electorates where Estimated Margins have changed by more than 1% Strengthened for Labor Balcatta ALP 5.8% to ALP 8.0%
Burns Beach ALP 2.5% to ALP 5.4% Butler ALP 19.4% to ALP 20.5% Kwinana ALP 18.1% to ALP 20.7% Mirrabooka ALP 19.2% to ALP 23.3% Wanneroo ALP 7.3% to ALP 8.6% West Swan ALP 17.1% to ALP 18.4% Willagee ALP 15.5% to ALP 17.7%
Weakened for Labor Baldivis ALP 17.9% to ALP 16.6% Cockburn ALP 15.9% to ALP 14.3% Girrawheen 16.7% now Landsdale ALP 9.6% Swan Hills ALP 14.5% to ALP 12.1%
Strengthened for Liberal Carine LIB 9.0% to LIB 10.2%
Weakened for Liberal Bateman LIB 9.5% to LIB 7.8% Churchlands LIB 13.2% to LIB 11.7% Hillarys LIB 4.1% to LIB 0.4%
Swings to Change Government
Following the 2017 election, a change of government required the Liberal and National Parties to gain 12 seats from Labor Party. On the old electoral boundaries, this corresponded to a uniform swing of 5.8%.
Taking account of the new boundaries, and the Liberal victory at the Darling Range by-election, a change of government requires the Liberal and National Parties to take 11 seats from the Labor Party. On the new electoral pendulum, this corresponds to a uniform swing of 7.9%.
While this appears to be a boost for the Labor government, the boost is due entirely to the new boundaries in one seat, Balcatta, where the Labor margin has increased from 5.8% to 8.0%.
05

2019 WA Redistribution
2019 WA Redistribution
6
The table below sets out the marginal Liberal and Labor seats based on both the old and new electoral boundaries.
Marginal Seats - Old and New Boundaries Labor Seats Under 6% Liberal Seats Under 6% Old Boundaries New Boundaries Old Boundaries New Boundaries 0.6 Joondalup 0.03 Joondalup 0.7 Dawesville 0.4 Hillarys 0.7 Kingsley 1.2 Kingsley 1.3 Geraldton 0.8 Dawesville 1.0 Jandakot 1.7 Murray-Wellington 4.1 Hillarys 1.3 Geraldton (NAT) 1.4 Murray-Wellington 1.8 Jandakot 4.4 Riverton 3.5 Darling Range 2.3 Pilbara 2.2 Pilbara 5.6 Scarborough 4.2 Riverton 2.5 Kalamunda 2.3 Kalamunda 5.7 Scarborough 2.5 Burns Beach 3.6 Bicton 2.9 Bicton 4.0 Mount Lawley 4.0 Mount Lawley 5.4 Burns Beach 5.1 Albany 5.9 Albany 5.8 Darling Range 5.8 Balcatta
Note Darling Range has moved due to the Liberal Party winning the seat from Labor at a June 2018 by-election. Geraldton shown as a National seat following a change of party by sitting MP Ian Blayney.
06

2019 WA Redistribution
2019 WA Redistribution
7
Variations in Enrolments by District and Region
East Metropolitan Region Old Boundaries New Boundaries District Enrolment Variation Enrolment VariationArmadale 29,460 +6.84 29,460 +6.84Bassendean 27,181 ‐1.42 28,337 +2.77Belmont 27,832 +0.94 27,832 +0.94Darling Range 32,913 +19.37 29,181 +5.83Forrestfield 27,120 ‐1.64 27,120 ‐1.64Kalamunda 26,889 ‐2.48 28,890 +4.78Maylands 27,967 +1.43 27,967 +1.43Midland 30,465 +10.49 29,326 +6.36Mirrabooka 27,906 +1.21 28,888 +4.77Morley 25,657 ‐6.95 28,768 +4.33Mount Lawley 28,133 +2.03 28,133 +2.03Swan Hills 34,864 +26.44 28,392 +2.97Thornlie 28,445 +3.16 28,445 +3.16West Swan 30,513 +10.66 28,723 +4.17Region Total 405,345 +5.01 399,462 +3.48
North Metropolitan Region Old Boundaries New Boundaries District Enrolment Variation Enrolment VariationBalcatta 28,178 +2.19 28,284 +2.58Burns Beach 29,954 +8.64 28,200 +2.27Butler 34,345 +24.56 28,799 +4.45Carine 27,777 +0.74 29,754 +7.91Churchlands 27,023 ‐1.99 28,417 +3.06Cottesloe 27,499 ‐0.27 29,433 +6.75Hillarys 25,951 ‐5.88 28,930 +4.92Joondalup 29,463 +6.85 28,171 +2.17Kingsley 27,641 +0.25 29,573 +7.25Girrawheen/Landsdale 27,658 +0.31 28,944 +4.97Nedlands 27,637 +0.23 29,036 +5.31Perth 30,454 +10.45 29,055 +5.37Scarborough 29,079 +5.46 29,272 +6.16Wanneroo 28,336 +2.77 29,481 +6.92Region Total 400,995 +3.88 405,349 +5.01
Shading indicates districts outside the permitted variation from quota before the election.
07

2019 WA Redistribution
2019 WA Redistribution
8
South Metropolitan Region Old Boundaries New Boundaries District Enrolment Variation % Enrolment Variation %Baldivis 33,640 +22.00 29,162 +5.76Bateman 25,735 ‐6.67 29,367 +6.51Bicton 25,999 ‐5.71 26,959 ‐2.23Cannington 26,279 ‐4.69 27,704 +0.48Cockburn 28,944 +4.97 28,620 +3.80Fremantle 29,611 +7.39 28,651 +3.91Jandakot 31,246 +13.32 28,799 +4.45Kwinana 26,885 ‐2.50 26,567 ‐3.65Riverton 25,078 ‐9.05 28,181 +2.21Rockingham 27,107 ‐1.69 27,975 +1.46South Perth 28,794 +4.43 28,405 +3.02Southern River 27,919 +1.25 27,919 +1.25Victoria Park 28,806 +4.47 27,114 ‐1.66Warnbro 29,353 +6.46 29,353 +6.46Willagee 25,024 ‐9.24 27,173 ‐1.45Region Total 420,420 +1.65 421,949 +2.02
South West Region Old Boundaries New Boundaries District Enrolment Variation % Enrolment Variation %Albany 27,342 ‐0.84 26,600 ‐3.53Bunbury 28,274 +2.54 29,392 +6.60Collie‐Preston 28,887 +4.77 29,588 +7.31Dawesville 31,047 +12.60 29,374 +6.53Mandurah 30,300 +9.89 29,434 +6.75Murray‐Wellington 28,939 +4.95 28,967 +5.06Vasse 29,175 +5.81 29,287 +6.22Warren‐Blackwood 27,951 +1.37 28,531 +3.47South West Region 231,915 +5.14 231,173 +4.80
Shading indicates districts outside the permitted variation from quota before the election.
08

2019 WA Redistribution
2019 WA Redistribution
9
Agricultural Region – Old Boundaries District Enrolment Variation% LDA Roll + LDA Variation%Central Wheatbelt 25,855 ‐6.23 1,519 27,374 ‐0.72Geraldton 25,874 ‐6.16 0 25,874 ‐6.16Moore 24,206 ‐12.21 0 24,206 ‐12.21Roe 25,486 ‐7.57 1,596 27,082 ‐1.78Old Region Total 101,421 ‐8.04 3,115 104,536 ‐5.22
Agricultural Region – New Boundaries District Enrolment Variation % LDA Roll + LDA Variation %Central Wheatbelt 25,458 ‐7.67 1,532 26,990 ‐2.11Geraldton 25,874 ‐6.16 0 25,874 ‐6.16Moore 25,297 ‐8.25 0 25,297 ‐8.25Roe 24,545 ‐10.98 1,575 26,120 ‐5.27New Region Totals 101,174 ‐8.27 3,107 104,281 ‐5.45
Mining and Pastoral Region – Old Boundaries District Enrolment Variation % LDA Roll + LDA Variation %Kalgoorlie 19,622 ‐28.84 8,332 27,954 +1.38Kimberley 15,275 ‐44.60 6,315 21,590 ‐21.70North West Central 9,915 ‐64.04 12,256 22,171 ‐19.59Pilbara 21,885 ‐20.63 6,098 27,983 +1.49Old Region Total 66,697 ‐39.53 33,001 99,698 ‐9.61
Mining and Pastoral Region – New Boundaries District Enrolment Variation % LDA Roll + LDA Variation %Kalgoorlie 19,622 ‐28.84 8,332 27,954 +1.38Kimberley 15,460 ‐43.93 8,032 23,492 ‐14.80North West Central 10,904 ‐60.45 12,275 23,179 ‐15.94Pilbara 21,700 ‐21.30 4,383 26,083 ‐5.40New Region Total 67,686 ‐38.63 33,022 100,708 ‐8.69
Metropolitan Country Enrolment Variation % Enrolment Variation %
Western Australia 1,226,760 +3.47 400,033 ‐9.32
LDA = Large District Allowance
Shading indicates districts outside the permitted variation from quota before the election.
09

2019 WA Redistribution
2019 WA Redistribution
10
New Legislative Assembly Electoral Pendulum Electorate % Margin Electorate % Margin Labor Seats (40) Armadale 25.2 Warnbro 23.7 Rockingham 23.5 Mirrabooka 23.3 Fremantle 23.0 Bassendean 21.6 Kwinana 20.7 Butler 20.5 West Swan 18.4 Mandurah 18.0 Maylands 17.9 Willagee 17.7 Cannington 17.6 Victoria Park 16.8 Baldivis 16.6 Thornlie 15.8 Collie-Preston 14.7 Cockburn 14.3 Kimberley 13.1 Midland 12.8 Perth 12.6 Morley 12.3 Swan Hills 12.1 Belmont 11.4 Bunbury 10.5 Landsdale 9.6 Forrestfield 9.4 Wanneroo 8.6 Balcatta 8.0 Southern River 7.9 Albany 5.9 Burns Beach 5.4 Mount Lawley 4.0 Bicton 3.6 Kalamunda 2.3 Pilbara 2.2 Jandakot 1.8 Murray-Wellington 1.7 Kingsley 1.2 Joondalup 0.03
Liberal/Nationals Seats (13/6)Roe (NAT 13.8 v LIB) 25.9 Central Wheatbelt (NAT) 22.2 Moore (NAT 14.8 v LIB) 19.5 Vasse 14.6 Cottesloe 14.1 Warren-Blackwood (NAT) 12.8 Churchlands 11.7 Carine 10.2 North West Central (NAT) 10.1 Nedlands 8.0 Bateman 7.8 South Perth 7.2 Kalgoorlie 6.2 Scarborough 5.7 Riverton 4.2 Darling Range (See notes) 3.5 Geraldton (NAT) (See notes) 1.3 Dawesville 0.8 Hillarys 0.4
Note: Darling Range is shown as Liberal held based on the June 2018 by-election. The margin shown is from the by-election. Geraldton is shown as Nationals held based on the sitting MP switching from the Liberal to the National Party. For Moore and Roe, alternative Nationals versus Liberal two-candidate preferred margins are shown in brackets.
010

2019 WA Redistribution 2019 WA Redistribution
11
SUMMARY OF CHANGES TO ASSEMBLY DISTRICTS Electorate Name Old
Margin New
Margin Detail of Changes
Albany ALP 5.1 ALP 5.9 Strengthened slightly for Labor with the transfer of the Shire of Jerramungup to Roe
Armadale ALP 25.2 ALP 25.2 No change
Balcatta ALP 5.8 ALP 8.0 Strengthened for Labor with the gain of Westminster from Mirrabooka and loss of Hamersley to Kingsley.
Baldivis ALP 17.9 ALP 16.6 Loses Bertram and parts of Leda to Kwinana and part of Waikiki to Rockingham. Gains parts of Baldivis east of the Kwinana Freeway from Darling Range.
Bassendean ALP 21.5 ALP 21.6 Gains Bennett Springs and parts of Caversham from West Swan and Midland. Loses parts of Beechboro and Morley to Morley.
Bateman LIB 9.5 LIB 7.8 Gains parts of Kardinya and Murdoch from Willagee.
Belmont ALP 11.4 ALP 11.4 No change
Bicton ALP 2.9 ALP 3.6 Gains around a thousand voters in East Fremantle from Fremantle.
Bunbury ALP 10.8 ALP 10.5 Gains around 1,100 voters in Gelorup and areas south of Bunbury from Collie-Preston.
Burns Beach ALP 2.5 ALP 5.4 Strengthened for Labor as the seat moves north, gaining Quinns Rocks from Butler and loosing parts of Joondalup and Iluka in the south to Joondalup.
Butler ALP 19.4 ALP 20.5 Loses Quinns Rocks in the south to Burns Beach.
Cannington ALP 18.1 ALP 17.6 Loses the balance of the suburb of Riverton to Riverton. Gains part of Wilson from Victoria Park.
Carine LIB 9.0 LIB 10.2 Moves north, gaining Sorrento from Hillarys, losing parts of North Beach and Gwelup to Scarborough in the south.
Central Wheatbelt
NAT 22.6 NAT 22.2 Shifts south losing the Shires of Wongan-Ballidu, Goomalling and Dowerin to Moore, gaining the Shires of Cuballing, Wickepin and Kulin from Roe.
Churchlands LIB 13.2 LIB 11.7 Moves north, losing parts of City Beach to Cottesloe, gaining parts of Doubleview and Scarborough from Scarborough.
011

2019 WA Redistribution
2019 WA Redistribution
12
Electorate Name Old Margin
New Margin
Detail of Changes
Cockburn ALP 15.9 ALP 14.3 Moves east of the Kwinana Freeway in gaining Atwell from Kwinana. Loses parts of Spearwood and Munster to Willagee.
Collie-Preston ALP 14.7 ALP 14.7 Gains around 2,500 voters in the south of the Shire of Harvey from Murray-Wellington. Loses areas around Gelorup to Bunbury, Balingup to Warren-Blackwood and a smaller area around Capel River to Vasse.
Cottesloe LIB 13.3 LIB 14.1 Gains around 2,000 voters in City Beach from Churchlands.
Darling Range ALP 5.8 LIB 3.5 New margin based on by-election. Estimated Labor margin based on redistribution 6.0%. Loses Kalamunda and Mundaring Shires in the north, as well as parts of Baldivis and Wellard east of the Kwinana Freeway.
Dawesville LIB 0.7 LIB 0.8 Loses Clifton, Herron and Bouvard to Murray-Wellington. Loses part of Dudley Park to Mandurah.
Forrestfield ALP 9.4 ALP 9.4 No change
Fremantle ALP 23.1 ALP 23.0 Loses around a thousand voters in East Fremantle to Bicton.
Geraldton LIB 1.3 NAT 1.3 No change. MP Ian Blayney has defected from the Liberal to the National Party.
Hillarys LIB 4.1 LIB 0.4 Moves north, gaining Beldon and Mullaloo from Joondalup, losing Sorrento and its strong Liberal vote to Carine.
Jandakot ALP 1.0 ALP 1.8 Loses parts of Leeming east of Karel Avenue to Riverton.
Joondalup ALP 0.6 ALP 0.03 Moves north gaining parts of Joondalup and Iluka from Burns Beach, losing Beldon and Mullaloo in the south to Hillarys.
Kalamunda ALP 2.5 ALP 2.3 Gains around 2,000 voters in Mundaring and Pickering Brook from Darling Range.
Kalgoorlie LIB 6.2 LIB 6.2 No change
Kimberley ALP 13.0 ALP 13.1 Minor change gaining Gibson Desert North.
Kingsley ALP 0.7 ALP 1.2 Gains Hamersley from Balcatta.
Kwinana ALP 18.1 ALP 20.7 Loses Atwell in the north to Cockburn. Gains Bertram and parts of Leda in the south from Baldivis, and a part of Wellard from Darling Range.
Landsdale (formerly Girrawheen)
ALP 16.7 ALP 9.6 Loses the suburbs of Marangaroo and Girrawheen to Mirrabooka. Gains Hocking and Pearsall from Wanneroo and Alexander Heights from Mirrabooka.
012

2019 WA Redistribution 2019 WA Redistribution
13
Electorate Name Old Margin
New Margin
Detail of Changes
Mandurah ALP 18.0 ALP 18.0 Gains part of Dudley Park from Dawesville. Loses Barragup and Furnissdale to Murray-Wellington.
Maylands ALP 17.9 ALP 17.9 No change
Midland ALP 13.0 ALP 12.8 In the west loses around 1,100 voters in Caversham to Bassendean.
Mirrabooka ALP 19.2 ALP 23.3 Loses Westminster to Balcatta, the rest of Ballajura to West Swan and Alexander Heights to Landsdale. Gains Girrawheen and Marangaroo from the former seat of Girrawheen.
Moore NAT 18.2 NAT 19.5 Gains Wongan-Ballidu, Goomalling and Dowerin Shires from Central Wheatbelt. Loses Kalbarri to North West Central. In a two-candidate contest versus the Liberal Party, the National margin increases from 13.9% to 14.8%.
Morley ALP 11.4 ALP 12.3 Eastern boundary moves from the Tonkin Highway to Beechboro Road, gaining around 3,000 voters in parts of Morley and Beechboro from Bassendean.
Mount Lawley ALP 4.0 ALP 4.0 No change
Murray-Wellington
ALP 1.4 ALP 1.7 Minor boundary changes with neighbouring Mandurah, Dawesville and Collie-Preston.
Nedlands LIB 8.3 LIB 8.0 Gains West Perth from Perth.
North West Central
NAT 9.5 NAT 10.1 Gains Kalbarri from Moore.
Perth ALP 11.8 ALP 12.6 Loses West Perth to Nedlands.
Pilbara ALP 2.3 ALP 2.2 Minor change losing Gibson Desert North to Kimberley.
Riverton LIB 4.4 LIB 4.2 Gains the balance of Riverton from Cannington, and parts of Leeming east of Karel Avenue from Jandakot.
Rockingham ALP 23.4 ALP 23.5 Gains parts of Waikiki from Baldivis.
Roe NAT 26.3 NAT 25.9 Loses Shires of Cuballing, Wickepin and Kulin to Central Wheatbelt, gains Shire of Jerramungup from Albany. In a two-candidate contest versus the Liberal Party, the National margin slips from 14.4% to 13.8%.
Scarborough LIB 5.6 LIB 5.7 Moves north, gaining parts of Gwelup and North Beach from Carine, losing parts of Doubleview and Scarborough in the south to Churchlands.
South Perth LIB 7.1 LIB 7.2 Loses part of Kensington to neighbouring Victoria Park.
Southern River ALP 7.9 ALP 7.9 No change
013

2019 WA Redistribution 2019 WA Redistribution
14
Electorate Name Old Margin
New Margin
Detail of Changes
Swan Hills ALP 14.5 ALP 12.1 Loses the southern parts of Aveley and Ellenbrook to West Swan in exchange for more rural areas east of the Swan River around Herne Hill.
Thornlie ALP 15.8 ALP 15.8 No change
Vasse LIB 14.7 LIB 14.6 Gains a small number of voters around Capel River from Collie-Preston.
Victoria Park ALP 16.5 ALP 16.8 Minor boundary adjustments, gaining part of Kensington from South Perth, losing part of Wilson to Cannington.
Wanneroo ALP 7.3 ALP 8.6 Loses Hocking and Pearsall to Landsdale, gains Banksia Grove from West Swan.
Warnbro ALP 23.7 ALP 23.7 No change
Warren-Blackwood
NAT 13.4 NAT 12.8 Gains areas around Balingup from Collie-Preston.
West Swan ALP 17.1 ALP 18.4 Lots of changes, losing Banksia Grove to Wanneroo, Bennett Springs to Bassendean, Herne Hill and areas east of the Swan River to Swan Hills, gaining southern parts of Aveley and Ellenbrook from Swan Hills, and the balance of Ballajura from Mirrabooka.
Willagee ALP 15.5 ALP 17.7 Loses parts of Kardinya and Murdoch to Bateman. Gains parts of Spearwood and Munster from Cockburn.
014

2019 WA Redistribution
2019 WA Redistribution
15
DETAIL OF LEGISLATIVE ASSEMBLY DISTRICTS
Format for Listings
For each new electorate, a summary of total vote by party is provided, as well as detail of transfers between old and new electorates brought about by the redistribution.
The summary table includes an entry for all parties that contested polling places within the boundary of each new electorate. The table includes a total and percentage of first preference vote, two-candidate preferred vote and two-party preferred vote. Where an electorate includes transfers from electorates with different combinations of two-candidate preferred contestants in 2017 (eg Central Wheatbelt), there may be more than two parties listed under the two-party and two-candidate preferred totals.
The final line of each summary table shows the calculated total votes transferred to the new electorate as a percentage of the total enrolment at the date of the redistribution.
After the summary table, a series of totals are provided that correspond to transfers of enrolment between old and new electorates. There is a separate listing and total for each transfer. Transfers in from an old electorate are listed first, followed by transfers out of the existing electorate into new electorates.
An example of an enrolment transfer for Albany is shown below.
2-PARTY PREFERRED PRIMARY VOTES To: Roe (742 voters, 664 last election votes, 89.5% of enrolment) Bremer Bay Community Resource Centre, Jerramungup District High School, Declaration Vote (3%) Labor L/NP ALP LIB NAT GRN ONP OTHVotes 167 464 120 172 244 21 66 10 % 26.5 73.5 19.0 27.2 38.5 3.3 10.4 1.6
This example shows the transfer of an area out of Albany and into the electorate of Roe. The full listing for Albany also includes transfers from the old electorate of Albany to the new Albany.
Each entry shows the total number of enrolled voters transferred, as well as the calculated number of votes and the total transferred votes as a percentage of the enrolled voters.
The second line shows a list of booths that form part of the transfer. Booths that have been split are shown with a percentage indicating the proportion of the booth transferred. A percentage of declaration votes transferred is also shown. Totals of two-party preferred and first preference votes are shown with each transfer. Where a transfer includes an area that finished as a two-candidate preferred contest in 2008, a separate two-candidate preferred total is also provided under the party transfer totals.
015

2019 WA Redistribution
2019 WA Redistribution
16
AlbanyRedistributed Totals First Preference 2-Candidate 2-Party Preferred Party Votes % Votes % Votes % Labor Party 10229 44.6 12819 55.9 12819 55.9 Liberal Party 3977 17.3 The Nationals 4506 19.6 10123 44.1 10123 44.1 The Greens 1526 6.6 One Nation 1558 6.8 Australian Christians 1157 5.0
Formal Vote 22953 Informal Vote 808 3.4 Redistribution enrolment 26600 Transferred votes as a percentage of redistribution enrolment - 89.3%
Albany includes transfers from the following old electorates
2-PARTY PREFERRED PRIMARY VOTES From: Albany (26600 voters, 23760 last election votes, 89.3% of enrolment) Albany PCYC, Albany Primary School, Albany Sea Rescue Hall, Albany Senior Citizens Centre, Albany Surf Life Saving Club, Elleker Hall, Flinders Park Primary School, Great Southern Grammar, King River Hall, Little Grove Primary School, Mt Lockyer Primary School, Mt Manypeaks Primary School, Napier Hall, North Albany Senior High School, Redmond Hall, Spencer Park Primary School, Wellstead Community Resource Centre, Yakamia Primary School, Youngs Siding Hall, Special Institutions, Hospitals & Remotes, Declaration Vote (97%) Labor L/NP ALP LIB NAT GRN ONP OTHVotes 12819 10123 10229 3977 4506 1526 1558 1157 % 55.9 44.1 44.6 17.3 19.6 6.6 6.8 5.0
The following areas have been transferred out of Albany
2-PARTY PREFERRED PRIMARY VOTES To: Roe (742 voters, 664 last election votes, 89.5% of enrolment) Bremer Bay Community Resource Centre, Jerramungup District High School, Declaration Vote (3%) Labor L/NP ALP LIB NAT GRN ONP OTHVotes 167 464 120 172 244 21 66 10 % 26.5 73.5 19.0 27.2 38.5 3.3 10.4 1.6
016

2019 WA Redistribution
2019 WA Redistribution
17
ArmadaleRedistributed Totals First Preference 2-Candidate 2-Party Preferred Party Votes % Votes % Votes % Labor Party 15091 66.7 17008 75.2 17008 75.2 Liberal Party 3814 16.9 5619 24.8 5619 24.8 The Greens 1456 6.4 Australian Christians 1448 6.4 Micro Business party 269 1.2 Independent 556 2.5
Formal Vote 22634 Informal Vote 1325 5.5 Redistribution enrolment 29460 Transferred votes as a percentage of redistribution enrolment - 81.3%
Armadale includes transfers from the following old electorates
2-PARTY PREFERRED PRIMARY VOTES From: Armadale (29460 voters, 23959 last election votes, 81.3% of enrolment) Armadale Primary School, Cecil Andrews Senior High School, Challis Primary School, Free Reformed Church, Grovelands Primary School, Gwynne Park Primary School, Kelmscott Primary School, Kelmscott Senior High School, Kingsley Primary School, Westfield Park Primary School, Armadale Senior High School, Special Institutions, Hospitals & Remotes, Declaration Vote Labor L/NP ALP LIB GRN OTHVotes 17008 5619 15091 3814 1456 2273 % 75.2 24.8 66.7 16.9 6.4 10.0
Note: Boundaries unchanged.
017

2019 WA Redistribution
2019 WA Redistribution
18
BalcattaRedistributed Totals First Preference 2-Candidate 2-Party Preferred Party Votes % Votes % Votes % Labor Party 10702 46.7 13303 58.0 13303 58.0 Liberal Party 8291 36.2 9623 42.0 9623 42.0 The Greens 2358 10.3 Australian Christians 732 3.2 Liberal Democrats 202 0.9 Micro Business party 522 2.3 Independent 126 0.5
Formal Vote 22933 Informal Vote 1575 6.4 Redistribution enrolment 28284 Transferred votes as a percentage of redistribution enrolment - 86.6%
Balcatta includes transfers from the following old electorates
2-PARTY PREFERRED PRIMARY VOTES From: Balcatta (24556 voters, 21257 last election votes, 86.6% of enrolment) Balcatta Primary School, Balcatta Senior High School, Osborne Park Community Centre, Osborne Park Hospital, Osborne Primary School, St Denis School, Takari Primary School, Tuart Hill Primary School, Special Institutions, Hospitals & Remotes, Declaration Vote (87%) Labor L/NP ALP LIB GRN OTHVotes 11180 8804 8923 7634 2121 1310 % 55.9 44.1 44.6 38.2 10.6 6.6
From: Mirrabooka (3728 voters, 3250 last election votes, 87.2% of enrolment) Balga Primary School (25%), Westminster Primary School, Declaration Vote (13%) Labor L/NP ALP LIB GRN OTHVotes 2124 818 1779 657 237 271 % 72.2 27.8 60.4 22.3 8.1 9.2
The following areas have been transferred out of Balcatta
2-PARTY PREFERRED PRIMARY VOTES To: Kingsley (3622 voters, 3371 last election votes, 93.1% of enrolment) East Hamersley Primary School, Glendale Primary School, Declaration Vote (13%) Labor L/NP ALP LIB GRN OTHVotes 1771 1442 1345 1250 385 234 % 55.1 44.9 41.8 38.9 12.0 7.3
018

2019 WA Redistribution
2019 WA Redistribution
19
BaldivisRedistributed Totals First Preference 2-Candidate 2-Party Preferred Party Votes % Votes % Votes % Labor Party 8742 42.8 11114 54.4 13625 66.6 Liberal Party 2947 14.4 6842 33.4 The Greens 1066 5.2 One Nation 1540 7.5 Australian Christians 509 2.5 Others 671 3.3 Matt Whitfield (IND) 4970 24.3 9322 45.6
Formal Vote 20445 Informal Vote 944 4.4 Redistribution enrolment 29162 Transferred votes as a percentage of redistribution enrolment - 73.3%
Baldivis includes transfers from the following old electorates
2-PARTY PREFERRED PRIMARY VOTES From: Baldivis (28633 voters, 21239 last election votes, 74.2% of enrolment) Baldivis Primary School, Bertram Primary School (25%), Makybe Rise Primary School, Peter Carnley Anglican Community School, Rivergums Primary School, Rockingham John Calvin School, South Coast Baptist College, The Kings College (50%), Tranby College, Tuart Rise Primary School, Waikiki Primary School, Special Institutions, Hospitals & Remotes, Declaration Vote (85%) Labor L/NP ALP LIB GRN ONP OTHVotes 13545 6779 8683 2903 1055 1528 6134 % 66.6 33.4 42.8 14.3 5.2 7.5 30.2 2-Candidate Preferred: ALP 10891 (53.6%) IND 9413 (46.4%)
From: Darling Range (529 voters, 150 last election votes, 28.4% of enrolment) Declaration Vote (2%) Labor L/NP ALP LIB GRN ONP OTHVotes 80 63 59 43 11 12 17 % 55.9 44.1 41.5 30.3 7.7 8.5 12.0
The following areas have been transferred out of Baldivis
2-PARTY PREFERRED PRIMARY VOTES To: Kwinana (4139 voters, 4174 last election votes, 100.8% of enrolment) Bertram Primary School (75%), Leda Primary School, The Kings College (50%), Declaration Vote (12%) Labor L/NP ALP LIB GRN ONP OTHVotes 2826 1116 2123 604 308 277 643 % 71.7 28.3 53.7 15.3 7.8 7.0 16.3 2-Candidate Preferred: ALP 2770 (70.2%) IND 1176 (29.8%)
To: Rockingham (868 voters, 776 last election votes, 89.4% of enrolment) East Waikiki Primary School, Declaration Vote (3%) Labor L/NP ALP LIB GRN ONP OTHVotes 574 169 442 62 32 52 156 % 77.3 22.7 59.4 8.3 4.3 7.0 21.0 2-Candidate Preferred: ALP 510 (68.5%) IND 234 (31.5%)
Note: Labor won Baldivis in 2017 with an estimated margin of 7.2% versus Independent Matt Whitfield.
019

2019 WA Redistribution
2019 WA Redistribution
20
Bassendean Redistributed Totals First Preference 2-Candidate 2-Party Preferred Party Votes % Votes % Votes % Labor Party 14042 59.5 16903 71.6 16903 71.6 Liberal Party 5409 22.9 6706 28.4 6706 28.4 The Greens 2579 10.9 One Nation 69 0.3 Australian Christians 749 3.2 Julie Matheson for WA 46 0.2 Shooters, Fishers, Farmers 92 0.4 Micro Business party 629 2.7
Formal Vote 23615 Informal Vote 1550 6.2 Redistribution enrolment 28337 Transferred votes as a percentage of redistribution enrolment - 88.8%
Bassendean includes transfers from the following old electorates
2-PARTY PREFERRED PRIMARY VOTES From: Bassendean (24070 voters, 21289 last election votes, 88.4% of enrolment) Anzac Terrace Primary School, Ashfield Primary School, Bassendean Primary School, Beechboro Primary School, East Beechboro Primary School, Eden Hill Primary School, Hampton Senior High School (50%), John Septimus Roe Anglican Community School (50%), Kiara College, Lockridge Primary School, Special Institutions, Hospitals & Remotes, Declaration Vote (89%) Labor L/NP ALP LIB GRN OTHVotes 14307 5670 11763 4606 2343 1275 % 71.6 28.4 58.9 23.0 11.7 6.4
From: Midland (1145 voters, 984 last election votes, 85.9% of enrolment) East Beechboro Primary School, Declaration Vote (4%) Labor L/NP ALP LIB GRN ONP OTHVotes 644 293 567 218 53 69 31 % 68.7 31.3 60.4 23.2 5.7 7.4 3.3
From: West Swan (3122 voters, 2891 last election votes, 92.6% of enrolment) Cracovia Club, Declaration Vote (10%) Labor L/NP ALP LIB GRN OTHVotes 1953 743 1712 585 183 210 % 72.4 27.6 63.6 21.7 6.8 7.8
The following areas have been transferred out of Bassendean
2-PARTY PREFERRED PRIMARY VOTES To: Morley (3111 voters, 2508 last election votes, 80.6% of enrolment) Hampton Senior High School (50%), John Septimus Roe Anglican Community School (50%), Declaration Vote (11%) Labor L/NP ALP LIB GRN OTHVotes 1659 696 1443 589 184 139 % 70.4 29.6 61.3 25.0 7.8 5.9
020

2019 WA Redistribution
2019 WA Redistribution
21
BatemanRedistributed Totals First Preference 2-Candidate 2-Party Preferred Party Votes % Votes % Votes % Labor Party 7827 30.4 10867 42.2 10867 42.2 Liberal Party 12820 49.8 14889 57.8 14889 57.8 The Greens 2672 10.4 One Nation 1032 4.0 Australian Christians 806 3.1 Socialist Alliance 17 0.1 Julie Matheson for WA 206 0.8 Micro Business party 383 1.5
Formal Vote 25763 Informal Vote 927 3.5 Redistribution enrolment 29367 Transferred votes as a percentage of redistribution enrolment - 90.9%
Bateman includes transfers from the following old electorates
2-PARTY PREFERRED PRIMARY VOTES From: Bateman (25735 voters, 23361 last election votes, 90.8% of enrolment) Applecross Primary School, Ardross Primary School, Bateman Primary School, Booragoon Primary School, Brentwood Primary School, Corpus Christi College, Len Shearer Pavilion, Mt Pleasant Primary School, St Benedict's Hall, Winthrop Primary School, Special Institutions, Hospitals & Remotes, Declaration Vote Labor L/NP ALP LIB GRN ONP OTHVotes 9148 13418 6469 11515 2315 1032 1238 % 40.5 59.5 28.7 51.0 10.3 4.6 5.5
From: Willagee (3632 voters, 3328 last election votes, 91.6% of enrolment) Kardinya Primary School (90%), Declaration Vote (15%) Labor L/NP ALP LIB GRN OTHVotes 1719 1471 1358 1305 357 174 % 53.9 46.1 42.5 40.9 11.2 5.4
021

2019 WA Redistribution
2019 WA Redistribution
22
BelmontRedistributed Totals First Preference 2-Candidate 2-Party Preferred Party Votes % Votes % Votes % Labor Party 10547 49.2 13162 61.4 13162 61.4 Liberal Party 6500 30.3 8273 38.6 8273 38.6 The Greens 1621 7.6 One Nation 1397 6.5 Australian Christians 394 1.8 Animal Justice 355 1.7 Shooters, Fishers, Farmers 356 1.7 Micro Business party 280 1.3
Formal Vote 21450 Informal Vote 1169 5.2 Redistribution enrolment 27832 Transferred votes as a percentage of redistribution enrolment - 81.3%
Belmont includes transfers from the following old electorates
2-PARTY PREFERRED PRIMARY VOTES From: Belmont (27832 voters, 22619 last election votes, 81.3% of enrolment) Belmont City College, Belmont Park Tennis Club, Belmont Primary School, Carlisle Primary School, Hazelmere Community Hall, Kewdale Primary School, Nations Church, Redcliffe Primary School, Rivervale Primary School, St Augustine's School, Special Institutions, Hospitals & Remotes, Declaration Vote Labor L/NP ALP LIB GRN ONP OTHVotes 13162 8273 10547 6500 1621 1397 1385 % 61.4 38.6 49.2 30.3 7.6 6.5 6.5
Note: Boundaries unchanged.
022

2019 WA Redistribution
2019 WA Redistribution
23
BictonRedistributed Totals First Preference 2-Candidate 2-Party Preferred Party Votes % Votes % Votes % Labor Party 9338 39.9 12546 53.6 12546 53.6 Liberal Party 9890 42.3 10839 46.4 10839 46.4 The Greens 2590 11.1 Australian Christians 246 1.1 Animal Justice 325 1.4 Micro Business party 232 1.0 Independent 734 3.1 Others 37 0.2
Formal Vote 23392 Informal Vote 722 3.0 Redistribution enrolment 26959 Transferred votes as a percentage of redistribution enrolment - 89.4%
Bicton includes transfers from the following old electorates
2-PARTY PREFERRED PRIMARY VOTES From: Bicton (25999 voters, 23312 last election votes, 89.7% of enrolment) Attadale Primary School, Bicton Primary School, Melville Primary School, Melville Recreation Centre, Melville Senior High School, Palmyra Primary School, Richmond Primary School, St Peter's Anglican Church Hall, Tricolore Community Centre, Special Institutions, Hospitals & Remotes, Declaration Vote Labor L/NP ALP LIB GRN OTHVotes 11968 10641 8955 9734 2406 1522 % 52.9 47.1 39.6 43.0 10.6 6.7
From: Fremantle (960 voters, 802 last election votes, 83.5% of enrolment) East Fremantle Primary School (40%), Declaration Vote (3%) Labor L/NP ALP LIB GRN ONP OTHVotes 578 198 383 156 184 15 37 % 74.5 25.5 49.4 20.1 23.7 1.9 4.8
023

2019 WA Redistribution
2019 WA Redistribution
24
BunburyRedistributed Totals First Preference 2-Candidate 2-Party Preferred Party Votes % Votes % Votes % Labor Party 10495 43.5 14576 60.5 14576 60.5 Liberal Party 5395 22.4 9512 39.5 9512 39.5 The Nationals 3338 13.9 The Greens 1631 6.8 One Nation 2132 8.8 Shooters, Fishers, Farmers 855 3.5 Micro Business party 65 0.3 Flux the System! 172 0.7 Independent 18 0.1
Formal Vote 24101 Informal Vote 1195 4.7 Redistribution enrolment 29392 Transferred votes as a percentage of redistribution enrolment - 86.1%
Bunbury includes transfers from the following old electorates
2-PARTY PREFERRED PRIMARY VOTES From: Bunbury (28274 voters, 24179 last election votes, 85.5% of enrolment) Adam Road Primary School, Bunbury Catholic College, Bunbury CBD, Bunbury Pre-Primary Centre, Carey Park Primary School, Cooinda Primary School, Dalyellup Primary School, Maidens Park Primary School, Milligan House Child Care Centre, Picton Primary School, South Bunbury Pre-Primary Centre, South West Health Campus, Special Institutions, Hospitals & Remotes, Declaration Vote Labor L/NP ALP LIB NAT GRN ONP OTHVotes 14003 9010 10099 5118 3162 1559 2050 1041 % 60.8 39.2 43.9 22.2 13.7 6.8 8.9 4.5
From: Collie-Preston (1118 voters, 1117 last election votes, 99.9% of enrolment) Gelorup Community Centre (60%), Declaration Vote (4%) Labor L/NP ALP LIB NAT GRN ONP OTHVotes 573 502 396 277 176 72 82 69 % 53.3 46.7 36.9 25.8 16.4 6.7 7.6 6.4
024

2019 WA Redistribution
2019 WA Redistribution
25
Burns Beach Redistributed Totals First Preference 2-Candidate 2-Party Preferred Party Votes % Votes % Votes % Labor Party 9879 44.3 12356 55.4 12356 55.4 Liberal Party 8366 37.5 9954 44.6 9954 44.6 The Greens 2037 9.1 One Nation 377 1.7 Australian Christians 466 2.1 Family First 386 1.7 Julie Matheson for WA 392 1.8 Shooters, Fishers, Farmers 151 0.7 Micro Business party 265 1.2
Formal Vote 22319 Informal Vote 1248 5.3 Redistribution enrolment 28200 Transferred votes as a percentage of redistribution enrolment - 83.6%
Burns Beach includes transfers from the following old electorates
2-PARTY PREFERRED PRIMARY VOTES From: Burns Beach (22654 voters, 19164 last election votes, 84.6% of enrolment) Bramston Park Community Sporting Facility (40%), Clarkson Community High School, Comet School, Currambine Primary School, Francis Jordan Catholic School (25%), Kinross Primary School, MacNaughton Clubrooms, Mindarie Primary School, Mindarie Senior College, Somerly Primary School, Declaration Vote (76%) Labor L/NP ALP LIB GRN OTHVotes 9655 8475 7849 7354 1636 1294 % 53.3 46.7 43.3 40.6 9.0 7.1
From: Butler (5546 voters, 4403 last election votes, 79.4% of enrolment) Gumblossom Community Centre, Quinns Beach Primary School, Declaration Vote (16%) Labor L/NP ALP LIB GRN ONP OTHVotes 2701 1479 2030 1012 401 377 366 % 64.6 35.4 48.5 24.2 9.6 9.0 8.7
The following areas have been transferred out of Burns Beach
2-PARTY PREFERRED PRIMARY VOTES To: Joondalup (7300 voters, 5775 last election votes, 79.1% of enrolment) Bramston Park Community Sporting Facility (60%), Francis Jordan Catholic School (75%), Joondalup Primary School, Declaration Vote (24%) Labor L/NP ALP LIB GRN OTHVotes 2740 2737 2216 2419 422 424 % 50.0 50.0 40.4 44.1 7.7 7.7
025

2019 WA Redistribution
2019 WA Redistribution
26
ButlerRedistributed Totals First Preference 2-Candidate 2-Party Preferred Party Votes % Votes % Votes % Labor Party 11376 57.5 13949 70.5 13949 70.5 Liberal Party 3988 20.2 5832 29.5 5832 29.5 The Greens 1253 6.3 One Nation 1754 8.9 Australian Christians 334 1.7 Julie Matheson for WA 169 0.9 Shooters, Fishers, Farmers 733 3.7 Micro Business party 174 0.9
Formal Vote 19781 Informal Vote 1009 4.9 Redistribution enrolment 28799 Transferred votes as a percentage of redistribution enrolment - 72.2%
Butler includes transfers from the following old electorates
2-PARTY PREFERRED PRIMARY VOTES From: Butler (28799 voters, 20789 last election votes, 72.2% of enrolment) Butler Primary School, East Butler Primary School, Merriwa Primary School, RAAFA Estate - Merriwa, Two Rocks Primary School, Yanchep Beach Primary School, Yanchep District High School, Special Institutions, Hospitals & Remotes, Declaration Vote (84%) Labor L/NP ALP LIB GRN ONP OTHVotes 13949 5832 11376 3988 1253 1754 1410 % 70.5 29.5 57.5 20.2 6.3 8.9 7.1
The following areas have been transferred out of Butler
2-PARTY PREFERRED PRIMARY VOTES To: Burns Beach (5546 voters, 4403 last election votes, 79.4% of enrolment) Gumblossom Community Centre, Quinns Beach Primary School, Declaration Vote (16%) Labor L/NP ALP LIB GRN ONP OTHVotes 2701 1479 2030 1012 401 377 366 % 64.6 35.4 48.5 24.2 9.6 9.0 8.7
026

2019 WA Redistribution
2019 WA Redistribution
27
CanningtonRedistributed Totals First Preference 2-Candidate 2-Party Preferred Party Votes % Votes % Votes % Labor Party 11936 54.5 14781 67.6 14781 67.6 Liberal Party 5286 24.1 7090 32.4 7090 32.4 The Greens 1982 9.1 One Nation 1342 6.1 Australian Christians 815 3.7 Micro Business party 325 1.5 (unaffiliated) 207 0.9
Formal Vote 21893 Informal Vote 1125 4.9 Redistribution enrolment 27704 Transferred votes as a percentage of redistribution enrolment - 83.1%
Cannington includes transfers from the following old electorates
2-PARTY PREFERRED PRIMARY VOTES From: Cannington (25623 voters, 21393 last election votes, 83.5% of enrolment) Bannister Creek Primary School, Beckenham Community Church, Brookman Primary School, Fountain College, Gibbs Street Primary School, Lynwood Christian Church, Parkwood Primary School (85%), Sevenoaks Senior College, St Norbert College, Special Institutions, Hospitals & Remotes, Declaration Vote (98%) Labor L/NP ALP LIB GRN ONP OTHVotes 13841 6474 11186 4824 1806 1342 1176 % 68.1 31.9 55.0 23.7 8.9 6.6 5.8
From: Victoria Park (2081 voters, 1624 last election votes, 78.0% of enrolment) Wilson Primary School (60%), Declaration Vote (7%) Labor L/NP ALP LIB GRN OTHVotes 940 616 750 463 175 170 % 60.4 39.6 48.1 29.7 11.2 10.9
The following areas have been transferred out of Cannington
2-PARTY PREFERRED PRIMARY VOTES To: Riverton (656 voters, 564 last election votes, 86.0% of enrolment) Parkwood Primary School (15%), Declaration Vote (2%) Labor L/NP ALP LIB GRN ONP OTHVotes 349 187 288 146 44 30 29 % 65.1 34.9 53.6 27.2 8.2 5.6 5.4
027

2019 WA Redistribution
2019 WA Redistribution
28
CarineRedistributed Totals First Preference 2-Candidate 2-Party Preferred Party Votes % Votes % Votes % Labor Party 7321 27.2 10708 39.8 10708 39.8 Liberal Party 13519 50.2 16200 60.2 16200 60.2 The Greens 2824 10.5 One Nation 1128 4.2 Australian Christians 579 2.2 Julie Matheson for WA 269 1.0 Micro Business party 395 1.5 Independent 879 3.3
Formal Vote 26914 Informal Vote 1008 3.6 Redistribution enrolment 29754 Transferred votes as a percentage of redistribution enrolment - 93.8%
Carine includes transfers from the following old electorates
2-PARTY PREFERRED PRIMARY VOTES From: Carine (24256 voters, 23086 last election votes, 95.2% of enrolment) Carine Senior High School, Davallia Primary School, Duncraig Primary School, Duncraig Senior High School, Glengarry Primary School, Karrinyup Primary School, Marmion Primary School, North Beach Community Centre, North Beach Primary School (50%), Poynter Primary School, Special Institutions, Hospitals & Remotes, Declaration Vote (87%) Labor L/NP ALP LIB GRN ONP OTHVotes 9129 13136 6345 11163 2509 1128 1127 % 41.0 59.0 28.5 50.1 11.3 5.1 5.1
From: Hillarys (5498 voters, 4836 last election votes, 88.0% of enrolment) Sacred Heart College (85%), Sorrento Primary School, Declaration Vote (20%) Labor L/NP ALP LIB GRN OTHVotes 1579 3064 976 2356 316 995 % 34.0 66.0 21.0 50.7 6.8 21.4
The following areas have been transferred out of Carine
2-PARTY PREFERRED PRIMARY VOTES To: Scarborough (3521 voters, 1909 last election votes, 54.2% of enrolment) North Beach Primary School (50%), Declaration Vote (13%) Labor L/NP ALP LIB GRN ONP OTHVotes 736 1103 496 922 226 105 90 % 40.0 60.0 27.0 50.1 12.3 5.7 4.9
028

2019 WA Redistribution
2019 WA Redistribution
29
Central Wheatbelt Redistributed Totals First Preference 2-Candidate 2-Party Preferred Party Votes % Votes % Votes % Labor Party 4285 19.5 5773 26.4 6095 27.8 Liberal Party 2546 11.6 418 1.9 The Nationals 10100 46.1 15714 71.7 15812 72.2 The Greens 689 3.1 One Nation 2524 11.5 Australian Christians 464 2.1 Shooters, Fishers, Farmers 1164 5.3 Independent 149 0.7
Formal Vote 21921 Informal Vote 900 3.9 Redistribution enrolment 25458 Transferred votes as a percentage of redistribution enrolment - 89.6%
Central Wheatbelt includes transfers from the following old electorates
2-PARTY PREFERRED PRIMARY VOTES From: Central Wheatbelt (23775 voters, 21182 last election votes, 89.1% of enrolment) Bakers Hill Primary School, Beacon Community Resource Centre, Bencubbin Community Resource Centre, Beverley Lesser Hall, Boddington Shire Chambers, Brookton District High School, Bruce Rock Shire Hall, Corrigin Senior Citizens Centre, Cunderdin District High School, Grass Valley Hall, Greenhills Hall, Hyden Community Resource Centre, Kellerberrin Memorial Hall, Kondinin Primary School, Koorda Emergency Centre, Meckering Primary School, Merredin Community Resource Centre, Merredin Senior Centre, Mukinbudin Shire Chambers, Narembeen District High School, Northam Memorial Hall, Northam Primary School, Nungarin Primary School, Pingelly Town Hall, Quairading Town Hall, Southern Cross Community Centre, Tammin Lesser Hall, Trayning Community Centre, Wandering Primary School, Westonia Shire Office, Wundowie Primary School, Wyalkatchem Community Resource Centre, York District High School, Special Institutions, Hospitals & Remotes, Declaration Vote (92%) Labor L/NP ALP LIB NAT GRN ONP OTHVotes 5774 14539 4098 2275 9295 646 2387 1628 % 28.4 71.6 20.2 11.2 45.7 3.2 11.7 8.0
From: Roe (1683 voters, 1639 last election votes, 97.4% of enrolment) Cuballing Agricultural Hall, Harrismith Community Hall, Kulin Resource Centre, Popanyinning Agricultural Hall, Wickepin Primary School, Yealering Hall, Declaration Vote (7%) Labor L/NP ALP LIB NAT GRN ONP OTHVotes 321 1272 187 271 805 43 137 149 % 20.2 79.8 11.7 17.0 50.6 2.7 8.6 9.4 2-Candidate Preferred: LIB 418 (26.3%) NAT 1174 (73.7%)
The following areas have been transferred out of Central Wheatbelt
2-PARTY PREFERRED PRIMARY VOTES To: Moore (2080 voters, 2065 last election votes, 99.3% of enrolment) Dowerin Lesser Hall, Goomalling Community Resource Centre, Wongan Hills Community Resource Centre, Declaration Vote (8%) Labor L/NP ALP LIB NAT GRN ONP OTHVotes 348 1615 208 221 1179 39 187 130 % 17.7 82.3 10.6 11.3 60.0 2.0 9.5 6.6
029

2019 WA Redistribution
2019 WA Redistribution
30
ChurchlandsRedistributed Totals First Preference 2-Candidate 2-Party Preferred Party Votes % Votes % Votes % Labor Party 5759 23.6 9351 38.3 9351 38.3 Liberal Party 12987 53.1 15081 61.7 15081 61.7 The Greens 3441 14.1 One Nation 107 0.4 Australian Christians 511 2.1 Julie Matheson for WA 269 1.1 Micro Business party 368 1.5 Independent 999 4.1
Formal Vote 24441 Informal Vote 820 3.2 Redistribution enrolment 28417 Transferred votes as a percentage of redistribution enrolment - 88.9%
Churchlands includes transfers from the following old electorates
2-PARTY PREFERRED PRIMARY VOTES From: Churchlands (25089 voters, 22367 last election votes, 89.2% of enrolment) Churchlands Primary School, Floreat Park Primary School, Floreat Primary - Early Education Centre, Kapinara Primary School, Lake Monger Primary School, Wembley Downs Primary School, Wembley Primary School, West Leederville Primary School, WestCity Church - Wembley, Woodlands Primary School, Special Institutions, Hospitals & Remotes, Declaration Vote (93%) Labor L/NP ALP LIB GRN OTHVotes 8157 13478 5034 11640 2944 2026 % 37.7 62.3 23.3 53.8 13.6 9.4
From: Scarborough (3328 voters, 2892 last election votes, 86.9% of enrolment) Doubleview Primary School (50%), Declaration Vote (11%) Labor L/NP ALP LIB GRN ONP OTHVotes 1194 1603 726 1347 497 107 119 % 42.7 57.3 26.0 48.2 17.8 3.8 4.3
The following areas have been transferred out of Churchlands
2-PARTY PREFERRED PRIMARY VOTES To: Cottesloe (1934 voters, 1804 last election votes, 93.3% of enrolment) City Beach Primary School, Declaration Vote (7%) Labor L/NP ALP LIB GRN OTHVotes 444 1298 278 1199 160 104 % 25.5 74.5 16.0 68.9 9.2 6.0
030

2019 WA Redistribution
2019 WA Redistribution
31
CockburnRedistributed Totals First Preference 2-Candidate 2-Party Preferred Party Votes % Votes % Votes % Labor Party 12105 51.7 15053 64.3 15053 64.3 Liberal Party 6656 28.4 8359 35.7 8359 35.7 The Greens 2093 8.9 One Nation 425 1.8 Australian Christians 608 2.6 Micro Business party 282 1.2 Flux the System! 227 1.0 Independent 1029 4.4
Formal Vote 23425 Informal Vote 1270 5.1 Redistribution enrolment 28620 Transferred votes as a percentage of redistribution enrolment - 86.3%
Cockburn includes transfers from the following old electorates
2-PARTY PREFERRED PRIMARY VOTES From: Cockburn (23163 voters, 19347 last election votes, 83.5% of enrolment) Beeliar Primary School, Coogee Primary School, Jandakot Primary School, Mater Christi Catholic Primary School, South Coogee Primary School, St Jerome's School (50%), St Michael Church (25%), Success Primary School, Yangebup Primary School, Special Institutions, Hospitals & Remotes, Declaration Vote (80%) Labor L/NP ALP LIB GRN OTHVotes 11986 6347 9713 5076 1611 1945 % 65.4 34.6 52.9 27.7 8.8 10.6
From: Kwinana (5457 voters, 5348 last election votes, 98.0% of enrolment) Atwell Primary School, Harmony Primary School (75%), Declaration Vote (20%) Labor L/NP ALP LIB GRN ONP OTHVotes 3067 2011 2392 1581 481 425 201 % 60.4 39.6 47.1 31.1 9.5 8.4 4.0
The following areas have been transferred out of Cockburn
2-PARTY PREFERRED PRIMARY VOTES To: Willagee (5781 voters, 5241 last election votes, 90.7% of enrolment) Newton Primary School, Spearwood Primary School, St Jerome's School (50%), St Michael Church (75%), Declaration Vote (20%) Labor L/NP ALP LIB GRN OTHVotes 3321 1567 2743 1314 459 373 % 67.9 32.1 56.1 26.9 9.4 7.6
031

2019 WA Redistribution
2019 WA Redistribution
32
Collie-PrestonRedistributed Totals First Preference 2-Candidate 2-Party Preferred Party Votes % Votes % Votes % Labor Party 12236 50.0 15820 64.7 15820 64.7 Liberal Party 4393 17.9 8645 35.3 8645 35.3 The Nationals 3183 13.0 The Greens 1053 4.3 One Nation 2110 8.6 Shooters, Fishers, Farmers 957 3.9 Independent 559 2.3
Formal Vote 24491 Informal Vote 1089 4.3 Redistribution enrolment 29588 Transferred votes as a percentage of redistribution enrolment - 86.5%
Collie-Preston includes transfers from the following old electorates
2-PARTY PREFERRED PRIMARY VOTES From: Collie-Preston (27077 voters, 24110 last election votes, 89.0% of enrolment) Allanson Primary School, Australind Community Hall, Boyanup Primary School, Capel Community Centre, Clifton Park Primary School, Collie Senior High School, Dardanup Hall, Donnybrook Soldiers Memorial Hall, Eaton Community College, Eaton Hall, Ferguson Hall, Gelorup Community Centre (40%), Kirup Hall, Margaretta Wilson Centre, North Collie Hall, River Valley Primary School, Wilson Park Primary School, Yabberup Hall, Special Institutions, Hospitals & Remotes, Declaration Vote (94%) Labor L/NP ALP LIB NAT GRN ONP OTHVotes 15068 7991 11678 4016 3008 983 1954 1447 % 65.3 34.7 50.6 17.4 13.0 4.3 8.5 6.3
From: Murray-Wellington (2511 voters, 1470 last election votes, 58.5% of enrolment) Riverlinks Community Centre (75%), Declaration Vote (9%) Labor L/NP ALP LIB NAT GRN ONP OTHVotes 752 654 559 377 175 70 156 69 % 53.5 46.5 39.8 26.8 12.4 5.0 11.1 4.9
The following areas have been transferred out of Collie-Preston
2-PARTY PREFERRED PRIMARY VOTES To: Bunbury (1118 voters, 1117 last election votes, 99.9% of enrolment) Gelorup Community Centre (60%), Declaration Vote (4%) Labor L/NP ALP LIB NAT GRN ONP OTHVotes 573 502 396 277 176 72 82 69 % 53.3 46.7 36.9 25.8 16.4 6.7 7.6 6.4
To: Vasse (112 voters, 37 last election votes, 33.0% of enrolment) Declaration Vote (0%) Labor L/NP ALP LIB NAT GRN ONP OTHVotes 23 13 18 6 5 2 3 2 % 63.9 36.1 50.0 16.7 13.9 5.6 8.3 5.6
To: Warren-Blackwood (580 voters, 573 last election votes, 98.8% of enrolment) Balingup Primary School, Declaration Vote (2%) Labor L/NP ALP LIB NAT GRN ONP OTHVotes 346 215 167 103 114 109 31 34 % 61.7 38.3 29.9 18.5 20.4 19.5 5.6 6.1
032

2019 WA Redistribution
2019 WA Redistribution
33
CottesloeRedistributed Totals First Preference 2-Candidate 2-Party Preferred Party Votes % Votes % Votes % Labor Party 5558 22.1 9034 35.9 9034 35.9 Liberal Party 14463 57.5 16097 64.1 16097 64.1 The Greens 2986 11.9 Australian Christians 239 1.0 Julie Matheson for WA 18 0.1 Micro Business party 213 0.8 Independent 1493 5.9 (unaffiliated) 176 0.7
Formal Vote 25146 Informal Vote 882 3.4 Redistribution enrolment 29433 Transferred votes as a percentage of redistribution enrolment - 88.4%
Cottesloe includes transfers from the following old electorates
2-PARTY PREFERRED PRIMARY VOTES From: Churchlands (1934 voters, 1804 last election votes, 93.3% of enrolment) City Beach Primary School, Declaration Vote (7%) Labor L/NP ALP LIB GRN OTHVotes 444 1298 278 1199 160 104 % 25.5 74.5 16.0 68.9 9.2 6.0
From: Cottesloe (27499 voters, 24224 last election votes, 88.1% of enrolment) Cottesloe Civic Centre Lesser Hall, Cottesloe Primary School, Freshwater Bay Primary School, Mosman Park Primary School, Mount Claremont Primary School, North Cottesloe Primary School, North Fremantle Primary School, Saint Hilda's Anglican School for Girls - Chidley Campus, Swanbourne Primary School, Special Institutions, Hospitals & Remotes, Declaration Vote Labor L/NP ALP LIB GRN OTHVotes 8590 14799 5280 13264 2826 2035 % 36.7 63.3 22.6 56.7 12.1 8.7
033

2019 WA Redistribution
2019 WA Redistribution
34
Darling Range Redistributed Totals First Preference 2-Candidate 2-Party Preferred Party Votes % Votes % Votes % Labor Party 10116 41.8 13550 56.0 13550 56.0 Liberal Party 7243 29.9 10638 44.0 10638 44.0 The Greens 1856 7.7 One Nation 2122 8.8 Australian Christians 1126 4.7 Shooters, Fishers, Farmers 1025 4.2 Micro Business party 292 1.2 Others 423 1.7
Formal Vote 24203 Informal Vote 1252 4.9 Redistribution enrolment 29181 Transferred votes as a percentage of redistribution enrolment - 87.2%
Darling Range includes transfers from the following old electorates 2-PARTY PREFERRED PRIMARY VOTES From: Darling Range (29181 voters, 25455 last election votes, 87.2% of enrolment) Armadale Primary, Bedfordale District Hall, Bruno Gianetti Hall, Byford Hall, Clifton Hills Primary, Karragullen District Hall, Kelmscott Primary, Marri Grove Primary, Mundijong Primary, Oakford Community Hall, Roleystone Hall, Serpentine Jarrahdale Community Recreation Centre, Serpentine Primary, West Byford Primary, Special Institutions, Hospitals & Remotes, Declaration Vote (89%) Labor L/NP ALP LIB GRN ONP OTHVotes 13550 10638 10116 7243 1856 2122 2866 % 56.0 44.0 41.8 29.9 7.7 8.8 11.8
The following areas have been transferred out of Darling Range 2-PARTY PREFERRED PRIMARY VOTES To: Baldivis (529 voters, 150 last election votes, 28.4% of enrolment) Declaration Vote (2%) Labor L/NP ALP LIB GRN ONP OTHVotes 80 63 59 43 11 12 17 % 55.9 44.1 41.5 30.3 7.7 8.5 12.0
To: Kalamunda (1994 voters, 1509 last election votes, 75.7% of enrolment) Mundaring Hall, Pickering Brook Primary School, Declaration Vote (6%) Labor L/NP ALP LIB GRN ONP OTHVotes 712 736 484 590 127 108 141 % 49.2 50.8 33.4 40.7 8.8 7.4 9.7
To: Kwinana (1000 voters, 703 last election votes, 70.3% of enrolment) Kwinana South Bush Fire Brigade, Declaration Vote (3%) Labor L/NP ALP LIB GRN ONP OTHVotes 412 253 330 170 33 59 74 % 62.0 38.0 49.5 25.5 5.0 8.9 11.1
To: Swan Hills (209 voters, 60 last election votes, 28.7% of enrolment) Declaration Vote (1%) Labor L/NP ALP LIB GRN ONP OTHVotes 32 25 23 17 4 5 7 % 56.1 43.9 41.1 30.4 7.1 8.9 12.5
Note: The Liberal Party won Darling Range from the Labor Party at a June 2018 by-election. The Liberal margin at the by-election was 3.5%.
034

2019 WA Redistribution
2019 WA Redistribution
35
DawesvilleRedistributed Totals First Preference 2-Candidate 2-Party Preferred Party Votes % Votes % Votes % Labor Party 7752 33.3 11445 49.2 11445 49.2 Liberal Party 8579 36.9 11819 50.8 11819 50.8 The Nationals 513 2.2 The Greens 1023 4.4 One Nation 2161 9.3 Shooters, Fishers, Farmers 601 2.6 Micro Business party 159 0.7 Flux the System! 119 0.5 Independent 2368 10.2
Formal Vote 23275 Informal Vote 1195 4.9 Redistribution enrolment 29374 Transferred votes as a percentage of redistribution enrolment - 83.3%
Dawesville includes transfers from the following old electorates
2-PARTY PREFERRED PRIMARY VOTES From: Dawesville (29374 voters, 24470 last election votes, 83.3% of enrolment) Coodanup Community College, Dudley Park Primary School (65%), Falcon Primary School, Falcon Reserve Football Pavilion, Glencoe Primary School, Halls Head Primary School, Mandurah Yacht Club, Metro Church Hall, Ocean Road Primary School (80%), South Halls Head Primary School, Southern Estuary Progress Association Hall (80%), Special Institutions, Hospitals & Remotes, Declaration Vote (95%) Labor L/NP ALP LIB NAT GRN ONP OTHVotes 11445 11819 7752 8579 513 1023 2161 3247 % 49.2 50.8 33.3 36.9 2.2 4.4 9.3 14.0
The following areas have been transferred out of Dawesville
2-PARTY PREFERRED PRIMARY VOTES To: Mandurah (690 voters, 657 last election votes, 95.2% of enrolment) Dudley Park Primary School (35%), Declaration Vote (2%) Labor L/NP ALP LIB NAT GRN ONP OTHVotes 332 292 239 205 19 26 65 71 % 53.2 46.8 38.2 32.8 3.0 4.2 10.4 11.4
To: Murray-Wellington (983 voters, 905 last election votes, 92.1% of enrolment) Ocean Road Primary School (20%), Southern Estuary Progress Association Hall (20%), Declaration Vote (3%) Labor L/NP ALP LIB NAT GRN ONP OTHVotes 424 439 295 310 26 36 84 114 % 49.1 50.9 34.1 35.8 3.0 4.2 9.7 13.2
035

2019 WA Redistribution
2019 WA Redistribution
36
ForrestfieldRedistributed Totals First Preference 2-Candidate 2-Party Preferred Party Votes % Votes % Votes % Labor Party 10357 46.3 13281 59.4 13281 59.4 Liberal Party 6709 30.0 9067 40.6 9067 40.6 The Greens 1443 6.5 One Nation 2244 10.0 Australian Christians 631 2.8 Animal Justice 747 3.3 Micro Business party 222 1.0
Formal Vote 22353 Informal Vote 1217 5.2 Redistribution enrolment 27120 Transferred votes as a percentage of redistribution enrolment - 86.9%
Forrestfield includes transfers from the following old electorates
2-PARTY PREFERRED PRIMARY VOTES From: Forrestfield (27120 voters, 23570 last election votes, 86.9% of enrolment) Darling Range Sports College, Dawson Park Primary School, East Kenwick Primary School, Edney Primary School, Forrestfield Primary School, High Wycombe Primary School, Maida Vale Primary School, Wattle Grove Primary School, Special Institutions, Hospitals & Remotes, Declaration Vote Labor L/NP ALP LIB GRN ONP OTHVotes 13281 9067 10357 6709 1443 2244 1600 % 59.4 40.6 46.3 30.0 6.5 10.0 7.2
Note: Boundaries unchanged.
036

2019 WA Redistribution
2019 WA Redistribution
37
FremantleRedistributed Totals First Preference 2-Candidate 2-Party Preferred Party Votes % Votes % Votes % Labor Party 11625 51.2 16549 73.0 16549 73.0 Liberal Party 4643 20.5 6120 27.0 6120 27.0 The Greens 4224 18.6 One Nation 989 4.4 Australian Christians 444 2.0 Socialist Alliance 466 2.1 Julie Matheson for WA 154 0.7 Micro Business party 138 0.6
Formal Vote 22683 Informal Vote 1085 4.6 Redistribution enrolment 28651 Transferred votes as a percentage of redistribution enrolment - 83.0%
Fremantle includes transfers from the following old electorates
2-PARTY PREFERRED PRIMARY VOTES From: Fremantle (28651 voters, 23768 last election votes, 83.0% of enrolment) Beaconsfield Primary School, Christ The King School, East Fremantle Primary School (60%), East Hamilton Hill Primary School, Fremantle Primary School, Fremantle Town Hall, Hilton Primary School, Phoenix Primary School, Rottnest Island Picture Hall, Southwell Primary School, Spearwood Primary School, White Gum Valley Primary School, Special Institutions, Hospitals & Remotes, Declaration Vote (97%) Labor L/NP ALP LIB GRN ONP OTHVotes 16549 6120 11625 4643 4224 989 1202 % 73.0 27.0 51.2 20.5 18.6 4.4 5.3
The following areas have been transferred out of Fremantle
2-PARTY PREFERRED PRIMARY VOTES To: Bicton (960 voters, 802 last election votes, 83.5% of enrolment) East Fremantle Primary School (40%), Declaration Vote (3%) Labor L/NP ALP LIB GRN ONP OTHVotes 578 198 383 156 184 15 37 % 74.5 25.5 49.4 20.1 23.7 1.9 4.8
037

2019 WA Redistribution
2019 WA Redistribution
38
GeraldtonRedistributed Totals First Preference 2-Candidate 2-Party Preferred Party Votes % Votes % Votes % Labor Party 7071 33.7 10201 48.7 10201 48.7 Liberal Party 5808 27.7 10759 51.3 10759 51.3 The Nationals 3669 17.5 The Greens 849 4.0 One Nation 1979 9.4 Australian Christians 413 2.0 Shooters, Fishers, Farmers 791 3.8 Independent 394 1.9
Formal Vote 20974 Informal Vote 937 4.3 Redistribution enrolment 25874 Transferred votes as a percentage of redistribution enrolment - 84.7%
Geraldton includes transfers from the following old electorates
2-PARTY PREFERRED PRIMARY VOTES From: Geraldton (25874 voters, 21911 last election votes, 84.7% of enrolment) Allendale Primary School, Bluff Point Primary School, Cape Burney Volunteer Fire Brigade, Durlacher Street, Geraldton Primary School, Geraldton Senior College, John Batten Drummond Cove Community Centre, Moonyoonooka Polocrosse Club, Mt Tarcoola Primary School, Rangeway Primary School, Spalding Family Centre, Waggrakine Primary School, Walkaway Primary School, Wandina Primary School, Special Institutions, Hospitals & Remotes, Declaration Vote Labor L/NP ALP LIB NAT GRN ONP OTHVotes 10201 10759 7071 5808 3669 849 1979 1598 % 48.7 51.3 33.7 27.7 17.5 4.0 9.4 7.6
Note: Boundaries unchanged.
Note: Sitting MP Ian Blayney switched from the Liberal Party to the National Party in mid-2019.
038

2019 WA Redistribution
2019 WA Redistribution
39
HillarysRedistributed Totals First Preference 2-Candidate 2-Party Preferred Party Votes % Votes % Votes % Labor Party 8176 33.3 12188 49.6 12188 49.6 Liberal Party 9354 38.1 12370 50.4 12370 50.4 The Greens 2266 9.2 Australian Christians 581 2.4 Family First 58 0.2 Julie Matheson for WA 50 0.2 Micro Business party 52 0.2 Independent 4028 16.4
Formal Vote 24565 Informal Vote 1014 4.0 Redistribution enrolment 28930 Transferred votes as a percentage of redistribution enrolment - 88.4%
Hillarys includes transfers from the following old electorates
2-PARTY PREFERRED PRIMARY VOTES From: Hillarys (22143 voters, 19677 last election votes, 88.9% of enrolment) Craigie Heights Primary School, Hillarys Primary School, Padbury Primary School, Sacred Heart College (15%), South Padbury Primary School, Springfield Primary School, St Mark's Anglican Community School, Declaration Vote (80%) Labor L/NP ALP LIB GRN OTHVotes 9238 9688 5795 6990 1808 4339 % 48.8 51.2 30.6 36.9 9.5 22.9
From: Joondalup (6787 voters, 5901 last election votes, 86.9% of enrolment) Beldon Primary School, Beldon Primary School (Drive-in), Mullaloo Heights Primary School, Declaration Vote (25%) Labor L/NP ALP LIB GRN OTHVotes 2950 2682 2382 2363 458 429 % 52.4 47.6 42.3 42.0 8.1 7.6
The following areas have been transferred out of Hillarys
2-PARTY PREFERRED PRIMARY VOTES To: Carine (5498 voters, 4836 last election votes, 88.0% of enrolment) Sacred Heart College (85%), Sorrento Primary School, Declaration Vote (20%) Labor L/NP ALP LIB GRN OTHVotes 1579 3064 976 2356 316 995 % 34.0 66.0 21.0 50.7 6.8 21.4
039

2019 WA Redistribution
2019 WA Redistribution
40
JandakotRedistributed Totals First Preference 2-Candidate 2-Party Preferred Party Votes % Votes % Votes % Labor Party 9360 40.4 11991 51.8 11991 51.8 Liberal Party 8888 38.4 11165 48.2 11165 48.2 The Greens 1558 6.7 One Nation 1565 6.8 Australian Christians 843 3.6 Animal Justice 535 2.3 Micro Business party 414 1.8
Formal Vote 23163 Informal Vote 946 3.9 Redistribution enrolment 28799 Transferred votes as a percentage of redistribution enrolment - 83.7%
Jandakot includes transfers from the following old electorates
2-PARTY PREFERRED PRIMARY VOTES From: Jandakot (28799 voters, 24109 last election votes, 83.7% of enrolment) Banksia Park Primary School (20%), Canning Vale Primary School, Forrestdale Primary School, Harrisdale Primary School, Lakeland Senior High School, Leeming Primary School, Piara Waters Primary School, Ranford Primary School, West Leeming Primary School, Declaration Vote (92%) Labor L/NP ALP LIB GRN ONP OTHVotes 11991 11165 9360 8888 1558 1565 1792 % 51.8 48.2 40.4 38.4 6.7 6.8 7.7
The following areas have been transferred out of Jandakot
2-PARTY PREFERRED PRIMARY VOTES To: Riverton (2447 voters, 2084 last election votes, 85.2% of enrolment) Banksia Park Primary School (80%), Declaration Vote (8%) Labor L/NP ALP LIB GRN ONP OTHVotes 845 1157 614 941 177 116 152 % 42.2 57.8 30.7 47.0 8.8 5.8 7.6
040

2019 WA Redistribution
2019 WA Redistribution
41
JoondalupRedistributed Totals First Preference 2-Candidate 2-Party Preferred Party Votes % Votes % Votes % Labor Party 9258 40.2 11528 50.03 11528 50.03 Liberal Party 10093 43.8 11514 49.97 11514 49.97 The Greens 1973 8.6 Australian Christians 394 1.7 Family First 337 1.5 Julie Matheson for WA 268 1.2 Micro Business party 191 0.8 Independent 540 2.3
Formal Vote 23054 Informal Vote 1095 4.5 Redistribution enrolment 28171 Transferred votes as a percentage of redistribution enrolment - 85.7%
Joondalup includes transfers from the following old electorates
2-PARTY PREFERRED PRIMARY VOTES From: Burns Beach (7300 voters, 5775 last election votes, 79.1% of enrolment) Bramston Park Community Sporting Facility (60%), Francis Jordan Catholic School (75%), Joondalup Primary School, Declaration Vote (24%) Labor L/NP ALP LIB GRN OTHVotes 2740 2737 2216 2419 422 424 % 50.0 50.0 40.4 44.1 7.7 7.7
From: Joondalup (20871 voters, 18373 last election votes, 88.0% of enrolment) Beaumaris Community Centre, Connolly Primary School, Eddystone Primary School, Edgewater Primary School, Joondalup Public Library, Ocean Reef Senior High School, Poseidon Primary School, Special Institutions, Hospitals & Remotes, Declaration Vote (75%) Labor L/NP ALP LIB GRN OTHVotes 8788 8777 7042 7673 1551 1306 % 50.0 50.0 40.1 43.7 8.8 7.4
The following areas have been transferred out of Joondalup
2-PARTY PREFERRED PRIMARY VOTES To: Hillarys (6787 voters, 5901 last election votes, 86.9% of enrolment) Beldon Primary School, Beldon Primary School (Drive-in), Mullaloo Heights Primary School, Declaration Vote (25%) Labor L/NP ALP LIB GRN OTHVotes 2950 2682 2382 2363 458 429 % 52.4 47.6 42.3 42.0 8.1 7.6
041

2019 WA Redistribution
2019 WA Redistribution
42
KalamundaRedistributed Totals First Preference 2-Candidate 2-Party Preferred Party Votes % Votes % Votes % Labor Party 9168 36.9 12981 52.3 12981 52.3 Liberal Party 9359 37.7 11836 47.7 11836 47.7 The Greens 3166 12.8 One Nation 1799 7.2 Australian Christians 675 2.7 Julie Matheson for WA 305 1.2 Liberal Democrats 15 0.1 Shooters, Fishers, Farmers 65 0.3 Micro Business party 247 1.0 Flux the System! 18 0.1 Independent 9 0.0
Formal Vote 24826 Informal Vote 997 3.9 Redistribution enrolment 28890 Transferred votes as a percentage of redistribution enrolment - 89.4%
Kalamunda includes transfers from the following old electorates
2-PARTY PREFERRED PRIMARY VOTES From: Darling Range (1994 voters, 1509 last election votes, 75.7% of enrolment) Mundaring Hall, Pickering Brook Primary School, Declaration Vote (6%) Labor L/NP ALP LIB GRN ONP OTHVotes 712 736 484 590 127 108 141 % 49.2 50.8 33.4 40.7 8.8 7.4 9.7
From: Kalamunda (26889 voters, 24312 last election votes, 90.4% of enrolment) Carmel Hall, Darlington Primary School, Falls Road Primary School, Glen Forrest Primary School, Gooseberry Hill Primary School, Kalamunda Primary School, Kalamunda Senior High School, Lesmurdie Primary School, Mahogany Creek Hall, Mundaring Primary School, Parkerville Primary School, Stoneville Playgroup Centre, Walliston Primary School, Special Institutions, Hospitals & Remotes, Declaration Vote Labor L/NP ALP LIB GRN ONP OTHVotes 12268 11100 8683 8768 3039 1691 1192 % 52.5 47.5 37.1 37.5 13.0 7.2 5.1
From: Swan Hills (7 voters, 2 last election votes, 28.6% of enrolment) Declaration Vote (0%)
042

2019 WA Redistribution
2019 WA Redistribution
43
KalgoorlieRedistributed Totals First Preference 2-Candidate 2-Party Preferred Party Votes % Votes % Votes % Labor Party 3965 26.1 6656 43.8 6656 43.8 Liberal Party 4256 28.0 8533 56.2 8533 56.2 The Nationals 3713 24.4 The Greens 646 4.3 One Nation 1846 12.1 Shooters, Fishers, Farmers 622 4.1 Flux the System! 149 1.0
Formal Vote 15197 Informal Vote 649 4.1 Redistribution enrolment 19622 Transferred votes as a percentage of redistribution enrolment - 80.8%
Kalgoorlie includes transfers from the following old electorates
2-PARTY PREFERRED PRIMARY VOTES From: Kalgoorlie (19622 voters, 15846 last election votes, 80.8% of enrolment) Boulder Primary School, Coolgardie Community Recreation Centre, Goldfields Arts Centre, Hannans Primary School, John Paul College, Kalgoorlie Health Campus, Kambalda Primary School, Kambalda West District High School, Laverton Primary School, Leinster Community Hall, Leonora Recreation Centre, Norseman Town Hall, North Kalgoorlie Primary School, O'Connor Primary School, Special Institutions, Hospitals & Remotes, Declaration Vote Labor L/NP ALP LIB NAT GRN ONP OTHVotes 6656 8533 3965 4256 3713 646 1846 771 % 43.8 56.2 26.1 28.0 24.4 4.3 12.1 5.1
Note: Boundaries unchanged.
043

2019 WA Redistribution
2019 WA Redistribution
44
KimberleyRedistributed Totals First Preference 2-Candidate 2-Party Preferred Party Votes % Votes % Votes % Labor Party 5301 44.9 7446 63.1 7446 63.1 Liberal Party 2048 17.4 4351 36.7 4351 36.9 The Nationals 1924 16.3 The Greens 1090 9.2 One Nation 956 8.1 Shooters, Fishers, Farmers 4 0.0 Flux the System! 92 0.8 Independent 387 3.3
Formal Vote 11802 Informal Vote 502 4.1 Redistribution enrolment 15460 Transferred votes as a percentage of redistribution enrolment - 79.6%
Kimberley includes transfers from the following old electorates
2-PARTY PREFERRED PRIMARY VOTES From: Kimberley (15275 voters, 12217 last election votes, 80.0% of enrolment) Broome Primary School, Cable Beach Primary School, Derby District High School, Fitzroy Valley District High School, Halls Creek District High School, Kununurra Leisure Centre, Roebuck Bay Primary School, Warmun Council Chambers, Wyndham District High School, Special Institutions, Hospitals & Remotes, Declaration Vote Labor L/NP ALP LIB NAT GRN ONP OTHVotes 7381 4333 5250 2038 1915 1085 952 479 % 63.0 37.0 44.8 17.4 16.3 9.3 8.1 4.1
From: Pilbara (185 voters, 87 last election votes, 47.0% of enrolment) Special Institutions, Hospitals & Remotes (10%), Declaration Vote (1%) Labor L/NP ALP LIB NAT GRN ONP OTHVotes 65 18 51 10 9 5 4 4 % 78.3 21.7 61.4 12.0 10.8 6.0 4.8 4.8
044

2019 WA Redistribution
2019 WA Redistribution
45
KingsleyRedistributed Totals First Preference 2-Candidate 2-Party Preferred Party Votes % Votes % Votes % Labor Party 10650 41.0 13312 51.2 13312 51.2 Liberal Party 11064 42.6 12676 48.8 12676 48.8 The Greens 2593 10.0 Australian Christians 762 2.9 Julie Matheson for WA 473 1.8 Liberal Democrats 50 0.2 Micro Business party 401 1.5
Formal Vote 25993 Informal Vote 1120 4.1 Redistribution enrolment 29573 Transferred votes as a percentage of redistribution enrolment - 91.7%
Kingsley includes transfers from the following old electorates
2-PARTY PREFERRED PRIMARY VOTES From: Balcatta (3622 voters, 3371 last election votes, 93.1% of enrolment) East Hamersley Primary School, Glendale Primary School, Declaration Vote (13%) Labor L/NP ALP LIB GRN OTHVotes 1771 1442 1345 1250 385 234 % 55.1 44.9 41.8 38.9 12.0 7.3
From: Kingsley (25951 voters, 23741 last election votes, 91.5% of enrolment) Church of Christ Warwick, Creaney Primary School, Goollelal Primary School, Greenwood College, Greenwood Primary School, Halidon Primary School, Hawker Park Primary School, North Woodvale Primary School, Woodvale Secondary College, Special Institutions, Hospitals & Remotes, Declaration Vote Labor L/NP ALP LIB GRN OTHVotes 11541 11234 9305 9814 2208 1451 % 50.7 49.3 40.9 43.1 9.7 6.4
045

2019 WA Redistribution
2019 WA Redistribution
46
KwinanaRedistributed Totals First Preference 2-Candidate 2-Party Preferred Party Votes % Votes % Votes % Labor Party 11704 57.2 14474 70.7 14474 70.7 Liberal Party 3968 19.4 5990 29.3 5990 29.3 The Greens 1594 7.8 One Nation 1885 9.2 Australian Christians 511 2.5 Liberal Democrats 4 0.0 Shooters, Fishers, Farmers 24 0.1 Micro Business party 303 1.5 Flux the System! 11 0.1 Independent 475 2.3
Formal Vote 20479 Informal Vote 1066 4.9 Redistribution enrolment 26567 Transferred votes as a percentage of redistribution enrolment - 81.1%
Kwinana includes transfers from the following old electorates
2-PARTY PREFERRED PRIMARY VOTES From: Baldivis (4139 voters, 4174 last election votes, 100.8% of enrolment) Bertram Primary School (75%), Leda Primary School, The Kings College (50%), Declaration Vote (12%) Labor L/NP ALP LIB GRN ONP OTHVotes 2826 1116 2123 604 308 277 643 % 71.7 28.3 53.7 15.3 7.8 7.0 16.3 2-Candidate Preferred: ALP 2770 (70.2%) IND 1176 (29.8%)
From: Darling Range (1000 voters, 703 last election votes, 70.3% of enrolment) Kwinana South Bush Fire Brigade, Declaration Vote (3%) Labor L/NP ALP LIB GRN ONP OTHVotes 412 253 330 170 33 59 74 % 62.0 38.0 49.5 25.5 5.0 8.9 11.1
From: Kwinana (21428 voters, 16669 last election votes, 77.8% of enrolment) Aubin Grove Primary School, Calista Primary School, Hammond Park Primary School, Harmony Primary School (25%), Leda Primary School, Medina Primary School, North Parmelia Primary School, Peter Carnley Anglican Community School, St Vincent's School, Wandi Pavilion, Special Institutions, Hospitals & Remotes, Declaration Vote (80%) Labor L/NP ALP LIB GRN ONP OTHVotes 11235 4621 9251 3194 1253 1549 612 % 70.9 29.1 58.3 20.1 7.9 9.8 3.9
The following areas have been transferred out of Kwinana
2-PARTY PREFERRED PRIMARY VOTES To: Cockburn (5457 voters, 5348 last election votes, 98.0% of enrolment) Atwell Primary School, Harmony Primary School (75%), Declaration Vote (20%) Labor L/NP ALP LIB GRN ONP OTHVotes 3067 2011 2392 1581 481 425 201 % 60.4 39.6 47.1 31.1 9.5 8.4 4.0
046

2019 WA Redistribution
2019 WA Redistribution
47
Landsdale (formerly Girrawheen) Redistributed Totals First Preference 2-Candidate 2-Party Preferred Party Votes % Votes % Votes % Labor Party 11741 49.9 14011 59.6 14010 59.6 Liberal Party 7544 32.1 9506 40.4 9506 40.4 The Greens 1475 6.3 One Nation 517 2.2 Australian Christians 858 3.6 Family First 337 1.4 Julie Matheson for WA 46 0.2 Shooters, Fishers, Farmers 314 1.3 Micro Business party 366 1.6 Independent 323 1.4
Formal Vote 23521 Informal Vote 1257 5.1 Redistribution enrolment 28944 Transferred votes as a percentage of redistribution enrolment - 85.6%
Landsdale includes transfers from the following old electorates
2-PARTY PREFERRED PRIMARY VOTES From: Girrawheen (17059 voters, 13935 last election votes, 81.7% of enrolment) Ashdale Primary School, Landsdale Primary School, Madeley Primary School, Declaration Vote (58%) Labor L/NP ALP LIB GRN OTHVotes 7758 5502 6485 4587 769 1420 % 58.5 41.5 48.9 34.6 5.8 10.7
From: Mirrabooka (5367 voters, 4961 last election votes, 92.4% of enrolment) Alexander Heights Community Hall, Alinjarra Primary School, Declaration Vote (19%) Labor L/NP ALP LIB GRN OTHVotes 3035 1575 2598 1292 335 388 % 65.8 34.2 56.3 28.0 7.3 8.4
From: Wanneroo (6476 voters, 5866 last election votes, 90.6% of enrolment) Hocking Primary School, Pearsall Primary School, Declaration Vote (23%) Labor L/NP ALP LIB GRN ONP OTHVotes 3208 2425 2651 1662 371 517 433 % 57.0 43.0 47.1 29.5 6.6 9.2 7.7
From: West Swan (42 voters, 15 last election votes, 35.7% of enrolment) Declaration Vote (0%)
The following areas have been transferred out of Girrawheen
2-PARTY PREFERRED PRIMARY VOTES To: Mirrabooka (12404 voters, 11258 last election votes, 90.8% of enrolment) Hudson Park Primary School, Marangaroo Family Centre, Marangaroo Primary School, Rawlinson Primary School, Roseworth Primary School, Special Institutions, Hospitals & Remotes, Declaration Vote (42%) Labor L/NP ALP LIB GRN OTHVotes 8090 2461 6934 1929 585 1110 % 76.7 23.3 65.7 18.3 5.5 10.5
047

2019 WA Redistribution
2019 WA Redistribution
48
MandurahRedistributed Totals First Preference 2-Candidate 2-Party Preferred Party Votes % Votes % Votes % Labor Party 12867 56.7 15429 68.0 15429 68.0 Liberal Party 4929 21.7 7275 32.0 7275 32.0 The Nationals 445 2.0 The Greens 1073 4.7 One Nation 2898 12.8 Shooters, Fishers, Farmers 15 0.1 Micro Business party 150 0.7 Flux the System! 281 1.2 Independent 53 0.2
Formal Vote 22711 Informal Vote 1231 5.1 Redistribution enrolment 29434 Transferred votes as a percentage of redistribution enrolment - 81.3%
Mandurah includes transfers from the following old electorates
2-PARTY PREFERRED PRIMARY VOTES From: Dawesville (690 voters, 657 last election votes, 95.2% of enrolment) Dudley Park Primary School (35%), Declaration Vote (2%) Labor L/NP ALP LIB NAT GRN ONP OTHVotes 332 292 239 205 19 26 65 71 % 53.2 46.8 38.2 32.8 3.0 4.2 10.4 11.4
From: Mandurah (28744 voters, 23285 last election votes, 81.0% of enrolment) Assumption Catholic Primary School, Billy Dower Youth Centre, Coodanup Community College, Foundation Christian College, Madora Bay Community Hall, Mandurah Baptist College, Mandurah Primary School, RAAFA Estate - Meadow Springs, Riverside Primary School, Special Institutions, Hospitals & Remotes, Declaration Vote (95%) Labor L/NP ALP LIB NAT GRN ONP OTHVotes 15097 6983 12629 4724 425 1047 2833 428 % 68.4 31.6 57.2 21.4 1.9 4.7 12.8 1.9
The following areas have been transferred out of Mandurah
2-PARTY PREFERRED PRIMARY VOTES To: Murray-Wellington (1556 voters, 1272 last election votes, 81.7% of enrolment) West Murray Community Hall, Declaration Vote (5%) Labor L/NP ALP LIB NAT GRN ONP OTHVotes 740 467 645 290 61 26 174 12 % 61.3 38.7 53.4 24.0 5.0 2.2 14.4 1.0
048
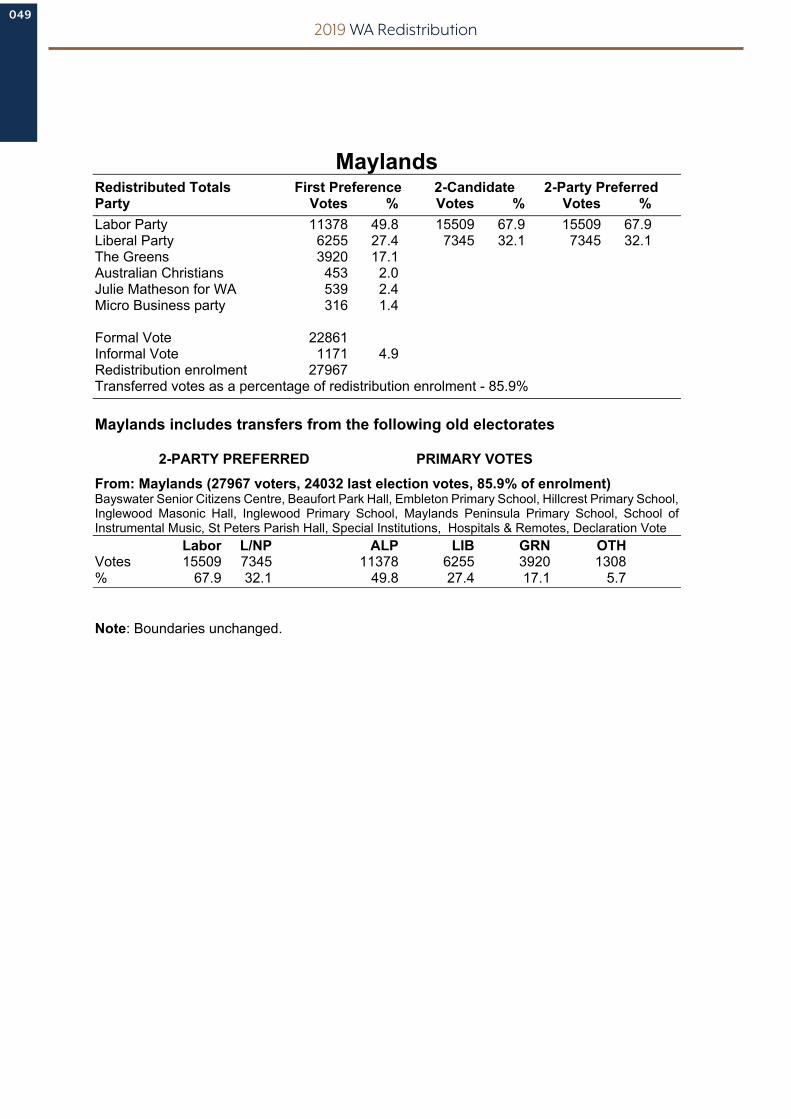
2019 WA Redistribution
2019 WA Redistribution
49
Maylands Redistributed Totals First Preference 2-Candidate 2-Party Preferred Party Votes % Votes % Votes % Labor Party 11378 49.8 15509 67.9 15509 67.9 Liberal Party 6255 27.4 7345 32.1 7345 32.1 The Greens 3920 17.1 Australian Christians 453 2.0 Julie Matheson for WA 539 2.4 Micro Business party 316 1.4
Formal Vote 22861 Informal Vote 1171 4.9 Redistribution enrolment 27967 Transferred votes as a percentage of redistribution enrolment - 85.9%
Maylands includes transfers from the following old electorates
2-PARTY PREFERRED PRIMARY VOTES From: Maylands (27967 voters, 24032 last election votes, 85.9% of enrolment) Bayswater Senior Citizens Centre, Beaufort Park Hall, Embleton Primary School, Hillcrest Primary School, Inglewood Masonic Hall, Inglewood Primary School, Maylands Peninsula Primary School, School of Instrumental Music, St Peters Parish Hall, Special Institutions, Hospitals & Remotes, Declaration Vote Labor L/NP ALP LIB GRN OTHVotes 15509 7345 11378 6255 3920 1308 % 67.9 32.1 49.8 27.4 17.1 5.7
Note: Boundaries unchanged.
049

2019 WA Redistribution
2019 WA Redistribution
50
MidlandRedistributed Totals First Preference 2-Candidate 2-Party Preferred Party Votes % Votes % Votes % Labor Party 11491 49.2 14671 62.8 14671 62.8 Liberal Party 6816 29.2 8685 37.2 8685 37.2 The Greens 2075 8.9 One Nation 1846 7.9 Julie Matheson for WA 226 1.0 Shooters, Fishers, Farmers 667 2.9 Micro Business party 246 1.1
Formal Vote 23367 Informal Vote 1148 4.7 Redistribution enrolment 29326 Transferred votes as a percentage of redistribution enrolment - 83.6%
Midland includes transfers from the following old electorates
2-PARTY PREFERRED PRIMARY VOTES From: Midland (29320 voters, 24513 last election votes, 83.6% of enrolment) Bellevue Hall, Clayton View Primary School, Goodstart Early Learning Stratton, Greenmount Primary School, Guildford Town Hall, Helena Valley Primary School, Midland Town Hall, North Metropolitan TAFE Midland Campus, Stratton Community Hall, Swan View Senior High School, Special Institutions, Hospitals & Remotes, Declaration Vote (96%) Labor L/NP ALP LIB GRN ONP OTHVotes 14670 8684 11491 6815 2075 1846 1138 % 62.8 37.2 49.2 29.2 8.9 7.9 4.9
From: Swan Hills (6 voters, 1 last election votes, 16.7% of enrolment) Declaration Vote (0%)
The following areas have been transferred out of Midland
2-PARTY PREFERRED PRIMARY VOTES To: Bassendean (1145 voters, 984 last election votes, 85.9% of enrolment) East Beechboro Primary School, Declaration Vote (4%) Labor L/NP ALP LIB GRN ONP OTHVotes 644 293 567 218 53 69 31 % 68.7 31.3 60.4 23.2 5.7 7.4 3.3
050

2019 WA Redistribution
2019 WA Redistribution
51
MirrabookaRedistributed Totals First Preference 2-Candidate 2-Party Preferred Party Votes % Votes % Votes % Labor Party 14115 62.7 16497 73.3 16497 73.3 Liberal Party 4786 21.2 6014 26.7 6014 26.7 The Greens 1450 6.4 Australian Christians 772 3.4 Family First 324 1.4 Shooters, Fishers, Farmers 293 1.3 Micro Business party 323 1.4 Independent 463 2.1
Formal Vote 22526 Informal Vote 1929 7.9 Redistribution enrolment 28888 Transferred votes as a percentage of redistribution enrolment - 84.7%
Mirrabooka includes transfers from the following old electorates
2-PARTY PREFERRED PRIMARY VOTES From: Girrawheen (12404 voters, 11258 last election votes, 90.8% of enrolment) Hudson Park Primary School, Marangaroo Family Centre, Marangaroo Primary School, Rawlinson Primary School, Roseworth Primary School, Special Institutions, Hospitals & Remotes, Declaration Vote (42%) Labor L/NP ALP LIB GRN OTHVotes 8090 2461 6934 1929 585 1110 % 76.7 23.3 65.7 18.3 5.5 10.5
From: Mirrabooka (16484 voters, 13197 last election votes, 80.1% of enrolment) Balga Primary School (75%), Boyare Primary School, Dryandra Primary School, Koondoola Primary School, North Balga Primary School, St Andrew's Grammar School, Special Institutions, Hospitals & Remotes, Declaration Vote (59%) Labor L/NP ALP LIB GRN OTHVotes 8407 3554 7181 2857 865 1065 % 70.3 29.7 60.0 23.9 7.2 8.9
The following areas have been transferred out of Mirrabooka
2-PARTY PREFERRED PRIMARY VOTES To: Balcatta (3728 voters, 3250 last election votes, 87.2% of enrolment) Balga Primary School (25%), Westminster Primary School, Declaration Vote (13%) Labor L/NP ALP LIB GRN OTHVotes 2124 818 1779 657 237 271 % 72.2 27.8 60.4 22.3 8.1 9.2
To: Landsdale (5367 voters, 4961 last election votes, 92.4% of enrolment) Alexander Heights Community Hall, Alinjarra Primary School, Declaration Vote (19%) Labor L/NP ALP LIB GRN OTHVotes 3035 1575 2598 1292 335 388 % 65.8 34.2 56.3 28.0 7.3 8.4
To: West Swan (2327 voters, 2120 last election votes, 91.1% of enrolment) Illawarra Primary School, Declaration Vote (8%) Labor L/NP ALP LIB GRN OTHVotes 1327 667 1151 519 138 187 % 66.5 33.5 57.7 26.0 6.9 9.4
051

2019 WA Redistribution
2019 WA Redistribution
52
MooreRedistributed Totals First Preference 2-Candidate 2-Party Preferred Party Votes % Votes % Votes % Labor Party 4404 19.8 6766 30.5 Liberal Party 4182 18.8 7805 35.2 The Nationals 8173 36.8 14393 64.8 15422 69.5 The Greens 864 3.9 One Nation 2829 12.7 Australian Christians 443 2.0 Shooters, Fishers, Farmers 1292 5.8 Independent 14 0.1
Formal Vote 22201 Informal Vote 930 4.0 Redistribution enrolment 25297 Transferred votes as a percentage of redistribution enrolment - 91.4%
Moore includes transfers from the following old electorates
2-PARTY PREFERRED PRIMARY VOTES From: Central Wheatbelt (2080 voters, 2065 last election votes, 99.3% of enrolment) Dowerin Lesser Hall, Goomalling Community Resource Centre, Wongan Hills Community Resource Centre, Declaration Vote (8%) Labor L/NP ALP LIB NAT GRN ONP OTHVotes 348 1615 208 221 1179 39 187 130 % 17.7 82.3 10.6 11.3 60.0 2.0 9.5 6.6
From: Moore (23217 voters, 21064 last election votes, 90.7% of enrolment) Badgingarra Community Centre, Bindoon Primary School, Bolgart Primary School, Calingiri Primary School, Carnamah District High School, Cervantes Recreation Centre, Coorow Community Centre, Dalwallinu District High School, Dandaragan Primary School, Eneabba Primary School, Granville Centre, Green Head Community Centre, Guilderton Hall, Horrocks Community Recreation Centre, Immaculate Heart College, Irwin Recreation Centre, Jurien Bay District High School, Kalannie Primary School, Lancelin St John Ambulance Subcentre, Ledge Point Community Hall, Leeman Primary School, Miling Primary School, Mingenew Primary School, Moora Performing Arts Centre, Morawa Shire Council Chambers, Muchea Community Hall, Mullewa District High School, Nabawa Community Hall, New Norcia Institute Study Hall, Northampton RSL Hall, Perenjori Primary School, Seabird Community Hall, Three Springs Primary School, Toodyay Show Grounds Pavilion, Watheroo Primary School, Woodridge Community Centre, Special Institutions, Hospitals & Remotes, Declaration Vote (96%) Labor L/NP ALP LIB NAT GRN ONP OTHVotes 6417 13806 4196 3961 6993 825 2642 1618 % 31.7 68.3 20.7 19.6 34.6 4.1 13.1 8.0 2-Candidate Preferred: LIB 7375 (36.5%) NAT 12836 (63.5%)
The following areas have been transferred out of Moore
2-PARTY PREFERRED PRIMARY VOTES To: North West Central (989 voters, 1007 last election votes, 101.8% of enrolment) Kalbarri District High School, Declaration Vote (4%) Labor L/NP ALP LIB NAT GRN ONP OTHVotes 309 652 226 121 410 39 120 43 % 32.2 67.8 23.6 12.6 42.8 4.1 12.5 4.5 2-Candidate Preferred: LIB 267 (27.8%) NAT 694 (72.2%)
052

2019 WA Redistribution
2019 WA Redistribution
53
MorleyRedistributed Totals First Preference 2-Candidate 2-Party Preferred Party Votes % Votes % Votes % Labor Party 12389 52.4 14723 62.3 14723 62.3 Liberal Party 7449 31.5 8899 37.7 8899 37.7 The Greens 2201 9.3 Australian Christians 665 2.8 Shooters, Fishers, Farmers 523 2.2 Micro Business party 405 1.7
Formal Vote 23632 Informal Vote 1493 5.9 Redistribution enrolment 28768 Transferred votes as a percentage of redistribution enrolment - 87.3%
Morley includes transfers from the following old electorates
2-PARTY PREFERRED PRIMARY VOTES From: Bassendean (3111 voters, 2508 last election votes, 80.6% of enrolment) Hampton Senior High School (50%), John Septimus Roe Anglican Community School (50%), Declaration Vote (11%) Labor L/NP ALP LIB GRN OTHVotes 1659 696 1443 589 184 139 % 70.4 29.6 61.3 25.0 7.8 5.9
From: Morley (25657 voters, 22617 last election votes, 88.2% of enrolment) Camboon Primary School, Crimea Park Hall, Dianella Heights Primary School, Dianella Secondary College, Hampton Park Primary School, Morley Primary School, Nollamara Primary School, Noranda Primary School, North Morley Primary School, Special Institutions, Hospitals & Remotes, Declaration Vote Labor L/NP ALP LIB GRN OTHVotes 13064 8203 10946 6860 2017 1454 % 61.4 38.6 51.4 32.2 9.5 6.8
053

2019 WA Redistribution
2019 WA Redistribution
54
Mount Lawley Redistributed Totals First Preference 2-Candidate 2-Party Preferred Party Votes % Votes % Votes % Labor Party 9642 40.8 12767 54.0 12767 54.0 Liberal Party 9621 40.7 10858 46.0 10858 46.0 The Greens 2938 12.4 Australian Christians 583 2.5 Animal Justice 497 2.1 Micro Business party 352 1.5
Formal Vote 23633 Informal Vote 1099 4.4 Redistribution enrolment 28133 Transferred votes as a percentage of redistribution enrolment - 87.9%
Mount Lawley includes transfers from the following old electorates
2-PARTY PREFERRED PRIMARY VOTES From: Mount Lawley (28133 voters, 24732 last election votes, 87.9% of enrolment) Australian Islamic College - Dianella, Central Metropolitan College of TAFE - Mt Lawley Campus, Coolbinia Primary School, Coolbinia Primary School (Drive-in), Dianella Community Centre, Mount Lawley Primary School, RSL Aged Care Menora Gardens Village, St Patrick's Anglican Church, St Paul's Primary School, Sutherland Dianella Primary School, Vedanta Church, West Morley Primary School, Yokine Community Playgroup, Yokine Primary School, Special Institutions, Hospitals & Remotes, Declaration Vote Labor L/NP ALP LIB GRN OTHVotes 12767 10858 9642 9621 2938 1432 % 54.0 46.0 40.8 40.7 12.4 6.1
Note: Boundaries unchanged.
054

2019 WA Redistribution
2019 WA Redistribution
55
Murray-WellingtonRedistributed Totals First Preference 2-Candidate 2-Party Preferred Party Votes % Votes % Votes % Labor Party 8879 36.7 12501 51.7 12501 51.7 Liberal Party 7126 29.5 11675 48.3 11675 48.3 The Nationals 2545 10.5 The Greens 1054 4.4 One Nation 2751 11.4 Shooters, Fishers, Farmers 1477 6.1 Flux the System! 270 1.1 Others 91 0.3
Formal Vote 24193 Informal Vote 1313 5.1 Redistribution enrolment 28967 Transferred votes as a percentage of redistribution enrolment - 88.1%
Murray-Wellington includes transfers from the following old electorates
2-PARTY PREFERRED PRIMARY VOTES From: Dawesville (983 voters, 905 last election votes, 92.1% of enrolment) Ocean Road Primary School (20%), Southern Estuary Progress Association Hall (20%), Declaration Vote (3%) Labor L/NP ALP LIB NAT GRN ONP OTHVotes 424 439 295 310 26 36 84 114 % 49.1 50.9 34.1 35.8 3.0 4.2 9.7 13.2
From: Mandurah (1556 voters, 1272 last election votes, 81.7% of enrolment) West Murray Community Hall, Declaration Vote (5%) Labor L/NP ALP LIB NAT GRN ONP OTHVotes 740 467 645 290 61 26 174 12 % 61.3 38.7 53.4 24.0 5.0 2.2 14.4 1.0
From: Murray-Wellington (26428 voters, 23329 last election votes, 88.3% of enrolment) Austin Cove Baptist College, Australind Community Hall, Binningup Community Hall, Brunswick Town Hall, Carcoola Primary School, Coolup Community Hall, Dwellingup Primary School, Kingston Primary School, Lake Clifton Community Centre, North Dandalup Community Hall, North Yunderup CWA Centre, Parkfield Primary School, Pinjarra Senior High School, Preston Beach Community Centre, Riverlinks Community Centre (25%), Settlers Hall, St Anne's Primary School, Waroona Senior Citizens Centre, Yarloop Primary School, Special Institutions, Hospitals & Remotes, Declaration Vote (91%) Labor L/NP ALP LIB NAT GRN ONP OTHVotes 11337 10769 7938 6525 2458 992 2493 1712 % 51.3 48.7 35.9 29.5 11.1 4.5 11.3 7.7
The following areas have been transferred out of Murray-Wellington
2-PARTY PREFERRED PRIMARY VOTES To: Collie-Preston (2511 voters, 1470 last election votes, 58.5% of enrolment) Riverlinks Community Centre (75%), Declaration Vote (9%) Labor L/NP ALP LIB NAT GRN ONP OTHVotes 752 654 559 377 175 70 156 69 % 53.5 46.5 39.8 26.8 12.4 5.0 11.1 4.9
055

2019 WA Redistribution
2019 WA Redistribution
56
NedlandsRedistributed Totals First Preference 2-Candidate 2-Party Preferred Party Votes % Votes % Votes % Labor Party 6512 26.6 10283 42.0 10283 42.0 Liberal Party 12656 51.6 14214 58.0 14214 58.0 The Greens 3800 15.5 Australian Christians 548 2.2 Julie Matheson for WA 619 2.5 Animal Justice 8 0.0 Micro Business party 336 1.4 Flux the System! 27 0.1
Formal Vote 24506 Informal Vote 823 3.2 Redistribution enrolment 29036 Transferred votes as a percentage of redistribution enrolment - 87.2%
Nedlands includes transfers from the following old electorates
2-PARTY PREFERRED PRIMARY VOTES From: Nedlands (27637 voters, 24101 last election votes, 87.2% of enrolment) Dalkeith Primary School, Freshwater Bay Primary School, Hollywood Primary School, Jolimont Primary School, Nedlands Primary School, Shenton Park Community Centre, Sir Charles Gairdner Hospital, St Andrew's Church Hall - Nedlands, Subiaco Community Centre, Subiaco Primary School, Tresillian Community Centre, University of Western Australia - Nedlands Campus, Special Institutions, Hospitals & Remotes, Declaration Vote Labor L/NP ALP LIB GRN OTHVotes 9728 13588 6125 12093 3641 1462 % 41.7 58.3 26.3 51.9 15.6 6.3
From: Perth (1399 voters, 1227 last election votes, 87.7% of enrolment) Constitutional Centre, Declaration Vote (5%) Labor L/NP ALP LIB GRN OTHVotes 555 626 387 563 159 75 % 47.0 53.0 32.7 47.6 13.4 6.3
056

2019 WA Redistribution
2019 WA Redistribution
57
North West Central Redistributed Totals First Preference 2-Candidate 2-Party Preferred Party Votes % Votes % Votes % Labor Party 2205 26.7 3287 39.9 3287 39.9 Liberal Party 1300 15.8 The Nationals 2981 36.1 4955 60.1 4955 60.1 The Greens 465 5.6 One Nation 938 11.4 Australian Christians 7 0.1 Shooters, Fishers, Farmers 36 0.4 Micro Business party 24 0.3 Flux the System! 73 0.9 Independent 221 2.7
Formal Vote 8250 Informal Vote 396 4.6 Redistribution enrolment 10904 Transferred votes as a percentage of redistribution enrolment - 79.3%
North West Central includes transfers from the following old electorates
2-PARTY PREFERRED PRIMARY VOTES From: Moore (989 voters, 1007 last election votes, 101.8% of enrolment) Kalbarri District High School, Declaration Vote (4%) Labor L/NP ALP LIB NAT GRN ONP OTHVotes 340 618 226 121 410 39 120 43 % 35.5 64.5 23.6 12.6 42.8 4.1 12.5 4.5 2-Candidate Preferred: LIB 267 (27.8%) NAT 694 (72.2%)
From: North West Central (9915 voters, 7640 last election votes, 77.1% of enrolment) Carnarvon Community College (Marmion Street Campus), Carnarvon Community College (Cleaver Street Campus), Coral Bay Learning Centre, Cue Primary School, Denham Hall, Exmouth Shire Hall, Meekatharra Shire Hall, Mount Magnet Anzac Memorial Hall, Onslow Primary School, Pannawonica Primary School, Paraburdoo Primary School, Tom Price Recreation Centre, Wiluna Remote Community School, Yalgoo Primary School, Special Institutions, Hospitals & Remotes, Declaration Vote Labor L/NP ALP LIB NAT GRN ONP OTHVotes 2947 4337 1979 1179 2571 426 818 318 % 40.5 59.5 27.1 16.2 35.3 5.8 11.2 4.4
Note: Overall new margin calculated using the 2017 preference distribution for North West Central.
057

2019 WA Redistribution
2019 WA Redistribution
58
PerthRedistributed Totals First Preference 2-Candidate 2-Party Preferred Party Votes % Votes % Votes % Labor Party 10759 47.2 14269 62.6 14269 62.6 Liberal Party 7528 33.0 8514 37.4 8514 37.4 The Greens 3291 14.4 Australian Christians 318 1.4 Julie Matheson for WA 137 0.6 Animal Justice 317 1.4 Micro Business party 199 0.9 Flux the System! 238 1.0
Formal Vote 22787 Informal Vote 864 3.7 Redistribution enrolment 29055 Transferred votes as a percentage of redistribution enrolment - 81.4%
Perth includes transfers from the following old electorates
2-PARTY PREFERRED PRIMARY VOTES From: Perth (29055 voters, 23651 last election votes, 81.4% of enrolment) Aranmore Catholic College, Greek Orthodox Church, Highgate Primary School, Kyilla Primary School, Mt Hawthorn Baptist Church Hall, Mt Hawthorn Community Centre Lesser Hall, Mt Hawthorn Primary School, North Metropolitan TAFE East Perth Campus, North Metropolitan TAFE Leederville Campus, North Metropolitan TAFE Northbridge Campus, North Perth Primary School, Royal Perth Hospital, WAEC (BOQ building), Citiplace Community Centre, Housing Authority, Special Institutions, Hospitals & Remotes, Declaration Vote (95%) Labor L/NP ALP LIB GRN OTHVotes 14269 8514 10759 7528 3291 1209 % 62.6 37.4 47.2 33.0 14.4 5.3
The following areas have been transferred out of Perth
2-PARTY PREFERRED PRIMARY VOTES To: Nedlands (1399 voters, 1227 last election votes, 87.7% of enrolment) Constitutional Centre, Declaration Vote (5%) Labor L/NP ALP LIB GRN OTHVotes 555 626 387 563 159 75 % 47.0 53.0 32.7 47.6 13.4 6.3
058

2019 WA Redistribution
2019 WA Redistribution
59
PilbaraRedistributed Totals First Preference 2-Candidate 2-Party Preferred Party Votes % Votes % Votes % Labor Party 4342 30.9 7334 52.2 7334 52.2 Liberal Party 2147 15.3 The Nationals 3847 27.4 6723 47.8 6723 47.8 The Greens 580 4.1 One Nation 1601 11.4 Shooters, Fishers, Farmers 1347 9.6 Micro Business party 65 0.5 Flux the System! 133 0.9
Formal Vote 14062 Informal Vote 673 4.6 Redistribution enrolment 21700 Transferred votes as a percentage of redistribution enrolment - 67.9%
Pilbara includes transfers from the following old electorates
2-PARTY PREFERRED PRIMARY VOTES From: Pilbara (21700 voters, 14734 last election votes, 67.9% of enrolment) Baler Primary School, Dampier Pre-Primary School, Hedland Senior High School, Karratha Primary School, Marble Bar Community Resource Centre, Millars Well Primary School, Newman Primary School, Newman Senior High School, PCYC Roebourne, Port Hedland Primary School, Tambrey Primary School, Wickham Primary School, Special Institutions, Hospitals & Remotes (90%), Declaration Vote (99%) Labor L/NP ALP LIB NAT GRN ONP OTHVotes 7334 6723 4342 2147 3847 580 1601 1545 % 52.2 47.8 30.9 15.3 27.4 4.1 11.4 11.0
The following areas have been transferred out of Pilbara
2-PARTY PREFERRED PRIMARY VOTES To: Kimberley (185 voters, 87 last election votes, 47.0% of enrolment) Special Institutions, Hospitals & Remotes (10%), Declaration Vote (1%) Labor L/NP ALP LIB NAT GRN ONP OTHVotes 65 18 51 10 9 5 4 4 % 78.3 21.7 61.4 12.0 10.8 6.0 4.8 4.8
059

2019 WA Redistribution
2019 WA Redistribution
60
RivertonRedistributed Totals First Preference 2-Candidate 2-Party Preferred Party Votes % Votes % Votes % Labor Party 8394 33.9 11347 45.8 11347 45.8 Liberal Party 11134 44.9 13435 54.2 13437 54.2 The Greens 2310 9.3 One Nation 1232 5.0 Australian Christians 1136 4.6 Julie Matheson for WA 274 1.1 Animal Justice 52 0.2 Micro Business party 251 1.0 (unaffiliated) 3 0.0
Formal Vote 24786 Informal Vote 961 3.7 Redistribution enrolment 28181 Transferred votes as a percentage of redistribution enrolment - 91.4%
Riverton includes transfers from the following old electorates
2-PARTY PREFERRED PRIMARY VOTES From: Cannington (656 voters, 564 last election votes, 86.0% of enrolment) Parkwood Primary School (15%), Declaration Vote (2%) Labor L/NP ALP LIB GRN ONP OTHVotes 349 187 288 146 44 30 29 % 65.1 34.9 53.6 27.2 8.2 5.6 5.4
From: Jandakot (2447 voters, 2084 last election votes, 85.2% of enrolment) Banksia Park Primary School (80%), Declaration Vote (8%) Labor L/NP ALP LIB GRN ONP OTHVotes 845 1157 614 941 177 116 152 % 42.2 57.8 30.7 47.0 8.8 5.8 7.6
From: Riverton (25078 voters, 23101 last election votes, 92.1% of enrolment) Bull Creek Primary School, Herald Avenue Senior Citizens Centre, Oberthur Primary School, RAAFA Estate - Bull Creek, Riverton Primary School, Rossmoyne Primary School, Rostrata Primary School, Shelley Primary School, Willetton Primary School, Willetton Senior High School, Special Institutions, Hospitals & Remotes, Declaration Vote Labor L/NP ALP LIB GRN ONP OTHVotes 10153 12092 7492 10047 2090 1086 1536 % 45.6 54.4 33.7 45.2 9.4 4.9 6.9
060

2019 WA Redistribution
2019 WA Redistribution
61
RockinghamRedistributed Totals First Preference 2-Candidate 2-Party Preferred Party Votes % Votes % Votes % Labor Party 14018 61.5 16748 73.5 16748 73.5 Liberal Party 4027 17.7 6038 26.5 6038 26.5 The Greens 1637 7.2 One Nation 1967 8.6 Australian Christians 424 1.9 Micro Business party 150 0.7 Independent 575 2.5
Formal Vote 22798 Informal Vote 1030 4.3 Redistribution enrolment 27975 Transferred votes as a percentage of redistribution enrolment - 85.2%
Rockingham includes transfers from the following old electorates
2-PARTY PREFERRED PRIMARY VOTES From: Baldivis (868 voters, 776 last election votes, 89.4% of enrolment) East Waikiki Primary School, Declaration Vote (3%) Labor L/NP ALP LIB GRN ONP OTHVotes 574 169 442 62 32 52 156 % 77.3 22.7 59.4 8.3 4.3 7.0 21.0
From: Rockingham (27107 voters, 23052 last election votes, 85.0% of enrolment) Bungaree Primary School, Charthouse Primary School, Cooloongup Primary School, East Waikiki Primary School, Hillman Primary School, Rockingham Autumn Centre (Drive-in), Rockingham Beach Primary School, Rockingham Senior High School, Safety Bay Primary School, Safety Bay Senior High School, Special Institutions, Hospitals & Remotes, Declaration Vote Labor L/NP ALP LIB GRN ONP OTHVotes 16174 5869 13576 3965 1605 1915 993 % 73.4 26.6 61.6 18.0 7.3 8.7 4.5
061

2019 WA Redistribution
2019 WA Redistribution
62
RoeRedistributed Totals First Preference 2-Candidate 2-Party Preferred Party Votes % Votes % Votes % Labor Party 3138 14.6 5176 24.1 Liberal Party 5290 24.6 7794 36.2 The Nationals 8985 41.7 13719 63.8 16335 75.9 The Greens 738 3.4 One Nation 1721 8.0 Australian Christians 504 2.3 Shooters, Fishers, Farmers 1087 5.0 (unaffiliated) 63 0.3
Formal Vote 21526 Informal Vote 866 3.9 Redistribution enrolment 24545 Transferred votes as a percentage of redistribution enrolment - 91.2%
Roe includes transfers from the following old electorates
2-PARTY PREFERRED PRIMARY VOTES From: Albany (742 voters, 664 last election votes, 89.5% of enrolment) Bremer Bay Community Resource Centre, Jerramungup District High School, Declaration Vote (3%) Labor L/NP ALP LIB NAT GRN ONP OTHVotes 167 464 120 172 244 21 66 10 % 26.5 73.5 19.0 27.2 38.5 3.3 10.4 1.6
From: Roe (23803 voters, 21729 last election votes, 91.3% of enrolment) Arthur River Hall, Borden Primary School, Broomehill Town Hall, Castletown Primary School, Condingup Primary School, Cranbrook Memorial Hall, Darkan Town Hall, Dumbleyung Primary School, Duranillin Hall, East Narrogin Primary School, Esperance Senior Citizens Centre, Frankland River Community Centre, Gibson Football Club, Gnowangerup Community Resource Centre, Highbury Hall, Hopetoun Community Centre, Katanning Leisure and Function Centre, Kojonup RSL Hall, Lake Grace Community Resource Centre, Lake King Primary School, Munglinup Primary School, Muradup Hall, Narrogin Senior Citizens Centre, Newdegate Community Resource Centre, Nulsen Primary School, Nyabing Town Hall, Ongerup Primary School, Quindanning Community Hall, Ravensthorpe District High School, Salmon Gums Primary School, Tambellup Shire Lesser Hall, Uniting Church - Wagin, Williams RSL Hall, Woodanilling Shire Hall, Woolorama Wagin Show Grounds, Special Institutions, Hospitals & Remotes, Declaration Vote (93%) Labor L/NP ALP LIB NAT GRN ONP OTHVotes 5009 15871 3018 5118 8742 717 1655 1644 % 24.0 76.0 14.4 24.5 41.8 3.4 7.9 7.9 2-Candidate Preferred: LIB 7586 (36.3%) NAT 13293 (63.7%)
The following areas have been transferred out of Roe
2-PARTY PREFERRED PRIMARY VOTES To: Central Wheatbelt (1683 voters, 1639 last election votes, 97.4% of enrolment) Cuballing Agricultural Hall, Harrismith Community Hall, Kulin Resource Centre, Popanyinning Agricultural Hall, Wickepin Primary School, Yealering Hall, Declaration Vote (7%) Labor L/NP ALP LIB NAT GRN ONP OTHVotes 321 1272 187 271 805 43 137 149 % 20.2 79.8 11.7 17.0 50.6 2.7 8.6 9.4 2-Candidate Preferred: LIB 418 (26.3%) NAT 1174 (73.7%)
062
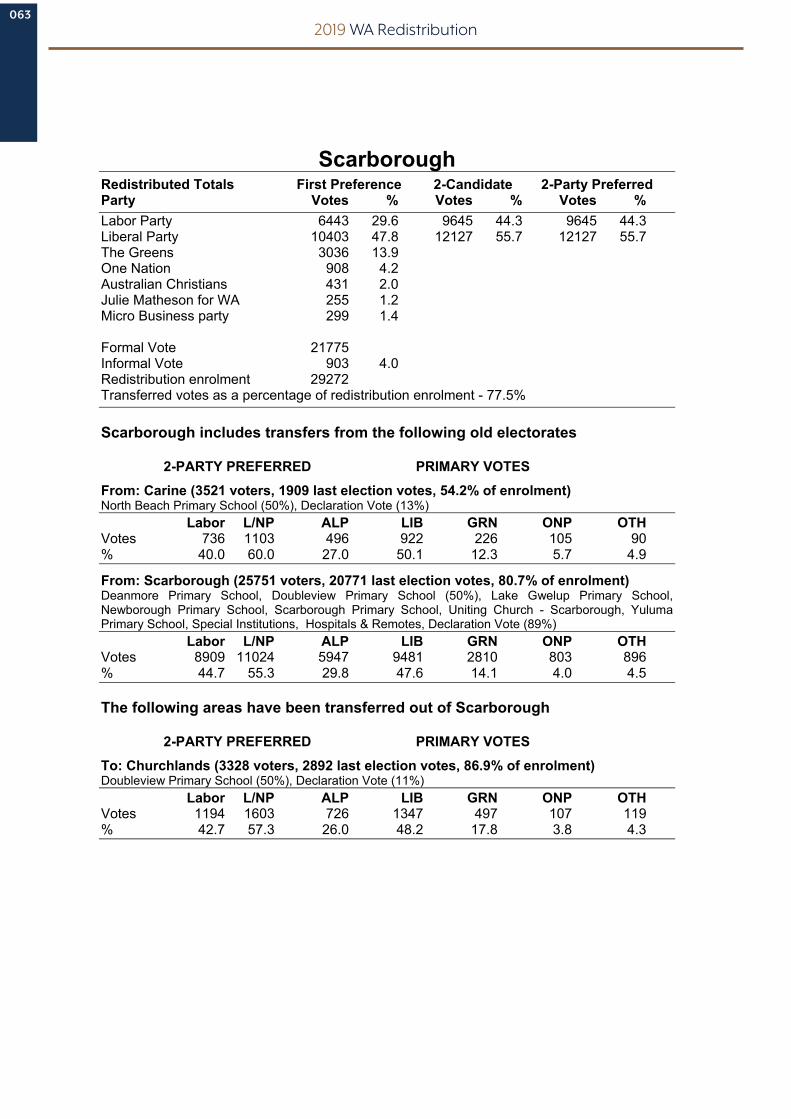
2019 WA Redistribution
2019 WA Redistribution
63
ScarboroughRedistributed Totals First Preference 2-Candidate 2-Party Preferred Party Votes % Votes % Votes % Labor Party 6443 29.6 9645 44.3 9645 44.3 Liberal Party 10403 47.8 12127 55.7 12127 55.7 The Greens 3036 13.9 One Nation 908 4.2 Australian Christians 431 2.0 Julie Matheson for WA 255 1.2 Micro Business party 299 1.4
Formal Vote 21775 Informal Vote 903 4.0 Redistribution enrolment 29272 Transferred votes as a percentage of redistribution enrolment - 77.5%
Scarborough includes transfers from the following old electorates
2-PARTY PREFERRED PRIMARY VOTES From: Carine (3521 voters, 1909 last election votes, 54.2% of enrolment) North Beach Primary School (50%), Declaration Vote (13%) Labor L/NP ALP LIB GRN ONP OTHVotes 736 1103 496 922 226 105 90 % 40.0 60.0 27.0 50.1 12.3 5.7 4.9
From: Scarborough (25751 voters, 20771 last election votes, 80.7% of enrolment) Deanmore Primary School, Doubleview Primary School (50%), Lake Gwelup Primary School, Newborough Primary School, Scarborough Primary School, Uniting Church - Scarborough, Yuluma Primary School, Special Institutions, Hospitals & Remotes, Declaration Vote (89%) Labor L/NP ALP LIB GRN ONP OTHVotes 8909 11024 5947 9481 2810 803 896 % 44.7 55.3 29.8 47.6 14.1 4.0 4.5
The following areas have been transferred out of Scarborough
2-PARTY PREFERRED PRIMARY VOTES To: Churchlands (3328 voters, 2892 last election votes, 86.9% of enrolment) Doubleview Primary School (50%), Declaration Vote (11%) Labor L/NP ALP LIB GRN ONP OTHVotes 1194 1603 726 1347 497 107 119 % 42.7 57.3 26.0 48.2 17.8 3.8 4.3
063

2019 WA Redistribution
2019 WA Redistribution
64
South Perth Redistributed Totals First Preference 2-Candidate 2-Party Preferred Party Votes % Votes % Votes % Labor Party 6997 29.7 10088 42.8 10088 42.8 Liberal Party 11807 50.1 13480 57.2 13480 57.2 The Greens 2778 11.8 Australian Christians 440 1.9 Micro Business party 437 1.9 Independent 1116 4.7
Formal Vote 23575 Informal Vote 887 3.6 Redistribution enrolment 28405 Transferred votes as a percentage of redistribution enrolment - 86.1%
South Perth includes transfers from the following old electorates
2-PARTY PREFERRED PRIMARY VOTES From: South Perth (28405 voters, 24462 last election votes, 86.1% of enrolment) Challenger Reserve, Collier Primary School, Como Primary School, Curtin Primary School, Ernest Johnson Oval Pavilion, Kensington Primary School, South Perth Primary School, St Augustine's Church Hall, St Pius X Parish Hall, Uniting Church - South Perth, Special Institutions, Hospitals & Remotes, Declaration Vote (99%) Labor L/NP ALP LIB GRN OTHVotes 10088 13480 6997 11807 2778 1993 % 42.8 57.2 29.7 50.1 11.8 8.5
The following areas have been transferred out of South Perth
2-PARTY PREFERRED PRIMARY VOTES To: Victoria Park (389 voters, 214 last election votes, 55.0% of enrolment) Kent Street Senior High School, Declaration Vote (1%) Labor L/NP ALP LIB GRN OTHVotes 103 101 66 89 29 20 % 50.5 49.5 32.4 43.6 14.2 9.8
064

2019 WA Redistribution
2019 WA Redistribution
65
Southern River Redistributed Totals First Preference 2-Candidate 2-Party Preferred Party Votes % Votes % Votes % Labor Party 11311 49.7 13170 57.9 13170 57.9 Liberal Party 8853 38.9 9591 42.1 9591 42.1 The Greens 1443 6.3 Julie Matheson for WA 222 1.0 Liberal Democrats 146 0.6 Micro Business party 227 1.0 Independent 563 2.5
Formal Vote 22765 Informal Vote 1145 4.8 Redistribution enrolment 27919 Transferred votes as a percentage of redistribution enrolment - 85.6%
Southern River includes transfers from the following old electorates
2-PARTY PREFERRED PRIMARY VOTES From: Southern River (27919 voters, 23910 last election votes, 85.6% of enrolment) Ashburton Drive Primary School, Bletchley Park Primary School, Caladenia Primary School, Campbell Primary School, Canning Vale College, Excelsior Primary School, Gosnells Primary School, Huntingdale Primary School, Wirrabirra Primary School, Special Institutions, Hospitals & Remotes, Declaration Vote Labor L/NP ALP LIB GRN OTHVotes 13170 9591 11311 8853 1443 1158 % 57.9 42.1 49.7 38.9 6.3 5.1
Note: Boundaries unchanged.
065

2019 WA Redistribution
2019 WA Redistribution
66
Swan Hills Redistributed Totals First Preference 2-Candidate 2-Party Preferred Party Votes % Votes % Votes % Labor Party 10424 49.4 13106 62.1 13096 62.1 Liberal Party 5936 28.1 7993 37.9 7993 37.9 The Greens 1576 7.5 One Nation 2370 11.2 Australian Christians 47 0.2 Julie Matheson for WA 256 1.2 Shooters, Fishers, Farmers 151 0.7 Micro Business party 351 1.7
Formal Vote 21111 Informal Vote 953 4.3 Redistribution enrolment 28392 Transferred votes as a percentage of redistribution enrolment - 77.7%
Swan Hills includes transfers from the following old electorates
2-PARTY PREFERRED PRIMARY VOTES From: Darling Range (209 voters, 60 last election votes, 28.7% of enrolment) Declaration Vote (1%) Labor L/NP ALP LIB GRN ONP OTHVotes 32 25 23 17 4 5 7 % 56.1 43.9 41.1 30.4 7.1 8.9 12.5
From: Swan Hills (26031 voters, 20080 last election votes, 77.1% of enrolment) Arbor Grove Primary School, Bullsbrook College, Chidlow Primary School, Ellen Stirling Primary School, Ellenbrook Secondary College (25%), Gidgegannup Shire Hall, Mt Helena Recreation Centre, Sawyers Valley Primary School, Upper Swan Primary School, Wooroloo Primary School, Declaration Vote (75%) Labor L/NP ALP LIB GRN ONP OTHVotes 12068 7144 9588 5257 1450 2365 566 % 62.8 37.2 49.9 27.3 7.5 12.3 2.9
From: West Swan (2152 voters, 1926 last election votes, 89.5% of enrolment) Herne Hill Primary School, Declaration Vote (7%) Labor L/NP ALP LIB GRN OTHVotes 996 824 812 662 122 233 % 54.7 45.3 44.4 36.2 6.7 12.7
The following areas have been transferred out of Swan Hills
2-PARTY PREFERRED PRIMARY VOTES To: Kalamunda (7 voters, 2 last election votes, 28.6% of enrolment) Declaration Vote (0%)
To: Midland (6 voters, 1 last election votes, 16.7% of enrolment) Declaration Vote (0%)
To: West Swan (8820 voters, 8593 last election votes, 97.4% of enrolment) Ellenbrook Secondary College (75%), GraceLife Church, Swan Valley Anglican Community School, Declaration Vote (25%) Labor L/NP ALP LIB GRN ONP OTHVotes 5604 2618 4707 2137 480 670 223 % 68.2 31.8 57.3 26.0 5.8 8.2 2.7
066

2019 WA Redistribution
2019 WA Redistribution
67
ThornlieRedistributed Totals First Preference 2-Candidate 2-Party Preferred Party Votes % Votes % Votes % Labor Party 11983 52.6 14965 65.8 14965 65.8 Liberal Party 5682 25.0 7781 34.2 7781 34.2 The Greens 1563 6.9 One Nation 1747 7.7 Australian Christians 798 3.5 Shooters, Fishers, Farmers 526 2.3 Micro Business party 309 1.4 Flux the System! 160 0.7
Formal Vote 22768 Informal Vote 1451 6.0 Redistribution enrolment 28445 Transferred votes as a percentage of redistribution enrolment - 85.1%
Thornlie includes transfers from the following old electorates
2-PARTY PREFERRED PRIMARY VOTES From: Thornlie (28445 voters, 24219 last election votes, 85.1% of enrolment) Addie Mills Centre, Addie Mills Centre (Drive In), East Maddington Primary School, Forest Crescent Primary School, Gosnells Primary School, Maddington Primary School, Thornlie Primary School, Thornlie Senior High School, Wirrabirra Primary School, Yale Primary School, Yule Brook College, Special Institutions, Hospitals & Remotes, Declaration Vote Labor L/NP ALP LIB GRN ONP OTHVotes 14965 7781 11983 5682 1563 1747 1793 % 65.8 34.2 52.6 25.0 6.9 7.7 7.9
Note: Boundaries unchanged.
067

2019 WA Redistribution
2019 WA Redistribution
68
VasseRedistributed Totals First Preference 2-Candidate 2-Party Preferred Party Votes % Votes % Votes % Labor Party 4936 20.7 8444 35.4 8444 35.4 Liberal Party 11038 46.2 15442 64.6 15442 64.6 The Nationals 4611 19.3 The Greens 3299 13.8 Others 5 0.0
Formal Vote 23889 Informal Vote 993 4.0 Redistribution enrolment 29287 Transferred votes as a percentage of redistribution enrolment - 85.0%
Vasse includes transfers from the following old electorates
2-PARTY PREFERRED PRIMARY VOTES From: Collie-Preston (112 voters, 37 last election votes, 33.0% of enrolment) Declaration Vote (0%) Labor L/NP ALP LIB NAT GRN ONP OTHVotes 23 13 18 6 5 2 3 2 % 63.9 36.1 50.0 16.7 13.9 5.6 8.3 5.6
From: Vasse (29175 voters, 24845 last election votes, 85.2% of enrolment) Acton Park Hall, Busselton Primary School, Busselton Senior High School, Cape Naturaliste College, Churchill Park Hall, Cowaramup Primary School, Dunsborough Hall, Georgiana Molloy Anglican School, Naturaliste Community Centre, Rosa Brook Hall, West Busselton Primary School, Yallingup Hall, Special Institutions, Hospitals & Remotes, Declaration Vote Labor L/NP ALP LIB NAT GRNVotes 8421 15429 4918 11032 4606 3297 % 35.3 64.7 20.6 46.2 19.3 13.8
068

2019 WA Redistribution
2019 WA Redistribution
69
Victoria Park Redistributed Totals First Preference 2-Candidate 2-Party Preferred Party Votes % Votes % Votes % Labor Party 10889 51.1 14225 66.8 14225 66.8 Liberal Party 6023 28.2 7083 33.2 7083 33.2 The Greens 3124 14.7 Australian Christians 775 3.6 Micro Business party 499 2.3 Independent 13 0.1
Formal Vote 21323 Informal Vote 970 4.4 Redistribution enrolment 27114 Transferred votes as a percentage of redistribution enrolment - 82.2%
Victoria Park includes transfers from the following old electorates
2-PARTY PREFERRED PRIMARY VOTES From: South Perth (389 voters, 214 last election votes, 55.0% of enrolment) Kent Street Senior High School, Declaration Vote (1%) Labor L/NP ALP LIB GRN OTHVotes 103 101 66 89 29 20 % 50.5 49.5 32.4 43.6 14.2 9.8
From: Victoria Park (26725 voters, 22078 last election votes, 82.6% of enrolment) Bentley Baptist Church, Bentley Community Centre, Carlisle Memorial Hall, Connect Victoria Park Inc, East Victoria Park Primary School, Handa Hall (within Perron Centre), Lathlain Primary School, Leisurelife Centre, Millen Primary School, Swan Village Of Care, Wilson Primary School (40%), Special Institutions, Hospitals & Remotes, Declaration Vote (93%) Labor L/NP ALP LIB GRN OTHVotes 14122 6982 10823 5934 3095 1267 % 66.9 33.1 51.2 28.1 14.7 6.0
The following areas have been transferred out of Victoria Park
2-PARTY PREFERRED PRIMARY VOTES To: Cannington (2081 voters, 1624 last election votes, 78.0% of enrolment) Wilson Primary School (60%), Declaration Vote (7%) Labor L/NP ALP LIB GRN OTHVotes 940 616 750 463 175 170 % 60.4 39.6 48.1 29.7 11.2 10.9
069

2019 WA Redistribution
2019 WA Redistribution
70
WannerooRedistributed Totals First Preference 2-Candidate 2-Party Preferred Party Votes % Votes % Votes % Labor Party 10704 47.4 13223 58.6 13223 58.6 Liberal Party 6680 29.6 9337 41.4 9337 41.4 The Greens 1734 7.7 One Nation 1772 7.8 Australian Christians 608 2.7 Julie Matheson for WA 244 1.1 Shooters, Fishers, Farmers 272 1.2 Micro Business party 126 0.6 Independent 447 2.0
Formal Vote 22587 Informal Vote 1061 4.5 Redistribution enrolment 29481 Transferred votes as a percentage of redistribution enrolment - 80.2%
Wanneroo includes transfers from the following old electorates
2-PARTY PREFERRED PRIMARY VOTES From: Wanneroo (21860 voters, 18474 last election votes, 84.5% of enrolment) Carramar Primary School, Crossways Uniting Church, Spring Hill Primary School, St Anthony's School, Tapping Primary School, Wanneroo Recreation Centre, Wanneroo Secondary College, Special Institutions, Hospitals & Remotes, Declaration Vote (77%) Labor L/NP ALP LIB GRN ONP OTHVotes 10154 7549 8279 5356 1181 1772 1122 % 57.4 42.6 46.7 30.2 6.7 10.0 6.3
From: West Swan (7621 voters, 5175 last election votes, 67.9% of enrolment) Banksia Grove Primary School, Joseph Banks Secondary College, Declaration Vote (25%) Labor L/NP ALP LIB GRN OTHVotes 3069 1788 2425 1324 553 575 % 63.2 36.8 49.7 27.1 11.3 11.8
The following areas have been transferred out of Wanneroo
2-PARTY PREFERRED PRIMARY VOTES To: Landsdale (6476 voters, 5866 last election votes, 90.6% of enrolment) Hocking Primary School, Pearsall Primary School, Declaration Vote (23%) Labor L/NP ALP LIB GRN ONP OTHVotes 3208 2425 2651 1662 371 517 433 % 57.0 43.0 47.1 29.5 6.6 9.2 7.7
070

2019 WA Redistribution
2019 WA Redistribution
71
WarnbroRedistributed Totals First Preference 2-Candidate 2-Party Preferred Party Votes % Votes % Votes % Labor Party 13821 60.6 16800 73.7 16800 73.7 Liberal Party 3631 15.9 5988 26.3 5988 26.3 The Greens 1582 6.9 One Nation 2721 11.9 Australian Christians 540 2.4 Julie Matheson for WA 286 1.3 Micro Business party 218 1.0
Formal Vote 22799 Informal Vote 1022 4.3 Redistribution enrolment 29353 Transferred votes as a percentage of redistribution enrolment - 81.2%
Warnbro includes transfers from the following old electorates
2-PARTY PREFERRED PRIMARY VOTES From: Warnbro (29353 voters, 23821 last election votes, 81.2% of enrolment) Coastal Community Centre, Comet Bay College, Koorana Primary School, Port Kennedy Primary School, Rockingham Lakes Primary School, Secret Harbour Community Hall, Singleton Primary School, Warnbro Community High School, Warnbro Primary School, Special Institutions, Hospitals & Remotes, Declaration Vote Labor L/NP ALP LIB GRN ONP OTHVotes 16800 5988 13821 3631 1582 2721 1044 % 73.7 26.3 60.6 15.9 6.9 11.9 4.6
Note: Boundaries unchanged.
071

2019 WA Redistribution 072
2019 WA Redistribution
72
Warren-BlackwoodRedistributed Totals First Preference 2-Candidate 2-Party Preferred Party Votes % Votes % Votes % Labor Party 5021 20.8 8968 37.2 8968 37.2 Liberal Party 3806 15.8 The Nationals 8753 36.3 15157 62.8 15157 62.8 The Greens 3500 14.5 One Nation 1672 6.9 Shooters, Fishers, Farmers 1364 5.7 Independent 14 0.1
Formal Vote 24130 Informal Vote 1095 4.3 Redistribution enrolment 28531 Transferred votes as a percentage of redistribution enrolment - 88.4%
Warren-Blackwood includes transfers from the following old electorates
2-PARTY PREFERRED PRIMARY VOTES From: Collie-Preston (580 voters, 573 last election votes, 98.8% of enrolment) Balingup Primary School, Declaration Vote (2%) Labor L/NP ALP LIB NAT GRN ONP OTHVotes 346 215 167 103 114 109 31 34 % 61.7 38.3 29.9 18.5 20.4 19.5 5.6 6.1 2-Candidate Preferred: ALP 345 (61.6%) LIB 215 (38.4%)
From: Warren-Blackwood (27951 voters, 24652 last election votes, 88.2% of enrolment) Augusta Community Resource Centre, Boyup Brook Ambulance Centre, Bridgetown Lesser Hall, Denmark Recreation Centre, East Manjimup Primary School, Frost Park Pavilion, Greenbushes Primary School, Karridale Primary School, Kendenup Primary School, Manjimup Town Hall, Margaret River Senior High School, Mayanup Hall, Nannup RSL Hall, Narrikup District Hall, Northcliffe District High School, Parryville Hall, Pemberton Sports Club, Porongurup District Hall, Quinninup Community Centre, Scotsdale Hall, Tingledale Hall, Walpole Community Centre, Witchcliffe Druids Hall, Yornup Hall, Special Institutions, Hospitals & Remotes, Declaration Vote Labor L/NP ALP LIB NAT GRN ONP OTHVotes 8622 14942 4854 3703 8639 3391 1641 1344 % 36.6 63.4 20.6 15.7 36.6 14.4 7.0 5.7 2-Candidate Preferred: ALP 8622 (36.6%) NAT 14942 (63.4%)
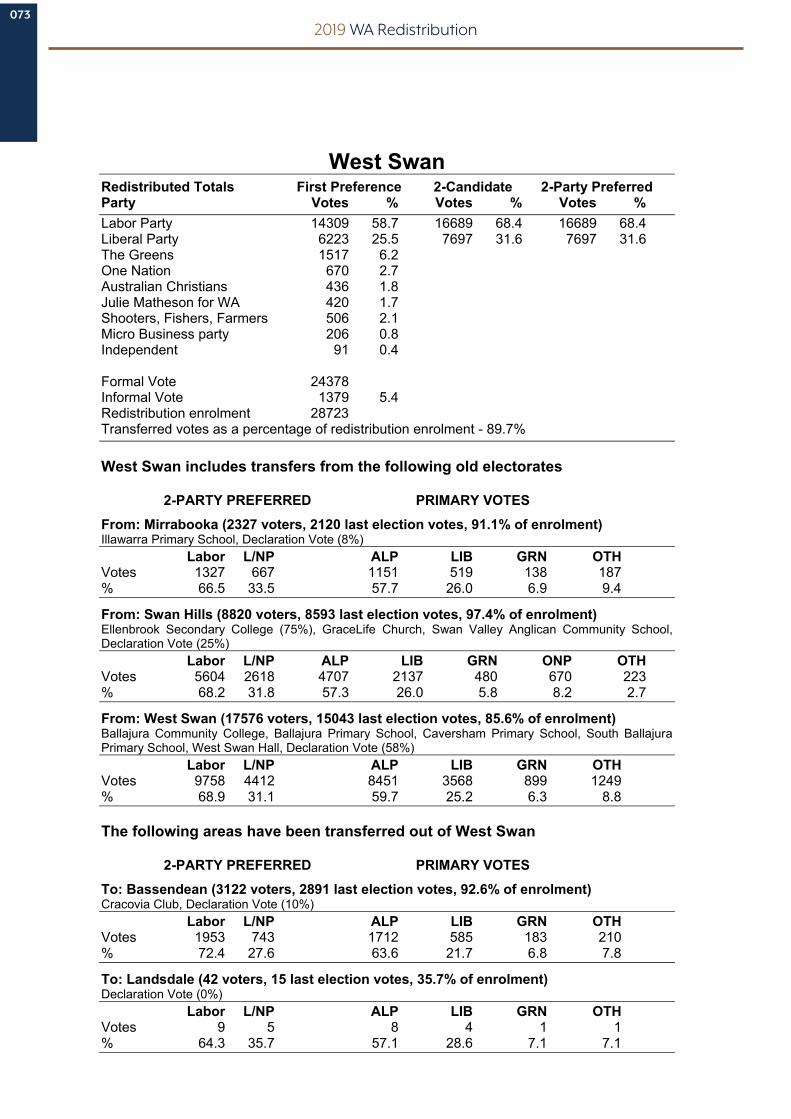
2019 WA Redistribution 073
2019 WA Redistribution
73
West Swan Redistributed Totals First Preference 2-Candidate 2-Party Preferred Party Votes % Votes % Votes % Labor Party 14309 58.7 16689 68.4 16689 68.4 Liberal Party 6223 25.5 7697 31.6 7697 31.6 The Greens 1517 6.2 One Nation 670 2.7 Australian Christians 436 1.8 Julie Matheson for WA 420 1.7 Shooters, Fishers, Farmers 506 2.1 Micro Business party 206 0.8 Independent 91 0.4
Formal Vote 24378 Informal Vote 1379 5.4 Redistribution enrolment 28723 Transferred votes as a percentage of redistribution enrolment - 89.7%
West Swan includes transfers from the following old electorates
2-PARTY PREFERRED PRIMARY VOTES From: Mirrabooka (2327 voters, 2120 last election votes, 91.1% of enrolment) Illawarra Primary School, Declaration Vote (8%) Labor L/NP ALP LIB GRN OTHVotes 1327 667 1151 519 138 187 % 66.5 33.5 57.7 26.0 6.9 9.4
From: Swan Hills (8820 voters, 8593 last election votes, 97.4% of enrolment) Ellenbrook Secondary College (75%), GraceLife Church, Swan Valley Anglican Community School, Declaration Vote (25%) Labor L/NP ALP LIB GRN ONP OTHVotes 5604 2618 4707 2137 480 670 223 % 68.2 31.8 57.3 26.0 5.8 8.2 2.7
From: West Swan (17576 voters, 15043 last election votes, 85.6% of enrolment) Ballajura Community College, Ballajura Primary School, Caversham Primary School, South Ballajura Primary School, West Swan Hall, Declaration Vote (58%) Labor L/NP ALP LIB GRN OTHVotes 9758 4412 8451 3568 899 1249 % 68.9 31.1 59.7 25.2 6.3 8.8
The following areas have been transferred out of West Swan
2-PARTY PREFERRED PRIMARY VOTES To: Bassendean (3122 voters, 2891 last election votes, 92.6% of enrolment) Cracovia Club, Declaration Vote (10%) Labor L/NP ALP LIB GRN OTHVotes 1953 743 1712 585 183 210 % 72.4 27.6 63.6 21.7 6.8 7.8
To: Landsdale (42 voters, 15 last election votes, 35.7% of enrolment) Declaration Vote (0%) Labor L/NP ALP LIB GRN OTHVotes 9 5 8 4 1 1 % 64.3 35.7 57.1 28.6 7.1 7.1

2019 WA Redistribution 074
2019 WA Redistribution
74
To: Swan Hills (2152 voters, 1926 last election votes, 89.5% of enrolment) Herne Hill Primary School, Declaration Vote (7%) Labor L/NP ALP LIB GRN OTHVotes 996 824 812 662 122 233 % 54.7 45.3 44.4 36.2 6.7 12.7
To: Wanneroo (7621 voters, 5175 last election votes, 67.9% of enrolment) Banksia Grove Primary School, Joseph Banks Secondary College, Declaration Vote (25%) Labor L/NP ALP LIB GRN OTHVotes 3069 1788 2425 1324 553 575 % 63.2 36.8 49.7 27.1 11.3 11.8

2019 WA Redistribution 075
2019 WA Redistribution
75
WillageeRedistributed Totals First Preference 2-Candidate 2-Party Preferred Party Votes % Votes % Votes % Labor Party 12621 54.9 15559 67.7 15559 67.7 Liberal Party 6549 28.5 7438 32.3 7438 32.3 The Greens 2572 11.2 Australian Christians 514 2.2 Socialist Alliance 195 0.8 Micro Business party 345 1.5 Flux the System! 38 0.2 Independent 168 0.7
Formal Vote 23002 Informal Vote 1173 4.9 Redistribution enrolment 27173 Transferred votes as a percentage of redistribution enrolment - 89.0%
Willagee includes transfers from the following old electorates
2-PARTY PREFERRED PRIMARY VOTES From: Cockburn (5781 voters, 5241 last election votes, 90.7% of enrolment) Newton Primary School, Spearwood Primary School, St Jerome's School (50%), St Michael Church (75%), Declaration Vote (20%) Labor L/NP ALP LIB GRN OTHVotes 3321 1567 2743 1314 459 373 % 67.9 32.1 56.1 26.9 9.4 7.6
From: Willagee (21392 voters, 18935 last election votes, 88.5% of enrolment) Bibra Lake Primary School, Caralee Community School, Coolbellup Community School, Kardinya Primary School (10%), Lakeland Senior High School, North Lake Senior Campus, Samson Primary School, South Lake Primary School, Southern Districts Senior Centre, Southern Districts Senior Centre (Drive-in), Special Institutions, Hospitals & Remotes, Declaration Vote (85%) Labor L/NP ALP LIB GRN OTHVotes 12238 5871 9878 5235 2113 886 % 67.6 32.4 54.5 28.9 11.7 4.9
The following areas have been transferred out of Willagee
2-PARTY PREFERRED PRIMARY VOTES To: Bateman (3632 voters, 3328 last election votes, 91.6% of enrolment) Kardinya Primary School (90%), Declaration Vote (15%) Labor L/NP ALP LIB GRN OTHVotes 1719 1471 1358 1305 357 174 % 53.9 46.1 42.5 40.9 11.2 5.4

2019 WA Redistribution 076
2019 WA Redistribution
76
TRANSFERS OF OLD DISTRICT ENROLMENTS
Old Electorate Electors Transferred to Albany Albany 26,600 (97.3%) Roe 742 (2.7%)
Armadale Armadale 29,460 (100.0%)
Balcatta Balcatta 24,556 (87.1%) Kingsley 3,622 (12.9%)
Baldivis Baldivis 28,633 (85.1%) Kwinana 4,139 (12.3%) Rockingham 868 (2.6%)
Bassendean Bassendean 24,070 (88.6%) Morley 3,111 (11.4%)
Bateman Bateman 25,735 (100.0%)
Belmont Belmont 27,832 (100.0%)
Bicton Bicton 25,999 (100.0%)
Bunbury Bunbury 28,274 (100.0%)
Burns Beach Burns Beach 22,654 (75.6%) Joondalup 7300 (24.4%)
Butler Butler 28,799 (83.9%) Burns Beach 5546 (16.1%)
Cannington Cannington 25,623 (97.5%) Riverton 656 (2.5%)
Carine Carine 24,256 (87.3%) Scarborough 3521 (12.7%)
Central Wheatbelt Central Wheatbelt 23,775 (92.0%) Moore 2080 (8.0%)
Churchlands Churchlands 25,089 (92.8%) Cottesloe 1934 (7.2%)
Cockburn Cockburn 23,163 (80.0%) Willagee 5781 (20.0%)
Collie-Preston Collie-Preston 27,077 (93.7%) Bunbury 1,118 (3.9%) Warren-Blackwood 580 (2.0%) Vasse 112 (0.4%)
Cottesloe Cottesloe 27,499 (100.0%)
Darling Range Darling Range 29,181 (88.7%) Kalamunda 1,994 (6.1%) Kwinana 1000 (3.0%) Baldivis 529 (1.6%) Swan Hills 209 (0.6%)
Dawesville Dawesville 29,374 (94.6%) Murray-Wellington 983 (3.2%) Mandurah 690 (2.2%)
Forrestfield Forrestfield 27,120 (100.0%)
Fremantle Fremantle 28,651 (96.8%) Bicton 960 (3.2%)
Geraldton Geraldton 25,874 (100.0%)
Girrawheen Landsdale 17,059 (57.9%) Mirrabooka 12,404 (42.1%)
Hillarys Hillarys 22,143 (80.1%) Carine 5,498 (19.9%)
Jandakot Jandakot 28,799 (92.2%) Riverton 2,447 (7.8%)
Joondalup Joondalup 20,871 (75.5%) Hillarys 6,787 (24.5%)
Kalamunda Kalamunda 26,889 (100.0%)
Kalgoorlie Kalgoorlie 19,622 (100.0%)
Kimberley Kimberley 15,275 (100.0%)
Kingsley Kingsley 25,951 (100.0%)
Kwinana Kwinana 21,428 (79.7%) Cockburn 5457 (20.3%)
Mandurah Mandurah 28,744 (94.9%) Murray-Wellington 1556 (5.1%)
Maylands Maylands 27,967 (100.0%)
Midland Midland 29,320 (96.2%) Bassendean 1,145 (3.8%)

2019 WA Redistribution 077
2019 WA Redistribution
77
Old Electorate Electors Transferred to Mirrabooka Mirrabooka 16,484 (59.1%) Landsdale 5,367 (19.2%) Balcatta 3,728
(13.4%) West Swan 2,327 (8.3%)
Moore Moore 23,217 (95.9%) North West Central 989 (4.1%)
Morley Morley 25,657 (100.0%)
Mount Lawley Mount Lawley 28,133 (100.0%)
Murray-Wellington Murray-Wellington 26,428 (91.3%) Collie-Preston 2,511 (8.7%)
Nedlands Nedlands 27,637 (100.0%)
North West Central North West Central 9,915 (100.0%)
Perth Perth 29,055 (95.4%) Nedlands 1,399 (4.6%)
Pilbara Pilbara 21,700 (99.2%) Kimberley 185 (0.8%)
Riverton Riverton 25,078 (100.0%)
Rockingham Rockingham 27,107 (100.0%)
Roe Roe 23,803 (93.4%) Central Wheatbelt 1,683 (6.6%)
Scarborough Scarborough 25,751 (88.6%) Churchlands 3,328 (11.4%)
South Perth South Perth 28,405 (98.6%) Victoria Park 389 (1.4%)
Southern River Southern River 27,919 (100.0%)
Swan Hills Swan Hills 26,031 (74.7%) West Swan 8,820 (25.3%) Kalamunda 7 (0.0%) Midland 6 (0.0%)
Thornlie Thornlie 28,445 (100.0%)
Vasse Vasse 29,175 (100.0%)
Victoria Park Victoria Park 26,725 (92.8%) Cannington 2,081 (7.2%)
Wanneroo Wanneroo 21,860 (77.1%) Landsdale 6,476 (22.9%)
Warnbro Warnbro 29,353 (100.0%)
Warren-Blackwood Warren-Blackwood 27,951 (100.0%)
West Swan West Swan 17,576 (57.6%) Wanneroo 7,621 (25.0%) Bassendean 3,122 (10.2%) Swan Hills 21,52 (7.1%) Landsdale 42 (0.1%)
Willagee Willagee 21,392 (85.5%) Bateman 3,632 (14.5%)

2019 WA Redistribution 078
IBRAR YP A R L I A M E N T A R Y
wes te rn australia

![ANALYSIS OF FINAL ELECTORAL BOUNDARIESFILE/WA2011_Redistribution_final[1].pdf · ANALYSIS OF FINAL ELECTORAL BOUNDARIES by ... votes are cast for candidates or parties, ... Transferring](https://static.fdocuments.in/doc/165x107/5b2f7b237f8b9ac06e8d6e6d/analysis-of-final-electoral-filewa2011redistributionfinal1pdf-analysis.jpg)


![57-2-txt FINAL NEWconsidering the Charter and Electoral Boundaries” (1999) 22:1 Dal LJ 53 at 88 [Carter, “Electoral Boundaries”]; Michael Pal & Sujit Choudhry, “Is Every Ballot](https://static.fdocuments.in/doc/165x107/5ec6a348516d821f3a570714/57-2-txt-final-new-considering-the-charter-and-electoral-boundariesa-1999-221.jpg)