ANALYSIS OF DYNAMIC STALL USING UNSTEADY BOUNDARY-LAYER THEORY · i i ~ nasacontractor nasa cr-2462...
68
I I ~ NASACONTRACTOR NASA CR-2462 I REPORT 1 rn ANALYSIS OF DYNAMIC STALL USING UNSTEADY BOUNDARY-LAYER THEORY Prepared by SCIENTIFIC & BUSINESS CONSULTANTS, INC. Atlanta, Ga. 30339 for Lagley Research Center NATIONAL AERONAUTICS AND SPACE ADMINISTRATION WASHINGTON, D. C. OCTOBER 1974 https://ntrs.nasa.gov/search.jsp?R=19740026587 2018-06-16T09:38:38+00:00Z
-
Upload
phungxuyen -
Category
Documents
-
view
216 -
download
2
Transcript of ANALYSIS OF DYNAMIC STALL USING UNSTEADY BOUNDARY-LAYER THEORY · i i ~ nasacontractor nasa cr-2462...

I
I
~ N A S A C O N T R A C T O R N A S A C R - 2 4 6 2 I R E P O R T 1
rn
ANALYSIS OF DYNAMIC STALL USING UNSTEADY BOUNDARY-LAYER THEORY
Prepared by
SCIENTIFIC & BUSINESS CONSULTANTS, INC.
Atlanta, Ga. 3 0 3 3 9
for L a g l e y Research Center
N A T I O N A L A E R O N A U T I C S A N D SPACE A D M I N I S T R A T I O N W A S H I N G T O N , D. C. OCTOBER 1974
https://ntrs.nasa.gov/search.jsp?R=19740026587 2018-06-16T09:38:38+00:00Z

1. Report No. 2. Government Accession No.
NASA CR-2462 3. Recipient's Catalog No.
4. Title and Subtitle ANALYSIS OF DYNAMIC STALL USING UNSTEADY BOUNDARY - LAYER THEORY
5. Report Date
6. Performing Organization Code
October 197 4
~
6. Abstract
7. Author(s)
R. M. Scruggs, J. F. Nash, and R . E. Singleton
9. Performing Organization Name and Address
Scientific and Business Consultants, Inc.
Atlanta, Georgia 30339 9 Perimeter Place, N.W.
2. Sponsoring Agency Name and Address
The unsteady turbulent boundary layer and potential flow about a pitching airfoil are analyzed using numerical methods to determine the effect of pitch rate on the delay in forward movement of the rear flow reversal point. An explicit finite difference scheme is used to integrate the unsteady boundary layer equations, which are coupled at each instant of time to a fully unsteady and nonlinear potential flow analysis. A substantial delay in forward movement of the reversal point is demonstrated with increasing pitch rate, and it is shown that the delay results partly from the alleviation of the gradients in the potential flow, and partly from the effects of unsteadiness in the boundary layer itself.
8. Performing Organization Report No.
10. Work Unit No.
11. Contract or Grant No.
NAS1-11991 13. Type of Report and Period Covered
Contractor Report
The predicted delay in flow-reversal onset, and its variation with pitch rate, are shown to be in reasonable agreement with experimental data relating to the delay in dynamic stall. From the comparisons it can be concluded (a) that the effects of time-dependence are sufficient to explain the failure of the boundary layer to separate during the dynamic overshoot, and (b) that there may be some link between forward movement of the reversal point and dynamic stall.
National Aeronautics and Space Administration Washington, D.C. 20546
7
14, Sponsoring Agency Code
r..- _ _ I . * r VI xlle oy rne Narionai Technicai information Service, Sprlngtield, Vlrginia 22151
7. Key Words (Suggested by Author(s1)
Boundary layer, pitching airfoil, unsteady boundary layer, turbulent boundary layer, boundary layer separation, dynamic stall
18. Distribution Statement
UNCLASSIFIED - Unlimited
Star Category 12 19. Security Classif. (of this report)
Unclassified Unclassified 20. Security Classif. (of this page1 21. NO. of Pages 22. Rice'
66 $3.75

CONTENTS
Page
L I S T O F F I G U R E S . . . . . . . . . . . . . . . . . . . . . . . . iv
SUMMARY . . . . . . . . . . . . . . . . . . . . . . . . . . . . vii
SYMOBLS . . . . . . . . . . . . . . . . . . . . . . . . i x
INTRODUCTION . . . . . . . . . . . . . . . . . . . . . . . . . 1
THEORETICAL DEVELOPMENT . . . . . . . . . . . . . . . . . . . . The Potent ia l Flow The Unsteady Boundary Layer
RESULTS AND COMPARISONS WITH EXPERDENT . . . . . . . . . . . Analytical Results and Discussion
Comparison with Experimental Results
CONCLUSIONS AND RFCOMMENDATIONS . . . . . . . . . . . . . . . . Conclusions
Re comme ndat ions
REFERENCES . . . . . . . . . . . . . . . . . . . . . . . . . .
6
19
29
34
iii

Figure
1
2
3
4
8
9
10
11
I2
LIST OF FIGURES
T i t l e - Schematic of the Computation Procedure
Unsteady Effect on C4 Due t o Ramp a’
Pitch Rate Effect on Upper-Surface Potential-Flow Velocity Distribution:
(a) &/urn = 0.06
(b) &/Urn = 0.10
P i t ch-Rate Effect on Upper-Surface Potential-Flow Pressure Distribution:
Page
38
39
40
42
(a) &/urn = 0.06
(b) .&/Urn = 0.10
Empirical Turbulence Functions
Numerical Integration Molecule
Schematic of the Boundary-Layer Coqutat ion Procedure
44
45
46
Forward Movement of t h e Flow-Reversal Point with Increasing Incidence: &/Urn = 0.005
47
Forward Movement of the Flow-Revers@ Point with Increasing Incidence:
Forward Movement of t he Flow-Reversal Point with Increasing Incidence:
col/Urn = 0.02
c&/U, = 0.04
48
49
Forward Movement of t he Flow-Reversal Point with Increasing Incidence:
Forward Movement of the Flow-Reversal Point with Increasing Incidence:
&/Urn = 0.06
&/Urn = 0.08
50
51
iv

LIST OF FIGURES
Figure
13
14
15
16
17
18
19
T i t l e
Forward Movement of the Flow-Reversal Point with Increasing Incidence: &/Urn = 0.10
Increasing i n Incidence f o r Flow Reversal at 0 . 5 ~ Due t o Pi tch Rate
Wall Shear Stress Versus Chordwise Posi t ion at Q = 17.5' ,and .&'/Urn = 0.06
Displacement Thicknesz Versus Chordwise Posit ion at Cy = 17.5 and .&'/Urn = 0.06
Wall Shear Stress and Displacement Thickness Response f o r the Fully Unsteady Case, &/urn = 0.06
Approach t o Flow Reversal: Selected Chordwise Stations and Incidences,
Velocity Prof i les at
&/urn = 0.06
Comparison of Theory and Experiment
Page
52
53
54
55
56
57
59
v


I
The coupled unsteady turbulent boundary layer and poten t ia l flow about
a pitching a i r f o i l are analyzed using numerical methods t o determine
the effect of pi tch r a t e on the delay i n forward movement of the rear
flow reversal point. An expl ic i t f i n i t e difference scheme is used t o
integrate the unsteady boundary layer equations, which are coupled a t
each instant of time t o a fully unsteady and nonlinear po ten t ia l flow
analysis.
point i s demonstrated w i t h increasing p i tch ra te , and it i s shown tha t
the delay resu l t s par t ly from the alleviation of the gradients i n the
poten t ia l flow, and par t ly from the effects of unsteadiness i n the
boundary layer i t s e l f .
A substant ia l delay i n forward movement of the reversal
The predicted delay i n flow-reversal onset, and i t s var ia t ion w i t h p i tch
ra te , a re shown t o be i n reasonable agreement w i t h experimental data
r e l a t ing to the delay i n dynamic s t a l l . From the comparisons it can be
concluded (a) tha t the effects of the-dependence are suff ic ient t o
explain the fa i lure of the boundary layer t o separate during the dynamic
overshoot, and (b) tha t there may be some l ink between forward movement
of the reversal point and dynamic s t a l l .

I SYMBOLS
I L
“l’“2
C
h
P
r
S
t
Y
r CY
0
Y
6
6*
7
P
u)
Matrices occurring i n the f i n i t e difference equations
Empirical scale of turbulence f’unct ion
Total head
Total veloci ty magnitude
Ensemble average veloci t ies i n the s and y-directions
Empirical coefficients i n the turbulence model
A i r f o i l chord
Height of the computation domain
Pres sure
Magnitude of posi t ion vector i n a i r f o i l coordinates
Arc length along the a i r f o i l surface
Time
Fluctuating veloci ty components
Distance measured along a i r f o i l chord
Distance masured along a loca l normal t o a i r f o i l surface
Circulation
Angle of attack, i n radians unless otherwise noted
A parameter i n the numerical method
Circulation d is t r ibu t ion
Boundary layer thickness
Boundary layer displacement thickness
Transfomed coordinate i n the numerical method
Density
Rotation r a t e , rad./sec.

cp
I-
T w
SYMBOLS (Cont 'd)
Velocity -potential
Turbulent shear s t r e s s , p s i .
Turbulent shear s t r e s s a t the wal l divided by pQ 2
Sub s c r i p t s
e Denotes conditions a t the edge of the boundary layer
r Denotes r e l a t ive motion i n an i n e r t i a l frame of reference
Superscript
(-1 Denotes a vector or a time or ensemble averaged quantity
X

I ANALYSIS OF DYNAMIC STALL *
USING UNSTEADY BOUNDARY-LAYER THEORY
by 4- R. M. Scruggs, J. E. Nash, R. E. Singleton
(+ now, Chief, Fluid Mechanics Branch, A r m y Research Office, Duke Station. Durham, N. C.)
! Introduction
I The phenomenon of dynakc s t a l l , or delay of the angle of s t a l l due t o
unsteady motion, has been the subject of intense investigation fo r
I several years. There remains some controversy as t o the exact
mechanisms responsible fo r the delay, and the extent t o which each is
responsible. Dynamic s ta l l i s identified as a l imiting factor i n the
design of high speed helicopters, and attempts t o predict control linkage
loads due t o it have not met w i t h great success. From the outset,
experimental work has proceeded along l ines intended t o simulate ac tua l
f l i gh t conditions for a helicopter rotor. From these data, design
oriented prediction methods have evolved, and t o the extent tha t t e s t
cases represent design conditions of new a i r c ra f t , the empirical methods
resul t ing from such t e s t s have generated reasonable design envelope
values . (2) It has been demonstrated that three-dimensional effects
associated w i t h rotor geometry do not contribute s ignif icant ly i n the
onset of s t a l l f l u t t e r f o r a helicopter. (3)
t h a t three-dimensional effects associated with the steady turbulent
It has f'urther been shown

boundary layer of the ro tor are not of significance i n the s t a l l delay
phen~menon'~) . These r e su l t s lend encouragement t o the development of
a two-dimensional, o r quasi two-dimensional, theory capable of predict-
ing dynamic s t a l l and the consequent s t a l l f l u t t e r excursions.
Several approaches have been taken i n the past t o t r ea t ing dynamic
s ta l l . Most have attacked the complete phenomenon, from pre-separation
through the circulat ion loss and return t o attached flow. Notable
contributions have been made by Ham(5) , Carta, e t al. ( 6 ) , Ericsson
and Re13.ing(~) , Cr imi (8 ) , and others. Several methods i n present use
are predicated on the unsteady aerodynamics of an a i r f o i l o sc i l l a t ing
i n s ta l l with a prescribed amplitude.
experimental data were obtained i n t h i s way, with only m i l d var ia t ions
i n the osc i l la tory form allowed. It i s d i f f i c u l t t o i so l a t e the
various mechanisms i n such data because of his tory e f fec ts i n the flow
and because dynamic s t a l l i s almost cer ta in ly dependent on the particu-
lar motion of the a i r f o i l before and during the s t a l l break.
Unfortunately most exis t ing
A number of phenomena may share roles of importance i n dynamic s t a l l .
The unsteady pressure d is t r ibu t ion has been shown t o be of importance
due t o the a l lev ia t ion of gradients over the a i r f o i l upper surface.
It has been argued t h a t the Karman-Sears/Theodorsen representation Of
unsteady-potential flow could account fo r par t of the overshoot i n lift.
A s developed f o r the l i nea r perturbation problem these theories account
for lift lag and attenuation, and it i s d i f f i c u l t t o justif 'y t h e i r Use
i n the s t a l l problem.
involved, it should be assumed tha t non-linear po ten t i a l f l o w i s
(9)
Because of t he r a t e s and amplitudes of motion
2

involved. However, the pressure gradient present i n the Karman-Sears
type theory i s of the correct behavior, as shown by Carta. (9)
The leading edge bubble, common t o many a i r f o i l s used fo r helicopter
rotors, may well play an important part i n s t a l l delay.
burst c r i te r ion has been developed by Crimi ('') f o r determining the
A bubble-
s t a l l condition. Other phenomenological devices have been used with
some success, such as induced camber(7), and the "spinning cylinder"
e f fec t a t the leading edge, as given by Ericsson and Reding. ( 11)
The ac tua l process of flow breakdown at the instant of s t a l l has been
a point of some controversy i n the past.
M~Croskey(~) , and the work of Ham(5), and Scruggs('), indicate the
presence of discrete leading edge vortex rol lup a t s tall .
including C r i m i ( " ) , have developed the idea of a "deadwater" region
immediately following bubble-burst at s t a l l .
The observations of
Others,
Serious theore t ica l
quest ions concerning the time-dependent boundary-layer development
come in to play from t h i s issue.
flow breakdown it is f irst necessary to carefully analyze the behavior
In order t o resolve the question of
of the unsteady boundary layer as the s t a l l condition i s approached.
L i t t l e consideration has been given the unsteady boundary layer i n
dynamic-stall theories , although i t s importance has been recognized,
or implied, by several researchers. One of the first attempts t o
investigate the significance of boundary-layer e f fec ts on a trans-
l a t ing ro tor was made by Hicks and Nash. (4)
t h a t three-dimensionality i n the boundary layer had a small but s ign i f i -
Their calculations showed
call+, effect. n ~ l separskion. However, the more important resu l t was tha t
3

both the two-and the three-dimensional calculations were found t o be
seriously pessimistic when the predicted separation boundaries were I
compared with t e s t resu l t s f o r an ac tua l rotor.
at tr ibuted chiefly t o the neglect of time dependence i n the boundary-
layer equations.
on the dynamic-stall problem taken i n the present investigations.
This perspective concentrates on the mechanism by which the boundary
layer manages t o remain attached during the dynamic overshoot, rather
than on the mechanism by which s t a l l f i na l ly does take place.
significant ra tes of pitch, the boundary layer stays attached t o the
a i r f o i l -- o r a t leas t behaves as though it were s t i l l attached -- at
angles of incidence substant ia l ly higher than could occur under S t a t i c
conditions.
The discrepancy was
It w a s a l so a major factor leading t o the perspective
A t
The suggestion that unsteady effects i n the boundary layer i tself (as
d is t inc t t o those i n the external flow) cause, o r contribute t o the
tenacity of the boundary layer referred t o above, w a s confirmed by the
work of Singleton e t a l . (13) and Nash e t a l . (I4)
tha t the-dependence resu l t s i n a delay i n the onset of flow reversa l
i n the boundary layer, and that th i s delay could be large under
conditions simulating the flow over an a i r f o i l i n upward pitching
motion.
d i s t inc t phenomena.
of the boundary layer, adjacent t o the a i r f o i l surface, and i t s onset
corresponds t o the vanishing on the w a l l shear s t r e s s .
the other hand, refers t o detachment of the outer flow from t h e a i r f o i l
Their work showed
Now, i n unsteady flow, reversal and separation are generally
Reversal re fers t o conditions i n the inner part
Separation, on
4
~ ~

contour, and the breakdown of the boundary-layer equations. The work
of Sears and Telionis(15) indicates that , fo r flows of the present type,
separation would always occw l a t e r than reversal. Thus, any prediction
of the delay i n flow-reversal onset has t o be regarded as a conservative
estimate of the delay i n separation onset. Correspondingly,
i s the point which i s relevant t o the present studies, i f it can be
shown tha t reversal i s avoided over some range of incidence, due t o
dynamic effects , then it can safely be concluded tha t separation w i l l be
avoided over at leas t the same range of incidence.
re fer only t o the upstroke of the a i r f o i l motion, which i s the si tua-
t i o n addressed herein; under conditions corresponding t o the downstroke,
separation preceeds reversal and avoidance of reversal does not imply
avoidance of separation.
and t h i s
These coments
The work of References (13,14) examined the nature of the unsteadiness
i n a boundary layer devel-oping i n a prescribed external velocity dis-
t r ibut ion.
more general than this , insofar as the external velocity f i e l d i t s e l f
depends on the pi tch ra te . Thus a second source of unsteady effects
is presented by the departure of t h e external velocity dis t r ibut ion,
at any given incidence, from i t s form i n steady flow.
unsteadiness are considered i n the present calculations, and one of the
objectives of the present study was t o determine t h e i r re la t ive import-
ance i n the context of flow-reversal onset.
The flow over an a i r f o i l i n pitching motion i s , however,
Both sources of
5
THEORETICAL DEVELOPMENT
A two-dimensional, t h e dependent flow i s assumed. For a l l conditions
preceding t h a t of s ta l l , the outer po ten t ia l flow i s assumed t o be
circulation preserving. The viscous flow near the a i r f o i l surface i s
assumed t o obey boundary layer assumptions u n t i l the loca l surface shear
s t ress f a l l s t o zero and the displacement thickness diverges, indicating
the approach t o separation.
i n the simplest possible unsteady flow consistent w i t h observed experi-
mental cases, it i s assumed t h a t the a i r f o i l begins a p i tch motion about
i t s quarter-chord from a steady, zero angle-of-attack i n i t i a l condition,
and pitches a t a constant r a t e u n t i l the point of flow reversal on the
upper surface moves t o the v i c in i ty of the leading edge.
In order t o ident i fy the separation dynamics
The concept of one-way coupling i s employed and, as depicted i n Figure 1,
assumes that during the motion of the a i r f o i l the boundary layer remains
suff ic ient ly t h i n t h a t the unsteady po ten t i a l flow i s unaffected by it.
This i s the usual assumption made i n a i r f o i l calculations. However it
should be noted tha t i t s va l id i ty i s improved i n unsteady flows of the
type considered here because the displacement thickness is g e n e r a l b
smaller than i n equivalent steady flows: t h i s i s t r u e near the point of
flow reversal and elsewhere. The po ten t i a l flow develops i n response
t o the a i r f o i l motion i n a c i rcu la t ion preserving manner and imposes a
pressure d is t r ibu t ion on the a i r f o i l which i s time dependent.
mathematical model appropriate t o the descr ipt ion of such a flow i s
developed i n the following sections.
throughout.
The
Incompressibility is assumed
6

The Potential Flow
Unsteady po ten t i a l flow consti tutes a l i nea r problem i n the sense tha t
the governing d i f f e r e n t i a l equation f o r any po ten t i a l flow i s l inear .
However i n the time dependent case, when it i s necessary t o determine
the instantaneous tangent ia l veloci t ies on a moving boundary the
algebraic resolution of the problem exhibi ts numerical d i f f i c u l t i e s
s imilar t o those encountered i n t h e solut ion of a non-linear differen-
t i a l equation. A method due t o Giesing(I6) is used i n the present
investigation t o determine the time-dependent pressure dis t r ibut ion, t o
be imposed on the boundary layer, due t o an a rb i t r a ry motion of the
a i r f o i l i n a two dimensional, incompressible po ten t i a l flow. The a i r -
f o i l used throughout t h i s investigation i s the NACA 0012 section. The
surface i s defined fo r numerical purposes by 65 control points, d i s t r i -
buted so as t o give optimum defini t ion of the unsteady velocity prof i les
on the surface. The motion of the a i r f o i l begins from zero angle of
attack t o a uniform stream, and pitch-up commences w i t h a constant
p i t c h r a t e cy , resu l t ing i n an angle of a t tack time his tory as shown
i n Figure 1.
modification i n a i r f o i l loading a t low angles of a t tack as w i l l be seen.
The flow i s assumed t o be circulation preserving and vo r t i c i ty i s
The discontinuity i n a t time zero causes a s l igh t
re leased i n the wake a t each time s tep of the computation such tha t
the sum of c i rculat ion about the a i r f o i l and i n the wake remains
constant, t h a t i s
Y(s)ds = 0 ,

where the sum i n t h i s case i s zero since the a i r f o i l starts from zero
angle of attack. The wake v o r t i c i t y i s released i n the neighborhood
of the t r a i l i n g edge at a l l times during the motion and the boundary
layer is assumed t o have no e f f ec t on the potent ia l flow.
si tuation i s depicted i n Figure 1.
This
The pressure a t any point i n the flow, as computed from a coordinate
(17) system fixed i n the a i r f o i l , is
where 6 a i r f o i l coordinate system and 6 a i r f o i l frame of reference r e l a t ive t o i n e r t i a l coordinates.
i s the velocity vector at a point as measured i n the
i s the velocity vector of the r
For t h e viscous flow near the a i r f o i l surface the equations Of motion
are of the form,
- where i s the rotation r a t e of the a i r f o i l , r i s the posi t ion
vector i n a i r f o i l coordinates, and
the stresses.
be
5 i s a cons t i tu t ive vector for
A t the outer edge of the viscous flow l e t t he veloci ty
Qe 9 then the equations of motion a re
DQe P [ F + 2 (il x 6, + 6 x (i x ;)I= - grad p. (4)

The two cross-product terms i n equations (3) and (4) are apparent
acceleration terms due, i n the present case, t o the pi tch r a t e of the
a i r f o i l coordinate system.
i n e r t i a l coordinates, equation (2), has terms which ju s t balance the
apparent acceleration terms i n equations (3) and (4 ) .
couple the boundary layer approximation of equation ( 3 ) , which form w i l l
be given l a t e r , t o the unsteady potent ia l flow it is desirable t o remove
the non-inertial terms.
p from equation (4), Then
The unsteady Bernoulli equation i n non-
In order t o
This i s accomplished by substi tuting fo r grad
DQ F "e D t p D t (5)
To the boundary layer approximation the r igh t hand side of t h i s
equation ( 5 ) becomes
where Ue i s the velocity tangent t o the a i r f o i l a t posit ion s as
measured i n a i r f o i l coordinates.
The cent r ipe ta l acceleration along the surface thus removed was found t o
be small for the cases considered i n the present work, being proportional
t o
It is noted tha t the resu l t , equation (5), does not remove the Coriolis
gradient.
and thus does not enter into the boundary layer momentum equation.
a 2 . However fo r higher pi tch rates t h i s e f fec t may become important.
But t h i s gradient is everywhere normal t o the a i r f o i l surface
9

Since the poten t ia l flow is unaffected by the boundary layer, it may be
computed for any number of t h e steps at each desired pi tch ra te and
the resulting velocity dis t r ibut ion may then be used as forcing flznction
f o r the boundary layer computation. The computations were made fo r
both steady flow and unsteady flow fo r purposes of evaluating cer ta in
boundary layer e f fec ts , as w i l l be discussed l a t e r . In every case the
potent ia l f l a w computation was terminated when the angle of attack
reached 25'.
t o .lo.
numerical accuracy of the unsteady wake calculation, 10 time steps
The pi tch ra te parameter &/Urn , w a s varied from zero
To evaluate the The pi tch axis was taken a t the 25% chord.
were used and then 20 steps.
loading could be detected for the highest pi tch ra te used.
method of Giesing, an incremental vortex i s released i n the wake a t
No prac t ica l difference i n a i r f o i l
By the
each step i n time.
analyzed i n the present investigation the wake roll-up i s suf f ic ien t ly
It appears tha t even fo r the most unsteady case
well represented by 10 incremental vortices.
the conclusion of Geising fo r the highly unsteady s tep-s ta r t condition.
This resu l t agrees with
(16)
Figure 2 shows a comparison of the lift coefficient versus angle of
attack resul t ing from the poten t ia l flow program fo r steady and unsteady
flow. The ef fec t of the s tep input of Q i s evident a t the lower angles
of attack, which corresponds t o short intervals of t h e a f t e r i n i t i a t i n g
the motion. Figure 3 and Figure 4 show the veloci ty and pressure
distributions respectively over the upper surface of the NACA 0012 at an
angle o f at tack of 15' for the steady and unsteady conditions.
c lear t h a t the unsteady dis t r ibut ions for
1% is
&/Urn = .06, show considerable
10

a l lev ia t ion of gradients over most of the surface. O f course these
figures only depict one instant of t h e i n comparing the steady, o r
quasi-steady, and the unsteady flows. The a l lev ia t ion of gradient i s
present t o a greater o r lesser extent throughout the pitch-up motion.
It can be expected t o contribute t o a delay i n boundary-layer flow
reversal i n addition t o the delay associated with unsteadiness i n the
boundary layer i t s e l f .
The Unsteady Boundary Layer
The or ig ina l method of Pa te l and Nash (18) f o r unsteady turbulent
boundary layers has been recently improved upon and used as a basis
for a range of computational experiments. ('31, (14), (l9) The theory
i s presented here for incorporation i n a f'ull3r unsteady-flow examina-
t i o n of the delay i n reversal point movement on a p rac t i ca l a i r fo i l .
The method is designed t o calculate the time-dependent, incompressible,
turbulent boundary layer on a two-dimensional a i r f o i l section moving
i n a po ten t ia l flow f i e ld .
t o the a i r f o i l surface: s denoting distance along the surface, y the
distance along the loca l normal, and x
The radius of curvature i s assumed t o be everywhere large compared t o
the boundary layer thickness.
s iona l unsteady flow.
formulation may be found in Reference (19).
A curvilinear coordinate system is f i t t e d
the distance along the chordline.
The method i s given here f o r two dimen-
A somewhat more general quasi-three-dimensional
The ve loc i t ies i n the s and y directions are expressed i n the form
11

U + u, V + v, where a l l components are fbnctions of t.
The components, U(s,y,t) and V(s,y,t) are defined as ensemble averages,
taken over a large number of realizations of the same basic flow, o r
successive flows w i t h the same time history and boundary conditions.
The components u and v represent the random fluctuations about U
and
zero.
s , y , and time
V, and by implication t h e i r ensemble averages are ident ical ly
The conservation of mass then takes the form
which can be immediately integrated t o give V i n quadrature form,
0
Applying the boundary layer approximation t o equation ( 5 ) fo r the
momentum balance i n the s-direction there r e su l t s
,
where the viscous shear s t r e s s has been neglected and L e turbulent
shear s t ress , T , i s the ensemble average,
- 7 = - p u v .
12
(9)

The turbulent shear s t r e s s i s assumed t o behave according t o a ra te
equation which follows from those given fo r three dimensional
flows, (20) ’ ( 2 2 ) but with the convective derivative extended t o include
the time derivative, (18)
- 312 = o . uv - a
3.Y L + - (a2 uv) + -
For most of the calculations, a1 , a , and L are assumed t o be
the same f’unctions as appear i n the ear l ie r steady and unsteady three-
(I9) ’(*’) * dimensional methods
i n Figure 5 , and a1 i s ta.ken t o be the usual constant (= 0.15). The
va l id i ty of these empirical f’unctions has never been checked d i rec t ly ,
and L a re shown by the sol id curves ’ “2
for unsteady flow, because of the lack of experimental data. In order
t o determine the sens i t iv i ty of the results t o changes of the dissipa-
t i o n length function (the most c r i t i c a l one), some calculations were
done using the dashed curve i n Figure 5. The f la t dissipation length,
over t he outer par t of the boundary layer, leads t o a more constant
d i s t r ibu t ion of turbulent k ine t ic energy. It w a s found, however, t ha t
the calculated velocity prof i les and the predicted point of flow reversal
were almost indistinguishable from the resu l t s corresponding t o the
o r ig ina l dissipation length. Uncertainties i n the empirical functions
do not, therefore, seem l ike ly t o put the present resu l t s seriously i n
question.
Since the turbulent boundary layer thickness varies rapidly lii botk;
13

space and time, the extent of the domain of numerical integration i s a
variable calculated continuously as the computation proceeds. Thus a
t rans format ion
i s introduced where f3 i s a constant greater than unity, and h i s
the height of the computation.
i n sympathy with the boundary layer thickness 6(s , t ) , approximate proportionality i s maintained between them.
h is allowed t o increase (o r decrease)
and an
This
proportionality cannot be made exact i n an expl ic i t scheme since the
value of ah/as must be assigned before a6/as i s known. h i s taken
t o be about 1.256. y/h, Primary mesh points l i e on curves of constant
and are dist r ibuted nonuniformly over the height of the domain t o
produce an increased density of points near the surface.
are distributed such tha t yi i s proportional t o (i - 1) , the
If the points
B
w i l l transform the domain into one of constant
thickness and uniform v-step.
Having made the transformation(11) and defining matrices as follows,
14

A =
a
I 2 a
22 a J the governing equations take the form
- 0 bll I
b22 I t -I
I I ~
B = I
10
where the a i j ' s , bij 's , c ' s ( i , j = 1,2) are functions of the
dependent variables.
integrated i n a three-dimensional domain ( l , s , t )
exp l i c i t , staggered-mesh, finite-difference scheme. A fourth-order
accurate difference formula is used f o r the a m :
i
The system of equation (13) i s hy-perbolic, and i s
by means of an
where the subscript i denotes the value of F ( l = qi),
i-1 1 n-1 ' 1. = - (15)
15

and n = t o t a l number of mesh points across the boundary layer.
Equation (14) cannot be used f o r
replaced by the th i rd order accurate scheme:
i = n -1 and i n t h i s case, it i s
Boundary conditions for the calculation consist o f :
i n i t i a l p rof i les of U and versus y f o r t = 0 and x,
i n i t i a l prof i les of U and versus y f o r x = 0 and a l l t ,
- uv = 0, a t y - 1.256 au auv
aY a Y - = - =
1.256 being the loca l height of the integration domain, which
varies with both x and t.
appropriate boundary conditions at
matching the numerical solution t o the Law of the Wall a t
y = 0, which are imposed by
y/6 = 0.05.
In the method of Singleton and Nash, (I9) integration of the above
equations is carried out i n the direct ion of increasing time:
of velocity and shear s t r e s s being calculated f o r a l l
successhve planes t = constant.
condition r e s t r i c t ing A t
boundary-layer thickness a t the par t icu lar time level . For calculations
of the present type, i n which the boundary-layer thickness i s very S m a l l
near the leading edge, the procedure would have l ed t o excessive machine
prof i les
x, over
This procedure r e su l t s i n a s t a b i l i t y
t o some value which depends on the minimum
16

times. Instead, the roles of time and chordwise posit ion were reversed.
The present calculations were performed w i t h the integration advancing
i n the posit ive x-direction, prof i les for a l l t
successive planes x = constant. A s before, proper consideration was
given t o the zones of dependence and influence associated w i t h the con-
vection of information i n the flow. The scheme provided f o r e i ther f i rs t -
or se cond-order accuracy i n the t h e d i r e c t ion; sample calculations
indicated l i t t l e difference i n the results obtained.
being determined over
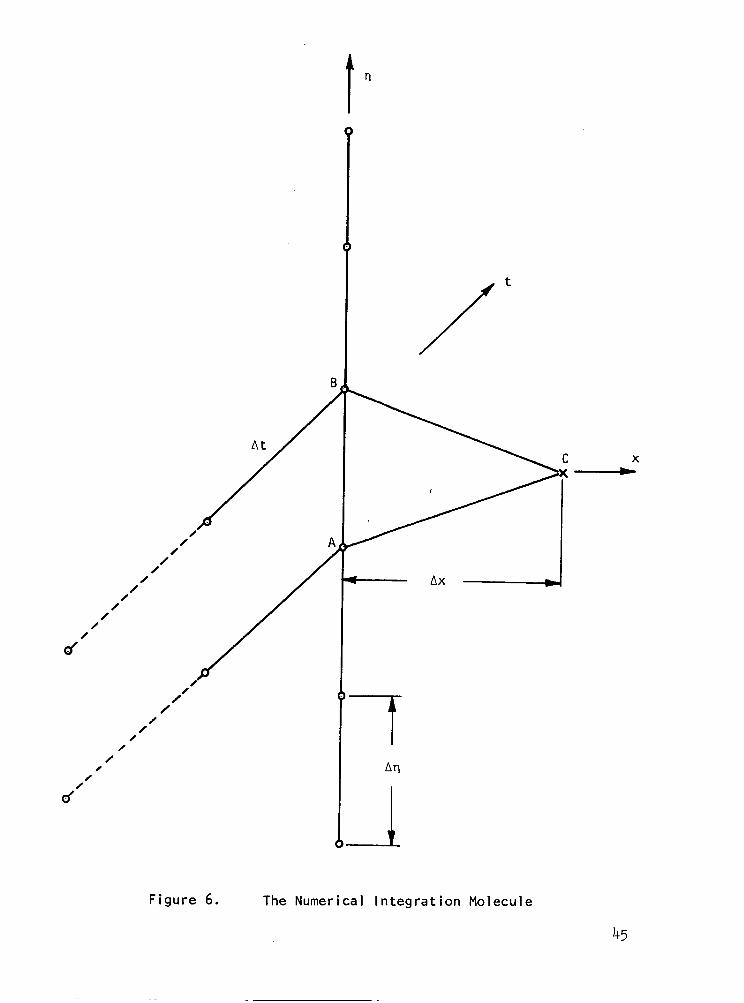
The finite-difference molecule i s shown i n Figure ( 6 ) , and the scheme
i s given by
This scheme has been shown by Nash (22) t o be both second-order accurate
and condit ionally s table .
The boundary-layer calculations covered the region of non-reversal flow
on the a i r f o i l (Figure 7). No attempt was made t o penetrate beyond the
instantaneous point of flow reversal, a t each time level , although
t h i s has been done i n more recent calculations which are continuing at the
time of writing.
l i ne ,
and which moves forward as the angle of incidence increases with time.
The present calculations were s ta r ted a t a " t ransi t ion
11 which is assumed t o coincide with the suction peak on the a i r f o i l ,

I simple quasi-steady laminar calculations were performed f o r the region
between the instantaneous stagnation l i ne and the t r ans i t i on l i n e as
defined above. It was decided t o maintain continuity of momentum
thickness across the t r ans i t i on l i ne i f the Reynolds number based on
momentum thickness, Re, exceeded 320 (assumed t o be the minimum value
for a fully-developed turbulent boundary layer) . If the value of Re
f romthe laminar calculation, was less than 320, it was decided t o impose
a s tep change i n momentum thickness t o br ing Re
minimum level.
a l l t he calculations done i n t h i s study(in fac t up t o a chord Reynolds
number of 3 x 10 ) . The i n i t i a l veloci ty and shear-stress prof i les
were then constructed, using the momentum thickness derived i n t h i s
manner, as though the boundary layer corresponded loca l ly t o steady
flow over a f la t p la te .
i n i t i a l prof i les was clear ly crude.
throughout the calculations, and fortunately the r e su l t s did not seem
unduly sensit ive t o small changes f romthe assumed conditions.
detai led treatment of the i n i t i a l conditions i s needed, although it
involves the very complex problem of unsteady t r a n s i t i o n near a high
suction peak.
before re l iable guidelines can be provided for calculations of the present
type.
up t o the prescribed
It emerged that the s tep change w a s necessary i n v i r tua l ly
6
The procedure adopted f o r generating the
It provided a measure of consistency
A more
Both experimental and theo re t i ca l work i s probably needed
18

RFSULTS AND COMl?ARJSONS WITH EXPERlMENT
The primary objective of t h i s numerical study was t o assess the effects
of time-dependence on
A s noted e a r l i e r , these e f fec ts a r i s e i n two ways: i n the potent ia l
flow about the a i r f o i l i n unsteady motion, and i n the response of the
boundary layer t o the velocity distribution imposed by the unsteady
poten t ia l flow.
e f fec t of the time-dependence and the relat ive importance of each
component.
the onset of flow reversal i n the boundary layer.
The present work attempts t o determine both the overal l
For simplicity, the time history o f t h e a i r f o i l motion was idealized by
uniform motion, at zero incidence, for t 0, followed by a constant
r a t e of pi tch, fo r t > 0. This simple s i tua t ion provides well-defined
i n i t i a l conditions at the time origin, and an unsteady flow defined by
a s ingle parameter thereaf ter .
pi tch:
The single parameter i s the ra te of
Cy , which canbe expressed non-dimensionally as a sor t of
"reduced frequency'' cG?/Um, where c i s the a i r f o i l chord and U, , the free-stream speed, although the flow i s not, of cowse, osci l la tory.
Oscil latory flow was avoided both because of the higher t h e derivatives
present and because the i n i t i a l conditions would be d i f f i c u l t t o specif'y
a t any given instant of time.
The calculation was performed i n two steps: f irst , the potential-flow
calculation, t o produce the external velocity d is t r ibu t ion (as a function
of chordwise posi t ion and time) , and then the boundary-layer calculation
using t h i s veloci ty distribution. 'me caicultztlons were done on the -.
CDC 6600 machine. Run times varied with p i tch ra te , but were on the
order of 1.5 minutes f o r each potential-flow calculation and about the
same for each boundary-layer calculation.
Analytical Results and Discussion
Potent ial-flow veloci ty d is t r ibu t ions were calculated over the upper
surface of the a i r f o i l , f o r incidences up t o 25' and for a range of
p i t ch rates:
experimental data and also covers conditions exis t ing on typ ica l ro tor
blades. With
past t he a i r f o i l a t each value of a considered.
@/Urn , from 0 t o 0.1. This range brackets the available
-+ 0 , the r e su l t s correspond t o steady po ten t i a l flow
Interfacirg between the potential-flow calculation and the boundary-
layer calculation consisted of a s e t of veloci ty dis t r ibut ions,
U (x ,a ) , together with the appropriate value of cQ'/Ua . however, t o do a steady boundary-layer calculation ( c y + 0) using the
ex terna l velocity dis t r ibut ions corresponding t o unsteady po ten t i a l flow
(a > 0) . Alternatively, an unsteady boundary-layer calculat ion could
be performed using the s e t of ex terna l veloci ty d is t r ibu t ions correspoin-
ing t o steady poten t ia l flow.
.It was possible, e
Thus four combinations of conditions existed:
1) steady po ten t i a l flow, steady boundary layer
2) steady poten t ia l flow, unsteady boundary layer
3) unsteady poten t ia l flow, steady boundary layer
4) unsteady poten t ia l flow, unsteady boundary layer .
Combination (1) represents flow at a vanishingly small r a t e of p i tch
20

( k -, 0) ; (4) represents the fully unsteady flow at some given
&/Urn . Combinations (2) and (3) represent approximations t o the t rue
s t a t e of a f f a i r s , i n which time-dependence is assumed t o be present i n
e i the r the poten t ia l flow o r the boundary layer, but not both, the
objective being t o determine the relative importance of each effect .
Calculations, covering these four combinations, were performed fo r some
I2 values of &‘/Urn, from 0 t o 0.1, and typ ica l s e t s of resul ts are
shown i n Figures 8 through 13. Each figure shows the movement of the
flow-reversal point with angle of a t tack (or w i t h time, since the two
are proportional t o one another). The reversal point i s the point where
the w a l l shear s t r e s s f irst reaches zero. The behavior i s qual i ta t ively
the same i n each case, and ca.n be divided in to three phases.
of incidence, below about 8’ , there i s l i t t l e movement of the reversal
A t low angles
point away from the t r a i l i n g edge. Then, over some fairly short range
of incidence the reversal point moves rapidly forward, and f ina l ly at
high angles of incidence the reversal point remains close t o the leading
edge, with l i t t l e f’urther movement. It has t o be recognized, of course,
t h a t if flow reversal occurs substantially ahead of the t r a i l i n g edge --
and is accompanied by gross boundary-layer thickening or separation -- then the outer po ten t ia l flow w i l l be d is tor ted and the external velocity
d is t r ibu t ion assumed i n the boundary-layer calculation w i l l not be the
correct one. Be tha t as it may, the resu l t s are probably r e a l i s t i c up
t o incidences corresponding t o some point i n the region of rapid forward
movement of reversal .
21

A t each value of cQ,/U, , i n Figures 8 through 13, the curve for filly
unsteady flow (combination (4)) l i e s t o the r ight of the one for f'ully
steady flow (combination (1)). Thus the effect of the-dependence i s
t o delay the onset of significant f l a w reversal t o higher angles of
incidence. The curves corresponding t o combinations (2), (3) l i e
between those for filly steady flow and filly unsteady flow, indicating
tha t the two components of the time-dependence each serve t o delay flow
reversal, compared with the steady case. The incremental effects are of
roughly the same magnitude, and hence it may be concluded tha t the
components of unsteadiness i n the poten t ia l flow and i n the boundary
layer, are both important. The two increments are not precisely additive,
because of non-linearities i n the flow, and it w i l l be noted tha t the
significance of the nonlinearity increases with Q, . A s Q, increases, the extent of the delay i n flow reversal becomes greater,
and t h e subsequent forward movement of the reversal point becomes pro-
gressively more rapid. A t the highest values of a/ considered, there
may be a discontinuous movement of reversal point, but the time steps
were too coarse t o judge def ini t ively. Analysis of the behavior of the
two increments of unsteadiness indicates t ha t the increase of the r a t e of
forward movement of the reversal point stems chiefly from the effect Of
time-dependence i n the boundary layer.
Except possibly a t the highest values of
the forward movement of the point of flow reversa l is progressive, and
there i s a consequent degree of a rb i t ra r iness i n any measure Of the
Onset of "significant reversal".
@/Urn considered (see above) Y
A reasonably objective Criterion of
22

signif icant flow reversal would seem t o be the movement of the reversal
point past some par t icu lar chordwise s ta t ion lying i n the steep part of
the curves i n Figures 8 through 13.
appropriate s ta t ion f o r t h i s purpose.
50% chord has been selected as an
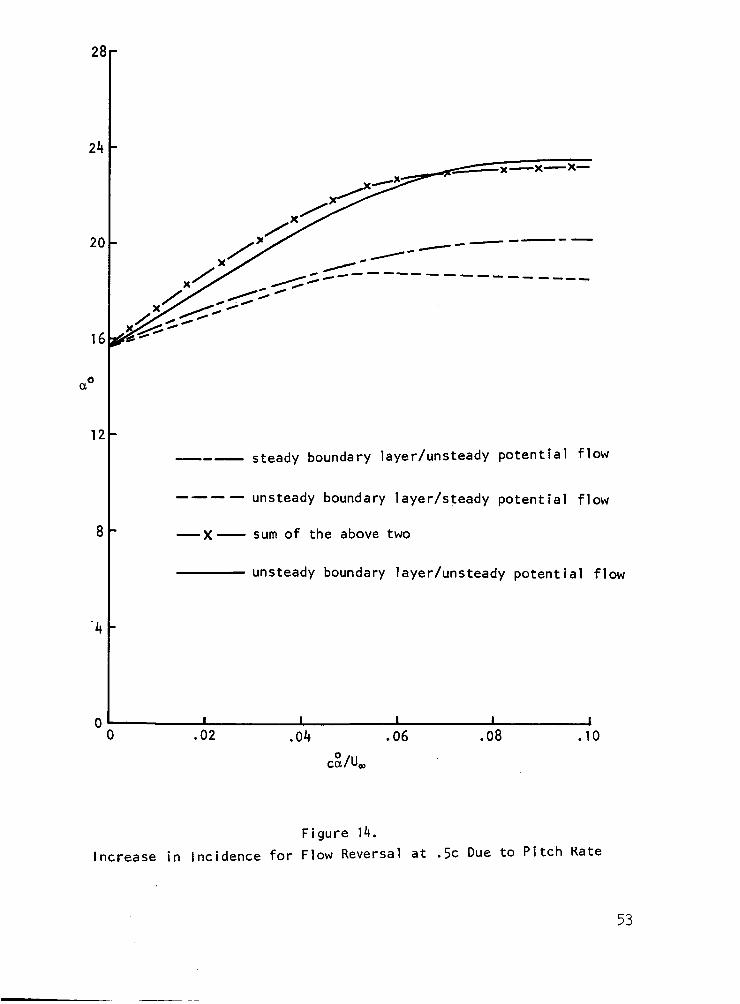
Use of a c r i te r ion of t h i s nature permits discussion, i n quantitative
terms, of the delay i n flow-reversal onset, w i t h increasing pi tch ra te ,
and Figure 14 presents the data plotted versus
tha t f o r small values of
reversal occurs, increases l inear ly with
@/Urn . It is evident
cQ'/Urn the incidence, a t which significant
cQ'/Um . For large values,
however, nonlinearit ies s e t i n and the delay i n flow reversal appears
t o f l a t t e n out t o a maximum corresponding t o an increment of about 8' of
incidence.
qual i ta t ively similar behavior, as i s shown by the dashed and the chain-
dotted curves i n Figure 14.
approximation t o the resu l t s f o r fully unsteady flow.
The two components of the e f fec t of time-dependence exhibit
The sum o f these i s seen t o be a rough
In addition t o examining the movement of the flow-reversal point w i t h
incidence, it i s instruct ive t o observe development of the boundary
layer during the approach t o incipient reversal . Figure 15 shows the
chordwise var ia t ion of wall shear stress a t the instant of time when the
a i r f o i l incidence equals 17.5'. These r e su l t s i l l u s t r a t e the delay
i n flow reversal ra ther dramatically:
Occurs a t about 0.2 chord, while i n fu l ly unsteady flow (&'/Urn = 0.06,
here) it does not occur u n t i l 0.94 chord. The assumption of pa r t i a l ly
i n steady flow (Q' = 0 ) , reversal
unsteady flow (e i the r i n the potential flow o r i n the boundary layer,
but not i n both) yieids intei.nied5.z-k pczit icrn,~ n f reversal . Figure 16
23

shows the corresponding resu l t s for displacement thickness. A t the
position of steady-flow reversal ( i n t h i s case, steady separation) the
displacement thickness exhibits singular behavior, 6
rapidly t o in f in i ty as the wall shear s t ress approaches zero.
unsteady flow, however, the displacement thickness i s everywhere smaller
than i n steady flow.
the displacement thickness increases rapidly, but not so rapidly as
occurred i n the steady flow.
Secause a U e / a t
the
* increasing
In
A s the point of unsteady flow reversal i s approached
A f a i r l y rapid increase i s t o be expected
is re la t ive ly small over the rear of the a i r f o i l (cf.
resu l t s fo r Flow D, i n Reference 1 4 ) .
Figure 17 contrasts the approach t o unsteady flow reversal i n space
( the upper figure) and i n time ( the lower figure) ; l oca l incidence i s
used here as the measure of time.
par t ic le moving over the a i r f o i l w i l l be somewhere between these two
extremes, depending on the value of
i t s position i n the boundary layer.
layer parameters i s i n i t i a l l y different from t h e i r temporal var ia t ion,
but the differences become l e s s as the reversal point i s approached.
Indeed, representative velocity prof i les (Figure 18) show essent ia l ly
the same pattern, during the l a s t stages of approach t o reversal , whether
the observer i s fixed i n space o r i n time.
The actual his tory of a f lu id
ccy/U,
The spacial var ia t ion of the boundary-
( i n t h i s case 0.06) and on
24

Comparison w i t h Experimental Results
A direct validation of the computed resul ts , presented herein, cannot be
made because of the lack of relevant experimental data. There are
v i r tua l ly no data available from which the movement of the flow-reversal
point could be deduced -- o r , indeed from w h i c h any useful boundary-layer
information could be deduced. The sets of measurements discussed below
provide unsteady force and moment data and, t o some extent, unsteady
pressure data.
t o be properly interpreted. Comparisons a re made between the calculated
onset of significant flow reversal (as defined i n the previous section)
and the occurrence of some event identified i n terms of the force, moment,
o r pressure measurements. The event selected i s not always the same i n
each experiment, as w i l l be noted l a t e r , and consequently there may be
d i f f icu l ty i n re la t ing one se t of measurements with another.
it has yet t o be established tha t any of the events selected i s associated
with the flow reversal. The intention, i n making these comparisons, needs
t o be c la r i f ied , and it i s two-fold. F i r s t , it i s of considerable
in t e re s t t o see whether the effects of time-dependence can explain the
well-behaved development of the turbulent boundary layer during the
dynamic overshoot. From experiment it i s known tha t the boundary layer
remains attached, o r appears t o remain attached, at angles of incidence
substant ia l ly higher than the s t a t i c - s t a l l angle, enabling the circula-
t i o n t o continue increasing. If it is found tha t the predicted delay
i n flow reversal i s much smaller than the observed delay i n s t a l l , a t
a given p i tch ra te , then some other explanation must be found for the
f a i lu re of the a i r f o i l t o stall . Second, it i s of interest t o see
The comparisons between theory and experiment thus have
Moreover,
25

whether the predicted delay of reversal and the observed delay of s t a l l
are of comparable magnitude. If they are, then the tentat ive conclusion
may be drawn tha t unsteady boundary-layer calculations, of the type
performed here, have some relevance t o the dynamic-stall problem, and
f'urther studies can search for a possible causative l ink between the
movement of the rear point of flow reversal and the onset of dynamic
s t a l l .
Experiments conducted by G a r e l i ~ k ' ~ ~ ) approximated a ramp-type increase
i n angle of attack from steady i n i t i a l conditions.
the a-trace of reference (23) did not. maintain a l i nea r increase due t o
aerodynamic and ine r t i a loading i n the t e s t apparatus. The c r i te r ion
used in evaluating tha t data t o determine s t a l l onset was t o determine
the angle at which the pressure a t 10% chord (of a MCA 0012 a i r f o i l )
stopped increasing. Although there i s c lear ly a re la t ion between the
angle established by t h i s cr i ter ion and the angle established i n the
present analysis f o r flow reversal at 50% chord, they are not necessar iw
equal. This is especially the case a t the lower p i tch ra tes where,
as was seen from the analyt ical resu l t s , the r a t e of forward movement
of t h e flow reversal point i s slowed r e l a t ive t o the step-like motion
at high pi tch rate . With the poten t ia l flow and wake flow given time
t o respond, large adjustments i n the pressure dis t r ibut ions may OCCUT,
w i t h leading vortex formation and bubble breakdown phenomena obscuring
possible comparison.
In some instances
Results for an osc i l la t ing a i r f o i l w i t h both a sinusoidal and a skewed
wave-form are given by Carta e t a l . (6) Again these data measure
26

primarily lift and moment t ra jec tor ies i n the a-plane. Oscillatory
data i s f a r from idea l i n evaluating separation dynamics because of
history effects , f ixed osci l la tory amplitude ( i . e . , i n successive
cycles) and, perhaps most important, because the p i tch r a t e varies
continuously throughout the motion of the a i r f o i l . Consequently for
purposes of comparison w i t h the present theory, osc i l la tory experimental
data was chosen w i t h the largest possible amplitude of motions, o r the
c r i te r ion was used tha t s t a l l occur well before reaching peak osci l la tory
amplitude.
r a t e i s changing rapidly thus the data are not sui table f o r comparison
with constant p i tch r a t e resul ts . The angle of s t a l l i s determined from
the data of reference (6) as the angle corresponding t o sudden change i n
lift curve slope on the ups t roke motion.
When the s t a l l occurs near the maximum angle, the pi tch
The Reynolds number of the Garelick data i s approximately 350,000, which
gives a s t a t i c s t a l l angle of 10' (experimental) for the NACA 0012
a i r f o i l .
chord versus
data of Garelick and Carta, references (23) and (6) are shown for
comparison. The reference (6) data i s f o r a Reynolds number of
1 x 10 , the same as tha t used for t h e theore t ica l resu l t s . Two
addi t ional experimental points are included, taken as given i n reduced
form by Ericsson and Reding, but originating i n the experimental work
of Steiner(24) for osc i l la t ing a i r fo i l s . These resu l t s were included
t o give some comparison a t intermediate pi tch ra tes , though the data
a re not very sui ted for comparison with the present theory.
Figure 19 shows the predicted angle f o r flow reversal a t 50%
@/U , reproduced from Figure 14, and the experimental
6
27

Figure 19 shows tha t as the p i tch r a t e parameter
comparison between experiment and theory improves, regardless of
ca/U increases, the
whether the experimental data r e su l t from approximately constant p i t ch
rate, skewed-oscillatory, or sinusoidal t e s t conditions.
tends t o confirm the observation from the calculated r e su l t s that the
This behavior
f l o w reversal point moves forward more rapidly w i t h increasing p i t ch
rate. Thus at high p i t ch r a t e the s t a l l i s sudden and there i s no
observable d is t inc t ion between events i n the process. It i s noted
that the Garelick data, a t a much lower Reynolds number, r i s e rapidly
at low pi tch r a t e s then slowly approach the theore t ica l curve f o r a
Reynolds number three times as large.
s t a l l delay becomes insensi t ive t o Reynolds number as unsteadiness
These comparisons indicate t h a t
increases. A s a check on t h i s observation, a short s e r i e s of computa- 6 6 t ions was made a t Reynolds numbers of .35 x 10 and 3 x 10 , using the
present theory, w i t h no other changes being made. The r e su l t s are
shown i n Figure 19 as the dashed curves.
only f o r the fill unsteady condition, that i s , unsteady boundary layer
and unsteady po ten t i a l flow.
The calculations were made
This computation c lear ly confirms the
observation t h a t Reynolds number i s of decreasing importance w i t h
increasing p i tch r a t e . The theory predicts a behavior similar t o the
experimental values of Garelick, but w i t h somewhat lower values Of
overshoot. A much more rapid increase i n delay i s apparent f o r the low
pi tch r a t e s , w i t h the curve slowly approaching t h a t f o r Reynolds number
one million a t higher p i t ch ra tes .
28

CON CLUS IONS AND E3 COMMFNDATIONS
Conclusions
Calculations have been performed of the movement of the point of rear
flow reversal on an a i r f o i l i n uniform pitching motion.
were done i n two stages. F i r s t , the unsteady poten t ia l flow was cal-
culated, yielding the velocity distribution over the a i r f o i l as a
f'unction of chordwise s t a t ion and t h e . Then, the unsteady turbulent
boundary layer was calculated using the predetermined external velocity
distribution. Fully unsteady calculations, as so defined, were per-
formed fo r a range of pi tch ra tes bracketing conditions on a helicopter
rotor i n typ ica l operations. In addition t o these filly unsteady
calculations, calculations were also performed i n which e i ther the
poten t ia l flow, o r the boundary layer, was considered t o be quasi-
steady. The objective, here, was t o determine the re la t ive importance
of time-dependence i n the outer flow and i n the boundary-layer, from
the standpoint of t h e i r e f fec ts on flow reversal.
The calculations
The r e su l t s indicate tha t a substant ia l delay i n the onset of s ign i f i -
cant flow reversal , due t o unsteadiness, OCCUTS even at moderate ra tes
of pitch. For high ra tes of pi tch, the delay appears t o reach a maximum
corresponding t o about 8' of incidence.
the turbulent boundary layer can withstand the imposed retardation,
without suffering reversal , a t angles of incidence up t o 8' higher
Thus, under dynamic conditions,
than would be possible under s t a t i c conditions. It is known tha t , fo r
flows of t h i s type, boundary-layer separation -- i n the sense of detach-
ment of the external stream from the a i r f o i l contour -- occurs l a t e r
29

than reversal. Hence, it may be concluded that the delay of separation
onset i s equivalent t o at leas t 8' of incidence, a t the highest ra tes
of pitch considered here, and may even be greater.
It was found t h a t unsteadiness i n the poten t ia l flow and unsteadiness
i n the boundary layer both contribute, i n a posit ive manner, t o the
delay o f flaw-reversal onset discussed above.
roughly equal i n magnitude although, because of the inherent non-
l i nea r i t i e s , the two ef fec ts are not precisely additive.
The two ef fec ts are
The results of the present calculations shed some l igh t on the dynamic
s t a l l problem. No suggestion i s being made here tha t dynamic s t a l l
occurs simply as the resu l t of the forward movement of the point of
rear flow reversal. The development of the leading-edge bubble, which
has not been considered i n th i s work, no doubt plays a major ro le i n
. What has the abrupt loss of c i rculat ion which takes place near CL
been shown i s t h a t the e f fec ts of the-dependence permit the turbulent
boundary layer t o remain i n a non-reversed (and non-separated)
max
condition during the so-called dynamic overshoot. Had it been
demonstrated tha t reversal , i n the turbulent boundary layer, could not
be avoided a t these angles of incidence and p i tch r a t e s , then Some
other hypothesis would have been needed t o explain how the lift
coefficient continues t o r i s e , beyond the point of s t a t i c s t a l l . This
hypothesis would have been required i n addition t o an adequate des-
cription of the mechanism of dynamic s ta l l i t s e l f ; such a description
has not yet been advanced.
The poss ib i l i ty ex is t s , of course, that the forward movement of the
rear reversal point contributes, i n some manner, t o the collapse of the
circulation around the a i r f o i l .
movement of the reversal point tr iggers the events which actually
cause the collapse of the circulation, receives considerable support
from the comparisons between theory and experiment presented herein.
It i s shown tha t there i s a surprising degree of correlation between
calculations of the onset of significant flow-reversal, and measurements
of the onset of dynamic s t a l l .
whether the correlation is fortuitous, o r whether some causative l ink
does indeed ex is t between rear flow reversal and dynamic s t a l l .
The tentative suggestion, tha t t h i s
F u r t h e r work w i l l address the question of
Re commendat ions
’ 1 The present work has drawn at tent ion t o the urgency of investigating a
number of re la ted topics i n order t o f’u1I.y exploit , apply, and extend
the technology developed herein.
1.
the turbulent boundary layer.
a fill treatment would involve the study of unsteady t rans i t ion near a
high suction peak, possibly associated w i t h a separation bubble (o r more
precisely a bubble of reversed flow); t h i s i s a formidable problem.
useful, but more limited, approach would be t o perform a sens i t iv i ty
analysis t o determine the precise effect of the uncertainty i n initiP.1
conditions: w i t h regard t o the thickness and prof i le of the turbulent
boundary layer, and also t o the location of t ransi t ion. Herein,
)/ ’ I
Attention should be given t o the question of i n i t i a l conditions fo r
A s noted i n the body of the Report,
A
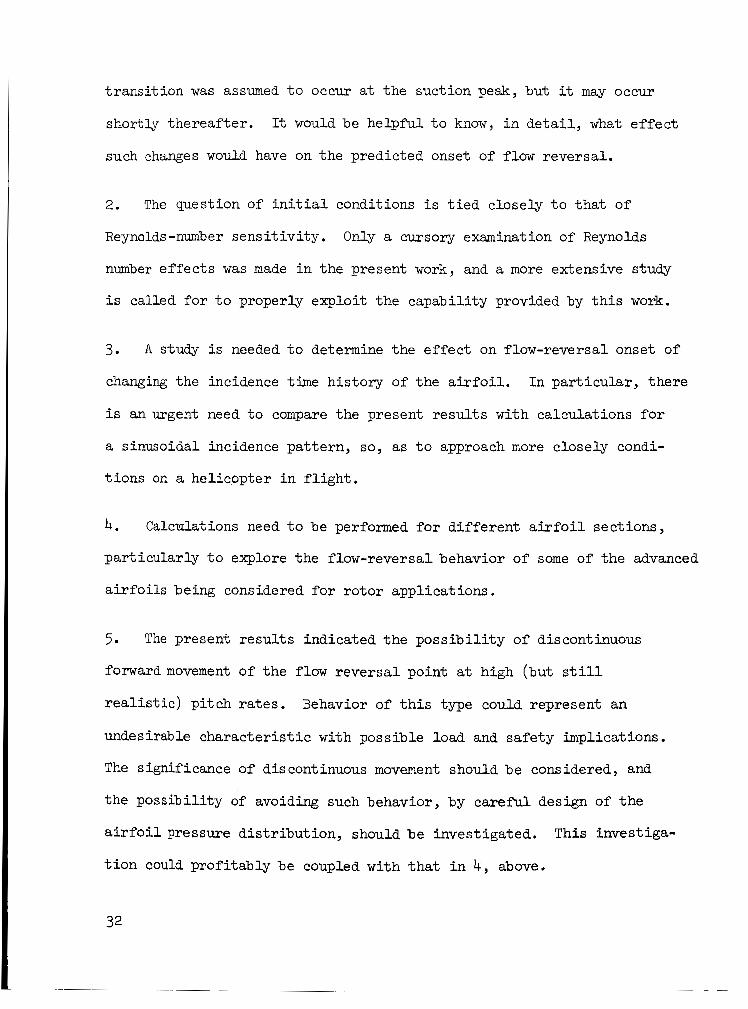
t ransi t ion was assumed t o occur a t the suction peak, but it may occur
shortly thereafter. It would be helpf'ul t o know, i n de t a i l , what e f fec t
such changes would have on the predicted onset of flow reversal.
2.
Reynolds-number sens i t iv i ty .
number e f fec ts was made i n the present work, and a more extensive study
i s called fo r t o properly exploit the capabili ty provided by t h i s work.
The question of i n i t i a l conditions i s t i e d closely t o tha t of
Only a cursory examination of Reynolds
3.
changing the incidence time history of the a i r f o i l .
i s an urgent need t o compare the present resu l t s with calculations f o r
a sinusoidal incidence pat tern, so, as t o approach more closely condi-
t ions on a helicopter i n f l i gh t .
A study i s needed t o determine the effect on flow-reversal onset of
In par t icular , there
4. Calcdations need t o be performed for different a i r f o i l sections,
particularly t o explore the flow-reversal behavior of some of the advanced
a i r fo i l s being considered fo r rotor applications.
5.
forward movement of the flow reversal point a t high (but s t i l l
r ea l i s t i c ) pi tch rates .
undesirable character is t ic with possible load and safety implications
The significance of discontinuous movement should be considered, and
the possibi l i ty of avoiding such behavior, by careful design of the
a i r f o i l pressure dis t r ibut ion, should be investigated.
t i o n could profitably be coupled w i t h t ha t i n 4 , above.
The present resu l t s indicated the poss ib i l i t y of discontinuous
Behavior of t h i s type could represent an
This investiga-
32

6.
act ion between the boundary layer and the poten t ia l f l o w .
the va l id i ty of the r e su l t s i s i n question once reversa l moves sub-
s t a n t i a l l y forward from the t r a i l i n g edge.
remove th i s l imitat ion, and develop methods fo r including the e f fec ts of
d i s tor t ion of the external flow by the boundary-layer displacement
thickness.
largely been wuccessf 'ul .
has been the lack of adequate models o f the boundary layer downstream
of the point of flow reversal.
USAAMJXDL, Ames Directorate under Contract W2-7724, has provided the
capabili ty of extending the boundary-layer calculation through the
c ruc ia l region between reversal and flow separation.
provides an e s sen t i a l t o o l for inclusion i n any method of t rea t ing the
strong interact ion problem on a physically r e a l i s t i c basis .
The present study did not include the e f f ec t s of strong inter-
Accordingly,
There is an urgent need t o
Some attempts have already been made t o do t h i s , but they have
One of the main weaknesses of these attempts
Work currently being conducted f o r
This new capabili ty
33

REFERENCES
1. J. Liiva, F. J. Davenport, L. Gray and I. C. Walton,
"Two-Dimensional Tests o f Airfoi ls Osci l la t ing Near S t a l l , Vol. 1
USAAVUB Technical Rep. No. 68-13~, Apri l 1968.
2. (Anon). , Specia l i s t s Meeting on Helicopter Rotor Loads Prediction
Methods; 36th Meeting of the Structures and Materials Panel,
A.G.A.R.D., Milan, Italy, March 1973.
3. W. J. McCroskey, "Dynamic S t a l l .of Ai r fo i l s and Helicopter Rotors,"
i n A.G.A.R.D. Rep. No. 595.
4. J. G. Hicks and J. F. Nash, "The Calculation of Three-Dimensional
Turbulent Boundary Layers on Helicopter Rotors,
May 1971.
M A CR-1845,
5. N. D. Ham, "Aerodynamic Loading on a Helicopter Blade During
Pitching Motion i n the Presence of S t a l l , " Sc.D. Thesis, Massachu-
se t t s Ins t . of Technology, January 1968.
6. F. 0. Carta, G. L. Commerford, R. G. Carlson and R. H. Blackwell,
"Investigation of A i r f o i l Dynamic S t a l l and I ts Influence on
Helicopter Control Loads," U.S.A.A.M.R.D.L. Technical Rep. NO. 72-51,
September 1972.
34

REFE1IENCES ( Cont 'd)
7. L. E. Ericsson and J. P. Reding, "Unsteady Ai r fo i l S t a l l , "
NASA CR-66787, July 1969.
8. P. C r i m i and B. L. Reeves, "A Method fo r Analyzing Dynamic S ta l l , "
A. I.A.A. 10th Aerospace Sciences Meeting, Paper No. 72-37,
January 1972.
9. F. 0. Carta, "Effect of Unsteady Pressure Gradient Reduction on
Dynamic S t a l l Delay, Engineering Note , J. Aircraf t , October 1971.
10. P. C r i m i , "Analysis of S t a l l F lu t te r of a Helicopter Rotor Blade,"
A. 1 . A .A. /A. S .M. E. /S .A. E. 14th Annual Structures, Structural
Dynamics , and Materials Conference , Paper No. 73-403, March 1973.
11. L. E. Ericsson and J. P. Reding, "Unsteady Ai r fo i l S t a l l and S t a l l
F lu t t e r , I' Fina l Technical Rep. , Contract NASI--9987, June 1971.
12. R. M. Scruggs, "An lnvestigation of Near Wake i n Ai r fo i l Dynamic
S t a l l , " G. I.T.A.E.R. Rep. No. 71-1, March 1971, Georgia Ins t i t u t e
of Technology (also published as Ph.D. Thesis).
13. R. E. Singleton, J. F. Nash, L. W. Carr and V. C. Patel ,
"Unsteady Turbulent Boundary-Layer Analysis , Coiitract XAS2-6466: 1972; NASA TM L62,242, February 1973.
F ina l Report,
35

REFERENCES (Cont 'd)
14. J. F. Nash, L. W. Carr and R. E. Singleton, "Unsteady Turbulent
Boundary Layers i n Two-Dimensional, Incompressible Flow, A. I .A.A.
6 th Fluid & Plasma Dynamics Conf., Paper No. 73-650, July 1973.
11
15. Sears, W. R. and Telionis, D. P., "Unsteady Boundary-Layer
Separation," Recent Research on Unsteady Boundary Layers
(Proc. I.U.T.A.M. Symposium, Quebec 1971), E.A. Eichelbrenner, ed. , Presses de L'universite Laval, Quebec 1972.
16. J. P. Giesing, "Non-Linear Two-Dimensional Unsteady Potent ia l Flow
with Lif ' t ," J. Aircraf't 5, No. 2 , p. 135, 1968.
1' 17. S i r Horace Lamb, Hydrodynamics,'' Cambridge University Press, 6 th
Ed., 1932.
18. V. C. Pa t e l and J. F. Nash, "Some Solutions of the Unsteady
Turbulent Boundary Layer Equations , Boundary Layers (Proc. I.U.T.A.M. Symposium, Quebec 1971) , E A .
Eichelbrenner , ed. , Presses de L'universite Laval, Quebec 1972.
Recent Research on Unsteady
19. R. E. Singleton and J. F. Nash, "A Method for Calculating Unsteady
Turbulent Boundary Layers i n Two- and Three-Dimensional Flows , Proc. AIAA Com-putational Fluid Dynamics Conference , July 1973.
I'
36

REFErCENCES ( Cont 'd)
20. J. F. Nash and V. C. Patel , "A Generalized Method f o r t he Calculation
of Three-Dimensional Turbulent Boundary Layers, '' Fluid Dynamics of
Unsteady, Three-Dimensional and Separated Flows, Proceedings of
Project SQUID Workshop, Georgia Ins t i tu te of Technology, June 1971.
21. J. F. Nash and V. C. Patel , "Three-Dimensional Turbulent Boundary
Layers, SBC Technical Books, 1972.
22. J. F. Nash, ''An Expl ic i t Scheme f o r the Calibration of Three-
Dimensional Turbulent Boundary Layers," J. Basic E%. 94D, p. 131,
March 1972.
23. Garelick, M. S., "Non-Steady Airloads on Dynamically S ta l l ing Two-
Dimensionally Wings," Thesis, Massachusetts Institute of Technology,
June 1967.
24. Steiner , R. W., "Experimental Study of the Unsteady Flow
Characterist ics of S ta l led Airfoi ls ," A i r Force Ins t i t u t e of
Technology, Report GAE 56-15, August 1956.
37

Y
ci
I X I
\ c/4
4 t
vor t i c I
Figure 1. Schematic o f the Computation Procedure

3 .
2.
c R
1 .
0
S t a t i c
- - - --- Dynamic
F i g u r e 2 . Unsteady E f f e c t on CQ, Due t o Ramp &
39

3
u/u,
2
i
steady
----- unsteady c;/U, = .06
I I I I 1 0 . 2 .4 .6 .8 1 .o
X/C
Figure 3 . P i t c h Rate Effect on Upper Surface P o t e n t i a l
Flow V e l o c i t y ’ D i s t r i b u t i o n
40
t

3 .
2.
u/um
1 .
steady
------ unsteady c d U m = .10
I I I I I .2 .4 . 6 .8 1 .o 0
0 x/c
Figure 3(b). Pitch Rate E f f e c t on Upper Surface Potential Flow Velocity Distribution
41

-6
-5.
-4.
cP
- 3 8
- 2
- 1
(
1
Steady
- -- -- Unsteady C&/U = .06
a = 150
x/c
Figure 4 . P i t c h Rate E f fec t on Upper Surface P o t e n t i a l
Flow Pressure D i s t r i b u t i o n

- 6 .
-5 .
-4 .
C P
- 3
-2 I
- 1 .
0
1 .
steady
------ unsteady C;/U co = .10
c1 = 150
I I I I I . 6 .8 '1 .o 0 . 2 .4
x/c
Figure !+(b). P i t c h Rate E f f e c t on Upper Sur face P o t e n t i a l
Flow Pressure D i s t r i b u t i o n
43

1.c
.5
0 0
7 Modified L/6
I I -7----- I I /
7
L - x 10 6
. 5 Y l 6
1.0
Figure 5. Empirical Turbulence Functions
44
0 0 ’
/ /
0 ’ d’
t Ax LJ
7 1
Figure 6. The Numerical Integration Molecule
45

// Figure 7. Schematic of the Boundary Layer Computation Procedure
46

12 -
-
8 -
-
4 -
Steady P o t e n t i a l Flow/Steady Boundary Layer
----- Steady P o t e n t i a l Flow/Unsteady Boundary Layer
_.--- Unsteady Po ten t i a l Flow/Steady Boundary Layer
- Unsteady Po ten t i a l Flow/Unsteady Boundary La
- I I 1 0. I I I I I I
0 . 2 .4 .6 .8 1 .o x/c
Figure 8, Forward Movement o f Flow Reversal Po in t
w i t h Increas ing Incidence, c&/Uoo = .005
47

24
2c
16
a'
1:
8
4
0
Steady Potent ia l Flow/Steady Boundary Layer
------ Steady Potent ia l Flow/Unsteady Boundary Layer
-.-.- Unsteady P o t e n t i a l Flow/Steady Boundary Layer
-Unsteady P o t e n t i a l Flow/Unsteady Boundary Layer
0 . 1 . 2 . 3 . 4 .5 .6 .7 .8 .9 1.0
x/c
Figure 9. Forward Movement o f Flow Reversal Po in t
w i t h Increasing Incidence, c&/Um = .02

24
20
15
ao
12
8
4
0
Steady Poten.tia1 Flow/Steady Boundary Layer
----- Steady Po ten t i a l Flow/Unsteady Boundary Layer
-.-.-.- Unsteady Poten t ia l Flow/Steady Boundary Layer - Unsteady Poten t ia l Flow/Unsteady Boundary Layer
I I I I I I I
0 .2 .4 . 6 .8 x/c
A 1 .o
F i g u r e 16. Forward Movement of Flow Reversal Po in t
w i t h Increasing Incidence, &/Urn = .04
49

Steady Po ten t i a l Flow/Steady Boundary Layer
------- Steady Po ten t i a l Flow/Unsteady Boundary Layer
------- Unsteady Po ten t i a l Flow/Steady Boundary Layer
.o---o--O Unsteady P o t e n t i a l Flow/Unsteady Boundary Layer c
24 -
-
20 -
16 -
U0
1 2 -
8 .
4
I . I I I I I I I I Y 0 . 1 . 2 - 3 .4 .5 .6 . 7 .8 *9 1.0
x/c Figure 1 1 . Forward Movement of Flow Reversal Po in t w i t h
Increas ing Incidence, &/Urn = .06

Steady Po ten t i a l Flow/Steady Boundary Layer
- - - - - Steady Po ten t i a l Flow/Unsteady Boundary Layer
-.-.- Unsteady Poten t ia l Flow/Steady Boundary Layer - Unsteady Poten t ia l Flow/Unsteady Boundary Layer
24
20
16
ao
12
8
4
0 0 . 2 .4 .6 .a 1 .o x/c
F igure 12. Forward Movement of Flow Reversal Po in t
w i t h Increas ing Incidence, c&/'U,'.28

24
20
16
a0
12
8
4
O;1
Steady P o t e n t i a l F
----- Steady P o t e n t i a l F
Unsteady P o t e n t i a l -.-.-
I I I I I I I I I I . 4 .6 .8 1 .o . 2
ow/Steady Boundary Layer
ow/Uns teady Boundary Layer
Flow/Steady Boundary Layer
Boundary
Layer
F igure 13. Forward Movement o f F l o w Reversal P o i n t
w i t h Increas ing Inc idence, c&/Um = .10
52
28
24
20
16
2
12
8
-4
0
---- /--
--- steady boundary layer/unsteady p o t e n t i a l f l ow
---- unsteady boundary layer/steady p o t e n t i a l f low
-X- sum o f the above t w o
unsteady boundary layer/unsteady p o t e n t i a l f l ow
0 .02 .04 .06 .08 .10
C:/U,
Figure 14. Increase i n Incidence f o r Flow Reversal a t .5c Due t o P i t c h Kate
53

.008
TW
.006
..004
,002
0
54
Steady Poten t a1 FlowISteady Boundary Layer
Steady Poten t a1 Flow/Unsteady Boundary Layer ------
Unsteady P o t e n t i a l Flow/Steady Boundary Layer -.-.-. - Unsteady P o t e n t i a l Flow/Unsteady Boundary Layer
x/c
F igure 15. Wall Shear S t r e s s Versus Chordwise P o s i t i o n a t a = 17 .5 and c&/Uw = .06

.05
6*
.04
. 0 3
.02
.Ol
0
Steady Po ten t i a l Flow/Steady Boundary Layer
----- Steady Po ten t i a l Flow/Unsteady Boundary Layer
---.- Unsteady Po ten t i a l Flow/Steady Boundary Layer - Unsteady Po ten t i a l Flow/Unsteady Boundary Layer
I I
I I I I I
I I
I
I I I i i i i
/ I / I
x/c
F igure 16. Displacement Thickness Versus Chordwise
P o s i t i o n a t a = 17.5 and c&/U = .06
55

.o
8 ;k
.o
.o
L 0
.04
6 9;
03
.02
.Ol
0
5.
.004
T W
.002
0 10. 20.
ao
(b) -rw and 6;: Versus x /c a t a = 17.5'
. 2 .4 .6 .8 1
,008
,006
T W
.004
,002
0 .o
F igure 17. Wall Shear S t ress and Displacement
Response for t h e F u l l y Unsteady, ch/UW = .06

.08
Y/C
.06
.04
.02
0
&'/u = .06 03
17.50 = 0.91
17.50 = 0.81
0 .2 . 4 .6 .8 1 .o 1.2
U/Um
' F i g u r e 18. Approach t o Flow Reversal :
I , velocity P r o f i l e s a t Se lec ted Chordwise S t a t i o n s and Inc idences
57

28
2 b
2c
I t
ao
1 :
. n
Theory: --- R = 3 . x l o 6
= . 3 5 i o 5
= 1 . x 106
Tes t : 0 s i n u s o i d a l , Car ta
0 ramp, Car ta
0 s i n u s o i d a l , S t e i n e r
ramp, G a r e l i c k
I I I u .04 .06 .08 .10 0 .02
0 calu,
F i g u r e 19. Comparison w i t h Exper iment
NASA-Langley, 1974 CR-2462


![Entropy Analysis for Unsteady MHD Boundary Layer Flow and ... · Jena [7] studied the numerical solution of MHD boundary layer flow with viscous dissipation. In all these studies,](https://static.fdocuments.in/doc/165x107/5f35aad796ce023095738f68/entropy-analysis-for-unsteady-mhd-boundary-layer-flow-and-jena-7-studied-the.jpg)