An Overview of Landslide Occurrence, Inventorization and ... · An Overview of Landslide...
28
An Overview of Landslide Occurrence, Inventorization and Susceptibility Mapping in South Africa Landslide Risk Assessments for Decision Making Souleymane Diop (Ph.D., Pr. Nat. Sci., MSAIEG)
Transcript of An Overview of Landslide Occurrence, Inventorization and ... · An Overview of Landslide...

An Overview of Landslide Occurrence, Inventorization and Susceptibility Mapping in South
Africa
Landslide Risk Assessments for Decision Making
Souleymane Diop (Ph.D., Pr. Nat. Sci., MSAIEG)

The author gratefully acknowledge:
• DST and DMR for funding the research project;
• My co-authors
Ms. Rebekah SINGH, Kwa-Zulu Natal Unit
Mr. Colin FORBES, Engineering Geoscience Unit
Mr. Goodman CHILIZA, Engineering Geoscience Unit for valuable contributions of help in the various aspects of this research project.
Acknowledgements

Landslide in South Africa

Landslide in Limpopo
Forestry land was removed by a huge mudslide after heavy rains , the slide mass blocked the road and swept vehicles away.
The towering quartzite cliff failure scarp above the dammed Mutale River. Past seismicity, toe undercutting and rock shear failure occurred.
Rockfall along a National road in the Waterberg Mountains east of Lephalale
Landslide in Western Cape
Debris slide in highly weathered quartzitic
sandstone near Garabouw, Western Cape. Kaaimans Pass: August 2006 Chapmans Peak Drive, June 1994

Landslide in KZN
Deeply eroded gullies threatening the infrastructure of communities living on the hillsides of Kwanoshezi, SW of Pietermaritzburg, KZN.

Landslide in Gauteng
Bruma Lake Jhb quartzite rock slope

Theoretical Background
Province Event Date Causalities
Kwa-Zulu Natal Stanger: debris flow Sept 1987 6 deaths
Western Cape Chapman's Peak Drive: rock falls
1988-2000 5 deaths
Free State Merriespruit: slimes dam failure
Feb. 1994 17 deaths
Limpopo Multiple Feb. 2000 101 deaths
To date 2,367 landslide events have been recorded in South Africa (only a small selection of landslides are illustrated and not all nine provinces are represented due to data deficiencies).
Theoretical Background
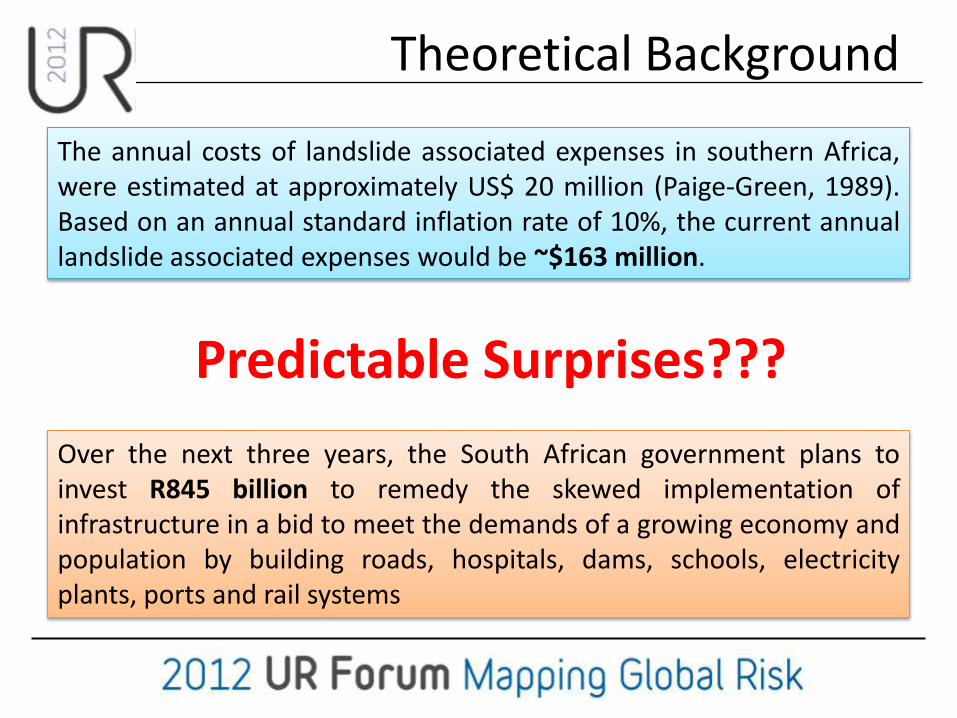
The annual costs of landslide associated expenses in southern Africa, were estimated at approximately US$ 20 million (Paige-Green, 1989). Based on an annual standard inflation rate of 10%, the current annual landslide associated expenses would be ~$163 million.
Over the next three years, the South African government plans to invest R845 billion to remedy the skewed implementation of infrastructure in a bid to meet the demands of a growing economy and population by building roads, hospitals, dams, schools, electricity plants, ports and rail systems
Predictable Surprises???

Theoretical Background
• In 2008, the Engineering Geoscience Unit of the CGS was identified as one of the World Centre of Excellence (WCoE) on Landslide Risk Reduction by an independent Panel of Experts, and approved by the IPL Global Promotion Committee, during the First World Landslide Forum in Tokyo.
• The CGS has initiated a systematic inventorization and susceptibility mapping of zones prone to slope instability for the entire country in response to the needs of local and provincial authorities for effective management strategies for reducing economic and social losses due to landslides.

Research Objectives
• This project is intended to meet the growing demands of local authorities for a reliable predictive system, warning of the likelihood of landslide occurrence.
• It is intended that through its use, a new approach to risk assessment will thus be implemented in order to assess the vulnerability of local communities to the effects of landslide hazards.

Methodology
Phase 2 - Two types of landslide susceptibility modeling techniques were used: • the bivariate statistical landslide susceptibility modeling method
(Soeters and van Westen, 1996) aided by the Analytical Hierarchy Process (AHP) (Saaty, 1980).
• the weights of evidence/logistic regression method was used to produce a comparative map of national landslide susceptibility.
Phase 1- Compilation of all the CGS landslide inventory data and literature. The landslide susceptibility modeling methodology followed the hypothesis which suggests that slope-failures in the future will be more likely to occur under those conditions which led to slope instability and failure in the past (Ermini et al, 2005).

Methodology
Phase 3 - Quality control or accuracy assessment where landslide test points independent of those landslides incorporated in the landslide susceptibility modeling exercise were compared with the landslide susceptibility maps produced.

Landslide causal factors
The following landslide influencing parameters, with the exception of
human-initiated effects, were selected for the national-scale landslide
susceptibility analyses:
1. Slope Angle
2. Relative relief
3. Rainfall
4. Geology
5. Seismicity
6. Terrain morphology
7. Dolerite contact zones
8. Lineaments
9. Human-initiated effects

Bivariate Statistical Analysis
Density graphs of each CF are plotted and categorised to facilitate the assessment of ranking values . Ranking values of 1, 2 or 3 were assigned relative to the position of each sub-class on the density graph, where a value of 3 represents areas of highest landslide susceptibility.
Individual Causal Factor (CF) maps are combined with the landslide inventory data to give weighting/ranking values per CF sub-class based on landslide densities.
𝐿𝑑𝑒𝑛 =
Number of landslides in sub −clas s𝑎𝑇𝑜𝑡𝑎𝑙 𝑎𝑟𝑒𝑎 𝑜𝑓 𝑠𝑢𝑏 −𝑐𝑙𝑎𝑠𝑠 𝑎

Results: Inventory Data
N = 2367
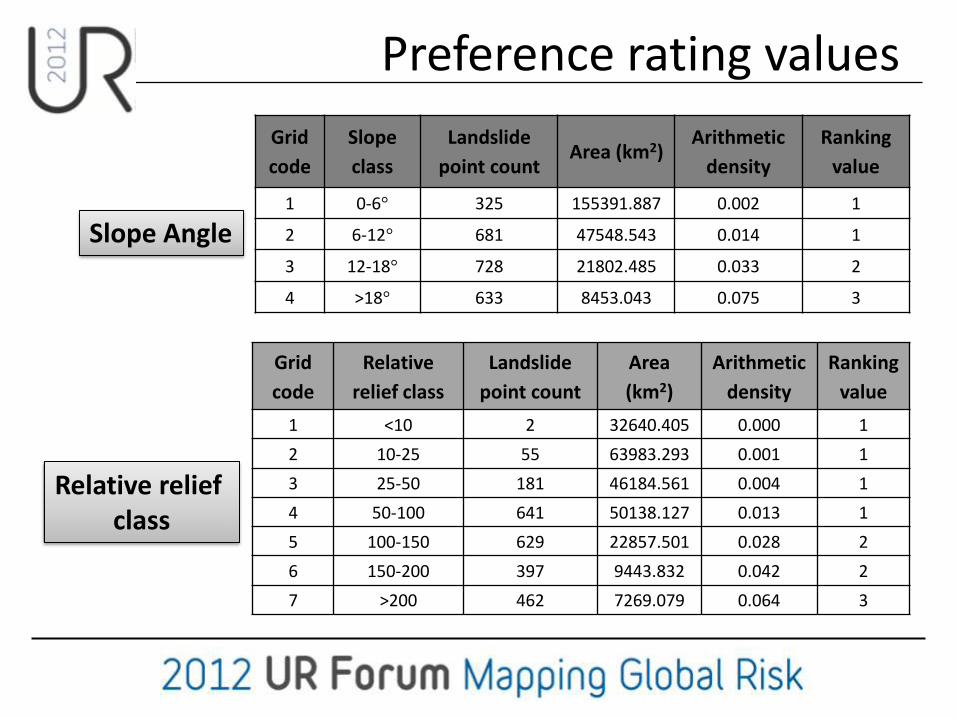
Preference rating values
Grid
code
Slope
class
Landslide
point count Area (km2)
Arithmetic
density
Ranking
value
1 0-6° 325 155391.887 0.002 1
2 6-12° 681 47548.543 0.014 1
3 12-18° 728 21802.485 0.033 2
4 >18° 633 8453.043 0.075 3
Slope Angle
Grid
code
Relative
relief class
Landslide
point count
Area
(km2)
Arithmetic
density
Ranking
value
1 <10 2 32640.405 0.000 1
2 10-25 55 63983.293 0.001 1
3 25-50 181 46184.561 0.004 1
4 50-100 641 50138.127 0.013 1
5 100-150 629 22857.501 0.028 2
6 150-200 397 9443.832 0.042 2
7 >200 462 7269.079 0.064 3
Relative relief class

Slope Angle Lithology Terrain Morphology Relative Relief Mean Annual Rainfall
Dolerite contact Zones
Seismic Hazard (PGA)
Lineament s
Lineaments
Causal Factor maps

Analytical Hierarchy Process The AHP uses the mathematical pair-wise comparison technique for deriving importance values.
Saaty’s
Preference
Rating Value
CCI*
Importance
Scale
Significance Level
(How important is A relative to B?)
9 9 Extremely more important
7 7 Very strongly more important
5 5 Strongly more important
3 3 Moderately more important
1 1 or -1 Equally important
1/3 -3 Moderately less important
1/5 -5 Strongly less important
1/7 -7 Very strongly less important
1/9 -9 Extremely less important * Canadian Conservation Institute

Analytical Hierarchy Process
In this study landslide experts were required to respond to pairwise comparison questions asking the relative importance of factor A over factor B
Number of
Decision
elements
Relationship Decision
maker 1
Decision
maker 2
Decision
maker 3 Sum Mean
Factor A Factor B 1 Slope Angle vs Relative relief 3 5 1 9 3 2 Slope Angle vs Rainfall 7 7 7 21 7 3 Slope Angle vs Geology 5 5 5 15 5 4 Slope Angle vs Seismicity 9 9 5 23 8
5 Slope Angle vs Terrain
morphology 5 5 5 15 5
6 Slope Angle vs Dolerite
contact zones 7 7 5 19 6
7 Slope Angle vs Lineaments 9 9 7 25 8

Weight values of each CF
The landslide susceptibility coefficient (M) for each pixel is calculated using the expression:
Landslide causal factors Weight
values
Slope angle (Sa) 0.3912
Relative relief (Rr) 0.2306
Rainfall (R) 0.0761
Geology (G) 0.0937
Seismicity (S) 0.0465
Terrain morphology (Tm) 0.0788
Dolerite contact zones (Dcz) 0.0571
Lineaments (L) 0.0261
Total (Sum) 1.000
M = (0. 0.3912Sa + 0.2306Rr + 0.0761R + 0.0937G + 0.0465S + 0.0788Tm+ 0.0571Dcz + 0.0261L)/1
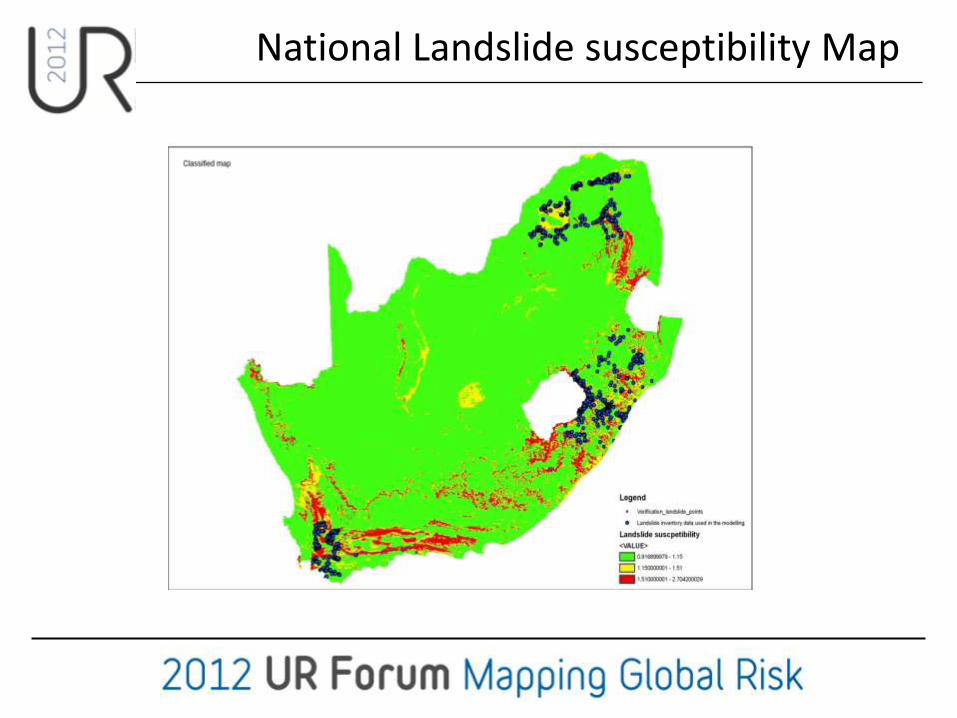
National Landslide susceptibility Map

Provincial Landslide susceptibility Map

Verification
Landslide susceptibility class Landslide verification point count Low Susceptibility 2
Moderate Susceptibility 11
High Susceptibility 52
A total of 65 verification sites in the Eastern and Western Cape provinces were mapped using Google EarthTM and utilized in quality testing of the national-scale landslide susceptibility map

Conclusions
1. Both past and recent landslide occurrences appear to have been under-reported by various authorities and the research establishment in South Africa. This does not imply an absence of features as recent, mostly unpublished work by the Council for Geoscience, reveals a large population of events.
2. Establishment of the full spatial record and their complete characterization is necessary as communities and formal urban growth expand unwittingly into areas prone to various forms of landslides. Landslides have also not as yet been fully identified and inventorized provincially or nationally in South Africa.

Conclusions
4. The landslide susceptibility maps of South Africa derived by the bivariate statistical methodology are presented as draft maps since these maps need to be comprehensively ground-truthed through an intensive fieldwork phase. There is some uncertainty inherent in the landslide susceptibility results due to the data used. The broad scales of the datasets and the mapping errors limit the accuracy of the results.
3. Work by the Council for Geoscience is still ongoing in the Eastern and Western Cape provinces, but collation of existing data and fresh landslide mapping in the North West, Mpumalanga and the Free State, has yet to commence.

Recommendations
A comprehensive questionnaire to all local, provincial and national authorities, followed by selected interviews; will facilitate a far better status quo evaluation of past present and future remediation efforts and efficacy of mitigation strategies.
A mandatory standardized format and procedure of reporting to the National Disaster Management Centre (NDMC) and in turn the Council for Geoscience; by local provincial and national authorities with control over various forms of land use (road, rail, harbour, housing, agriculture), is required.
Landslide inventorization via collection of available statistics and susceptibility mapping programs by the Council for Geoscience needs to be more adequately funded and renewed at an expanded scale to be of relevance.

Contact Details
Dr SOULEYMANE DIOP | (Ph.D., Pr. Nat. Sci., MSAIEG)
COUNCIL FOR GEOSCIENCE
ENGINEERING GEOSCIENCE UNIT
280 Pretoria Street, Silverton | Private Bag X112, Pretoria, 0001
Tel: 012 841 1168 | Cell: 071 346 1764 | Fax2Email: 086 552 9834
Email: [email protected] | Web: www.geoscience.org.za