Mickie Cioccia - Mickie C and Co. Realty Marketing Presentation
Upload
marybeth-hawkinsCategory
view
213download
0
An Introduction to Statistics
COLLECTING DATA

QUICK QUESTIONS• Travis is 2 years older than his sister Mickie. Together their ages
total 106. How old is each person?
• Mack has $300 in the bank at an annual interest rate of 3%. How much money will Mack have in the bank in four years?
• How many ways are there to make $0.75 using dimes and nickels?

QUICK QUESTIONS (CONT.)Expense Apt. A Cost ($) Apt. B Cost
($)Monthly Rent 495 515
Average Electricity Per Month
65 23
Average Gas Per Month
0 15
• Which apartment has the lower monthly rent?
• Overall, which apartment is cheaper to live in?

WHAT ARE WE LEARNING?
• Collecting Data• Analyzing Data• Using Data to Predict
Probability

DEFINITIONS
• Sampling: a convenient way to gather data
• Data: information
• Population: a group of things
• Sample: a small group that is used to represent a much larger population
WHAT IS A GOOD SAMPLE?
• Represents the larger population accurately.
• Selected at random
• Large enough to provide accurate data

EXAMPLE• One hundred people in Lafayette, Colorado,
were asked to eat a bowl of oatmeal every day for a month to see whether eating a healthy breakfast daily could help reduce cholesterol. After 30 days, 98 of those in the sample had lower cholesterol. Is this a good sample? Explain.

YOUR TURN!
• Define whether each is a good sample. Explain.– Two hundred students at a school basketball game are
surveyed to find the students’ favorite sport.– Every other person leaving a supermarket is asked to
name their favorite soap.

DEFINITIONS
• Frequency Table: a table that organizes data
• Tally Marks: indicates the frequency of events
EXAMPLE
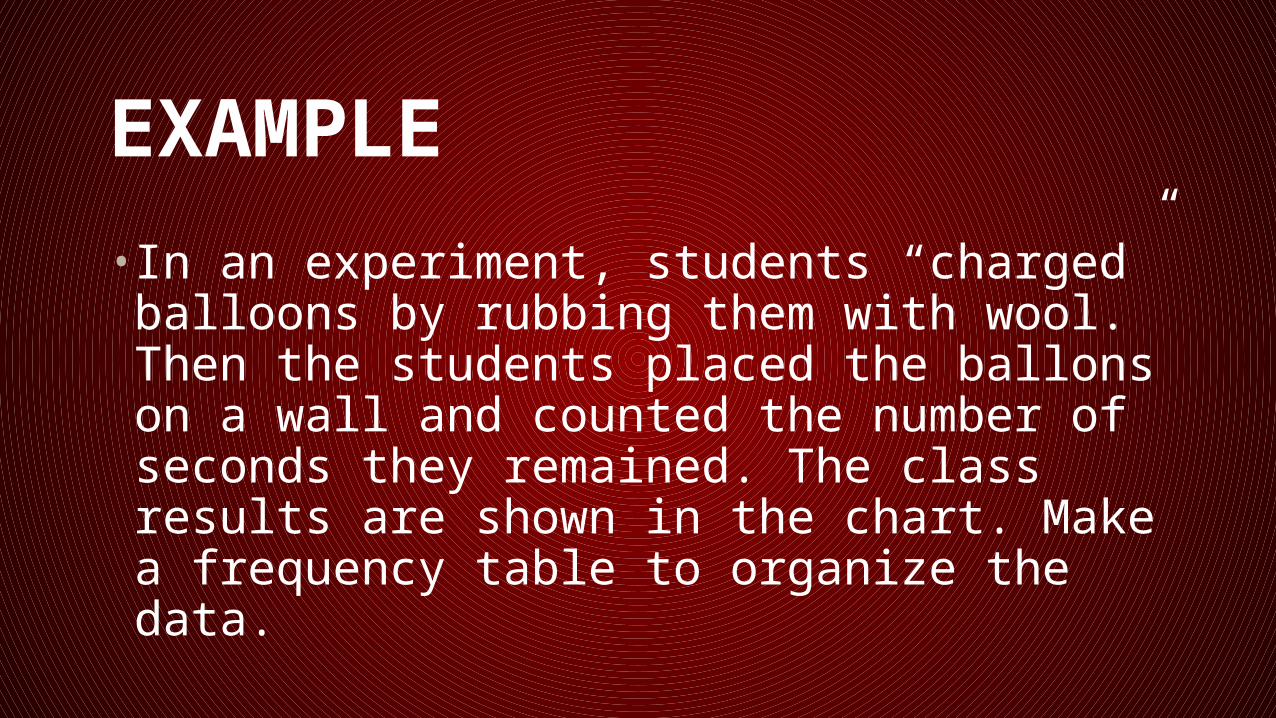
• In an experiment, students “charged” balloons by rubbing them with wool. Then the students placed the ballons on a wall and counted the number of seconds they remained. The class results are shown in the chart. Make a frequency table to organize the data.

EXAMPLE (CONT.)
15 52 26 22 2526 29 33 36 2043 21 30 39 3435 27 29 42 3516 18 21 21 40
Static Electricity Time (s)

EXAMPLE (CONT.)• Step 1: Make a table with three columns: time (s),
tally, and frequency. Add a title

EXAMPLE (CONT.)• Step 2: It is sometimes helpful to use intervals so there
are fewer categories. In this case, we are using intervals of size 10.

EXAMPLE (CONT.)• Step 3: Use tally marks in each row and record this
number in the frequency column.

EXAMPLE (CONT.)
Static ElectricityTime (s) Tally Frequency
15-24 8 825-34 9 935-44 7 745-54 1 1

YOUR TURN!• Make a frequency table to organize the data in the chart.
32 30 18 29 20 1421 32 36 15 19 1016 22 25 30 26 21
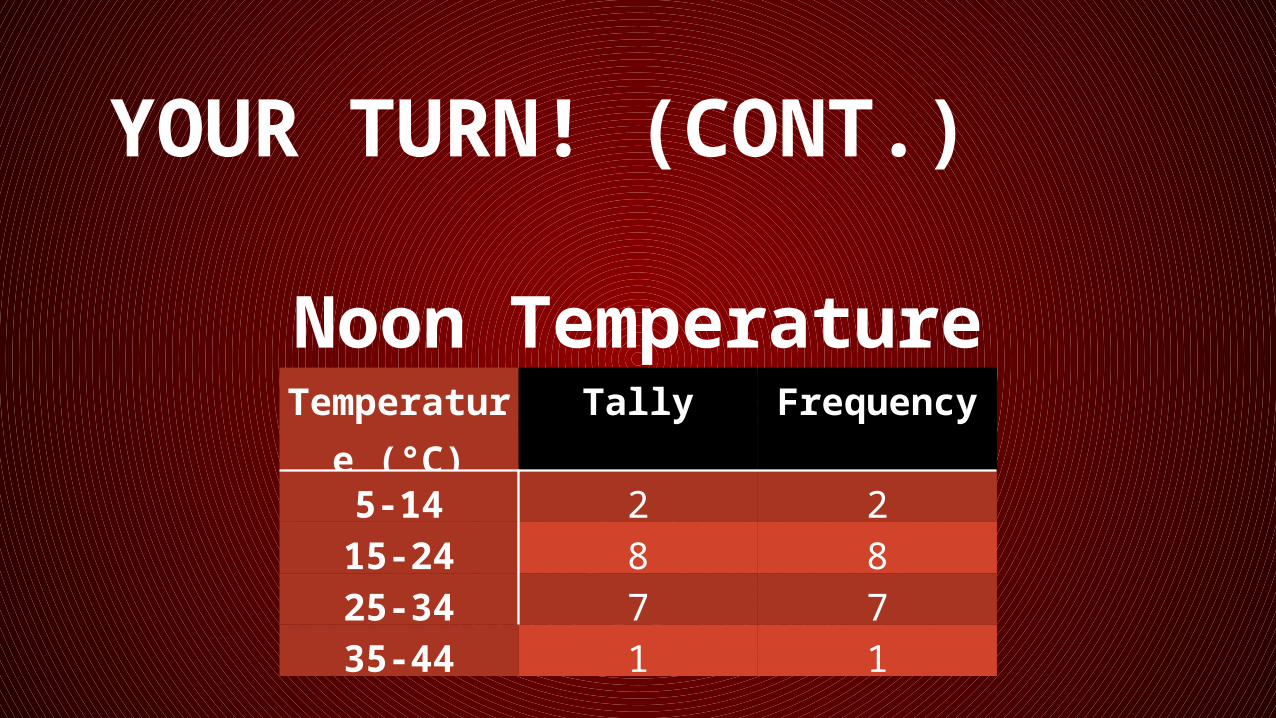
Noon Temperature
YOUR TURN! (CONT.)
Noon TemperatureTemperature
(°C)Tally Frequency
5-14 2 215-24 8 825-34 7 735-44 1 1

DEFINITIONS
• Cumulative Frequency Table: frequencies are accumulated for each item

EXAMPLE
Static ElectricityTime (s) Frequency Cumulative
Frequency15-24 8 825-34 9 1735-44 7 2445-54 1 25
• From the cumulative frequency table, we see that 24 balloons stayed on the wall for 44 seconds or less. Or, 24 balloons stayed on the wall for no more than 44 seconds

CHECK-UP!
• Explain the difference between a frequency table and a cumulative frequency table.• List some examples of how a survey might be
biased

EXAMPLE
• Owners of a restaurant are looking for a new location. They counted the number of people who passed by the proposed location one afternoon. The frequency table shows the results of their sampling.

EXAMPLE (CONT.)Age of People Tally Frequency
Under 13 7 7Teens 10 10
20s 18 1840s 36 3650s 19 1960s 11 11

EXAMPLE (CONT.)
• Which two groups of people passed by the location most frequently?• If the restaurant is an ice cream shop aimed
at teens during their lunchtimes, is this a good location for the restaurant? Explain.

CHECK-UP!• Determine whether each is a good sample.
Explain.– Four people out of 500 are randomly chosen at a
senior assembly and surveyed to find the percent of seniors who drive to school.
– Six hundred randomly chosen pea seeds are used to determine whether wrinkled seeds or round seeds are the more common type of seed.

QUIZ• Determine whether each is a good sample.
Describe what caused the bias in each poor sample. Explain.– Thirty people standing in a movie line are asked to
name their favorite actor.– Police stop every fifth car at a sobriety checkpoint.– Every other household in a neighborhood of 240
homes is surveyed to determine how many people in the area recycle.

QUIZ
1 2 51 6 26 8 42 4 55 1 34 7 22 6 4
Number of Soccer Goals ScoredThis Season

QUIZ•Refer to the chart to answer the questions.
– Make a frequency table to organize the data– What number of goals was scored most
frequently?– How many times did the team score 8 goals?– How many more times did the soccer team score
six goals than three goals?