AN EXPERIMENTAL STUDY OF LAUNCH VEHICLE PROPELLANT TANK FRAGMENTATION · AN EXPERIMENTAL STUDY OF...
24
AN EXPERIMENTAL STUDY OF LAUNCH VEHICLE PROPELLANT TANK FRAGMENTATION Erin Richardson NASA MSFC EV33 Huntsville, AL Austin Jackson, Michael Hays, Mike Bangham, James Blackwood, Troy Skinner, Ben Richman Bangham Engineering, incorporated; Jacobs ESSSA Group Huntsville, AL ABSTRACT In order to better understand launch vehicle abort environments, Bangham Engineering Inc. (BEi) built a test assembly that fails sample materials (steel and aluminum plates of various alloys and thicknesses) under quasi-realistic vehicle failure conditions. Samples are exposed to pressures similar to those expected in vehicle failure scenarios and filmed at high speed to increase understanding of complex fracture mechanics. After failure, the fragments of each test sample are collected, catalogued and reconstructed for further study. Post-test analysis shows that aluminum samples consistently produce fewer fragments than steel samples of similar thickness and at similar failure pressures. Video analysis shows that there are several failure ‘patterns’ that can be observed for all test samples based on configuration. Fragment velocities are also measured from high speed video data. Sample thickness and material are analyzed for trends in failure pressure. Testing is also done with cryogenic and non- cryogenic liquid loading on the samples. It is determined that liquid loading and cryogenic temperatures can decrease material fragmentation for sub-flight thicknesses. A method is developed for capture and collection of fragments that is greater than 97 percent effective in recovering sample mass, addressing the generation of tiny fragments. Currently, samples tested do not match actual launch vehicle propellant tank material thicknesses because of size constraints on test assembly, but test findings are used to inform the design and build of another, larger test assembly with the purpose of testing actual vehicle flight materials that include structural components such as iso-grid and friction stir welds. INTRODUCTION This work is the result of a desire to understand how fragments are produced and accelerated from catastrophic liquid Launch Vehicle (LV) failures. This capability required research and synthesis of existing LV test and accident data collected from over 50 years of spaceflight experience as well as from extensive literature search, theory review, and model development. Specifically, information about overpressure, impulse, wave speed, fragmentation characteristics (size, distance, direction, velocity, etc.), and fireball size/duration was collected. In many ways, the test and accident data were incomplete— fragmentation data were sparse or nonexistent, most fragment velocity data were averaged without fragment-specific data, blast overpressure data required corrections. All things considered, these accidents and tests did not cover all aspects required for a complete model. https://ntrs.nasa.gov/search.jsp?R=20150002633 2018-06-10T22:28:53+00:00Z
Transcript of AN EXPERIMENTAL STUDY OF LAUNCH VEHICLE PROPELLANT TANK FRAGMENTATION · AN EXPERIMENTAL STUDY OF...

AN EXPERIMENTAL STUDY OF LAUNCH VEHICLE PROPELLANT TANK FRAGMENTATION
Erin Richardson
NASA MSFC EV33
Huntsville, AL
Austin Jackson, Michael Hays, Mike Bangham, James Blackwood, Troy Skinner, Ben Richman
Bangham Engineering, incorporated; Jacobs ESSSA Group
Huntsville, AL
ABSTRACT
In order to better understand launch vehicle abort environments, Bangham Engineering Inc. (BEi) built a test assembly that fails sample materials (steel and aluminum plates of various alloys and thicknesses) under quasi-realistic vehicle failure conditions. Samples are exposed to pressures similar to those expected in vehicle failure scenarios and filmed at high speed to increase understanding of complex fracture mechanics. After failure, the fragments of each test sample are collected, catalogued and reconstructed for further study. Post-test analysis shows that aluminum samples consistently produce fewer fragments than steel samples of similar thickness and at similar failure pressures. Video analysis shows that there are several failure ‘patterns’ that can be observed for all test samples based on configuration. Fragment velocities are also measured from high speed video data. Sample thickness and material are analyzed for trends in failure pressure. Testing is also done with cryogenic and non-cryogenic liquid loading on the samples. It is determined that liquid loading and cryogenic temperatures can decrease material fragmentation for sub-flight thicknesses. A method is developed for capture and collection of fragments that is greater than 97 percent effective in recovering sample mass, addressing the generation of tiny fragments. Currently, samples tested do not match actual launch vehicle propellant tank material thicknesses because of size constraints on test assembly, but test findings are used to inform the design and build of another, larger test assembly with the purpose of testing actual vehicle flight materials that include structural components such as iso-grid and friction stir welds.
INTRODUCTION
This work is the result of a desire to understand how fragments are produced and accelerated
from catastrophic liquid Launch Vehicle (LV) failures. This capability required research and synthesis of existing LV test and accident data collected from over 50 years of spaceflight experience as well as from extensive literature search, theory review, and model development. Specifically, information about overpressure, impulse, wave speed, fragmentation characteristics (size, distance, direction, velocity, etc.), and fireball size/duration was collected. In many ways, the test and accident data were incomplete—fragmentation data were sparse or nonexistent, most fragment velocity data were averaged without fragment-specific data, blast overpressure data required corrections. All things considered, these accidents and tests did not cover all aspects required for a complete model.
https://ntrs.nasa.gov/search.jsp?R=20150002633 2018-06-10T22:28:53+00:00Z

To determine crew survivability in the event of a rocket explosion, several fragment parameters are needed: fragment count, size, weight, direction and velocity. These, along with various material properties, can be used to determine if a particular fragment will damage survival-critical hardware on the crew capsule. Historically, launch vehicle blast environments have been misrepresented in fragment models. Many models imparted velocities to fragments with high energy explosive overpressures. Research done by BEi has shown that the blast environments would be better represented by a much less energetic event [2]. This test apparatus was designed to effectively simulate this environment by way of not generating pressures in excess of 480 psig — the maximum theoretical overpressure from a LOX-LH2 explosion [3]. In addition the blast wave velocities were managed to insure they remained within the range that has been measured in launch vehicle accidents and tests.
The team evaluated numerous approaches to obtaining the data needed to characterize the fragment generation and acceleration processes and elected to approach the problem using parallel paths including computational modeling, empirical research and testing (the subject of this paper). Testing is considered crucial to the understanding of fragmentation, with the focus being on the risk to the crew and the crew safety systems. Trades were made between scale, configuration of the test samples, number of variables involved and technologies available to visualize and measure the fragment generation and acceleration process. Large-scale tests representative of launch vehicles are highly desired but the cost and complexity are prohibitive until the team can ensure that the data gained would improve the knowledge base beyond that that exists today. Small-scale tank tests were considered but the cost of producing numerous small tanks that were representative of the launch vehicle construction was considered a serious drawback due to the limited funding available. A “Cannon” approach was selected because it allowed the team to conduct numerous tests quickly and safely, simplified the collection of fragments and allowed the team to use high-speed video cameras to measure the velocities and shape of the fragments. This microscale testing was performed in order to more fully understand missing or incomplete aspects of the data. This testing was executed to identify significant differences between the way aluminum and stainless steel samples fragment. The microscale test series were a cost-effective method to provide an understanding of material properties in representative blast environments as well as define the equipment, experimental methods, and procedures needed for larger scale tests. This approach allowed the team to assess the impact of liquids on fragmentation, flash evaporation, increased ullage pressures and temperatures as well as the materials aspects. It also helped identify scaling effects and verify computational models.
The objectives of the microscale tests included: establish if small fragments are produced; determine if material selection impacted fragmentation; assess the impact of liquids and cryogenic fluids on fragment generation, examine fragment velocities and what fluids influenced the acceleration, examine post blast fragmentation (aerodynamic tearing, impact fragmentation, etc.) and demonstrate the collection of a majority of the material generated as fragments.
Microscale testing was utilized as a cost-effective path-finding mission to answer questions regarding material effects on fragmentation, effects of apparatus on test samples, environmental effects on fragmentation, validation of data acquisition systems, and development of test and safety procedures. As of this writing, over 150 microscale tests have been completed.
SINGLE-STAGE/STEADY-STATE TESTING
The single-stage testing was carried out to determine if there was a significant difference in the failure modes in Aluminum 2024-T6 and Stainless Steel 300-FH. These materials were selected as cost-effective analogues to ones utilized in LV systems. The original intent was to determine if either material failed in a substantially different manner than the other, particularly in terms of the number and speed of
the fragments produced. Worst-case failures would produce many fragments with high kinetic energy. If one material was worse than the other, then it would be possible to move to larger scale testing with only the worst-case material, thus saving time and money on future testing.
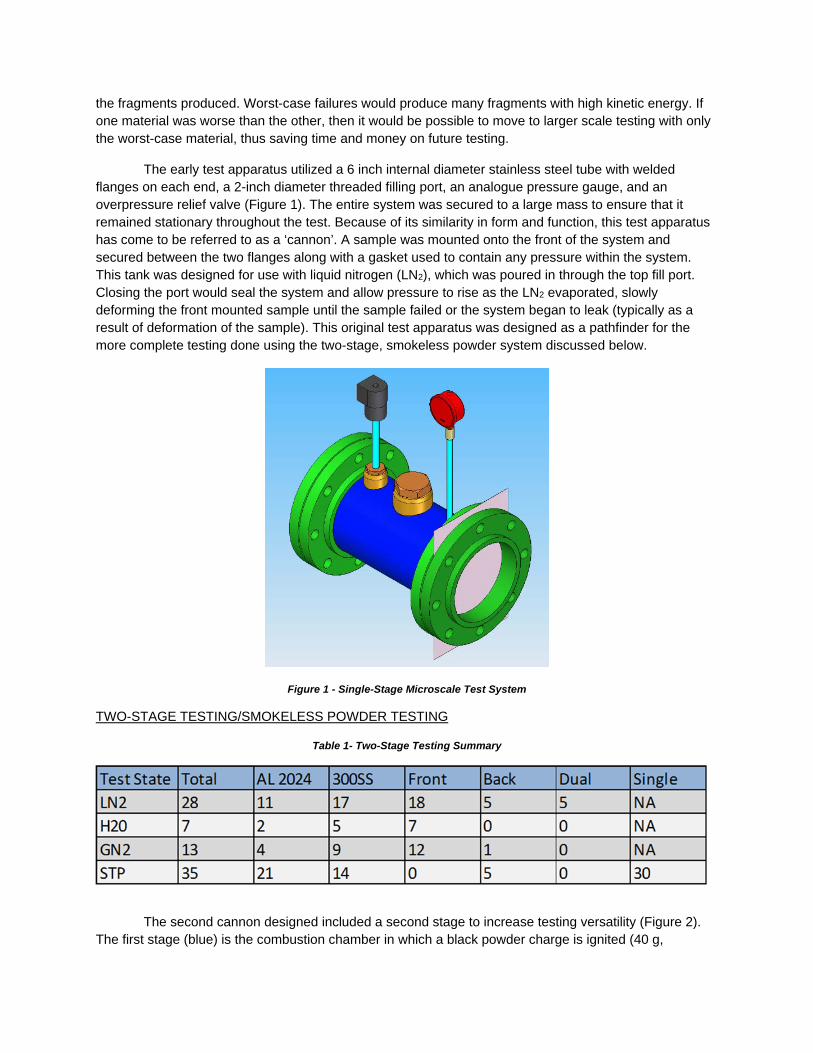
The early test apparatus utilized a 6 inch internal diameter stainless steel tube with welded flanges on each end, a 2-inch diameter threaded filling port, an analogue pressure gauge, and an overpressure relief valve (Figure 1). The entire system was secured to a large mass to ensure that it remained stationary throughout the test. Because of its similarity in form and function, this test apparatus has come to be referred to as a ‘cannon’. A sample was mounted onto the front of the system and secured between the two flanges along with a gasket used to contain any pressure within the system. This tank was designed for use with liquid nitrogen (LN2), which was poured in through the top fill port. Closing the port would seal the system and allow pressure to rise as the LN2 evaporated, slowly deforming the front mounted sample until the sample failed or the system began to leak (typically as a result of deformation of the sample). This original test apparatus was designed as a pathfinder for the more complete testing done using the two-stage, smokeless powder system discussed below.
Figure 1 - Single-Stage Microscale Test System
TWO-STAGE TESTING/SMOKELESS POWDER TESTING
Table 1- Two-Stage Testing Summary
The second cannon designed included a second stage to increase testing versatility (Figure 2). The first stage (blue) is the combustion chamber in which a black powder charge is ignited (40 g,

typically). The combustion chamber has a high-speed blast pressure transducer and a general purpose Omega pressure transducer, both of which are used to monitor the internal pressure and identify the pressure at which the samples fail. The combustion chamber and the second stage are isolated from each other using either a burst disk (AL 1100) or a sample depending on the nature of the test. The second stage (gray) can be filled with LN2, water, pressurized GN2, or left at atmospheric pressure. Finally, a sample is mounted on the end of the system and the failure mode is monitored using high-speed video (~20,000 fps). The configuration can be changed to simulate various liquids and gases within the rocket and to simulate internal and external type explosions. The table above (Table 1) briefly summarizes the amount and variety of testing done to date using smokeless powder. Results from these tests are discussed in a later section of this paper.
Figure 2 - Dual stage Microscale Test System
Smokeless powder was utilized as a pressurant in the dual-stage cannon system. It was utilized due to its cost effectiveness, stability, and rapid pressurization time. Additionally, smokeless powder is not a high explosive, so it does not produce supersonic shock waves upon ignition. A typical pressurization scheme is shown in Figure 3 below. The usual load of 40 g would pressurize the first stage of the system in 20 to 40 ms depending on the thickness of the sample or diaphragm material. The quantity of gunpowder was determined based on a series of tests designed to replicate the blast wave produced by the launch vehicle accidents. It was tuned to ensure that the upper pressure limits were not above those representative of the LV explosion (480 psia for hydrogen/oxygen) and that the blast wave when released was within the bounds seen in prior tests or accidents. The shorter times were associated with a small amount of unburned powder, which was mostly consumed after the sample was ejected. The figure also shows that a rapid depressurization was easily detected when the sample/diaphragm was compromised.
FRAGMENT COLLECTION
Attempts were made to collect 100 percent of the generated fragments from every test. This capture system was constructed with ¾-inch plywood sheets and was a 16-ft wide by 10-ft tall wall placed

approximately 6 ft away from the end of the two-stage system. The large distance between the end of the cannon and the wall allowed for a side-viewing high-speed camera to aid in the identification and tracking of fragments. The system was covered with foam to decelerate any fragments interacting with the system. This system adequately captured particles; only a minimum amount of additional impact fragmentation occurred, predominantly as a result of ground/capture structure interactions.
RESULTS AND DISCUSSION
The approach to testing was iterative in that the team would test, collect the data and analyzes
the resulting data and then repeat or modify the test to address additional variables. Each test series was planned and a Design of Experiments matrix was developed to reduce costs and to randomize the test patterns so that test biases, hardware wear or human error influence on the results were minimized. Each test configuration was repeated multiple times to provide insight as to the variability of the tests. The test sequence started with the simplest configurations and added complexity so that the testing was always done safely and in a way that allowed the team to assess the impact of changes to the configuration on the results.
BURST PRESSURE
A typical pressure curve for single stage rupture tests can be seen below (Figure 3). The burst pressure of stainless steel has a stronger dependence on sample thickness than aluminum, as can be seen in Figure 4. This was an expected result since stainless steel has a higher tensile strength than aluminum. This relationship will assist in the design of the next version of the cannon, which will be used to test flight thickness materials at flight-like pressures.
Figure 3 - Typical Dynamic Pressure Curve (DC Test 065, Al 2024 0.020")

Figure 4 - Stainless Steel vs. Aluminum Rupture Test Series—Pressure vs. Thickness (DC Tests 47-74)
FRAGMENTATION
Stainless steel test articles created more fragments and generated more tears than aluminum during rupture, flight, and after impact/capture. In most cases, aluminum samples will punch out as a single piece with very few, if any, tears and only fragment upon impact. The table below (Table 2) shows a comparison of aluminum and steel samples from tests 47 through 74 of the dual cannon series. These tests varied only the thickness of the material and material type and did not include the second stage to reduce variability and isolate only the rapid pressurization effects. The initial fragments are defined as the number of fragments counted on high-speed video as the sample is ejected from the test apparatus and during flight. The final fragments are the total number of fragments collected— in many cases the samples would impact the collection wall, ground, or lighting equipment and break up more. Note that tests 53 and 56 probably had additional impact fragments, but only 30 and 60 percent, respectively, of the total material was recovered because the fragments perforated the collection wall and were not available for collection (lost).

Table 2 - Stainless Steel and Aluminum Fragment Comparison
These tests indicated that stainless steel fragments more than aluminum when it impacts a hard surface in the collection system or instrumentation system (plywood, metal poles, etc.). The table below (Table 3) illustrates only the impact fragments associated with aluminum and stainless steel. Again, tests 53 and 56 definitely have more impact fragments, but a significant percentage of the sample was missing due to the perforation of the collection system, which allowed the fragments to travel outside the test area. Tests 48 and 51 on the aluminum sample had a strong interaction with the ground and an impact with a metal light pole used with the high-speed cameras.
Table 3 - Stainless Steel and Aluminum Impact Fragmentation Comparison
SAMPLE REMAINDER
The material remaining on the test apparatus showed significant differences between aluminum and stainless steel. The stainless steel remainders display cracking and wrinkling across all thicknesses, which are not present on the aluminum remainders. Three types of cracks were classified in the sample remainders and are shown in Figure 5 below. First, a crack into the sample area on stainless steel which
Test t (mil) rupture (psi) init frag final frag impact frag init rips Test t (mil) rupture (psi) init frag final frag impact frag init rips
49 7 248.1 1 1 0 0 47 16 259.4 1 1 0 2
55 7 212.7 1 1 0 2 52 16 192.5 1 1 0 0
60 7 287.7 1 2 1 2 57 16 237.8 1 1 0 0
64 7 155.4 1 2 1 2 61 16 202.2 1 1 0 0
50 10 373.9 1 1 0 1 48 20 301.4 1 7 6 0
54 10 278.3 2 4 2 1 51 20 292.3 1 7 6 0
59 10 392.7 3 4 1 2 65 20 190.4 1 1 0 0
62 10 531.5 3 7 4 1 66 20 #N/A 1 1 0 0
53 15 576.2 2 11 9 3 67 32 414.5 1 1 0 0
56 15 385.4 3 4 1 1 68 32 384.3 1 1 0 0
58 15 572 4 0 4 3 69 32 426.4 1 1 0 0
63 15 586.5 3 12 9 3 70 32 385.3 1 1 0 0
71 40 441 1 2 1 0
72 40 449.7 1 1 0 0
73 40 429.1 1 1 0 0
74 40 401.5 1 1 0 0
300 Series Steel Al 2024 T3
Test t (mil) impact frag Test t (mil) impact frag
49 7 0 47 16 0
55 7 0 52 16 0
60 7 0 57 16 0
64 7 1 61 16 0
50 10 0 48 20 6
54 10 2 51 20 6
59 10 1 65 20 0
62 10 4 66 20 0
53 15 9
56 15 1
58 15 0
63 15 9
300 Series Steel Al 2024 T3

is a result of cracks propagating toward the center of the sample and leaving a jagged edge. Second, a crack under the retaining flange that occurs as the failure propagates under the retaining flange and pulls this material away as it is ejected. Finally, a crack to the bolt hole that fixes the flanges and sample together. This crack is a result of the deformations of the remainder as the sample fails; significant wrinkling occurs in the region of the bolt holes as the sample deforms and tears away. All three types will sometimes occur in a stainless steel sample, as shown in Figure 5. Aluminum remainders and fragments tend to have no cracking or wrinkling. All 16 aluminum remainders from this test series experienced a clean punch-out with no wrinkling and no cracking, as shown in Figure 6.
The wrinkled stainless steel remainders are indicative of a compressive load being applied at the boundary. The differences in the wrinkling between the two materials suggest that they do not have exactly the same boundary condition. The stainless steel is significantly harder than aluminum, and this prevents the retaining flange from biting into the stainless steel as substantially as with the aluminum. The aluminum remainders have small concentric grooves transferred to the constrained area from the retaining flange; the stainless steel remainders do not exhibit these grooves. The wrinkling, lack of imprinted grooves, and cracks under the retaining flange suggest that the stainless steel may be slipping under the retaining flange. The forces on the sample deform the interior portion of the sample and start pulling the remainder through. The retaining flange fixes the deformation of the remainder through a fixed-area annulus. As more material is forced into the annulus, this area goes into compression, which forms wrinkles in the outer unconstrained areas.
Figure 5 – Three common cracks on a sample remainder (DC Test 053, 300 SS 0.015’’)

Figure 6 - Aluminum Punch-out (DC Test 066, AL 2024 0.020’’)
FRAGMENTATION MODE
The micro-scale fragmentation testing has covered a wide range of potential failure modes and test configurations in an effort to understand and quantify the differences between materials and the driving factors in increased fragmentation and kinetic energy. The test matrix for the single stage and dual stage cannons varied test states between steady-state and rapid pressurization by use of smokeless powder. Variations within those general pressurization modes included the use of liquid nitrogen, high pressure gaseous nitrogen, liquid water and air. The dual stage cannon also allowed testing to simulate the effects of an external blast on the outer shell of a LV or an internal blast that experiences liquid effects. One of the most obvious variations that can be observed when looking at the scope of the test matrix is in the mode of sample failure. The two overarching categories of sample failure are referred to as “Tearing” and “Smooth/Punch Out” failures of the sample material. Each of these general types includes several specific modes and is explained in this section. In order to distinguish the precise material failure modes for the test samples, several different reconstructed samples were examined using a scanning electron microscope at Marshall Space Flight Center. All of the failures, regardless of material or test configuration, were determined to be ductile failures due to tension. The fracture surfaces, an example of which can be seen below in , all exhibited dimpling with full rims.
Figure 7 – Dimpling indicating tensile failure on stainless (Test 061)
Note that the scope of the fragmentation testing focuses on the tank skin material, and does not address the fragmentation characteristics of structural element such as stringers. Stringers, for instance, would be expected to buckle under structural loads in the event of tank rupture and will produce much different fragments than tank skin. These various structural elements should be evaluated but currently are beyond the scope of this report. A major goal of these fragmentation tests is to lay the groundwork for testing and modeling that incorporates the interplay of structure and propellant in an accident environment.
TEARING FAILURES
This type of failure occurs when the sample material is pulled apart. In general, tearing failures in the BEi fragmentation tests occur when the sample is given a relatively lengthy pressurization time. The longer time scale allows the sample material to stretch out and eventually tear apart under the strain. Using smokeless powder in the two stage cannon rapidly pressurizes the sample and results in fewer tearing failures. Several specific tearing failure modes are outlined in the following paragraphs.
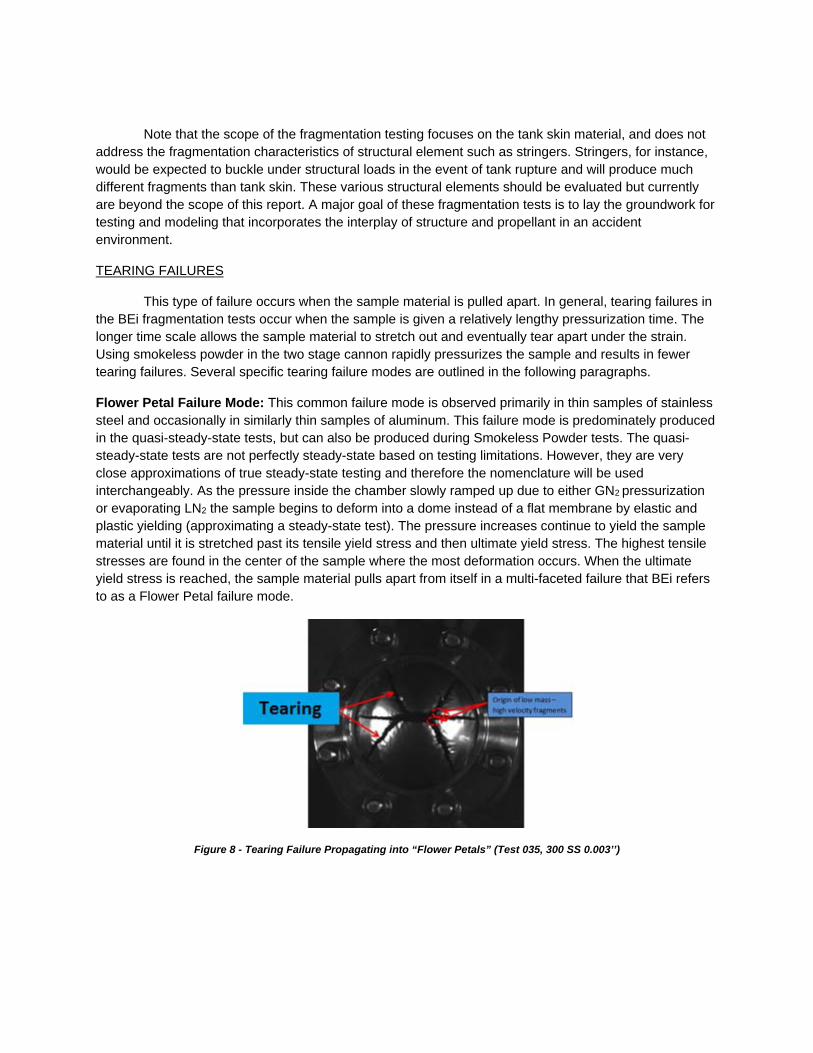
Flower Petal Failure Mode: This common failure mode is observed primarily in thin samples of stainless steel and occasionally in similarly thin samples of aluminum. This failure mode is predominately produced in the quasi-steady-state tests, but can also be produced during Smokeless Powder tests. The quasi-steady-state tests are not perfectly steady-state based on testing limitations. However, they are very close approximations of true steady-state testing and therefore the nomenclature will be used interchangeably. As the pressure inside the chamber slowly ramped up due to either GN2 pressurization or evaporating LN2 the sample begins to deform into a dome instead of a flat membrane by elastic and plastic yielding (approximating a steady-state test). The pressure increases continue to yield the sample material until it is stretched past its tensile yield stress and then ultimate yield stress. The highest tensile stresses are found in the center of the sample where the most deformation occurs. When the ultimate yield stress is reached, the sample material pulls apart from itself in a multi-faceted failure that BEi refers to as a Flower Petal failure mode.
Figure 8 - Tearing Failure Propagating into “Flower Petals” (Test 035, 300 SS 0.003’’)

Figure 9 - Flower Petals Fling Outward Radially (Test 035, 300 SS 0.003’’)
The previous two figures show the initiation and propagation of the flower petal type failure. It should be noted that the test configuration for the shown test is a single stage, GN2 test using 300 Series Stainless Steel at a sample thickness of 0.003 in. This type failure occurs during the other types of steady-state tests as well, including the LN2, H2O and hybrid configurations such as half H2O-half GN2. The different test states are similar in that they slowly pressurize the sample until it bursts. These tests are valuable in understanding fragmentation patterns in relationship to failure mode. The sample material fails initially because of the large levels of yielding. However, additional fragmentation begins to occur immediately after the initial failure. This is evidenced in the difference between the two above figures—the initial flower petals are seen undergoing further fragmentation. This tearing is due to aerodynamic loading as well as internal stresses as the initial fragments are flung outward. If the initial fragment (flower petal) has a pointed tip, the releases of the internal stresses cause the tip to break off and be accelerated away from the rest of the fragment. Further in-flight tearing may occur depending on the size of the initial fragment and exposure to high aerodynamic loading. An observed velocity trend within individual flower petals (initial fragments) is that a small mass at the tip of the flower petal tends to be ejected at a higher velocity than the rest of the fragment. Generally speaking, each subsequent fragment undergoes less acceleration than the ones closer to the center of the sample. It is hypothesized that this trend is due primarily to the release of the internal stresses of the sample. The highly stressed flower petal quickly pivots away from the center of the sample when the initial failure occurs. The acceleration due to the release of internal stresses is strongest for the material closest to the center of the sample. All fragments are accelerated due to the aerodynamic loading of the compressed gas or liquid, but internal stresses increase the acceleration of some fragments more effectively.
Barn Door Failures: This type of tearing failure is very similar to the flower petal failure mode, but it results in only two initial fragments. It is primarily seen in steady-state tests, but is also produced occasionally in Smokeless Powder tests. Flower petal failures have several initial cracks that propagate from the center to the edge of the flange. Barn door failures begin in the same way, with only one initial crack causing sample failure. The same aerodynamic loading effects and impact cause subsequent fragmentation. No definitive mechanism has been determined as to what causes samples to fail in a Barn Door mode instead of a Flower Petal mode. It is assumed to be a combination of minor material flaws and slight differences in loading. Any abnormalities in the initial deformation of the sample, such as slippage, would contribute to the creation of high stress lines. The initial failure in flower petal mode quickly branches out into multiple cracks, while the equivalent the barn door failure mode expands without branching. Ultimately, these two types of failure modes are essentially the same with the only main difference being the number and size of the initial fragments. This is not a significant difference from a kinetic energy standpoint because the initial fragments undergo multiple in-flight fragmentations that soon

erase the weight differential of fragments between the Barn Door and Flower Petal failure modes. This means that the fragmentation trends in velocity and kinetic energy do not show a distinct difference between fragments generated in Barn Door or Flower Petal failure modes.
Figure 10 - Barn Door Failure (DC Test 43, 300 SS 0.007’’)
SMOOTH/PUNCH OUT FAILURES
This type of initial sample failure occurs most often around the edge of the sample and has several variations that depend largely on the type of material. Aluminum samples show distinct differences from stainless steel samples when they both undergo Punch Out Failure. The different general modes of Punch Out Failure are explained in the following sections:
Arc failure: One of the most common types of failure mode is the ‘arc’ failure. This is when the sample fails circumferentially around the edge of the gasket and the sample is ejected as a deformed disc or dome. It is referred to as a Punch Out failure because the sample remainder often does not have much damage, like the center has simply been removed. This type of failure is seen almost exclusively in aluminum samples. However, thin samples of 0.003 in to 0.007 in thick stainless steel tend to fail similarly under equivalent testing conditions, but show differing edge characteristics. This type of failure mode occurs in both steady-state and rapid pressurization tests. For steady-state tests, this failure mode is seen more often in the thicker aluminum samples. Punch Out failure is unequivocally the expected failure mode in any test configuration for aluminum, though Barn Door and Flower Petal failure modes have occurred in some thin aluminum samples. Even in the rapid pressurization tests yielding occurs before the sample fails.
Figure 11 - Onset of Arc failure (DC Test 079, Al 2024 0.032’’)

Figure 12 - Al 2024 Arc Failure (DC Test 079, Al 2024 0.032’’)
Figure 13 - Stainless Steel Punch Out Failure (DC Test 078, 300 SS 0.010’’)
When observed macroscopically, the Punch Out failure mechanism shows a difference between stainless steel and aluminum. The above pictures illustrate this difference. A stainless steel fracture during this type of failure mode is jagged and non-uniform. An aluminum facture under an identical test configuration is consistent and smooth. Figure 12 above shows the outside edge of a relatively thick sample of aluminum (0.032 in). Notice how rounded and smooth this edge appears. Even after impact, that outside edge where the initial failure occurred is relatively smooth to the touch with almost rounded edges in some places. Any additional mid-flight or impact fragmentation produces edges that can be sharper and somewhat jagged, but always comparatively less severe than stainless steel fragments. Stainless steel, on the other hand, has much sharper edges, regardless of the failure mode. As can be seen in Figure 13, the outside edge of this 0.010 in thick sample has a highly asymmetric and jagged fracture pattern. This pattern occurs more often when thicker samples of stainless steel are tested. The thinnest stainless steels do not exhibit nearly the same level of initial tearing/folding during punch outs, but they invariably show ripples around the circumference of the sample. Examples of the pre-punch out yielding differences between stainless steel and aluminum are shown below (Figure 14 and Figure 15).

Figure 14 - Al 2024 Symmetrical Yielding Prior to Rupture (DC Test 040, Al 2024 0.020’’)
Figure 15 - Stainless Steel Non-Symmetrical Yielding/Rippling Prior to Rupture (DC Test 041, 300 SS 0.004’’)
Point Failure: This type of Punch Out failure is very similar to the Arc failure. The main difference is the origin and propagation of the initial crack. This type of failure has been observed only in stainless steel samples. Stainless steel samples tend to ripple and fold along the edge of the gasket during pressurization. Sometimes these folds cause a crack to form between the bolt hole and the edge of the gasket. Careful analysis of the front viewing high speed video shows that the initial failure of thick stainless steel samples consistently originates from a single point that is tied to that bolt-hole tear. It should be noted that, while these failures initially appear as points of light on video data (hence the failure mode nomenclature), that point of light is really the tip of a crack originating from between one of the bolt holes and the edge of the flange. This “Point Failure” then bifurcates and propagates around the circumference of the sample, resembling a Punch Out type failure but not as consistent in tearing exactly along the edge of the flange. Some stainless steel tests show two near-simultaneous point failures that combine. A combination of high speed video and examination of the sample remainder confirm that all Point Failures originate from slippage related to bolt-hole tears.

Figure 16 - Bolt Hole Tear linked to Point Failure (DC Test 063, 300 SS 0.015’’)
Figure 17 - First Frame of Point Failure (DC Test 059, 300 SS 0.010’’)
Figure 18 - Cracks propagating from point failure (DC Test 059, 300 SS 0.010’’)
The speed at which the initial point failure propagates into a full sample burst is very high. At frame rates of 10,000 fps, it is difficult to detect, but using a frame rate of 20,000 fps has been instrumental in confirming the origin of point failures. The lower frame rates somewhat mask the failure mechanism. However, using high frame rates for aluminum punch outs always reveals an arc failure that propagates along the edge of the flange. The difference in punch out failures between aluminum and stainless steel may be linked to the level of slippage between the sample and the flange before sample rupture. The stainless steel, being harder, can slip more easily. This is evidenced in the high occurrence

of tearing and folding under the flange that manifests as point failures. The slippage phenomenon was discussed previously in greater detail in the Sample Remainder subsection.
TEARING FAILURE VS. SMOOTH/PUNCH OUT FAILURE CHARACTERISTICS
This section seeks to help qualify the characteristic differences between Tearing and Smooth/Punch Out failures. The process of sample reconstruction is invaluable in determining the failure mode of the fragments. It is important to note that different edges of an individual fragment may show characteristics of Tearing failure while others show characteristics of the Punch Out failure. For example, this may occur for a single flower petal — the entire outside edge is formed in the initial Tearing failure, but the additional fragmentation that occurs mid-flight has smooth edges, like many Punch Out failures. Thus, the smaller pieces exhibit a conglomeration of failure modes depending on their location relative to the larger, original fragment. When comparing collected fragments to high speed video, it is possible to visually identify both initial and mid-flight fragmentation and match these to the reconstructed sample. The process of reconstructing all relevant samples and matching each fragment to video data provides corroboration to the fragmentation trends presented here.
TEARING FAILURE
This type of material failure is found in certain initial failure modes that lead to sample rupture. The specific modes have been discussed in length in previous sections. The jagged characteristics of Tearing failure are observed on the outside edges of the initial fragments for Barn Door and Flower Petal, and the smooth characteristics of Punch Out failures occur on the edge of arc and point failures as well as the edges of fragments that form mid-flight and upon impact. These changing failure modes are prime examples of the ways in which an individual fragment can exhibit differing failure types around its circumference. The figure below shows a reconstructed sample that failed in a Flower Petal mode. Highlighted are regions of either Tearing failure characteristics or Punch Out failure characteristics, depending on location in relation to individual flower petals.
Figure 19 - Reconstructed Sample with Flower Petals shown (Test 028, 300 SS 0.004’’)
Figure 20 - Tearing Failure Characteristics (Highlighted from Test 028)

As can be seen in the above figure, Tearing failures tend to leave a jagged and uneven edge. The high level of yielding as the material domes outward during pressurization leaves the sample considerably thinned out. The effect of pulling the sample material apart causes a noticeable roughness to occur along the failure cracks. This exceptional roughness is due to the near simultaneous creation of multiple cracks from the Tearing failure. These cracks begin to propagate through the sample, then “jump” to other cracks because of the high stress concentrations between them. This creates the checkered/jagged edge that can be seen in Figure 20 above — it is a collection of many small initial cracks that combined into the Tearing failure of the sample. This helps explain the tendency that Flower Petal and Barn Door failure modes have to produce such rough edges and rapidly branch out.
Figure 21 - Smooth Failure Characteristics (Highlighted from Test 028)
SMOOTH/PUNCH OUT FAILURE
This type of failure can be observed in initial failure, in-flight fragmentation and impact fragmentation, unlike Tearing failure which is only observed in initial fragmentation. The practical differences between Tearing and Smooth failures become even clearer when examining Figure 21 and comparing it to the Figure 20. The edge, while certainly not a straight line, is relatively smooth and unabridged by protrusions or divots. It is a very sharp edge that may engender a magnified danger to crew capsule material if it impacts edge on. Many Smooth failures can be observed on stainless steel samples. The outside edges (near the flange) of large stainless steel fragments often show multiple cracks that never propagated into additional fragments. Even if those initial cracks do not always lead to in-flight fragmentation, they contribute to the frequency of impact fragmentation as well. The stainless steel fragments tend to ball up or fold over themselves during flight or upon impact, increasing the likelihood of such cracks further propagating into additional fragments.
FRAGMENT VELOCITIES
The high speed video data provides a reasonably precise record of the observed fragments’ velocities. Once the velocities have been calculated and correlated to the appropriate fragments, a data set of observed fragment velocities with associated masses is developed. This data is the first step in the creation of empirically derived fragment velocity predictions based on test configuration and is intended to guide future work in refining fragment predictions in LV accident environments. BEi will continue to build this data set as new fragmentation information from accidents is recovered, and fragmentation testing moves forward. The current data set reveals quite a few observable trends, which will be detailed in this section. An observation of the data provided below does not show any general upward trends for velocities with respect to mass, indicating that an upper limit exists on fragment velocity produced by the test article irrespective of mass. This is likely due to consistent blast wave velocities driving the fragments. Additionally, smaller fragments tend to have lower velocity with one exception noted in the discussion of the Steady-State Gas Test State below.
TEST FAMILIES

The data seen below (Figure 22) appears cluttered by the large number of highly specific test configurations. Once this full set of data was gathered and plotted, it became clear that it was necessary to group the data sets into appropriate test configuration ‘families’. These families are determined by the general test state. Those test configuration families are detailed in the figures below.
Figure 22 - Overview of Fragment Velocities by Test Configuration
LIQUID TEST STATE
This test configuration comprises of tests that use LN2 or H2O to rupture the test samples. The single stage test configuration ruptures the sample by chamber pressurization from LN2 boiling. This is considered a quasi-steady-state test configuration. The dual stage LN2 and H2O tests partially or completely fill the second chamber with the respective liquid and then rapidly pressurize the first stage with smokeless powder. The pressure then ruptures the burst disc of Al 1100 separating the two chambers and shocks up into the test sample, bursting it. The liquid damping effects on the shockwave are considerable. The general test state shown below could actually be split into two liquid groups—the steady-state group and the rapid pressurization group. However, it is evident from the similarities between the two test types that the liquid damping effects are sufficiently dominant as to make that distinction unnecessary. Cryogenic effects on these tests are not fully known, because the liquid levels of the LN2
tests are rough estimates at best.

The average observed fragment velocity for this test configuration family is about Mach 0.4. These data can be seen below in Figure 23. The maximum and minimum velocities are roughly flat lines across the range of data. Overall, this shows that the fragments from liquid damped tests are relatively slow compared to the other test states. The spread of velocities between maximum and minimum values is evenly distributed. From 0.1 g fragments to 35 g fragments, the observed velocity range remains roughly the same. This shows that the fragments are often accelerated unequally but within predictable bounds. As this data set is expanded with scaled up testing, it can potentially grow into a compelling argument for fragment probability density fields that reflect the liquid level inside the Launch Vehicle. The consistently low average velocity of liquid damped fragments, if the trend holds when scaled in testing, may be useful in delineating the sources of high or low velocity fragments in an LV accident environment.
Figure 23 - Liquid Test State Family
STEADY-STATE GAS TEST STATE
This test state is comprised of single and dual stage cannon tests that ruptured the sample by means of pressurized GN2. This includes a series of single stage tests that were half filled with liquid water. As determined by the high speed videos, the bulk of the fragments from those hybrid tests came from the upper half of the sample, being accelerated primarily by the pressurized GN2. It should be noted that the range on the low mass fragments is very similar to that of the liquid test state, but the variability tightens up considerably as the mass increases. This indicates that the GN2 is more consistent in accelerating fragments than LN2 and H2O. This trend shown below (Figure 24) makes sense when looking at the physics involved — the liquids tend to come out as “plugs” that rapidly vaporize or dissipate, and the gaseous nitrogen comes out more uniformly. The faster expansion rate of the GN2 will also allow the fragments to be accelerated for a longer period. The observed velocities for the Steady-State Gas Family are on the upper end of the Steady-State Liquid Family range. The fragment velocities may be slightly trending upward as mass increases, but there is not a wide enough weight range to verify this. The weight range is limited because the thicknesses of the samples used in these tests were all relatively thin.

Figure 24 - Steady-State Gas Test Family
RAPID PRESSURIZATION/SHOCKWAVE TEST FAMILY (GAS)
This test configuration is marked by the use of smokeless powder to simulate the effects of a blast wave in an LV accident. The test samples are burst in a rate-dependent manner that shows clear fragmentation differences from the steady-state test series. Both aluminum and stainless steel samples undergo a short period of very rapid pressurization and deformation before failing. The aluminum samples tend to punch out cleanly while the stainless steel samples often rip, tear and fold before bursting. The observed fragment velocities (Figure 25) are much higher than those of the steady state test series. These tests also use thicker samples of both aluminum and stainless steel, so the overall range of mass is considerably larger. The blue and red triangles are from tests that used the Bull’s Eye Smokeless Black Powder, while the dark grey triangles used a slower burning black powder (non-smokeless). The overall fragment velocities for the black powder tests are lower than the smokeless powder tests. The slower burn rate made pressurization slower, and allowed the samples to yield more before rupture. Two gaskets were used in those tests as well, and increased the amount of leakage prior to sample rupture. The black powder tests are more approximate to the quasi-steady-state configuration because of these factors, as is evidenced by the low maximum velocities compared to equivalent smokeless powder tests. Both the Single Stage Smokeless and Dual Stage Smokeless test configurations are considered to be more representative and experimentally controlled than the path finding efforts of the Single Stage Black Powder test configuration.

Figure 25 - Rapid Pressurization Test Family
One of the most compelling trends in the rapid pressurization test configuration family is the consistent production of Mach 0.9 to 1.5 fragments over a wide range of fragment masses. This includes both aluminum and stainless steel fragments. Once the fragment mass reaches around 25 grams, the average velocity is about Mach 1.2 with limited variability of ± Mach 0.3. This is an important discovery because it means that the cannon test apparatus is able to reliably reproduce fragments of certain masses and velocities. This has direct and significant application to impact testing. A sample of crew capsule components such as a heat shield or inter-stage material can be mounted in front of the cannon and hit with one of the stainless steel or aluminum fragments. The cannon consistently produces fragments that are in the velocity range of fragments produced during LV accidents [1] [4], making this type of testing appropriate for fragment impact testing of crew capsules and other sensitive hardware. This is also an excellent way to distinguish which material produces fragments that are the most dangerous. If it can be shown by impact testing that either stainless steel or aluminum fragments of comparable size and velocity do more damage, then modeling efforts can be better focused on the true worst case scenario without expending unnecessary testing funds. It is also hoped that such work could impact LV design to account for the relative risk levels from fragmentation, maximizing survivability without excessively conservative designs.
The overall plot of the three test configuration families (Figure 26) helps clarify the distinctions and trends for each test family, and is shown on the following page. Both steady-state test configuration families have a fragment velocity average that is roughly half that of the shock tests (black and smokeless powder initiated). The rapid pressurization family includes a distinct difference between low mass and high mass fragments.

Figure 26 - Fragment Velocity Trends by Test Configuration Families

SUMMARY AND CONCLUSION
In order to better understand Launch Vehicle failure environments, a micro-scale test series was designed to mimic the failure of vehicle-similar materials under vehicle-similar conditions. A test cannon was built that allowed for the explosive failure of thin metal sheets and the capture, documentation and study of near 100 percent of the resulting fragments. Many different configurations were tested, including both steady-state and rapid pressurization failures, cryogenic loading, liquid loading and multiple pressurants. It was found that stainless steel burst pressure was more heavily dependent on plate thickness than was aluminum. This relationship, while expected, will be useful going forward in efforts to design and test thicker materials. Also, stainless steel generally produced more initial fragments and experienced more aerodynamic tearing and impact fracture. The material left on the test apparatus after each test also indicated differences in the failure of aluminum and steel, but this could be due to slightly different boundary conditions for each material. Again, this relationship will be useful going forward with future test work. High speed video analysis showed multiple different ‘failure modes’ for varying test configurations. Aluminum overwhelmingly tended to fail as a ‘punch out’ while steel samples exhibited several different failure modes. It was also shown that individual fragments had characteristics (called here “Smooth” and “Tearing”) that might give hint to their genesis.
The presence of liquids damped the generation of fragments with fewer fragments being produced when liquids are in contact with the test samples. This provides some insight into the generation of fragments as the propellant tanks empty during the flight and may help guide estimates of the fragment population density as function of propellant mass or level.
Fragment velocities were recorded and it was determined that the various test configurations (liquid loading, steady state gas loading, and rapid pressurization) tending to create ‘families’ or clusters of velocities when compared to one another. As one might expect, the rapid pressurization failures tended to produce fragments with greater velocities than either of the steady-state loading failure configurations.
Fragment velocities match those observed in LV accidents for a range of masses that can be produced by the cannon. While final conclusions on the accelerating mechanisms for fragments remains open, there are trends being observed here that are being used to guide future work. Gas/ullage clearly accelerates the fragments more effectively than the liquids tested. Flash evaporation does not appear to be a significant contributor to accelerating the fragments but additional computational and test work is planned to examine this in more detail.
The parallel computational efforts will be documented in separate publications but is being used to guide the testing and the new cannon configuration. Some testing has been conducted to support the computational requirements including the introduction of known flaws in the samples and the use of visualization tools to determine the stress and strain in the sample prior to failure during the pressurization phase of a test.
FUTURE WORK
As indicated before, none of the testing done to date has occurred using actual launch vehicle propellant tank materials. All of the data collected has displayed many useful trends, discussed above, and these trends have been taken into consideration in the design of a new test apparatus. The new test apparatus is large enough to accommodate flight-thickness materials without exceeding expected failure

environments. It can also accommodate actual flight materials with structural components like iso-grid and friction stir welds.
REFERENCES
1. Baker, W. E., Parr, V. B., Bessey, R. L., Cox, P. A., “Assembly and Analysis of Fragmentation
Data for Liquid Propellants Vessels,” NASA CR-134538, January 1974
2. Bangham, M. et al "Final report of NESC Assessment of Blast Environments developed by Bangham Engineering", unreleased, May, 2011
3. Edwards, D.H., Williams, G.T., and Breeze, J.C., "Pressure and Velocity Measurements on Detonation Waves in Hydrogen-oxygen mixtures"; Journal of Fluid Mechanics, 6, pp. 497 – 517, 1959
4. Jeffers, S. L., “Fragment Velocity Measurements from Three Project PYRO Experiments” Aerospace Nuclear Safety Department 9510, Sandia Laboratories, SC-DR-69-329, June 1969