An Evaluation of Incentive Regulation: Corrections and ...
14
An Evaluation of Incentive Regulation: Corrections and Extensions by SANFORD V. BERG University of Florida Department of Economics, Gainesville, FL 32611 JINOOK JEONG Emory University Department of Economics, Atlanta, GA 30322 August 26, 1993 (Revised) Abstract This note re-estbnates our model of the detenninants and impacts of cost component incentive regulation using an improved data set which avoids double-counting finn obse11Jations. It also tests alternative specifications of the relationships. While cost component incentive regulation improves engineering efficiency (heat rates), it does not improve economic efficiency. Thus, our earlier findings are not altered by the slnaller data set or by model respecification. 1. Introduction The Energy Policy Act of 1992 requires that states consider new PURPA standards related to integrated resource planning--for the promotion of efficiency. The new PURPA standards [Sec. 11(d)(9)] mandate that commissions consider the efficiency impacts of incentives associated with existing rate-making procedures. Consequently, it is important that policy-makers be aware of the empirical tests of past state incentive plans. Our earlier analysis (Berg-Jeong 1991, 45-55) of the causes and effects of cost component incentive regulation contained data problems. 1 Some double Ipaul J oskow pointed out problems with the original data set; rather than publishing a comment, he encouraged us to re-estimate the model. Dana Aberwald assisted in eliminating holding companies from the final sample. In addition, Bill Taylor and David Sappington provided helpful comments on model specification and interpretation. This note attempts to address their concerns and presents some new results. Each co-author blames the other for any remaining deficiencies.
Transcript of An Evaluation of Incentive Regulation: Corrections and ...

An Evaluation of Incentive Regulation:Corrections and Extensions
by
SANFORD V. BERGUniversity of Florida
Department of Economics, Gainesville, FL 32611
JINOOK JEONGEmory University
Department of Economics, Atlanta, GA 30322
August 26, 1993(Revised)
Abstract
This note re-estbnates our model ofthe detenninants and impacts ofcost component incentive regulationusing an improved data set which avoids double-counting finn obse11Jations. It also tests alternativespecifications of the relationships. While cost component incentive regulation improves engineeringefficiency (heat rates), it does not improve economic efficiency. Thus, our earlier findings are not alteredby the slnaller data set or by model respecification.
1. Introduction
The Energy Policy Act of 1992 requires that states consider new PURPA standards related
to integrated resource planning--for the promotion of efficiency. The new PURPA standards [Sec.
11(d)(9)] mandate that commissions consider the efficiency impacts of incentives associated with
existing rate-making procedures. Consequently, it is important that policy-makers be aware of the
empirical tests of past state incentive plans. Our earlier analysis (Berg-Jeong 1991, 45-55) of the
causes and effects of cost component incentive regulation contained data problems.1 Some double
Ipaul Joskow pointed out problems with the original data set; rather than publishing a comment, heencouraged us to re-estimate the model. Dana Aberwald assisted in eliminating holding companies from thefinal sample. In addition, Bill Taylor and David Sappington provided helpful comments on model specificationand interpretation. This note attempts to address their concerns and presents some new results. Each co-authorblames the other for any remaining deficiencies.

-2-
counting occurred because holding companies and the operating companies were both included in
the sample. Although our earlier conclusions are unaffected by re-estimation, the relative importance
of some factors is altered. Going beyond our earlier analysis, we also test whether cost component
incentives at least improve heat rates--which are targeted by some of the incentive plans. These new
results are reported in the concluding section. Furthermore, we take this opportunity to clarify the
construction of the data base used for estimating the simultaneous model. We conclude that cost
component incentive regulation did not reduce overall costs (as measured by managerial slack). To
facilitate comparisons with the 1991 analysis, an identical equation numbering scheme is utilized here.
2. Results for Operating Companies
To obtain a proxy for managerial slack, we estimated a cost function
where
C·•
GEN.•
= log operating cost of the firm
= log total generation
RESCAPi = reserve capacity of firm i
HYRi = log % electricity produced by hydroelectric
NUCRi = log % electricity produced by nuclear plants
YEARi = time variable (year), 1973-1985
The original and the new results for the cost function are shown in table 1. The coefficients of the
generation variables change slightly, but they generally remain significant. Changes for HYR and
NUCR occur, but overall explanatory power of the cost equation is basically unchanged.
The managerial slack variable (S) was defined asC. - C~
S· ==. •• Qt
(1)

Table 1
Estimated Cost Function: Equation (4)
Variables Original WithoutResults Holding Co.
Constant 17.22 5.59(5.85)** (1.12)
GEN -5.59 -3.69(-5.35)* * (-2.01)*
GEN2 0.68 0.45(5.58)** (2.02)*
GEN3 -0.02 -0.02(-5.19)** (-1.75)
RESCAP 0.41 0.07(1.80) (0.21)
LOADF 0.32 0.38(1.26) (0.71)
HYR 0.009 0.05(0.938) (2.70)**
NUCR -0.02 0.02(-4.80)** (0.60)
YEAR 0.09 0.09(19.86)** (14.99)**
IAdj. R2
I0.81
I0.78
IN 490 296
* 5% significance level** 1% significance level

-3-
where C: is the predicted value of log operating cost. A Probit MLE model was estimated:
(2)
where I-I
MAR.I
= 1 when firm i is under incentive regulation
= managerial slack of firm i (based on 3 years)
= heat rate of firm i
= (Total Revenue - Total Cost)rrotal Cost = firm i's margin
LOADFi = Total Generation/(System Capacity * 8760) = load factor firm i
= log of total generation of firm i
As noted in Berg-Jeong (1991, 51), Si is endogenous because the onset of incentive regulation (IR)
might reduce managerial slack. Thus, for firms subject to IR, observations are used only for the three
years prior to adoption. Observations for firms not subjected to IR are deleted after 1980 since IR
is expected to lower industry average cost--resulting in higher measured managerial slack.
The re-estimated coefficients for the determinants of IR are shown in table 2, along with the
earlier results. We also present the marginal effects--changes in the probability of adoption due to
a one unit change in the independent variable. Slack remains a significant determinant of cost
component IR, but the size of its impact is less than one-tenth of that found earlier. Since the
average slack is lower with the improved data set, the implied elasticity (calculated at mean values)
does not drop by a factor of ten. In the original results, a one percent increase in slack increased the
probability of IR by .17 percent. Without holding companies, the comparable number is .08 percent.
On the other hand, the impact of margin more than doubles--in terms of the marginal impact
and elasticity. As (revenue-cost)/cost rises by one percent, the probability of IR is increased by 1.55
percent. We interpret this as evidence that high prices (relative to average total cost) can also trigger
cost component IR since such mechanisms provide a way for sharing cost savings. To continue
obtaining such margins, firms will be expected to meet firm-specific targets. The regulatory rationale

Table 2
Adoption of Incentive Regulation: Equation (5)
Variables Coefficients Marginal Effects
Original Without Original WithoutResults Holding Co. Results Holding Co.
Constant -2.84 -3.21 -0.78 -1.08(-1.14) (-0.86)
Slack 277.10 18.49 75.76 6.23(2.42)* (3.96)**
Heat Rate -0.14 -0.22 -0.04 -0.08(-1.11) (-1.41)
Margin 1.14 2.72 0.31 .92(2.85)* * (3.70)**
Load Factor 9.39 14.82 2.57 4.99(3.52)** (3.61)**
GEN -0.27 -0.55 -0.07 -0.19(-1.72) (-2.24)*
Prediction Rate 0.73 0.76 NA NA
N 156 90 156 90
* 5% significance level** 1% significance level
-4-
may be that such performance legitimizes the relatively higher margins. Thus, firms may not only
accede to such regulations, but promote them as justifying relatively high returns.
We had hypothesized that a large electricity utility (captured by GEN) would be highly visible
politically; such firms also offered the potential for larger overall cost savings for a given percentage
cost reduction. However, the re-estimated coefficient for GEN was negative and significant at the
10% level (whereas, previously it had also been negative, but was not significant at the 10% level).
Thus, size appears to be an important negative factor--suggesting that regulators tend to apply cost
component IR to smaller utilities. We do not have an explanation for this result.
Since the correct prediction rate increases from 73% to 76% when the parent (holding)
companies are excluded from the sample, the data correction leads to a slightly sharper ability to
identify firms which are likely to have cost component regulation imposed on them.
3. Effectiveness of Cost Component Incentive Regulations Re-examined
A simultaneous equations model was used to examine the effectiveness of incentive
regulation:
Si = f(Di, LOADFi, RESCAPi, MARi, GEND
Di = g(Si' LOADFi, HEATi, MARi, GEND
(6)
(7)
where Di = 1 if firm i is under incentive regulation and = 0 if it is not. Since Di is binary, we have
a limited dependent simultaneous equation system;2 two alternative consistent estimation methods
were described in Berg-Jeong (1991, 51-52). New results for the reduced form probit model for Di
are shown in table 3. The coefficients and prediction rate were basically unchanged by the use of
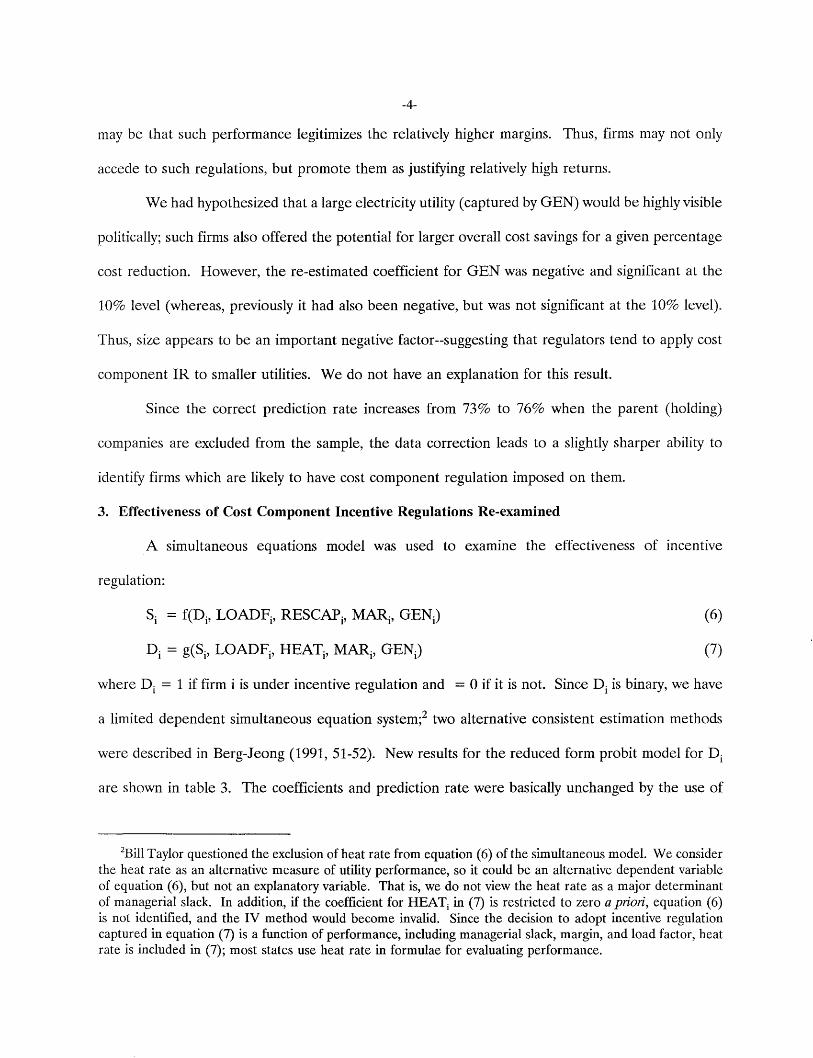
2Bill Taylor questioned the exclusion of heat rate from equation (6) of the simultaneous model. We considerthe heat rate as an alternative measure of utility performance, so it could be an alternative dependent variableof equation (6), but not an explanatory variable. That is, we do not view the heat rate as a major determinantof managerial slack. In addition, if the coefficient for HEATi in (7) is restricted to zero a priori, equation (6)is not identified, and the IV method would become invalid. Since the decision to adopt incentive regulationcaptured in equation (7) is a function of performance, including managerial slack, margin, and load factor, heatrate is included in (7); most states use heat rate in formulae for evaluating performance.

Table 3
Reduced Form Probit: Equation (10)
Variables Coefficients Marginal Effects
Original Without Original WithoutResults Holding Co. Results Holding Co.
Constant -6.45 -6.06 -1.53 -1.66(-3.43)** (-2.57)**
Heat Rate -0.12 -0.13 -0.03 -0.03(-1.32) (-1.08)
Margin 0.39 0.14 0.09 0.04(2.26)* (0.68)
Load Factor 5.70 3.32 1.35 0.91(3.59)** (1.79)
RESCAP 1.59 4.81 0.38 1.31(1.84) (3.84)**
GEN 0.28 0.36 0.07 0.10(2.94) (3.01)* *
Prediction Rate 0.82 0.79 NA NA
N 409 258 409 258
* 5% significance level** 1% significance level

-5-
the revised data set. Note that the original article was unclear about how the data were arranged for
testing the simultaneous model. The original data set was an incomplete panel, having 305 missing
observations out of 795 potential cells. Due to the large proportion (38%) of missing data, we
decided to pool the data, ignoring time variation. However, for the pre-estimation of equation (2)
(explaining the adoption of IR), we had deleted some observations to reduce endogeneity bias--as
described earlier. Thus, the data set used for equation (2) is different from the data used for the
simultaneous model (equations (6) and (7)): the results from equation (5) do not suggest that 02 =
o. Turning to the estimation process, the two-step estimation suggested by Maddala-Lee (1976, 525
545) yielded equation (11)--with the results shown in table 4. The adjusted R2 increases dramatically,
from .38 to .55. Again, the IR dummy does not reduce managerial slack.
The alternative IV method yields similar results: the insignificance of the coefficient for D i
in table 5 suggests that cost component IR is not effective in reducing managerial slack.
4. Cost Component Regulation Improves Heat Rates
The heat rate was not a significant determinant of the decision to adopt incentive regulation.
However, heat rates are often targeted as aspects of production which regulators are trying to change.
The heat rate reflects the engineering efficiency with which fuels are transformed into electricity.
Lower heat rates imply more complete transformation of fuel inputs into electricity output (as
measured in BTUs).
In the sample periods, only nine states have the heat rate (or fuel efficiency) as the target of
their IR: Arkansas, Arizona, California, Connecticut, Massachusetts, New Hampshire ("Energy Cost
Recovery Mechanism" program only), New York ("Incentive Fuel Adjustment Clause" program only),
Oregon, and Pennsylvania ("Limerick 2 Operational Incentive Program" only). Nine states in the data
set (DE, FL, lA, MS, NH, NI, NY, OH, and PA) had complex combinations of various factors

Table 4
Effect of Incentive Regulation on Slack: Equation (11)
Variables Original WithoutResults Holding Co.
Constant -0.21 -0.16(-1.78) (-1.96)
Dummy 0.002 -0.04(0.02) (-0.79)
Margin -0.19 -0.11(-13.21)* * (-15.36)**
Load Factor -0.39 -0.10(-3.44)** (-1.44)
RESCAP 0.002 0.06(0.03) (0.83)
GEN 0.05 0.03(6.95)** (5.73)**
Inverse Mills 0.02 0.03Ratio (0.39) (1.08)
Adj. R2 0.38 0.55
N 409 258
* 5% significance level** 1% significance level

Table 5
Effect of Incentive Regulation on Slack: Equation (12)
Variables Original WithoutResults Holding Co.
Constant -0.13 -0.19(-1.04) (-1.77)
Dummy 0.08 -0.06(0.84) (-0.90)
Margin -0.20 -0.11(-13.31)* * (-13.60)**
Load Factor -0.47 -0.08(-3.39)* * (-0.92)
RESCAP -0.02 0.09(-0.26) (0.93)
GEN 0.05 0.03(6.15)** (4.67)**
Adj. R2 0.37 0.35
N 409 258
* 5% significance level** 1% significance level

-6-
(Edison Electric Institute 1987, 1-50). The model presented below does not include all the firms in
the earlier data set, but only the above nine states which clearly had the heat rate target.
We investigated the impact of cost component regulation on the heat rate:
(13)
The variables are all as defined earlier, with LAGHEATi being the previous period heat rate. Cost
component regulation represents a structural break. Since lagged heat rate is a key determinant of
current heat rate, a more complicated model would be needed to capture the switch in the
relationship. Also, managers could anticipate changes in regulation. Deleted from the sample were
observations from the year prior to regulation, the year regulation was initiated, and the first two
years after regulation. Figure 1 illustrates why a total of four years around the adoption point are
deleted. The time series relationship implied by the inclusion of the trend (YEAR) and the lagged
heat rate has the following typical autoregressive form:
Yt = aYt_l + bt +ut (14)
Year (t) captures the linear trend, and the variable LAGHEAT (Yt-l) captures the autoregressive
trend.
We expected D i (dummy for cost component incentive regulation) to negatively affect the
heat rate. All else equal, a greater load factor (LOADFi ) implies that fuel-efficient base load units
are run relatively more of the time. High reserve capacity also ought to lower the heat rate as the
electric utility does not run older generating units. Also, larger firms (reflected in the log of output)
have more opportunities to benefit from power pooling and other techniques for efficiently utilizing
its generation mix. Rather than capturing technological change by the average age of production
capacity, we use the passage of time, so the coefficient on YEAR ought to be negative. The lagged
heat rate is included so that the firm-specific generation mix can serve as an anchor on which to base
subsequent developments.

HeatRate
Figure 1Impact of Incentive Regulation on Heat Rate
deleted
risiDg due to newenviroDDlental controls
IRTime

-7-
The new results are presented below:
HEATi = 4.57 - .239 D i - 1.36 LOADFi - .201 RESCAP i - .132 GENi(2.93) (-1.98) (-2.10) (-0.70) (2.95)
+ .025 YEAR(2.06)
+ .584 LAGHEATi(5.97)
(15)
Adj R2 = .755, N = 64, F Value = 33.95
The signs and significance of the coefficients are generally as expected. Engineering efficiency, as
reflected in the heat rate, is improved by the presence of targeted incentives.
In addition, the results indicate that higher load factors and greater output improve (reduce)
heat rates. Running counter to expectations, the coefficient on reserve capacity is negative, but it
is not significant. The positive significant impact of time (reflected in the coefficient on YEAR)
implies that the heat rate rises over the period, ceteris paribus. The trend of worsening heat rates
could be explained by environmental regulations which negatively affect the performance of
generating units--as when electricity is used to operate pollution control equipment.
We conclude that engineering efficiency (as defined by heat rates) has been enhanced by cost
component regulation between 1973 and 1985. However, our earlier conclusions are underscored
by the results from the improved data set: we do not find that economic efficiency is improved by
narrow cost component regulation.3 The non-observance of improved cost performance does not
necessarily mean that the cost component IR is worthless, just that both the incentives themselves
and operating cost savings may be relatively small. When states consider the new PURPA standards,
generalized incentive schemes, such as yardstick regulation or price caps, may offer greater promise
for promoting cost containment.
3Graniere, Duann, and Hegazy (1993, 1-103) assume that cost component incentive regulation is exogenous,rather than endogenous. They use a recursive system rather than a general simultaneous equations system andconclude that these performance based incentives do reduce operating costs. We performed a Hausman test totest the endogeneity of the incentive dummy and found that it was endogenous--bringing their recursive modelinto question.

-8-
REFERENCES
Berg, Sanford V. and Jinook Jeong. 1991. "An Evaluation of Incentive Regulation for ElectricUtilities." Journal of Regulatory Economics (Vol. 3, No.1): 45-55.
Edison Electric Institute. 1987. Incentive Regulation in the Electric Utility Industry. 1-50.
Graniere, Robert J., Daniel Duann and Youssef Hegazy. 1993. The Effectiveness of Heat Rate andPlant Availability Incentives: Electric Utilities. National Regulatory Research Institute, DraftReport (Summer): 1-103.
Maddala, G.S. and L. Lee. 1976. "Recursive Model with Qualitative Endogenous Variables," Annalsof Economic and Social Measurement (Vol. 5, No.4): 525-545.