Incentive Regulation Theory and Practice Reformatted 1-26-…
63
INCENTIVE REGULATION IN THEORY AND PRACTICE: ELECTRICITY DISTRIBUTION AND TRANSMISSION NETWORKS Paul L Joskow 1 MIT January 21, 2006 ABSTRACT Modern theoretical principles to govern the design of incentive regulation mechanisms are reviewed and discussed. General issues associated with applying these principles in practice are identified. Examples of the actual application of incentive regulation mechanisms to the regulation of prices and service quality for “unbundled” transmission and distribution networks are presented and discussed. Evidence regarding the performance of incentive regulation in practice for electric distribution and transmission networks is reviewed. Issues for future research are identified. Keywords: regulation, incentives, networks, electricity, transmission, distribution 1 Prepared for the National Bureau of Economic Research Conference on Economic Regulation, September 9-10, 2005. I have benefited from extensive comments provided by David Sappington and from discussions with Jean Tirole, Richard O’Neil and Michael Pollitt. I am grateful for research support from the MIT Center for Energy and Environmental Policy Research.
Transcript of Incentive Regulation Theory and Practice Reformatted 1-26-…
INCENTIVE REGULATION IN THEORY AND PRACTICE: ELECTRICITY DISTRIBUTION AND TRANSMISSION NETWORKS
Paul L Joskow1
MIT
January 21, 2006
ABSTRACT Modern theoretical principles to govern the design of incentive regulation mechanisms are reviewed and discussed. General issues associated with applying these principles in practice are identified. Examples of the actual application of incentive regulation mechanisms to the regulation of prices and service quality for “unbundled” transmission and distribution networks are presented and discussed. Evidence regarding the performance of incentive regulation in practice for electric distribution and transmission networks is reviewed. Issues for future research are identified. Keywords: regulation, incentives, networks, electricity, transmission, distribution
1 Prepared for the National Bureau of Economic Research Conference on Economic Regulation, September 9-10, 2005. I have benefited from extensive comments provided by David Sappington and from discussions with Jean Tirole, Richard O’Neil and Michael Pollitt. I am grateful for research support from the MIT Center for Energy and Environmental Policy Research.
January 21, 2006 (Revised)
INCENTIVE REGULATION IN THEORY AND PRACTICE: ELECTRICITY DISTRIBUTION AND TRANSMISSION NETWORKS
Paul L Joskow1
MIT INTRODUCTION Over the last twenty years several network industries that evolved historically as either private or state-owned regulated vertically integrated monopolies have been privatized, restructured, and some vertical segments deregulated. These industries include telecommunications, natural gas, electric power, and railroads. The reform program typically involves the vertical separation (ownership or functional) of potentially competitive segments, which are gradually deregulated, from remaining network segments that are assumed to have natural monopoly characteristics and continue to be subject to price, network access, service quality and entry regulations. In several countries, an important part of the reform agenda has included the introduction of “incentive regulation” mechanisms for the remaining regulated segments as an alternative to traditional “cost of service” or “rate of return” regulation. The expectation was that incentive regulation mechanisms would provide more powerful incentives for regulated firms to reduce costs, improve service quality in a cost effective way, stimulate (or at least not impede) the introduction of new products and services, and stimulate efficient investment in and pricing of access to regulated network infrastructure services. Although much of the research on the “liberalization” of these sectors has focused on the evolution of the potentially competitive segments that have been deregulated (e.g. wholesale and retail electric power markets), the performance of the remaining regulated network segments, and in particular the performance of new incentive regulation mechanisms, is also of considerable economic importance. These regulated segments often represent a significant fraction of the total price paid for by consumers for retail service (prices for competitive plus regulated services). Moreover, the performance of the regulated segments can have important effects on the performance of the competitive segments when the regulated segments provide the infrastructure platform upon which the competitive segments rely (e.g. the electric transmission and distribution networks). Accordingly, the welfare consequences of these industry restructuring and deregulation initiatives depends on the performance of both the competitive and the regulated segments of these industries.
1 Prepared for the National Bureau of Economic Research Conference on Economic Regulation, September 9-10, 2005. I have benefited from extensive comments provided by David Sappington and from discussions with Jean Tirole, Richard O’Neil and Michael Pollitt. I am grateful for research support from the MIT Center for Energy and Environmental Policy Research.

2
As the industry liberalization initiatives were gaining steam in Europe, Latin America, Australia, New Zealand and North America during the late 1980s and the 1990s, theoretical research on the properties of alternative incentive regulation mechanisms developed quite rapidly as well. However, the relationship between theoretical developments and applications of incentive regulation theory in practice has not been examined extensively. In this paper I provide an overview of the theoretical and conceptual foundations of incentive regulation theory, discuss some practical implementation issues, examine how incentive regulation mechanisms have been structured and applied to electric distribution and transmission networks, primarily in the UK where the application of these mechanisms is most advanced, review the limited available empirical analysis of the performance of incentive regulation mechanisms applied to electric distribution and transmission networks, and draw some conclusions about the relationships between incentive regulation theory and it application in practice.
As I will discuss, the implementation of incentive regulation concepts is more
complex and more challenging than may first meet the eye. Even apparently simple mechanisms like price caps (e.g. so-called “RPI – x” regulation) are fairly complicated to implement in practice, are often imbedded in a more extensive portfolio of incentive regulation schemes, and depart in potentially important ways from the assumptions upon which related theoretical analyses have been based. Moreover, the sound implementation of incentive regulation mechanisms depends in part on information gathering, auditing, and accounting institutions that are commonly associated with traditional cost of service or rate of return regulation. These institutions are especially important for developing sound approaches to the treatment of capital expenditures, to develop benchmarks for operating costs, to implement resets (“ratchets”) of prices, to take service quality attributes into account, and to deter gaming of incentive regulation mechanisms that have mechanisms for resetting prices or price adjustment formulas of one type or another over time.
The failure to understand the role of this regulatory infrastructure, especially as it
relates to data collection, accounting rules, reporting and auditing standards can significantly undermine the effectiveness of incentive regulation in practice. In the UK, for example, the initial failure of regulators to fully understand the need for a uniform system of capital and operating cost accounts as part of the foundation for implementing incentive regulation mechanisms has placed limitations on their effectiveness and led to gaming by regulated firms (e.g. capitalizing operating costs to take advantage of asymmetries in the treatment of operating and capital costs). The lack of a good standard accounting and reporting system made more difficult the UK electricity regulator’s efforts to remove distortions caused by the periodicity of regulatory reviews. As a result, the electricity regulator in the UK has now found it necessary to strengthen and standardize cost accounting and reporting protocols to allow for better incentive regulation (OFGEM 2004f).

3
THEORETICAL AND CONCEPTUAL FOUNDATIONS
a. Overview The traditional textbook theories of optimal pricing for regulated firms characterized by subadditive costs and a budget constraint (e.g marginal cost pricing, Ramsey-Boiteux pricing, non-linear pricing, etc.) assume that regulators are completely informed about the technology, costs and consumer demand attributes facing the firms they regulate and can somehow impose cost-minimization obligations on regulated firms (e.g. Boiteux 1960 (1951), 1971 (1956), Braeutigam (1989)).2 The focus is then on second-best pricing given defined cost functions, demand attributes and budget balance constraints3, not on incentives to minimize costs or improve other dimensions of firm performance (e.g. service quality attributes). Fully informed regulators clearly do not exist in reality. Regulators have imperfect information about the cost and service quality opportunities and the attributes of the demand for services that the regulated firm faces. Moreover, the regulated firm generally has more information about these attributes than does the regulator or third parties which have an interest in the outcome of regulatory decisions. Accordingly, the regulated firm may use its information advantage strategically in the regulatory process to increase its profits or to pursue other managerial goals, to the disadvantage of consumers (Owen and Braeutigam 1978, Laffont and Tirole 1993, Chapter 1). These problems may be further exacerbated if the regulated firm can “capture” the regulatory agency and induce it to give more weight to its interests (Posner 1974; McCubbins 1985; Spiller 1990; Laffont and Tirole 1993, Chapter 5). Alternatively, other interest groups may be able to “capture” the regulator and, in the presence of long-lived sunk investments, engage in “regulatory holdups” or expropriation of the regulated firm’s assets. Higher levels of government, such as the courts and the legislature, also have imperfect information about both the regulator and the regulated firm and can monitor their behavior only imperfectly (McCubbins, Noll and Weingast 1987).
The evolution of “traditional” regulatory practices in the U.S. actually has
reflected efforts to mitigate the information disadvantages that regulators confront, as well as reflecting broader issues of regulatory capture and opportunities for monitoring by other levels of government, consumers and other interest groups. These institutions and practices are reflected in: laws and regulations that require firms to adhere to a uniform system of capital and operating cost accounts, give regulators access to the books and records of regulated firms and the right to request additional information on a case by case basis; auditing requirements, staff resources to evaluate the associated information, transparency requirements such as public hearings and written decisions, ex parte communications rules; opportunities for third parties to participate in regulatory
2 This characterization is a little unfair since the development of much of this theoretical work was associated with economists in public enterprises who not only worked on optimal pricing but also developed methods for optimizing costs, reliability and service quality in a public enterprise context. 3In what follows I will use the terms “budget constraint”,” firm viability constraint”, and “firm participation constraint”, interchangeably.

4
proceedings to (in theory)4 assist the regulatory agency in developing better information and reducing its regulatory disadvantage; and appeals court review, and legislative oversight processes. In addition, since regulation is a repeated game, regulators (as well as legislators and appeals courts) can learn about the firm’s attributes as they observe its responses to regulatory decisions over time and, as a result, the regulated firm naturally develops a reputation for the credibility of its claims and the information that it uses to support them.
However, although the development of U.S. regulatory practice focused on
improving the information available to regulators, the regulatory mechanisms adopted typically did not utilize this information nearly as effectively as they could have. While U.S. regulatory practice differs significantly from the way it is often characterized, and during long periods of time provided incentives to control costs (Joskow 1974, 1989), formal incentive regulation mechanism where historically used infrequently in the U.S., Canada, Spain, Germany and other countries with private rather than state owned regulated network industries. Perhaps regulatory practice evolved this way due to the absence of a sound theoretical incentive regulation framework to apply in practice.
Beginning in the 1980s, theoretical research on incentive regulation rapidly
evolved to confront directly imperfect and asymmetric information problems and related contracting constraints, regulatory credibility issues, dynamic considerations, regulatory capture, and other issues that regulators have been trying to respond to for decades but in the absence of a comprehensive theoretical framework to guide them. This theoretical framework is reasonably mature and can help regulators deal with these challenges much more directly and effectively (Laffont and Tirole 1993; Armstrong, Cowan and Vickers 1994; Armstrong and Sappington 2003). Consider the simplest characterization of the nature of the regulator’s information disadvantages and its potential implications. A firm’s cost opportunities may be high or low based on inherent attributes of its technical production opportunities, exogenous input cost variations over time and space, inherent differences in the costs of serving locations with different attributes (e.g. urban or rural), etc. While the regulator may not know the firm’s true cost opportunities she will typically have some information about their probability distribution. The regulator’s imperfect information can be summarized by a probability distribution defined over a range of possible cost opportunities between some upper and lower bound within which the regulated firm’s actual cost opportunities lie. Second, the firm’s actual realized costs or expenditures will not only depend on its underlying cost opportunities but also on the behavioral decisions made by managers to exploit these cost opportunities. Managers may exert varying levels of effort to get more (or less) out of the cost opportunities that the firm has available to it. The greater the managerial effort the lower will be the firm’s costs, other things equal. However, exerting more managerial effort imposes costs on managers and on society. Other things equal, managers will prefer to exert less effort than more to increase their own satisfaction, but less effort will lead to higher costs and more “x-inefficiency.” 4 Of course, third parties may have an incentive to inject inaccurate information into the regulatory process as well.
5
Unfortunately, the regulator cannot observe managerial effort directly and may be uncertain about its quality and its impacts on actual costs. The uncertainties the regulator faces about the firm’s inherent cost opportunities and managerial effort gives the regulated firm a strategic advantage. The firm would like to convince the regulator that it is a “higher cost” firm than it actually is, in the belief that the regulator will then set higher prices for the services it provides as it satisfies the firm’s long-run financial viability constraint (firm participation or budget-balance constraint), increasing the regulated firm’s profits, creating dead-weight losses from (second-best) prices that are two high, and allowing the firm to capture surplus from consumers. Thus, the social welfare maximizing regulator faces a potential adverse selection problem as it seeks to distinguish between firms with high cost opportunities and firms with low cost opportunities while adhering to a firm budget balance constraint that must be satisfied whether the firm turns out to have either high or low cost opportunities. The uncertainties that the regulator faces about the quantity and impact of managerial effort creates another potential problem. Since the regulator typically has or can obtain good information about the regulated firm’s actual costs (i.e. it’s actual expenditures), at least in the aggregate, one approach to dealing with the adverse selection problem outlined above would simply be to set (or reset after a year) prices to a level equal to the firm’s ex post realized costs. This would solve the adverse selection problem since the regulator’s information disadvantage would be resolved by auditing the firm’s costs.5 This is the standard characterization of “cost of service” regulation. However, if the loss of the opportunity for the firm and its managers to earn rents reduces managerial effort and less managerial effort increases the firm’s costs, this kind of “cost plus” regulation may lead management to exert too little effort to control costs, increasing the realized costs above their efficient levels. If the “rat doesn’t smell the cheese and sometimes get a bit of it to eat” he may play golf rather than working hard to achieve efficiencies for the regulated firm. Thus, the regulator faces a potential moral hazard problem associated with variations in managerial effort in response to regulatory incentives (Laffont and Tirole 1986; Baron and Besanko 1987b). Faced with these information disadvantages, the social welfare maximizing regulator will seek a regulatory mechanism that takes both the social costs of adverse selection and moral hazard into account, subject to the firm participation or budget-balance constraint that it faces, balancing the costs associated with adverse selection and the costs associated with moral hazard. The regulator may also take actions that reduce her information disadvantages by, for example, increasing the quality of the information that the regulator has about the firm’s cost opportunities.
Following Laffont and Tirole (1993, pp. 10-19), to illuminate the issues at stake
we can think of two polar case regulatory mechanisms that might be applied to a
5 Of course, the auditing of costs may not be perfect and in a multiproduct context the allocation of accounting costs between different products is likely to reflect some arbitrary joint cost allocation decisions.

6
monopoly firm producing a single product. The first regulatory mechanism involves setting a fixed price ex ante that the regulated firm will be permitted to charge going forward (i.e. effectively forever). Alternatively, we can think of this as a pricing formula that starts with a particular price and then adjusts this price for exogenous changes in input price indices and other exogenous indices of cost drivers (forever). This regulatory mechanism can be characterized as a fixed price regulatory contract or, in a dynamic setting, a price cap regulatory mechanism where prices adjust based on exogenous input price and performance benchmarks. There are two important attributes of this type of regulatory mechanism. Because prices are fixed (or vary based only on exogenous indices of cost drivers) and do not respond to changes in managerial effort or ex post cost realization, the firm and its managers are the residual claimants on production cost reductions and the costs of increases in managerial effort (and vice versa). That is, the firm and its managers have the highest powered incentives fully to exploit their cost opportunities by exerting the optimal amount of effort (Brennan 1989; Cabral and Riordan 1989; Isaac 1989; Sibley 1989; Kwoka 1993). Accordingly, this mechanism provides optimal incentives for inducing managerial effort and eliminates the costs associated with managerial managerial moral hazard. However, because the regulator must adhere to a firm participation or financial viability constraint, when there is uncertainty about the regulated firm’s cost opportunities the regulator will have to set a relatively high fixed price (or dynamic price cap) to ensure that if the firm is indeed inherently high cost, the prices under the fixed price contract or price cap will be high enough to cover the firm’s (efficient) realized costs. Accordingly, while a fixed price mechanism may deal well with the potential moral hazard problem by providing high powered incentives for cost reduction, it is potentially very poor at “rent extraction” for the benefit of consumers and society, potentially leaving a lot of rent to the firm due to the regulator’s uncertainties about the firm’s inherent costs and its need to adhere to the firm viability or participation constraint. Thus, while a fixed price type incentive mechanism solves the moral hazard problem it incurs the full costs of adverse selection. At the other extreme, the regulator could implement a “cost of service” contract or regulatory mechanism where the firm is assured that it will be compensated for all of the costs of production that it actually incurs. Assume for now that this is a credible commitment --- there is no ex post renegotiation --- and that audits of the expenditures the firm has incurred are accurate. When the firm produces it will then reveal whether it is a high cost or a low cost firm to the regulator. Since the regulator compensates the firm for all of its costs, there is no “rent” left to the firm or its managers in the form of excess profits. This solves the adverse selection problem. However, this kind of cost of service recovery mechanism does not provide any incentives for the management to exert optimal (any) effort. If the firm’s profitability is not sensitive to managerial effort, the managers will exert the minimum effort that they can get away with. Even though there are no “excess profits” left on the table since revenues are equal to the actual costs the firm incurs, consumers are now paying higher prices than they would have to pay if the firm were better managed and some rent were left with the firm and its managers. Indeed, it is this kind of managerial slack and associated x-inefficiencies that most policymakers have in mind when they discuss the “inefficiencies” associated with

7
regulated firms. Thus, while the adverse selection problem can be solved in this way, but the costs associated with moral hazard are fully realized. Accordingly, these two polar case regulatory mechanisms each have both positive and negative attributes. One is good at providing incentives for managerial efficiency and cost minimization, but it is bad at extracting the benefits of the lower costs for consumers. The other is good at rent extraction but leads to inefficiencies due to moral hazard resulting from suboptimal managerial effort. Perhaps not surprisingly, the optimal regulatory mechanism (in a second best sense) will lie somewhere between these two extremes. In general, it will have the form of a profit sharing contract or a sliding scale regulatory mechanism where the price that the regulated firm can charge is partially responsive to changes in realized costs and partially fixed ex ante (Schmalensee 1989, Lyon 1996). More generally, by offering a menu of cost-contingent regulatory contracts with different cost sharing provisions, the regulatory can do even better than if it offers only a single profit sharing contract (Laffont and Tirole 1993). The basic idea here is to make it profitable for a firm with low cost opportunities to choose a relatively high powered incentive scheme and a firm with high cost opportunities a relatively low-powered scheme. Some managerial inefficiencies are incurred if the firm turns out to have high cost opportunities, but these costs are balanced by reducing the rent left to the firm if it turns out to have low cost opportunities. Consider the following simple example that illustrates the value of offering a menu of regulatory contracts to the regulated firm.6 Assume that there are two options, a fixed price contract or a cost-of-service contract. By offering this menu the regulator can present a more demanding fixed priced contract because the cost-of-service contract ensures that the firm’s budget constraint will not be violated. If the fixed price contract is too demanding the firm will choose the cost-of-service contract. However, if the firm is potentially a very low-cost supplier and chooses the fixed price contract more rents will be conveyed to consumers.
We can capture the nature of the range of options in the following fashion.
Consider a general formulation of a regulatory process in which the firm’s allowed revenues “R” are determined based on a fixed component “a” and a second component that is contingent on the firm’s realized costs “C” and where “b” is the sharing parameter that defines the responsiveness of the firm’s revenues to realized costs. R = a + (1-b)C Under a fixed price contract or price cap regulation: a = C* where C* is the regulator’s assessment of the “efficient” costs of the
highest cost type and b = 1 6 I am grateful to David Sappington for providing this example.

8
Under pure cost of service regulation where the regulator can observe the firm’s expenditures but not evaluate their efficiency:7 a = 0 b = 0 Under profit sharing contract or sliding scale regulation (Performance Based Regulaion) 0 < b < 1 0 < a < C*
The challenges then are to find the optimal performance based mechanism given
the information structure faced by the regulator and for the regulator to find ways to reduce its information disadvantages vis a vis the regulated firm and to use the additional information effectively. Laffont-Tirole show that it is optimal for the regulator to offer a menu of contracts with different combinations of a and b that meet certain conditions driven by the firm’s budget constraint and an incentive compatibility constraint that leads firms with low cost opportunities to choose a high powered scheme (b is closer to 1 and a is closer to the efficient cost level for a firm with low cost opportunities) and firms with high cost opportunities to choose a lower powered incentive scheme (a and b are closer to zero). The lower powered scheme is offered to satisfy the firm participation constraint, sacrificing some costs resulting from managerial moral hazard, in order to reduce the rents that must be left to the low cost firm as it is induced to exert the optimal amount of managerial effort while satisfying the firm viability constraint if it turns out to be a high cost opportunity firm. (So far, this discussion has ignored quality issues. Clearly if a regulatory mechanism focuses only on reducing costs and ignores quality it will lead to firm to provide too little quality. This is a classic problem with pure fixed price or price cap mechanisms and will be discussed further below.) The incentive regulation literature is not a substitute for the older literature on optimal pricing for natural monopolies subject to a budget constraint, but rather a complement to it. This can be seen most clearly in the framework developed by Laffont and Tirole where the availability of government transfers creates a dichotomy or separation between optimal pricing and optimal incentives for controlling costs (Laffont-Tirole 1993, Chapter 2). As a result, all of the basic second-best optimal pricing results for a natural monopoly subject to a budget constraint continue to be applied alongside the application of optimal incentive schemes (given asymmetric information) for controlling production costs. More generally, however, pricing and incentives cannot be so easily separated and their effects are likely to be interdependent. Some mechanisms can provide both good pricing and performance (cost, quality) incentives, but typically, the desire to get prices as well as performance incentives right creates another constraint that
7 This is not a particularly accurate characterization of cost of service regulation in practice in the U.S., but it has become the common characterization of it, especially among those who had no experience with it (Joskow and Schmalensee 1986).

9
moves us further from first-best outcomes. Legal, political, bureaucratic and other constraints may also be quite important in practice. b. Incentive Regulation Theory Typology The many papers that have contributed to the development of incentive regulation theory reflect a wide range of assumptions about the nature of the information possessed by the regulator and the firm about costs, cost reducing managerial effort, demand and product quality, the attributes of the regulatory instruments available to the regulator, the risk preferences of the firm, regulatory capture by interest groups, regulatory commitment, flexibility, and other dynamic considerations. These alternative sets of assumption can be applied in both a single or multiproduct context. One strand of the literature initially focused primarily on adverse selection problems motivated by the assumption that regulators could not observe a firm’s costs and ignoring the role of managerial effort (Baron-Meyerson 1982; Lewis and Sappington 1988a, 1988b). Another strand of the literature focused on both adverse selection and moral hazard problems motivated by the assumption that regulators could observe a firm’s realized cost ex post, had information about the probability distribution of a firm’s cost ex ante, and that managerial effort did affect costs but that this effort was not observable by the regulator (Laffont and Tirole (1986)). Over time, these approaches have evolved to cover a similar range of assumptions about these basic information and behavioral conditions and lead to qualitatively similar conclusions. Armstrong and Sappington (2005) provide a comprehensive and thoughtful review and synthesis of this entire literature and I refer readers interested in a very detailed treatment of the full range of specifications of incentive regulation problems to their paper. Here I will simply lay out a “typology” of how these issues have been developed in the literature. What are the regulator’s objectives? Much of the literature assumes that the regulator seeks to maximize a social welfare function that reflects the goal of limiting the rents that are transferred from consumers and/or taxpayers to the firm’s owners and managers subject to a firm participation or breakeven constraint. Armstrong and Sappington (2005) articulate this by specifying an objective function W = S + αR where W is expected social welfare, S equals expected consumers’ (including consumers as taxpayers) surplus, R equals the expected rents earned by the owners and managers of the firm (over and above what is needed to compensate them for the total costs of production and the disutility of managerial effort to satisfy the firm viability or participation constraint), and where α < 1 implies that the regulator places more weight on consumer surplus than on rents earned by the firm. That is, the regulator seeks to extract rent from the firm for the benefit of consumers, subject as always to a firm break-even constraint. In addition, W will be reduced if excessive rents are left to the firm since this will require higher (second-best) prices and greater allocative inefficiency.
Laffont and Tirole (1988, 1993, 2000)) create a social benefit from reducing the
rents left to the firm in a different way. In their basic model, consumer welfare and the welfare of the owners and managers of the firm are generally weighted equally. However, one of the instruments available to the regulator is the provision of transfer

10
payments from the government to the firm which affect the rents earned by the firm. These transfer payments come out of the government’s budget and carry a social cost resulting from the inefficiencies of the tax system used to raise these revenues. Thus, for every dollar of transfer payments given to the firm to increase its rent, effectively (1+λ) dollars of taxes must be raised, where λ reflects the inefficiency of the tax system. Accordingly, by reducing the transfers to the firm over and above what is required to compensate it for its efficient production costs and the associated managerial disutility of effort, welfare can be increased. As noted above, this set-up also leads to a nice dichotomy between incentive mechanisms and the setting of second-best prices for the services sold by the firm. That is, regulators first establish compensation arrangements (define how the firm’s budget constraint or “revenue requirements” will be determined) to deal as effectively as possible with adverse selection and moral hazard problems given the information structure assumed. The regulator separately establishes a second best price structure to deal with allocational efficiency considerations. These prices may not yield enough revenue to cover all of the firm’s costs, with the difference coming from net government transfers (or vice versa). In addition, Laffont and Tirole introduce managerial effort (e) as a variable that affects costs. Managers have a disutility of effort (U) and must be compensated for it. Accordingly, the utility of management also appears in the social welfare function. What does the regulator know about the firm ex ante and ex post? The literature that focuses on adverse selection builds on the fundamental paper by Baron and Myerson (1982). There the regulator does not know the firm’s cost opportunities ex ante but has information about the probability distribution over the firm’s possible cost opportunities.8 Nor can the regulator observe or audit the firm’s costs ex post. The firm does know its own cost opportunities ex ante and ex post. The firm’s demand is known by both the regulator and the regulated firm. There is no managerial effort in these early models of incentive mechanism design. Accordingly, the analysis deals with a pure adverse selection problem with no potential inefficiencies or moral hazard associated with inadequate managerial effort. The regulation in the presence of adverse selection literature then proceeds to consider asymmetric information about the firm’s demand function, where the firm knows its demand but either the regulator does not observe demand ex ante or ex post or learns about demand only ex post (Lewis and Sappington 1988a; Riordan 1984). In light of common U.S. and Canadian regulatory practice, a natural extension of these models is to assume that the regulated firm’s actual realized costs are observable ex post, at least with uncertainty. Baron and Besanko (1984) considers cases where a firm’s costs are “audited” ex post, but the actual realized costs resulting from the audit are observable by the regulator with a probability less than one. The regulator can use this information to reduce the costs of adverse selection. Laffont and Tirole (1986, 1993) consider cases where the firm’s realized costs are fully observable by the regulator. However, absent the simultaneous introduction of an uncertain scope for cost reductions through managerial effort, the regulatory problem then becomes trivial --- just set prices 8 In models that distinguish between fixed and variable costs, the regulator may know the fixed costs but not the variable costs. See Armstrong and Sappington (2003).
11
equal to the firm’s realized costs. Accordingly, Laffont and Tirole (1986a, 1993) introduce managers of the firm who can choose the amount of cost reducing effort that they expend. Managerial effort is not observable by the regulator ex ante or ex post, but realized production costs are fully known to the regulator as are the managerial “production function” that transforms managerial effort into cost reductions and the managers’ utility of effort function. The regulated firm fully observes managerial effort, the cost reducing effects of managerial effort, and demand. It also knows what managerial utility would be at different levels of effort. Armstrong and Sappington (2003) advance this analysis by considering cases where the regulated firm is uncertain about the operating costs that will be realized but knows that it can reduce costs by increasing managerial effort, though in a way that creates a moral hazard problem but no adverse selection problem. In the face of uncertainty over its costs, they consider cases where the firm may be either risk-neutral or risk averse. What instruments are available to the regulator and how do the regulator and the regulated firm interact over time? Much of the incentive regulation literature is static. The regulator (or the government through the regulator) can offer a menu of prices (or fixed price contracts) with or without a fixed fee or transfer payment. The menu may contain prices that are contingent on realized costs (which can be thought of as penalties or rewards for performance) in those models where regulators observe costs ex post. Some of these instruments may be costly to utilize (e.g. transfer payments and auditing efforts). The more instruments the regulator has at its disposal and the lower the costs of using them, the closer the regulator will be able to get to the full information efficiency benchmark.
In the two-type case, the optimal regulatory mechanism involves offering the
regulated firm a choice between two regulatory contract options. One is a fixed price option that leaves some rent if the firm is a low-cost type but negative rent if it is a high cost type. The second is a cost-contingent contract that distorts the firm’s effort if it is a high cost type but leaves it no rent. The high powered scheme is the most attractive to the low-cost type and the low-powered scheme is the most attractive to the high cost type. The expected cost of the distortion of effort if the firm is a high cost type is balanced against the expected cost of leaving additional rent to the firm if it is a low cost type --- the fundamental tradeoff between incentives and rent extraction.
The two-type example can be generalized to a continuum of types (Laffont and
Tirole 1993, pp. 137ff). Assume that β indicates the firm’s type ordered from low-cost to high-cost opportunities and has a continuous distribution from some lower bound βL to some upper bound βH with a cumulative distribution F(β) and a strictly positive density f(β) where F is assumed to satisfy a monotone hazard rate condition so that F(β)/f(β) is non-decreasing in β.9 The regulator maximizes expected social welfare subject to the firm participation and incentive compatibility constraints as before and incentive compatibility requires a mechanism that leaves more rent to the firm the lower is its type β, with the highest cost type getting no rent, the lowest cost type getting the most rent and
9 Most commonly used distribution satisfy this assumption, e.g. uniform and normal distributions.

12
intermediate types’ rent defined by the difference in their marginal costs. Similarly, the effort of the lowest cost type is optimal and the effort of the highest cost type is distorted the most, with intermediate types having smaller levels of distortion (and more rents) as β declines toward βL. In the case of a continuous distribution of types, the optimality conditions are directly analogous to those for the two-type case.
Laffont and Tirole (1993) show that these optimality conditions can be
implemented by offering the firm a menu of linear contracts, which in their model are transfer or incentive payments in excess of realized costs (which are also reimbursed), of the form:
t(β, c) = a(β) – b(β)c
where a is a fixed payment, b is a cost contingent payment, and a and b are decreasing in β. We can rewrite the transfer payment equation in terms of the gross transfer to the firm including the unit cost reimbursement: Rf = a(β) – b(β)c + c = a(β) + (1-b(β))c (36) where da/db > 0 (for a given β a unit increase in the slope of the incentive payment must be compensated by an increase in the fixed payment to cover the increase in production costs) and d2a/db2 < 0 (the fixed payment is a concave function of the slope of the incentive scheme.) (See Figure 1) The lowest cost type chooses a fixed price contract with a transfer net of costs equal to UL and the firm is the residual claimant on cost reducing effort (b = 1). As β increases, the transfer is less sensitive to the firm’s realized costs (b declines), the rent is lower (a declines), and the efficiency distortion from suboptimal effort increases.

13
Note that if regulators utilized an optimal menu of contracts of this type and one
were to try empirically to relate a cross section of regulated firms’ realized costs to the power of the incentive scheme they had selected, a correlation between the power of the incentive scheme and the firm’s realized costs would not tell us anything directly about the incentive effects of higher-powered schemes in terms of inducing optimal effort and mitigating moral hazard problems. This is the case because the firms with the lower inherent costs will rationally choose the higher powered contracts. Assume that we had data for regulated firms serving different geographic regions (e.g. different states) which had different inherent cost opportunities (a range of possible values for β). If the regulators in each state offered the optimal menu of incentive contracts, the low cost opportunity firms would choose high powered contracts and the high cost opportunity firms would choose lower powered contracts. Accordingly, the effects of the mechanisms on mitigating the rents that would accrue to a low cost firm’s information advantage from the effects of the mechanism on inducing optimal effort are not easily distinguished empirically. When firms are given a choice of incentive mechanisms in this way, the endogeneity between the power of the mechanism chosen by the firm and realized costs should be accounted for carefully in empirical work aimed at measuring the effects of incentive regulation on firm performance ex post.
One way in which regulators can effectively reduce their information
disadvantage is by using competitive benchmarks or “yardstick regulation” in the price setting process. Shleifer (1985) shows that if there are multiple non-competing but otherwise identical firms (e.g. gas distribution companies in firms in different states), an
14
efficient regulatory mechanism involves setting the price for each firm based on the costs of the other firms. Each individual firm has no control over the price it will be allowed to charge (unless the firms can collude) since it is based on the realized costs of (n-1) other firms. So, effectively each firm has a fixed price contract and the regulator can be assured that the budget balance constraint will be satisfied since if the firms are identical prices will never fall below their “efficient” realized costs. This mechanism effectively induces each firm to compete against the others. The equilibrium is a price that just covers all of the firm’s efficient costs as if they competed directly with one another.
Of course, the regulator is unlikely to be able to find a large set of truly identical
firms. However, hedonic regression, frontier cost function estimation and related statistical techniques can be used to normalize cost variations for exogenous differences in firm attributes to develop normalized benchmark costs (Jamasb and Pollitt 2001, 2003; Estache, Rossi, Ruzzier 2004). As we shall see below, these benchmark costs can then be used by the regulator in a yardstick framework or in other ways to reduce its information disadvantage, allowing it to use high powered incentive mechanisms without incurring the cost of excessive rents that would accrue if the regulator had a greater cost disadvantage. However, data to perform this type of benchmarking analysis are not always available, a variety of benchmarking techniques can be utilized, and the failure to integrate cost and quality variables can lead to misleading results (Giannakis, Jamasb and Pollitt 2004; Jamasb and Pollitt 2001). Of additional practical interest are issues that arise as we consider the dynamic interactions between the regulated firm and the regulator and the availability and utilization of mechanisms that the regulator potentially has available to reduce its information disadvantage. It is inevitable that the regulator will learn more about the regulated firm as they interact over time. So, for example, if the regulator can observe a firm’s realized costs ex post it will learn a lot about its true cost opportunities. Should the regulator use that information to reset the prices that the regulated firm receives (commonly known as a “ratchet” --- Weitzman 1980)? Or is it better for the regulator to commit to a particular contract ex ante, which may be contingent on realized costs, but the regulator is then not permitted to use the information gained from observing realized costs to change the terms and conditions of the regulatory contract offered to the firm? Is it credible for the regulator to commit not to renegotiate the contract, especially in light of U.S. regulatory legal doctrines that have been interpreted as foreclosing the ability of a regulatory commission to bind future commissions? Clearly, if the regulated firm knows that information about its realized costs can be used to renegotiate the terms of its contract ex post, this will affect its behavior ex ante. It may have incentives to engage in less cost reduction in period 1 or try to fool the regulator into thinking it is a high cost firm so that it can continue to earn rents in period 2. Of if the regulated firm has a choice between technologies that involve sunk cost commitments, will the possibility of ex post opportunism or regulatory expropriation, perhaps driven by the capture of the regulator by other interest groups, affect its willingness to invest in the lowest cost technologies when they involve more significant sunk cost commitments (leading to the opposite of the Averch-Johnson effect --- Averch and Johnson 1962; Baumol and Klevorick 1970).

15
These issues are all of considerable importance when applying incentive regulation concepts in practice.
These dynamic issues have been examined theoretically more intensively over
time and represent a merging of the literature on regulation with the literature on contracts and dynamic incentive mechanisms more generally. (Laffont and Tirole 1988b, 1990a, 1993; Baron and Besanko 1987a; Armstrong and Vickers 1991, 2000; Armstrong, Cowan and Vickers 1995) The impacts of regulatory lag of different durations (Baumol and Klevorick 1970, Klevorick 1973, Joskow 1974) and other price adjustment procedures have been analyzed theoretically as well (Vogelsang and Finsinger 1979; Sappington and Sibley 1988, 1990).
As I will discuss further below, one of the regulatory mechanisms utilized
extensively in the UK since its utility sectors were privatized is effectively a fixed price contract (actually a price cap that is adjusted for general movements in input prices and an assumed target rate of productivity growth --- a so-called RPI-X mechanism as discussed further below) with a ratchet every five (or so) years when the level of the price cap is reset to reflect the current realized (or forecast) cost of service (Beesley and Littlechild 1989; Brennan 1989; Isaac 1989; Sibley 1989; Armstrong, Cowan and Vickers 1994). It has been observed that regulated firms appear to make their greatest cost reduction efforts during the early years of the price cap period and then exert less effort at reducing costs as the date of the price review proceeding approached (OFGEM 2004a, 2004c, 2004e, 2004f). More generally, the dynamic attributes of the regulatory process and how regulators use information about costs revealed by the regulated firm’s behavior over time have significant effects on the incentives the regulated firm faces and on its behavior (Gilbert and Newbery 1994). PRACTICAL IMPLEMENTATION ISSUES While the theoretical literature on incentive regulation is quite rich, it still provides relatively little direct guidance for empirical application in specific circumstances. Regulators need to find answers to a number of practical questions to apply the theory in practice in the design of actual incentive regulation mechanisms. Among the questions that must be answered are the following: a. Where does the regulator’s information about the firm’s actual costs and the distribution of cost opportunities come from? If regulators are going to apply incentive regulation mechanisms that are cost contingent they must have some consistent mechanism for measuring the regulated firm’s actual costs. These costs include operating costs (e.g. labor), the cost of capital investments (e.g. the cost of physical distribution network equipment), and the financial components necessary to transform this capital investment cost stock into a flow of rental or user charges for capital services (e.g. depreciation rates, the opportunity cost of capital, the appropriate debt/equity ratio, income taxes) over time.

16
Capital cost accounting issues have largely been ignored in the theoretical literature on incentive regulation. Although it has been of limited concern to contemporary economists, any well functioning regulatory system needs to adopt good cost accounting rules, reporting requirements for costs, output, prices, and other dimensions of firm performance, and enforce auditing and monitoring protocols to ensure that the regulated firm applies the auditing rules and adheres to its reporting obligations. Much of the development of U.S. regulation during the first half of the 20th century focused on the development of these foundation components required for any good regulatory system that involves cost contingent regulatory mechanisms.
Of course, cost is only one dimension of firm performance. Firm performance
may also have various “quality” dimensions and there are likely to be inherent tradeoffs between cost and quality. If incentives are to be extended to the quality dimension as well, as they should be, then these quality dimensions must be defined and associated performance indicia measured by the firm, reported to the regulator, and must be subject to auditing protocols. Regulators also need information to develop a view about the distribution of cost opportunities, consumer valuations of service quality, and other dimensions of firm performance to implement incentive regulation mechanisms that do not leave too much rent to regulated firms and do not lead to excessive managerial efficiency. Regulators need to have the resources to develop information about industry performance norms and the causes of variations in the performance of regulated firms. Accordingly, they need the resources to commission industry studies that give them this kind of information so that their information disadvantage can be reduced. b. Should the regulator offer the regulated firm a menu of contracts or a specific contract with a single set of values for a and b as discussed above? The Laffont-Tirole framework implies that firms should be offered a menu of cost-contingent contracts from which they can choose. The menu forces the firm to reveal its type ex post and allows for a better balance of efficiency and rent extraction than would a single linear incentive contract designed ex ante based on the same information and subject to the same budget balance constraints. However, it appears that regulators typically offer firms only a single regulatory contract and when the contracts is cost contingent it is typically linear (Schmalensee 1989). I am aware of two situations in which regulated firms were offered a menu of cost contingent or sliding scale contracts. The first relates to the System Operator (SO) incentive schemes that have been offered to the electric transmission system operator in England and Wales discussed below. The second is the menu of sliding scale mechanisms offered to the electric distribution companies in the UK for determining future capital expenditure allowances and associated user charges for capital services pursuant to the most recent price cap review in late 2004. These menus are discussed in more detail below as well. However, there may be more use of a de facto menu of contracts approach than first meets the eye when we take the attributes of the regulatory review process itself into account. The final regulatory mechanism applied to a regulated firm is often the result of formal and informal negotiations involving proposals by the regulator’s staff, the regulatory firm and interested third parties (Joskow

17
1973, 1974; Doucet and Littlechild 2006). This process may have similarities to the regulator’s offer of a menu of contracts in the sense that the parties negotiate over the attributes of the incentive mechanism. We see only the final outcome of these negotiations. c. What benchmarks are to be used to arrive at starting values for the regulated firm’s costs, revenues, and other performance indicia and how are these benchmarks adjusted over time? In some cases regulators accept the firm’s current levels of costs and other dimensions of performance and focus on benchmarks for performance improvements, effectively benchmarking the firm against its historical performance. This approach reflects the assumption that the firm can do better than it has in the past, but still leaves open the question of performance improvement norms. Another approach is to benchmark the firm’s current performance using appropriate comparisons with other similarly situated firms, properly adjusting for differences in the cost opportunities and demand patters faced by similar but not identical comparator firms. Where there is not a set of reasonable comparator firms to draw upon, regulators may rely on engineering and management “experts” to study the firm’s performance and opine on cost improvement opportunities and the associated uncertainties, perhaps drawing analogies from components of firms in other industries. d. What should be the power of the incentive scheme? If the regulator offers a menu of cost-contingent contracts, the height and the slope of the incentive scheme must be defined (a and b above). If the regulator apples a single incentive mechanism both the fixed component and the “sharing” or “sliding scale” fraction must be defined. If the regulatory mechanism is a price cap, both the starting values for prices or the average price level (po for UK regulation of electric, gas, and water distribution and transmission networks) and the “x” intertemporal adjustment factor must be defined. In addition, an appropriate inflation index (RPI in the UK) must be identified.
In practice, incentive regulation mechanisms typically also have “resets” or
“ratchets” and the period of “regulatory lag” between price reviews needs to be defined. As the review period gets longer the power of the incentive mechanism increases and vice versa. Finally, many incentive regulation mechanisms used in practice have caps and floors that effectively define a collar on the operation of the mechanism. So, for example, a cap and floor are often applied that limit the gains and the losses that the regulated firm can incur under the incentive mechanism. Once the cap or floor is hit the mechanism effectively defaults to pure cost of service regulation or to a renegotiation of the regulatory contract. The rationale for the use of caps and floors superimposed on to a sliding scale scheme is not immediately obvious from incentive regulation theory and is likely to have poor incentive properties around the points where the collar kicks in. The use of caps and floors is probably best thought of as a way for regulators to recognize the range of outcomes anticipated in the design of the mechanism and the associated starting values and sharing fractions that have been defined. When the caps and floors are hit this effectively triggers a renegotiation, reset or ratchet process.

18
e. Should the incentive mechanism be comprehensive or “partial?” There are multiple dimensions of firm performance defined by cost and quality indicia and the tradeoffs between them. Most regulated firms supply multiple products for which demand and cost attributes vary. There are also multiple dimensions of firm costs with different adjustment lags. Operating costs can be adjusted relatively quickly, while capital costs are often long-lived and can be economically adjusted much more slowly. Moreover, both the level and adjustment opportunities for operating costs depend upon the attributes of the legacy stock of capital and investments in new facilities and can both expand the firm’s capacity to supply particular products and affect its operating costs. Capital and operating costs are inherently interdependent with varying adjustment lags. Moreover, as a practical matter, the line between an operating cost and a capital cost may not be well defined except by clear accounting rules. A hammer that lasts for five years may be expensed while software that has a useful life of three years may be capitalized. Under some incentive regulation mechanisms this creates opportunities for gaming by expensing capital costs or capitalizing operating costs.
Ideally, a comprehensive incentive regulation mechanism that consistently
integrates all cost and quality relationships at a point of time and over time would be applied. However, as a practical matter this often places very challenging information and implementation burdens on the regulator. Partial mechanisms or a portfolio of only loosely harmonized mechanisms are often used by regulators. Operating and capital cost norms and targets are typically developed separately and the effective power of the incentive scheme applicable to operating and capital costs may vary between them. Separate incentive mechanisms may be applied to measures of quality than to measures of total operating and capital costs. This reality represents perhaps the most significant variation between received incentive regulation theory and incentive regulation in practice. IMPLEMENTATION IN PRACTICE TO ELECTRICITY AND GAS NETWORKS
a. Early applications
Although the theoretical literature on incentive regulation is fairly recent, we can trace the earliest applications of incentive regulation concepts back to the early regulation of the manufactured gas distribution sector10 (town gas) in England in the mid-19th century (Joskow and Schmalensee 1986, Hammond, Johnes, and Robinson, 2002). A sliding scale mechanism in which the dividends available to shareholders were linked to increases and decreases in gas prices from some base level was first introduce in England in 1855 (Hammond, Johnes, and Robinson, 2002 p. 255). The mechanism established a base dividend rate of 10%. If gas prices increased above a base level the dividend rate was reduced according to a sharing formula. However, if gas prices fell below the base level the dividend rate did not increase (a “one-way” sliding scale). The mechanism was
10 This is before the development of natural gas. “City gas” was manufactured from coal by local gas distribution companies. At the time there were both private and municipal gas distribution companies in operation in England.

19
made symmetric in 1867. Note that the mechanism was not mandatory and it was introduced during a period of falling prices (Hammond, Johnes, and Robinson, 2002, pp. 255-256). A related profit sharing mechanism (what Hammond, Johnes and Robinson call the “Basic Price System”) was introduced in 1920 that provided a minimum guaranteed 5% dividend to the firm’s shareholders and shared changes in revenues from a base level between the consumers, the owners of the firm and the firm’s employees. Specifically, this mechanism established a basic price pb to yield a 5% dividend rate. This dividend rate was the minimum guaranteed to the firm. At the end of each financial year the firm’s actual revenues (R) were compared to its basic revenues Rb = pb times the quantity sold. The difference between R and Rb was then shared between consumers, investors and employees, apparently subject to the constraint that the dividend rate would not fall below 5%. In the early 20th century, U.S. economists took note of the experience with sliding scale mechanisms for local manufactured gas utilities in England, but appear to have concluded that they were not well matched to the regulation of electricity and telephone service (and other sectors) where demand and technology were changing fast and future costs were very uncertain (Clark, 1913). Cost of service regulation (with regulatory lag, prudence reviews, and public planning processes) evolved initially as the favored alternative in the U.S. and other countries with private (rather than state-owned) regulated monopolies and the experience in England during the 19th and early 20th centuries was largely forgotten by both regulators and students of regulation. State public utility commissions in the U.S. began to experiment with formal performance based regulation mechanisms for electric utilities in the early 1980s. The early programs were targeted at specific components of an electric utility’s costs or operating performance such as generation plant availability, heat rates, or construction costs (Joskow and Schmalensee 1986, Sappington, et. al. 2001). Formal comprehensive incentive regulation mechanism have been slow to spread in the U.S. electric power industry (Sappington et. al. 2001), though rate freezes, rate case moratoria, price cap mechanisms and other alternative mechanisms have been adopted in many states, sometimes informally since the mid- 1990s. b. Price cap mechanisms: general considerations Beginning in the mid-1980s a particular form of incentive regulation was introduced for the regulated segments of the privatized electric gas, telephone and water utilities in the UK, New Zealand, Australia, and portions of Latin American as well as in the regulated segments of the telecommunications industry in the U.S.11 The primary (but not the only) mechanism chosen was the “price cap” (Beesley and Littlechild 1989; Brennan 1989; Armstrong, Cowan and Vickers 1994; Isaac 1991). Under price cap regulation the regulator sets an initial price po (or a vector of prices for multiple products). This price (or a weighted average of the prices allowed for firms supplying
11 The U.S. is behind many other countries in the application of incentive regulation principles to electric distribution and transmission, though their use is slowly spreading in the U.S. beyond telecommunications.

20
multiple products or different types of customers) is then adjusted from one year to the next for changes in inflation (rate of input price increase or RPI) and a target productivity change factor “x.” Accordingly, the price in period 1 is given by:
p1 = po (1+ RPI – x) 12 Typically, some form of cost-based regulation is used to set po. The price cap mechanism then operates for a pre-established time period (e.g. 5 years). At the end of this period a new starting price po and a new x factor are established after another cost-of-service and prudence or efficiency review of the firm’s costs. That is, there is a pre-scheduled regulatory-ratchet built into the system.
As discussed earlier, in theory, a price cap mechanism is a high-powered “fixed
price” regulatory contract which provides powerful incentives for the firm to reduce costs. Moreover, if the price cap mechanism is applied to a (properly) weighted average of the revenues the firm earns from each product it supplies, the firm has an incentive to set the second-best prices for each service (Laffont and Tirole 2000; Armstrong and Vickers 1991) given the level of the price cap. It is also fairly clear that pure “forever” price cap mechanisms are not optimal from the perspective of an appropriate tradeoff between efficiency incentives and rent extraction (Schmalensee 1989). In practice, price cap mechanisms apply elements of cost of service regulation, yardstick competition, high powered “fixed price” incentives, plus a ratchet. Price caps on operating costs or capital plus operating costs are often one component of a larger portfolio of incentive mechanisms. As I will show presently, the details of constructing a price cap mechanism for electric distribution and transmission networks are more complicated than is often thought. Moreover, the regulated electric or gas distribution firm’s ability to determine the structure of prices under an overall revenue cap is typically limited. Price caps applied to electricity and gas distribution and transmission are used primarily as incentive mechanism not as a mechanism to induce optimal pricing. In telecommunications, regulated firms are given more pricing freedom so price cap mechanism affect both performance incentives and pricing incentives.
It is worth noting again that in an ongoing regulated firm context, a pure “forever”
price cap without any cost-sharing ( i.e. without a sliding scale mechanism) is not likely to be optimal given asymmetric information and uncertainty about future productivity opportunities (Schmalensee 1989). Prices would have to be set too high to satisfy the firm participation constraint and too much rent with be left on the table for the firm. The application of a ratchet from time to time that resets prices to reflect observed costs is a form of cost-contingent dynamic regulatory contract. It softens cost-reducing incentives but extracts more rents for consumers in the long run.
12 Many implementations of price cap regulation also have “z” factors. Z factors reflect cost elements that cannot be controlled by the regulated firm and are passed through in retail prices. For example, in the UK, the charges distribution companies pay for connections to the transmission network are treated as pass-throughs. Changes in property tax rates are also often treated as pass-throughs.
21
A natural question to ask about price cap mechanisms is where does “x’ (and perhaps po) come from (Bernstein and Sappington 1999)? Conceptually, assuming that RPI is a measure of a general input price inflation index, x should reflect the difference between the expected or target rate of total factor productivity growth for the regulated firm and the corresponding productivity growth rate for the economy as a whole and the difference between the rate of change in the regulated firm’s input prices and input prices faced by firms generally in the economy. That is, the regulated firm’s prices should rise at a rate that reflects the general rate of inflation in input prices less an offset for higher (or lower) than average productivity growth and an offset for lower (or higher) input price inflation. Unfortunately, the theory advanced by Bernstein and Sappington is rarely applied in practice.
In early applications, the computation of x was often fairly ad hoc. The initial
application of the price cap mechanism by the Federal Communications Commission (FCC) to AT&T’s intercity and information services used historical productivity growth and added an arbitrary “customer dividend” to choose an x that was larger than the historical rate of productivity growth. However, the expectation here was that the need for regulation would be transitory and would be phased out for AT&T’s services as competition expanded. In England and Wales and some other countries, statistical benchmarking methods have come to be used to help to determine the relative efficiency of individual firms’ operating costs and service quality compared to their peers. This information can then be used as an input to setting values for both po and x (Jamasb and Pollitt, 2001, 2003, OFGEM 2004c) to provide incentives for those far from the efficiency frontier to move toward it and to reward the most efficient firms in order to induce them to stay on the efficiency frontier, in a fashion that is effectively an application of yardstick regulation. A variety of empirical methods have been applied to identify an operating cost efficiency frontier and to measure how far from this operating cost efficiency frontier individual regulated firms lie. The value for x is then defined in such a way as to move the firms to the frontier over a pre-specified period of time (e.g. five years). These methods have recently been expanded to include quality of service considerations (Giaanakis, Jamasb and Pollitt 2004). Benchmark rankings of relative performance may change significantly when quality attributes are introduced. Accordingly benchmarking cost and quality as separable attributes is clearly problematic. The extensive use of periodic “ratchets” or “resets to cost” along with price cap mechanisms reflect the difficulties of defining a fixed long-term value for po and x ex ante and the standard tradeoffs between efficiency incentives, rent extraction and firm viability constraints. These periodic ratchets necessarily dull incentives for cost reduction, however. Note in particular that with a pre-defined five year ratchet, a dollar of cost reduction in year one is worth a lot more than a dollar of cost reduction in year four since the cost savings are retained by the firm only until the next reset anniversary (OFGEM 2004a, 2004e, 2004f). Although it is not discussed too much in the empirical literature, the development of the parameters of price cap mechanisms using statistical benchmarking methods have typically focused primarily on operating costs only, with capital cost allowances
22
established through more traditional utility planning and cost-of-service regulatory accounting methods including the specification of a rate base (regulatory asset value or RAV), depreciation rates, debt and equity costs, debt/equity ratios, tax allowances, etc.. Since operating costs for distribution networks are often a smaller fraction of total costs than are capital-related costs, the focus on operating costs (or so-called “controllable costs”) is potentially misleading. In addition, it is widely recognized that a pure price cap mechanism provides incentives to reduce both costs and the quality of service (Banerjee 2003). Accordingly, price cap mechanisms are increasingly accompanied either by specific performance standards and the threat of regulatory penalties if they are not met or formal PBR mechanisms that set performance standards and specify penalties and rewards for the firm for falling above or below these performance norms (OFGEM 2004d, 2004f; Sappington 2003; Ai and Sappington 2004; Ai, Martinez and Sappington 2004).
c. The Basic Price Cap Mechanism for Electric Distribution Companies in the
UK Today
There are 14 electric distribution companies in the UK, several of which are under common ownership within a holding company structure. These companies, which are referred to as Regional Electricity Companies or RECs, provide delivery services in specific geographic franchise areas to transport electricity from points of interconnection with the high voltage transmission network to points of interconnection with final consumers. Their total revenues and the associated prices for using their networks are regulated by the UK Office of Gas and Electricity Markets (OFGEM). The distribution companies themselves provide only delivery services and do not contract to buy or produce electricity for resale to final customers, a competitive function referred to as “electricity supply” in the UK, though they may have functionally separated or “ring fenced” supply affiliates which do so. The primary mechanism used to determine the total revenues that a regulated electricity distribution firm is permitted to recover from its prices for delivery service (the allowed revenue and associated average price level) is a price cap mechanism that sets an initial starting value for revenues (po), specifies an exogenous input price index for adjusting revenues for input price inflation and the associated price levels over time (RPI), and a productivity factor “x” which further adjusts revenues and profits over time. The value for x can be either positive or negative or zero. The regulatory framework establishes values for po, x, and the relevant RPI index once every five years. The po and x values are developed based on a review of the relative efficiency of each firm’s operating costs, the firm’s current capital rate base (adjusted for depreciation and inflation since the previous price review), referred to as the firm’s regulatory asset value (RAV), forecasts of future capital additions required to provide target levels of service quality, and the application of depreciation rates, estimates of the cost of the firm’s debt and equity capital, assumptions about the firm’s dept/equity ratio, tax allowances and other variables. The allowed revenues for the firm over the 5-year period are then the sum of allowed operating costs and allowed capital costs determined in each

23
year. Po and x are chosen so that the present discounted values of revenues over the five-year period is equal to the present discounted value of the total operating and capital-related charges that have been allowed for each distribution company during the price review. The choice of the specific values for po and x that satisfies this present discounted value property is a matter of judgment (OFGEM 2004f). Historically, this choice was driven by the notion that the regulated firms should be given some time to achieve reductions in operating costs to the efficient benchmarked level, leading to a relatively high initial value for po and a value of x that brings operating costs to their efficient levels over the period the price cap is in effect. OFGEM appears to have abandoned this “glide path” approach in the most recent price review for electric distribution companies (2004), perhaps because the initial value of po would have otherwise increased significantly as a result of a large increase in target investment expenditures (OFGEM 2004f).
Because the overall price cap covers both capital and operating costs, the ultimate
value of x depends on both the target efficiency improvements in operating costs and the forecast carrying charges on the existing RAV plus the carrying charges on allowed levels for future investments over the 5-year price control period. So, for example, real operating costs may be targeted to fall over time, implying a value of x in the RPI-x formula of say 1.5% per year. However, if capital-related costs are forecast to increase by 1.5% per year, the value of x used in the price cap mechanism over the five year period would be negative (yielding trajectory of increasing real prices) since capital-related charges including taxes are typically about double allowed operating costs for a UK electric distribution company.
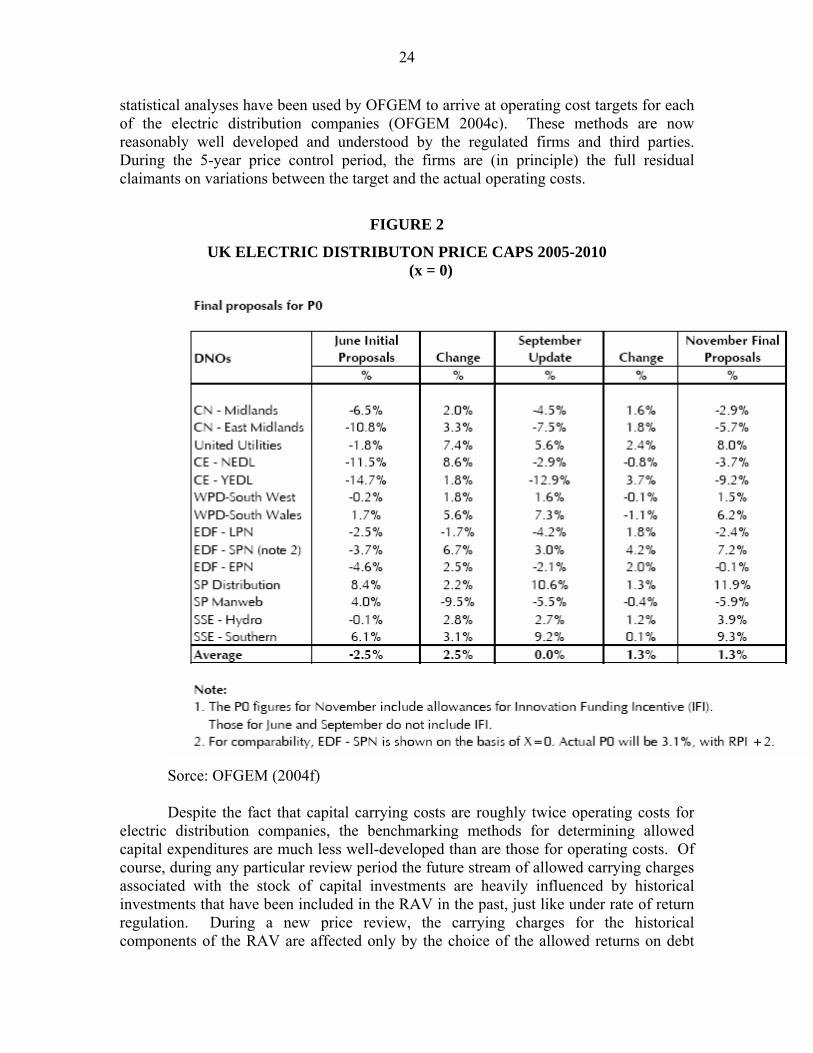
In the most recent review of prices for electric distribution companies, each firm’s
price cap was set so that the value of x is zero. Accordingly, prices will rise based on changes in RPI only. As can be seen from Figure 2, there was a large range in the change in po allowed at the beginning of the new price control period among the 14 distribution companies (- 9% to +9%) with an average increase of po of 1.3% from levels prevailing at the end of the last price review period (OFGEM 2004c). Figure 2 also summarizes the negotiation process that led to the final proposals. Accordingly, for each distribution company the initial level of allowed total revenues will increase with the rate of inflation with po set for each company so that the present discounted value of future revenues is equal to the present discounted value of the sum of target operating and capital costs over the 5-year period. The choice of a zero value for x does not imply that there are no improvements in operating cost efficiency built into the mechanism. The target improvements in operating costs are built into the total allowed cost forecasts and are reflected in the choice of po given OFGEM’s decision to have a flat real price trajectory over the next 5-year price period. OFGEM may have decided to “smooth” the real price increase implied by the large increase in investment approved for the next price period. This is discussed further below.
Since there are 14 distribution companies in the UK, the opportunity to perform
statistical analyses of how operating costs vary with various causal factors and to estimate variations in efficiency across firms readily presents itself. A variety of
24
statistical analyses have been used by OFGEM to arrive at operating cost targets for each of the electric distribution companies (OFGEM 2004c). These methods are now reasonably well developed and understood by the regulated firms and third parties. During the 5-year price control period, the firms are (in principle) the full residual claimants on variations between the target and the actual operating costs.
FIGURE 2
UK ELECTRIC DISTRIBUTON PRICE CAPS 2005-2010 (x = 0)
Sorce: OFGEM (2004f)
Despite the fact that capital carrying costs are roughly twice operating costs for electric distribution companies, the benchmarking methods for determining allowed capital expenditures are much less well-developed than are those for operating costs. Of course, during any particular review period the future stream of allowed carrying charges associated with the stock of capital investments are heavily influenced by historical investments that have been included in the RAV in the past, just like under rate of return regulation. During a new price review, the carrying charges for the historical components of the RAV are affected only by the choice of the allowed returns on debt

25
and equity and the debt/equity ratio assumed for each firm, as well as any changes in depreciation rates. During a new price review, however, future capital investments are still a variable cost that can be influenced by the capital expenditure allowances approved by the regulator and built into the future allowed capital carrying charges. Accordingly, much of the focus of the price review is on the approval of a target capital expenditure schedule for the next five-year period. Future investments in capital facilities do not have an insignificant effect on future costs and prices, especially in light of the fact that in the latest price review OFGEM was presented with increases in capital expenditures that averaged over 50% more than had been approved for the previous 5-year price period (OFGEM 2004c, 2004f).
Formal statistical benchmarking studies of the type that are now applied to
operating costs (so-called “controllable costs”) have not been applied to determine allowed investment costs over the next price cap period for each electric distribution company. The appropriate investment program may vary widely depending on variables like customer growth rates, load growth rates, equipment ages and replacement expenditures, underground vs. above ground facilities, service quality improvement needs, etc., with little necessary relationship to recent historical trends. Indeed, the rate of investment in electricity network infrastructure has historically been quite cyclical. As a result, it has proven difficult to develop useful statistical benchmarks for future capital additions. Instead, each of the regulated firms presents a proposed capital investment budget to the regulator and the regulator retains engineering consultants to evaluate the proposals and takes evidence from third parties which use the distribution networks as well. This has historically been a rather contentious process, sometimes yielding significant differences between what the companies claim they need and what the consultants claim they need to meet their legal responsibilities to provide safe and reliable service efficiently.
Regulatory judgments about allowances for future capital expenditures has
become a more sensitive issue for regulators in the UK (and the US) as reliability considerations have become of greater political importance, as excess capacity has been squeezed out of the legacy capital stock, and as the large amount of infrastructure investment made in the 1950s and 1960s reaches the end of its useful life. In the most recent price review in 2004 OFGEM adopted an innovative “menu” of sliding scale mechanisms approach to resolve the asymmetric information problem faced by the regulator as she tries to deal with differences between the firms’ claims and the consultants’ claims (OFGEM 2004f) about future capital investment requirements to meet reliability targets. The sliding scale menu allows firms to choose between getting a lower capital expenditure allowance but a higher powered incentive (and a higher expected return on investment) that allows them to retain more of the cost reduction if they can beat the target expenditure levels or a higher capital expenditure allowance combined with a lower powered sliding scale mechanism and lower expected return. (OFGEM 2004f) The sliding scale mechanism is based on the difference between the allowed capital expenditure target chosen by the firm from the menu and the firm’s actual capital expenditures during the 5-year price cap period.

26
The menu of sliding scale incentives is reproduced as Figure 3 below. The values for the sharing fractions are based on the ratio of the distribution company’s (DNO) choice of capital expenditure target and that recommended by OFGEM’s consultant (PB Power). These ratios vary between 100 and 140. For example, in Figure 3 if a firm agrees to accept a capital expenditure budget equal to 105% of the consultant’s recommendation (PB Power = 100 in Figure 3) it would also be choosing the sliding scale in the first column. It would get a base bonus of 2.5% of its target income. If it’s actual expenditures turned out to be 70% of the target (through efficiencies) during the price control period it would get a 16.5% increase in its income as a reward. If it greatly exceeds the target and has realized capital expenditures of 140% of the target than its income is reduced by 11.5% from the target.
This is the most direct and extensive application of Laffont and Tirole’s menu of
cost-contingent contracts result that I have seen. However, it appears to be the case that the sliding scale scheme for capital expenditures is integrated into the price cap mechanism in a way that appears to make the power of the incentive scheme for capital expenditures appears to be different from the power of the incentive scheme applied to operating costs.
FIGURE 3
SLIDING SCALE MATRIX FOR CAPITAL EXPENDITURE ALLOWANCE
Source: OFGEM 2004f, p.87
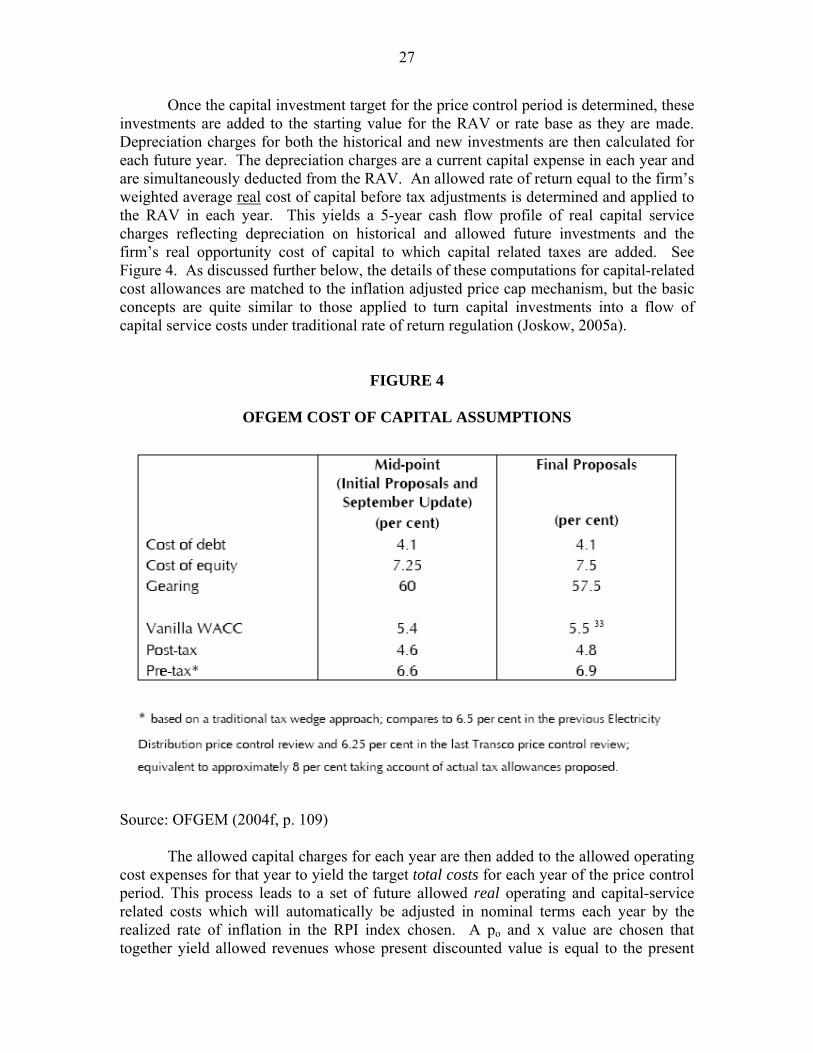
27
Once the capital investment target for the price control period is determined, these investments are added to the starting value for the RAV or rate base as they are made. Depreciation charges for both the historical and new investments are then calculated for each future year. The depreciation charges are a current capital expense in each year and are simultaneously deducted from the RAV. An allowed rate of return equal to the firm’s weighted average real cost of capital before tax adjustments is determined and applied to the RAV in each year. This yields a 5-year cash flow profile of real capital service charges reflecting depreciation on historical and allowed future investments and the firm’s real opportunity cost of capital to which capital related taxes are added. See Figure 4. As discussed further below, the details of these computations for capital-related cost allowances are matched to the inflation adjusted price cap mechanism, but the basic concepts are quite similar to those applied to turn capital investments into a flow of capital service costs under traditional rate of return regulation (Joskow, 2005a).
FIGURE 4
OFGEM COST OF CAPITAL ASSUMPTIONS
Source: OFGEM (2004f, p. 109)
The allowed capital charges for each year are then added to the allowed operating cost expenses for that year to yield the target total costs for each year of the price control period. This process leads to a set of future allowed real operating and capital-service related costs which will automatically be adjusted in nominal terms each year by the realized rate of inflation in the RPI index chosen. A po and x value are chosen that together yield allowed revenues whose present discounted value is equal to the present

28
discounted value of allowed costs. As noted earlier, in the most recent price review OFGEM chose to set x to zero which has the effect of “backloading” the revenues toward the end of the price review period. An example of what the various operating and capital cost components look like for one distribution company (United Utilities) is displayed in Table 1.
TABLE 1
ALLOWED 2005 COSTS (YEAR 1) FOR ONE UK DISTRIBUTION COMPANY
£millions
Operating costs: 67.0 Change in po = +8.0%
Capital charges: 103.5 x = 0
Tax allowances: 16.0
Capex incentives: 3.4
Opex incentives: 1.4
Pensions: 16.0
Other: 1.5
TOTAL 212.3
Source: OFGEM 2004f, p. 127.
There are a number of issues that have not been fully resolved in this price setting and incentive mechanism specification process. First, as already noted, the 5-year ratchet potentially leads to differential incentives for cost reduction depending on how close the firm is to the next price review. OFGEM has indicated that it is aware of this problem and is committed to allowing firms to keep the benefits of “outperformance” (and presumably the costs of underperformance) for a full five years regardless of when during the 5-year review period the outperformance actually occurs. For capital expenditures, OFGEM has adopted a formula for rolling adjustments in the value of capital assets used for regulatory purposes (regulatory asset value or RAV) so that outperformance or underperformance incentives and penalties are reflected in prices for a five-year period. Although OFGEM has made a commitment to allow operating cost (OPEX) savings to be retained for five years, it did not adopt a formal rolling OPEX adjustment mechanism in the latest price review do to imperfections in the operating cost accounting and reporting protocols that now exist (OFGEM 2004f). OFGEM has started a process to develop a better uniform system of accounts and reporting requirements to facilitate improvements in the incentive regulation mechanisms.

29
A second set of issues involves potential asymmetries between the treatment of operating costs and capital costs. The power of the incentive schemes for operating costs and capital costs appears to be different for at least two reasons. First, the sliding scale mechanism applies to capital cost variations but not operating cost variations. In addition, there is not a well defined line between what is an operating cost that is expensed in a single year and what costs can be capitalized. The firms may have incentives to capitalize operating costs to beat the OPEX incentives during the current review period in the hope that they will be included in the RAV during the next review period. OFGEM is making efforts to better define rules for capitalizing expenditures to deter this kind of gaming. Finally, when there is capital cost overspending the firm gets another crack to recover at least the undepreciated portion of these expenditures beginning in the next price review. Capital expenditures have lives that are typically much longer than the five year review period. How should capital expenditures that exceed or fall short of targets be treated in the next price review? Ordinarily these variances in capital expenditures may be handled through the incentive mechanism discussed above, including the impact of the rolling RAV calculation. However, firms can try to make the case that overspending was justified and get it fully included in the next price review and OFGEM may claw back benefits of underspending that was due to reductions in service rather than efficiencies. Obviously, these adjustments may be quite subjective and need to be evaluated on a case by case basis.
A third set of issues relates to incentives to reduce both operating and capital costs
today to increase profits during the current price control period, but with the result that service quality deteriorates either during the current review period or in subsequent periods. Deferred maintenance (e.g. tree trimming) and deferred capital expenditures may lead to the deterioration of service quality in either the short run or the long run or both. Regulated firms may hope that they can use adverse service quality trends to argue for higher allowances for operating and capital costs in future price reviews. The UK regulatory process tries to deal with the relationships between operating and capital cost expenditures and service quality in two ways. First, there are service quality performance norms and incentives that I will discuss presently. Second, OFGEM reserves the right to “claw back” capital cost savings if they are clearly not the result of efficiencies but rather reflect efforts to cut services in the short run or the long run. This is not an ideal approach since operating expenditures, capital expenditures and service quality are related in complex ways over time and space. Indeed it sounds like “prudence reviews” that are a component of traditional cost of service regulation in the U.S. Moreover, operating cost benchmarking studies that do not take service quality and the quality of the capital stock into account can lead to misleading conclusions (Giannakis, Jamasb and Pollitt 2004).
There is a final issue involving capital cost accounting that has been addressed
properly in the UK, but not in all countries that have implemented price cap mechanisms. When a price cap mechanism (RPI – x) is applied to capital costs, the calculation of the amortization formula for capital (depreciation, rate of return on investment) and the valuation of the capital stock (rate base or RAV) need to be done in a particular way to ensure that there is not over or underpayment for capital services over the lives of capital

30
investments. Specifically, at the time of a price review the RAV (original cost of capital investments less depreciation) should be adjusted for inflation that has occurred since the last price review and the allowed rate of return on the RAV during the price review period should be based on the real cost of debt and equity capital net of taxes, with tax allowances then added back in. Since prices are based on both operating and capital costs, the RPI - x formula essentially yields a nominal return equal to the real cost of capital plus the rate of inflation. Capital related charges rise with the rate of inflation in this case and this is consistent with the RAV rising with the rate of inflation, together yielding an approximation to the economic depreciation rate (depending exactly on how the depreciation rates are set; Joskow 2005a, Schmalensee 1989a). Simply bolting a price cap mechanism on to the capital cost accounting formulas used in the U.S. (Joskow 2005a) would lead to the wrong result since regulated prices in the U.S. are based on the nominal cost of capital and a depreciated original cost rate base (RAV) that is not adjusted for inflation.
d. Service Quality Incentives for Electric Distribution Companies in the UK and
the U.S. 13
Any incentive regulation mechanism that provides incentives only for cost
reduction also potentially creates incentives to reduce service quality when service quality and costs are positively related to one another. The regulatory mechanisms developed for electric distribution companies in the UK have included an additional set of incentive mechanisms to provide incentives for the regulated firms to maintain or enhance service quality. Adding quality-related incentives to cost-control incentives makes good sense in theory and in practice. However, integrating these incentive mechanisms into a package that gives the correct incentives on all relevant margins remains a considerable challenge for incentive regulation in practice. OFGEM has developed several incentive mechanisms targeted at various dimensions of performance. These include: (a) two distribution service interruption incentive mechanisms targeted at the number of outages and the number of minutes per outage, (b) storm interruption payment obligations targeted at distribution company response times to outages caused by severe weather events, (c) quality of telephone responses during both ordinary weather conditions and storm conditions, (d) and a discretionary award based on surveys of customer satisfaction. Overall, about 4% of total revenue on the downside and an unlimited fraction of total revenue on the upside are subject to these quality of service incentive mechanisms. See Figure 5. Is this the right allocation of financial risk to variations in service quality? Nobody really knows.
13 The UK has also applied incentive arrangements for distribution system losses that I will not discuss here.

31
FIGURE 5
REVENUE EXPOSURE TO QUALITY OF SERVICE VARIATIONS
Source: OFGEM 2004f, page 16.
OFGEM uses statistical and engineering benchmarking studies and forecasts of planned maintenance outages to develop targets for the number of customer outages and the average number of minutes per outage for each distribution company. The individual distribution companies are disaggregated into different types (e.g. voltages) of distribution circuits and performance benchmarks and targets are developed for each based on comparative historical experience and engineering norms. Aggregate performance targets for each distribution company are then defined by re-aggregating the targets for each type of circuit (OFGEM (2004c) appendix to June 2004 proposals) to match up circuits that make up each electric distribution company. Both planned (maintenance) and unplanned outages are taken into account to develop the outage targets. The targets incorporate performance improvements over time and reflect, in part, customer surveys of the value of improved service quality. There is a fairly wide range in the targets among the 14 distribution companies in the UK, reflecting differences in the configurations of the networks. OFGEM also has added cost allowances into the price control (po) to reflect estimates of the costs of improving service quality in these dimensions. See Figures 6 and 7.

32
FIGURE 6
TARGETS FOR AVERAGE NUMBER OF CUSTOMER INTERUPTIONS BY DISTRIBUTION COMPANY AND YEAR
Source: OFGEM 2004f, p.17
FIGURE 7
TARGETS FOR AVERAGE CUSTOMER MINUTES LOST BY DISTRIBUTION COMPANY AND YEAR
Source: OFGEM 2004f, p. 17

33
Once the performance targets are set, a financial penalty/reward structure needs to be applied to it to transform the physical targets into financial penalties and rewards. The natural approach would be to apply estimates of the value of outages and outage minutes to customers (OFGEM surveys indicated customers valued reducing the number of minutes per outage more than the number of outages) to define prices for outages and outage duration. OFGEM did not take this approach in the most recent distribution company price review. Instead it developed prices for outages and outage duration by taking the target revenue at risk and dividing it by a performance band around the target (25% and 30% respectively). This approach seems rather arbitrary and yields a fairly wide variation in the effective price per outage and the price per minute of outage across distribution companies. See Figure 8.
OFGEM has also adopted a storm restoration compensation incentive mechanism.
The distribution companies are given incentives to restore service within a specified time period and if they do not they must pay compensation to customers as defined in the incentive mechanism. The mechanism includes adjustments for exceptional events. Under normal weather conditions customers are eligible to be paid £50 pounds for an interruption that lasts more than 24 hours (£100 for non-domestic) and a further £25 for each subsequent 12-hour period. It is not clear where the values for these payments come from. If a customer consumes 20 kWh per day (600 kWh per month) the implied value of lost load is £2.5 per lost kWh or roughly $5000/Mwh of lost energy. Alternative compensation arrangements are applied when there are severe weather conditions. Both
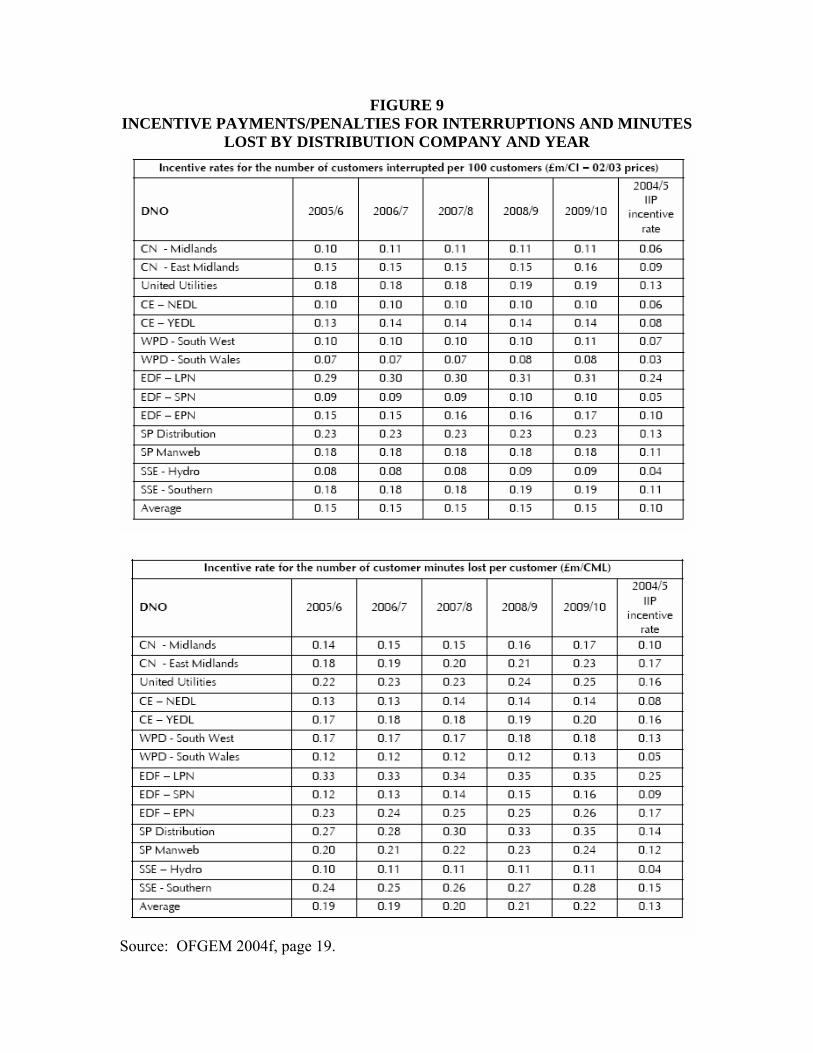
FIGURE 9 INCENTIVE PAYMENTS/PENALTIES FOR INTERRUPTIONS AND MINUTES
LOST BY DISTRIBUTION COMPANY AND YEAR
Source: OFGEM 2004f, page 19.

35
FIGURE 9
SEVERE WEATHER INCENTIVES
OFGEM 2004f, p.28
the triggers and the compensation change. The trigger periods for compensation are defined below and the amount of compensation starts at £25 when the trigger is hit with a cap of £200 per customer. See Figure 9. Finally, there are penalties and rewards for the quality of telephone service. These are based on the results of customer surveys. e. Service Quality Incentives in Massachusetts As price cap mechanisms of one type or another are introduced in the United States, quality of service incentives are beginning to get more attention. The Massachusetts Department of Telecommunications and Energy (DTE) has developed and applied quality of service performance criteria and incentives to electric distribution companies under its jurisdiction (DTE, 2001). The service quality (SQ) mechanism applied to Massachusetts Electric Company is an example. See Figure 10. It covers frequency and duration of outages as in the UK, five attributes of customer service and workplace safety. The benchmarks are developed based on historical experience and penalties and rewards are triggered when actual performance falls outside of one standard deviation of historical performance. This effectively leads to a “dead-band” around historical performance. There are also caps and floor on the incentive arrangements. See Figure 12.
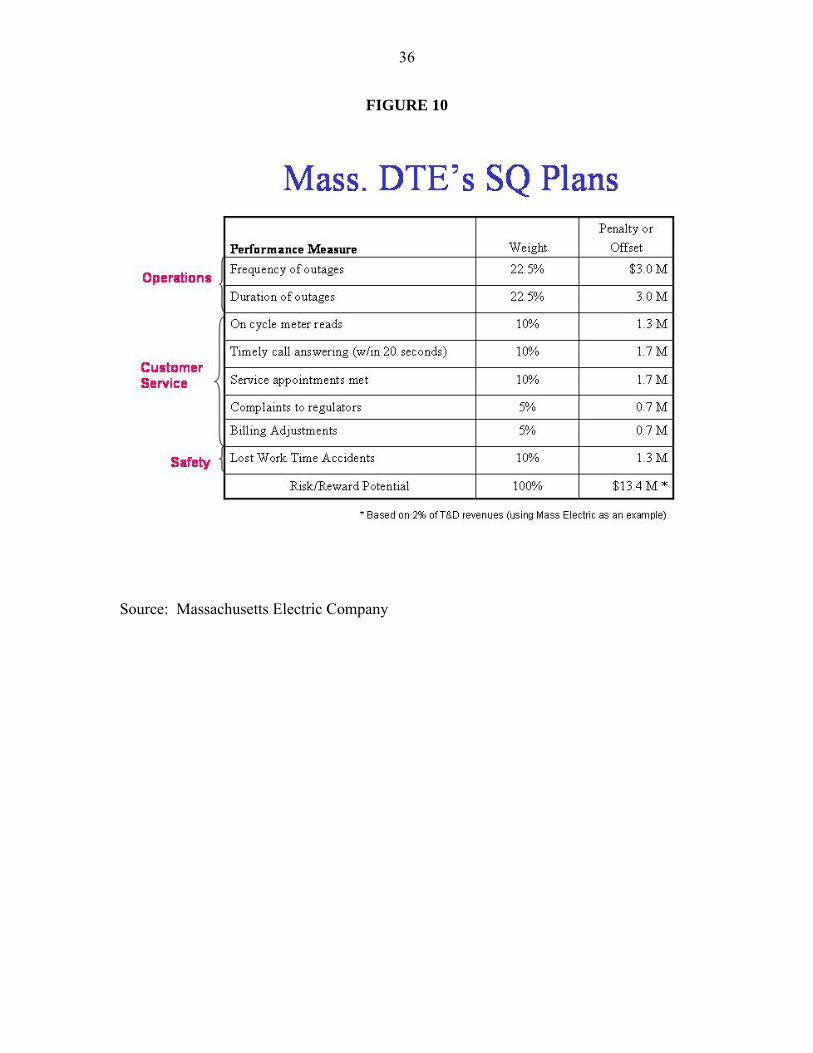
36
FIGURE 10
Source: Massachusetts Electric Company

37
FIGURE 11
Source: Massachusetts Electric Company
f. Electricity Transmission: Regulation of the National Grid Company (NGC) in
England and Wales
The application of incentive regulation mechanisms to local electricity and gas distribution companies, water utilities, and local telephone companies is gaining acceptance around the world. However, these concepts have rarely been applied to the owners of electric transmission networks. The regulation of the National Grid Company (NGC) in England and Wales is one of the few examples.14 The regulatory mechanisms used to regulate NGC are conceptually similar to those used to regulate the UK distribution companies. And, as with the UK distribution companies, the regulatory mechanisms have evolved over time as experience has been gained with them and with NGC’s performance in response to them.
When the electricity sector was privatized and restructured in England and Wales
in 1990, a separate transmission company – the National Grid Company (NGC) -- was
14 Argentina has also applied incentives of various kinds to the owners of the high voltage transmission networks in the country (Pollitt 2004).

38
created to own, maintain, operate and invest in the England and Wales transmission network. It was originally owned by the distribution companies but was spun off as an independent company in 1995. NGC is subject to regulation by OFGEM. Separate but compatible incentive regulation mechanisms are applied to the transmission owner (TO) and system operating functions (SO). These regulatory mechanisms effectively yield values for the target revenues NGC is permitted to earn from charges made to generators, electricity suppliers and distribution companies for transmission service and system operations. These mechanisms define the aggregate revenues that NGC is allowed to earn in each period --- the incentive mechanism defines the average price level for transmission service.
The allowed aggregate revenues determined through the regulatory process are
then be recovered through a set of prices for the services provided by NGC. Transmission customers (generators and retail suppliers) pay NGC for the aggregate operating and capital costs allowed for the transmission network defined by the basic incentive mechanism pursuant to a regulated tariff. 15 The tariff has two basic components. The first is a “shallow” connection charge that allows NGC to recover the capital (depreciation, return on investment, taxes, etc) and operating costs associated with the facilities that support each specific interconnection (now using the “Plugs” methodology). The second component of the transmission tariff is composed of the Transmission Network Use of System Charges (TNUoS). (NGC 2004a,b,c). The SO revenues defined by the SO incentive mechanism are then recovered as surcharges on the price of energy delivered to each transmission customer, reflecting variations in these charges at different points in time.
Thus, the general level of charges are set to allow NGC to recover its cost-of-
service based “revenue requirement” or “allowed revenues” as adjusted through the incentive regulation mechanism that I will discuss presently. The structure of the TNUoS charges provides for price variation by location on the network based upon (scaled) differences in the incremental costs of injecting or receiving electricity at different locations as specified in the Investment Cost Related Pricing Methodology. The regulator determines the structure of the charges whose level is adjusted each year to yield NGC’s allowed aggregate revenues. The objective of this pricing mechanism is stated to be: “… efficient economic signals are provided to Users when services are priced to reflect the incremental costs of supplying them. Therefore charges should reflect the impact that Users of the transmission system at different locations would have on National Grid’s costs, if they are to increase or decrease their use of the system. These costs are primarily defined as the investment costs in the transmission system, maintenance of the transmission system and maintaining a system capable of providing a secure bulk supply of energy.” (NGC 2004a,b,c). So, for example, generators pay significantly higher transmission service costs in the North of England than in the South (where the prices may be negative) because there is congestion from North to South and “deep” transmission network reinforcements are more likely to be required to accommodate new generation added at various locations in the North but not in the
15 http://www.nationalgrid.com/uk/ click “charging”.

39
South.16 Similarly, load in the South pays more than load in the North because transmission enhancements to increase capacity from constrained generation export areas benefits customer in the South more than those in the North.
Unlike the assumption reflected in some of the theoretical work on price cap
regulation, NGC is not free to adjust the price structure independently. Indeed, this freedom is rarely given to electric transmission and distribution companies subject to price cap regulation. Accordingly, as with the distribution companies in the UK, price caps are used primarily as mechanisms to provide incentives for cost reduction by giving the regulated firm a budget constraint that (for some time period) is exogenous, not to give the firm the freedom to set the optimal price structure.
Finally, in its role as system operator or SO, NGC has an obligation to balance the
supply and demand for energy in the system in real time (energy balancing) and to meet operating reliability criteria (system balancing). These costs include the net costs NGC incurs to buy and sell power in the balancing market (or through short-term bilateral forward contracts) to balance supply and demand at each location, including to manage congestion, provide ancillary services, and other actions it must take to meet the network’s operating reliability standards, and system losses. These costs are recovered from system users through an “uplift” charge based (mediated through an incentive regulatory mechanism discussed further below) on the quantities of energy supplied to or taken from the network at various points in time. The regulatory framework for determining the revenues that NGC can recover through the Use of System charges and the energy and system balancing charges is based on a set of incentive regulation mechanisms that have evolved over time. The primary mechanism covering NGC’s TO costs and charges is a price cap that is developed using methods that are similar to those used for the UK electric distribution companies. This mechanism has a cost-of-service base, a performance-based incentive, and a ratchet that resets prices from time to time to reflect NGC’s realized or forecast costs. A base annual aggregate “allowed revenue” for use of system charges is established at the beginning of each five year “price review” period (though the latest period is being extended to seven years by mutual agreement on NGC and the regulator) in much the same way as for the distribution companies discussed above. As for the distribution companies, the accounting for operating costs and capital costs are different. For capital costs a rate base (regulatory assets value or RAV) is defined that is composed of the depreciated original cost of existing assets that make up the transmission system inflated to reflect inflation since the assets were installed. The forecast cost of incremental capital expenditures budgeted for next five years to meet NGC’s interconnection and system security criteria are added to the RAV. The final capital investment budget is determined by OFGEM through a public consultation process and reports by experts retained by OFGEM. Depreciation rates are then applied to the RAV each year to develop a depreciation component of the user charge for capital and deducted from the RAV. A
16 “Deep” transmission network reinforcements refer to reinforcements of the core network that serves large groups of generators and demand points as opposed to facilities that connect a single generator or small group of generators to the core network.
40
real cost of debt and equity capital and a debt/equity ratio are defined and applied to the RAV to yield the allowed rate of return component of capital charges for each year of the price control period. The values for allowable O&M expenditures during the future price control period are defined and added to each year’s capital charges (depreciation, allowed rate of return on investment, and capital related taxes). A target rate of productivity improvement in operating costs --- the “x” factor --- is included in the forecast of allowable real operating costs, or alternatively, the year one allowed operating costs are adjusted by the x factor chosen by OFGEM, in addition to the RPI inflation adjustment over time. Statistical benchmarking is very difficult for transmission networks. There is only one transmission network in England and Wales. The composition of a particular transmission network depends on many variables, including the distribution of generators and load, population density, geographic topography, the attributes and age of the legacy network’s components and various environmental constraints affecting siting of new lines, transformers and substations. Comparable cost and performance data are also not collected across transmission networks. Indeed there is no standardization of where the transmission network ends and the distribution network begins. In the UK, the transmission network includes network elements that operate at 270kv and above. In the U.S. and France transmission includes network elements that operate down 60kv. Thus, “transmission” includes different types of facilities with different costs and different performance attributes in these two sets of countries. Benchmarking one against the other would not be very meaningful. In the U.S. there is no systematic collection of data on transmission network performance measures (U.S. Energy Information Administration 2004). Accordingly, opportunities for relying on statistical benchmarking are not yet available in the U.S. because the necessary data are not collected and the value of x is determined through a regulatory consultation process rather than through statistical benchmarking studies based on NGCs forecasts of O&M requirements, wage escalation, and various engineering studies of the physical needs of the network and the costs of alternative methods to respond to them performed for OFGEM by independent consultants. Transmission service customers participate in this consultation process as well. (I suppose that the phrase “consultation process” sounds better than “rate case,” but they are effectively the same animals.) The allowed operating and capital cost values are expressed at the price levels prevailing at the time the price review is complete and then are escalated automatically during the price control period according to the RPI. Unbudgeted capital expenditures during the price review period can be considered in the next price review, though NGC may be at risk for amortization charges during the period between reviews. Underspending on capital may also be considered in next price review and adjustments made going forward. After a five year (or longer) period another price review is commenced, the starting price is reset to reflect then-prevailing costs, and new adjustment parameters defined for the next review period.17
17 There is also an incentive regulation mechanism that governs network losses that involves annual adjustments in the benchmark.
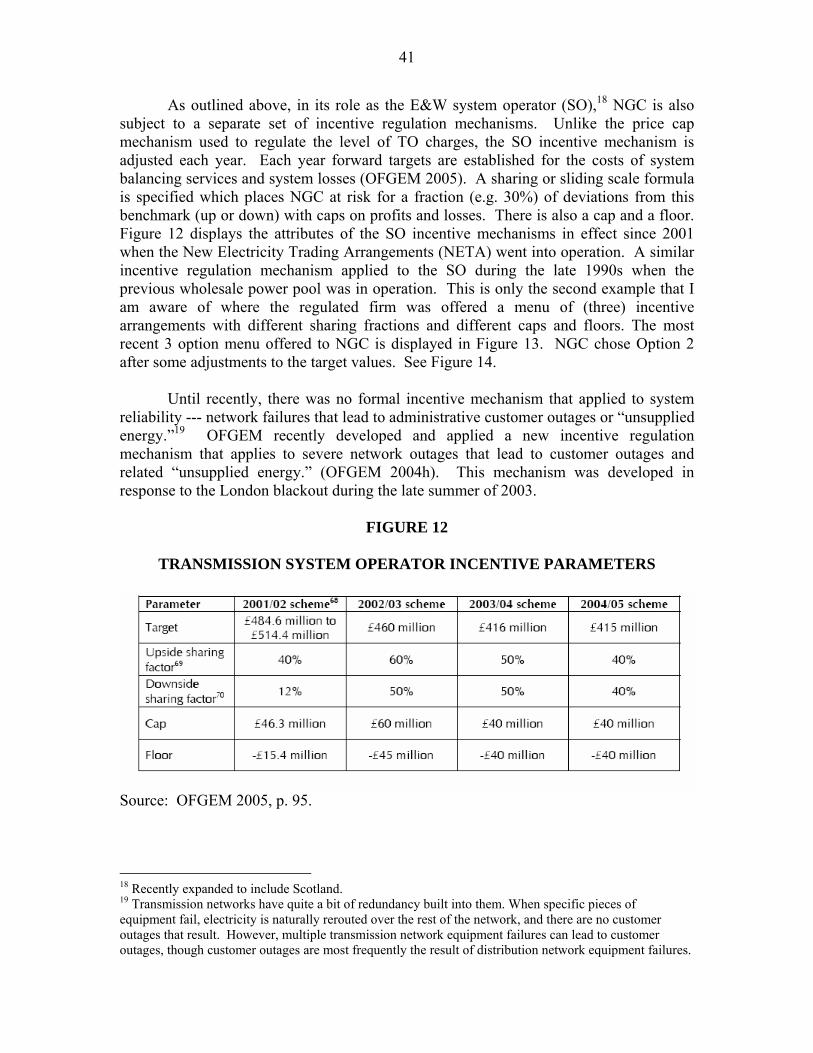
41
As outlined above, in its role as the E&W system operator (SO),18 NGC is also subject to a separate set of incentive regulation mechanisms. Unlike the price cap mechanism used to regulate the level of TO charges, the SO incentive mechanism is adjusted each year. Each year forward targets are established for the costs of system balancing services and system losses (OFGEM 2005). A sharing or sliding scale formula is specified which places NGC at risk for a fraction (e.g. 30%) of deviations from this benchmark (up or down) with caps on profits and losses. There is also a cap and a floor. Figure 12 displays the attributes of the SO incentive mechanisms in effect since 2001 when the New Electricity Trading Arrangements (NETA) went into operation. A similar incentive regulation mechanism applied to the SO during the late 1990s when the previous wholesale power pool was in operation. This is only the second example that I am aware of where the regulated firm was offered a menu of (three) incentive arrangements with different sharing fractions and different caps and floors. The most recent 3 option menu offered to NGC is displayed in Figure 13. NGC chose Option 2 after some adjustments to the target values. See Figure 14. Until recently, there was no formal incentive mechanism that applied to system reliability --- network failures that lead to administrative customer outages or “unsupplied energy.”19 OFGEM recently developed and applied a new incentive regulation mechanism that applies to severe network outages that lead to customer outages and related “unsupplied energy.” (OFGEM 2004h). This mechanism was developed in response to the London blackout during the late summer of 2003.
FIGURE 12
TRANSMISSION SYSTEM OPERATOR INCENTIVE PARAMETERS
Source: OFGEM 2005, p. 95.
18 Recently expanded to include Scotland. 19 Transmission networks have quite a bit of redundancy built into them. When specific pieces of equipment fail, electricity is naturally rerouted over the rest of the network, and there are no customer outages that result. However, multiple transmission network equipment failures can lead to customer outages, though customer outages are most frequently the result of distribution network equipment failures.

42
FIGURE 13
MENU OF SO INCENTIVE CONTRACTS FOR 2005-06
Source: OFGEM 2005, Summary, page 3.
FIGURE 14
FINAL SYSTEM OPERATOR INCENTIVE SCHEME 2005-06
Source: OFGEM 2005, Summary, page 5.

43
In 2005, a new incentive mechanism that focuses on the reliability of the transmission network as measured by the quantity of “unsupplied energy” resulting from transmission network outages went into effect (OFGEM 2004h). This mechanism was introduced following the 2003 London blackout. NGC is assessed penalties or received rewards when outages fall outside of a “deadband” of +/- 5% defined by the distribution of historical outage experience (and with potential adjustments for extreme weather events), using a sliding scale with a cap and a floor on the revenue impact. This new mechanism is displayed in Figures 15 and 16. The incentive structure is consistent with a value of unsupplied energy of £33,000/Mwh, though OFGEM indicated that it did not derive the incentive structure from an estimate of the value of lost energy, but rather to stimulate managerial attention in what is designed to be an interim incentive mechanism (OFGEM 2004h, p.8, 20). OFGEM argued that it is very difficult to come up with accurate measures of the value of lost energy. Nor does the mechanism provide for compensation to customers affected by outages that trigger penalties for the SO (or charges for rewards) (p. 20). The implicit value of unsupplied energy reflected in the transmission network incentive mechanism is about an order of magnitude higher that the value reflect in the comparable distribution network mechanisms.
FIGURE 15
TRANSMISSION OWNER LOSS OF SERVICE SLIDING SCALE INCENTIVE MECHANISM
Source: OFGEM 2004h, page 31.
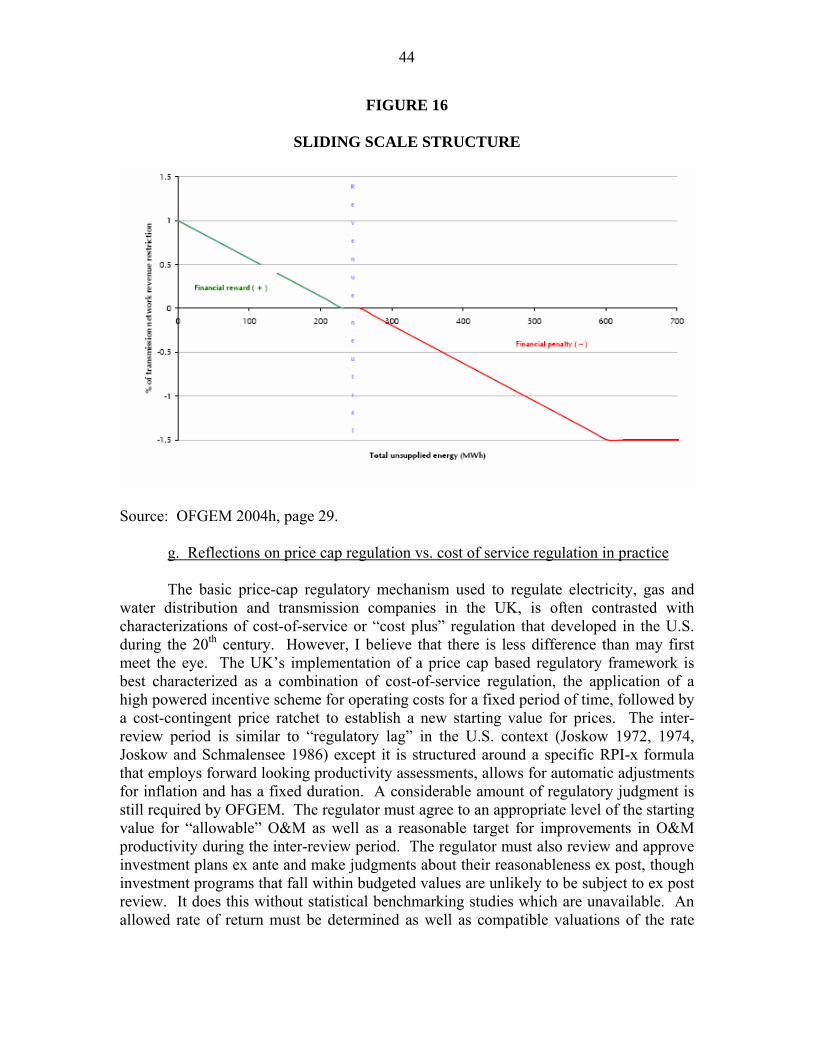
44
FIGURE 16
SLIDING SCALE STRUCTURE
Source: OFGEM 2004h, page 29.
g. Reflections on price cap regulation vs. cost of service regulation in practice The basic price-cap regulatory mechanism used to regulate electricity, gas and water distribution and transmission companies in the UK, is often contrasted with characterizations of cost-of-service or “cost plus” regulation that developed in the U.S. during the 20th century. However, I believe that there is less difference than may first meet the eye. The UK’s implementation of a price cap based regulatory framework is best characterized as a combination of cost-of-service regulation, the application of a high powered incentive scheme for operating costs for a fixed period of time, followed by a cost-contingent price ratchet to establish a new starting value for prices. The inter-review period is similar to “regulatory lag” in the U.S. context (Joskow 1972, 1974, Joskow and Schmalensee 1986) except it is structured around a specific RPI-x formula that employs forward looking productivity assessments, allows for automatic adjustments for inflation and has a fixed duration. A considerable amount of regulatory judgment is still required by OFGEM. The regulator must agree to an appropriate level of the starting value for “allowable” O&M as well as a reasonable target for improvements in O&M productivity during the inter-review period. The regulator must also review and approve investment plans ex ante and make judgments about their reasonableness ex post, though investment programs that fall within budgeted values are unlikely to be subject to ex post review. It does this without statistical benchmarking studies which are unavailable. An allowed rate of return must be determined as well as compatible valuations of the rate

45
base (capital stock) and depreciation rates. Cost accounting and cost reporting protocols are required to implement sound incentive regulation mechanisms.
Thus, there are many similarities here with the way cost-of-service regulation
works in practice in the U.S. Indeed, perhaps the greatest difference is philosophical. OFGEM takes a view which recognizes that by providing performance-based incentives for regulated utilities to reduce costs, it can yield consumer benefits in the long run by making it profitable for the firm to make efficiency improvements. If the firm over performs against the target, consumers eventually benefit at the next price review. It has generally (though not always) been willing to allow the regulated firms to earn significantly higher returns than their cost of capital when these returns are achieved from cost savings beyond the benchmark, knowing that the next “ratchet” will convey these benefits to consumers.20 Under traditional U.S. regulation, the provision of incentives through regulatory lag is more a consequence of the impracticality of frequent price reviews and changing economic conditions than by design. PERFORMANCE OF INCENTIVE REGULATION MECHANISMS FOR ELECTRIC DISTRIBUTION AND TRANSMISSION NETWORK There are been relatively little systematic analysis of the effects of the application of incentive regulation mechanisms on the performance of electric distribution and transmission companies.21 Privatization, restructuring and the application of high-powered regulatory mechanisms has led to improvements in labor productivity and service quality in electric distribution systems in England and Wales, Argentina, Chile, Brazil, Peru, New Zealand and other countries (Newbery and Pollitt 1997, Rudnick and Zolezzi 2001, Bacon and Besant-Jones 2001, Estache and Rodriguez-Pardina 1998, Pollitt (2004)). Sectors that had experienced physical distribution losses due to poor maintenance and antiquated equipment, as well as resulting from thefts of electric service, have generally experienced significant reductions in both types of losses. Penetration rates for the availability of electricity to the population have increased in those countries where service was not already universally available and queues for connections have been shortened. Distribution and transmission network outages have declined. Improved performance of regulated distribution (and sometimes transmission) systems has accompanied privatization and the application of high-powered PBR mechanisms almost everywhere it has been implemented. Most of these studies have focused on developing countries where the pre-reform levels of performance was especially poor. Moreover, it is difficult to disentangle the effects of privatization, restructuring and incentive regulation from one another.
20 There is an least one problem with the fixed ratchet period. A dollar (or Pound Sterling) of cost savings in year 1 is worth much more to the firm than a dollar of cost savings in year 5. OFGEM recently adopted policies to equalize the returns from cost saving during the inter-review period. 21 There is a much more extensive body of empirical work that examines the effects of incentive regulation mechanisms, primarily price caps, on the performance of telecommunications firms. For example, Ai and Sappington 2002, Sappington 2003, and Ai, Martinez and Sappington 2004.

46
The most comprehensive study of the post reform performance of the regional electricity distribution companies in the UK (distribution and supply functions) has been done by Domah and Pollitt (2001). They find significant overall increases in productivity over the period 1990 to 2000 and lower real “controllable” distribution costs compared to a number of benchmarks. See Figure 17. However, controllable costs and overall prices first rose in the early years of the reforms before falling dramatically after 1995. The first application
FIGURE 17
Source: Domah and Pollitt (2001), p. 21
of price cap mechanisms to the RECs in 1990 was too generous (average of RPI+ 2.5%) and a lot of rent was left on the table for the RECs’ initial owners (who cleverly soon sold out to foreign buyers). Subsequent price cap mechanisms placed much more cost pressure on the RECs and stimulated large increases in realized productivity and falling distribution charges. Bertram and Twaddle (2005) provide an interesting analysis of the combined effects on the prices charged for distribution service resulting from capital asset valuation decisions and the impacts of price cap-type regulation on the operating costs of distribution networks. When sector restructuring takes place one decision that must be made is how to value the assets of the distribution and transmission companies that will be used for regulatory purposes going forward; that is, how the rate base or RAV of the capital stock will be valued. The typical approach has been to carry forward the existing depreciated book value of historical investments in transmission and distribution into the new liberalized regime so that the base level of distribution and transmission charges associated with the recovery of capital-related charges does not change as a consequence
Actual and Counterfactual Controllable Costs of the RECs (p/kWh 1995 Prices)
0.40.50.60.70.80.9
11.1
1985/6
1986/7
1987/8
1988/9
1989/0
1990/1
1991/2
1992/3
1993/4
1994/5
1995/6
1996/7
1997/8
1998/9
1999/0
2000/1
2001/2
2002/3
2003/4
2004/5
Year
p/kW
h
Net Controllable costs 3y r ma 0pa 3yr ma 2pa 3yr ma 4pa

47
of the transition. Incremental investments are then accounted for more or less as they were under the old regime (as in the U.S. and Canada) or economic/inflation accounting methods and approximations to economic depreciation applied (as in the UK). These decisions are further complicated in countries where the industry was state-owned and did not employ rigorous capital cost accounting protocols or where prices were kept so low as to not even cover the carrying charges on plant and equipment.
Bertram and Twaddle (2005) review the impact of decisions made in New
Zealand to “write up” the value of distribution company assets to reflect their “true” economic value (something like depreciated replacement cost new) as a component of the restructuring program. These asset values were then used to set the price levels within a price cap regulatory framework. The argument for doing so was that this would allow prices to rise to their efficient level and provide consumers with appropriate price signals. The arguments against this revaluation were that (a) it would lead to significant price increases, (b) non-linear pricing could be used to restore the correct price incentives on the margin, and (c) it created windfall profits for distribution network owners and undermined support for restructuring and competition.
Bertram and Twaddle focus on the effects of this asset revaluation program on
distribution service price and profit levels in New Zealand. Prices and price-operating cost margins rose significantly. However, their work also demonstrates that operating costs incurred by distribution companies in New Zealand fell very significantly during the same period of time. These cost savings appear to reflect both the consolidation of many small distribution companies through mergers and the incentives for cost reduction provided by a high-power incentive scheme. See Figure 18.

48
FIGURE 18
DISTRIBUTION NETWORK PRICES AND COSTS IN NEW ZEALAND
Source: Bertram and Twaddle (2005)
Distribution service quality, at least as measured by supply interruptions per 100 customers and average minutes of service lost per customer, has improved as well in the UK since the restructuring and privatization initiative in 1990. This suggests that incentive regulation has not led, as some had feared, to a degradation in these dimensions of service quality. See Figure 19.
0.000.501.001.502.002.503.003.504.004.505.00
1991
1992
1993
1994
1995
1996
1997
1998
1999
2000
2001
2002
Years to March
Cen
ts p
er k
Wh
conv
eyed
Average revenue
Averageoperating costs

49
FIGURE 19
Source: OFGEM 2003b, page 21.
Let me conclude with a few observations on the performance of the incentive regulation mechanisms that have been applied to NGC by OFGEM for almost a decade. When the new E&W industry structure and market arrangements were implemented in 1990, the system naturally started with a legacy network and configuration of generating capacity. Substantial entry of new generating capacity and retirements of old generating capacity followed, with major changes in power flows over the legacy network. During the initial years of operation there was no incentive regulation mechanism governing system operating costs, including the costs of managing congestion and other network constraints. NGC’s SO costs escalated rapidly growing from about $75 million per year in 1990/91 to almost $400 million per year in 1993/94. After the introduction of the SO incentive scheme in 1994, these costs fell to about $25 million in 1999/2000. OFGEM estimates that NGC’s system operating costs fell by about £400 million between 1994 and 2001 (OFGEM, April 2004). Overall costs of transmission service, including operating, system balancing (which includes congestion costs), use of system, and connection charges fell by about 50% between 1994 and 2001. See Figure 20. NGC’s loss rate has also declined over time. A new SO incentive scheme was introduced when NETA went into operation in early 2001. NGC’s SO costs have fallen by nearly 20% over the three year period since the new scheme was introduced (OFGEM, December 2003).
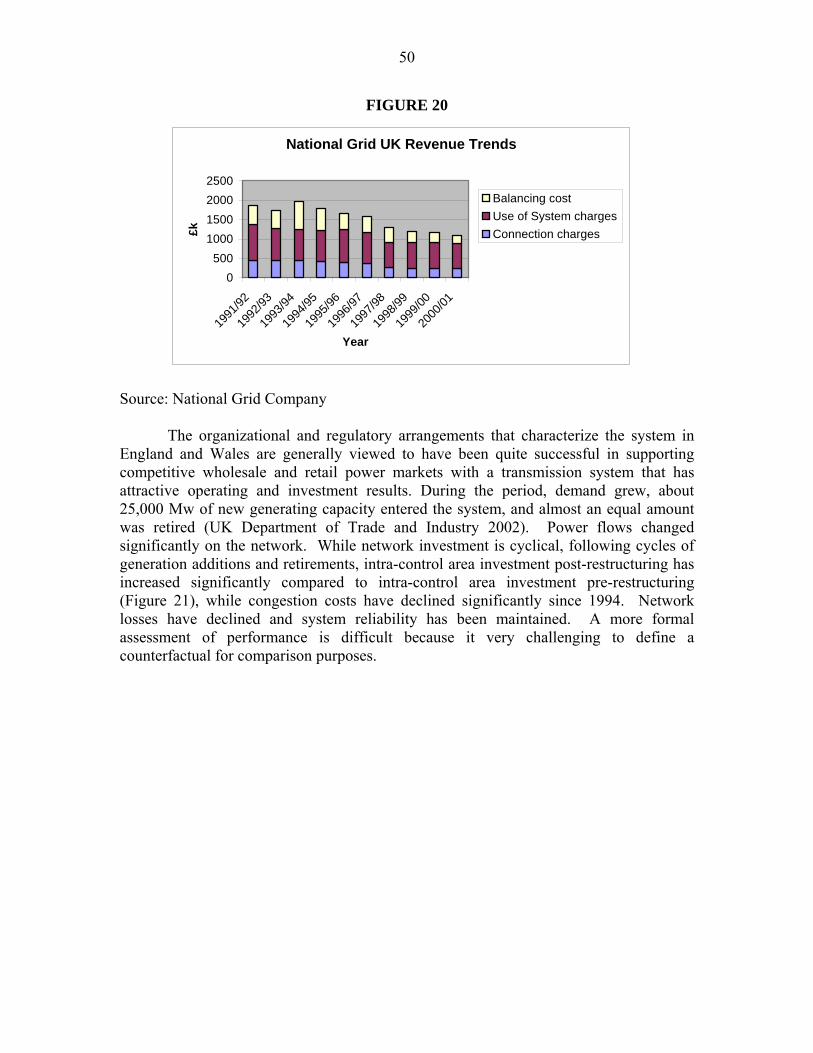
50
FIGURE 20
Source: National Grid Company
The organizational and regulatory arrangements that characterize the system in England and Wales are generally viewed to have been quite successful in supporting competitive wholesale and retail power markets with a transmission system that has attractive operating and investment results. During the period, demand grew, about 25,000 Mw of new generating capacity entered the system, and almost an equal amount was retired (UK Department of Trade and Industry 2002). Power flows changed significantly on the network. While network investment is cyclical, following cycles of generation additions and retirements, intra-control area investment post-restructuring has increased significantly compared to intra-control area investment pre-restructuring (Figure 21), while congestion costs have declined significantly since 1994. Network losses have declined and system reliability has been maintained. A more formal assessment of performance is difficult because it very challenging to define a counterfactual for comparison purposes.
National Grid UK Revenue Trends
0500
1000150020002500
1991
/92
1992
/93
1993
/94
1994
/95
1995
/96
1996
/97
1997
/98
1998
/99
1999
/00
2000
/01
Year
£kBalancing costUse of System chargesConnection charges

51
FIGURE 21
Source: National Grid Company
DISCUSSION During the last fifteen years the theoretical foundations for incentive regulation of legal monopolies has developed considerably and now provides a reasonably mature theoretical framework for designing incentive regulatory mechanisms for practical application. However, the application of these concepts to electric distribution and transmission networks has lagged considerably behind these theoretical developments for a variety of reasons. Incentive regulation in practice is considerably more complicated than incentive regulation in theory. I offer the following observations about the relationship between theory and practice.
1. Incentive regulation has been promoted as a straightforward and superior
alternative to traditional cost of service or rate of return regulation. In practice, incentive regulation is more a complement to than a substitute for traditional approaches to regulating legal monopolies. In some ways it is more challenging. Whether the extra effort is worth it depends on whether the performance improvements justify the additional effort. Incentive regulation in practice requires a good accounting system for capital and operating costs, cost reporting protocols, data collection and reporting requirements for dimensions of performance other than costs. Capital cost accounting rules are necessary, a rate base for capital must still be defined, depreciation rates specified, and an allowed rate of return on capital determined. Comprehensive “rate cases” or “price reviews” are still required to implement “simple” price cap mechanisms. Planning processes for determining needed capital additions are an important part of the process of setting total allowed revenues going forward. Performance benchmarks must be defined and the power of the relevant incentive mechanisms determined. The
NGC's Transmission Investment (£m) - 2002-03 Prices
0
50
100
150
200
250
300
350
400
450
50080
/81
81/8
2
82/8
3
83/8
4
84/8
5
85/8
6
86/8
7
87/8
8
88/8
9
89/9
0
90/9
1
91/9
2
92/9
3
93/9
4
94/9
5
95/9
6
96/9
7
97/9
8
98/9
9
99/0
0
00/0
1
01/0
2
02/0
3
French InterconnectorPost vestingPre-vesting
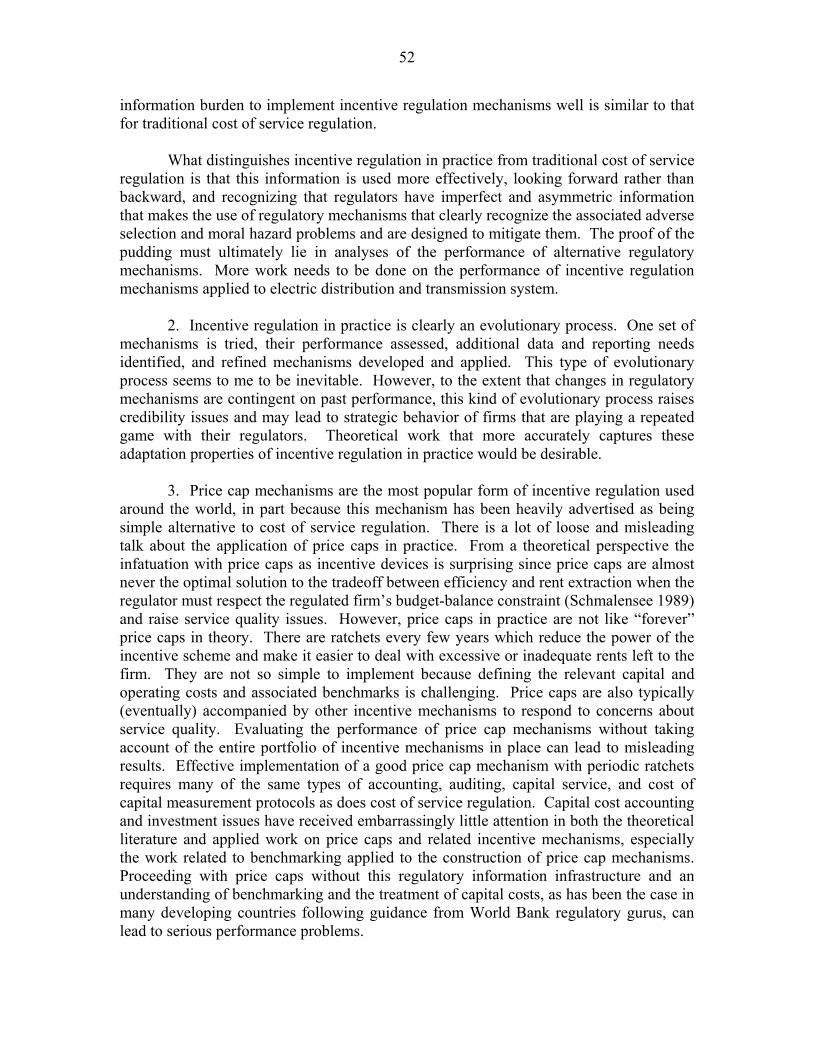
52
information burden to implement incentive regulation mechanisms well is similar to that for traditional cost of service regulation.
What distinguishes incentive regulation in practice from traditional cost of service
regulation is that this information is used more effectively, looking forward rather than backward, and recognizing that regulators have imperfect and asymmetric information that makes the use of regulatory mechanisms that clearly recognize the associated adverse selection and moral hazard problems and are designed to mitigate them. The proof of the pudding must ultimately lie in analyses of the performance of alternative regulatory mechanisms. More work needs to be done on the performance of incentive regulation mechanisms applied to electric distribution and transmission system.
2. Incentive regulation in practice is clearly an evolutionary process. One set of
mechanisms is tried, their performance assessed, additional data and reporting needs identified, and refined mechanisms developed and applied. This type of evolutionary process seems to me to be inevitable. However, to the extent that changes in regulatory mechanisms are contingent on past performance, this kind of evolutionary process raises credibility issues and may lead to strategic behavior of firms that are playing a repeated game with their regulators. Theoretical work that more accurately captures these adaptation properties of incentive regulation in practice would be desirable.
3. Price cap mechanisms are the most popular form of incentive regulation used
around the world, in part because this mechanism has been heavily advertised as being simple alternative to cost of service regulation. There is a lot of loose and misleading talk about the application of price caps in practice. From a theoretical perspective the infatuation with price caps as incentive devices is surprising since price caps are almost never the optimal solution to the tradeoff between efficiency and rent extraction when the regulator must respect the regulated firm’s budget-balance constraint (Schmalensee 1989) and raise service quality issues. However, price caps in practice are not like “forever” price caps in theory. There are ratchets every few years which reduce the power of the incentive scheme and make it easier to deal with excessive or inadequate rents left to the firm. They are not so simple to implement because defining the relevant capital and operating costs and associated benchmarks is challenging. Price caps are also typically (eventually) accompanied by other incentive mechanisms to respond to concerns about service quality. Evaluating the performance of price cap mechanisms without taking account of the entire portfolio of incentive mechanisms in place can lead to misleading results. Effective implementation of a good price cap mechanism with periodic ratchets requires many of the same types of accounting, auditing, capital service, and cost of capital measurement protocols as does cost of service regulation. Capital cost accounting and investment issues have received embarrassingly little attention in both the theoretical literature and applied work on price caps and related incentive mechanisms, especially the work related to benchmarking applied to the construction of price cap mechanisms. Proceeding with price caps without this regulatory information infrastructure and an understanding of benchmarking and the treatment of capital costs, as has been the case in many developing countries following guidance from World Bank regulatory gurus, can lead to serious performance problems.

53
4. In practical applications to electric distribution and transmission networks there is an implicit assumption that there is a dichotomy between incentives contracts (aggregate revenue targets) and price setting (price structures). This dichotomy between the firm’s budget or allowed revenues and its price structure is consistent with the historical development of regulatory practice in the U.S. where rate cases separate the determination of allowed revenues or revenue requirements from the specification of price structures that yield the indicated revenues (Joskow 1972; Joskow and Schmalensee 1986). A similar dichotomy has been adopted in the regulatory process in the UK. Regulated firms are given little flexibility to adjust price structures under the price cap mechanism. Accordingly, the primary role of price caps is to provide incentives for cost reduction not to provide firms with the incentive to set optimal second-best prices given their overall budget constraints. The evaluations of the performance of price cap regulation should therefore be evaluated from the perspective of the effects on performance incentives not on its effects on price structures since these are typically not chosen voluntarily by the regulated firm but are subject to independent regulatory determinations.
5. Incentive regulation theory implies that the adverse selection and moral hazard
problems resulting from the regulators’ information disadvantages are best handled by offering firms a menu of cost contingent incentive contracts. Formal offers of menus are rare, though the give and take of regulatory negotiations may be a substitute. OFGEM’s recent use of a menu of sliding scale schemes to deal with differences over capital investment forecasts for electric distribution companies seems to me to be an especially effective approach and, indeed, led the regulated firms to make more “reasonable” investment proposals, at least according to OFGEM. More frequent use of menus of incentive contracts in this way could improve incentive regulation in practice.
6. Collection of data on all relevant and significant measures of firm performance
and the use of these data for benchmarking purposes and for developing performance targets is an important component of good incentive regulation in practice. Regulators need the authority to require firms to collect performance data, to audit performance data and to analyze these data. Absent these authorities and resources incentive regulation mechanisms will not achieve their promise in practice.
7. As incentive regulation has evolved in the UK and other countries, the
portfolio of incentive mechanisms that is being utilized has grown. While the initial focus was on reducing operating costs it has now shifted to investment and various dimensions of service quality. Ideally these mechanisms should be fully integrated and differences in the power of the individual incentive schemes carefully considered. As things stand now there appear to be differences in the power of the incentives schemes as they relate to capital and operating costs. These problems are exacerbated in the UK and many other countries new to formal regulation by the lack of uniform systems of accounts and reporting requirements. Quality of service schemes appear to have been bolted on to schemes designed to provide incentives for cost reduction and do not effectively incorporate information on consumer valuations of quality and the costs of varying quality in different dimensions. While the value of lost or unsupplied energy is

54
uncertain, it is better to use an imperfect estimate of the right number than a highly accurate estimate of the wrong number. Efforts need to be made to harmonize these schemes and to guard against distortions caused by differences in the effective power of the constituent components of the overall incentive mechanisms.
8. Incentive regulation mechanisms often have “deadbands,” caps, and floors that
place limits on the performance realizations for which the regulated firm is at risk. At first blush, the use of hard caps and floors on the realizations of sliding scale mechanisms that place kinks in the incentive structure are hard to rationalize from a theoretical perspective and appear to have poor incentive properties for realizations near to the kinks in the incentive contract. Caps and floors may be justified as reflecting outcomes that were not contemplated (bounded rationality) in the level and structure of the target performance norms and the distribution of profits around these targets. They effectively trigger renegotiation. However, it is likely that a multipart sliding scale structure that softens incentives as the cap and floor are approaches would have superior efficiency properties. We need to better understand the popular use of hard caps and floors and try to better understand their efficiency properties.
9. Our ability to use incentive regulation mechanisms effectively is dependent on
the attributes of the restructuring and liberalization program of which it is part. For example, it is much easier to develop and apply an incentive regulation program to the electric transmission system in England and Wales because there is one integrated transmission owner and system operator. The balkanized ownership structure of transmission assets in the U.S., combined with the separation of system operating functions (to non-profit independent system operators) from transmission ownership, maintenance, physical operation and investment, makes the application of incentive regulation mechanisms (indeed any effective regulation mechanism) a very significant challenge. The difficulties are enhanced by the peculiar mix of federal and state regulation of transmission in the U.S. and the failure of the federal regulator to take an active role in defining performance attributes, collecting performance data and developing performance norms. FERC Order 2000 effectively assigns these responsibilities to RTO/ISO entities, but they have not taken up this challenge to date (Joskow 2005b).
10. It would be worthwhile to pursue more work on the performance of incentive
regulation mechanisms on electric and gas distribution and transmission companies in all relevant dimensions. The empirical research on the performance of incentive regulation in the telecommunications sector is much more extensive than is the research on electricity and gas networks. This kind of comparative institutional work is not easy, but it needs to be done, perhaps in conjunction with benchmarking studies that include firms subject to different types of regulation.
55
REFERENCES
Ai, C., S. Martinez and D.E. Sappington (2004), “Incentive Regulation and Telecommunications Service Quality,” Journal of Regulatory Economics, 26:3 263-285. Ai, C. and D. Sappington (2002), “The Impact of State Incentive Regulation on the U.S. Telecommunications Industry, Journal of Regulatory Economics, 22:2 133-160. Armstrong, M., S. Cowan and J. Vickers (1994), Regulatory Reform: Economic Analysis and British Experience, Cambridge, MA: MIT Press. Armstrong, M. and D. Sappington (2005), “Recent Developments in the Theory of Regulation,” Handbook of Industrial Organization (Vol. III), M. Armstrong and R. Porter, eds., Elsevier Science Publishers, forthcoming. Armstrong, M. and D.M. Sappington (2003), “Toward a Synthesis of Models of Regulatory Policy Design with Limited Information,” mimeo. Armstrong, M. and J. Vickers (1991), “Welfare Effects of Price Discrimination by a Regulated Monopolist,” Rand Journal of Economics, 22:571-80. Averch, H. and L.L. Johnson (1962), “Behavior of the Firm Under Regulatory Constraint,” American Economic Review, 52: 1059-69. Bacon, R. W., and J. E. Besant-Jones. 2001. “Global Electric Power Reform, Privatization and Liberalization of the Electric Power Industry in Developing Countries.” Annual Reviews of Energy and the Environment 26: 331–59. Banerjee, A.(2003), “Does Incentive Regulation “Cause” Degradation of Telephone Service Quality?” Information Economics and Policy, 15: 243-269. Baron, D. (1989), “Design of Regulatory Mechanisms and Institutions,” Handbook of Industrial Organization (Vol. II), R. Schmalensee and R. Willig eds, Amsterdam: North Holland.. Baron, D. and D. Besanko (1984), “Regulation, Asymmetric Information and Auditing,” Rand Journal of Economics 15:4 447-470. Baron, D. and D. Besanko (1987a), “Commitment and Fairness in a Dynamic Regulatory Relationship,” Review of Economic Studies, 54(3): 413-436. Baron, D. and D. Besanko (1987b), “Monitoring, Moral Hazard, Asymmetric Information and Risk Sharing in Procurement Contracting,” Rand Journal of Economics, 18(4): 509-532.
56
Baron, D. and R. Myerson (1982), “Regulating a Monopolist with Unknown Costs,” Econometrica, 50:4 911-930. Baumol, W. and A.K. Klevorick (1970), “Input Choices and Rate of Return Regulation: An Overview of the Discussion,” Bell Journal of Economics and Management Science, 1:2 169-190. Bertram, G. and Twaddle, D. (2005). “Price-Cost Margins and Profit Rates in New Zealand Electricity Distribution Networks: The Cost of Light Handed Regulation”, Journal of Regulatory Economics 27(3): 281-307. Beesley, M. and S. Littlechild (1989), “The Regulation of Privatized Monopolies in the United Kingdom,” Rand Journal of Economics, 20:3 454-472. Bernstein, J.I, and D. M. Sappington (1999), “Setting the X-factor in Price Cap Regulation Plans,” Journal of Regulatory Economics, 16: 5-25. Boiteux, M. (1960), “Peak Load Pricing,” Journal of Business, 33:157-79 [translated from the original in French published in 1951.] Boiteux, M. (1971), “On the Management of Public Monopolies Subject to Budget Constraint,” Journal of Economic Theory, 3: 219-40. [translated from the original in French and published in Econometrica in 1956] Braeutigam, R. (1989), “Optimal Prices for Natural Monopolies,” Handbook of Industrial Organization, Volume II, R. Schmalensee and R. Willig, eds, Amsterdam: Elsevier Science Publishers. Brennan, T. (1989), “Regulating By Capping Prices,” Journal of Regulatory Economics, 1:2, 133-47. Cabral, L. and M. Riordan (1989), “Incentives for Cost Reduction Under Price Cap Regulation,” Journal of Regulatory Economics, 1:2, 93-102. Carrington, R., T. Coelli, and E. Groom (2002), “International Benchmarking for Monopoly Price Regulation: The Case of Australian Gas Distribution,” Journal of Regulatory Economics, 21: 191-216. Clark, J.M. (1913), “Frontiers of Regulation and What Lies Beyond,” American Economic Review 3:1 114-125. Domah, P.D. and M.G. Pollitt, 2001. “The Restructuring and Privatisation of the Regional Electricity Companies in England and Wales: A social cost benefit analysis,” Fiscal Studies, 22(1):107-146.
57
Estache, A. and M. Rodriguez-Pardina, 1998. “Light and Lightening at the End of the Public Tunnel: The Reform of the Electricity Sector in the Southern Cone,” World Bank Working Paper, May. Estache, A. and J-L Guasch and L. Trujillo (2003), “Price Caps, Efficiency Payoffs, and Infrastructure Contract Renegotiation in Latin America,” mimeo. Estache, A, M.A. Rossi, and C.A. Ruzzier (2004), “The Case for International Coordination of Electricity Regulation: Evidence from the Measurement of Efficiency in South America,” Journal of Regulatory Economics, 25: 3 271-295. Gagnepain, P. and M. Ivaldi (2002), “Incentive Regulatory Policies: The Case of Public Transit in France, Rand Journal of Economics, 33: 605-629. Giannakis, D, T. Jamasb, and M. Pollitt (2004), “ Benchmarking and Incentive Regulation of Quality of Service: An Application to the U.K. Distribution Utilities, Cambridge Working Papers in Economics CWEP 0408, Department of Applied Economics, University of Cambridge. Gilbert, R. and D. Newbery (1994), “The Dynamic Efficiency of Regulatory Constitutions,” Rand Journal of Economics, 26(2):243-256. Hammond, C. J., G. Johnes and T. Rolbinson (2002), “Technical Efficiency Under Alternative Regulatory Regimes, Journal of Regulatory Economics, 22:3 251-270. Henney, Alex, A Study of the Privatisation of the Electricity Supply Industry in England and Wales, EEE Limited, 1994. Isaac, R.M. (1991), “Price Cap Regulation: A Case Study of Some Pitfalls of Implementation,” Journal of Regulatory Economics, 3:2 193-210. Jamasb, T. and M. Pollitt (2003), “International Benchmarking and Regulation: An Application to European Electricity Distribution Utilities,” Energy Policy, 31 1609-1622. Jasmsb, T. and M. Pollitt (2001), “Benchmarking and Regulation: International Electricity Experience, Utilities Policy, 9: 107-130. Jamasb, Tooraj, Nilleson, Paul; Pollitt, Michael, “Strategic Behavior Under Regulatory Benchmarking,” Energy Economics, September 2004, 26(5), 825-43. Jarrell, G.A (1978). “The Demand for State Regulation of the Electric Utility Industry,” Journal of Law and Economics, 21:269-295. Joskow, P.L. (1972), “The Determination of the Allowed Rate of Return in a Formal Regulatory Hearing,” Bell Journal of Economics and Management Science, 3:633-644.

58
Joskow, P.L. (1973), “Pricing Decisions of Regulated Firms,” Bell Journal of Economics and Management Science, 4: 118-140. Joskow, P.L, (1974), “Inflation and Environmental Concern: Structural Change in the Process of Public Utility Price Regulation, Journal of Law and Economics, 17:291-327. Joskow, P.L. (1989), "Regulatory Failure, Regulatory Reform and Structural Change In The Electric Power Industry", Brookings Papers on Economic Activity: Microeconomic, 125-199. Joskow, P.L. (2000), “Deregulation and Regulatory Reform in the U.S. Electric Power Industry,” in S. Peltzman and C. Winston, eds., Deregulation of Network Industries, Washington, D.C.: Brookings Institution Press. Joskow, P.L.(2005a) , “The Regulation of Natural Monopolies,” forthcoming Handbook of Law and Economics, M. Polinsky and and S. Shavell editors. http://web.mit.edu/pjoskow/www/. Joskow, P.L. (2005b), “Transmission Policy in the United States,” Utilities Policy, 13, 2005, 95-115. Joskow, P.L. and R. Schmalensee (1986), “Incentive Regulation for Electric Utilities,” Yale Journal on Regulation, 4:1-49. Klevorick, A.K. (1971), “The Optimal Fair Rate of Return,” Bell Journal of Economics, 2:122-153. Klevorick, A.K. (1973), “The Behavior of the Firm Subject to Stochastic Regulatory Review,” Bell Journal of Economics, 4: 57-88. Kridel, D., D. Sappington and D. Weisman (1996), "The Effects of Incentive Regulation in the Telecommunications Industries: A Survey, "Journal of Regulatory Economics, 18: 269-306. Kwoka, J., (1993), “Implementing Price Caps in Telecommunications,” Journal of Policy Analysis and Management, 12:4 722-756. Laffont, J-J and J. Tirole (1986), “Using Cost Observations to Regulate Firms,” Journal of Political Economy, 94:3 614-641. Laffont, J-J and J. Tirole (1988a), “Auctioning Incentive Contracts,” Journal of Political Economy, 95:5 921-937. Laffont, J-J, and J. Tirole, (1988b), “The Dynamics of Incentive Contracts,” Econometrica, 56:5 1153-1176.

59
Laffont, J-J. and J. Tirole, (1990a), “Adverse Selection and Renegotiation in Procurement,” Review of Economic Studies, 57(4): 597-626. Laffont, J-J and J. Tirole (1993), A Theory of Incentives in Regulation and Propcurement, Cambridge, MA: MIT Press. Laffont, J-J and J. Tirole (2000), Competition in Telecommunication, Cambridge, MSA: MIT Press. Levy, B. and P. Spiller (1994), “The Institutional Foundations of Regulatory Commitment: A Comparative Analysis of Telecommunications,” Journal of Law, Economics and Organization, 10:2 201-246. Lewis, T. and D.M. Sappington (1988a), “Regulating a Monopolist with Unknown Demand,” American Economic Review, 78:5 986-998. Lewis, T. and D.M. Sappington (1988b), “Regulating a Monopolist with Unknown Demand and Cost Functions, Rand Journal of Economics, 18:3 438-457. Lewis, T. and D. Sappington (1989), “Regulatory Options and Price Cap Regulation,” Rand Journal of Economics, 20:3 405-416. Lyon, T., (1996), “A Model of the Sliding Scale,” Journal of Regulatory Economics, 9:3 227-247. Massachusetts Department of Telecommunications and Energy (2001), “Investigation to Establish Guidelines for Service Quality Standards for Electric Distribution Companies and Local Gas Distribution Companies, D.T.E. 99-84, June 29, 2001. McCubbins, M.D. (1985), “The Legislative Design of Regulatory Structure,” American Journal of Political Science, 29: 721-748. McCubbins, M.D., R.G. Noll, and B.R. Weingast (1987), “Administrative Procedures as Instruments of Corporate Control,” Journal of Law, Economics and Organization, 3:243-277. National Grid Company (NGC) (2004a), The Statement of the Use of System Charging Methodology,” Effective from 1 November 2004. London. National Grid Company (NGC) (2004b), The Statement of the Use of System Charges,” Effective from 1 November 2004. London. National Grid Company (NGC) (2004c), Interim Great Britain Seven Year Statement, November 2004. London.

60
National Grid Company (NGC)(2003), “Facts and Figures on the England and Wales Transmission System,” presentation, November 2003. London. Newbery, D., and M. Pollitt, 1997. “The Restructuring and Privatization of Britain’s CEGB – Was it Worth It?” Journal of Industrial Economics, 45(3), 269-303. Office of Gas and Electricity Markets (OFGEM) (2003a), “Electric Distribution Losses,” Initial Proposals, June 2003. London. Office of Gas and Electricity Markets (OFGEM) (2003b), Annual Report 2002-03,” 14 July 2003. London. Office of Gas and Electricity Markets (OFGEM) (2003c), “Scotland-England Interconnector: Access Criteria from 1 April 2004, Consultation Paper,” December 2003. London.
Office of Gas and Electricity Markets (OFGEM) (2003d), “NGC System Operator Incentive Scheme from April 2004, Initial Consultation Document,” December 2003. London. Office of Gas and Electricity Markets (OFGEM) (2004a), “Electricity Distribution Price Control Review: Policy Document,” March, London, UK. Office of Gas and Electricity Markets (OFGEM) (2004b), “Proposals for the Amendment of the Licensing Application Regulations,” (Interconnectors) Consultation Document, June 2004. London. Office of Gas and Electricity Markets (OFGEM) (2004c), “Electricity Distribution Price Control Review,” Initial Proposals, June 2004 145/04. London. Office of Gas and Electricity Markets (OFGEM) (2004d), “Electricity Distribution Price Control Review: Appendix – The Losses Incentive and Quality of Service, June 2004 145e/04. London. Office of Gas and Electricity Markets (OFGEM) (2004e), “Electricity Distribution Price Control Review,” Update Paper, September 2004. London. Office of Gas and Electricity Markets (OFGEM) (2004f), “Electricity Distribution Price Control Review: Final Proposals,” 265/04, November, London. Office of Gas and Electricity Markets (OFGEM) (2004g), “NGC System Operator Incentive Scheme from April 2005: Initial Proposals,” December, London. Office of Gas and Electricity Markets (OFGEM) (2004h), “ Electricity Transmission Network Reliability Incentive Scheme: Final Proposals,” December, London.
61
Office of Gas and Electricity Markets (OFGEM) (2005), “NGC System Operator Incentive Scheme from April 2005,” Final Proposals and Statutory License Consultation, March 2005 65/05. London. Owen, B. and R. Brauetigam (1978), The Regulation Game: Strategic Use of the Administrative Process, Cambridge, MA: Ballinger Publishing Company. Pollitt, Michael, 2004. “Electricity Reforms in Argentina: Lessons for Developing Countries,” CMI Working Paper 52, Cambridge Working Papers in Economics. http://www.econ.cam.ac.uk/electricity/publications/wp/ep52.pdf. Posner, R.A., (1974), “Theories of Economic Regulation,” Bell Journal of Economics, 5: 335-358.. Riordan, M. (1984), “On Delegating Price Authority to a Regulated Firm,” Rand Journal of Economics, 15:1 108-115. Rudnick, H., and J. Zolezzi. 2001. “Electric Sector Deregulation and Restructuring in Latin America: Lessons to be Learnt and Possible Ways Forward.” In IEEE Proceedings Generation, Transmission and Distribution 148: 180-84. Sappington, D. M. (1980), “Strategic Firm Behavior Under a Dynamic Regulatory Adjustment Process,” Bell Journal of Economics, 11(1), 360-372. Sappington, D.M. (2003), “The Effects of Incentive Regulation on Retail Telephone Service Quality in the United States,” Review of Network Economics, 2:3 355-375. Sappington, D. and D. Sibley (1988), “Regulating without Cost Information: The Incremental Surplus Subsidy Scheme,” International Economic Review 31:2 297-306. Sappington, D. and D. Sibley, (1990), “Regulating without Cost Information: Further Observations,” International Economic Review, 31:4 1027-1029. Sappington, D. et. al. (2001), “The State of Performance Based Regulation in the U.S. Electric Utility Industry,” Electricity Journal, 71-79. Schmalensee, R. (1989a), “An Expository Note on Depreciation and Profitability Under Rate of Return Regulation, Journal of Regulatory Economics, 1:3 293-298. Schmalensee, R. (1989b), “Good Regulatory Regimes,” Rand Journal of Economics, 20:3 417-436. Schleifer, Andrei (1985), “A Theory of Yardstick Competition,” Rand Journal of Economics, 16:3 319-327.

62
Sibley, D. (1989), “Asymmetric Information, Incentives and Price Cap Regulation,” Rand Journal of Economics 20:3 392-404. Spiegel, Y. and D. Spulber (1994), “The Capital Structure of Regulated Firms,” Rand Journal of Economics, 25(3) 424-440. UK Department of Trade and Industry (2002), United Kingdom Digest of Energy Statistics 2002 . U.S. Energy Information Administration (EIA), Electricity Transmission in a Restructured Industry: Data Needs for Public Policy Analysis, December 2004. Vogelsang, I. and J. Finsinger (1979), “A Regulatory Adjustment Process for Optimal Pricing of Multiproduct Firms,” Bell Journal of Economics, 10:1 151-171. Weitzman, M. (1980), “The Ratchet Principle and Performance Incentives,” Bell Journal of Economics, [ ]: 302-308.