An Application of Pareto Analysis and Cause-and-Effect ...
9
87 Copyright © Canadian Research & Development Center of Sciences and Cultures ISSN 1913-0341[Print] ISSN 1913-035X[Online] www.cscanada.net www.cscanada.org An Application of Pareto Analysis and Cause-and-Effect Diagram (CED) for Minimizing Rejection of Raw Materials in Lamp Production Process Mohiuddin Ahmed 1,* ; Nafis Ahmad 2 1 Student, Reg. No.-0409082017, Masters of Engineering, Department of Industrial & Production Engineering, Bangladesh University of Engineering and Technology, Dhaka, Bangladesh. Email: mohiuddin. [email protected]. 2 Associate Professor, Department of Industrial & Production Engineering, Bangladesh University of Engineering and Technology, Dhaka, Bangladesh. Email: nafi[email protected] * Corresponding author. Address: Industrial & Production Engineering Department, Bangladesh University of Engineering and Technology, Bangladesh. Email: [email protected] Received 31 August, 2011; accepted 8 September, 2011 Abstract Flange tube, Glass shell, Lead in Wire (LIW), Filament (Coil) and Cap are the most important raw materials in case of Lamp Production Process. Manufacturing processes tend to produce operational wastages due to various reasons, which can be reduced by identifying and eliminating those reasons. It has been a very challenging engineering problem particularly in a multistage manufacturing, where maximum number of processes and activities are performed. With the help of Pareto diagrams, which are mostly used to identify critical areas, the manufacturing process defects in the each stage of the production belt have been prioritized by arranging them in decreasing order of importance. Then cause and effect diagram is being applied to explore possible causes/factors of defects and to determine the causes/factors, which has the greatest effect. Key words: Lamp production process; Multistage manufacturing; Pareto diagrams; Production belt; Cause and effect diagram Mohiuddin Ahmed, & Nafis Ahmad (2011). An Application of Pareto Analysis and Cause-and-Effect Diagram (CED) for Minimizing Rejection of Raw Materials in Lamp Production Process. Management Science and Engineering, 5 (3), 87-95. Available from: URL: http://www. cscanada.net/index.php/mse/article/view/j.mse.1913035X20110503.320 DOI: http://dx.doi.org/10.3968/j.mse.1913035X20110503.320 INTRODUCTION In the contemporary world of manufacturing due highly competitive nature of the market, different companies have started to look for different approaches and practices to reduce the wastage of raw materials. Waste minimization plays very important role in manufacturing industries. Wastage of raw materials affects price of the product and decreases the profit level of the company or industry. Therefore industries are continuously trying to reduce operational wastages. Pareto analysis helps to identify different defects and classify them according to their significance. These defects often lead to the rejection of raw materials. To determine possible root causes of rejection, Cause- and-Effect Diagram (CED) is also a very useful tool. It helps to identify, sort, and display causes of a specific problem or quality characteristic. It graphically illustrates the relationship between a given outcome and all the factors that influence the outcome and hence to identify the possible root causes i.e. basic reasons for a specific effect, problem, or condition. The reduction of raw material consumption in manufacturing processes will increase the efficiency as less material will be exhausted, transported, transformed, and disposed. Increasing the raw material efficiency will increase both resource efficiency (to use less material for producing one product) and energy efficiency (to supply, transport and process fewer raw materials per finished product). Developing countries’ hunger for raw materials is increasing rapidly. Manufacturing industries have to tackle the challenge of rising raw material prices. “Zero-waste” and “zero- defect” approach may result up to 35% cut in raw material consumption in highly automated production lines [IMS, 2020, Roadmap on sustainable manufacturing, Energy efficient manufacturing and key technologies, 15 February 2010]. In this work, an electric lamp manufacturing industry is studied where electric lamps of different Management Science and Engineering Vol. 5, No. 3, 2011, pp.87-95 DOI:10.3968/j.mse.1913035X20110503.320
Transcript of An Application of Pareto Analysis and Cause-and-Effect ...

86 87 Copyright © Canadian Research & Development Center of Sciences and Cultures
ISSN 1913-0341[Print] ISSN 1913-035X[Online]
www.cscanada.netwww.cscanada.org
An Application of Pareto Analysis and Cause-and-Effect Diagram (CED) for Minimizing Rejection of Raw Materials in Lamp Production Process
Mohiuddin Ahmed1,*; Nafis Ahmad2
1Student, Reg. No.-0409082017, Masters of Engineering, Department of Industrial & Production Engineering, Bangladesh University of Engineering and Technology, Dhaka, Bangladesh. Email: [email protected] Professor, Department of Industrial & Production Engineering, Bangladesh University of Engineering and Technology, Dhaka, Bangladesh. Email: [email protected] *Corresponding author.Address: Industrial & Production Engineering Department, Bangladesh University of Engineering and Technology, Bangladesh. Email: [email protected]
Received 31 August, 2011; accepted 8 September, 2011
AbstractFlange tube, Glass shell, Lead in Wire (LIW), Filament (Coil) and Cap are the most important raw materials in case of Lamp Production Process. Manufacturing processes tend to produce operational wastages due to various reasons, which can be reduced by identifying and eliminating those reasons. It has been a very challenging engineering problem particularly in a multistage manufacturing, where maximum number of processes and activities are performed. With the help of Pareto diagrams, which are mostly used to identify critical areas, the manufacturing process defects in the each stage of the production belt have been prioritized by arranging them in decreasing order of importance. Then cause and effect diagram is being applied to explore possible causes/factors of defects and to determine the causes/factors, which has the greatest effect.Key words: Lamp production process; Multistage manufacturing; Pareto diagrams; Production belt; Cause and effect diagram
Mohiuddin Ahmed, & Nafis Ahmad (2011). An Application of Pareto Analysis and Cause-and-Effect Diagram (CED) for Minimizing Rejection of Raw Materials in Lamp Production Process. Management Science and Engineering, 5(3), 87-95. Available from: URL: http://www.cscanada.net/index.php/mse/article/view/j.mse.1913035X20110503.320 DOI: http://dx.doi.org/10.3968/j.mse.1913035X20110503.320
INTRODUCTION In the contemporary world of manufacturing due highly competitive nature of the market, different companies have started to look for different approaches and practices to reduce the wastage of raw materials. Waste minimization plays very important role in manufacturing industries. Wastage of raw materials affects price of the product and decreases the profit level of the company or industry. Therefore industries are continuously trying to reduce operational wastages. Pareto analysis helps to identify different defects and classify them according to their significance. These defects often lead to the rejection of raw materials.
To determine possible root causes of rejection, Cause-and-Effect Diagram (CED) is also a very useful tool. It helps to identify, sort, and display causes of a specific problem or quality characteristic. It graphically illustrates the relationship between a given outcome and all the factors that influence the outcome and hence to identify the possible root causes i.e. basic reasons for a specific effect, problem, or condition. The reduction of raw material consumption in manufacturing processes will increase the efficiency as less material will be exhausted, transported, transformed, and disposed. Increasing the raw material efficiency will increase both resource efficiency (to use less material for producing one product) and energy efficiency (to supply, transport and process fewer raw materials per finished product). Developing countries’ hunger for raw materials is increasing rapidly. Manufacturing industries have to tackle the challenge of rising raw material prices. “Zero-waste” and “zero-defect” approach may result up to 35% cut in raw material consumption in highly automated production lines [IMS, 2020, Roadmap on sustainable manufacturing, Energy efficient manufacturing and key technologies, 15 February 2010]. In this work, an electric lamp manufacturing industry is studied where electric lamps of different
Management Science and EngineeringVol. 5, No. 3, 2011, pp.87-95DOI:10.3968/j.mse.1913035X20110503.320

88Copyright © Canadian Research & Development Center of Sciences and Cultures 89
wattage are produced in four production lines. In this study Pareto chart and Cause-and-Effect Diagram have been used with an objective to identify and classify the reasons that are responsible for operational wastage of raw materials in the production lines.
1. LITERATURE REVIEWProductivity can be increased by adopting practices to reduce defects that will ultimately reduce wastage of raw materials. In order to properly diagnose a defect, it is necessary to start inspecting raw materials, investigate all manufacturing steps, final inspection and customer claims. It is essential to reducing scrap by defining corrective and preventive actions. First by Pareto analysis we can sort all different defects with their relative significance to the total rejection. Then Root Cause Analysis can be used to perform a comprehensive, systematic review of critical incidents (Wilson et al. 1993). It includes the identification of the root and contributory factors, determination of risk reduction strategies, and development of action plans along with measurement strategies to evaluate the effectiveness of the plans. It is an important tool for a thorough understanding of “what happened”. A root cause is the most basic reason for an undesirable condition or problem. If the real cause of the problem is not identified, then one is merely addressing the symptoms and the problem will continue to exist. Finally CED helps to express all the findings graphically.
Juran (in 1940) applied Pareto analysis for separating the “vital few” from the “trivial many”. It shows the most frequent reason for rejection of raw materials. In this case 10 different categories or bins for raw material rejects and length rejects account for 50% of all rejection. In another case study in foundry industry by Perzyk (2007), Pareto chart shows that the foundry staff should concentrate on reducing defects like ’sand inclusions’ and ‘gas holes’, which make up 72% of all defects. Pareto diagrams can therefore be particularly useful in defining the targets. Pareto charts show the most frequently occurring factors and help to make the best use of limited resources by pointing at the most important problems to tackle. Chandna and Chandra (2009) studied forging operation that produce six cylinder crankshafts used in trucks and buses. With the help of Pareto
diagrams critical areas are identified and forging defects of crankshaft have been prioritized by arranging them in decreasing order of importance. Then Cause-and-Effect Diagram (CED) is applied to explore possible causes of defects through brain storming session and to determine the causes, which have the greatest effect. The corrective measures reduce the rejection rate from 2.43% to 0.21%.
Mahto and Kumar (2008) applied root-cause identification methodology to eliminate the dimensional defects in cutting operation in CNC oxy flame cutting
machine. Rejection rate has been reduced from 11.87% to 1.92% on an average. Khekalei et.al (2010) presented another case of wastage reduction in a belt manufacturing industry located in the Virabha, India which produces world class automotive belts and hoses. The main raw material for producing this automotive belt is rubber. Others raw materials are biased fabric and cord. From many years consumption of raw material was not taken seriously as rubber is reusable. But other raw material that is biased fabric and cord consumption was increased drastically which resulted in increased in the production cost of belt and reduced profit margin. Wastages in the belt manufacturing process are- cord wastages, fabric wastages, in-process wastages. Cord and fabric wastages occurred during drum building process while in-process wastages occurred during cutting operation. DMAIC (Define, Measure, Analyze, Improve and Control) has been used to reduce cord wastages in belt manufacturing. The analyze phase focuses on the potential causes that are identified by using cause-and-effect diagram, which have the maximum impact on the operational wastages. CED presents a chain of causes and effects, sorts out causes, organizes relationship between Critical-To-Quality (CTQ) and root causes. After analyzing collected data, it is found out that tension setting in drum building and left over cord were the major causes for high cord wastage. The result showed reduction in cord wastage from 549531 to 17240, also the Sigma Level is improved from 1.37 to 3.6.
Khamis (2003) presented a study on a plastic injection molding process department in an air-conditioning assembly company cross flow flan is a critical component in the company’s latest new product. A high defect of cross flow fan from the injection molding process is the main concern. The team conducted a brainstorming session to find the root cause of the short-shot defects through the cause and effect diagram.
From the literature review it is revealed that successful applications of Pareto analysis and CED can significantly reduce the rejection rate and increase efficiency. In this work these tools are used to improve the condition of a lamps manufacturing plant. In this paper mount making, stem making, sealing, pumping and capping process are considered for reducing rejection rate.
2. METHODOLGY OF THE STUDYThere are varieties of problems related to product quality and productivity in industries due to varying degrees of abnormality and inefficiency, which ultimately causes rejection of raw materials. The study was conducted in an electric lamp manufacturing industry where flange tube, glass shell, Lead in Wire (LIW), filament (Coil) and cap are the most important raw materials. The monthly budget for these five main raw materials are Flange tube -10%, Glass shell 5.00% , Lead in Wire (LIW) 9.00 % , Filament (Coil) – 7.50 % and Cap-1.70%. The consumption of
An Application of Pareto Analysis and Cause-and-Effect Diagram (CED) for Minimizing Rejection of Raw Materials in Lamp Production Process
88 89 Copyright © Canadian Research & Development Center of Sciences and Cultures
main raw materials are in stem making process, mount making process, sealing, pumping and capping process. From the monthly rejection of raw material in 2010, amount of rejection of these raw materials is found beyond the budget rejection rate of raw materials. In this paper, the identification of the defects corresponding these raw materials has been taken for the related steps like stem making process, mount making process, sealing, pumping and capping mill process of the production belt are collected from the monthly bin count history. With the help of Pareto diagrams, the defects in the every steps are arranged in decreasing order of importance has prioritized the defects of the production belt and the frequency of the defects are identified which has the greatest effect to increase the wastage of raw materials. Then root cause analysis is performed to explore possible causes of defects in every processing step of the belt. A cause-and-effect diagram is used to organize and graphically show interrelationships of various causes of problems.
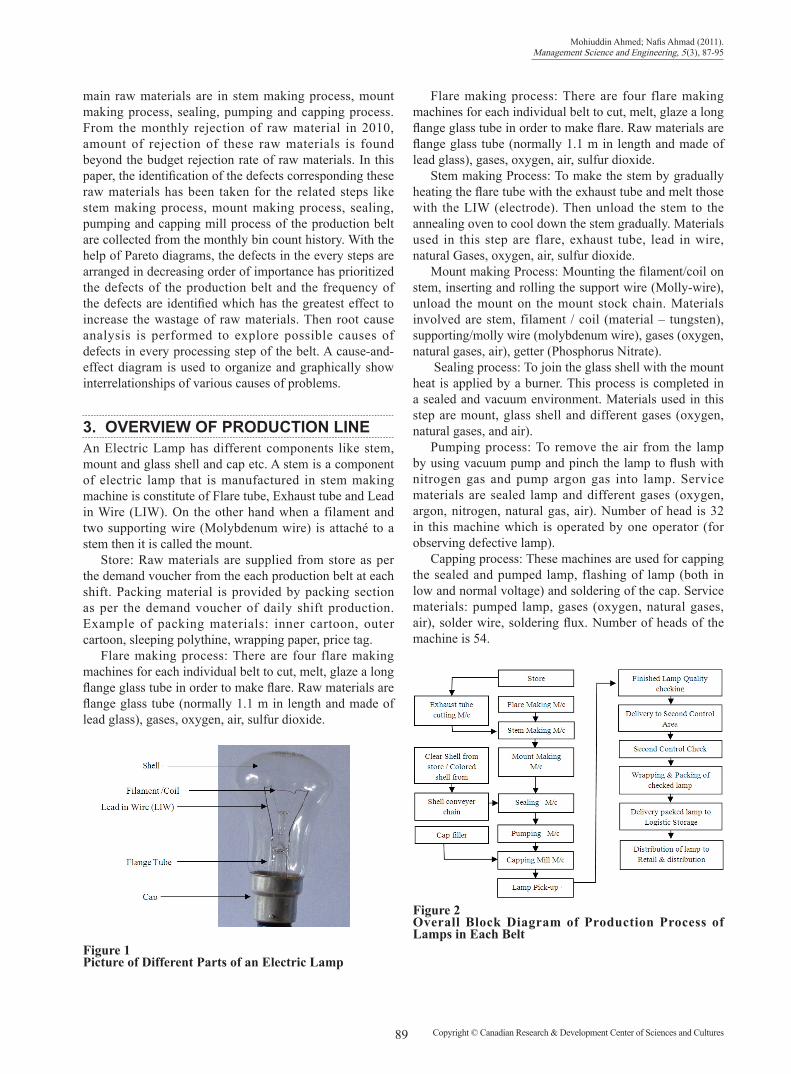
3. OVERVIEW OF PRODUCTION LINEAn Electric Lamp has different components like stem, mount and glass shell and cap etc. A stem is a component of electric lamp that is manufactured in stem making machine is constitute of Flare tube, Exhaust tube and Lead in Wire (LIW). On the other hand when a filament and two supporting wire (Molybdenum wire) is attaché to a stem then it is called the mount.
Store: Raw materials are supplied from store as per the demand voucher from the each production belt at each shift. Packing material is provided by packing section as per the demand voucher of daily shift production. Example of packing materials: inner cartoon, outer cartoon, sleeping polythine, wrapping paper, price tag.
Flare making process: There are four flare making machines for each individual belt to cut, melt, glaze a long flange glass tube in order to make flare. Raw materials are flange glass tube (normally 1.1 m in length and made of lead glass), gases, oxygen, air, sulfur dioxide.
Figure 1Picture of Different Parts of an Electric Lamp
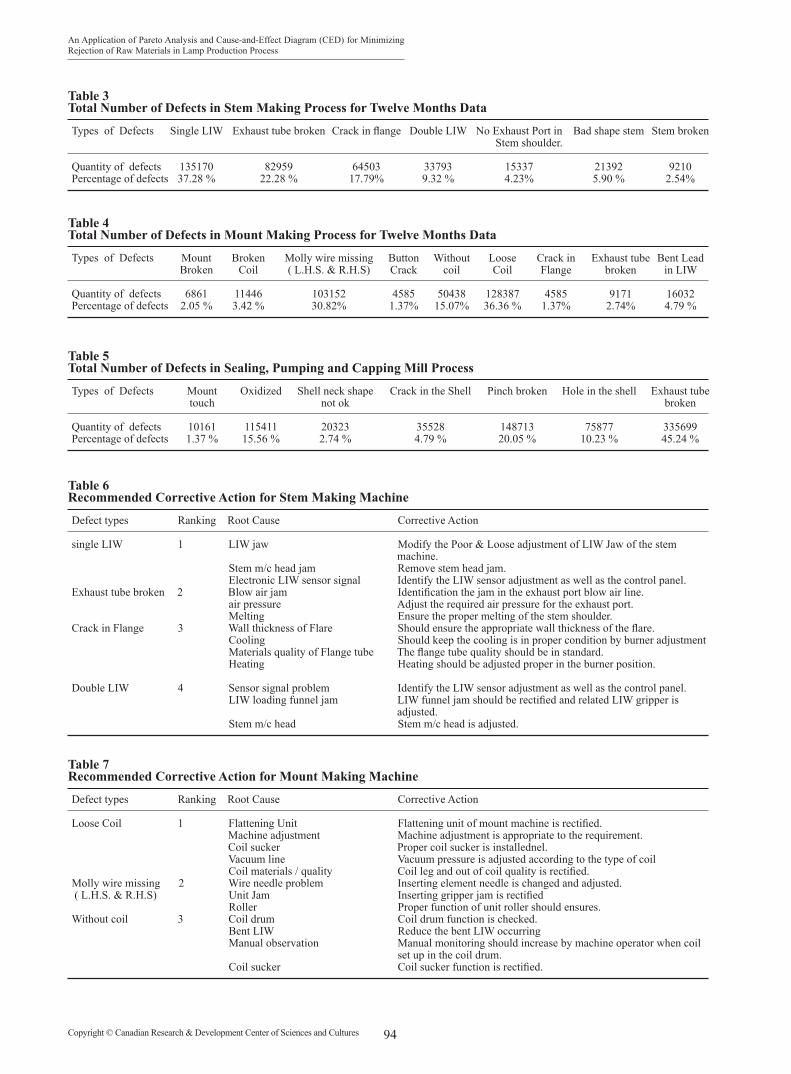
Figure 2Overall Block Diagram of Production Process of Lamps in Each Belt
Flare making process: There are four flare making machines for each individual belt to cut, melt, glaze a long flange glass tube in order to make flare. Raw materials are flange glass tube (normally 1.1 m in length and made of lead glass), gases, oxygen, air, sulfur dioxide.
Stem making Process: To make the stem by gradually heating the flare tube with the exhaust tube and melt those with the LIW (electrode). Then unload the stem to the annealing oven to cool down the stem gradually. Materials used in this step are flare, exhaust tube, lead in wire, natural Gases, oxygen, air, sulfur dioxide.
Mount making Process: Mounting the filament/coil on stem, inserting and rolling the support wire (Molly-wire), unload the mount on the mount stock chain. Materials involved are stem, filament / coil (material – tungsten), supporting/molly wire (molybdenum wire), gases (oxygen, natural gases, air), getter (Phosphorus Nitrate).
Sealing process: To join the glass shell with the mount heat is applied by a burner. This process is completed in a sealed and vacuum environment. Materials used in this step are mount, glass shell and different gases (oxygen, natural gases, and air).
Pumping process: To remove the air from the lamp by using vacuum pump and pinch the lamp to flush with nitrogen gas and pump argon gas into lamp. Service materials are sealed lamp and different gases (oxygen, argon, nitrogen, natural gas, air). Number of head is 32 in this machine which is operated by one operator (for observing defective lamp).
Capping process: These machines are used for capping the sealed and pumped lamp, flashing of lamp (both in low and normal voltage) and soldering of the cap. Service materials: pumped lamp, gases (oxygen, natural gases, air), solder wire, soldering flux. Number of heads of the machine is 54.
Mohiuddin Ahmed; Nafis Ahmad (2011). Management Science and Engineering, 5(3), 87-95

90Copyright © Canadian Research & Development Center of Sciences and Cultures 91
4. DATA COLLECTIONRejection data of five main raw materials due to defects occurred during the manufacturing process of the production belt BHH-I group has been taken from “material reject 2010” reports for twelve months starting from January 2010 to December 2010 and is presented in Table:1. It provides detail information about rejection of different raw materials with corresponding monthly production figure. Defects occurred in stem making process are single LIW, exhaust tube broken, crack in flange, double LIW, no exhaust port in stem shoulder, bad shape stem and stem broken. Single LIW stem is manufactured, when there is only one LIW/electrode is attached to stem. Sometimes exhaust tube is broken from the shoulder point of the stem. Crack in the body of the flare tube creates flange crack. Loading or attaching double LIW in any side of the stem shoulder creates the defective stem that is called the double Lead in Wire stem. Stem shoulder has out of quality in dimension, shape, melting which occurs to bad shape stem. As revealed by the observation in the mount making process, most of the defects were due to bent lead in wire, exhaust tube broken, crack in flange, loose coil, without coil, button Crack, molly wire missing (L.H.S. & R.H.S), broken coil,
mount broken. Coil attached only one LIW and other side open on the stem occurs the loose coil mount. Molly wire missing occurs (R.H.S)/ (L.H.S). L.H.S Molly wire unit do not attach the molybdenum wire. R.H.S Molly wire unit do not attach the Molybdenum wire. As revealed from data shell wall thickness, heating, burner adjustment problem are the main causes for occurring the crack in shell during sealing process.
Table 1Month Wise Defective Items in Different Stages of lamp Making Process
Month Stem making Mount making Sealing, pumping and Process Process capping process
JAN 43297 39966 81716FEB 32488 29989 67548MAR 24420 22541 49796APR 32809 30285 49333MAY 34537 31880 57021JUN 44587 41157 54426JUL 39033 36030 92535AUG 24502 22617 64713SEP 12556 11590 43474OCT 17865 16692 57070NOV 24998 23075 52940DEC 31274 28834 71141Total 362364 334657 741713
Table 2 Month Wise Rejection of Raw Materials in the BHH-I Group Production Belt
Rejection of raw materials in 2010
Cap Shell Coil L I W Flare
Month
JAN FEB MAR APR MAY JUN JUL AUG SEP OCT NOV DEC
Production Quantity
12386655853908914008933107957807252909317268111206032001034610922819836302
(Kg)
431.01347.14 295.23
360364.99454.4502.41315.2183.71246.71248.55333.27
Quantity (pcs)
148626119703101803124218125857156689173246108689 63347 85071 85707114920
%
12.00%20.45%11.42%13.91%15.82%21.60%18.59%13.40%10.50%8.22%9.29%13.74%
Quantity(pcs)
363410280120219336234744262076289820353948228861143640197740235498307660
Quantity(Pair)
1817051400601096681173721310381449101769741144317182098870117749153830
%
14.67%23.93%12.30%13.14%16.47%19.98%18.99%14.11%11.91%9.56%12.76%18.39%
Quantity(pcs)
1646051303107880095690113420118910152574112380676959159599581125098
%
13.29%22.26%8.84%10.71%14.25%16.39%16.38%13.85%11.22%8.85%10.79%14.96%
Quantity(pcs)
817166754849796493335702154426925356471443474570705294071141
%
6.60%11.54%5.59%5.52%7.17%7.50%9.93%7.98%7.21%5.52%5.74%8.51%
Quantity(pcs)
604382502833202303642496622442296902624218068304322741832601
%
4.88%4.28%3.72%3.40%3.14%3.09%3.19%3.24%3.00%2.94%2.97%3.90%
5. PARETO ANALYSIS AND CED
5.1 Stem Making ProcessIn stem making process, single LIW is the most frequent defect with as much as 37.28% of the total as shown in Figure-3. Among other defects contribution of exhaust tube broken is 22.28%, crack in flange is 17.79%, double LIW type defect is 9.32%. These four types of defects are the “vital few” factors that cause 87.27% of total rejection in the stem making process. Other reasons for defects are bad shaped stem, no exhaust port, stem broken etc. The bar graph in Figure 3 shows the percentage of each type of
factors for defects in the process with a line of cumulative percent.
A stem which is manufactured in stem making machine of the production belt is constitued of one flange tube, two LIW and an exhaust tube. The small flange tube is produced from long flare tube in flare cutting machine and exhaust tube is also produced in the exhaust tube cutting machine. LIW is directly feed into the hopper of the stem making machine of the belt. Single LIW stem is produced for different reasons. LIW is hold by LIW jaw of each head of stem machine. LIW jaw problem, stem machine head jam creats this type of defect. The electronic sensor
An Application of Pareto Analysis and Cause-and-Effect Diagram (CED) for Minimizing Rejection of Raw Materials in Lamp Production Process

90 91 Copyright © Canadian Research & Development Center of Sciences and Cultures
signal from machine control that is required to set up the LIW into jaw, if it fails to pass the signal, then single LIW defect creates. Exhaust tube, flange tube should be heated properly by using the appropiate combination of gas, oxygen, blow air in order to get the good shape stem. On the same time compressed air pressure, oxygen pressure should be maintained. Each head of the stem machine can be made bad shape stem due to misadjustment or missalignment. Exhaust port of stem is necessay in stem because it is used to taken out air of lamp in the sealing process. Blow air line jam, air pressure problem, in accurate melting can occur without exhaust port stem or poor exhaust port. Stem can be broken due to improper unloading of stem from stem machine to the annealing oven. Flange crack (micro-crack ) can also be a reason of the broken stem. Heating variation in stemming process is also major reason of stem broken. There are two LIW at two ends of the stem to pass the electricity to the filament to elluminate. If double LIW is placed at any of the end of the stem then it causes rejection. LIW is feeded to the stem through the LIW funnel from the hopper. Sensor signal that is needed to feed the LIW in the stem. Sensor signal problem, LIW loading funnel jam and stem machine head problem occurs the double LIW problem. Exhaust tube is vital part of the stem. Stem head jaw problem, exhaust tube glass poor quality, inaccurate heating, cooling is not sufficient and melting problem causes exhaust tube to be broken. Due to flange tube wall thickness problem, stem head jaw problem, heating and cooling prolem, flange tube materials quality problem crack is created in flare.
A: Single Lead in WireB: Double Lead in WireC: No Exhaust PortD: Bad Shape StemE: Flange CrackF: Exhaust tube broken
Figure 3Different Types of Defective Stems in Stem Making Process
Figure 4Pareto Diagram Showing the Percentage of Different Defect Type in Stem Making Process
Figure 5 Cause Enumeration of Different Type of Defects/Rejects in Stem Making Process
Mohiuddin Ahmed; Nafis Ahmad (2011). Management Science and Engineering, 5(3), 87-95
5.2 Mount Making ProcessIn mount making process loose coil, molly-wire missing (L.H.S. & R.H.S), without coil are the major factors which contribute 82.25% to total rejection in this step. Defects in mount making process are prioritized on the basis of their contribution to total rejection as shown in Table 7. Mount
broken is one of the most important defects of the mount making process. Mount loader is used to feed the mount to the sealing machine. Any kind mechanical misalignment, improper adjustment or inaccurate electrical signal that actuates the mount loader to load the mount into the sealing head may create the mount fracture/crack. Each

92Copyright © Canadian Research & Development Center of Sciences and Cultures 93
Figure 7Pareto Diagram Showing the Percentage of Defect Type in Mount Making Process
Figure 8 Cause Enumeration of Different Type of Defects/Rejects in Mount Making Process
An Application of Pareto Analysis and Cause-and-Effect Diagram (CED) for Minimizing Rejection of Raw Materials in Lamp Production Process
A : Molly wire missing (RHS) B : Molly wire missing (LHS) C: Without Coil D : Bent LIWE : Loose Coil F : Button Crack G: Exhaust tube broken
Figure 6Different Types of Defective Mounts in Mount Making Process
5.3 Sealing, Pumping and Capping ProcessImportant defects for rejection in the sealing, pumping and capping process with their respective contribution are shown in Figure-7. Here 91.08 % of total defects are contributed by exhaust tube broken, pinch broken, oxidized and hole in the shell. Shell wall thickness
mount head should be aligned properly so that it should hold the mount during mounting process. Molly wire can be missed in either L.H.S or R.H.S. Molly wire is attached through the inserting element. Each Inserting element has wire needle to feed the molly wire to the mount button for attaching it. Roller is a vital component of the inserting element. Any kind of malfunction of roller produces molly wire missing. Without coil is occurred when mount is produced without any coil/filament. Coil drum acts as the coil feeder. Due to coil leg problem, without coil mount is produced. Broken coil occurs due to molly wire rolling element improper functioning. On the other hand spreader unit of the mount making process spreads the LIW. Any malfunction, occurs the broken coil
variation, heating variation and seal shaper fault are the main reason of the crack in shell. On the other hand, sealing head adjustment problem, seal shaper problem, adjustment problem are the reasons of the shell neck shape inaccuracy. Oxidized is one of the important defects in the sealing, pumping process in lamp production.
which is a defect of the mount machine. bent LIW, loose coil, button crack, crack in flange, mount broken, molly-wire missing (R.H.S and L.H.S), without coil, broken coil, exhaust tube broken are the main causes of different type of defects in mount making process. LIW can be bent for various reasons like hammer problem, stem loading not proper in mount machine, flattening unit not functioning properly, sensor problem etc. Loose coil is due to flattenng unit problem, machine adjustment, coil sucker is not functioning properly due to adjustment problem,vaccum is not sufficient to hold the filament/coil, coil quality is not upto the standard. Oxygen pressure updown trouble, heating insufficient occur the button crack which hold the molly wire of the mount.

92 93 Copyright © Canadian Research & Development Center of Sciences and Cultures
A : Pinch broken B : shell neck shape not ok C: mount touch D : Exhaust tube broken E : Crack in Shell F : Oxidized
Mohiuddin Ahmed; Nafis Ahmad (2011). Management Science and Engineering, 5(3), 87-95
Figure 10Pareto Diagram Showing the % of Different Defect Type in Sealing, Pumping, Capping Mill Process
Figure 11 Cause Enumeration of Different Type of Defects/Rejects in Sealing, Pumping, Capping Process
Figure 9Different Types of Defective Lamps in Sealing, Pumping and Capping Process
Oxidized lamp may occur if air is passed into the inside of the lamp. Flange tube crack, any crack in the shell also responsible for oxidized lamp. Oxidized lamps basically occur in the pump machine. Every lamp table of the pump machine hold the lamp through the rubber tube. So crack in rubber tube will create the oxidize lamp. Rubber tube is necessary to vacuum the lamp from. Any micro crack in the rubber tube occur the oxidize lamp. Pinch is a vital portion of a pump lamp. It is done by melting the exhaust tube at is last end to make the lamp completely vacuum
tight. Pinching hammer is necessary to force the pressure from both side of the exhaust tube to make it vacuum. For melting purpose burner is used. Burner adjustment, pinching hammer poor function are the reasons for the pinch broken defects. Mount touch occur when the LIW is touched inside surface of the shell in the lamp. Shell loader which loads the shell in the sealing head during sealing process. Shell loader, mount loader malfunction will produce the mount touch type defects.
6. RESULT & DISCUSSIONBased on the Pareto principle of 80/20 rule, in stem making process it is found that single LIW is the rank first defects as 37.28 %, then Exhaust tube broken is in rank second as 22.28 % of defects, then Crack in Flange as ranked third as 17.79 % of defects then Double LIW type defect is ranked fourth as 9.32 % of defects .Loose Coil type defect is ranked as first as occurring 38.36 % of total defects, Molly wire missing (L.H.S. & R.H.S) is second as occurring 30.82 % of total defects, Without coil is ranked as third as 15.07 % of defects in mount making process. In Sealing, Pumping, Capping mill Process, the Exhaust
tube broken is ranked as first defect as 45.24% of total defects, Pinch broken is rank Second defects as 20.24 % and Oxidized is ranked third as 15.56 % of total defects. After getting to know top priority defect type the CED methodology has been used to identify the root causes in different processing steps of the production belts. Application of CED Diagram in Lamp Manufacturing Industry creates new chances for achieving a better quality of products (final and intermediate) and higher production effectiveness. This can be accomplished by extraction and visualization of the knowledge hidden in the recorded past data. After a thorough analysis of the actual root causes for the defects, the following remedies were suggested:
94Copyright © Canadian Research & Development Center of Sciences and Cultures 95
Table 3 Total Number of Defects in Stem Making Process for Twelve Months Data
Types of Defects
Quantity of defects Percentage of defects
Single LIW
13517037.28 %
Exhaust tube broken
8295922.28 %
Crack in flange
6450317.79%
Double LIW
337939.32 %
No Exhaust Port in Stem shoulder.
153374.23%
Bad shape stem
213925.90 %
Stem broken
92102.54%
Table 5 Total Number of Defects in Sealing, Pumping and Capping Mill Process
Types of Defects
Quantity of defects Percentage of defects
Mounttouch
101611.37 %
Oxidized
11541115.56 %
Shell neck shapenot ok
203232.74 %
Crack in the Shell
355284.79 %
Pinch broken
14871320.05 %
Hole in the shell
7587710.23 %
Exhaust tube broken
33569945.24 %
Table 4 Total Number of Defects in Mount Making Process for Twelve Months Data
Types of Defects
Quantity of defects Percentage of defects
Mount Broken
68612.05 %
Broken Coil
114463.42 %
Molly wire missing( L.H.S. & R.H.S)
10315230.82%
Button Crack
45851.37%
Withoutcoil
5043815.07%
LooseCoil
12838736.36 %
Crack inFlange
45851.37%
Exhaust tubebroken
91712.74%
Bent Lead in LIW
160324.79 %
Table 6Recommended Corrective Action for Stem Making Machine
Defect types Ranking Root Cause Corrective Action
single LIW 1 LIW jaw Modify the Poor & Loose adjustment of LIW Jaw of the stem machine. Stem m/c head jam Remove stem head jam. Electronic LIW sensor signal Identify the LIW sensor adjustment as well as the control panel.Exhaust tube broken 2 Blow air jam Identification the jam in the exhaust port blow air line. air pressure Adjust the required air pressure for the exhaust port. Melting Ensure the proper melting of the stem shoulder.Crack in Flange 3 Wall thickness of Flare Should ensure the appropriate wall thickness of the flare. Cooling Should keep the cooling is in proper condition by burner adjustment Materials quality of Flange tube The flange tube quality should be in standard. Heating Heating should be adjusted proper in the burner position.
Double LIW 4 Sensor signal problem Identify the LIW sensor adjustment as well as the control panel. LIW loading funnel jam LIW funnel jam should be rectified and related LIW gripper is adjusted. Stem m/c head Stem m/c head is adjusted.
Table 7Recommended Corrective Action for Mount Making Machine
Defect types Ranking Root Cause Corrective Action
Loose Coil 1 Flattening Unit Flattening unit of mount machine is rectified. Machine adjustment Machine adjustment is appropriate to the requirement. Coil sucker Proper coil sucker is installednel. Vacuum line Vacuum pressure is adjusted according to the type of coil Coil materials / quality Coil leg and out of coil quality is rectified. Molly wire missing 2 Wire needle problem Inserting element needle is changed and adjusted. ( L.H.S. & R.H.S) Unit Jam Inserting gripper jam is rectified Roller Proper function of unit roller should ensures. Without coil 3 Coil drum Coil drum function is checked. Bent LIW Reduce the bent LIW occurring Manual observation Manual monitoring should increase by machine operator when coil set up in the coil drum. Coil sucker Coil sucker function is rectified.
An Application of Pareto Analysis and Cause-and-Effect Diagram (CED) for Minimizing Rejection of Raw Materials in Lamp Production Process

94 95 Copyright © Canadian Research & Development Center of Sciences and Cultures
Table 8Recommended Corrective Action for Sealing, Pump and Capping Mill Machine
Defect types Ranking Root Cause Corrective Action
Exhaust tube broken 1 Mount loader Mount loader to be adjusted and repair. Ex. Tube materials Quality Exhaust tube materials should be in standard quality. Loading Arm Alignment Lamp transferring arm to pumping is to be repair.. Sealing m/c spindle jam Bad cap of sealing spindle to be identified and repaired weekly as per maintenance schedule and in the spindle hole should be free of scrap glass. Broken Lamp Lamp broken should be clear out as soon as possible. Pinch broken 2 Heating Heating of Pinch should keep accurate. Burner adjustment Pinching Burner alignment should keep proper. Ex. Tube materials Quality Check and Identify the Exhaust tube material quality. Oxidized 3 Crack in shell Shell crack is rectified. Flange crack Flange crack is rectified. Rubber ring Rubber ring of the Lamp table is rectified and replace.
CONCLUSIONPareto principle and CED are used to identify and evaluate different defects and causes for these defects responsible for rejection of materials at different stages of electric lamp making process. According to the Pareto analysis, in stem making process vital few defects are: single LIW, exhaust tube broken, crack in Flange, double LIW are responsible for 87.27 % of the total defects. So more importance should be given to these vital few defects and the root causes of these defects. According to the root cause, the corrective action is recommended in order to reduce the defects to minimize the rejection of the raw materials. Similar to the stem making process, vital and trivial factors for defects in other steps are identified, analyzed using CED and finally recommendation for corrective actions are discussed here. In this work, the identification of the problems or root causes is limited to some particular stages of manufacturing. So CED can also be used for every individual step of manufacturing to improve product quality and productivity. CED is very useful in detecting the appearance of abnormalities of the process in the form of excessive variations of process parameters, but they are unable to indicate the causes of the irregularities. Pareto chart is used as important tools for preliminary identification of the most significant defects by giving priority. It is worth noting that this method totally eliminate the less significant defects and does not explain the unexpected behavior of these defects. It is important to conduct further analysis on various other defects, less frequent defects to improve quality and productivity by reducing rejection of raw materials in this specific manufacturing area.
REFERENCES[1] Ishikawa, K. (1968). Guide to Quality Control . Tokyo, Japan:
Asian Productivity Organization.[2] Perzyk, M. (2007). Statistical and Visualization Data Mining
Tools for Foundry Production. Foundry Commission of the Polish Academy of Sciences, 7(3), 111 – 116.
[3] Mahto, D., & Kumar, A. (2008). Application of Root Cause Analysis in Improvement of Product Quality and Productivity. Journal of Industrial Engineering and Management, 01(02), 16-53.
[4] Chandna, P., & Chandra, A. (2009). Quality Tools to Reduce Crankshaft Forging Defects: An Industrial Case Study. Journal of Industrial and Systems Engineering, 3(1), 27-37.
[5] Khekalei, S. N., Chatpalliwar, A. S., & Thaku, N. (2010). Minimization of Cord Wastages in Belt Industry Using DMAIC. International Journal of Engineering Science and Technology, 2(8), 3687-3694.
[6] Yousoff, S. M. M., Rohani, J. M., Harun W., Hamid, W., & Ramly, E. (2004). Plastic Injection Molding Process Characterization Using Experimental Design Technique: A Case Study. Journal Teknologi, Universiti Teknologi Malaysia, 41(A), 1–16.
[7] Bernolak, I. (1997). Effective Measurement and Successful Elements of Company Productivity: The Basis of Competitiveness and World Prosperity. International Journal of Production Economics, 52(1-2), 203-213.
[8] Wilson, P. F., Dell, L. D., & Anderson, G. F. (1993). Root Cause Analysis: A Tool for Total Quality Management . Milwaukee: ASQC Quality Press.
[9] Dew, J. R. (1991). In Search of the Root Cause. Quality Progress, 24(3), 97-107.
[10] Sproull, B. (2001). Process Problem Solving: A Guide for Maintenance and Operations Teams. Portland: Productivity Press.
[11] Rolstadas A. (2010). IMS2020, Roadmap on Sustainable Manufacturing, Energy Efficient Manufacturing and Key Technologies . Retrieved from Http://www.tapironline.no/last-ned/385, 15 September 2011.
Mohiuddin Ahmed; Nafis Ahmad (2011). Management Science and Engineering, 5(3), 87-95