8D Eight Disciplines Five-Whys Process Ishikawa-fishbone ...
Upload
truongquynhCategory
view
223download
2
James C. Benneyan, PhD, DirectorHealthcare Systems Engineering InstituteCMS Innovation Healthcare Systems Engineering Center NSF Center for Health Organization TransformationNortheastern University, Boston MAwww.HSyE.org
Basic Process Improvement Methods in Health CareSummer Intern Orientation, May 2015
Northeastern University © 2012www.HSyE.orgHealthcare Systems Engineering Institute
Outline
1. The big 3:i. Six sigma (Motorola, GE)ii. Lean (Toyota production system)iii. PDSA (Plan Do Study Act)
2. Othersi. Theory of constraintsii. others
3. Institute for Healthcare Improvement (IHI)i. “Model for Improvement”ii. Collaborative improvement
2
Northeastern University © 2012www.HSyE.orgHealthcare Systems Engineering Institute
Healthcare Systems Engineering Institute
3
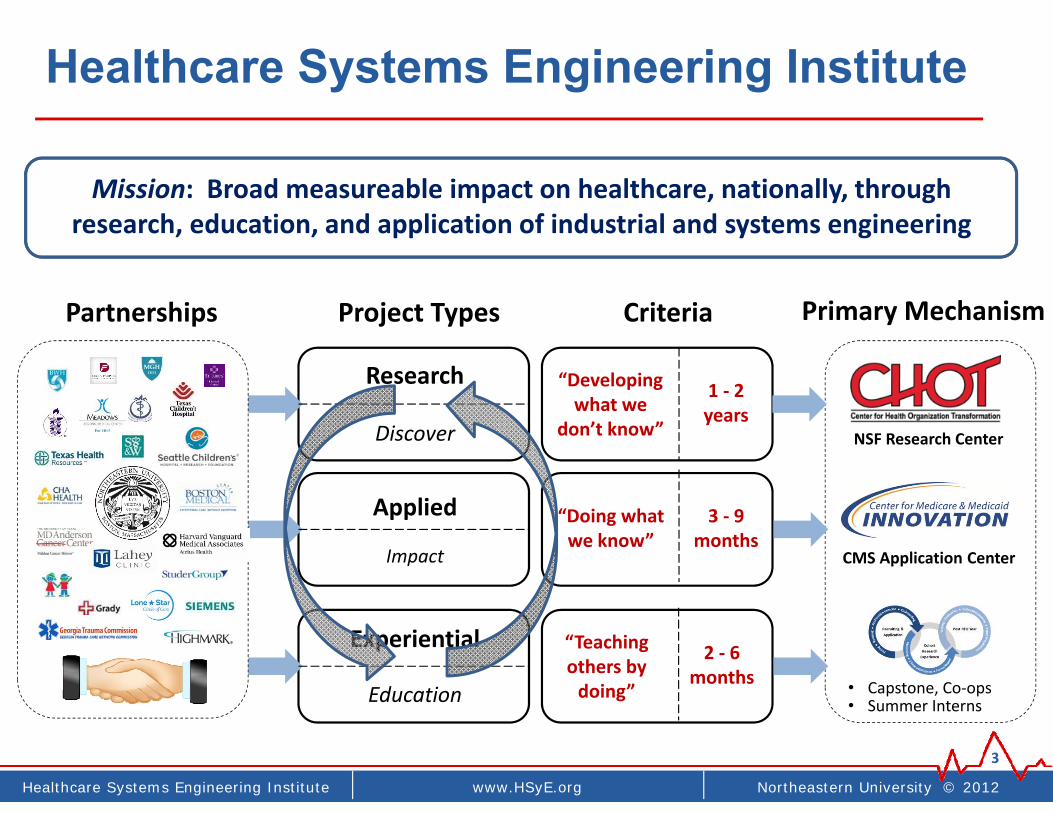
Partnerships Project Types Criteria Primary Mechanism
NSF Research Center
CMS Application Center
• Capstone, Co‐ops• Summer Interns
Research
Discover
Applied
Impact
Experiential
Education
1 ‐ 2years
3 ‐ 9 months
“Developing what we
don’t know”
“Doing what we know”
2 ‐ 6 months
“Teaching others by doing”
Mission: Broad measureable impact on healthcare, nationally, through research, education, and application of industrial and systems engineering

Northeastern University © 2012www.HSyE.orgHealthcare Systems Engineering Institute
Recall (70-20-10 rule)
4
Simple Complex
Industrial and Systems Engineering
1. Methods‐based Model‐based
PDSA
Lean
Six Sigma2. Computer simulation
4. Mathematical optimization
3. Probability and stochastic modelsetc etc

Northeastern University © 2012www.HSyE.orgHealthcare Systems Engineering Institute
1.Basic Improvement Methods
(70% of it)
10
Northeastern University © 2012www.HSyE.orgHealthcare Systems Engineering Institute
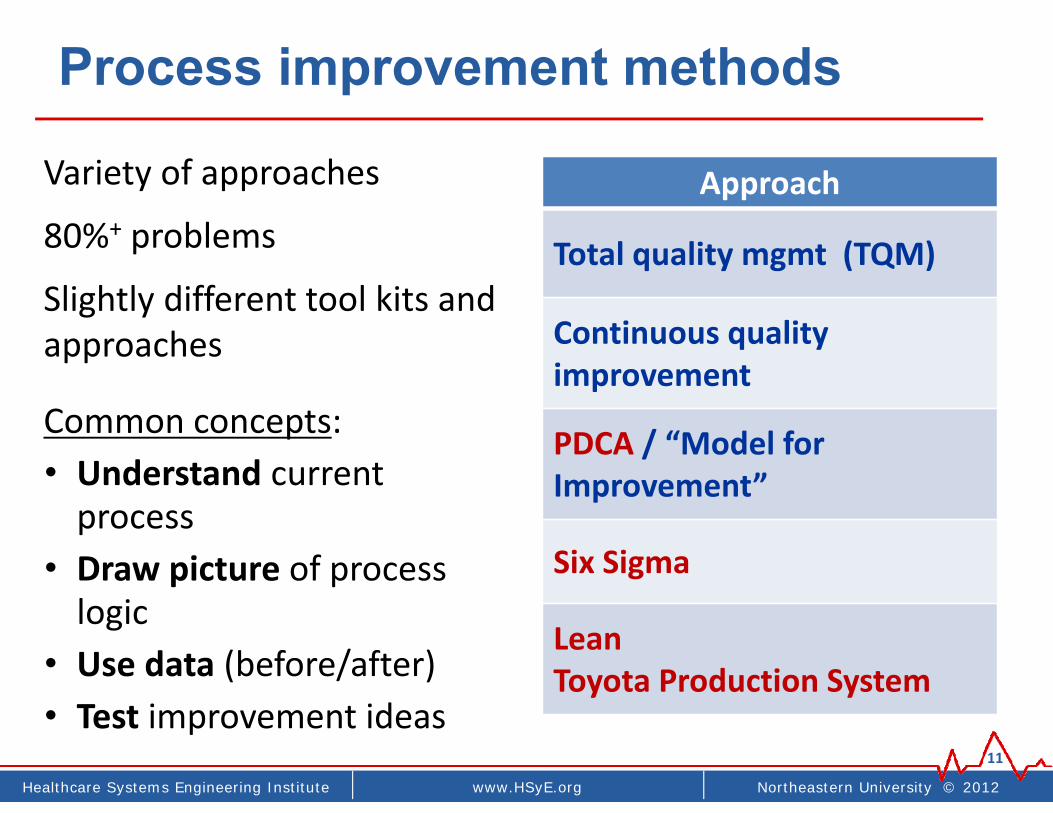
Process improvement methods
11
Approach
Total quality mgmt (TQM)
Continuous quality improvement
PDCA / “Model for Improvement”
Six Sigma
LeanToyota Production System
Variety of approaches
80%+ problems
Slightly different tool kits and approaches
Common concepts:• Understand current process
• Draw picture of process logic
• Use data (before/after)• Test improvement ideas

Northeastern University © 2012www.coe.neu.edu/healthcareHealthcare Systems Engineering Institute
Similar / different focus

Northeastern University © 2012www.coe.neu.edu/healthcareHealthcare Systems Engineering Institute
Total quality management (TQM)

Northeastern University © 2012www.HSyE.orgHealthcare Systems Engineering Institute
TQM overview
• Popularized in U.S. industry in 1970‐80’s
• “Guru’s”: Deming, Juran, Feigenbaum, Crosby, …
• Appreciation of the system as a whole
• Focus on process quality
• 85% problems due to process (not people)
• Use of statistical methods to understand, monitor, and improve quality
• Adapted into healthcare, 1990’s
“Quality is Job 1”

Northeastern University © 2012www.HSyE.orgHealthcare Systems Engineering Institute
Common approach & philosophy
• Management’s job is to create a system to improve quality and remove barriers to improvement
• There is no quick fix, no instant pudding, no magic bullet ‐continuous improvement of process required
• Long‐term focus on continuous never‐ending often incremental improvements
• Employee involvement in QI as valuable resource
• Engagement of front‐line workers in improvement as key process experts (quality improvement circles)
• Use of data and statistical methods to improve quality, not to measure/reward/punish workers
• Study of variation (natural vs. special cause) (SPC)

Northeastern University © 2012www.HSyE.orgHealthcare Systems Engineering Institute
Northeastern University © 2012www.coe.neu.edu/healthcareHealthcare Systems Engineering Institute
Continuous quality improvement (CQI)

Northeastern University © 2012www.HSyE.orgHealthcare Systems Engineering Institute
Common QI/6tools
23
“Basic 7 Tools”
• Check sheets
• Pareto charts
• Cause‐and‐effect “fishbone” diagrams
• Process flow charts
• Histograms
• Scatter diagrams
• Run and control charts

Northeastern University © 2012www.HSyE.orgHealthcare Systems Engineering Institute
Examples
Monthly Volume
Temps hired dueto high volume
(r = 0.23)
Billin
g co
ding
erro
r rat
e
0
200
400
600
800
1000
Posi
t
Dar
k
Ligh
t
Mot
ion
Oth
er
Cho
ice
Equi
p
Art
if.
DB
L EX
J R
eas
K R
eas
L R
eas
Trivial/vital many (can add up to a lot)
Critical few
Reasons for Poor Mammogram Image
Freq
uenc
y
The 5 M’s and 5 Why’s
Northeastern University © 2012www.HSyE.orgHealthcare Systems Engineering Institute
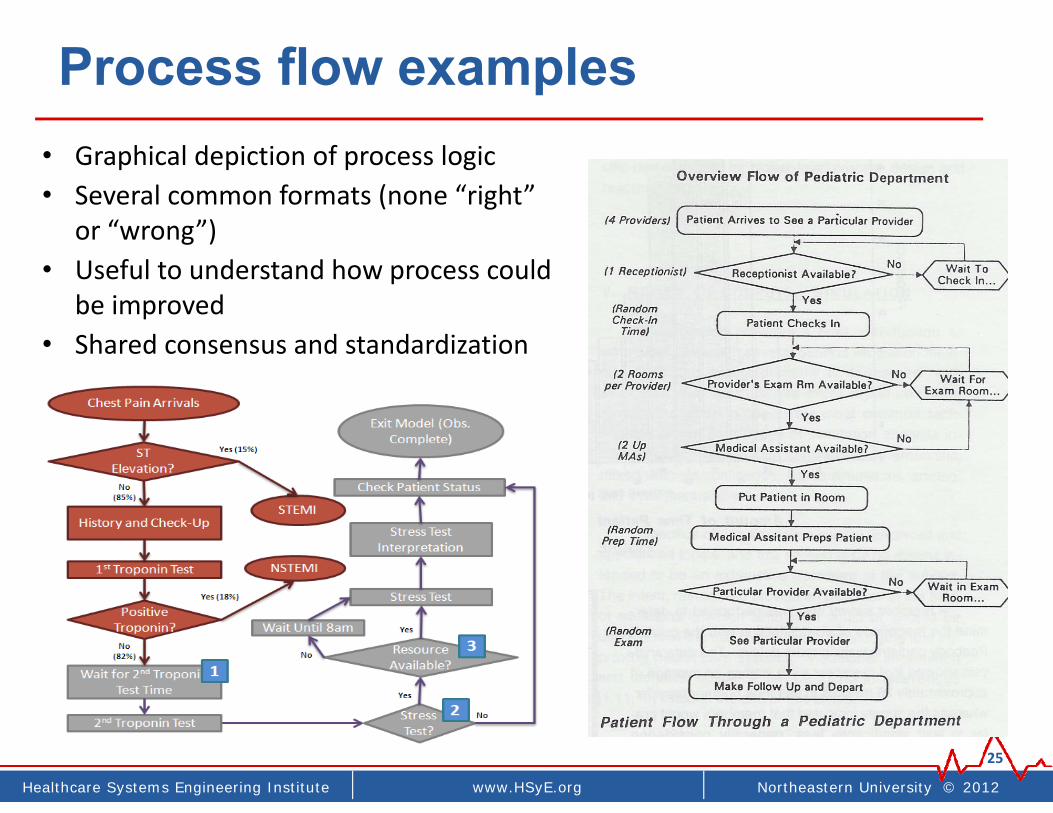
Process flow examples
25
• Graphical depiction of process logic• Several common formats (none “right”
or “wrong”)• Useful to understand how process could
be improved• Shared consensus and standardization

Northeastern University © 2012www.HSyE.orgHealthcare Systems Engineering Institute
How do you make tea?
26
Making Tea
Healthcare Systems Engineering | www.coe.neu.edu/healthcare | Northeastern University © 2010
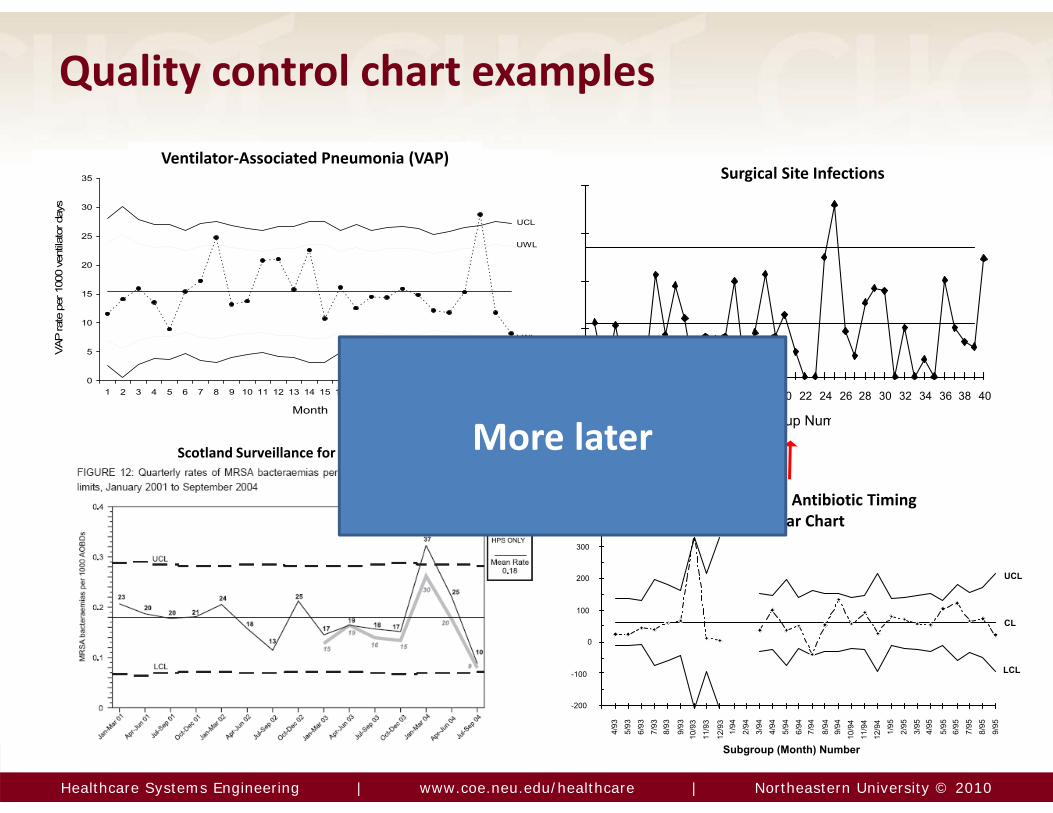
Quality control chart examples
0
5
10
15
20
25
30
35
1 2 3 4 5 6 7 8 9 10 11 12 13 14 15 16 17 18 19 20 21 22 23 24 25 26 27
Month
VAP
rate
per
100
0 ve
ntila
tor d
ays
UCL
UWL
LWL
LCL
Subgroup Num
2 4 6 8 10 12 14 16 18 20 22 24 26 28 30 32 34 36 38 40
Surgical Site Infections
Subgroup (Month) Number
-200
-100
0
100
200
300
4/93
5/93
6/93
7/93
8/93
9/93
10/9
311
/93
12/9
31/
942/
943/
944/
945/
946/
947/
94
8/94
9/94
10/9
411
/94
12/9
41/
952/
953/
954/
95
5/95
6/95
7/95
8/95
9/95
UCL
CL
LCL
Trial X-bar Control ChartPerioperative Antibiotic Timing
X‐bar Chart
Ventilator‐Associated Pneumonia (VAP)
Scotland Surveillance for Regional MRSA More later

Northeastern University © 2012www.coe.neu.edu/healthcareHealthcare Systems Engineering Institute
Six sigma(a CQI implementation approach)

Northeastern University © 2012www.HSyE.orgHealthcare Systems Engineering Institute
“Six Sigma” DMAIC basics
30
• Focus: Quality improvement
• Structured approaches, integrated measuring– DMAIC: Improve existing process– DFSS: Design for Six Sigma– DMADV: Define, Measure, Analyze, Design Verify

Northeastern University © 2012www.HSyE.orgHealthcare Systems Engineering Institute
DMAIC example
31
• Define: Process maps for EBM delivery (AMI, SSI, CHF)
• Measure: Baseline element and composite measures
• Analyze: Weekly review of 10 random patient charts by change agents and case coordinators. Root cause analysis
• Improve: Staff education, order sets, Protocols, check lists
• Control: Standardize processesCompliance monitoring
http://www.commonwealthfund.org/Content/Innovations/Case-Studies/2007/Nov/Case-Study--Improving-Performance-at-Charleston-Area-Medical-Center.aspx
Northeastern University © 2012www.HSyE.orgHealthcare Systems Engineering Institute
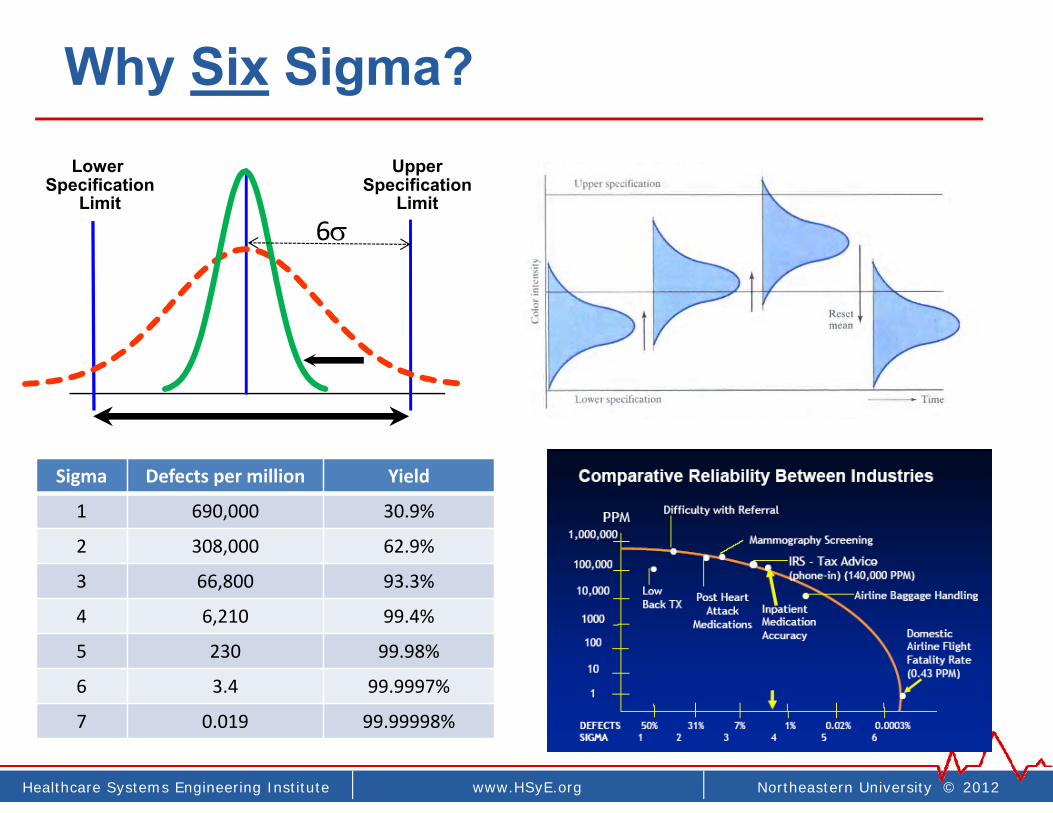
Why Six Sigma?Upper
SpecificationLimit
Lower Specification
Limit6
Sigma Defects per million Yield
1 690,000 30.9%
2 308,000 62.9%
3 66,800 93.3%
4 6,210 99.4%
5 230 99.98%
6 3.4 99.9997%
7 0.019 99.99998%
Northeastern University © 2012www.coe.neu.edu/healthcareHealthcare Systems Engineering Institute
‘Lean’Toyota production system (TPS)
Healthcare Systems Engineering | www.coe.neu.edu/healthcare | Northeastern University © 2010
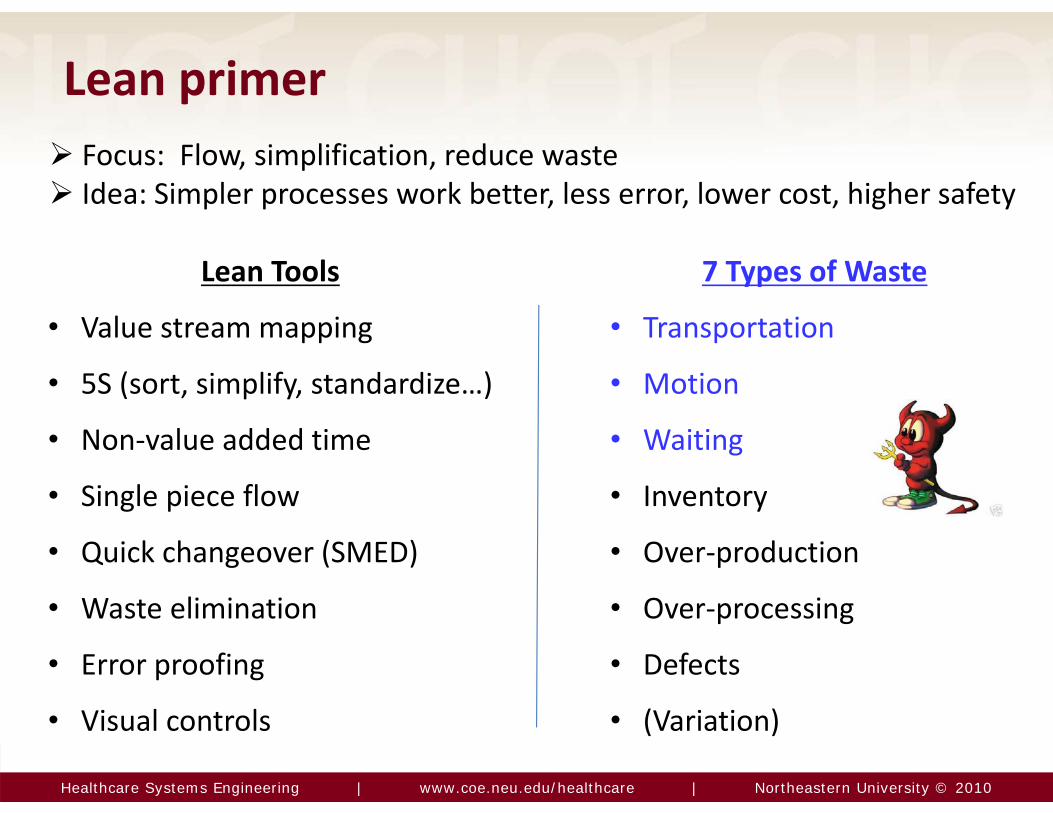
Lean primer
7 Types of Waste
• Transportation
• Motion
• Waiting
• Inventory
• Over‐production
• Over‐processing
• Defects
• (Variation)
Lean Tools
• Value stream mapping
• 5S (sort, simplify, standardize…)
• Non‐value added time
• Single piece flow
• Quick changeover (SMED)
• Waste elimination
• Error proofing
• Visual controls
Focus: Flow, simplification, reduce waste Idea: Simpler processes work better, less error, lower cost, higher safety

Northeastern University © 2012www.HSyE.orgHealthcare Systems Engineering Institute
Examples of non-value added activities
Approving
Batching
Searching
Walking
Waiting

Northeastern University © 2012www.HSyE.orgHealthcare Systems Engineering Institute
“5 S”
38
SortStandardizeSimplifySet in orderSustain(Safety)
SeiriSeitonSeisoSeiketsushitsuke

Northeastern University © 2012www.HSyE.orgHealthcare Systems Engineering Institute
Healthcare examples
39
“5S”

Healthcare Systems Engineering | www.coe.neu.edu/healthcare | Northeastern University © 2010
Visual controlsToyota
Wristbands
Barb Averyt, program director of patient safety at Arizona Hospital and Healthcare Association3 Cup System
Northeastern University © 2012www.HSyE.orgHealthcare Systems Engineering Institute
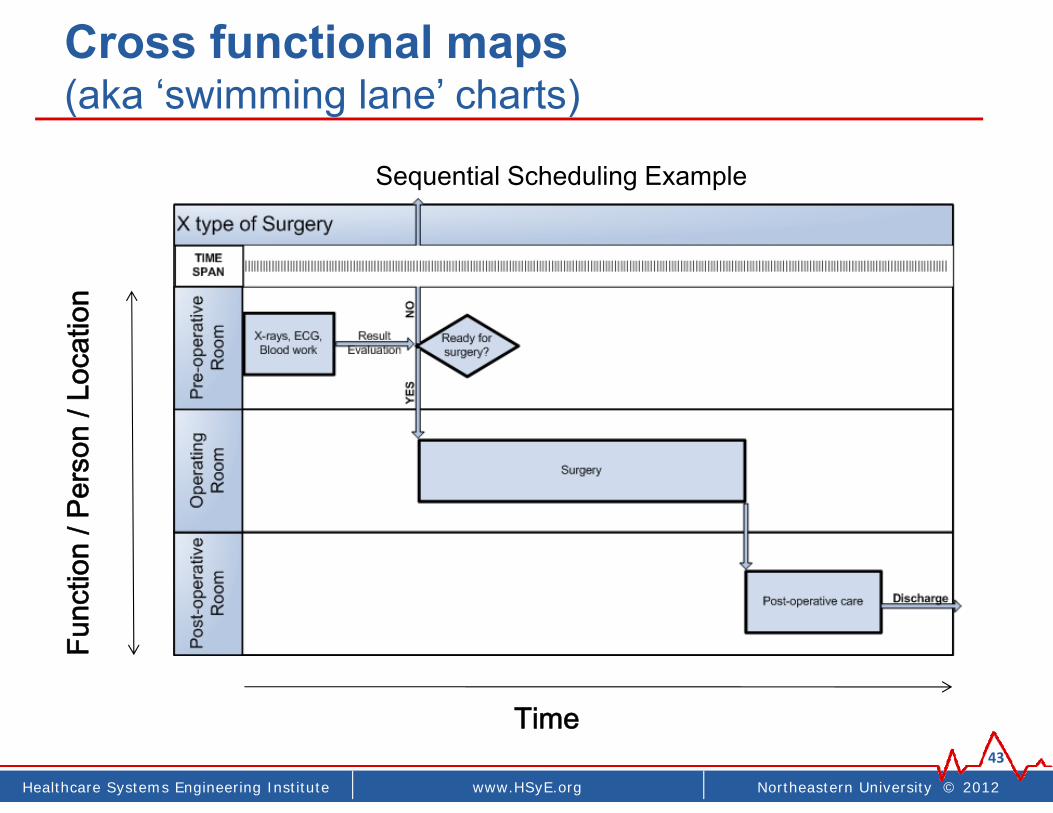
Cross functional maps(aka ‘swimming lane’ charts)
43
Time
Func
tion
/ Per
son
/ Loc
atio
n
Sequential Scheduling Example

Healthcare Systems Engineering | www.coe.neu.edu/healthcare | Northeastern University © 2010
Swimming lane example
14handoffs!
• Delays• Errors• incomplete care

Northeastern University © 2012www.HSyE.orgHealthcare Systems Engineering Institute
Non-value added work (NVA)
Non‐value add, waste
Person Non‐value add, waste
Swimming lane diagram – “current state map”
Northeastern University © 2012www.coe.neu.edu/healthcareHealthcare Systems Engineering Institute
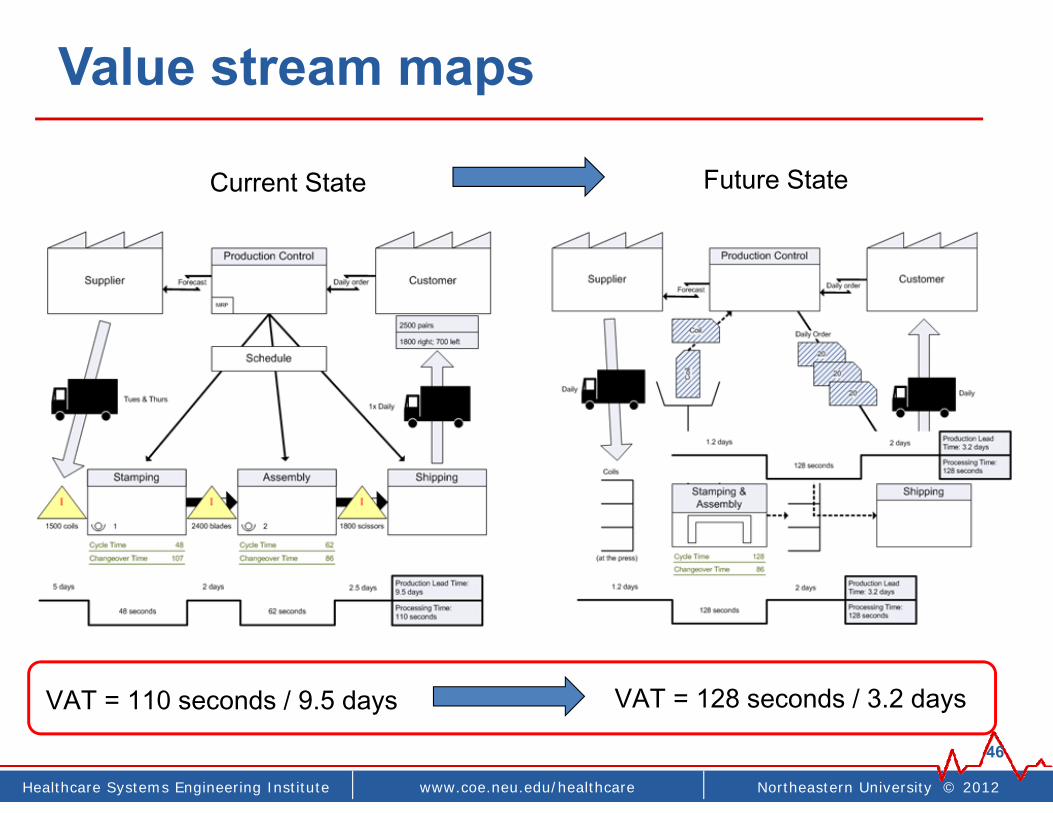
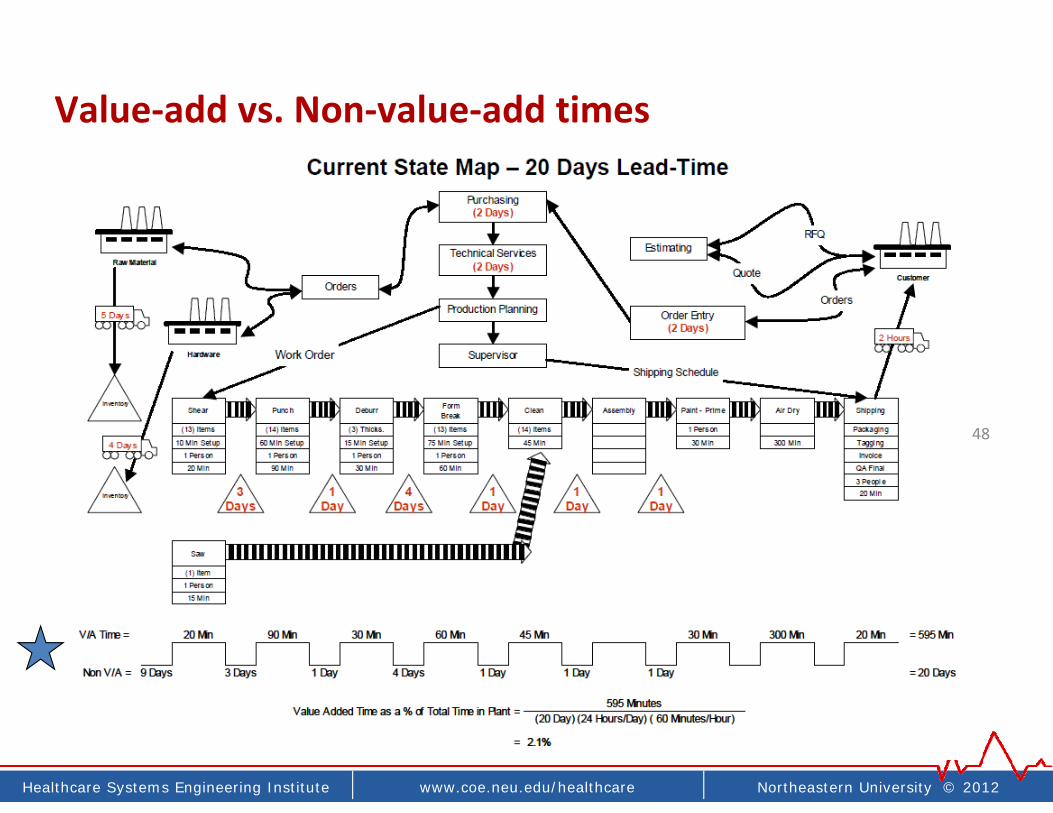
Value stream maps
46
Current State Future State
VAT = 110 seconds / 9.5 days= .01% (0.0001)
VAT = 128 seconds / 3.2 days= .04% (0.0004)
Northeastern University © 2012www.HSyE.orgHealthcare Systems Engineering Institute
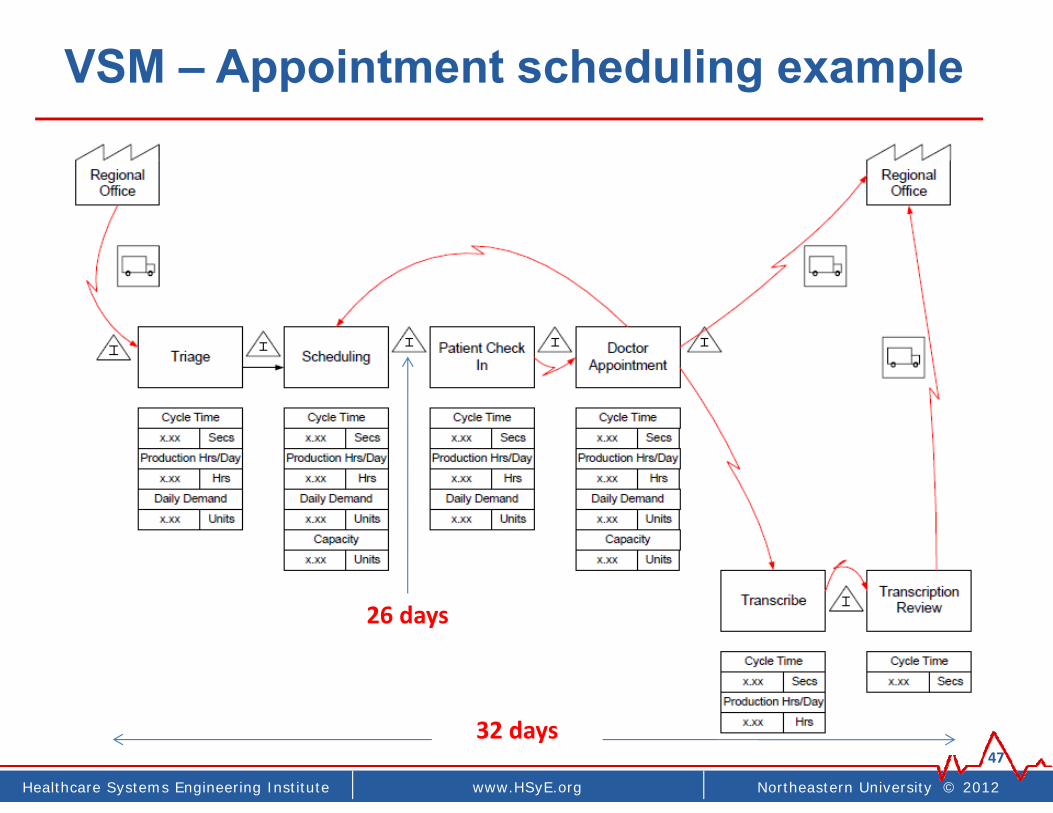
VSM – Appointment scheduling example
4732 days
26 days
Northeastern University © 2012www.coe.neu.edu/healthcareHealthcare Systems Engineering Institute
48
Value‐add vs. Non‐value‐add times

Healthcare Systems Engineering | www.coe.neu.edu/healthcare | Northeastern University © 2010
Waste - Travel as a form of wasteBefore
CQI / Lean projects
New layout
375 ft travel distance14.9 minutes70 – 85% reduction!
3,215 ft travel distance98 minutes

Healthcare Systems Engineering | www.coe.neu.edu/healthcare | Northeastern University © 2010
Waste – NVA and travel time (50% NVA)
• Documentation: 35%• Non-nursing practice: 25%• Foraging, Travel time, Patient escorting
IHI TCAB Study
~50%!

Healthcare Systems Engineering | www.coe.neu.edu/healthcare | Northeastern University © 2010
Waste – Spaghetti diagram
• Lean: 7 types of waste• Travel = waste• “Visual data”
• Relocate workstations• 75% travel reduction• Loss cross-over
congestion

Northeastern University © 2012www.HSyE.orgHealthcare Systems Engineering Institute
Waste - Shingo’s bolt metaphor
53
Bolt attachments requires 32 complete turns for each bolt or screw to fasten die to a machine.
• Single minute exchange of die• Quick changeover and set-up • Race pit / tire change metaphor
Only last turn has value
No-value add> 80% time
Split thread bolts
Under‐used concept in healthcare. How could we implement SMED?
• OR/clinic room turn over?• Sterile equipment reprocessing• Lab diagnostics• Other?

Northeastern University © 2012www.HSyE.orgHealthcare Systems Engineering Institute
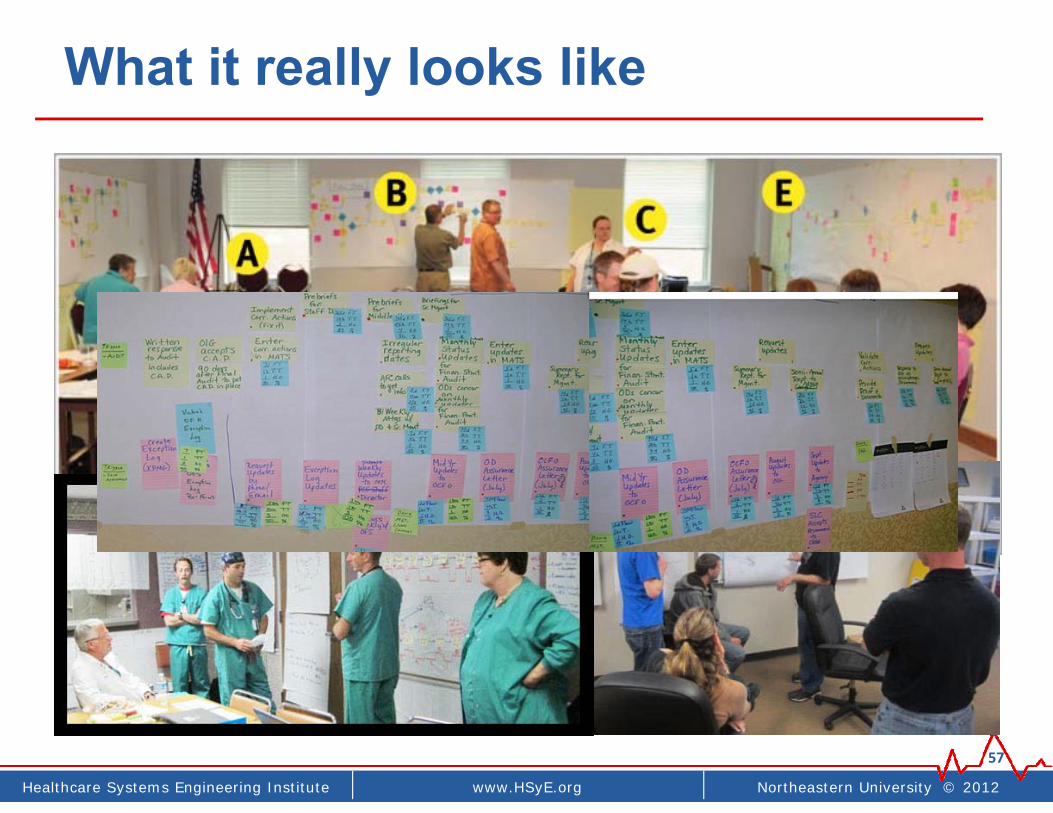
“Kaizen event”
• aka, Rapid process improvement workshop (RPIW) or Rapid Improvement Event (RIE)
• A way to rapidly do lean
56
Northeastern University © 2012www.HSyE.orgHealthcare Systems Engineering Institute
What it really looks like
57
Northeastern University © 2012www.HSyE.orgHealthcare Systems Engineering Institute
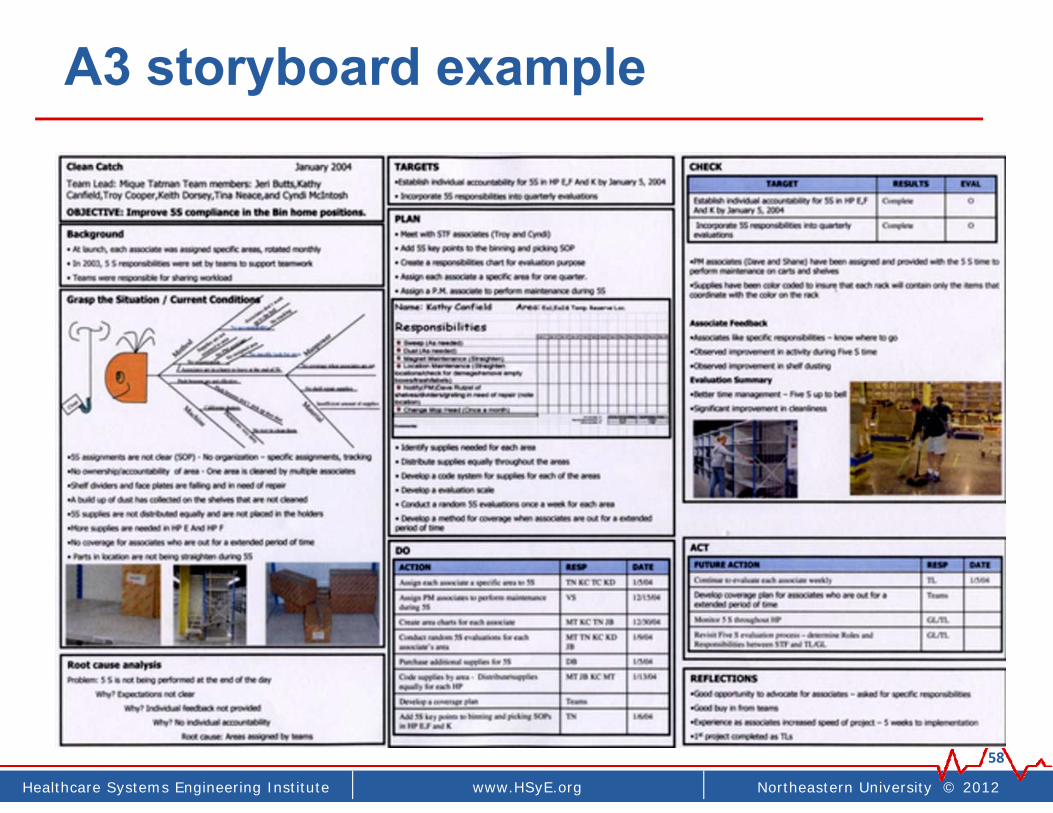
A3 storyboard example
58

Northeastern University © 2012www.coe.neu.edu/healthcareHealthcare Systems Engineering Institute
PDSAInstitute for Healthcare
Improvement(A way to implement PDSA)
Act Plan
Study Do

Northeastern University © 2012www.HSyE.orgHealthcare Systems Engineering Institute
IHI growth & impact: 1986 - present
• Active in over 50 countries and 14,000 organizations worldwide• Modern Healthcare: 3rd (2nd) most important person in health care• E.F. Hutton of health care
1986
15,000 organizations. 50 countries

Northeastern University © 2012www.HSyE.orgHealthcare Systems Engineering Institute
Plan Do Check (Study) Act
62
Act• What changes
are to be made?
• Next cycle?
Plan• Goal• Questions and
predictions (why)• Plan to carry out
the cycle (who,what, where, when)
Study• Analyze the data
• Compare data topredictions
• Summarize what was
learned
Do• Carry out the plan• Document problems
and unexpectedobservations

Northeastern University © 2012www.coe.neu.edu/healthcareHealthcare Systems Engineering Institute
Basic idea
• Plan (who, when, etc)
• Execute test (‘do’)
• Measures (‘study’)
• Refine, re‐test (‘act’)

Northeastern University © 2012www.HSyE.orgHealthcare Systems Engineering Institute
Planning deliberate tests
64
Northeastern University © 2012www.HSyE.orgHealthcare Systems Engineering Institute
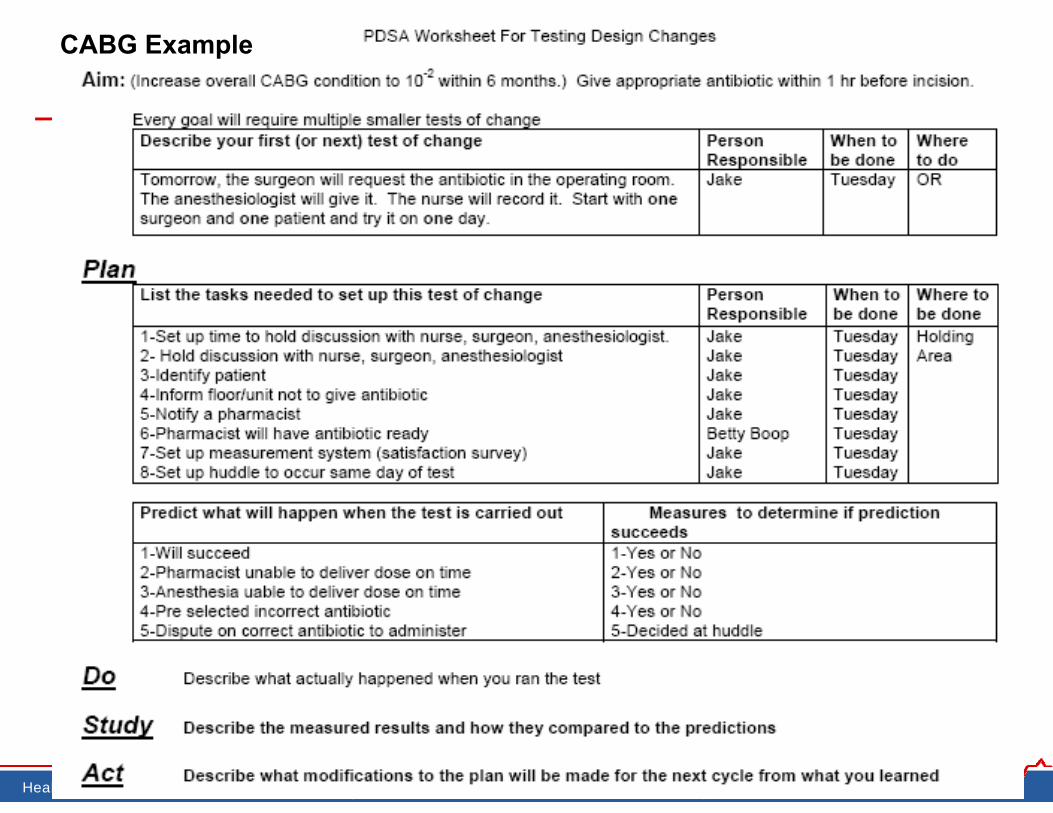
CABG Example

Northeastern University © 2012www.HSyE.orgHealthcare Systems Engineering Institute
Our PDSA planning form
66
PDSA #1 PDSA #2
Plan preparation
Baselines:
Materials:
Schedules:
Plan preparation
Baselines:
Materials:
Schedules:
Do execution
Who:
When:
Duration:
Do execution
Who:
When:
Duration:
Study analysis
Data Qualitative:
Quantitative:
Study analysis
Data Qualitative:
Quantitative:
Act based on results
If successful:
If not: Act
based on results If successful:
If not:
Checklist □ Achievable ≤ 7 days □ Not possible on smaller scale
Checklist □ Achievable ≤ 14 days □ Not possible on smaller scale
Northeastern University © 2012www.HSyE.orgHealthcare Systems Engineering Institute
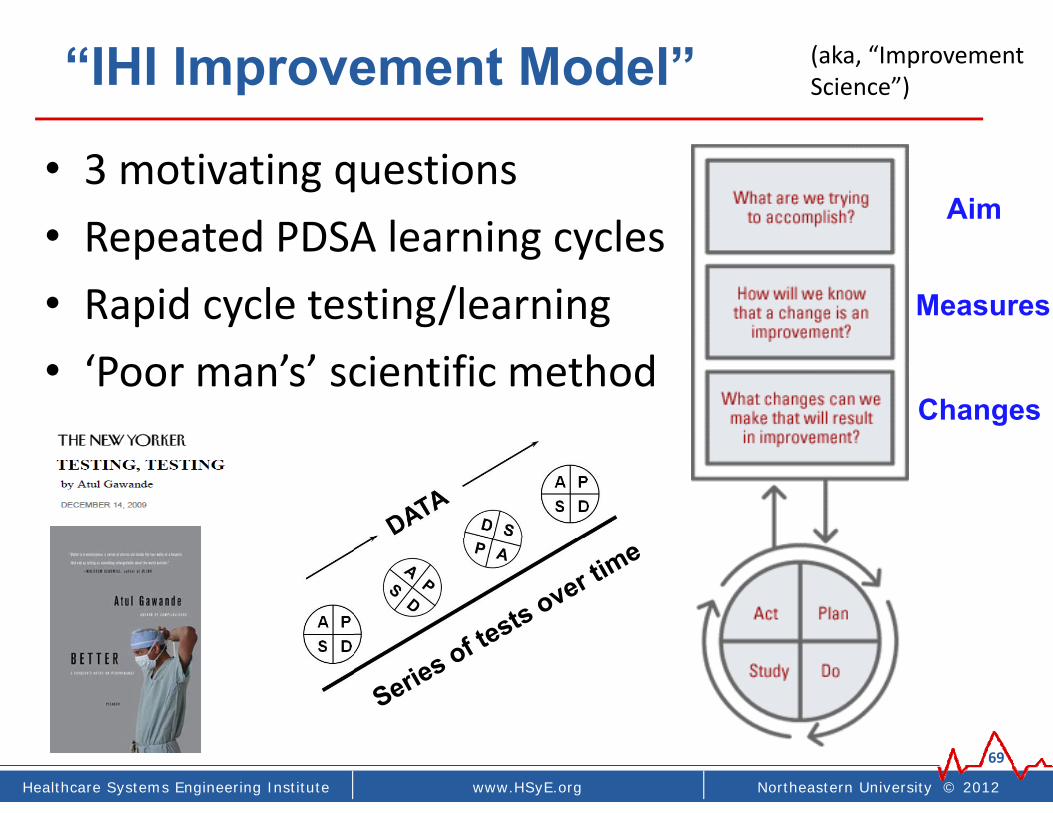
“IHI Improvement Model”
• 3 motivating questions• Repeated PDSA learning cycles• Rapid cycle testing/learning• ‘Poor man’s’ scientific method
69
Aim
Measures
Changes
(aka, “Improvement Science”)
Northeastern University © 2012www.HSyE.orgHealthcare Systems Engineering Institute
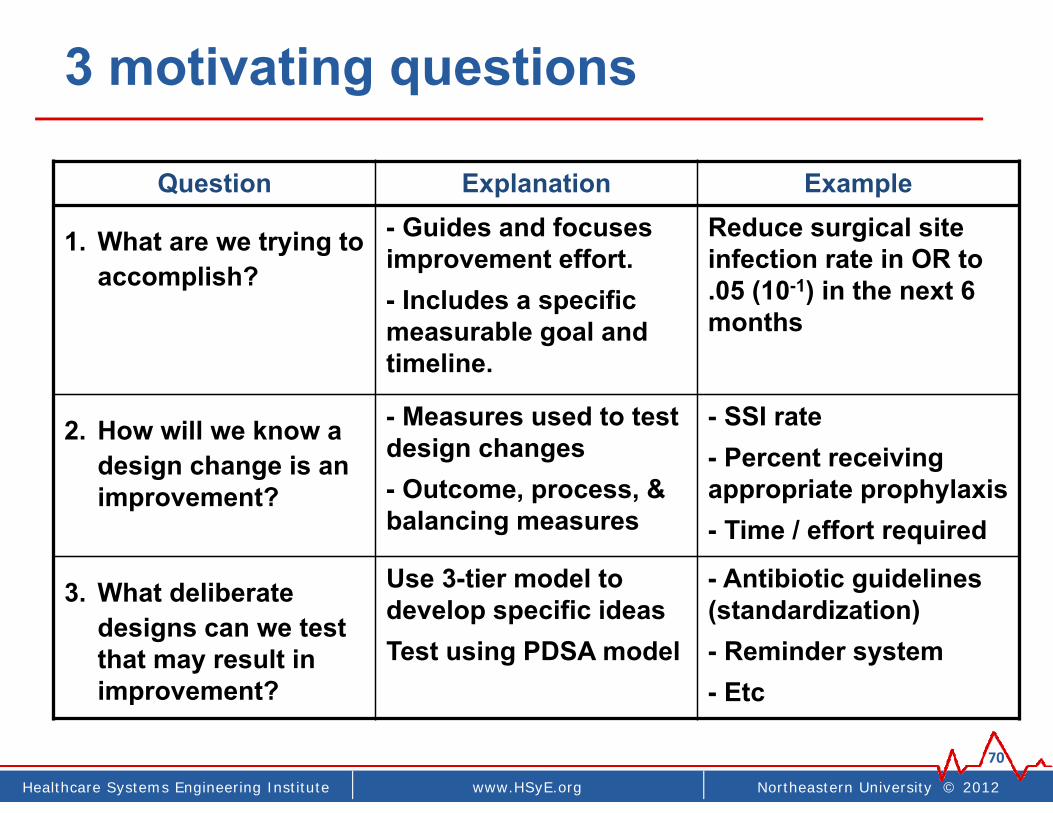
3 motivating questions
70
Question Explanation Example
1. What are we trying to accomplish?
- Guides and focuses improvement effort.- Includes a specific measurable goal and timeline.
Reduce surgical site infection rate in OR to .05 (10-1) in the next 6 months
2. How will we know a design change is an improvement?
- Measures used to test design changes- Outcome, process, & balancing measures
- SSI rate- Percent receiving appropriate prophylaxis- Time / effort required
3. What deliberate designs can we test that may result in improvement?
Use 3-tier model to develop specific ideasTest using PDSA model
- Antibiotic guidelines (standardization)- Reminder system- Etc
Northeastern University © 2012www.HSyE.orgHealthcare Systems Engineering Institute
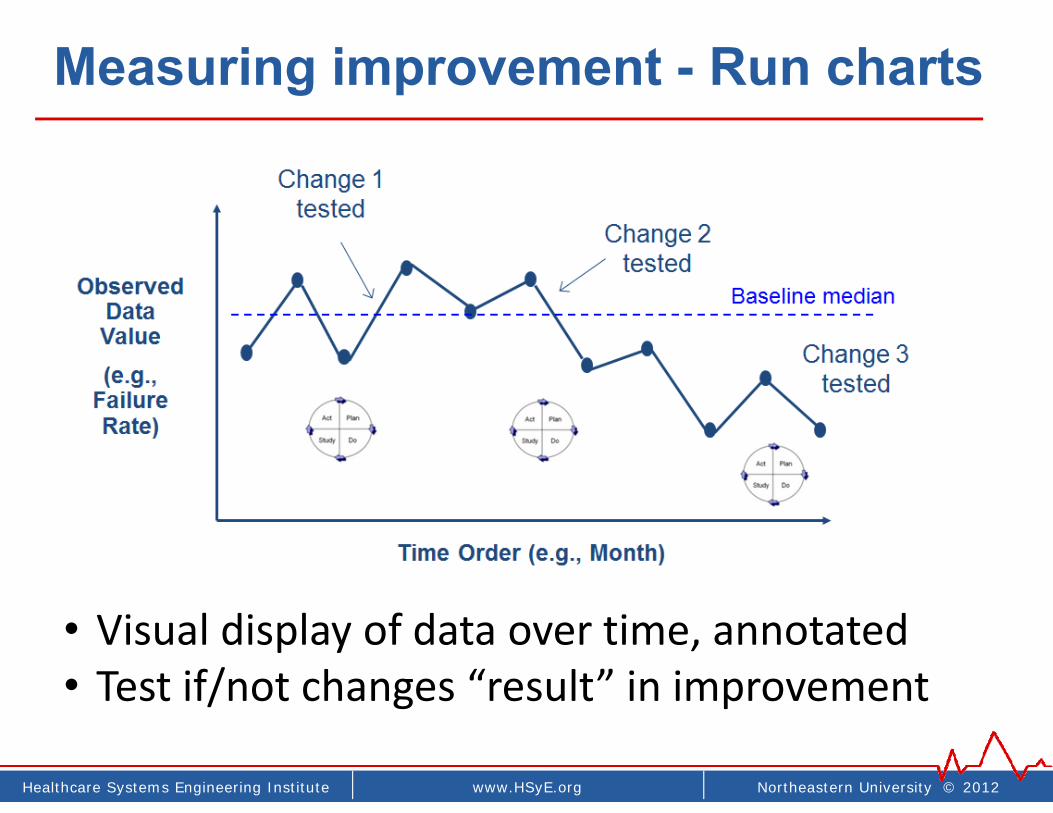
Measuring improvement - Run charts
• Visual display of data over time, annotated• Test if/not changes “result” in improvement

Northeastern University © 2012www.HSyE.orgHealthcare Systems Engineering Institute
Annotated run chart - Example
Northeastern University © 2012www.HSyE.orgHealthcare Systems Engineering Institute
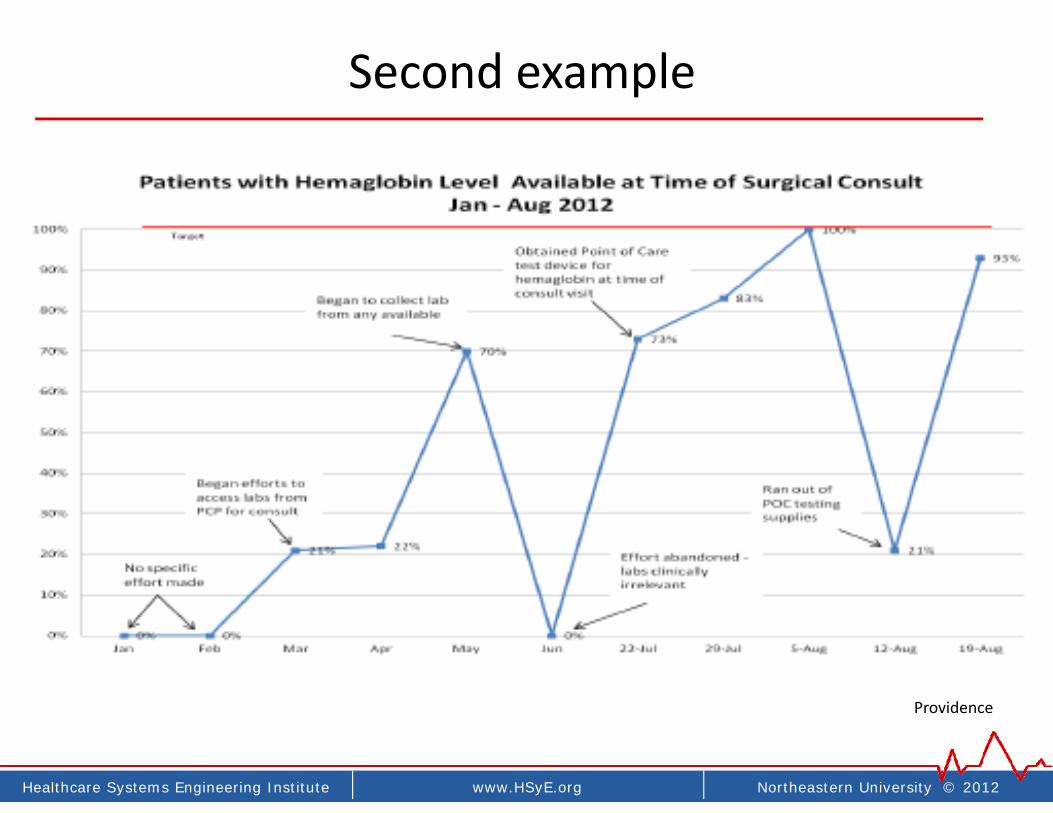
Second example
Providence

Northeastern University © 2012www.HSyE.orgHealthcare Systems Engineering Institute
Putting it into practice
• Starting small (smallest 1st test as possible)
• Linked tests over time
• Highly iterative. (Number tests = PI measure)
• Building knowledge, culture, comfort, degree of belief, support, learning
• Testing across contexts, settings, days
• Improvement advisor (IA) coaching role
74

Northeastern University © 2012www.HSyE.orgHealthcare Systems Engineering Institute
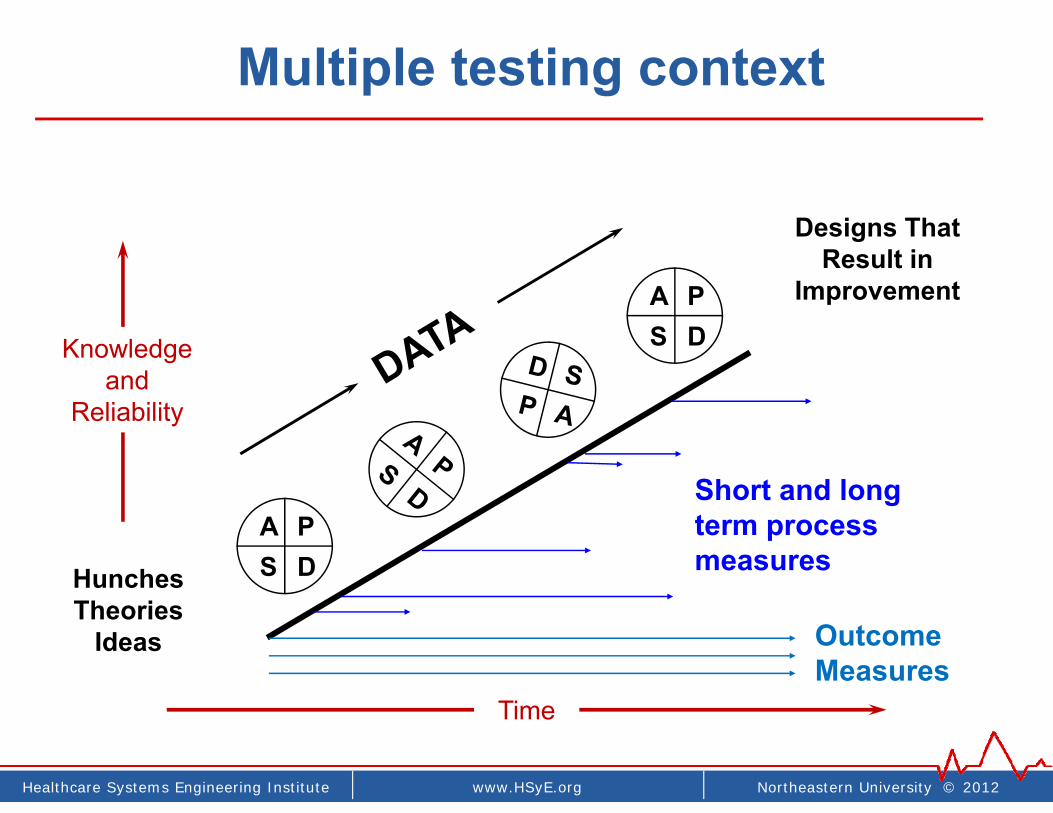
Small multiple tests - why
75
• Rapid small tests accelerate learning and improvement
• Start with smallest possible test• “one afternoon, one doc, one type of patient, etc”
• Learn what works and what does not
• Learn how to make process robust• Test in multiple environments• 2nd doc, 2nd shift, 2nd department, weekends, etc
Northeastern University © 2012www.HSyE.orgHealthcare Systems Engineering Institute
Time
Multiple testing context
Hunches Theories
Ideas
Designs That Result in
Improvement
A PS D
A PS D
Short and long term process measures
OutcomeMeasures
Knowledgeand
Reliability
Northeastern University © 2012www.HSyE.orgHealthcare Systems Engineering Institute
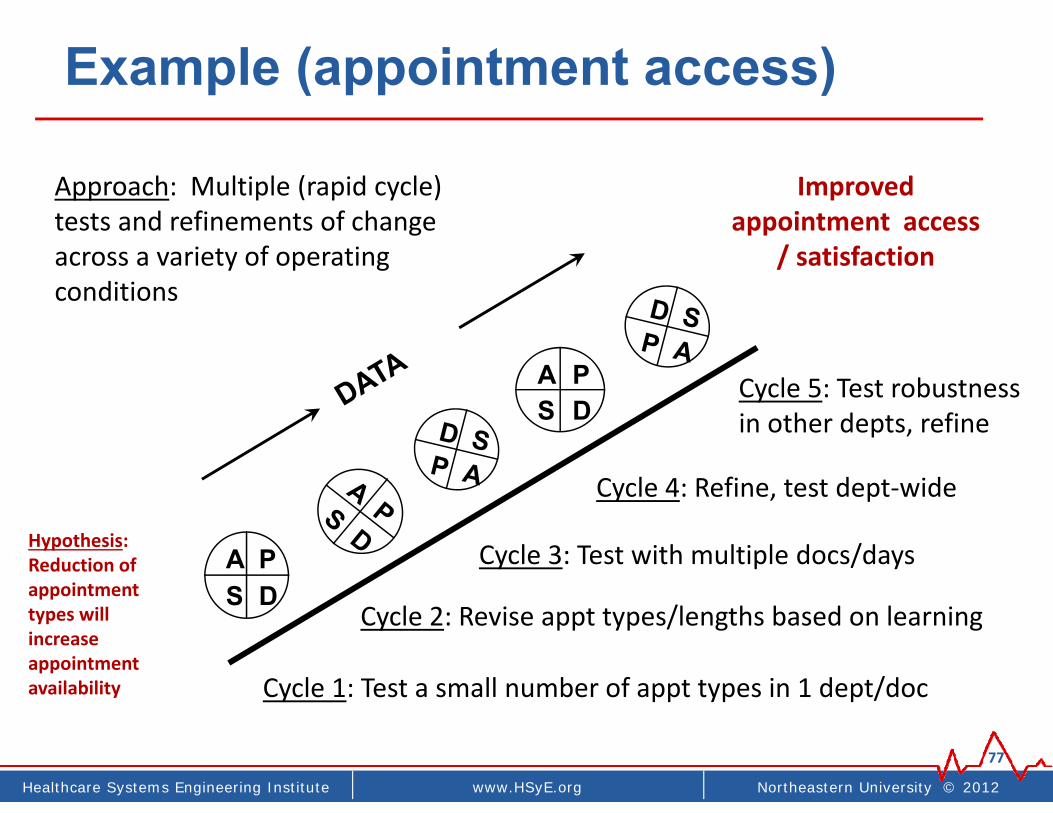
Example (appointment access)
77
Hypothesis: Reduction of appointment types will increase appointment availability
Improved appointment access
/ satisfaction
A PS D
A PS D
Cycle 1: Test a small number of appt types in 1 dept/doc
Cycle 2: Revise appt types/lengths based on learning
Cycle 3: Test with multiple docs/days
Cycle 4: Refine, test dept‐wide
Cycle 5: Test robustness in other depts, refine
Approach: Multiple (rapid cycle) tests and refinements of change across a variety of operating conditions
Northeastern University © 2012www.HSyE.orgHealthcare Systems Engineering Institute
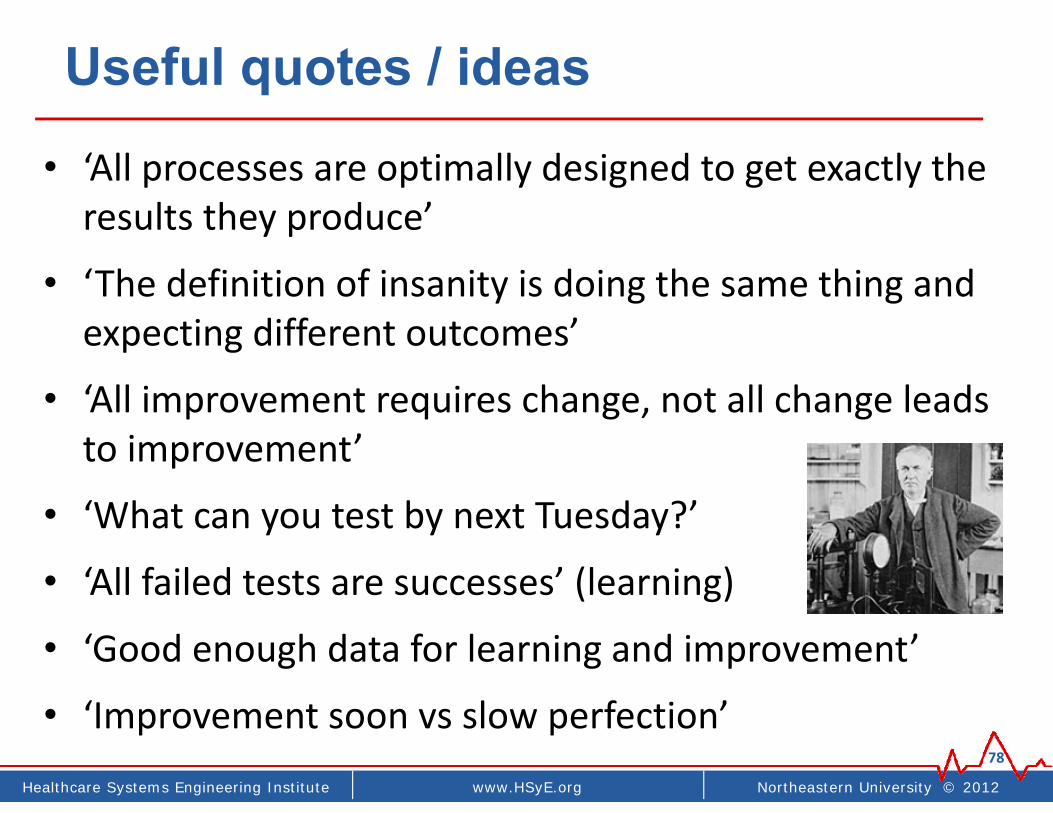
Useful quotes / ideas
• ‘All processes are optimally designed to get exactly the results they produce’
• ‘The definition of insanity is doing the same thing and expecting different outcomes’
• ‘All improvement requires change, not all change leads to improvement’
• ‘What can you test by next Tuesday?’
• ‘All failed tests are successes’ (learning)
• ‘Good enough data for learning and improvement’
• ‘Improvement soon vs slow perfection’78

Northeastern University © 2012www.HSyE.orgHealthcare Systems Engineering Institute
(WHY REPEATED TESTS)
“All improvement requires change, But not all changes result in improvement”
“All improvement is local”79
One month
Northeastern University © 2012www.HSyE.orgHealthcare Systems Engineering Institute
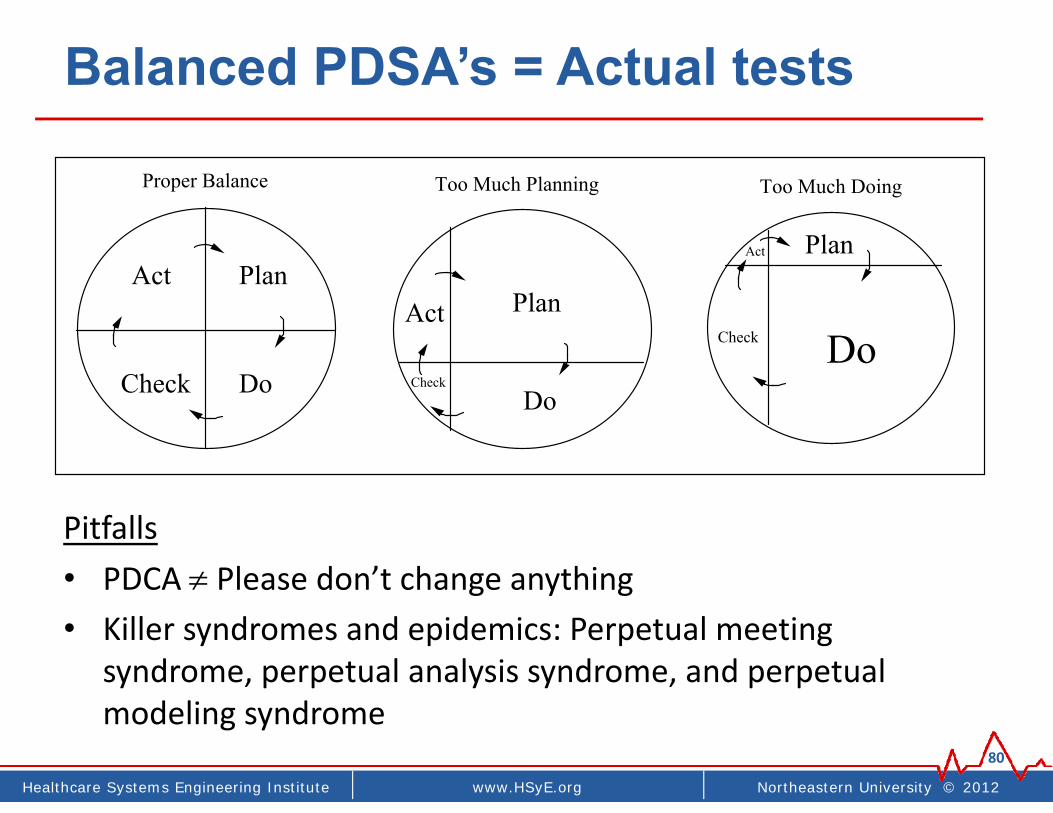
Balanced PDSA’s = Actual tests
Pitfalls• PDCA Please don’t change anything• Killer syndromes and epidemics: Perpetual meeting
syndrome, perpetual analysis syndrome, and perpetual modeling syndrome
80
Act
Check
Plan
Do
Too Much Planning
Plan
DoCheck
Act
Too Much Doing
Act Plan
DoCheck
Proper Balance
Northeastern University © 2012www.coe.neu.edu/healthcareHealthcare Systems Engineering Institute
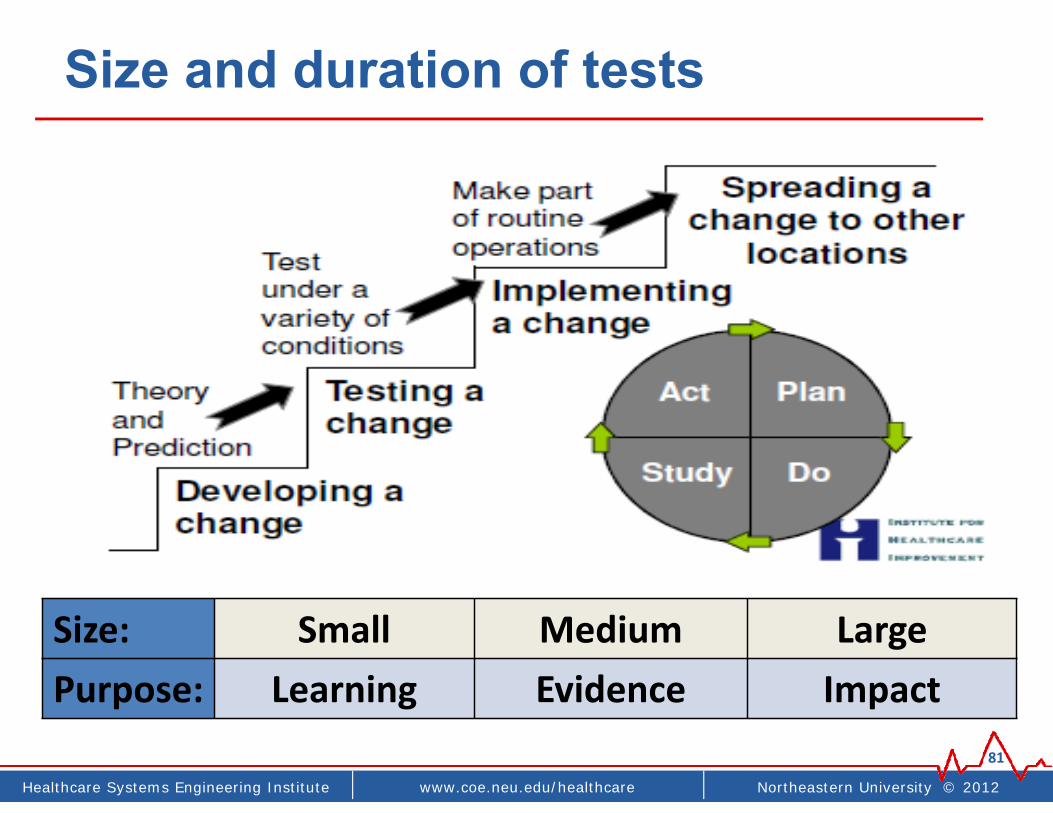
Size and duration of tests
81
Size: Small Medium LargePurpose: Learning Evidence Impact
Northeastern University © 2012www.coe.neu.edu/healthcareHealthcare Systems Engineering Institute
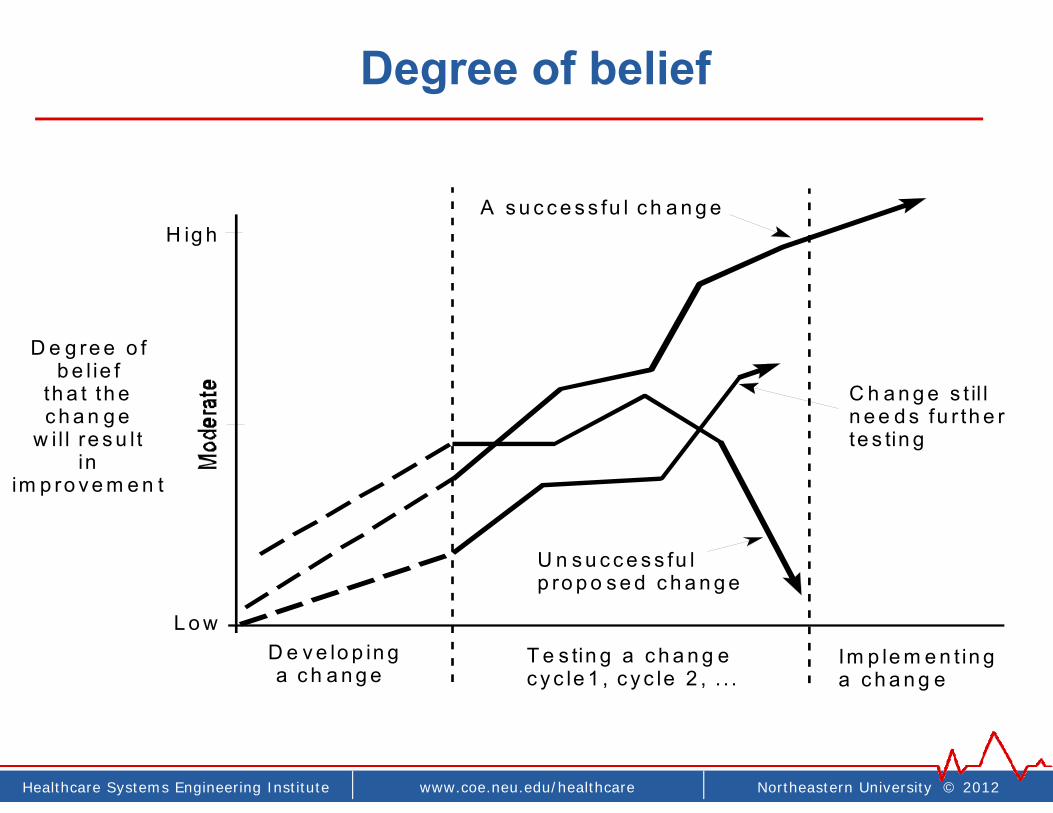
Degree of belief
D e g re e o fb e l ie f
th a t th ec h a n g e
w i l l re s u l tin
im p ro v e m e n t
H ig h
D e v e lo p in g a c h a n g e
T e s tin g a c h a n g ec y c le 1 , c y c le 2 , . . .
Im p le m e n t in ga c h a n g e
A s u c c e s s fu l c h a n g e
C h a n g e s t il ln e e d s fu r th e rte s tin g
U n s u c c e s s fu lp ro p o s e d c h a n g e
L o w
Northeastern University © 2012www.HSyE.orgHealthcare Systems Engineering Institute
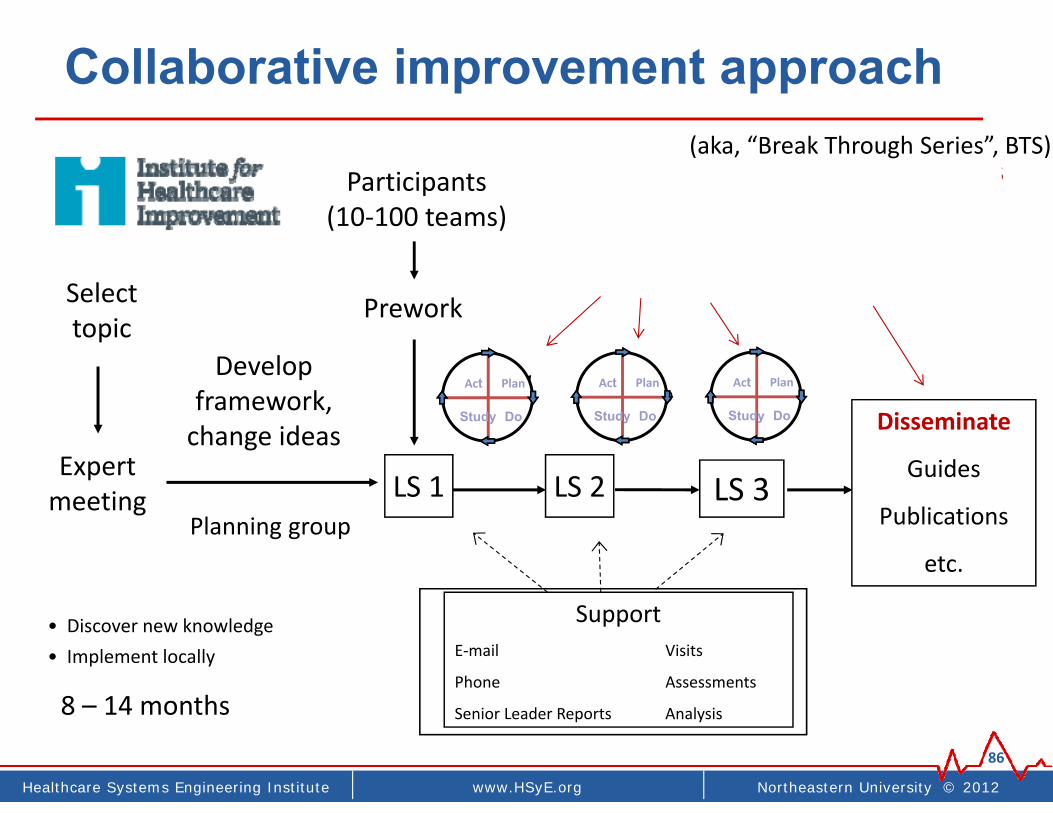
Collaborative improvement approach
86
Select topic
Expert meeting
Develop framework, change ideas
Participants(10‐100 teams)
Prework
P
S
A
P
S
A
SupportE‐mail Visits
Phone Assessments
Senior Leader Reports Analysis
LS 1
D D
LS 3LS 2
Disseminate
Guides
Publications
etc.Planning group
P
S
A D
8 – 14 months
Act Plan
Study Do
• Discover new knowledge• Implement locally
Act Plan
Study Do
Act Plan
Study Do
• Repeated tests across 20‐40 settings• Under‐exploited• Learning, DOE, robust opportunities
(aka, “Break Through Series”, BTS)

Northeastern University © 2012www.HSyE.orgHealthcare Systems Engineering Institute
General collaborative approach
87
Pre‐work
Material developmentEarly testingParticipant enrollment
Kick off meeting
BaselinesGeneral
knowledgeTools
6 month cycles (phase 1, phase 2, phase 3) – Action oriented
Fall 2014 Jan 2015
General knowledgePreliminary “change package”
Preliminary experiences
Local implementationBuild on general knowledge
Broad impact/spread
Winter & Spring 2015
Action period
Testing changes and QI methodsSharing results, learning, trainingMonthly cycles
Monthly virtual mtg
WebEx calls
Impact spread
Continue
Disseminate results & tools
Semi‐annual F2F sharing
NeoQIC mtg
Fall ‘15
All improvement requires change… testing testing testing…

Northeastern University © 2012www.HSyE.orgHealthcare Systems Engineering Institute
Examples
• Patient safety, Readmissions ()• Flow and delays• Specialty care access• Pain management• Dozens others
88
Northeastern University © 2012www.coe.neu.edu/healthcareHealthcare Systems Engineering Institute
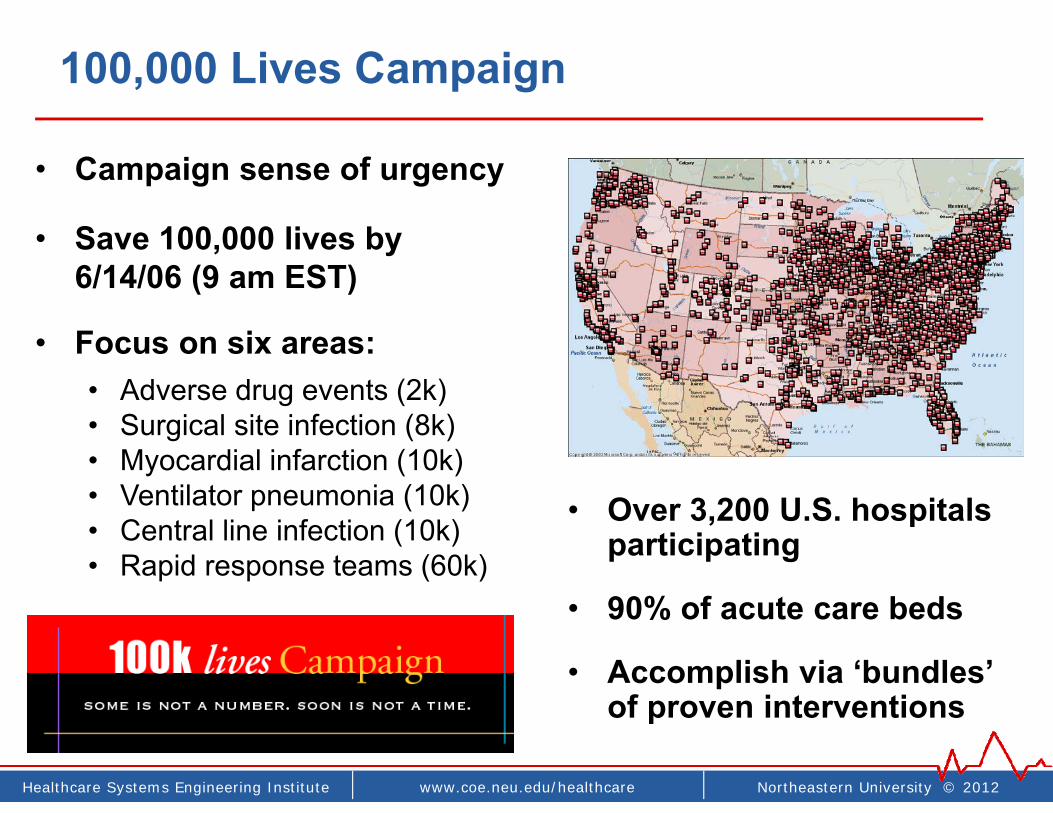
100,000 Lives Campaign
• Campaign sense of urgency
• Save 100,000 lives by 6/14/06 (9 am EST)
• Focus on six areas:• Adverse drug events (2k)• Surgical site infection (8k)• Myocardial infarction (10k)• Ventilator pneumonia (10k)• Central line infection (10k)• Rapid response teams (60k)
• Over 3,200 U.S. hospitals participating
• 90% of acute care beds
• Accomplish via ‘bundles’ of proven interventions
Northeastern University © 2012www.coe.neu.edu/healthcareHealthcare Systems Engineering Institute
recapPutting it all together

Northeastern University © 2012www.HSyE.orgHealthcare Systems Engineering Institute
Recap - putting it all together
91
Specific aims
Run and control charts
Driver diagram
Repeated testing, sharing, and co‐learning
S specificM measurableA action orientedR realisticT timeline

Northeastern University © 2012www.HSyE.orgHealthcare Systems Engineering Institute
Zen of Improvement Science
1. “Rapid cycle testing” is rapid (1 per week)
2. QI projects < 6 months
3. First focus on adapting known knowledge, then on discovering new improvements
4. Measure and test locally, with near immediate feedback and evaluation• Fast manual > slow electronic data• ‘Good enough’ > slow perfect data
5. Linked PDSAs (≥ 6 in ≤ 3 months)92
Northeastern University © 2012www.HSyE.orgHealthcare Systems Engineering Institute
Discussionwww.hsye.org
93
Contact information:James Benneyan, PhD, DirectorHealthcare Systems Engineering Institute334 Snell Engineering CenterNortheastern UniversityBoston MA [email protected]