Amplifying Outcomes - lntinfotech.com
171
ANNUAL REPORT 2017-18 Amplifying Outcomes Let’s Solve
Transcript of Amplifying Outcomes - lntinfotech.com

A n n u A l R e p o R t 2 0 1 7 - 1 8
Amplifying Outcomes
Let’s Solve

InsideCorporate overview
Chairman’s Message / 01CEO & MD’s Message / 02Board of Directors / 04Mapping LTI / 06The Elements of Amplifying Outcomes / 07Doing Less / 08Doing Fast / 09Doing More / 10Doing Better / 11Awards & Recognitions / 12Financial Highlights / 13Amplifying Outcomes for the Society / 14Corporate Information / 16
Statutory reportS
Management Discussion & Analysis / 17Directors’ Report / 33Corporate Governance Report / 40
FiNaNCiaL StateMeNtS
Standalone Financial Statements / 72Consolidated Financial Statements / 122
Dear Shareholders,
This has been an excellent year for your Company. Larsen & Toubro Infotech is
scaling new heights, and amplifying the momentum of its growth journey. In a rapidly
transforming digital landscape, LTI has posted exceptional performance while delivering
outstanding value to its customers and stakeholders.
At the heart of this success odyssey is the rich, customer-focused lineage of LTI’s parent – Larsen &
Toubro. LTI draws extensively on the domain knowledge of its parent company, and has also leveraged Larsen &
Toubro’s client base which includes multiple global majors. All this works in tandem with a business strategy built
around an outcome-oriented approach.
Team LTI is explicit in its willingness to remain flexible and open to learning new things, and perhaps also to unlearn and
relearn concepts and practices that enable us to stay relevant to the changing needs of our client base.

Chairman’s Message
LTI is emerging as the preferred digital partner to some of the world’s leading enterprises across segments. Our proprietary Mosaic platform is accelerating digital transformation, and helping our customers surge ahead of their competitors. Best-in-class technologies are also steering our own systems and processes, and our agile workforce is closely aligned to the emerging developments, enabling us to deliver impactful solutions that address complex challenges.
We are living in an age of near constant change – in technologies, customer expectations and socio-economic patterns. Your Company’s ability to map emerging trends and focus on exponential technologies is enabling it to cross new frontiers of capabilities and performance. We have thereby joined a differentiated league of industry players who are leading global new-age businesses towards more positive outcomes across their value chain.
As more and more companies look for specialised, cutting-edge digital solutions to achieve their business goals, the opportunity horizon ahead of us is expansive. With its intense focus on designing solutions for a world where the digital and the physical converge, your Company is well poised for rapid and sustained growth.
I take this opportunity to congratulate LTI on achieving the coveted USD1 Billion milestone in revenues, and for winning several awards and recognitions that endorse its deep domain expertise and capabilities. Under the guidance of a very effective leadership team, I am confident that LTI will continue to amplify business outcomes for its customers in the years ahead.
My best wishes and support are always with the entire LTI team.
a. M. NaikFounder Chairman

CEO & MD’s Message
Dear Shareholders,
It is with a sense of happiness and pride that I present to you the Annual Report for FY18. Your Company has reported an industry-leading performance and is rapidly being seen as the challenger and disruptor of status quo. We reported a growth of 16.7% for FY18, with digital revenues showing an impressive 42% increase Y-o-Y, with an exit rate accounting for 33% of our total revenue. This superlative performance marks our emergence as one of the fastest growing organizations in this sector, underlining our domain expertise and customer-centricity.
Steered by sustained investments in exponential technologies and people development, we have recorded a broad-based growth across verticals and service lines and have won more than USD 300 Million of new Total Contract Value (TCV) in large deals during the last 18 months – translating into exceptional performance across all key indicators. Our acquisitions of AugmentIQ and Syncordis are enriching our digital platform, Mosaic and expanding footprint in European financial services market.
I’m often asked the secret of our significantly faster growth compared to the industry. What sets us apart is our unflinching focus on outcomes that are important to customers. Rather than just meeting the Service Level Agreements (SLAs), our thrust is on delivering business outcomes that enable transformation and competitiveness. Our ability to look at every challenge as an opportunity lends us the strength to amplify these outcomes and help our clients address the complex digital demands of an ever-evolving industry.
While we are proud and excited to be where we stand today, this is not the time for us to be complacent of our accomplishments. We have an immense opportunity ahead of us and have our targets firmly set on becoming the most valuable partner for each of our customers. We will continue to strengthen our market presence while remaining agile and responsive to the demands of our clients.
We reported a growth of 16.7% for FY18, with digital revenues showing an impressive 42% increase Y-o-Y, with an exit rate accounting for 33% of our total revenue
Annual Report 2017-1802

The secret of building further on our momentum is to follow the principles of ‘Shoshin’ - a Zen Buddhism philosophy that means “a beginner’s mind”, a mind with openness, eagerness and no preconceptions. While we continue to build on our expertise, which of course remains critical to our growth, we shall also focus more concertedly on being open to continuous learning and finding new solutions to old problems. As we surge ahead, we will keep evolving as a ‘learning company’, with the most curious people in every department, and in every country.
With deeply-rooted industry expertise and one of industry’s most dynamic teams, we are well-positioned to establish LTI among the emerging leaders in this industry. That is my goal as we step into the next financial year.
Sanjay JalonaCEO & Managing Director
03

Board of DirectorsAt the helm of our efforts to amplify the outcomes is a visionary Board, supported by an experienced and agile leadership.
Sitting (L-r) Sanjay Jalona
Samir Desai
A. M. Naik
M. M. Chitale
S. N. Subrahmanyan
Standing (L-r) Aftab Zaid Ullah
R. Shankar Raman
Sanjeev Aga
Sudip Banerjee
Arjun Gupta
Sudhir Chaturvedi
Vedika Bhandarkar
Annual Report 2017-1804

Leadership TeamCorporate
Sanjay Jalona Chief Executive Officer & Managing Director
Aftab Zaid Ullah Chief Operating Officer
Sudhir Chaturvedi President Sales
Ashok Kumar Sonthalia Chief Financial Officer
Peeyush Dubey Chief Marketing Officer
Manoj Koul Company Secretary & Compliance Officer
Ajay Tripathi Chief Human Resources Officer
vertical Head Anil Vazirani
Chief Business Officer, Insurance Americas
Harsh Naidu Chief Business Officer, Banking & Financial Services,
Americas
Siddharth Bohra Chief Business Officer, Tech, Media, CRP & Digital,
Americas
Rohit Kedia Chief Business Officer, Manufacturing & ERP,
Americas
Sarbajit Deb Chief Business Officer, Nordics
Satya Samal Chief Business Officer,
Europe (excluding Nordics)
05
01Corporate Overview
17Statutory Reports
72Financial Statements

Mapping LTI
20
59
6th
300
25
27
49
24,000+
A global technology consulting and digital solutions Company, Larsen & Toubro Infotech (NSE: LTI, BSE: 540005) helps clients succeed in a converging world by accelerating their digital transformation. With the rich legacy of Larsen & Toubro Limited, LTI powers the augmentation of client efficiencies to enable them to deliver greater value to their customers, employees and shareholders.
Among top
LargestGlobal IT Services Companies
Fortune 500 Clients
Indian IT Services Company
Active Clients
Delivery Centers
Countries
Sales Office
Headcount
innovation partner to world’s leading brands across:
Banking Insurance Financial Services Oil & Gas Utility Consumer Packaged Goods & Retail Logistics Hi-tech Pharmaceuticals Healthcare Media & Entertainment Process Manufacturing Automotive & Aerospace Industrial Manufacturing Engineering &
Construction
Mature Service
offerings
pLatForM BaSeD
SoLutioNS
appLiCatioN MaNaGeMeNt
eNterpriSe SoLutioNS
teStiNG & vaLiDatioN
DiGitaL SoLutioNS & CoNSuLtiNG
CyBer SeCurity
iNFraStruCture MaNaGeMeNt ServiCeS (iMS)
Annual Report 2017-1806

The Elements of Amplifying OutcomesAcross industries, existing technologies are giving way to new ones every day, and digital has emerged as the universal disruptor for businesses striving to address new challenges in the transforming milieu.
However, the struggle for finding the right technology to address their business requirements is in itself a big challenge for businesses. With a plethora of technological offerings, search for the right digital partner to give the right solutions for delivering the desired results and RoI becomes fraught with difficulties.
LTI helps make the choice easier. We are focused on outcomes, rather than further aggravating the
We are committed to amplifying outcomes, for our clients.
Doing less: Automating and reducing work
volume
Doing fast: Using latest
technologies and agile ways of
working
Doing more: With proprietary
and domain-specific solutions and accelerators
Doing better: Accelerating digital
transformation with Mosaic
Our business philosophy is centered on enhancing business outcomes through automation
and innovation, which we are continuously driving through our partnership approach.
clients’ dilemma of choices. And we ensure that we deliver these outcomes by employing best-of-breed technologies backed by an empowered team.
Thus, while others are talking about technologies, we prefer to talk about outcomes.
and we do this by:
07
01Corporate Overview
17Statutory Reports
72Financial Statements
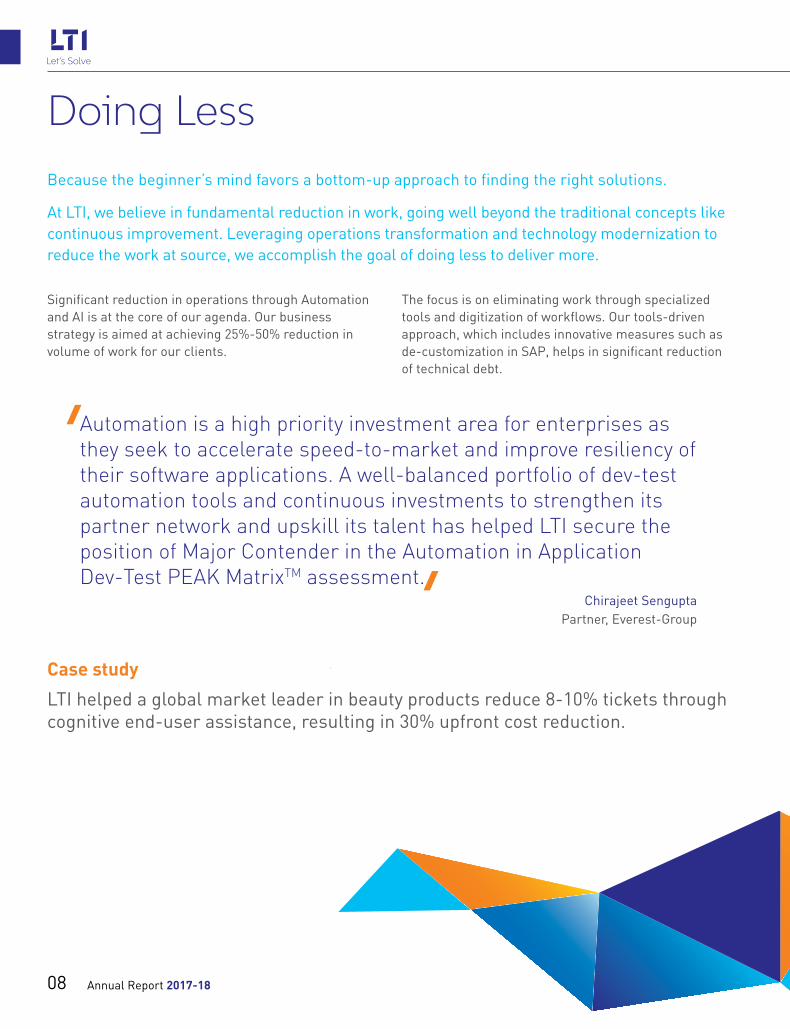
Doing LessBecause the beginner’s mind favors a bottom-up approach to finding the right solutions.
At LTI, we believe in fundamental reduction in work, going well beyond the traditional concepts like continuous improvement. Leveraging operations transformation and technology modernization to reduce the work at source, we accomplish the goal of doing less to deliver more.
Significant reduction in operations through Automation and AI is at the core of our agenda. Our business strategy is aimed at achieving 25%-50% reduction in volume of work for our clients.
The focus is on eliminating work through specialized tools and digitization of workflows. Our tools-driven approach, which includes innovative measures such as de-customization in SAP, helps in significant reduction of technical debt.
Automation is a high priority investment area for enterprises as they seek to accelerate speed-to-market and improve resiliency of their software applications. A well-balanced portfolio of dev-test automation tools and continuous investments to strengthen its partner network and upskill its talent has helped LTI secure the position of Major Contender in the Automation in Application Dev-Test PEAK MatrixTM assessment.
Chirajeet SenguptaPartner, Everest-Group
Case study
LTI helped a global market leader in beauty products reduce 8-10% tickets through cognitive end-user assistance, resulting in 30% upfront cost reduction.
Annual Report 2017-1808

Doing FastBecause fresh learning requires faster unlearning of old systems and processes.
With speed being the essence of digital revolution, we are continuously powering our business operations. The thrust is on delivering faster, through deployment of the latest technologies and more agile ways of working.
Our agile delivery centers are investing in space and infrastructure for teams to better operate in agile methodologies – agile rooms, video conferencing, collaboration tools like digital whiteboards, and training.
For applications management programs, our integrated full-stack Business Command Center, with end-to-end accountability of high priority tickets, helps customers move faster through automation.
When it comes to apps and infrastructure management, our focus is on enabling 1-touch resolution for faster turnaround. 24X7 monitoring across infra and apps propels this strategy, facilitating faster learnings and outcomes for customers.
Our delivery centers in Poland, Johannesburg, and Costa Rica ensure speed and business alignment where rapid results are a key requirement.
LTI has showcased strong focus on IoT Integration and Managed Services. LTI’s Mosaic offerings across the IoT technology stack is a differentiator that helps customers with accelerated solutions.
Sidhant RastogiPartner & Practice Head, Zinnov
Case study
LTI helped a leading American Multinational Energy Corporation by DevOps approach adoption to improve Business User Experience through Business-led innovations, which in turn improved Time-to-Market by 30%.
09
01Corporate Overview
17Statutory Reports
72Financial Statements

Doing MoreBecause the new-age business demands a deeper understanding of client needs.
We believe in going the extra mile to ensure client satisfaction, by understanding their needs better and learning to address them more effectively with our own solutions and accelerators that bring a wealth of industry specific knowledge.
Unitrax, our SaaS-based proprietary transfer agency record-keeping platform, enables fund managers and insurance providers with better administration of their wealth management products.
Syncordis Studio: LTI acquired Luxembourg-based Syncordis SA during the year, which is Europe’s leading implementation partner of Temenos core banking software solutions. The Syncordis Studio automates the critical COB process for banks. Besides regular T24 COB processes, Syncordis Studio also automates backups, messaging and alert systems, and other customized processes.
AccuRUSI: Our property and casualty insurance company, LTI AccuRUSI, the underwriter’s Workbench,
brings rigor, efficiency and control, by leveraging data from multiple third-party sources, including IoT sensors. AccuRUSI brings the power of single view of risk, cognitive risk intelligence, advanced risk visualization, real-time risk monitoring, and adaptive underwriting workflow.
Toolset driven levers, such as Bots, Mobility, Analytics, Automation and Personal Maps, are extensively used to ensure that our integrated teams deliver on their E2E goals with total ease. We also have in place a system of service provider payouts linked to IT and business SLAs, personal CSAT, and contribution to business outcome.
Case study
A Canadian asset servicing company partnered with LTI Canada to transition all its transfer agency clients onto Unitrax, which boosted business growth, improved long-term servicing performance, reliability and scalability of unit holder record-keeping solution, and effectively managed risk with a proven solution.
LTI has a wealth of solutions and accelerators, which make its consulting and implementation services more repeatable and faster to implement. NelsonHall welcomes this approach based on repeatability and quality.
Dominique Raviart IT Services Research Director at NelsonHall
Annual Report 2017-1810

Doing BetterBecause learning to excel is vital for business success in the transforming digital environment.
We are cognizant of the need to continuously improve business processes and outcomes to remain competitive and successful in the transforming industry landscape.
LTI’s Mosaic platform enables better outcomes and accelerates digital transformation through data engineering, advanced analytics, knowledge-led automation, IoT connectivity, improved experience and better cybersecurity for its users.
We are highly focused on driving a better customer experience at every step of our engagement
through a partnership approach rooted in targeted interventions. Better leverage of existing technology and data assets is ensured through a strong innovation thrust, which we have successfully institutionalized as a way of life at LTI.
Case study
A highly ambitious, large-scale digital transformation program for a ’Navratna’ PSU eliminated paper movement at all levels to improve transparency and enhance corporate governance.
mosaicthings
Intelligent Devices
mosaicautomation
Smarter Execution
mosaicdecisions
Impactful Decision-making
mosaicAI
Reinvent Problem-Solving
mosaicsecurity
Total Cybersecurity
mosaicexperience
Unmatched Customer
Experience
mosaicAccelerating Digital Transformation
mosaic academy
In combining machine learning with the other Mosaic automation products, LTI is addressing the continuum of automation from RPA to machine learning that customers seem to be demanding.
Nick PatienceCo-Founder & Research Vice President, 451 Research
11
01Corporate Overview
17Statutory Reports
72Financial Statements

Awards & RecognitionsThe success of our ‘Amplifying Outcomes’ strategy is endorsed by the various awards and recognitions received during the year.
#1 in the ‘Challengers’ list in Everest Group’s PEAK MatrixTM Service Provider of the Year 2018
Sanjay Jalona recognized among the Best CEOs in the Institutional Investor 2018 rankings for listed IT Services companies in Asia
Sanjay Jalona chosen as Exemplary CEO of the Year 2017 by BW Businessworld
Leader in Zinnov Zones 2017 for Digital Services
Recognized by ISG as one the Breakthrough 15 Sourcing Standouts in the Americas and EMEA regions in its 4Q17 Global ISG Index™
Recognized by Microsoft as “Azure Emerging partner of the Year”
Ranked among leaders in Property & Casualty and Life & Annuities categories in Novarica 2018 Market Navigator™ for IT Services Providers for Insurers
Major Player in IDC MarketScape: Worldwide Manufacturing Customer Experience Systems Integration and IT Strategic Consulting 2018 Vendor Assessment
Positioned as a ‘Leader’ for RPA and AI in Banking, ‘Leader’ in Digital Focus, ‘Leader’ for IoT Services, and ‘Innovator’ for SAP S/4HANA capabilities in NelsonHall’s NEAT 2017
Won the Oracle Digital Transformation award for Optimizing JD Edwards with IaaS
Featured as High Performer in HfS Blueprint Report: Enterprise Blockchain Services 2017
Ranked as the Top Service Provider in France in the 2017 French IT outsourcing study conducted by Whitelane Research
Mentioned in Gartner’s Market Guide for European Non-Life-Insurance Policy Administration Systems
Positioned as a Niche Player in Gartner’s Magic Quadrant for Oracle Application Services, Worldwide
Mosaic mentioned in Gartner’s Competitive Landscape of IoT Platform Vendors report for 2017
Recognized as a Representative Vendor in Gartner’s Market Guide for Blockchain Consulting and Proof-of-Concept Development Services report, dated 13th March 2018
Annual Report 2017-1812

Financial Highlights
FY17 FY18
revenue in uSD Million
pat (iNr Million) & pat Margins (%) % revenue by verticals
% revenue by Service offering % revenue by Geography
revenue in iNr Million
(Y-o-Y growth over the previous year)
(Y-o-Y growth over the previous year)
9.3% 16.8%
970
1,132
FY17 FY18
(Y-o-Y growth over the previous year)
(Y-o-Y growth over the previous year)
11.2% 12.4%
65,009
73,065
FY17 FY18
14.9% 15.2%
9,709
11,124
High-Tech, Media & Entertainment
Enterprise Integration & Mobility
Others
Platform Based Solutions
10.7%
6.6%
4.6%
3.5%
CPG, Retail & Pharma
Analytics, AI & Cognitive
9.0%
10.6%
Energy & Utilities
Testing
11.7%
8.6%
Manufacturing
Infrastructure Management Services
16.8%
11.4%
Insurance
Enterprise Solutions
19.7%
25.2%
BFS
Application Development Maintenance
27.5%
34.2%
India7.3%
RoW6.7%
Europe18.0%
North America
68.0%
01Corporate Overview
17Statutory Reports
72Financial Statements
13

Amplifying Outcomes for the SocietySolving for society is one of our core beliefs, and LTI 1Step initiative is our unique approach to corporate social responsibility, driving both organizational-level and individual-level contributions to communities, globally.
education Digital learning - leveraging technology to
connect children in remote villages of India to passionate volunteer teachers virtually over video conferencing tool
Experiential learning - ‘Introduction to Basic Technology’ program is implemented in schools from classes 08-10
Mid-day meals at Government schools to encourage attendance and reduce drop-out rate
our focus is on three causes:
Annual Report 2017-1814

empowerment Digital Sakshar-the program to help the youth learn IT skills to enhance
employability Women empowerment - supporting marginalized women in urban and
rural areas, helping them become financially independent I learn-I earn - helping differently-abled youth learn computer skillsout
rate
environment Green cover - Tree plantation drives, paper
recycling initiatives and e-waste collection Water harvesting - To help farmers have a
regular water source through the year
01Corporate Overview
17Statutory Reports
72Financial Statements
15
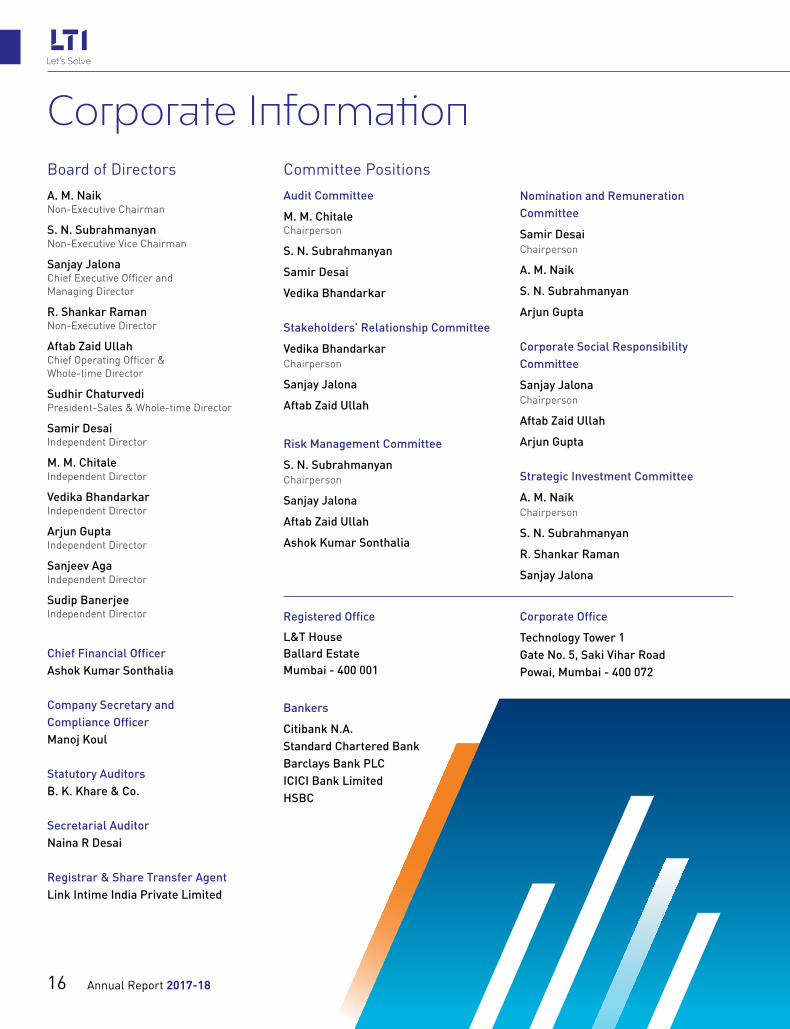
Corporate InformationBoard of DirectorsA. M. NaikNon-Executive Chairman
S. N. SubrahmanyanNon-Executive Vice Chairman
Sanjay Jalona Chief Executive Officer and Managing Director
R. Shankar RamanNon-Executive Director
Aftab Zaid Ullah Chief Operating Officer & Whole-time Director
Sudhir Chaturvedi President-Sales & Whole-time Director
Samir DesaiIndependent Director
M. M. ChitaleIndependent Director
Vedika BhandarkarIndependent Director
Arjun GuptaIndependent Director
Sanjeev AgaIndependent Director
Sudip BanerjeeIndependent Director
Chief Financial OfficerAshok Kumar Sonthalia
Company Secretary and Compliance OfficerManoj Koul
Statutory Auditors B. K. Khare & Co.
Secretarial Auditor Naina R Desai
Registrar & Share Transfer AgentLink Intime India Private Limited
Committee PositionsAudit Committee
M. M. Chitale Chairperson
S. N. Subrahmanyan
Samir Desai
Vedika Bhandarkar
Stakeholders’ Relationship Committee
Vedika Bhandarkar Chairperson
Sanjay Jalona
Aftab Zaid Ullah
Risk Management Committee
S. N. Subrahmanyan Chairperson
Sanjay Jalona
Aftab Zaid Ullah
Ashok Kumar Sonthalia
Nomination and Remuneration Committee
Samir Desai Chairperson
A. M. Naik
S. N. Subrahmanyan
Arjun Gupta
Corporate Social Responsibility Committee
Sanjay JalonaChairperson
Aftab Zaid Ullah
Arjun Gupta
Strategic Investment Committee
A. M. NaikChairperson
S. N. Subrahmanyan
R. Shankar Raman
Sanjay Jalona
Registered Office
L&T HouseBallard EstateMumbai - 400 001
Bankers
Citibank N.A.Standard Chartered BankBarclays Bank PLC ICICI Bank Limited HSBC
Corporate Office
Technology Tower 1Gate No. 5, Saki Vihar Road Powai, Mumbai - 400 072
Annual Report 2017-1816

01Corporate Overview
17Statutory Reports
72Financial Statements
17
Management Discussion & AnalysisI. Global Economic Scenario
Global synchronous growth in CY17 was led by consumption, investment, manufacturing and trade surpluses. Changes introduced in the US tax plan plus additional Spending bill is expected to boost US GDP growth. Initial US Industrial Production and PMI data point to a better 2018.
The global economic activity strengthened compared to CY16 with the world growth at 3.8%. For the next year, US GDP growth is expected to accelerate to 2.9% from 2.3% last year and growth for Euro area is expected to improve marginally to 2.4% over 2.3% last year. Emerging markets and developing economies grew at 4.8% in CY17 and are projected to grow at 4.9% in CY18. Overall, this should lead World growth to rise to 3.9% in CY18.
Source: International Monetary Fund. 2018. World Economic Outlook: Cyclical Upswing, Structural Change. Washington, DC, April.
II. Overview of the Industry
Global IT-BPM industry grew by 4.3% and the IT-BPM market excluding hardware stood at USD 1.3 trillion in CY17. Indian IT-BPM industry revenues including hardware stood at USD 167 billion in FY18. The industry added ~USD 12 billion in incremental revenues last year, representing year-on-year growth of ~8% in USD terms. IT-BPM export revenues for the industry for FY18 are expected to reach USD 126 billion, growth of 7.7% over the past year. Domestic IT-BPM revenues are estimated at USD 26 billion, a growth of 8% from USD 24 billion in FY17. IT-BPM export revenues are expected to grow by 7-9% in FY19 and the domestic market is likely to grow by 10-12% next year.
Digital technologies are increasingly becoming all pervasive and are not only blurring the boundaries between business units (technology, finance, marketing, etc.) but also between companies; it is now no longer tech and non-tech companies. Many companies especially in the banking, automotive and manufacturing space are re-branding themselves as tech companies.
In the age of digital technologies, the industry has been adept at building the necessary skills and capabilities to address new and changing customer demands. Over the past few years, firms have made substantial investments in building their portfolio of capabilities around these technologies and have set up a number of labs and CoEs to deliver digital services to customers. Consequently, the industry is now well equipped to manage the stage of Bi-modal IT. While currently the traditional services (ISO, CADM, software testing, F&A, HRO, etc.) continue to have a major share of revenue (~80%), the share of digital revenue is increasing rapidly. From about 14% in FY2016, it is now 18+% and is expected to reach 38% by 2025.
Source: NASSCOM IT-BPM Strategic Review 2018
III. Our Business
Larsen & Toubro Infotech Limited (LTI) (NSE: LTI), is a global technology consulting and digital solutions company helping more than 300 clients succeed in a converging world. With operations in 27 countries, we go the extra mile for our clients and accelerate their digital transformation with LTI’s Mosaic platform enabling their mobile, social, analytics, IoT (Internet of Things), cloud and cyber security journeys. In 2017, NASSCOM ranked the Company as the sixth largest Indian IT services company in terms of export revenues. The company was amongst the top 15 IT service providers globally in 2017 according to the Everest Group’s PEAK Matrix for IT service providers. Its clients comprise some of the world’s largest and well-known organizations, including 59 of the Fortune Global 500 companies. LTI offers an extensive range of IT services to its clients in diverse industries such as Banking & Financial Services, Insurance, Manufacturing, Energy & Utilities, Consumer Packaged Goods, Retail and Pharma, High-Tech and Media & Entertainment. Its range of services includes application development, maintenance and outsourcing, enterprise solutions, infrastructure management services, testing, digital solutions, cyber security and platform-based solutions. The company serves its clients across these industries, leveraging its domain expertise, diverse technological capabilities, wide geographical reach, an efficient global delivery model, thought partnership and ‘new age‘ digital offerings.
LTI is headquartered in Mumbai, India and part of the Larsen & Toubro (L&T) Group. The Company has inherited the engineering & innovation mind-set, domain expertise, and large program management capabilities from the promoter group. It leverages the strengths and heritage of L&T Group in imbibing virtuous risk management and corporate governance practices.
1. Strategy
LTI’s overall business strategy for long term growth has the following key elements:
i. Client centricity
ii. Deliver Amplified Outcomes to our clients
iii. Investing in new technologies to build differentiated service offerings
iv. Transforming as an organization to align ourselves in this dynamic world
v. Focusing on new large transformation deals
vi. Expanding in new geographies
vii. Investing in new avenues through Partnerships, Alliances and Acquisitions

Annual Report 2017-1818
Client Centricity is at the nucleus of Company strategy with primary focus on solving complex problems at the convergence of digital and physical world for its clients. LTI’s long association with key clients, understanding of their business and investment in account management teams through programs like Minecraft, ADEA (Analytics and Digital in Every Account) has positioned it well to deliver profitable growth. The Company posted significant improvement in client satisfaction over the last two years.
Company is focussed on amplifying outcomes for its clients by:
- Enabling new business models
- Enabling revenue growth
- Transforming customer and employee experiences
- Next gen efficient operations
LTI sees customers’ world changing through tectonic changes in technology. There are three things that are happening in the industry – First, there are exponential technologies that are available today. Second, these are all new technologies and they are new for everyone. No one has the incumbency advantage. Third, to help clients navigate and win in these times, one needs deep business knowledge to imagine and co-create with the customer. To facilitate and deliver amplified outcomes to its clients, Company has embraced the concept of ‘Shoshin’, Beginner’s mind - a mind that has openness, eagerness, and lack of preconceptions. In the beginner’s mind, there are many possibilities, in the expert’s mind there are few. Expertise is important however, what is needed is the willingness and openness to keep learning and then keep building expertise.
Conversant with latest technology and regulatory trends in an ever-evolving business ecosystem, LTI has created differentiated service offerings catering to a wide span of industry sectors. These include regulation-related offerings in the banking sector, underwriting-related offerings in the property and casualty insurance sector, digital operations management for Oil & Gas, Automotive etc. Considering the challenges around cyber security and data protection, LTI launched MOSAIC Security - it’s industry-agnostic offerings in the security space with a key focus on cyber-analytics.
Company’s relentless focus on digital, analytics, automation, IoT and cloud technologies through its proprietary MOSAICTM platform is helping it differentiate in the marketplace. It’s cutting edge work in these areas has been recognized by leading industry tech analysts in numerous studies, for example LTI has been recognised as Leader for Digital Focus in NelsonHall’s NEAT for Digital Testing and High Performer in HfS Blueprint Report for Enterprise Blockchain Services 2017.
The Company continues to move on its own path of transformation - “Change from Within”. LTI 2.0, the Company’s deep-rooted transformation program that covers every part of the organization has enabled the organization to be more agile, responsive and transparent. The Company executed a
comprehensive brand launch and global rollout during FY2018. LTI’s modern corporate identity reflects its aspiration to be the next generation IT services company with deep understanding of physical and digital convergence. On the Systems front, the Company revamped its internal systems to move away from standalone, legacy systems and replace them with a state-of-the-art, bespoken and tightly-coupled unified system to ensure streamlining of all processes and activities. Workplace has now become the platform of choice for all collaboration within the organization, this has helped create a unified front for all information and discussions and is the hot-bed for genesis of novel ideas. LTI also expanded its European footprint by setting up its latest development centre in Poland in FY2018. Located in Warsaw, the delivery centre will serve as a near-shore centre for local clients in the region.
To accelerate its revenue growth, the Company has adopted a three-pronged approach focusing on partnerships, acquisitions and association with start-up ecosystem. Together, these would assist in driving amplified outcomes for its clients.
Acquisition: In FY2018, the Company acquired Luxembourg-based Syncordis S.A., a leading core banking implementation services provider, along with its identified subsidiaries in France, UK, Luxembourg and India. Founded in 2004, Syncordis has an exclusive focus on Temenos Digital Suites that positions it as a leading independent pure play Temenos specialist. Syncordis has developed industry-leading accelerators that help with faster and consistent Temenos implementations and capture the fast-growing market opportunities for core banking product modernization services. This acquisition is poised to aid in growing LTI’s presence in Europe by deepening capabilities in the Banking and Financial services sector.
Partnerships: The Company has identified and signed nine strategic partnerships with large OEMs. It has also created 360-degree relationships with a select few partners, viewing them as Global growth engines. The Company has defined joint go-to-market strategies, enhanced capacity and readiness and proliferated best practices across clients through these partnerships.
LTI’s Start-up Ecosystem: The Company is creating an ecosystem to partner with innovators around the world and co-create value for clients through association with 600+ start-ups covering inputs from various Business Units.
The results from focus on client centricity and digital initiatives are evident from LTI’s performance. LTI has achieved a revenue of $1.13 Billion this year, steady customer satisfaction and is exiting the year with digital making 33% of revenues.
2. Opportunities
Company has a strong domain expertise derived from its parentage. It is at an inflection point, being right sized to attain agility of a start-up while maintaining stability of an established player which gives it a competitive advantage against its peers.

01Corporate Overview
17Statutory Reports
72Financial Statements
19
a) Banking and Financial Services: The Company achieved 23.5% year-on-year growth in BFS in FY18 and it is optimistic about growth in this vertical. In the US market, the softening of regulatory changes have resulted in more funds being diverted to digital and data projects, with an intent to increase efficiency. Banks are focused on reducing their operational costs and they see IT as a major enabler for achieving this goal. They are increasingly adopting cloud infrastructure to drive down costs through radical automation and superior asset utilization. Spend on “change-the-bank” activities forms significant part of total banks’ IT spend, of which the biggest proportion is for application change. They are moving towards master data management and analytics to allow for a single view of the customer and easier regulatory response and operations. However in Europe, focus will remain on modernizing the core banking operations. The anxiety towards Cloud and Blockchain has subsided to a certain extent as banks see these as technology enablers rather than mass disruptors.
Clients are relying on strategic partner such as LTI to help establish the new iterative model that some of the banks are looking to adopt. With the acquisition of Syncordis, LTI has gained expertise in Temenos, an industry-leading core banking solution. Temenos Digital Suites have ready-to-deploy solutions for banks looking to ‘go digital’ in a short span of time. LTI’s position is further strengthened by Analyst mentions such as being featured at the forefront as “Major Contender” in Everest Group’s inaugural PEAK Matrix for Risk & Regulatory Compliance Application Services in BFS.
b) Insurance: The Company has achieved 8.5% year-on-year growth in this vertical in FY18. Spend on digital transformation is the emerging trend in this sector despite the pressure on run-the-business spend. Life Annuity Insurers are focused on digital, optimized workflow and operating efficiencies as they face changing customer expectations. Property & casualty insurers are focused on analytics and speed-to-market as market competition and threat of adverse selection drives their need for better and faster product deployment. In the European market, spending will be focused to make the core insurance platform more resilient with simultaneous investment in building digital frontend to enhance customer experience.
LTI has built deep expertise in leading insurance products like Duck Creek, Insurity, Guidewire, etc., it also has unique offerings (digital and non-digital) that can help clients reduce turnaround time for operations, one of the core enablers for cost reduction.
c) Manufacturing: With 7.5% year-on-year growth, LTI is growing steadily in this sector. There are three key trends emerging in this vertical. First, cloud enabled IT
modernization has become mainstream and more and more clients are embarking on programs to move majority workloads to cloud and reduce cost of maintaining internal data centers. Second, manufacturing entities are proactively assessing ERP modernization, especially in SAP and Oracle economies. Third, clients in this industry have or are building definitive roadmaps for creating Digital-ready applications landscape for agility.
With its focus on Industry 4.0, LTI is uniquely positioned to address the digital transformation journey for its clients.
d) Energy and Utility: With a strong 23.1% year-on-year growth, the Company is confident about continued growth in this sector. Clients in this space are focusing on technology to streamline operations for cost reduction. They see investment in digital technologies as value-add for reducing costs, faster & better decision support and increasing workforce productivity. Digital investments are majorly focused on IoT, Analytics, Mobility and Cloud adoption. Advanced analytics is a major investment area for oil and gas companies. Augmented Reality & Drones to aid worker productivity, Wearables to provide over-the-shoulder coaching to workers are some of the Next Gen areas where LTI sees traction in this market.
e) CPG, Retail and Pharma: This sector has been a focus area for LTI and this resonates with 30.1% year-on-year growth the Company has achieved. Large players in CPG/Retail industry segment are facing intense local competition along with shifting consumer preference towards health & wellness and environment friendly products. Consumers are seen to drift towards more online purchases and it becomes imperative for these large players to directly engage with the consumers. Heavy focus is being given to supply chain optimization initiatives through Automation, IoT, Blockchain and direct to consumer initiatives enabled by AI and Machine Learning to set the tone for technology investment in this sector.
Clients in the Pharmaceuticals sector are focusing more on outcome-based patient care due to growing payer influence. To cope with the gap in funding and demand, providers are consolidating to procure at scale, leading to a change in the way they operate on the service delivery and purchasing fronts.
Medical device industry growth will be driven by North America and Asia, with profitability varying by segment. There is a more large-scale shift towards smarter technologies, which will help to enable many newer delivery model opportunities. IoT, Analytics, Hyper Automation, Wearables & Mobile apps, Health Informatics will drive the growth in this industry segment.
LTI has helped clients in their participation across the customer journey through smart support, chat bots and

Annual Report 2017-1820
automated interactions and will continue to enhance its offerings to reinforce such digital interactions.
f) Hi-Tech, Media and Entertainment: The Company has achieved 17.5% year-on-year growth in this industry vertical. In M&E space, changing demographic mix is leading to shifting spend patterns and is impacting Ad supported businesses. Technology adoption trends also see a shift in alignment with macro trends shaping the M&E industry segment. Augmented reality and Virtual reality would gain momentum, Blockchain, Cloud, AI, Analytics will be the driving force.
The Company sees Hi-Tech clients focus on faster speed-to-market initiatives, energy-efficient smart devices and industry models shifting towards pay per use models.
Digital Business
Digital strategy is evolving with unprecedented speed of change in our clients’ businesses. It is creating new businesses and new paradigms for clients. The Company aims to be digital transformation partner for clients to build their digital business and thrive in the digital era. New methodologies, like Design Driven Delivery help collapse layers and be more agile for clients.
For LTI, Digital will not just be a set of capabilities. It will be a Way of Working (WoW) and has below core components –
• Cuttingedgecapabilities
• Nextgendeliverymodels
• Extremedomainfocus
• Businessoutcomeasasuccessmetric
• Digitalinside
LTI’s Digital WoW is strategized through:
a) Digital Embed: is about developing amplified outcomes model for IT support through digital levers and enablers like advanced analytics, Artificial Intelligence, Machine Learning, Cloud mobility and Design Thinking.
b) Digitizing the Core: Empowering users with personalized and intelligent products and services. Enabling companies to interact with customers in real time and serve them with a 360 degree view.
c) Pivot on Platforms: Strong ecosystem to create value with external digital partners and end users allowing them to consume digital services unlike before. Platform as an economy creates new path for growth tapping into new revenue streams.
d) Service as a Product (SaaP): focusses on developing scalable and repeatable service experience to ensure consistency in customer experience and scale services over time without quality issues.
MOSAIC- LTI’s proprietary digital transformation platform: Mosaic is a converged platform offering data engineering, advanced analytics, process automation, IoT connectivity & improved solution experience to its users. Mosaic Ecosystem enables entities to undertake quantum leaps in digital transformation and bring an insights-driven approach to decision-making.
The ecosystem building blocks include:
• MOSAIC Artificial Intelligence: AI platform that integrates with Legacy and Micro Services based Architecture, understands Natural Language and derives Intelligence from knowledge assets
• MOSAIC Automation: Automation platform that addresses all the process automation needs of an enterprise
• MOSAIC Decisions: Analytics as a service offering designed for ease of data orchestration, data discovery, machine learning & AI, delivering industry specific use cases for accelerated data driven decision making
• MOSAIC Things: IoT framework for managing smart devices with seamless data injection, monitoring and control
• MOSAIC Experience: Provides features to measure, monitor and improve the application experience
• MOSAIC Security: Advanced cyber analytics, Resilient security ops orchestration, Advanced threat management, Multi-cloud security and Integrated IT-OT security
3. Human Capital
As we continue to take big strides in our transformation journey which has started with a simple goal of being the most customer centric company, we remain focused on three pillars of transformation – Sales & Marketing, Delivery and People practices.
Going forward, we want to build an organization that is recognized as the most meritocratic company in the Industry. Our ambitious goals can only be achieved when our employees are the happiest. Hence, people continue to be our most valued assets.
We are committed to nurturing an environment that promotes learning and growth which will lead us to build the next generation organization with a rigor on innovation, delivering business value and driving thought leadership. At LTI, we provide a range of professional skills to develop the finer aspects of executing our roles. Every day can be a new learning when it comes to delighting customers, managing people or delivering results. We believe that it’s never too late to learn something new. Our Anytime, Anywhere, byte sized programs help employees to acquire new skills and/or enhance their existing ones.
We have also institutionalized our five key beliefs across the organization:
• Beagile

01Corporate Overview
17Statutory Reports
72Financial Statements
21
• Gotheextramile
• Pushfrontiersofinnovation
• Keeplearning
• Solveforsociety
These five guiding principles have helped our people to be nimble towards changes, work over and beyond the call of duty to serve its clients, innovate on a day-to-day basis to transform the approach to work, continuously enhance their way of working and also focus on welfare for the society.
As on March 31, 2018, our headcount was 24,139. During FY18, we added 3000+ net new hires. Hiring, Engaging and Retaining talent continues to be the major focus areas for LTI. Compared to FY17, we improved on attrition, the full-year attrition was 14.8% in FY18 as compared to 16.9% last year.
We have launched several people initiatives that are making LTI an exciting place to learn and grow. Our Mosaic Academy continues to help us build new skills that our customers require. We have initiated the Krossover program which aims to enhance business operations and user experience of people through simplification and digitization of processes across Delivery, Finance, People supply chain and HR functions thereby upgrading our internal IT systems to be more digital-focused.
LTI has laid a Talent Strategy to focus on every employee at the
organization. Key focus and learning plans are available for all
experience bands, making the workforce ready by leveraging
the digital learning platforms.
iRise: This is a Global Sales Leadership Program where
B-school graduates are inducted and provided a Career in Sales
and Account Management with exposure across geographies.
The six month long program bears a promise of challenging
environment, engaging work and structured mentoring, thereby
creating an ecosystem to develop future global leaders who will
chart out LTIs growth story in the near future.
iImpact: The program designed for the Leadership team will
help the organization to create a pool of leadership talent,
develop and engage them, give opportunities to work on key
projects at an organization level and help build a career plan.
Delivery Partner Program: The objective is to prepare Delivery Managers to run and manage their accounts effectively. This program has participation from key leaders and domain experts, who ensure it’s successfully delivered.
IV. Significant Factors Affecting Our Results of Operations
Our results of operations have been, and will be, affected by many factors, some of which are beyond our control. This section sets out certain key factors that our management believes have
historically affected our results of operations, or which could affect our results of operations in the future.
Client relationships
Client relationships are at the core of our business. We have a history of high client retention and derive a significant proportion of our revenue from repeat business built on our successful execution of prior engagements. In the year ended March 31, 2018 we generated 97.9% of our revenue from existing clients as compared to 95.5% in the year March 31, 2017.
As a client relationship matures, we seek to maximize our revenue and profitability by expanding the scope of services offered to that client with the objective of winning more business from our clients, particularly in relation to our more substantive and value-added offerings. At the same time we continue our efforts to add new clients and expand client relationships.
Client contribution
37.6% 36.8%
FY17 FY18
Top 5 Clients Top 10 Clients Top 20 Clients
51.7% 49.9%
67.4% 65.5%
Composition of revenue portfolio
Our export service revenue consists of revenue from IT services both onsite and offshore. The mix of IT services performed onsite and offshore has an impact on our ability to achieve higher profit margins. The following table shows the proportionate contribution from our onsite and offshore service revenue on consolidated basis for the periods indicated:
Revenue Mix
46.3%48.3%
FY17 FY18
Onsite Offshore
53.7%51.7%
Employees and employee costs
In order to compete effectively, our ability to attract and retain qualified employees is critical. Our total headcount increased to 24,139 as of March 31, 2018 from 21,023 as of March 31, 2017.

Annual Report 2017-1822
Our attrition rate for FY18 was 14.8% which has improved from 16.9% in FY17.
Employee benefits expenses constituted 56.0% and 55.6% of our total income in the year ended March 31, 2018 and March 31, 2017. Wage costs in India, including in the IT services industry, have historically been more competitive than wage costs in the United States, Europe and other developed economies. In addition, we continue to invest in the recruitment and retention of sales and administration staff in line with our growth and expand our markets.
Foreign currency fluctuations
Since majority of our revenue is foreign currency denominated, we carry translation and transaction foreign exchange risks. Although our foreign currency expenses partly provide a natural hedge, we are exposed to foreign exchange rate risk in respect of revenue or expenses entered into in a currency where corresponding expenses or revenue are denominated in different currencies. Major currencies in which we have exposures are US Dollars, Euro, Norwegian Krone, Swedish Krone, Canadian Dollars, British Pound Sterling and South African Rand. LTI has an active foreign exchange hedging policy in place to mitigate the risks arising out of foreign exchange fluctuations.
In addition, the overall competitiveness of the Indian IT industry in the global market is also significantly dependent on favorable exchange rates.
Tax benefits for Indian IT companies
We have historically benefited from the direct and indirect tax benefits given by the Government for the export of IT services from SEZs, including for our business. As a result, a substantial portion of our profits is exempt from income tax leading to a lower overall effective tax rate than that which we would have otherwise been subjected to if we were doing business outside SEZs, and we will continue to enjoy such benefits in the near future. Our effective tax rate has increased to 22.8% and 21.4%, respectively in the year ended March 31, 2018 and March 31, 2017 due to lower proportion of exemptions.
From July 1, 2017 onwards the company has successfully transitioned to the new indirect tax regime of Goods & Service Tax (GST).
Until March 31, 2011, direct and indirect tax benefits were also available to us for the export of IT services from software development centers registered under the STPI Scheme. From April 1, 2011 onwards, only indirect tax benefits are available for our business through software development centers registered under the STPI Scheme which continue under GST regime.
V. Financial Conditions Consolidated
Assets
1. Tangible and Intangible Assets:
(` in Mn) As at
March 31, 2018As at
March 31, 2017Property, Plant and equipment 2,508 2,578Capital work-in-progress 10 9Goodwill 2,763 993Other Intangible assets 1,535 1,848Intangible assets under development 58 4Total 6,873 5,432
Property, Plant and equipment:
The Company continued to invest in infrastructure facilities on account of computers, office equipment, expansion of development centers in India as well as overseas, in order to meet business growth. Property, Plant and equipment has reduced to ` 2,507 Million as at March 31, 2018 from ` 2,578 Million as at March 31, 2017 due to depreciation being higher than net additions during the year.
Goodwill and other Intangible assets:
Increase in Goodwill is primarily due to goodwill arising from acquisition of Syncordis S.A. The net decrease in Other Intangible assets during the year is mainly on account of amortization. Intangible assets under development represent efforts spent on assets which are under development.

01Corporate Overview
17Statutory Reports
72Financial Statements
23
2. Other Non-current and current assets
(` in Mn)
As at March 31, 2018 As at March 31, 2017 Non-current Current Total Non-current Current Total
Non-Current Assets - Financial Investments 1 - 1 - - -Loans 387 - 387 311 - 311Other Financial Assets 721 - 721 1,866 - 1,866
1,109 - 1,109 2,177 - 2,177Other Non-current AssetsTax assets 900 - 900 722 - 722Other Assets 1,080 - 1,080 1,292 - 1,292
1,980 - 1,980 2,014 - 2,014Current Assets Loans - 238 238 - 159 159Other Financial Assets - 1,976 1,976 - 2,518 2,518Other Current Assets - 1,125 1,125 - 988 988Total 3,089 3,339 6,428 4,191 3,665 7,856
Non-current Financial Investment as of March 31, 2018 pertains to investment made by the Company in acquiring 4.76% shareholding of L&T LLC. The decrease in non-current and current other financial assets is attributable to decrease in marked to market gains of outstanding forward contracts.
3. Trade Receivables
Trade receivables amounted to ` 13,962 Million (net of provision for doubtful debts amounting to ` 345 Million) as at March 31, 2018, compared to ` 11,697 Million (net of provision for doubtful debts amounting to ` 230 Million) as at March 31, 2017.
Days of Sales outstanding of Trade Receivables as on March 31, 2018 is 70 days as against 66 days as on March 31, 2017.
4. Unbilled Revenue
Unbilled revenue represents value of services performed for customers not yet billed. Unbilled revenue stood at ` 8,365 Million as at March 31, 2018 as against ` 4,724 Million at March 31, 2017.
Days of Sales outstanding of unbilled revenue was 42 days as on March 31, 2018 as compared to 27 days as on March 31, 2017.
5. Funds Invested
(` in Mn) As at
March 31, 2018As at
March 31, 2017Investment in Mutual funds 12,643 9,406Cash and Cash equivalents 3,323 2,291Other Bank Balances 310 1,504Fund invested 16,277 13,201
The investments in Mutual funds are primarily in Debt mutual funds having investments in sound rated instruments & in schemes with large assets under management, thus mitigating counterparty risk. These investments stood at ` 12,643 Million as at March 31, 2018 as against ` 9,406 Million as at March 31, 2017.
Cash and cash equivalents include both rupee accounts and foreign currency accounts and deposits with banks. The bank balances in overseas accounts are maintained to meet the expenditure of the overseas operations.
Other Bank Balances are earmarked funds and term deposits, in rupee as well as foreign currency, having maturity of more than 3 months.

Annual Report 2017-1824
6. Share Capital
(` in Mn) As at
March 31, 2018As at
March 31, 2017Authorized:
260 240260,000,000 equity shares of ` 1 each(Previous year 240,000,000 of ` 1 each) Issued, paid up and subscribed
172 171171,999,263 equity shares for ` 1 each(Previous year 170,571,113 of ` 1 each)Equity Share Capital 172 171
Increase in Authorised Share Capital is due to amalgamation of AugmentIQ Data Sciences Pvt. Ltd. with LTI effective 1st Apr’17. The Issued, paid up and subscribed share capital increased on account of shares issued on exercise of employee stock options during the year ended March 31, 2018.
7. Other Equity
(` in Mn) As at
March 31, 2018As at
March 31, 2017Other reserves 9,521 9,910Retained earnings 28,905 21,362Share application money pending allotment 0 0Non-Controlling interest 13 8Other Equity 38,439 31,280
Other equity at the end of March 31, 2018 stood at ` 38,439 Million as against ` 31,280 Million at the end of at March 31, 2017. The decrease in Others reserves is primarily due to decrease in hedging reserve on account of lower marked to market gains on outstanding forward contracts due to rupee depreciation and also due to decrease in quantum of outstanding forward contracts.
8. Deferred tax assets / liabilities
(` in Mn) As at
March 31, 2018As at
March 31, 2017Deferred tax assets 1,921 1,434Deferred tax liabilities 132 171
Deferred tax assets and liabilities are recognized for temporary differences arising between the tax bases of assets and liabilities and their carrying amounts in the financial statements. Deferred income tax assets and liabilities are measured using tax rates and tax laws that have been enacted or substantively enacted as on the balance sheet date and are expected to apply to taxable income in the years in which those temporary differences are expected to be recovered or settled.
Other deferred tax assets are recognized and carried forward to the extent there is reasonable certainty that sufficient future taxable income will be available against which such deferred tax assets can be realized.
Deferred tax assets have increased to ` 1,921 Million as at March 31, 2018 from to ` 1,434 Million as at March 31, 2017. The increase is mainly due to reduction of Deferred tax liability on marked to market gains on outstanding forward contracts and additional Minimum Alternate Tax (MAT) for year ended March 31, 2018.
9. Other Non-Current and Current liabilities
(` in Mn)
As at March 31, 2018 As at March 31, 2017 Non-current Current Total Non-current Current Total
Non-Current liabilitiesFinancial Liabilities 1042 - 1041 - - -Provisions 279 - 280 285 - 285

01Corporate Overview
17Statutory Reports
72Financial Statements
25
(` in Mn)
As at March 31, 2018 As at March 31, 2017 Non-current Current Total Non-current Current Total
Current liabilitiesTrade Payables - 3,888 3,888 - 3,366 3,366Other Financial Liabilities - 6,106 6,106 - 5,998 5,998Other Liabilities - 1,617 1,617 - 1,158 1,158Provisions - 1,844 1,844 - 1,614 1,614Current income tax liabilities (Net) - 307 307 - 301 301Total 1,321 13,762 15,083 285 12,437 12,722
Total Other Non-Current and Current liabilities stood at ̀ 15,083 Million as of March 31, 2018 from ̀ 12,722 Million as of March 31, 2017.
Non-current Financial Liabilities and Current Other financial liabilities as of March 31, 2018 include contingent consideration payable for acquisition of Syncordis S.A and liability under commercial settlement with a client.
Other current liabilities comprise of statutory dues including employee related statutory dues. Provisions comprise of provisions for employee benefits on account of compensated absences and post-retirement medical benefits.
VI. Results of our consolidated operations
(` in Mn)
2017-18 2016-17` in Mn % of Total
Income` in Mn % of Total
IncomeIncomeRevenue from operations 73,065 94.5% 65,009 97.2%Other income 4,261 5.5% 1,867 2.8%Total Income 77,326 100.0% 66,876 100.0%ExpensesEmployee benefit expenses 43,289 56.0% 37,153 55.6%Operating expenses 16,845 21.8% 14,764 22.1%Finance costs 157 0.2% 32 0.0%Depreciation and Amortization 1,563 2.0% 1,779 2.7%Other Expenses 1,057 1.4% 790 1.2%Total Expenses 62,911 81.4% 54,518 81.5%Profit before tax 14,415 18.6% 12,358 18.5%Tax expenses - Current tax 3,654 4.7% 3,181 4.8% - Deferred tax (net) (363) -0.5% (532) -0.8%
3,291 4.2% 2,649 4.0%Net Profit for the period 11,124 14.4% 9,709 14.5%Other Comprehensive income (835) 1,945Total comprehensive income for the period 10,289 11,654Profit attributable to:Owners of the company 11,120 9,707Non-controlling interests 4 2
11,124 9,709Total comprehensive income attributable to:Owners of the Company 10,283 11,652Non-controlling interests 6 2
10,289 11,654Earnings Per ShareBasic ` 64.93 ` 57.08Diluted ` 63.48 ` 55.80

Annual Report 2017-1826
Financial Year 2017-18 Compared to Financial Year 2016-17
1. Income
Our total income comprises of revenue from operations and other income.
Our total income increased by 15.6% to ` 77,326 Million for the year ended March 31, 2018 from ` 66,876 Million for the year ended March 31, 2017.
Revenue from operations
Revenue Mix by Verticals
FY17 FY18
Insurance Manufacturing Energy & Utilities
CPG, Retail and M&E
OthersHi-Tech Media & Ent
26.0% 27.4%
21.2% 19.7% 18.3% 16.8%
8.0%10.7%
4.7%
9.0%10.7%
4.6%
11.1% 11.7%
BFS
Revenue Mix by Services
FY17 FY18
Enterprise Solutions
Infrastructure Services &
Security
Testing Analytics, Al & Cognitive
Products and
Platforms
Enterprise Integration
and Mobility
37.4%34.2%
23.5% 25.1%
10.9% 11.4%8.8%
6.1% 4.0%
10.6%6.6%
3.5%
9.4% 8.6%
ADS
Our revenue increased by 12.4% to ` 73,065 Million for the year ended March 31, 2018 from ` 65,009 Million for the year ended March 31, 2017, primarily due to growth in Banking and Financial services (growth of 18.3%), Energy & Utilities (growth of 18.5%) and CPG, Retail & Pharma (growth of 25.3%) verticals, which was partially offset by lower growth in revenues in our Insurance and Manufacturing business vertical.
Our service growth was higher mainly in Enterprise Solutions; Infrastructure Services & Security; Analytics, AI & Cognitive and Enterprise Integration & Mobility with growth of 19.9%, 17.4%, 35.1% and 21.4% respectively, which was partially offset by lower growth in other services.
2. Other Income
Other income primarily consists of income from foreign exchange gains (or losses), investments in mutual
funds, profit on sale of fixed assets, interest received and miscellaneous income. Other income for the year ended March 31, 2018 was ` 4,261 Million as against ` 1,867 Million for the year ended March 31, 2017.
Income from Investments in Mutual Funds
Income from investments in Mutual Funds was ` 738 Million in the year ended March 31, 2018 compared to ` 194 Million for the year ended March 31, 2017. The increase is primarily due to increase in surplus invested and switch from dividend to growth schemes.
Foreign Exchange Gains / (Losses)
In order to mitigate our foreign exchange risk, we have a long-term hedging policy. We hedge exposures in major currencies such as the US dollar and the Euro by entering into forward contracts. Our hedging policy runs on a net exposure basis, typically for a period of up to three years.

01Corporate Overview
17Statutory Reports
72Financial Statements
27
These forward contracts provide for payments by banks to us in the situations where the spot exchange rate on maturity is lower than the rate at which forward contracts were entered and payment by us to the banks in situations where the spot exchange rate on maturity is higher than the rate at which forward contracts were entered. Our foreign exchange gain was ` 3,427 Million in for the year ended March 31, 2018 as against ` 1,539 Million in the year ended March 31, 2017, the increase is primarily due to appreciation of Rupee against the US dollar.
3. Expenses
Our expenses include employee benefit expenses, operating expenses, finance costs, depreciation and amortization and other expenses. Our total expenses increased by 15.4% to ` 62,911 Million for the year ended March 31, 2018 from ` 54,518 Million for the year ended March 31, 2017, primarily as a result of an increase in employee benefit expenses and operating expenses.
4. Employee benefit expenses
Employee benefit expenses comprise salaries (including overseas staff expenses); staff welfare; contributions to provident and other funds; contributions to superannuation funds and contributions to gratuity funds.
Our employee benefit expenses increased by 16.5% to ` 43,289 Million for the year ended March 31, 2018 from ` 37,153 Million for the year ended March 31, 2017. The increase in the salaries was majorly due to increase in employee count due to growth of our operations and increments. This has also resulted in higher contribution to the Provident fund, Social security account and payroll taxes.
5. Operating expenses
Operating expenses comprise consultancy charges, cost of equipment, hardware and software packages, travelling and conveyance expenses, rent and establishment expenses etc.
Our operating expenses increased by 14.0% to ` 16,845 Million for the year ended March 31, 2018 from ` 14,764 Million for the year ended March 31, 2017. Operating expenses for year ended March 31, 2018 include one-time charge resulting from commercial settlement with a client of ` 617 Mn.
6. Finance costs
Finance costs comprise of interest on money received under Credit Support Agreement and interest payable on contingent consideration payable for acquisition of Syncordis S.A .
Our finance costs increased to ` 157 Million for the year ended March 31, 2018 from ` 32 Million for the year ended
March 31, 2017 primarily due to increase in interest
on deposits received from bank under Credit Support
Agreements entered in relation to our hedges.
7. Depreciation and amortization
Tangible and intangible assets are amortized over periods
corresponding to their estimated useful lives.
Our depreciation and amortization decreased by 12.2%
to ` 1,563 Million for the year ended March 31, 2018 from
` 1,779 Million for the year ended March 31, 2017.
8. Other Expenses
Other expenses increased by 35.8% to ̀ 1,057 Million for the
year ended March 31, 2018 from ` 790 Million for the year
ended March 31, 2017, primarily due to legal & professional
fees, Corporate Social Responsibility expenses, donations,
bank charges and other miscellaneous expenses.
9. Profit before tax
Our profit before tax increased by 16.6% to ` 14,415 Million
for the year ended March 31, 2018 from ` 12,358 Million for
the year ended March 31, 2017.
10. Tax expense
Tax expense comprises of current tax and deferred tax.
Current income tax is the amount expected to be paid to
the tax authorities in accordance with the applicable tax
laws in relevant jurisdictions. Deferred income tax assets
and liabilities reflect the impact of temporary differences
arising between the tax bases of assets and liabilities
and their carrying amounts in the financial statements as
well as other deferred tax assets recognized and carried
forward to the extent there is a reasonable certainty that
sufficient future taxable income will be available.
Total tax expense has increased by 24.3% to ` 3,291 Million
for the year ended March 31, 2018 from ` 2,649 Million for
the year ended March 31, 2017, primarily due to increase in
profit, tax on mutual fund income after switch from dividend
to growth schemes, reduction in tax exemptions etc.
11. Net profit after tax
As a result of the foregoing factors, our net profit increased
by 14.6% to ` 11,124 Million for the year ended March 31,
2018 from ̀ 9,709 Million for the year ended March 31, 2017.
12. Earnings per share (EPS)
Our Basic EPS has increased by 13.7% to ` 64.93 per share
for the year ended March 31, 2018 from ` 57.08 per share
for the year ended March 31, 2017. Our Diluted EPS has
increased by 13.7% to ` 63.48 per share for the year ended
March 31, 2018 from ` 55.80 per share in the year ended
March 31, 2017.
Annual Report 2017-1828
Investments in Subsidiaries
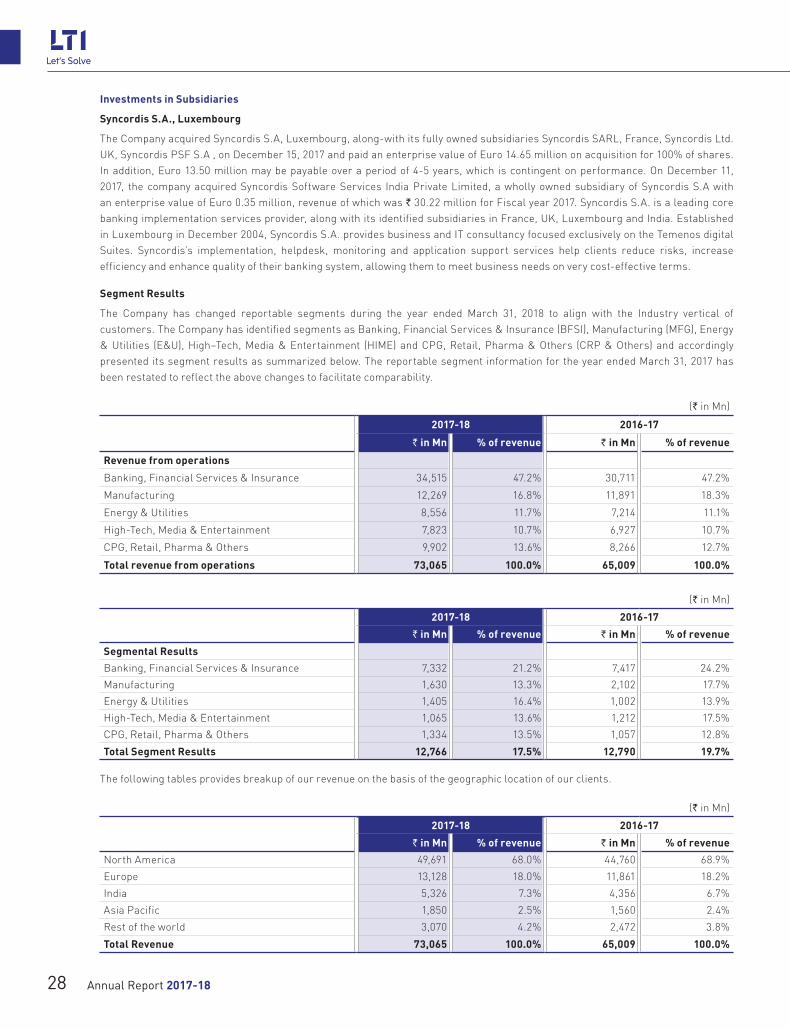
Syncordis S.A., Luxembourg
The Company acquired Syncordis S.A, Luxembourg, along-with its fully owned subsidiaries Syncordis SARL, France, Syncordis Ltd. UK, Syncordis PSF S.A , on December 15, 2017 and paid an enterprise value of Euro 14.65 million on acquisition for 100% of shares. In addition, Euro 13.50 million may be payable over a period of 4-5 years, which is contingent on performance. On December 11, 2017, the company acquired Syncordis Software Services India Private Limited, a wholly owned subsidiary of Syncordis S.A with an enterprise value of Euro 0.35 million, revenue of which was ` 30.22 million for Fiscal year 2017. Syncordis S.A. is a leading core banking implementation services provider, along with its identified subsidiaries in France, UK, Luxembourg and India. Established in Luxembourg in December 2004, Syncordis S.A. provides business and IT consultancy focused exclusively on the Temenos digital Suites. Syncordis’s implementation, helpdesk, monitoring and application support services help clients reduce risks, increase efficiency and enhance quality of their banking system, allowing them to meet business needs on very cost-effective terms.
Segment Results
The Company has changed reportable segments during the year ended March 31, 2018 to align with the Industry vertical of customers. The Company has identified segments as Banking, Financial Services & Insurance (BFSI), Manufacturing (MFG), Energy & Utilities (E&U), High–Tech, Media & Entertainment (HIME) and CPG, Retail, Pharma & Others (CRP & Others) and accordingly presented its segment results as summarized below. The reportable segment information for the year ended March 31, 2017 has been restated to reflect the above changes to facilitate comparability.
(` in Mn)
2017-18 2016-17
` in Mn % of revenue ` in Mn % of revenue
Revenue from operations
Banking, Financial Services & Insurance 34,515 47.2% 30,711 47.2%
Manufacturing 12,269 16.8% 11,891 18.3%
Energy & Utilities 8,556 11.7% 7,214 11.1%
High-Tech, Media & Entertainment 7,823 10.7% 6,927 10.7%
CPG, Retail, Pharma & Others 9,902 13.6% 8,266 12.7%
Total revenue from operations 73,065 100.0% 65,009 100.0%
(` in Mn)
2017-18 2016-17
` in Mn % of revenue ` in Mn % of revenue
Segmental Results
Banking, Financial Services & Insurance 7,332 21.2% 7,417 24.2%
Manufacturing 1,630 13.3% 2,102 17.7%
Energy & Utilities 1,405 16.4% 1,002 13.9%
High-Tech, Media & Entertainment 1,065 13.6% 1,212 17.5%
CPG, Retail, Pharma & Others 1,334 13.5% 1,057 12.8%
Total Segment Results 12,766 17.5% 12,790 19.7%
The following tables provides breakup of our revenue on the basis of the geographic location of our clients.
(` in Mn)
2017-18 2016-17
` in Mn % of revenue ` in Mn % of revenue
North America 49,691 68.0% 44,760 68.9%
Europe 13,128 18.0% 11,861 18.2%
India 5,326 7.3% 4,356 6.7%
Asia Pacific 1,850 2.5% 1,560 2.4%
Rest of the world 3,070 4.2% 2,472 3.8%
Total Revenue 73,065 100.0% 65,009 100.0%

01Corporate Overview
17Statutory Reports
72Financial Statements
29
VII. Liquidity
The Company has managed its cash flows during the year ended March 31, 2018 without raising short-term and long-term borrowings. The Company has financed its business growth including acquisition of Syncordis, S. A through cash generated from operations during the year.
The table below summarizes our consolidated cash flows
(` in Mn) 2017-18 2016-17
Net cash generated from operating activities 8,438 11,696Net cash (used) in Investing activities (4,606) (9,515)Net cash (used) in financing activities (4,076) (328)Net increase / (decrease) in cash and cash equivalents (244) 1,854Cash and cash equivalents at the beginning of the period 3,795 2,035Effect of exchange differences on translation of Foreign currency cash and cash equivalents 82 (94)Cash and cash equivalents at the end of the period 3,633 3,795
VIII. Internal Controls
LTI has established a framework for Internal Controls, commensurate with the size and nature of its operations. Process has been set up for periodically apprising the senior management and the Audit Committee of the Board about Internal audit observations of the Company with respect to Internal Controls and status of statutory compliances.
Business Heads and Support functions are responsible for establishing effective internal controls within their respective functions. Standard operating procedures and internal control manuals are defined and continuously updated.
The Company has laid down Internal Financial Controls as detailed in the Companies Act, 2013. These have been established across the levels and are designed to ensure compliance to internal control requirements, regulatory compliance and appropriate recording of financial and operational information.
Internal Audit team periodically conducts audits across the Company, which include review of operating effectiveness of internal controls. The Company wherever necessary engages third party consultants for specific audits or reviews. The Audit Committee oversees internal audit function.
Some of the Internal and External Risks are given below -
Category Risk Narration Mitigation ApproachInternal – Portfolio Risk
Rapid change in technologies and Digital Disruption
Rapid change in technologies with digital market marks a need of fast realignment to new technologies and business models, failure to which may attract low business.
Focused investments in creating new capabilities:• Strengthen new digital solution practice with a focus on digital
service offering• Continue develop expertise in new technologies through
MOSAIC academy• Creation and institutionalization of Digital Delivery Framework
focusing on delivering rich experience to clients using methodologies based on Design Thinking, Agile and DevOps.
Business Concentration Risks
Exposure to limited number of clients creates risk of a major revenue loss in the event a major client exit.
Focused efforts to expand existing business and add new logos• Focused initiatives and strategies on winning new clients with
large IT spends• Strategies enabling strong account relationship driving
account mining and profitability • Innovations and value added deliverables to become trusted
partners to client• Expand business in Europe, Middle East, and increase focus
on South Africa.During FY’18 these measures have already resulted in addition of high revenue clients
internal – Operational Risks
Execution Risks Failure in deliverable execution could mark a risk of work getting transferred to the competition. Any loss of confidence or customer trust due to deficiencies and execution failures could damage the business and organization reputation
Strengthening of service assurance framework through:• Ensuring early identification and resolution of any issues • Providing visibility of project execution status to right
management levels and ensuring strong risk management• Focused programs to strengthen program management
capabilities • Quality assurance through focused audits and quality control

Annual Report 2017-1830
Category Risk Narration Mitigation ApproachExternal – Economic Risks
FOREX Risks Our profitability could be impacted due to currency movements impacting realization of revenue in `
• Financial Risk management policy has been approved by the Board. Hedges are taken to mitigate forex risk as per the policy.
• Treasury Committee takes hedging decisions in line with the policy. The hedge positions are periodically reviewed by the Audit Committee and the Board.
External – Legal & Regulatory Risks
International Mobility Risks
Immigration policies of client countries may affect our ability to position consultants at client locations hindering operations.
• Dedicated leadership team for implementing a comprehensive solution
• Reduce dependence on work visas through staffing model changes
• Set up delivery center in USA and Poland• Grow business in other geographies
Compliance Risks
As our operations are spread globally, it exposes us to numerous local regulation. Non-compliance to these laws, adversely affect our business and future financial performance.
• Compliance portal in place to capture the specific geography’s regulatory requirement and our compliance towards the same
• Designated stakeholder responsible towards specific geography’s regulatory compliance
• Each stakeholder provides a Compliance certificate confirming local compliances
Natural hazards Natural hazards and disasters like earthquakes, floods, tsunamis, storms etc. can be threat to business requirements
Develop and implement robust Disaster Recovery and Business Continuity Plan• Business continuity plan (BCP) prepared for each Account and
Organization as a whole• BCP tested periodically ensuring its implementation in actual
force majeure • Backup site identified for each operating location, which shall
act as its Disaster recovery site in the force majeure event• Migration of key applications to Cloud
Cyber Attacks and Crime
In an era of ‘Digital world’, being affected by ‘Stay Connected’ syndrome’, cyber vulnerability as well is amplified. This makes the organization vulnerable to cyber-crimes
• Security policy designed and deployed across the organization• Various controls deployed for advanced security and
monitoring• Penetration testing by external vendors, through security
checks and assessment to confirm on security requirements
GDPR An organization if processes or stores any data of person residing in EU, the organizations needs to comply with GDPR requirements. Non-Compliance to the same shall attract heavy penalty
GDPR compliance team is constituted with key responsibility to:• Analyze the effect of GDPR compliance requirement on the
organization• Plan for its deployment and implementation• Monitor and drive GDPR implementation• Governance and reporting on compliance to the leadership
Outlook, Risks and Concerns
This section lists forward-looking statements that involve risks and uncertainties. Our actual results could differ materially from those anticipated in these statements as a results of certain factors. LTI does not undertake to update any forward-looking statement that may be made from time to time by us or on our behalf.
Our client’s business is getting impacted at an unprecedented speed due to world of digital and exponential technologies. LTI has made proactive investments in digital technologies, bringing our in-house expertise together under the MOSAIC platform and enhancing these offerings through acquisitions. Today, Enterprises want to work with partners that are agile, can de-clutter new technologies and can co-create solutions with them. Our sustained investments in digital and exponential technologies are establishing us as the partner-of-choice for our customers worldwide.
In FY18, we delivered an industry leading revenue growth of 16.7% in USD terms. With intense focus on client success and comprehensive transformation capabilities across digital, analytics, IoT, automation and cloud, we are optimistic about our future.
CY stands for Calender Year in this Annual Report.FY18 or FY2018 stands for financial year 2017-18 in this Annual Report.

01Corporate Overview
17Statutory Reports
72Financial Statements
31
Risk Management Framework
The following section outlines various dimensions of Risk Management framework and its implementation
A. Overview:
Our objective of Risk Management framework is to address risks in a proactive manner to sustain business growth. The framework is established to ensure that risks that would impact key business objectives are identified, assessed, quantified and appropriately mitigated on a continuous basis.
Multiple Lines of Defense for Risk Management
2ND LINE OF DEFENSE
(Compliance & Control Assessment)
Security
Quality
Compliance
Risk Management
Internal Audits
3RD LINE OF DEFENSE
(External Checks)
External Audits
External Consultants
Management Controls
Internal Control Measures
1ST LINE OF DEFENSE
(Self Risk Assessment)
Project
Account
Delivery Unit / Practice Unit
Business Enabling Unit
B. Risk Governance:
Following are the Key roles and responsibilities that comprise risk governance for the organization:
Board:
Key Responsibilities
- Ensure risk management framework and systems are in place;
- Monitor the development and implementation of Risk Management Framework.
Risk Management Committee (RMC):
RMC comprises of members of board and senior executives of the Company. The Composition of RMC is provided in Corporate Governance section of this Annual Report.
Key Responsibilities:
- Review effectiveness of the Risk Policy and Enterprise Risk Management (ERM) framework
- Review Strategic, Macro - Economic and Sectoral Risks for the organization
Risk Operating Committee (ROC):
ROC comprises of organization leadership and is chaired by the Chief Operating Officer (COO)
Key Responsibilities:
- Guide and mitigate issues related to respective business / functions;
- Develop proactive and sustainable Risk Management culture.
Chief Risk Officer (CRO):
CRO heads the Risk Management Function
Key Responsibilities:
- Design and deploy Risk Management Plan in co-ordination with ROC;
- Assist RMC in overseeing implementation of Risk Policy;
- Provide ERM updates to Audit Committee.

Annual Report 2017-1832
C. Risk Management through Multiple Lines of Defense:
Risk Management at Company is designed to have various lines of defense:
1. Self-Risk Assessment: Self-risk assessment happens at various levels of the Organization like, project, account, and unit level. Each unit proactively identify risks for their functions, and go through the risk management cycle.
2. Compliance & Control assessment: Various Internal teams like Internal Audit, Delivery Excellence, IT Security etc. performs internal checks ensuring required internal controls are in place. Non-conformities are escalated appropriately.
3. External Checks: Various external consultants and auditors are leveraged to receive best practices and industry benchmarks. These best practices are implemented in the organization to improve the operations vis-a-vise risk control measures.
Risk Management Process
Risk Management process at the Company comprises of Risk Identification, Analysis, Mitigation and Monitoring.
Risk Identification: Risk Identification includes study and analysis of technology trends, external market and events and existing processes. Identification of risk happens at various levels. Identified Risks are classified into three categories: Strategic, Business and Operational.
Risk Analysis: Analysis of risk happens on the basis of two parameters, i.e. ‘Impact’ and ‘Probability’. The impact of risk and its probability of occurrence derives ‘Risk Severity’. Risk can be prioritized for its mitigation based on the Severity of risk.
Risk Mitigation: Mitigation strategy can be one of the following:
• Avoid:Riskwithhighseveritywheremitigationofriskmaynot be possible, can be avoided.
• Reduce: Risk impact or frequency can be reduced byplacing appropriate mitigation plan.
• Transfer:Risk can be transferred in total or partially, toexternal third party.
• Accept: Accept the risk with low severity, where itsmitigation cost may not be more expensive than the risk exposure.
Risk Monitoring and Reporting:
Risk Monitoring:
a. Monitor the identified risk for: i) Proximity of risk occurrence; ii) Effectiveness of the mitigation plan.
b. Identify new risks that may surface, with its mitigation plan.
Risk Reporting: Where leadership guidance is required is reported to management through appropriate forums.
D. Risk Management Activities performed during FY18
1. Strong governance to drive risk management in the organization:
- Conducted six Risk Operating Committee (ROC) meetings with a focus on governance and drive to implement risk management framework in the organization
- Conducted one Risk Management Committee (RMC) meeting to have an oversight by the Board and Leadership ensuring implementation and effectiveness of risk management framework
- Apprised Audit Committee on risk management activities on periodic basis.
2. ERM maturity improvement activities planned and implementation initiated:
- Strengthen risk management in the organization through strengthening first line of defense
- Risk Management in strategic decisions
- Periodic risk scorecard
- Develop, risk management portal to aid implementation and monitoring of the framework.
3. Strengthen Issue Management Process:
- Strengthen issue management process to track audit observation through incident, process and coverage remedy.
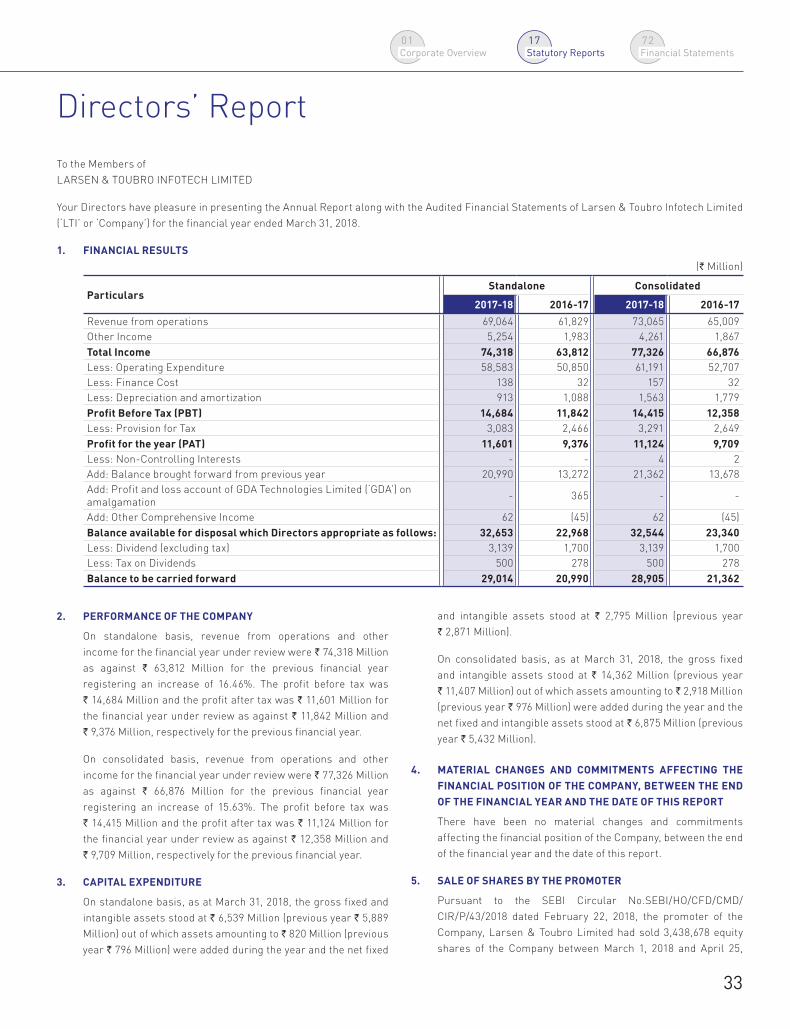
01Corporate Overview
17Statutory Reports
72Financial Statements
33
To the Members ofLARSEN & TOUBRO INFOTECH LIMITED
Your Directors have pleasure in presenting the Annual Report along with the Audited Financial Statements of Larsen & Toubro Infotech Limited (‘LTI’ or ‘Company’) for the financial year ended March 31, 2018.
1. FINANCIAL RESULTS (` Million)
ParticularsStandalone Consolidated
2017-18 2016-17 2017-18 2016-17
Revenue from operations 69,064 61,829 73,065 65,009Other Income 5,254 1,983 4,261 1,867Total Income 74,318 63,812 77,326 66,876Less: Operating Expenditure 58,583 50,850 61,191 52,707Less: Finance Cost 138 32 157 32Less: Depreciation and amortization 913 1,088 1,563 1,779Profit Before Tax (PBT) 14,684 11,842 14,415 12,358Less: Provision for Tax 3,083 2,466 3,291 2,649Profit for the year (PAT) 11,601 9,376 11,124 9,709Less: Non-Controlling Interests - - 4 2Add: Balance brought forward from previous year 20,990 13,272 21,362 13,678Add: Profit and loss account of GDA Technologies Limited (‘GDA’) on amalgamation - 365 - -
Add: Other Comprehensive Income 62 (45) 62 (45)Balance available for disposal which Directors appropriate as follows: 32,653 22,968 32,544 23,340Less: Dividend (excluding tax) 3,139 1,700 3,139 1,700Less: Tax on Dividends 500 278 500 278Balance to be carried forward 29,014 20,990 28,905 21,362
Directors’ Report
2. PERFORMANCE OF THE COMPANY
On standalone basis, revenue from operations and other income for the financial year under review were ` 74,318 Million as against ` 63,812 Million for the previous financial year registering an increase of 16.46%. The profit before tax was ` 14,684 Million and the profit after tax was ` 11,601 Million for the financial year under review as against ` 11,842 Million and ` 9,376 Million, respectively for the previous financial year.
On consolidated basis, revenue from operations and other income for the financial year under review were ` 77,326 Million as against ` 66,876 Million for the previous financial year registering an increase of 15.63%. The profit before tax was ` 14,415 Million and the profit after tax was ` 11,124 Million for the financial year under review as against ` 12,358 Million and ` 9,709 Million, respectively for the previous financial year.
3. CAPITAL EXPENDITURE
On standalone basis, as at March 31, 2018, the gross fixed and intangible assets stood at ` 6,539 Million (previous year ` 5,889 Million) out of which assets amounting to ` 820 Million (previous year ` 796 Million) were added during the year and the net fixed
and intangible assets stood at ` 2,795 Million (previous year ` 2,871 Million).
On consolidated basis, as at March 31, 2018, the gross fixed and intangible assets stood at ` 14,362 Million (previous year ` 11,407 Million) out of which assets amounting to ` 2,918 Million (previous year ` 976 Million) were added during the year and the net fixed and intangible assets stood at ` 6,875 Million (previous year ` 5,432 Million).
4. MATERIAL CHANGES AND COMMITMENTS AFFECTING THE FINANCIAL POSITION OF THE COMPANY, BETWEEN THE END OF THE FINANCIAL YEAR AND THE DATE OF THIS REPORT
There have been no material changes and commitments affecting the financial position of the Company, between the end of the financial year and the date of this report.
5. SALE OF SHARES BY THE PROMOTER
Pursuant to the SEBI Circular No.SEBI/HO/CFD/CMD/CIR/P/43/2018 dated February 22, 2018, the promoter of the Company, Larsen & Toubro Limited had sold 3,438,678 equity shares of the Company between March 1, 2018 and April 25,

Annual Report 2017-1834
2018. Accordingly, Larsen & Toubro Limited holds 140,311,322 equity shares constituting 81.54% of the paid-up share capital of the Company as on the date of this report.
6. DIVIDEND DISTRIBUTION POLICY AND DIVIDEND
The Directors are pleased to recommend final dividend of ` 13.50 per equity share on the face value of ` 1 each. During the financial year ended March 31, 2018, the Company paid an interim dividend of ` 8.00 per equity share. The total dividend including final dividend would amount to ` 21.50 per equity share.
The final dividend, if approved by the shareholders would be paid/ payable to those shareholders whose names appear in the Register of Members as on the Book Closure Date mentioned in the Notice convening 22nd Annual General Meeting (‘AGM’) of the Company.
The Dividend is based upon the parameters mentioned in the Dividend Distribution Policy approved by the Board of Directors of the Company on May 4, 2017, which is in line with Regulation 43A of the Securities and Exchange Board of India (Listing Obligations and Disclosure Requirements) Regulations, 2015 (‘SEBI Listing Regulations’). The Policy is available on the Company’s website, www.Lntinfotech.com/Investors.
7. MARKETING & COMMUNICATIONS
The Company strengthened its brand awareness and perception globally in FY18. After the brand launch and global rollout, Company strengthened its marketing ecosystem this year with investments in modern marketing technologies and inducting talented marketing leaders from the industry. Company’s participation in major trade shows and conferences like SAP SAPPHIRE, Oracle OpenWorld, Dreamforce and others improved brand visibility with enterprise technology buyers. The Company deepened its engagement with industry influencers and featured in major ratings and rankings for exponential technologies like Digital, Analytics, IoT, Automation and Cloud.
8. HUMAN RESOURCE DEVELOPMENT
The Company believes that the path to enduring ‘people’ success is by building and continually refining the Leadership Growth Engine. The Company’s programs enable the leaders within the organization to constantly learn and upskill themselves. The following programs and interventions support the people guiding initiatives:
Leadership Voyager: Leadership Development is at the heart of people development strategy and specially focuses on strengthening the leadership pipeline. A series of Leadership Development programs was launched in the month of July 2017. This digitally driven programs on ‘Workplace’, Company’s social collaborative platform, was made available to employees of LTI across 16 countries. The program currently runs for first time managers and senior managers under the brand of ‘I LEAD’ and ‘I LEAD Plus’. 1,326 leaders participated in the programs until March 31, 2018.
Diginius Voyager: Keeping in mind the digital transformation in the Company and in the IT industry, a series of soft skills programs were launched in the month of July 2017 using different methodologies. Handpicked programs from top international Universities on MOOC’s and eLearning platforms were made available to the employees in the digital format.
Catalyst: Transforming employee experience and contributing to positive change through collaborative efforts of employees as Change Agents (Catalysts), backed by ‘Workplace’. Here employees can post their queries, ideas and complaints. The Company has an internal mechanism to periodically review catalyst issues from each functional representative and recommend changes, if any. Intime action has led the Company to record 98.50% for query resolution and 83.33% towards idea implementation.
Beliefs Workshop: ‘Beliefs’ is an interactive classroom session with an end goal to propose our five Beliefs - ‘go the Extra mile’, ‘be Agile’, ‘push frontiers of Innovation’, ‘keep Learning’ and ‘solve for Society’, to be at the forefront of every business track and transaction. We present concepts of the Beliefs and how vital it is for each employee to align with them. Success stories, challenges and how to create a conducive environment to augment team work and bring about a ‘cool’ culture are discussed. So far, since October 2017 until March 2018, we have covered around 7000+ employees through face to face workshops both in India and onsite.
9. AWARDS & RECOGNITION
In the Analytics solutions category, the Company was awarded ‘Silver at Express IT Awards’ and also recognized as ‘India Partner of the Year’ at Cloudera’s 2017 APAC Partner Awards. In Analyst and Advisory category, the Company has got the following accolades:
1. In Leadership Zone in Zinnov Zones 2017 for Robotic Automation Services in overall and BFS segment, IoT Technology Services (For System Integration, Managed Services, Big Data Management and Analytics Segments) and Digital Services.
2. As a ‘Leader’ in NelsonHall NEAT 2017 for IoT Services, Digital Testing and as an Innovator for S/4 HANA Focus.
3. As High Performers in HfS Blueprint Report: Enterprise Blockchain Services 2017.
4. Ranked as ‘Leader’ in Property & Casualty and Life & Annuities categories of Novarica Market Navigator™ for IT Services Providers for Insurers 2018 Report.
5. Topped the ‘Challengers’ List in Everest Group’s PEAK MatrixTM Service Provider of the Year 2018 Report.
The Company was also bestowed with Humanitarian Award for the reconstruction of Gandhi Study Centre in Chennai.
01Corporate Overview
17Statutory Reports
72Financial Statements
35
Further, Mr. Sanjay Jalona, Chief Executive Officer & Managing Director of the Company was awarded ‘Exemplary CEO of the Year 2017’ by BW Businessworld and Mr. Ashok Sonthalia, Chief Financial Officer of the Company was awarded ‘CFO of the Year in 2018’ by Financial Express in the large enterprise having INR 1,000 crore plus turnover category.
10. INFRASTRUCTURE
The Company has the world class infrastructure throughout offices in India and abroad and has been expanding its facilities to keep pace with revenue growth. Emphasis has been on adding capacity in SEZ locations for new & incremental businesses. During the financial year, the Company added infrastructure space of 20,000 sq.ft. with 247 seats at SEZ in Bangalore and 10,000 sq.ft. with 90 seats at Chennai.
Additionally, space optimization was carried out through densification thereby increasing the capacity of 355 seats across Powai, Airoli and Pune within the existing infrastructure space.
The Company has also created client collaborative and interactive workspaces like Agile space, Cyber Defense Resiliency Centre, Design Studio making it a new-age workplace.
As on March 31, 2018, the total capacity at Indian centres stands at 21,241 seats over an area of 2,208,196 sq.ft.
11. QUALITY INITIATIVES
The Company continues all-pervasive commitment to Quality with focus on client centricity and continuous improvements. The Company has revamped the Quality Policy to reflect the same. The Quality Policy states:
We strive to be the most client-centric partner by:
• Deliveringrichandmeaningfulexperiencestoourclientsand their customers.
• Continuously improving our services and solutions, withfocus on agility and creativity.
• Nurturing an environment that promotes learning andgrowth.
The Company has aligned and strengthened the management processes with focus on client centricity and delivery excellence. We continue to measure project level and leadership level client satisfaction. Various initiatives implemented during the year have helped to improve client satisfaction levels. Leadership level client experience has also significantly improved for our key accounts.
The Company renewed the focus to deliver value to our clients through initiatives such as Beyond, Extreme Automation and Design Driven Delivery. ‘Beyond’ initiative has brought in focus on innovation to deliver value to our clients. ‘Extreme Automation’ has helped optimize our delivery execution and improve productivity. ‘Design Driven Delivery’ suitably supported by
Agile and DevOps methodologies, helps the Company to design
and deliver client focused services and solutions.
The Company continues to adhere to international certifications
viz. ISO 9001, ISO 20000, ISO 27001, ISO 14001 and ISO 18001
through combined external audit conducted by Bureau Veritas.
The Company continues to sustain CMMI for Development V1.3 at
Level 5 for Development, Maintenance, Testing and ERP projects.
The Company continues to sustain the CMMI for Services V1.3
at Level 5 for Application and Infrastructure Support projects.
The Company has also sustained the compliance to ISAE 3402
requirements for the projects in the Insurance domain across
Business Units and also for client specific engagements in the
Banking domain.
12. TRANSFER TO RESERVES
The Directors do not propose to transfer any amount to reserve.
13. DEPOSITS
During the year ended March 31, 2018, the Company has not
accepted any public deposits and as such, no amount on account
of principal or interest on public deposits was outstanding as on
the date of the Balance Sheet.
14. DIRECTORS’ RESPONSIBILITY STATEMENT
The Board of Directors hereby confirm that:
(i) in the preparation of the annual accounts, the applicable
accounting standards have been followed and there has
been no material departure;
(ii) the Directors have selected such accounting policies
and applied them consistently and made judgments and
estimates that are reasonable and prudent so as to give a
true and fair view of the state of affairs of the Company as
at March 31, 2018 and of the profit of the Company for the
year ended March 31, 2018;
(iii) the Directors have taken proper and sufficient care for
the maintenance of adequate accounting records in
accordance with the provisions of the Companies Act, 2013
(‘Act‘) for safeguarding the assets of the Company and for
preventing and detecting fraud and other irregularities;
(iv) the Directors have prepared the annual accounts on a
going concern basis;
(v) the Directors have laid down an adequate system of
internal financial controls to be followed by the Company
and such internal financial controls are adequate and
operating efficiently; and
(vi) the Directors have devised proper systems to ensure
compliance with the provisions of all applicable laws and
that such systems are adequate and operating effectively.

Annual Report 2017-1836
15. DIRECTORS & KEY MANAGERIAL PERSONNEL
During the year under review, following were the changes in the Board and Key Managerial Personnel:
a. Mr. Sudip Banerjee was appointed as an Independent Director of the Company, for a term of five years upto May 19, 2022, with effect from May 20, 2017 by the shareholders of the Company at its 21st AGM held on August 24, 2017.
b. Ms. Subhalakshmi Panse resigned as an Independent Director of the Company with effect from May 15, 2017.
c. Mr. Manoj Koul was appointed as the Company Secretary and Compliance Officer of the Company with effect from August 24, 2017.
Mr. R. Shankar Raman and Mr. S. N. Subrahmanyan, Non-Executive Directors of the Company, retire by rotation and being eligible, have offered themselves for re-appointment at the ensuing AGM of the Company. The details of Directors proposed to be re-appointed are given in the Notice convening the 22nd AGM.
16. CORPORATE GOVERNANCE REPORT
A report on Corporate Governance is annexed as Annexure A to this Report.
17. NUMBER OF MEETINGS OF THE BOARD OF DIRECTORS
The Board of Directors met 5 (five) times during the financial year. The details of the Board meetings and the attendance of Directors is provided in Annexure A to this Report.
Board meeting dates are finalized in consultation with all Directors and agenda backed up by comprehensive notes and detailed background information are circulated well in advance before the date of Board meeting thereby enabling the Board to take informed decisions. Detailed business presentations are also made to apprise the Board of the important developments.
18. DECLARATION BY INDEPENDENT DIRECTORS
The Company has received Declaration of Independence from its Independent Directors as stipulated under Section 149(7) of the Act confirming that they meet the criteria of Independence. The same is available on the Company’s website, www.Lntinfotech.com/Investors.
19. INDEPENDENT DIRECTORS MEETING
As per Schedule IV of the Act, Secretarial Standards-1 on Board Meetings (‘SS-1’) and SEBI Listing Regulations, the meeting of the Independent Directors in FY18 was held on May 4, 2017. Additionally, the Independent Directors meeting was also held on May 23, 2018.
20. COMPANY POLICY ON DIRECTOR APPOINTMENT AND REMUNERATION
The Nomination and Remuneration Committee has formulated a policy on Director’s appointment and remuneration including recommendation of remuneration of Key Managerial Personnel
and the criteria for determining qualifications, positive attributes and independence of a Director.
21. DISCLOSURE OF REMUNERATION
The details of remuneration as required under Section 197(12) of the Act and Rule 5(1) of the Companies (Appointment & Remuneration of Managerial Personnel) Rules, 2014 as amended from time to time, is provided in Annexure B to this Report.
The details of employees receiving remuneration as mentioned in Rule 5(2) & 5(3) of the Companies (Appointment & Remuneration of Managerial Personnel) Rules, 2014 as amended from time to time, is provided in Annexure I to this Report. In terms of Section 136(1) of the Act and the Rules made thereunder, the Report and Accounts are being sent to the shareholders excluding the aforesaid Annexure. Any shareholder interested in obtaining copy of the same may write to the Company Secretary of the Company. None of the employees listed in the said Annexure is related to any Director of the Company. The aforesaid annexure is also available for inspection by the shareholders at the Registered Office of the Company, on all working days, except Saturdays, Sundays and public holidays, between 11:00 am and 1:00 pm upto the date of the 22nd AGM.
22. PERFORMANCE EVALUATION OF THE BOARD, ITS COMMITTEES AND DIRECTORS
The Nomination and Remuneration Committee and the Board of Directors have laid down the manner in which formal annual evaluation of the performance of the Board, it’s Committees, Chairman and individual Directors has to be made.
During the year under review, a structured questionnaire was circulated to all Directors for evaluation of performance of the Board, its Committes, Chairman and individual Directors. The questionnaire included criteria such as composition & structure, meetings, Board effectiveness, Board functioning, information availability, etc. These questionaries also cover specific criteria and the grounds on which all Directors in their individual capacity have been evaluated.
The inputs given by all the Directors were discussed in the meeting of the Independent Directors held on May 23, 2018, in accordance with Schedule IV of the Act. The performance evaluation of the Board, its Committees, Chairman and Directors was also reviewed by the Nomination and Remuneration Committee and the Board of Directors which showcased the strengths of Board and areas of improvement. Overall the Board expressed its satisfaction on the performance evaluation process as well as performance of all Directors, Committees and Board as a whole.
23. BOARD COMMITTEES
The Board has constituted Audit Committee, Stakeholders’ Relationship Committee, Nomination and Remuneration
Committee, Corporate Social Responsibility (‘CSR’) Committee

01Corporate Overview
17Statutory Reports
72Financial Statements
37
and Risk Management Committee in terms of the requirements
of the Act and SEBI Listing Regulations. The details of each of
the Committees is given in Annexure A to this Report.
24. ANNUAL REPORT ON CSR
The Annual Report on CSR is annexed as Annexure C to this
Report. CSR Policy of the Company is available on the Company’s
website, www.Lntinfotech.com/social-responsibility.
25. BUSINESS RESPONSIBILITY REPORT (‘BRR’)
Pursuant to Regulation 34 of the SEBI Listing Regulations,
Business Responsibility Report for FY18 (‘BRR’) describing
initiatives taken by the Company from an environmental, social
and governance perspective, is provided in Annexure J, forming
part of this Annual Report. As a green initiative, BRR will be
available on the Company’s website, www.Lntinfotech.com/
Investors. Any shareholder interested in obtaining copy of the
same may write to the Company Secretary of the Company.
26. CORPORATE SUSTAINABILITY
The Company believes that a healthy planet is essential for a
Company’s success and therefore, sustainability is an important
element. The Company continues to be resource efficient and
puts efforts towards better environment management.
Company has taken various energy conservation initiatives to
reduce electricity consumption and overall carbon footprint,
on year-on-year basis. The energy conservation initiatives
is given in Annexure G to this report. During the year, the
Company has conducted initiatives like ‘Go Green’ campaign
and ‘PC hibernation’ towards reducing the impact of operational
activities on environment. The Company’s corporate office at
Powai, Mumbai has been accredited ‘LEED Gold certificate’ from
US Green Building Council 2016 and it continues to be green
building-compliant campus. The Company participates and
reports the carbon emissions/energy performances through
the Carbon Disclosure Project (CDP).
Company manages and recycles the paper, plastic and glass
waste efficiently at all three offices in Mumbai. Second round
of surveillance audit of BS OHSAS 18001:2007 certification
for occupational health and safety has been cleared for eight
Company locations during the year. This approach towards
people and planet forms a part of our sustainability framework
and business approach.
27. AUDITORS
STATUTORY AUDITOR
The Auditors’ Report to the shareholders’ on the audited
standalone and consolidated financial statements of the
Company for the year ended March 31, 2018 does not
contain any qualification and therefore does not call for any
comments from Directors. Further, the Statutory Auditors of
the Company have not reported any fraud as specified under
Section 143(12) of the Act. The Independent Auditors Report
forms part of this Annual Report.
The Auditors, M/s. B. K. Khare & Co. [ICAI Registration No.
105102W] were appointed as Statutory Auditors of the Company
by the shareholders at the last AGM held in 2017 for a period
of five continuous years from the conclusion of 21st AGM till the
conclusion of 26th AGM of the Company.
The Auditors have confirmed that they have subjected
themselves to the peer review process of the Institute of
Chartered Accountants of India (‘ICAI’) and hold valid certificate
issued by the Peer Review Board of the ICAI.
The Auditors have also furnished a declaration confirming
their independence as well as their arm’s length relationship
with the Company and declared that they have not taken up any
prohibited non-audit assignments for the Company.
SECRETARIAL AUDITOR
The Secretarial Audit Report issued by Ms. Naina Desai,
Practicing Company Secretary, does not contain any qualification
and is annexed as Annexure D to this Report.
28. CONSOLIDATED FINANCIAL STATEMENTS
The Consolidated Financial Statements pursuant to Section 129(3)
of the Act, prepared in accordance with the Accounting Standards
prescribed by the ICAI, forms part of this Annual Report.
29. ADEQUACY OF INTERNAL FINANCIAL CONTROLS
The Company has designed and implemented a process driven
framework for Internal Financial Controls (‘IFC’) within the
meaning of the explanation to Section 134(5)(e) of the Act. For
the year ended March 31, 2018, the Board is of the opinion that
the Company has sound IFC commensurate with the nature and
size of its business operations and operating effectively and no
material weaknesses exist. Further, the Company has a process
in place to continuously monitor the same and identify gaps, if
any, and implement new and/or improved controls wherever
the effect of such gaps would have a material impact on the
Company’s operations.
30. CHANGES IN SHARE CAPITAL
During FY18, the Company allotted 1,428,150 equity shares of
` 1 each on exercise of the vested options by the eligible employees
under the Employees Stock Options Schemes of the Company.
Accordingly, the paid-up equity share capital of the Company
increased from ` 170.571 Million to ` 171.999 Million.
After March 31, 2018, the Company has further allotted 19,922
equity shares of ` 1 each on April 19, 2018 and 52,219 equity
shares of ` 1 each on May 23, 2018 on exercise of vested options
by the eligible employees under the Employees Stock Options
Schemes of the Company. Consequent to the same, there has

Annual Report 2017-1838
been an increase in the paid-up equity share capital of the
Company to ` 172.071 Million.
31. EXTRACT OF ANNUAL RETURN
The extract of annual return is annexed as Annexure E to this Report.
32. RISK MANAGEMENT
The Company has formulated a Risk Management Policy and has in place a mechanism to inform the Board Members about risk assessment and minimization procedures and a periodical review is carried out to ensure that Executive Management controls risk by means of a properly designed framework. A detailed note on risk management is given in a separate section of this Annual Report.
33. VIGIL MECHANISM
The Whistle Blower Policy of the Company meets the requirement of the Vigil Mechanism framework under the Act. The Whistle Blower Policy encourages and facilitates the employees to report concerns about unethical behavior, actual/ suspected frauds and violation of the Company’s Code of Conduct. The Policy provides for adequate safeguards against victimisation of persons who avail the same and provides for direct access to the Chairperson of the Audit Committee. The Audit Committee of the Company oversees the implementation of the Whistle Blower Policy. Information about the Whistle Blower Policy is available on the Company’s website, www.Lntinfotech.com/Investors.
34. RELATED PARTY TRANSACTIONS
The Audit Committee and the Board of Directors have approved the Policy for Related Party Transactions and the same is available on the Company’s website, www.Lntinfotech.com/Investors.
During the year, all the related party transactions were in the ordinary course of business and at arm’s length and were approved by the Audit Committee. There were no materially significant transactions with related parties during the year that may have conflict of interest with the Company.
35. SUBSIDIARY/ ASSOCIATE/ JOINT VENTURE COMPANIES
As at March 31, 2018, the Company has 14 subsidiaries including one Joint Venture. There has been no material change in the nature of the business of subsidiaries.
During the year, the Company acquired following subsidiary companies:
a. The Company acquired 4,50,000 equity shares of ` 10 each (comprising 100% shareholding) of Syncordis Software Services India Private Limited on December 11, 2017.
b. The Company through its wholly-owned subsidiary, Larsen & Toubro Infotech GmbH, Germany acquired 100% shareholding of Syncordis SA, a Luxembourg based Company, on December 15, 2017.
Update on Amalgamation of AugmentIQ Data Sciences Private Limited (‘AugmentIQ’) with the Company:
Pursuant to the Scheme of Amalgamation (‘Scheme’) of AugmentIQ Data Sciences Private Limited with the Company, sanctioned by the Hon’ble National Company Law Tribunal, Mumbai Bench vide it’s order dated May 2, 2018, AugmentIQ has been amalgamated with the Company with effect from May 21, 2018, with appointed date being April 1, 2017. Consequently, the entire business, assets, liabilities, duties and obligations of AugmentIQ have been transferred to and vested in the Company with effect from April 1, 2017.
A statement containing the salient features of the financial statement of subsidiaries/ associate/ joint venture companies as per form AOC-1 is annexed as Annexure F to this Report.
The Company has formulated a policy on the identification of material subsidiaries in line with Regulation 16(c) of the SEBI Listing Regulations and the same is available on the Company’s website, www.Lntinfotech.com/Investors. There were no material subsidiaries of the Company as on March 31, 2018.
36. PARTICULARS OF LOANS GIVEN, INVESTMENTS MADE, GUARANTEES GIVEN OR SECURITY PROVIDED
Details of loans given, investments made or guarantees given or security provided, if any, covered under the provisions of Section 186 of the Act are given in the notes forming part of the financial statements provided in this Annual Report.
37. CONSERVATION OF ENERGY, TECHNOLOGY ABSORPTION, FOREIGN EXCHANGE EARNINGS AND OUTGO
Information as per section 134 of the Companies Act, 2013 read with Rule 8 of the Companies (Accounts) Rules, 2014 relating to conservation of energy, technology absorption, foreign exchange earnings and outgo is given in Annexure G to this Report.
38. COMPLIANCE WITH SECRETARIAL STANDARDS ON BOARD MEETINGS AND GENERAL MEETINGS
The Company has complied with Secretarial Standards issued by the Institute of Company Secretaries of India on Board Meetings and General Meetings.
39. COMPLIANCE MONITORING SYSTEM
The Company believes that compliance with regulatory laws has become a catalyst for corporate governance and that a good statutory compliance system is vital for effective conduct of business operations. The Company recognizes ethical conduct and compliance with regulatory requirements, in both business and internal dealings, as part of thorough and transparent corporate governance and to strengthen such belief the Company ensures that appropriate business processes and adequate tools are in place for adherence with all the statutory obligations.

01Corporate Overview
17Statutory Reports
72Financial Statements
39
Keeping this in mind, the Company has put in place a framework on ‘Global Corporate Compliance Tracking System’ which outlines the Company’s philosophy towards compliance culture, understanding compliances, coverage, approach, responsibilities, reporting matrix and trainings. The framework focuses on taking up compliance as an integral element for conducting business and create corporate culture characterized with integrity and law-abiding behavior. Under this framework, identified key stakeholders across business units, corporate functions and geography heads, ensure and confirm compliance with the provisions of all applicable laws on a continuous basis and a quarterly certificate is presented to the Board of Directors at its meetings confirming status of compliances along with remediation plan for exceptions, if any. Any amendments to the laws are also reviewed, updated in the system and monitored by the Company.
40. DISCLOSURE UNDER THE SEXUAL HARASSMENT OF WOMEN AT WORKPLACE (PREVENTION, PROHIBITION AND REDRESSAL) ACT, 2013
The Company has in place an Anti-Sexual Harassment Policy in line with the requirements of The Sexual Harassment of Women at Workplace (Prevention, Prohibition & Redressal) Act, 2013. Internal Complaints Committee has been constituted to redress the complaints received regarding sexual harassment. All employees (permanent, contractual, temporary and trainees) are covered under this Policy. During FY18, the Company has received three complaints on sexual harassment, which has been resolved with appropriate action taken by the Internal Complaints Committee.
41. EMPLOYEE STOCK OPTION SCHEMES
There has been no material change in the Employee Stock Option Schemes (‘ESOP Schemes’) during the financial year under review. The Employee Stock Ownership Scheme 2000 and the Employee Stock Ownership Scheme 2006 U.S. Stock Option Sub-Plan are in compliance with the then applicable Act and Regulations, if any. Further, the Employee Stock
Option Scheme 2015 is in compliance with the Act and SEBI
(Share Based Employee Benefits) Regulations, 2014 and the
disclosures relating to the ESOP Schemes of the Company
as required is available on the Company’s website, www.
Lntinfotech.com/Investors.
A Certificate obtained from the Statutory Auditors, confirming
compliance with the Act and SEBI (Share Based Employee
Benefits) Regulations, 2014 is given in Annexure H of
this Report.
42. DETAILS OF SIGNIFICANT AND MATERIAL ORDERS PASSED
BY THE REGULATORS OR COURTS OR TRIBUNALS
During the year under review, there were no material and
significant orders passed by the regulators or courts or
tribunals impacting the going concern status and the Company’s
operations in future.
43. GREEN INITIATIVE
Electronic copy of the Annual Report for FY18 and the Notice
of the ensuing AGM is being sent to all shareholders whose
email addresses are registered with the Company/ Depository
Participant(s). For shareholders who have not registered
their email addresses, physical copies are sent through the
permitted mode.
44. ACKNOWLEDGEMENTS
The Directors thank the Company’s customers, vendors,
banks, financial and academic institutions, employees,
regulatory authorities, stock exchanges & all other
stakeholders for their continued co-operation & support.
The Directors also acknowledge the support and co-
operation from the Government of India and overseas, its
agencies and other regulatory authorities. The Directors
also wish to place on record their appreciation of employees
of the Company and its Group for their commendable
efforts, teamwork and professionalism.
For and on behalf of the Board of Directors
Sanjay Jalona Aftab Zaid UllahChief Executive Officer Chief Operating Officer
Place: Mumbai & Managing Director & Whole-time DirectorDate: May 23, 2018 (DIN: 07256786) (DIN: 05165334)

Annual Report 2017-1840
Annexure A
CORPORATE GOVERNANCE REPORT1. COMPANY’S PHILOSOPHY ON CORPORATE GOVERNANCE
The Company emanates its values from the rich legacy of fair and transparent governance and disclosure practices followed by L&T group. In line with the group’s philosophy, the Company constantly endeavors to benchmark itself with the best practices in the IT industry. The Company’s five beliefs ‘go the Extra mile’, ‘be Agile’, ‘push frontiers of Innovation’, ‘keep Learning’ and ‘solve for Society’ articulates the Company’s business philosophy. The Company is committed towards maximizing shareholder value, ensuring fairness and building trust with shareholders, employees, customers, service providers and other stakeholders.
2. BOARD OF DIRECTORS
The Company’s policy is to have an appropriate mix of Executive, Non-Executive and Independent Directors on the Board. As on March 31, 2018, the Board of Directors of the Company consists of twelve Directors comprising of three Executive Directors, three Non-Executive Directors and six Independent Directors including one woman Director. Mr. A.M Naik is the Non-Executive Chairman of the Company and Mr. S. N. Subrahmanyan is the Non-Executive Vice Chairman of the Company. Mr. Sanjay Jalona is the Chief Executive Officer & Managing Director of the Company.
The composition of the Board, as on March 31, 2018, is in conformity with the provisions of the Companies Act, 2013 (‘Act‘) and Regulation 17 of the Securities and Exchange Board of India (Listing Obligations and Disclosure Requirements) Regulations, 2015 (‘SEBI Listing Regulations’). None of the Directors of the Company are inter-se related to each other.
Board Meetings are convened at appropriate intervals with a maximum time gap not exceeding more than 120 days between two consecutive meetings by giving advance notice alongwith agenda papers to the Directors. In case of exigencies or urgency of matters, resolutions are passed by circulation, for such matters as permitted by law and noted at the subsequent meeting. During the year ended March 31, 2018, five Board Meetings were held on May 4, 2017, July 24, 2017, August 24, 2017, November 6, 2017 and January 24, 2018.
As a green initiative, the Agenda of the Board and Committee meetings are circulated to the Directors through a secured web-based application, which is accessed through IPADs. The Minutes of the Board Meetings are circulated amongst the Board Members for their perusal. Comments, if any, received from the Directors are incorporated in the minutes, in consultation with the Chairman. Thereafter, the Minutes of the Board Meeting are signed by the Chairman of the Board at the next meeting.
The composition of the Board of Directors, their attendance at the Board Meetings and last Annual General Meeting (‘AGM‘) held during Financial Year 2017-18 (‘FY18’), number of other Directorships, Memberships/Chairpersonships held by them as on March 31, 2018, are as follows:
Name of Director Category Meetings held during the
year vis-à-vis Directors
Tenure
Attendance at Board Meetings
Attendance at Last AGM
Directorships in other
Companies4
No. of Committee
Membership5
No. of Committee Chairpersonship5
Mr. A. M. Naik Non-Executive Chairman 5 5 Y 4 0 0
Mr. S. N. Subrahmanyan1 Non-Executive Vice Chairman 5 4 N 3 2 0
Mr. R. Shankar Raman Non-Executive Director 5 4 Y 8 4 0
Mr. Sanjay Jalona Chief Executive Officer & Managing Director
5 5 Y 0 1 0
Mr. Aftab Zaid Ullah Whole-time Director & Chief Operating Officer
5 5 Y 0 1 0
Mr. Sudhir Chaturvedi Whole-time Director & President-Sales
5 5 Y 0 0 0
Mr. Samir Desai Independent Director 5 5 Y 1 2 0
Mr. M. M. Chitale Independent Director 5 4 Y 7 7 4
Ms. Vedika Bhandarkar Independent Director 5 4 Y 6 10 4
Mr. Arjun Gupta Independent Director 5 4 N 1 0 0
Mr. Sudip Banerjee2 Independent Director 4 4 Y 3 2 0
Mr. Sanjeev Aga Independent Director 5 4 Y 6 5 2
Ms. Shubhalakshmi Panse3 Independent Director 1 1 NA NA NA NA

01Corporate Overview
17Statutory Reports
72Financial Statements
41
Notes: 1. Mr. S. N. Subrahmanyan was appointed as the Non-Executive Vice Chairman of the Company w.e.f. May 4, 2017.
2. Mr. Sudip Banerjee was appointed as an Independent Director of the Company w.e.f. May 20, 2017.
3. Ms. Shubhalakshmi Panse, Independent Director on the Board of Directors of the Company resigned w.e.f. May 15, 2017.
4. Includes directorships of all public companies whether listed or not and excludes private limited companies, foreign companies and Section 8 companies.
5. Includes memberships/chairpersonships of Audit Committee and Stakeholders’ Relationship Committee as per Regulation 26 of SEBI Listing Regulations, including memberships/chairpersonships in the Company. Number of Committee membership includes Committee chairpersonships.
Details of equity shares held by the Directors of the Company is provided in Annexure E to Directors’ Report, of this Annual Report. The Company has not issued any convertible instruments.
3. BOARD COMMITTEES
As on March 31, 2018, the Board has six Committees: (a) Audit Committee (b) Nomination and Remuneration Committee (c) Corporate Social Responsibility Committee (d) Stakeholders’ Relationship Committee (e) Strategic Investment Committee and (f) Risk Management Committee.
During the year under review, Initial Public Offering (IPO) Committee constituted by the Board for approving and deciding upon all activities in connection with the IPO of the Company, was dissolved with effect from July 24, 2017.
The composition of the Committees, the number of meetings held during FY18 and attendance therein along with the terms of reference are provided below:
A. AUDIT COMMITTEE
Composition
The Audit Committee meets the criteria laid down under Section 177 of the Act and Regulation 18 of the SEBI Listing Regulations. As on March 31, 2018, Audit Committee comprises of three Independent Directors and one Non-Executive Director, as under:
1. Mr. M. M. Chitale, Independent Director
2. Mr. S. N. Subrahmanyan, Non-Executive Director
3. Mr. Samir Desai, Independent Director
4. Ms. Vedika Bhandarkar, Independent Director
Meetings
During the year under review, four meetings with a gap exceeding not more than 120 days between two consecutive Audit Committee Meetings were held on May 3, 2017, July 24, 2017, November 6, 2017 and January 24, 2018. The attendance of the Committee members at the Audit Committee Meetings were as follows:
Name of Director Position in the Committee No. of Meetings held during the year
No. of Meetings Attended
Mr. M. M. Chitale Chairman 4 4Mr. S. N. Subrahmanyan Member 4 3Mr. Samir Desai Member 4 4Ms. Vedika Bhandarkar Member 4 3
Terms of reference
Pursuant to Regulation 34(3) read with Schedule V of the SEBI Listing Regulations, brief description of terms of reference of the Audit Committee, includes the following:
• OversightoftheCompany’sfinancialreportingprocessandthedisclosureofitsfinancialinformationtoensurethatthefinancialstatement is correct, sufficient and credible;
• Recommendationforappointment,remunerationandtermsofappointmentofauditorsofthecompanyandreviewandmonitorthe auditor’s independence and performance, and effectiveness of audit process;
• Reviewing,withthemanagement,thequarterlyfinancialstatementsbeforesubmissiontotheBoardforapproval;
• ApprovaloranysubsequentmodificationoftransactionsoftheCompanywithrelatedparties;

Annual Report 2017-1842
• Evaluationofinternalfinancialcontrolsandriskmanagementsystems;
• Reviewing,withthemanagement,performanceofstatutoryandinternalauditors,adequacyoftheinternalcontrolsystems;
• ReviewingfunctioningoftheWhistleBlowerMechanism.
B. NOMINATION AND REMUNERATION COMMITTEE
Composition
The Nomination and Remuneration Committee meets the criteria laid down under Section 178 of the Act and Regulation 19 of the SEBI Listing Regulations. As on March 31, 2018, Nomination and Remuneration Committee comprises of two Independent Directors and two Non-Executive Directors, as under:
1. Mr. Samir Desai, Independent Director
2. Mr. A. M. Naik, Non-Executive Director
3. Mr. S. N. Subrahmanyan, Non-Executive Director
4. Mr. Arjun Gupta, Independent Director
Meetings
During the year under review, four meetings of Nomination and Remuneration Committee were held on May 4, 2017, July 24, 2017, August 24, 2017 and November 6, 2017. The attendance of the Committee members at the Nomination and Remuneration Committee Meetings were as follows:
Name of Director Position in the Committee No. of Meetings held during the year vis-à-vis Members Tenure
No. of Meetings Attended
Mr. Samir Desai Chairman 4 4Mr. A. M. Naik Member 4 4Mr. S. N. Subrahmanyan Member 4 3Mr. Arjun Gupta1 Member 3 1Mr. M.M. Chitale1 Member 1 1
Note: (1) Mr. Arjun Gupta was appointed as a member of the Committee w.e.f. May 4, 2017 in place of Mr. M.M. Chitale who ceased to be member of the
Committee w.e.f. May 4, 2017.
Terms of Reference
Pursuant to Regulation 34(3) read with Schedule V of the SEBI Listing Regulations, brief description of terms of reference of Nomination and Remuneration Committee includes the following:
• Toidentify,review,assessandrecommendtotheBoardtheappointmentofExecutiveandNon-ExecutiveDirectors&SeniorManagement personnel;
• Formulationofthecriteriafordeterminingqualifications,positiveattributesandindependenceofaDirectorandrecommendtothe Board a policy, relating to the remuneration of the Directors, Key Managerial Personnel and other employees;
• FormulationofcriteriaforevaluationofIndependentDirectorsandtheBoardofDirectors;
• ToconsiderandapproveEmployeeStockOptionSchemesandtoadministerandsupervisethesame;
• DevisingapolicyondiversityofBoardofDirectors.
Board Membership Criteria
The Nomination and Remuneration Committee identifies and recommends to the Board of Directors of the Company suitable candidates for Board Membership, based on the attributes/criteria such as qualification, expertise, past-performance and experience. Besides the attributes/criteria, Nomination and Remuneration Committee also considers attendance, participation and contribution of a Director during the Board/Committee Meetings while recommending re-appointment of the Directors.
The Nomination and Remuneration Committee ensures that the Board of Directors of the Company has an optimum composition of Directors with a mix of experts, balance of skills and experience alongwith diversity of thought, knowledge and perspective and gender which will help the Company in attainment of its objectives.

01Corporate Overview
17Statutory Reports
72Financial Statements
43
The Nomination and Remuneration Committee ensures that the Directors appointed or re-appointed for the position of Independent Director meet the criteria of independence as prescribed under the Act and SEBI Listing Regulations.
Performance Evaluation Criteria for Independent Directors (IDs)
In terms of the requirements of the Act and SEBI Listing Regulations, an annual performance evaluation of the Board, its Committees, Chairman and individual Directors was conducted during the year under review. Details of methodology adopted for Board evaluation have been provided in the Directors’ Report section, of this Annual Report.
Remuneration of Directors
The Nomination and Remuneration Committee recommends to the Board of Directors of the Company, remuneration to be paid to Directors, considering the Company’s size, global presence, economic and financial position, Directors’ participation in Board and Committee Meetings and after benchmarking with peer companies.
The Company pays sitting fees of ` 50,000/- for attendance at each Board Meeting and ` 25,000/- for each Committee Meetings. The remuneration paid to Whole-time Directors includes base salary, stock options and variable compensation which is based on variable compensation plan as per the Company’s policy and achievement of the milestones/goals laid out in the said policy.
In accordance with the approval of the shareholders of the Company granted at its 20th AGM held on May 31, 2016, the eligible Non-Executive Directors are paid commission upto a maximum of 1% of the net profits of the Company for each financial year. The criteria for making payment to Non-Executive Directors includes attendance at Board/Committee meetings, Chairmanship of Committees, active participation and inputs on strategic matters.
As required by the provisions of Regulation 46 of the SEBI Listing Regulations, the criteria for payment to Independent Directors/Non-Independent Directors is made available on the Company’s website, www.Lntinfotech.com/Investors.
Details of remuneration paid/payable to Directors for the year ended March 31, 2018 is provided in Annexure E to Directors’ Report, of this Annual Report.
During the year under review, there was no pecuniary relationship or transactions between the Company and any of its Non-Executive/ Independent Directors apart from payment towards commission, sitting fees & reimbursement of expenses.
C. CORPORATE SOCIAL RESPONSIBLITY COMMITTEE
Composition
As on March 31, 2018, Corporate Social Responsibility (‘CSR’) Committee comprises of one Independent Director and two Executive Directors, as under:
1. Mr. Sanjay Jalona, Chief Executive Officer & Managing Director
2. Mr. Arjun Gupta, Independent Director
3. Mr. Aftab Zaid Ullah, Whole-time Director
Meetings
During the year under review, two meetings of CSR Committee were held on May 4, 2017 and November 6, 2017. The attendance of the Committee members at the CSR Meetings were as follows:
Name of Director Position in the Committee No. of Meetings held during the year vis-à-vis Members Tenure
No. of Meetings Attended
Mr. Sanjay Jalona1 Chairman 2 2Mr. S. N. Subrahmanyan1 Member 1 1Mr. Aftab Zaid Ullah2 Member 1 1Mr. Arjun Gupta Member 2 2
Notes: (1) Mr. Sanjay Jalona was appointed as the Chairman of CSR Committee w.e.f. May 4, 2017 in place of Mr. S. N. Subrahmanyan, who ceased to be
Chairman and member of the CSR Committee w.e.f. May 4, 2017.
(2) Mr. Aftab Zaid Ullah was appointed as member of the CSR Committee w.e.f. May 4, 2017.

Annual Report 2017-1844
Terms of Reference
Pursuant to Regulation 34(3) read with Schedule V of the SEBI Listing Regulations, brief description of terms of reference of CSR Committee includes the following:
• To formulateandrecommendtotheBoard,aPolicywhichshall indicatetheactivitiestobeundertakenbytheCompanyasspecified in Schedule VII of the Act, including any amendments thereto;
• Torecommendtheamountofexpendituretobeincurredontheactivitiesreferredtoinclauseabove;
• TomonitorCSRpolicyoftheCompanyincludinginstitutingatransparentmonitoringmechanismforimplementationofCSRprojects or programs or activities undertaken by the Company.
D. STAKEHOLDERS’ RELATIONSHIP COMMITTEE
Composition
As on March 31, 2018, Stakeholders’ Relationship Committee comprises of one Independent Director and two Executive Directors, as under:
1. Ms. Vedika Bhandarkar, Independent Director
2. Mr. Sanjay Jalona, Chief Executive Officer & Managing Director
3. Mr. Aftab Zaid Ullah, Whole-time Director
Meetings
During the year under review, one meeting of Stakeholders’ Relationship Committee meeting was held on May 4, 2017. The attendance of the Committee members at the Stakeholders’ Relationship Committee Meeting was as follows:
Name of Director Position in the Committee No. of Meetings held during the year
No. of Meetings Attended
Ms. Vedika Bhandarkar1 Chairperson 1 1Mr. S. N. Subrahmanyan1 Member 1 1Mr. Sanjay Jalona Member 1 1Mr. Aftab Zaid Ullah2 Member NA NA
Notes: 1. Ms. Vedika Bhandarkar was appointed as Chairperson in place of Mr. S.N. Subrahmanyan who ceased to be Chairman and Member of Stakeholders’
Relationship Committee w.e.f May 4, 2017.
2. Mr. Aftab Zaid Ullah was appointed as member of Stakeholders’ Relationship Committee w.e.f May 4, 2017.
Terms of reference
Pursuant to Regulation 34(3) read with Schedule V of the SEBI Listing Regulations, brief description of terms of reference of Stakeholders’ Relationship Committee includes the following:
• Toredressgrievancesofshareholders,debentureholdersandothersecurityholders;
• Investigatingcomplaintsrelatingtoallotmentofshares,approvaloftransferortransmissionofshares,debenturesoranyothersecurities;
• Issueofduplicatecertificatesandnewcertificatesonsplit/consolidation/renewal;
• Toconsiderandresolvegrievancesrelatedtonon-receiptofdeclareddividends,annualreportoftheCompanyoranyotherdocuments or information to be sent by the Company to its shareholders.
Number of Complaints
During the year under review, the Company or its Registrar and Share Transfer Agent received the following complaints from SEBI/Stock Exchanges/ Depositories which were resolved within the time frames laid down by SEBI:
Particulars Opening Balance Received Resolved PendingSEBI/Stock Exchanges/ Depositories 0 4 4 0

01Corporate Overview
17Statutory Reports
72Financial Statements
45
E. STRATEGIC INVESTMENT COMMITTEE
Composition
As on March 31, 2018, Strategic Investment Committee comprises of three Non-Executive Directors and one Executive Director, as under:
1. Mr. A.M. Naik, Non-Executive Director
2. Mr. S. N. Subrahmanyan, Non-Executive Director
3. Mr. R. Shankar Raman, Non-Executive Director
4. Mr. Sanjay Jalona, Chief Executive Officer & Managing Director
Meetings
During the year under review, two Strategic Investment Committee meetings were held on September 28, 2017 and November 14, 2017. The attendance of the Committee members at the Strategic Investment Committee Meetings were as follows:
Name of Director Position in the Committee No. of Meetings held during the year
No. of Meetings Attended
Mr. A.M. Naik Chairman 2 2Mr. S. N. Subrahmanyan Member 2 2Mr. R. Shankar Raman Member 2 2Mr. Sanjay Jalona Member 2 1
Terms of reference
Pursuant to Regulation 34(3) read with Schedule V of the SEBI Listing Regulations, brief description of terms of reference of Strategic Investment Committee includes the following:
• Identification,duediligence,reviewingandapprovingproposalsforacquisitionsandinvestmentsintermsofbroadbusinessobjectives within the limits and parameters in principally approved by the Board;
• Consideration,reviewandapprovalofinvestmentproposalsinsubsidiarieswithinthelimitsdelegatedbytheBoardofDirectors;
• Periodicallyreviewingthestatusof theacquisitionand investments in termsofbusinessobjectives,statusof integrationofacquired companies & financial returns and other key strategic activities.
F. RISK MANAGEMENT COMMITTEE
Composition
As on March 31, 2018, Risk Management Committee comprises of Non-Executive Director, Chief Executive Officer & Managing Director, Whole-time Director and Chief Financial Officer, as under:
1. Mr. S. N. Subrahmanyan, Non-Executive Director
2. Mr. Sanjay Jalona, Chief Executive Officer & Managing Director
3. Mr. Aftab Zaid Ullah, Whole-time Director
4. Mr. Ashok Kumar Sonthalia, Chief Financial Officer
Meetings
During the year under review, one meeting of Risk Management Committee meeting was held on November 6, 2017. The attendance of the Committee members at the Risk Management Committee Meeting was as follows:
Name of Director Position in the Committee No. of Meetings held during the year
No. of Meetings Attended
Mr. S. N. Subrahmanyan Chairman 1 1Mr. Sanjay Jalona Member 1 1Mr. Aftab Zaid Ullah1 Member 1 1Mr. Ashok Kumar Sonthalia Member 1 1
Note: 1. Mr. Aftab Zaid Ullah was appointed as member of the Risk Management Committee w.e.f May 4, 2017
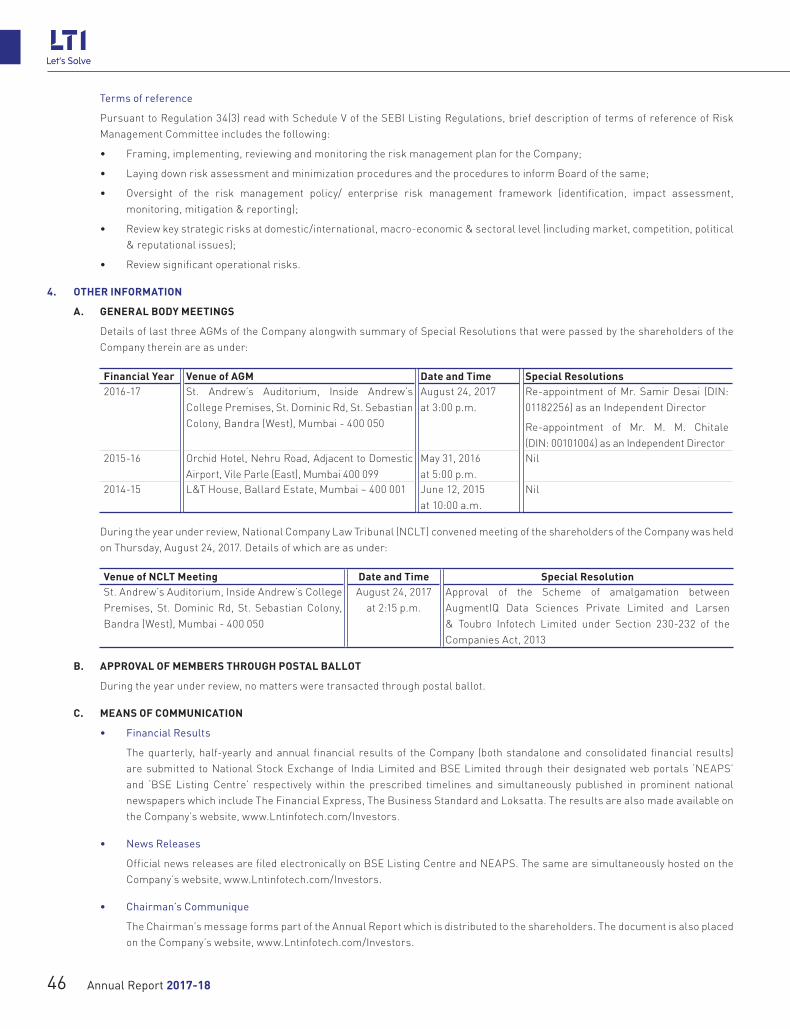
Annual Report 2017-1846
Terms of reference
Pursuant to Regulation 34(3) read with Schedule V of the SEBI Listing Regulations, brief description of terms of reference of Risk Management Committee includes the following:
• Framing,implementing,reviewingandmonitoringtheriskmanagementplanfortheCompany;
• LayingdownriskassessmentandminimizationproceduresandtheprocedurestoinformBoardofthesame;
• Oversight of the risk management policy/ enterprise risk management framework (identification, impact assessment,monitoring, mitigation & reporting);
• Reviewkeystrategicrisksatdomestic/international,macro-economic§orallevel(includingmarket,competition,political& reputational issues);
• Reviewsignificantoperationalrisks.
4. OTHER INFORMATION
A. GENERAL BODY MEETINGS
Details of last three AGMs of the Company alongwith summary of Special Resolutions that were passed by the shareholders of the Company therein are as under:
Financial Year Venue of AGM Date and Time Special Resolutions2016-17 St. Andrew’s Auditorium, Inside Andrew’s
College Premises, St. Dominic Rd, St. Sebastian Colony, Bandra (West), Mumbai - 400 050
August 24, 2017at 3:00 p.m.
Re-appointment of Mr. Samir Desai (DIN: 01182256) as an Independent Director
Re-appointment of Mr. M. M. Chitale (DIN: 00101004) as an Independent Director
2015-16 Orchid Hotel, Nehru Road, Adjacent to Domestic Airport, Vile Parle (East), Mumbai 400 099
May 31, 2016 at 5:00 p.m.
Nil
2014-15 L&T House, Ballard Estate, Mumbai – 400 001 June 12, 2015 at 10:00 a.m.
Nil
During the year under review, National Company Law Tribunal (NCLT) convened meeting of the shareholders of the Company was held on Thursday, August 24, 2017. Details of which are as under:
Venue of NCLT Meeting Date and Time Special ResolutionSt. Andrew’s Auditorium, Inside Andrew’s College Premises, St. Dominic Rd, St. Sebastian Colony, Bandra (West), Mumbai - 400 050
August 24, 2017at 2:15 p.m.
Approval of the Scheme of amalgamation between AugmentIQ Data Sciences Private Limited and Larsen & Toubro Infotech Limited under Section 230-232 of the Companies Act, 2013
B. APPROVAL OF MEMBERS THROUGH POSTAL BALLOT
During the year under review, no matters were transacted through postal ballot.
C. MEANS OF COMMUNICATION
• FinancialResults
The quarterly, half-yearly and annual financial results of the Company (both standalone and consolidated financial results) are submitted to National Stock Exchange of India Limited and BSE Limited through their designated web portals ‘NEAPS’ and ‘BSE Listing Centre’ respectively within the prescribed timelines and simultaneously published in prominent national newspapers which include The Financial Express, The Business Standard and Loksatta. The results are also made available on the Company’s website, www.Lntinfotech.com/Investors.
• NewsReleases
Official news releases are filed electronically on BSE Listing Centre and NEAPS. The same are simultaneously hosted on the Company’s website, www.Lntinfotech.com/Investors.
• Chairman’sCommunique
The Chairman’s message forms part of the Annual Report which is distributed to the shareholders. The document is also placed on the Company’s website, www.Lntinfotech.com/Investors.

01Corporate Overview
17Statutory Reports
72Financial Statements
47
• Website
The Company’s website contains a separate dedicated section ‘Investors’ where shareholder related information is available. Besides mandatory documents required to be uploaded on the Company’s website under SEBI Listing Regulations, Annual Report of the Company, details of earnings call, presentations, press releases, quarterly reports of the Company are also available on the Company’s website, www.Lntinfotech.com/Investors.
• AnnualReport
Annual Report containing audited standalone and consolidated financial statements together with Board’s Report, Auditors Report and other important information are circulated to Members entitled thereto and is made available on the Company’s website, www.Lntinfotech.com/Investors.
• PresentationmadetoInstitutionalInvestorsandAnalysts
The schedule of analyst/ institutional investors meetings and presentations made therein are available on the Company’s website, www.Lntinfotech.com/Investors. The same is also filed with the National Stock Exchange of India Limited and BSE Limited where the shares of the Company are listed.
• DesignatedemailID
The Company has designated the following email ID exclusively for investor servicing:
For queries on Annual Report & in respect of shares in physical mode: [email protected].
5. GENERAL SHAREHOLDERS’ INFORMATION
A. ANNUAL GENERAL MEETING
Date Time VenueWednesday, August 22, 2018 3:30 p.m. Yashwantrao Chavan Pratishhtan Auditorium, General Jagannath Bhosale
Marg, Next to Sachivalaya Gymkhana, Nariman Point, Mumbai – 400 021.
B. FINANCIAL YEAR AND TENTATIVE CALENDAR OF THE COMPANY FOR FY19
The Company follows April to March as the financial year.
Tentative calendar of Board meetings for consideration of financial results of the Company for financial year ending March 31, 2019 is as under:
First Quarter Results On/before August 14, 2018Second Quarter Results On/before November 15, 2018Third Quarter Results On/before February 15, 2019Last Quarter Results and Annual Audited Results On/before May 30, 2019
C. DATE OF BOOK CLOSURE AND DIVIDEND PAYMENT DATE
The Register of Members and Share Transfer Books of the Company will remain closed from Saturday, August 18, 2018 to Wednesday, August 22, 2018 (both days inclusive). The Board of Directors of the Company have recommended final dividend of ` 13.50 per share. The Dividend would be paid/dispatched within 30 days from the date of the AGM, if declared by the shareholders.
D. LISTING OF EQUITY SHARES ON STOCK EXCHANGES
The equity shares of the Company have been listed on the following Stock Exchanges:
Name of Stock Exchanges Address of Stock Exchanges Stock Code/ SymbolNational Stock Exchange of India Limited
Exchange Plaza, C-1, Block G, Bandra Kurla Complex, Bandra (E), Mumbai – 400 051.
LTI
BSE Limited Phiroze Jeejeebhoy Towers, Dalal Street, Mumbai- 400 001 540005ISIN INE214T01019
The Company has paid listing fees for the financial year 2018-2019 to the above Stock Exchanges.

Annual Report 2017-1848
E. STOCK MARKET DATA FOR THE YEAR 2017-2018
The monthly high and low share price and volume of equity shares of the Company traded at BSE Limited (BSE) and the National Stock Exchange of India Limited (NSE) during each month of FY18 are as under:
Month BSE NSE High (`) Low (`) Total number of
equity shares traded
High (`) Low (`) Total number of equity shares
tradedApril 2017 728.90 695.95 140760 729.00 693.90 936465May 2017 806.50 705.00 333615 808.65 705.00 2012206June 2017 840.00 761.10 147499 842.00 777.10 1076993July 2017 814.20 745.40 141342 804.75 750.00 870980August 2017 780.90 724.75 100063 800.00 724.55 487724September 2017 804.00 745.00 124364 807.50 744.10 1064011October 2017 838.80 779.05 145063 839.00 787.50 722784November 2017 1021.65 802.00 902754 1024.95 808.85 3142014December 2017 1120.95 961.00 243647 1126.20 958.75 1348608January 2018 1407.60 1078.00 777725 1407.00 1075.05 3129391February 2018 1543.00 1165.00 757562 1548.80 1155.00 4368876March 2018 1480.85 1270.00 459869 1479.20 1271.50 3904390
PerformanceoftheSharepriceoftheCompanywiththeNifty50andtheBSESensex.
160012000
10000
8000
6000
4000
2000
Apr
-17
May
-17
Jun-
17
Jul-
17
Aug
-17
Sep
-17
Oct
-17
Nov
-17
Dec
-17
Jan-
18
Feb-
18
Mar
-18
1400
1200
1000
800
400
600
00
200
Nifty Closing Price LTI Closing Price
160040000
35000
30000
25000
15000
10000
20000
5000
Apr
-17
May
-17
Jun-
17
Jul-
17
Aug
-17
Sep
-17
Oct
-17
Nov
-17
Dec
-17
Jan-
18
Feb-
18
Mar
-18
1400
1200
1000
800
400
600
00
200
Sensex Closing Price LTI Closing Price
Stock Price Performance
F. DISTRIBUTION OF SHAREHOLDING AS ON MARCH 31, 2018
Share Range Shareholders SharesNumber % Number %
Upto 500 110897 98.66 3260333 1.90501-1000 517 0.46 408892 0.241001-2000 296 0.26 441773 0.262001-3000 111 0.10 277876 0.163001-4000 76 0.07 268552 0.164001-5000 58 0.05 269260 0.165001-10000 137 0.12 1004023 0.5810001 & Above 313 0.28 166068554 96.55Total 112405 100.00 171999263 100.00

01Corporate Overview
17Statutory Reports
72Financial Statements
49
G. CATEGORIES OF SHAREHOLDERS AS ON MARCH 31, 2018
SR. NO. Category No. of shares %1. Corporate Bodies (Promoter Co) 142693637 82.962 Public 8787141 5.113 Mutual Funds 2905715 1.694 Alternate Investment Funds 139658 0.085 Foreign Portfolio Investors (Corporate) 11898723 6.926 Financial Institutions 12197 0.017 Insurance Companies 701434 0.418 Foreign Institutional Investor 4516 0.009 Foreign Nationals 217176 0.1310 Non Resident Indians 1367196 0.7911 Non Resident (Non Repatriable) 416508 0.2412 Nationalised Banks 5 0.0013 Non Nationalised Banks 11240 0.0114 Other Bodies Corporate 690447 0.4015 Hindu Undivided Family 192041 0.1116 Directors 1716863 1.0017 Clearing Members 244746 0.1418 Trusts 20 0.00
TOTAL 171999263 100.00
H. DEMATERIALIZATION OF SHARES & LIQUIDITY
The Company has dematerialized its equity shares with National Securities Depository Limited (NSDL) and Central Depository Services (India) Limited (CDSL). ISIN allotted to the Company is INE214T01019.
As on March 31, 2018, 99.63% of the Company’s total paid-up capital was held in the dematerialized form with NSDL and CDSL. The number of shares held in dematerialized and physical mode is as under:
Particulars Number of shares % of Total Capital issuedHeld in Dematerialized form in NSDL 16,90,57,729 98.29Held in Dematerialized form in CDSL 23,04,867 1.34Physical 6,36,667 0.37TOTAL 17,19,99,263 100.00
Members are requested to convert their physical holdings into electronic holdings which will negate risks associated with physical certificates.
Members holding shares in dematerialized form are requested to intimate all changes viz. pertaining to change of address, change in e-mail ID, bank details etc. to their Depository Participant(s) while members holding shares in physical form are requested to intimate such changes to Link Intime India Private Limited, Company’s Registrar and Share Transfer Agent.
I. OUTSTANDING GDRS/ ADRS/ WARRANTS OR ANY CONVERTIBLE INSTRUMENTS, CONVERSION DATE AND LIKELY IMPACT ON EQUITY
There are no outstanding GDRs/ ADRs/ Warrants/ Convertible Instruments of the Company and hence, the same is not applicable to the Company.
J. SHARE TRANSFER SYSTEM
Transfer of shares in electronic form are processed and approved in the electronic form by NSDL / CDSL without the involvement of the Company, while Members holding shares in physical form need to send their request to the Company’s Registrar and Share Transfer Agent. Shares sent for transfer in physical form are normally processed within a period of fifteen days from the date of receipt of the documents, provided the documents are valid and complete in all respects.
The Board has constituted a Share Transfer Committee comprising of Chief Executive Officer & Managing Director, the Chief Financial Officer and the Company Secretary to approve transfers, transmissions or transposition of securities of the Company.

Annual Report 2017-1850
K. ADDRESS FOR CORRESPONDENCE
Registrar and Share Transfer Agent Compliance OfficerLink Intime India Private LimitedC-101, 247 Park, L.B.S. Marg, Vikhroli (West), Mumbai 400 083, Maharashtra, IndiaTel: +91 022 4918 6000Fax: +91 022 4918 6060E-mail: [email protected] : www.Linkintime.co.in
Manoj Koul, Company Secretary & Compliance OfficerLarsen & Toubro Infotech LimitedTechnology Tower 1, Gate No.5, Saki Vihar Road, Powai, Mumbai 400 072, Maharashtra, IndiaTel: +91 22 6776 6776Fax: +91 22 6776 6004E-mail: [email protected]
6. FAMILIARISATION PROGRAMME FOR INDEPENDENT DIRECTORS
The Independent Directors are provided insights of the Company at the time of induction to enable them to understand the operations of the Company and its subsidiaries, business, industry and environment in which the Company functions. The Company also updates the Directors on continuing basis on any significant changes/developments in the Company. Additionally, the Directors are updated during the Board meetings on the business strategies, changes in domestic/overseas legislations impacting the Company and the IT Industry overall.
During the year under review, a visit to Company’s Mosaic Experience Centre, in Powai was conducted for the Directors, where they were familiarized with the latest technologies in the areas of Customer Experience, Advance Analytics, Artificial Intelligence, Cognitive Automation and multiple use cases like Customer Insight 360 on MOSAIC platform, AI based entity extraction in Trade Finance, DICE, IoT Analytics for elevator were demonstrated.
The information is also available on the Company’s website, www.Lntinfotech.com/Investors.
7. PREVENTION OF INSIDER TRADING
The Company has adopted the Securities Dealing Code (‘the Code’) in compliance with the SEBI (Prohibition of Insider Trading) Regulations, 2015 to regulate, monitor and report trading by its Designated Person(s)/ Employee(s) and other connected person(s).
The Code includes practices and procedures for fair disclosure of unpublished price sensitive information and prevention of dealing in the shares of the Company by an Insider while in possession of unpublished price sensitive information.
The Code is applicable to all Directors, employees, their immediate relatives and connected persons who are prevented from dealing in Company’s shares during Trading Window closure. Prior approval of Compliance Officer is sought to deal in the Company’s shares beyond threshold limit prescribed under the Code.
Further, to strengthen the monitoring process, the Company has in place the ‘Penalty Framework’ and the ‘Internal Guidelines on Special Closed Period’, under the Code.
Mr. Manoj Koul, Company Secretary is designated as the Compliance Officer while Mr. Ashok Kumar Sonthalia, Chief Financial Officer of the Company is appointed as the Chief Investor Relation Officer, under the Code.
The Company’s Code of practices and procedures for fair disclosure of unpublished price sensitive information is available on the Company’s website, www.Lntinfotech.com/Investors.
8. PLANT LOCATIONS
The Company being in IT industry does not require manufacturing plants and has development centers/offices in India and overseas. The addresses of overseas development centers /offices of the Company are available on the Company’s website under Global Footprint section, www.Lntinfotech.com/global-footprints.
9. DISCLOSURES
A. DISCLOSURE OF MATERIALLY SIGNIFICANT RELATED PARTY TRANSACTIONS & POLICY ON DEALING WITH RELATED PARTY TRANSACTIONS
During the year under review, there were no material significant related party transactions which have been entered into by the Company with its related parties having potential conflict of interests with the Company at large. The Board has approved a Policy for Related Party Transactions which is available on the Company’s website, www.Lntinfotech.com/Investors.

01Corporate Overview
17Statutory Reports
72Financial Statements
51
B. DETAILS OF NON-COMPLIANCE BY THE COMPANY, PENALTIES, AND STRICTURES IMPOSED ON THE COMPANY BY STOCK EXCHANGES OR SEBI OR ANY STATUTORY AUTHORITY, ON ANY MATTER RELATED TO CAPITAL MARKETS, DURING THE LAST THREE YEARS
There have been no instances of non-compliance by the Company or penalties and strictures imposed on the Company by the Stock Exchanges or SEBI or any statutory authority on any matter related to capital markets, during the last three years.
There is no non-compliance of any requirements of Corporate Governance Report as prescribed under sub-paras (2) to (10) of Part C of Schedule V of SEBI Listing Regulations.
C. WHISTLE BLOWER POLICY & VIGIL MECHANISM
The Company has formulated a Whistle Blower Policy and has established a vigil mechanism for directors and employees to report concerns about unethical behavior, actual or suspected fraud or violation of the Company’s code of conduct. In this regard, Whistle Blowing Investigation Committee has been constituted to address the concerns reported under this Policy. The Company affirms that no personnel had been denied access to the Audit Committee under Vigil Mechanism. Details of Whistle Blower Policy is provided in the Directors’ Report section and also on the Company’s website, www.Lntinfotech.com/Investors.
D. POLICY FOR DETERMINING ‘MATERIAL’ SUBSIDIARIES
The Company has formulated a Policy for determining ‘Material’ Subsidiaries as defined in Regulation 16 of the SEBI Listing Regulations. This Policy is available on the Company’s website, www.Lntinfotech.com/Investors. During the year under review, the Company did not have any material non-listed Indian subsidiary.
E. DISCLOSURE OF COMMODITY PRICE RISKS AND COMMODITY HEDGING ACTIVITIES
Details of foreign exchange risk is provided in the Management Discussion & Analysis, forming part of this Annual Report. The Company does not deal in commodity price risk and commodity hedging activities.
F. CODE OF CONDUCT
The Company has framed a Code of Conduct for the Board members and senior management of the Company and same is available on the Company’s website, www.Lntinfotech.com/Investors. All Directors and Senior Management Personnel of the Company have affirmed compliance with the Company’s Code of Conduct for the financial year ended March 31, 2018. A declaration signed by the Chief Executive Officer & Managing Director of the Company affirming compliance with the Code of Conduct is annexed to this Corporate Governance Report.
G. OTHER DISCLOSURES
The Company has complied with the compliance requirements specified under Regulation 17 to 27 and clause (b) to (i) of sub-regulation (2) of Regulation 46 of the SEBI Listing Regulations as detailed hereunder:
Particulars Regulation Compliance Status
(Yes/No/NA)
Compliance area
Board of Directors 17 Yes Board Composition, Meeting of Board of Directors, Review of Compliance Reports, Plan for orderly succession for appointments, Code of Conduct, Fees/compensation paid to NEDs, Minimum information to be placed before Board, CEO & CFO compliance certificate on Financial Results, Risk Assessment & Management, Performance Evaluation
Audit Committee 18 Yes Composition and role of Audit Committee, Meeting of Audit Committee
Nomination and Remuneration Committee
19 Yes Composition and role of Nomination and Remuneration Committee
Stakeholders’ Relationship Committee
20 Yes Composition and role of Stakeholders’ Relationship Committee
Risk Management Committee 21 NA Composition and role of Risk Management Committee Vigil Mechanism 22 Yes Formulation of vigil mechanism

Annual Report 2017-1852
Particulars Regulation Compliance Status
(Yes/No/NA)
Compliance area
Related Party Transactions 23 Yes Policy for Related Party Transactions (RPTs), Prior or Omnibus approval of Audit Committee for all RPTs, approval for material RPTs
Corporate Governance Requirements with respect to Subsidiary of Listed Entity
24 NA Composition of Board of Directors of unlisted material subsidiary, other corporate governance requirements with respect to subsidiary of listed entity
Obligations with respect to Independent Directors
25 Yes Maximum Directorship & Tenure, Meeting of Independent Directors, Familiarization of Independent Directors
Obligations with respect to Employees including Senior Management, Key Managerial Persons, Directors & Promoters
26 Yes Memberships/Chairpersonships in Committees, Affirmation with compliance to code of conduct from members of Board of Directors and Senior Management, Disclosure of shareholding by Non-Executive Directors, Policy with respect to obligations of Directors and Senior Management
Other Corporate Governance Requirements
27 Yes Compliance with discretionary requirements, Quarterly compliance report on Corporate governance
Website 46(2)(b-i) Yes Dissemination of information on website – terms and conditions of appointment of Independent Directors, Composition of various committees of the Board, Code of Conduct of Board of Directors and Senior Management, details of vigil mechanism, criteria of making payments to Non-Executive Director, policy on related party transactions, determining material subsidiaries, details of familiarization programmes to Independent Directors.
10. DISCRETIONARY REQUIREMENTS AS PRESCRIBED IN PART E OF SCHEDULE II OF THE SEBI LISTING REGULATIONS
Among the discretionary requirements as specified in Part E of Schedule II of SEBI Listing Regulations, the Company has complied with the following:
• Theauditors’reportonstandaloneandconsolidatedfinancialstatementsoftheCompanyareunqualified.
• Mr. A.M.Naik is theChairmanof theCompany andMr. Sanjay Jalona is theChief ExecutiveOfficer&ManagingDirector of theCompany.
• TheHeadofInternalAuditoftheCompanyreportsdirectlytotheAuditCommittee.
For and on behalf of the Board of Directors
Sanjay Jalona Aftab Zaid UllahChief Executive Officer Chief Operating Officer
Place: Mumbai & Managing Director & Whole-time DirectorDate: May 23, 2018 (DIN: 07256786) (DIN: 05165334)

01Corporate Overview
17Statutory Reports
72Financial Statements
53
To the Board of Directors of Larsen & Toubro Infotech LimitedDear Sirs/ Madam,
Sub: CEO/ CFO Certificate[Issued in accordance with the provisions of Regulation 17(8) of
SEBI (Listing Obligations and Disclosure Requirements) Regulations, 2015]
We have reviewed financial statements, read with the cash flow statement of Larsen and Toubro Infotech Limited for the year ended March 31, 2018 and that to the best of our knowledge and belief, we state that:
a. i. these statements do not contain any materially untrue statement or omit any material fact or contain statements that may be misleading;
ii. these statements present a true and fair view of the Company’s affairs and are in compliance with current accounting standards, applicable laws and regulations
b. There are, to the best of our knowledge and belief, no transactions entered into by the Company during the year which are fraudulent, illegal or in violation of the Company’s Code of Conduct.
c. We accept the responsibility for establishing and maintaining internal controls for financial reporting. We have evaluated the effectiveness of internal control systems of the Company pertaining to financial reporting and have disclosed to the Auditors and Audit Committee, deficiencies, if any, in the design or operation of such internal controls of which we are aware and steps have been taken or proposed to be taken for rectifying these deficiencies.
d. We have indicated to the Auditors and Audit Committee that:
i. there were no significant changes in internal control over financial reporting during the aforesaid period;
ii. there were no significant changes in accounting policies during the aforesaid period; and
iii. there were no instances of significant fraud of which we have become aware.
Yours sincerely
Sanjay Jalona Ashok Kumar SonthaliaPlace: Mumbai Chief Executive Officer Chief Financial Officer Date: May 23, 2018 & Managing Director
ANNEXURE
DECLARATION PURSUANT TO SCHEDULE V OF THE SECURITIES AND EXCHANGE BOARD OFINDIA (LISTING OBLIGATIONS AND DISCLOSURE REQUIREMENTS) REGULATIONS, 2015
I hereby confirm that all the Board Members and Senior Management Personnel have affirmed compliance with the Code of Conduct as adopted by the Board of Directors.
Sanjay JalonaPlace: Mumbai Chief Executive Officer Date: May 23, 2018 & Managing Director

Annual Report 2017-1854
Independent Auditors’ Certificate on Corporate Governance
To the Members of Larsen & Toubro Infotech Limited
We, B. K. Khare & Co. Chartered Accountants, the Statutory Auditors of Larsen & Toubro Infotech Limited (‘the Company’), have examined the compliance of conditions of Corporate Governance by the Company, for the year ended on March 31, 2018, as stipulated in regulation 17 to 27 and clause (b) to (i) of regulation 46(2) and paragraphs C and D of Schedule V of the Securities and Exchange Board of India (Listing Obligations and Disclosure Requirements) Regulations, 2015 (‘SEBI Listing Regulations’).
Management’s Responsibility
The compliance of conditions of Corporate Governance is the responsibility of Management. This responsibility includes the design, implementation and maintenance of internal control and procedures to ensure compliance with the conditions of corporate governance stipulated in the SEBI Listing Regulations.
Auditors’ Responsibility
Our responsibility is limited to examining the procedures and implementation thereof, adopted by the Company for ensuring the compliance of the conditions of the Corporate Governance. It is neither audit nor expression of opinion on the financial statements of the Company.
We have examined the books of accounts and other relevant records and documents maintained by the Company for the purpose of providing reasonable assurance on the compliance with Corporate Governance requirements by the Company.
We have carried out an examination of the relevant records of the Company in accordance with the Guidance Note on Certification of Corporate Governance issued by the Institute of Chartered Accountants of India (‘the ICAI’), the Standards on Auditing specified under section 143(10) of the Companies Act, 2013, in so far as applicable for the purpose of this certificate and as per the Guidance Note on Reports or Certificates for Special Purpose issued by the ICAI which requires that we comply with the ethical requirements of the Code of Ethics issued by the ICAI.
We have complied with the relevant applicable requirements of the Standard on Quality Control (SQC) 1, Quality Control for Firms that Perform Audits and Reviews of Historical Financial Information, and Other Assurance and Related Services Engagements.
Opinion
Based on our examination of the relevant records and according to the information and explanation provided to us and representations provided by management, we certify that the Company has complied with the conditions of Corporate Governance as specified in regulation 17 to 27, clause (b) to (i) of regulation 46(2) and paragraphs C and D of Schedule V of the SEBI Listing Regulations, as applicable during the year ended March 31, 2018.
We state that such compliance is neither an assurance as to the future viability of the Company nor the efficiency or effectiveness with which the management has conducted the affairs of the Company.
Restriction on use
This certificate is issued solely for the purpose of complying with the aforesaid SEBI Listing Regulations and should not be used by any other person or for any other purpose.
B. K. KHARE & CO.Chartered Accountants
Firm’s Registration No. 105102Wby the hand of
RAVI KAPOORMembership No. 040404
Mumbai, May 23, 2018 Partner

01Corporate Overview
17Statutory Reports
72Financial Statements
55
Annexure B
Statement of disclosure of remuneration under Section 197 of the Companies Act, 2013 and Rule 5(1) of Companies (Appointment and Remuneration of Managerial Personnel) Rules, 2014:
A Ratio of the remuneration of each director to the median remuneration of the employees of the Company for the financial year 2017-18, the percentage increase in remuneration of each Director & Key Managerial Personnel (‘KMP’) during the financial year 2017-18:
S. N.
Name of the Director/ KMP
Designation Total Remuneration
(INR Mn)
Ratio of remuneration of Director to
the median remuneration(1)
% Increase in Remuneration
1 A. M. Naik Non-Executive Chairman 12.63 14.31 N.A.2 S. N. Subrahmanyan Non-Executive Vice Chairman - - N.A.3 Sanjay Jalona2 Chief Executive Officer & Managing Director 139.68 158.26 73.604 R. Shankar Raman Non-Executive Director - - N.A.5 Aftab Zaid Ullah Chief Operating Officer & Whole-time Director 47.66 54.00 4.726 Sudhir Chaturvedi2 President-Sales & Whole-time Director 97.54 110.52 149.787 Samir Desai Independent Director 5.47 6.20 61.368 M. M. Chitale Independent Director 1.84 2.08 (24.28)9 Vedika Bhandarkar Independent Director 1.60 1.81 (7.51)10 Arjun Gupta Independent Director 2.37 2.69 4.8711 Sanjeev Aga Independent Director 1.10 1.25 292.8612 Sudip Banerjee3 Independent Director 1.10 1.25 N.A.13 Subhalakshmi Panse4 Independent Director 0.28 2.57 N.A.14 Ashok Kumar Sonthalia Chief Financial Officer 21.42 24.27 N.A.15 Manoj Koul Company Secretary & Compliance Officer 4.78 8.99 N.A.
Notes: 1. Ratio of remuneration of director to the median remuneration is calculated on pro-rata basis for those directors who served for only part of the FY18.2. Mr. Sanjay Jalona and Mr. Sudhir Chaturvedi have been paid remuneration in USD and GBP respectively. Accordingly, the figure mentioned above is INR
equivalent. 3. Mr. Sudip Banerjee has been appointed as an Independent Director of the Company w.e.f. May 20, 2017. 4. Ms. Shubhalakshmi Panse resigned as an Independent Director of the Company w.e.f. May 15, 2017.5. The percentage increase in remuneration of Mr. A. M. Naik is not comparable as no commission was paid for FY17.6. The percentage increase in remuneration of Mr. Sudhir Chaturvedi, Mr. Sanjeev Aga, Mr. Sudip Banerjee is not comparable as they were with the Company for
only part of FY17 or FY18.
B Average percentile increase already made in the salaries of employees other than the managerial personnel in the last financial year and its comparison with the percentile increase in the managerial remuneration and justification thereof and point out if there are any exceptional circumstances for increase in the managerial remuneration:
The average annual increase for employees was around 7.5% in India and 2% outside India. The average increase in managerial remuneration was 75%. The average increase is not comparable since the increase is on account of exercise of stock options by the Executive Directors and payment of commission to Non-Executive Directors.
C The percentage increase in the median remuneration of employees in the financial year 2017-18: 28.48%
D Number of permanent employees on the rolls of Company as on March 31, 2018: 22,702
E Affirmation that the remuneration is as per the remuneration policy of the Company:
The Company affirms that the remuneration is as per the remuneration policy of the Company.

Annual Report 2017-1856
Annexure C
1. A Brief outline of the Company’s CSR policy, including overview of projects undertaken and a reference to web link to the CSR policy and projects or programs:
The Company has framed the Corporate Social Responsibility (‘CSR’) Policy in compliance with the provisions of the Companies Act, 2013 and the same is available on the website of the Company www.Lntinfotech.com/wp-content/uploads/2018/04/LTI_CSR_Policy_Framework.pdf.
The primary purpose of Company’s CSR philosophy is to make a meaningful and measurable impact on the lives of economically, physically and socially challenged communities. The Company is committed to the cause of sustainable development by leveraging technology and creating opportunities for growth and prosperity around the world. Our focus is on three causes – Education, Empowerment and Environment. The Company’s efforts have been supplemented by implementation partners.
Supporting Inclusive Education
The Company works with the approach of leveraging technology to supplement education and helping children stay in school -
a) By providing high quality delivery of curriculum and supplementary education in Government schools across India;
b) By providing digital and experiential learning platforms created to mainstream students from marginalized communities;
c) By providing mid-day meals and helping students come to school.
The Company sets up virtual learning platforms where our volunteers from Company’s office premises help teach Science, English and Maths to students in Government schools in rural parts of Maharashtra, Karnataka and Tamil Nadu. We support digital education programs by providing laptops and conducive infrastructure for learning. Through our interventions in providing science kits to students and providing entrepreneurial based training, we try to enhance knowledge through experimentation among the students.
This year, the Company has supported 17,500 school children through Akshaya Patra in Bengaluru which helps in improving their attendance in school. In our endeavor of making education more inclusive, a unique quiz ‘Quizabled’ was organized for specially-abled children. 500 specially-abled students from 200 schools participated in the program in Bangalore district.
The Company has established a state-of-the-art Industrial Internet of Things (IIoT) lab at VJTI Mumbai which provides a platform to students for developing innovative technological solutions. Recently, these students won the first prize at the Global Cyber Challenge Hackathon 2017 for their solution on cyber security of critical infrastructure-out of 900 entries and participation from 120 countries.
This year we have supported 427 schools and helped 62,807 school children.
Annual report on Corporate Social Responsibility (‘CSR’) activities for financial year 2017-18
Empowermenttoenhanceemployability
With an objective to enhance earning capability among communities LTI is focusing on-
a) Employability based digital and vocational training for youth;
b) Entrepreneurship based programs for women;
c) Enabling the specially-abled in earning a livelihood.
The Digital Sakshar project in Mumbai aims to help youth learn computer skills based on market requirements. More interventions in this direction include providing Tally and Computer hardware, e-publishing and networking have been introduced in Mumbai, Pune and Chennai to enhance employability. In FY17-18 we have trained more than 14,000 youth through these programs.
This year we have trained 250 women artisans from Thane and Mumbai district in association with UNDP and FUEL with a two-fold objective-to revive Warli art and make these women as entrepreneurs and providing market linkages. To supplement their efforts, we organized sale of their products at our office premises which helped them gain confidence and tackle customers. Women were also trained in tailoring and beautician courses which helped them earn a livelihood.
Youth from remote parts of Uttarakhand were trained on domestically and internationally outsourced business processes, like Digital Publishing and Financial Services in a rural BPO set up.
The I-Learn I-Earn project, which is a Presidential award-winning initiative, helps differently-abled youth learn computer skills. Youth are provided training in computer skills to enhance employability.
During the year, 17,080 youth and women including the specially-abled have successfully completed such trainings at 87 centres located across India.
Environment
The Company works with multiple stakeholders, particularly our clients, employees and the communities we serve, towards the cause of a greener environment by-
a) Improving green cover;
b) Undertaking water conservation programs.
The Company felicitates the clients and employees with tree plantation certificates and each certificate supports plantation of two trees. Plantation drives have also been conducted across Maharashtra, Karnataka and Tamil Nadu to supplement our efforts for a greener environment.
A new initiative, ‘Walk for a Cause’, to converge the physical with digital was introduced across our locations in India in which employees were motivated to track their health through a mobile app and this was matched with planting trees. During the year 14,324 trees were planted through such initiative.
In order to address the critical issue of conserving and reusing water particularly in drought prone regions in Karnataka, we supported digging of ponds in fields and mobilized farmers through rain water harvesting. This initiative will help at least

01Corporate Overview
17Statutory Reports
72Financial Statements
57
25,000 members of the community to cultivate on land in this semi-arid region.
Employee Volunteering
Through 1Step, LTI employees have dedicated their time to teach curriculum based English, Mathematics and Science in addition to computers and soft skills to school children and youth across the country. Employees also participated in clothes and blood donation drives organized during the year. In FY18, 5,293 LTI-ites were a part of the 1Step initiatives.
2. The Composition of the CSR Committee:
i. Mr. Sanjay Jalona - Chairman ii. Mr. Aftab Zaid Ullah - Member iii. Mr. Arjun Gupta - Member
3. Average net profit for the last three years: ` 9,563 Million
4. Prescribed CSR expenditure (Two percent of the amount as in item 3 above): ` 191.30 Million
5. Details of CSR spent during the financial year:
i. Total amount spent for the financial year 2017-18: ` 116.62 Million;
ii. Amount unspent, if any: ` 74.68 Million;
iii. Manner in which the amount was spent during the financial year 2017-18: enclosed
6. In case the Company has failed to spend 2% of the average net profit of the last three financial years or any part thereof, the Company shall provide reasons for not spending the amount in its Board Report:
As reported earlier, the Company’s CSR projects being of mutli-year nature, these projects are executed in a phased manner. We continue to support sustainable projects by following the
due diligence process and ensuring reporting and monitoring standards are followed. As the Company is committed to its stakeholders to conduct the business in a responsible manner to create a sustained positive impact on the society, a more focused and structured approach has been adopted for driving the Company’s CSR initiatives. Though the CSR spend for the financial year under reference has been below the prescribed limit, the CSR spend has nearly doubled since last year and the Company is in the process of further ramping up its CSR initiatives, which can be factually evidenced from the increase in CSR spend on year-on-year basis..
7. A responsibility statement of the CSR Committee that the implementation and monitoring mechanisms are in compliance with its CSR objectives and CSR policy & its framework:
The CSR Committee hereby affirms that:
• TheCompanyhasdulyformulatedaCSRPolicyFrameworkwhich includes formulation of CSR Theme, CSR budget and roles and responsibilities of the Committee, CSR team formed for implementation of the CSR programs; and
• TheCompanyhasconstitutedamechanismtomonitorandreport on the progress of the CSR programs.
The activities undertaken by the Company as well as the implementation and monitoring mechanisms are in compliance with its CSR objectives and CSR policy and its framework.
Sanjay Jalona Aftab Zaid Ullah
Chief Executive Officer Chief Operating Officer & Managing Director & Whole-time Directorand Chairman - CSR Committee (DIN: 05165334) (DIN: 07256786)
5 (iii). Manner in which the amount spent during the financial year 2017-18 is detailed below:(Rs. Million)
S.N. CSR Project or activity identified Sector in which the project is covered
Projects or programs 1) Local area or other 2) Specify the State and District where project was undertaken
Amount Outlay (Budget)
project or programs wise
Direct expenses
Overheads Cumulative Expenditure
up to the reporting
period
Amount spent: Direct or through implementing agency
1
Providing computer education to school children from underprivileged communities. Providing experiential learning by setting up science and basic technology labs in schools and providing mid-day meals to Government school children.
Education
Mumbai, Navi Mumbai, Pune, Ahmednagar, Maharashtra; Bangalore, Dharwad, Koppal, Chamrajnagar, Karnataka; Chennai, Thiruvanamalai, Tamil Nadu.
61.00 62.68 3.13 65.81
Direct and through implementation partners
2
Providing vocational and digital skills and setting up necessary infrastructure for employability among underprivileged youth, women and people with special abilities.
Empowerment
Mumbai, Navi Mumbai, Thane, Pune, Maharashtra; Sonari, UP; Bhudni, MP; Letibunga, Uttrakhand; Chennai, Tamil Nadu
45.00 44.07 2.20 46.27
Direct and through implementation partners
3Rain water harvesting in drought prone regions and tree plantation drives to increase green cover.
Environment
Hubli, Banglaore, Karnataka; Maharashtra, Rajasthan and Tamil Nadu
4.00 4.32 0.22 4.54
Direct and through implementation partners
Total 110.00 111.07 5.55 116.62

Annual Report 2017-1858
Annexure D
To,The Members,LARSEN & TOUBRO INFOTECH LIMITED
I have conducted the secretarial audit of the compliance of applicable statutory provisions and the adherence to good corporate practices by LARSEN & TOUBRO INFOTECH LIMITED (hereinafter called the Company). Secretarial Audit was conducted in a manner that provided me a reasonable basis for evaluating the corporate conducts/statutory compliances and expressing my opinion thereon.
Based on my verification of the Company’s books, papers, minute books, forms and returns filed and other records maintained by the Company and also the information provided by the Company, its officers, agents and authorized representatives during the conduct of secretarial audit, I hereby report that in my opinion, the company has, during the audit period covering the financial year ended on March 31, 2018, complied with the statutory provisions listed hereunder and also that the Company has proper Board-processes and compliance-mechanism in place to the extent, in the manner and subject to the reporting made hereinafter.
I have examined the books, papers, minute books, forms and returns filed and other records maintained by the Company for the financial year ended on March 31, 2018 according to the provisions of:
(i) The Companies Act, 2013 (the Act) and the rules made thereunder;
(ii) The Securities Contracts (Regulation) Act, 1956 (‘SCRA’) and the rules made thereunder;
(iii) The Depositories Act, 1996 and the Regulations and Bye-laws framed thereunder;
(iv) Foreign Exchange Management Act, 1999 and the rules and regulations made thereunder to the extent of Foreign Direct Investment, Overseas Direct Investment and External Commercial Borrowings;
(v) The following Regulations and Guidelines prescribed under the Securities and Exchange Board of India Act, 1992 (‘SEBI Act’), as applicable:-
a) The Securities and Exchange Board of India (Substantial Acquisition of Shares and Takeovers) Regulations, 2011;
b) The Securities and Exchange Board of India (Prohibition of Insider Trading) Regulations, 1992; presently, (Prohibition of Insider Trading) Regulations, 2015
Form No. MR-3SECRETARIAL AUDIT REPORT
FOR THE FINANCIAL YEAR ENDED MARCH 31, 2018
[Pursuant to section 204(1) of the Companies Act, 2013 and rule No.9 of the Companies (Appointment and Remuneration of Managerial Personnel) Rules, 2014]
c) The Securities and Exchange Board of India (Issue of Capital and Disclosure Requirements) Regulations, 2009;
d) The Securities and Exchange Board of India (Employee Stock Option Scheme and Employee Stock Purchase Scheme) Guidelines, 1999; presently (Share Based Employee Benefits) Regulations, 2014;
e) The Securities and Exchange Board of India (Issue and Listing of Debt Securities) Regulations, 2008;
f) The Securities and Exchange Board of India (Registrars to an Issue and Share Transfer Agents) Regulations, 1993 regarding the Companies Act and dealing with client;
g) The Securities and Exchange Board of India (Delisting of Equity Shares) Regulations, 2009; and
h) The Securities and Exchange Board of India (Buyback of Securities) Regulations, 1998.
(vi) Other specific business/industry related laws that are applicable to the company, viz.
The Information Technology Act, 2000.
The Special Economic Zone Act, 2005.
Policy relating to Software Technology Parks of India and its regulations.
The Indian Copyright Act, 1957.
The Patents Act, 1970.
The Trade Marks Act, 1999.
Indian Telegraph Act.
Telecom Regulatory Authority of India (TRAI)/ Department of Telecommunication (DOT) Guidelines.
Other Service Provider Guidelines (Governed by DOT)
I have also examined compliance with the applicable clauses of the following:
i. Secretarial Standards issued by The Institute of Company Secretaries of India.
ii. The Securities and Exchange Board of India (Listing Obligations and Disclosure Requirements) Regulations, 2015 and the Listing Agreements entered into by the Company with Stock Exchange(s), applicable as follows:
• Equity Shares listed on BSE Limited and NationalStock Exchange of India Limited.
01Corporate Overview
17Statutory Reports
72Financial Statements
59
During the period under review the Company has complied with the provisions of the Act, Rules, Regulations, Guidelines, Standards, etc. mentioned above.
I further report that the Board of Directors of the Company is duly constituted with proper balance of Executive Directors, Non-Executive Directors and Independent Directors. The changes in the composition of the Board of Directors that took place during the period under review were carried out in compliance with the provisions of the Act.
Adequate notice is given to all directors to schedule the Board Meetings, agenda and detailed notes on agenda were sent at least seven days in advance, and a system exists for seeking and obtaining further information and clarifications on the agenda items before the meeting and for meaningful participation at the meeting. Majority decision is carried through while the dissenting members’ views are captured and recorded as part of the minutes.
I further report that, in my opinion there are adequate systems and processes in the company commensurate with the size and operations of the company to monitor and ensure compliance with applicable laws, rules, regulations and guidelines.
I further report that during the audit period the following events / actions have taken place which have a major bearing on the Company’s affairs in pursuance of the above referred laws, rules, regulations, guidelines, standards, etc., like -
(i) Public/Right/Preferential issue of shares / debentures/sweat equity, etc. – NIL
(ii) Redemption / buy-back of securities. – NIL.
(iii) Major decisions taken by the members in pursuance to section 180 of the Companies Act, 2013. – NIL.
(iv) Merger / amalgamation / reconstruction, etc. –
Amalgamation of AugmentIQ Data Sciences Private Limited (‘AugmentIQ’) with the Company:
The Board of Directors of the Company and AugmentiQ Data Sciences Private Limited (‘AugmentIQ’) in their meetings held on May 4, 2017 and May 3, 2017, respectively, have approved the Scheme of Amalgamation (‘Scheme’) of AugmentIQ with the Company under Sections 230-232 of the Companies Act, 2013. Further, the shareholders of the Company and AugmentIQ in their meeting held on August 24, 2017 and August 23, 2017, respectively, have approved the Scheme. Subsequently, AugmentIQ and the Company have filed a Petition with NCLT on September 07, 2017, and the approval is awaited. The appointed date for the proposed Scheme is April 1, 2017.
(v) Foreign technical collaborations – NIL.
(vi) Other Event –
During the financial year ended March 31, 2018, the Company has acquired 100% of the fully paid-up equity share capital of Syncordis S.A. along with its identified subsidiaries in India, UK, France and Luxembourg.
NAINA R DESAIPractising Company Secretary
Place: Mumbai Membership No. 1351Date: April 19, 2018 Certificate of Practice No.13365
This report is to be read with our letter of even date which is annexed as Annexure A and forms an integral part of this report.
To,The MembersLARSEN & TOUBRO INFOTECH LIMITED
Our report of even date is to be read along with this letter.
1) Maintenance of secretarial record is the responsibility of the management of the Company. Our responsibility is to express an opinion on these secretarial records based on our audit.
2) We have followed the audit practices and processes as were appropriate to obtain reasonable assurance about the correctness of the contents of the Secretarial records. The verification was done on test basis to ensure that correct facts are reflected in secretarial records. We believe that the processes and practices, we followed provide a reasonable basis for our opinion.
3) We have not verified the correctness and appropriateness of financial records and Books of Account of the Company.
4) Where ever required, we have obtained the Management representation about the compliance of laws, rules and regulations and happening of events etc.
5) The compliance of the provisions of Corporate and other applicable laws, rules, regulations, standards is the responsibility of management. Our examination was limited to the verification of procedures on test basis.
6) The Secretarial Audit report is neither an assurance as to the future viability of the Company nor of the efficacy or effectiveness with which the management has conducted the affairs of the Company.
NAINA R DESAIPractising Company Secretary
Place: Mumbai Membership No. 1351Date: April 19, 2018 Certificate of Practice No.13365
‘Annexure A’

Annual Report 2017-1860
Annexure E
Form No. MGT-9EXTRACT OF ANNUAL RETURN
as on the financial year ended on March 31, 2018[Pursuant to section 92(3) of the Companies Act, 2013 and rule 12(1)
of the Companies (Management and Administration) Rules, 2014]
i) REGISTRATION AND OTHER DETAILS:
S.N. Particulars1 CIN L72900MH1996PLC1046932 Registration Date 23rd December 19963 Name of the Company Larsen & Toubro Infotech Limited4
Category/ Sub-Category of the CompanyCompany limited by sharesIndian Non-Government Company
5 Address of the Registered office and contact details L&T House, Ballard Estate, Mumbai - 400001Tel: +9122 6776 6138Email: [email protected]
6 Whether listed Company Yes7 Name, Address and Contact details of Registrar and
Transfer Agent, if anyLink Intime India Private Limited Address: C 101, 247 Park, L B S Marg, Vikhroli West, Mumbai 400083 Tel: +91 22 4918 6000 | Fax: +91 22 4918 6060Email: [email protected]
ii) PRINCIPAL BUSINESS ACTIVITIES OF THE COMPANY:
All the business activities contributing 10% or more of the total turnover of the Company shall be stated:-
S. N. Name and Description of main Products/ Services NIC Code of the Product/ Service % to total turnover of the Company
1Computer programming, consultancy and related activities
620 100.00
iii) PARTICULARS OF HOLDING, SUBSIDIARY AND ASSOCIATE COMPANIES:
S. N. Name and Address of the Company CIN/ GLN Holding/ Subsidiary/ Associate
% of shares
held
Applicable Section
1 Larsen & Toubro LimitedAdd: L&T House, N. M. Marg, Ballard Estate, Mumbai-400001
L99999MH1946PLC004768 Holding Company
82.96 2(46)
2 Larsen & Toubro Infotech GmbHAdd: Euro-Asia Business Center, Messe-Allee 2, D-04356, Leipzig, Germany
-Subsidiary 100.00 2(87)
3 Larsen & Toubro Infotech Canada LimitedAdd: 2810, Matheson Blvd East, Suite 500, Mississauga, ON L4W 4X7, Canada
-Subsidiary 100.00 2(87)
4 Larsen & Toubro Infotech LLCAdd: 1220, N. Market St., Suite 806, Wilmington, DE 19801, Country of New Castle, United States of America
-Subsidiary 100.00 2(87)
5 L&T Infotech Financial Services Technologies Inc.Add: 2810, Matheson Blvd East, Suite 500, Mississauga, ON L4W 4X7, Canada
-Subsidiary 100.00 2(87)
6 Larsen And Toubro Infotech South Africa (Pty) LimitedAdd: 1st floor, Rosebank Towers, 15 Biermann Avenue, Rosebank, Johannesburg
-Subsidiary 74.90 2(87)

01Corporate Overview
17Statutory Reports
72Financial Statements
61
S. N. Name and Address of the Company CIN/ GLN Holding/ Subsidiary/ Associate
% of shares
held
Applicable Section
7 L&T Information Technology Services (Shanghai) Co., Ltd.Add: Room 1100m Building 2, No.1388, Xingxian Road, Jaiding District, Shanghai, China
- Subsidiary 100.00 2(87)
8 Larsen & Toubro Infotech Austria GmbH Add: c/o Oberhammer Rechtsanwälte GmbH, Karlsplatz 3/1, 1010 Vienna, Austria
- Subsidiary 100.00 2(87)
9 L&T Information Technology Spain SLAdd: C/JOSÉ ABASCAL 56 2nd Floor, Madrid, Spain
- Subsidiary 100.00 2(87)
10 AugmentIQ Data Sciences Private Limited*Add: Godrej Eternia A, 5th Floor Mumbai Pune Road, Shivajinagar, Pune Maharashtra 411005, India
U72200PN2012PTC145539 Subsidiary 100.00 2(87)
11 L&T Infotech S.de. RL.de. C.VAdd: Bosque de Ciruelos 180, Suite PP 101 Col. Bosques de las Lomas, 11700 Mexico city, Mexico
- Subsidiary 100.00 2(87)
12 Syncordis Software Services India Private limited Add: 4th floor Roop Emerald, No.45 North Usman Road, T.Nagar, Chennai-600 017, Tamilnadu, India
U72900TN2015FTC101675 Subsidiary 100.00 2(87)
13 Syncordis S.A. Add: 105, route d’ArlonL - 8009 Strassen Luxembourg(Step down Subsidiary)
- Subsidiary 100.00 2(87)
14 Syncordis Support Services S.A.Add: 105, route d’ArlonL - 8009 Strassen Luxembourg(Step down Subsidiary)
- Subsidiary 100.00 2(87)
15 Syncordis LimitedAdd: Beacon House, 15 Christchurch Road, Bournemouth, Dorset, England, BH1 3LB, UK(Step down Subsidiary)
- Subsidiary 100.00 2(87)
16 Syncordis SARLAdd: 8 Rue Paul Belmondo 75012 Paris, France(Step down Subsidiary)
- Subsidiary 100.00 2(87)
*Note: AugmentIQ Data Sciences Private Limited has been amalagamated with the Company w.e.f. May 21, 2018.
iv) SHARE HOLDING PATTERN (Equity Share Capital Breakup as percentage of Total Equity)
a) Category-wise Share Holding:
Category Code
Category of Shareholder(s)
No. of Equity Shares held at the beginning of the year No. of Equity Shares held at the end of the year % Change during the
yearDematerialised Form
Physical Form
Total % of Total Shares
Dematerialised Form
Physical Form
Total % of Total Shares
(A) Promoters
(1) Indian
(a) Individuals/ Hindu Undivided Family
0 0 0 0.00 0 0 0 0.00 0.00
(b) Central Government 0 0 0 0.00 0 0 0 0.00 0.00
(c) State Government(s) 0 0 0 0.00 0 0 0 0.00 0.00
(d) Banks/ Financial Institutions
0 0 0 0.00 0 0 0 0.00 0.00
(e) Bodies Corporate 143,750,000 0 143,750,000 84.28 142,693,637 0 142,693,637 82.96 1.32
(f) Any Other (Specify) 0 0 0 0.00 0 0 0 0.00 0.00
Sub-total (A1) 143,750,000 0 143,750,000 84.28 142,693,637 0 142,693,637 82.96 1.32
(2) Foreign
(a) NRIs – Individuals 0 0 0 0.00 0 0 0 0.00 0.00
(b) Government 0 0 0 0.00 0 0 0 0.00 0.00
(c) Institutions 0 0 0 0.00 0 0 0 0.00 0.00

Annual Report 2017-1862
Category Code
Category of Shareholder(s)
No. of Equity Shares held at the beginning of the year No. of Equity Shares held at the end of the year % Change during the
yearDematerialised Form
Physical Form
Total % of Total Shares
Dematerialised Form
Physical Form
Total % of Total Shares
(d) Foreign Portfolio Investor
0 0 0 0.00 0 0 0 0.00 0.00
(e) Any Other (Specify) 0 0 0 0.00 0 0 0 0.00 0.00
Sub-total (A2) 0 0 0 0.00 0 0 0 0.00 0.00
Total Shareholding of Promoter (A) = (A1 + A2)
143,750,000 0 143,750,000 84.28 142,693,637 0 142,693,637 82.96 1.32
(B) Public Shareholding
(1) Institutions
(a) Mutual Funds 2,038,938 0 2,038,938 1.20 2,905,715 0 2905,715 1.69 (0.49)
(b) Banks/ Financial Institutions
189,413 0 189,413 0.11 23,442 0 23,442 0.01 0.10
(c) Central Government 0 0 0 0.00 0 0 0 0.00 0.00
(d) State Government(s) 0 0 0 0.00 0 0 0 0.00 0.00
(e) Venture Capital Funds 0 0 0 0.00 0 0 0 0.00 0.00
(f) Insurance Companies 1,326,417 0 1,326,417 0.78 701,434 0 701,434 0.41 0.37
(g) Foreign Portfolio Investors
8,121,094 0 8,121,094 4.76 11,903,239 0 11,903,239 6.92 (2.16)
(h) Foreign Venture Capital Funds
0 0 0 0.00 0 0 0 0.00 0.00
(i) Alternative Investment Funds
0 0 0 0.00 139,658 0 139,658 0.08 (0.08)
(j) Any Other (Specify) 0 0 0 0.00 0 0 0 0.00 0.00
Sub-total (B1) 11,675,862 0 11,675,862 6.85 15,673,488 0 15,673,488 9.11 (2.26)
(2) Non – Institutions (a) Individuals (i) Individual Shareholders
holding nominal Equity Share Capital up to ` 1 Lakh
9,870,849 98,449 9,969,298 5.84 8,074,075 178,054 8,252,129 4.79 1.05
(ii) Individual Shareholders holding nominal Equity Share Capital in excess of ` 1 Lakh
2,145,500 111,250 2,256,750 1.32 2,251,875 0 2,251,875 1.31 0.01
(b) Bodies Corporate 409,288 0 409,288 0.24 690,447 0 690,447 0.40 (0.16)
(c) Any Other (Specify)
(i) Foreign Nationals 100 243,671 243,771 0.14 27,000 190,176 217,176 0.13 0.01
(ii) Hindu Undivided Family 283,580 0 283,580 0.17 192,041 0 192,041 0.12 0.05
(ii) Non Resident Indians (Repat)
979,197 428,428 1,407,625 0.82 1,114,956 252,240 1,367,196 0.80 0.02
(iv) Non Resident Indians (Non-Repat)
194,638 141,685 336,323 0.20 400,311 16,197 416,508 0.24 (0.04)
(v) Clearing Member 238,616 0 238,616 0.14 244,746 0 244,746 0.14 0.00
(vi) Trusts 0 0 0 0.00 20 0 20 0.00 0.00
Sub-total (B2) 14,121,768 1,023,483 15,145,251 8.87 12,995,741 636,667 13,632,138 7.93 0.94 Total Public
Shareholding (B) = (B1 + B2)
25,797,630 1,023,483 26,821,113 15.72 28,668,959 636,667 29,305,626 17.04 (1.32)
TOTAL (A+B) 169,547,630 1,023,483 170,571,113 100.00 171,362,596 636,667 171,999,263 100.00 0.00(C) Shares held by
Custodians and against which Depository Receipts have been issued
0 0 0 0.00 0 0 0 0.00 0.00
Grand Total (A+B+C) 169,547,630 1,023,483 170,571,113 100.00 171,362,596 636,667 171,999,263 100.00 0.00

01Corporate Overview
17Statutory Reports
72Financial Statements
63
b) Shareholding of Promoters:
S. N. Shareholder’s Name
Shareholding at the beginning of the year Shareholding at the end of the year % change in shareholding
during the yearNo. of Shares % of Total
Shares of the
Company
% of Shares Pledged/
encumbered to Total Shares
No. of Shares % of Total Shares
of the Company
% of Shares Pledged/
encumbered to Total Shares
1 Larsen & Toubro Limited
143,750,000 84.28 0.00 142,693,637 82.96 0.00 1.32
Total 143,750,000 84.28 0.00 142,693,637 82.96 0.00 1.32
c) Change in Promoters’ Shareholding:
S.N. Particulars Date of Transaction
Shareholding at the beginning of the year
Increase / (Decrease) in Shareholding
Cumulative Shareholding during the year
No. of Shares % of Total Shares of the
Company
No. of Shares % of Total Shares of the
Company1
1. Larsen & Turbo Limited 143,750,000 84.28 - -
Date wise Increase/ Decrease in Promoters Shareholding during the year specifying the reasons for increase/ decrease (e.g. allotment/ transfer/ bonus/ sweat equity etc.)
March 1, 2018 (100,000) 143,650,000 83.55
March 5, 2018 (70,000) 143,580,000 83.51
March 6, 2018 (67,183) 143,512,817 83.47
March 7, 2018 (88,681) 143,424,136 83.42
March 8, 2018 (112,117) 143,312,019 83.35
March 9, 2018 (79,331) 143,232,688 83.28
March 12, 2018 (104,635) 143,128,053 83.21
March 13, 2018 (166,824) 142,961,229 83.12
March 14, 2018 (28,147) 142,933,082 83.10
March 15, 2018 (15,000) 142,918,082 83.09
March 16, 2018 (25,863) 142,892,219 83.08
March 22, 2018 (59,690) 142,832,529 83.04
March 23, 2018 (7,090) 142,825,439 83.04
March 26, 2018 (6,066) 142,819,373 83.03
March 27, 2018 (54,309) 142,765,064 83.00
March 28, 2018 (71,427) 142,693,637 82.96
At the end of the year - - - 142,693,637 82.96
Note:1The change in the percentage of shareholding is also due to periodic allotment of equity shares under the Employee Stock Option Schemes of the Company during the financial year 2017-18.
d) Shareholding Pattern of top ten Shareholders (other than Directors, Promoters and Holders of GDRs and ADRs):
S.N. For Each of the Top 10 Shareholders Shareholding at the beginning of the year
Increase / (Decrease) in Shareholding
Cumulative Shareholding during the year
No. of shares % of total shares of the Company
No. of shares % of total shares of the Company
1 AUBURN LIMITED 4,763,495 2.79 - -Purchase(s) during the year - - -Sale(s) during the year - - -At the end of the year 4,763,495 2.77
2 HDFC TRUSTEE COMPANY LIMITED 639,125 0.37 - -Purchase(s) during the year 722,439 1,361,564 0.79Sale(s) during the year - - -At the end of the year - 1,361,564 0.79

Annual Report 2017-1864
S.N. For Each of the Top 10 Shareholders Shareholding at the beginning of the year
Increase / (Decrease) in Shareholding
Cumulative Shareholding during the year
No. of shares % of total shares of the Company
No. of shares % of total shares of the Company
3 NTASIAN EMERGING LEADERS MASTER FUND 1,446,399 0.85 - -Purchase(s) during the year 78,000 1,524,399 0.90Sale(s) during the year (185,306) 1,339,093 0.84At the end of the year 1,339,093 0.84
4 MORGAN STANLEY (FRANCE) S.A. - - - -Purchase(s) during the year 689,784 689,784 0.40Sale(s) during the year (39,111) 650,673 0.38At the end of the year 650,673 0.38
5 ICICI PRUDENTIAL MUTUAL FUND 1,373,080 0.80 - -Purchase(s) during the year 110,328 1,483,408 0.86Sale(s) during the year (889,791) 593,617 0.35At the end of the year 593,617 0.35
6 FIL INVESTMENTS(MAURITIUS)LTD 632,232 0.37 - -Purchase(s) during the year 113,782 746,014 0.43Sale(s) during the year (206,374) 539,640 0.31At the end of the year 539,640 0.31
7 UTI MUTUAL FUND - - - -Purchase(s) during the year 556,980 556,980 0.32Sale(s) during the year (18,758) 538,222 0.31At the end of the year 538,222 0.31
8 VIJAY KUMAR MAGAPU 420,000 0.25 - -Purchase(s) during the year - - -Sale(s) during the year - - -At the end of the year 420,000 0.24
9 SCHRODER INTERNATIONAL SELECTION FUND INDIAN EQUITY
392,880 0.23 - -
Purchase(s) during the year 296,101 688,981 0.40Sale(s) during the year (291,727) 397,254 0.23At the end of the year 397,254 0.23
10 HDFC STANDARD LIFE INSURANCE COMPANY LIMITED
- - - -
Purchase(s) during the year 428,897 428,897 0.25Sale(s) during the year (109,044) 319,853 0.19At the end of the year 319,853 0.19
11 THE NEW INDIA ASSURANCE COMPANY LIMITED
281,680 0.17 - -
Purchase(s) during the year - - -Sale(s) during the year - - -At the end of the year 281,680 0.16
12 YESHWANT MORESHWAR DEOSTHALEE 281,250 0.16 - -Purchase(s) during the year - - -Sale(s) during the year - - -At the end of the year 281,250 0.16
13 KUWAIT INVESTMENT AUTHORITY FUND 225 419,061 0.25 - -Purchase(s) during the year 5,887 424,948 0.25Sale(s) during the year (329,946) 95,002 0.06At the end of the year 95,002 0.06
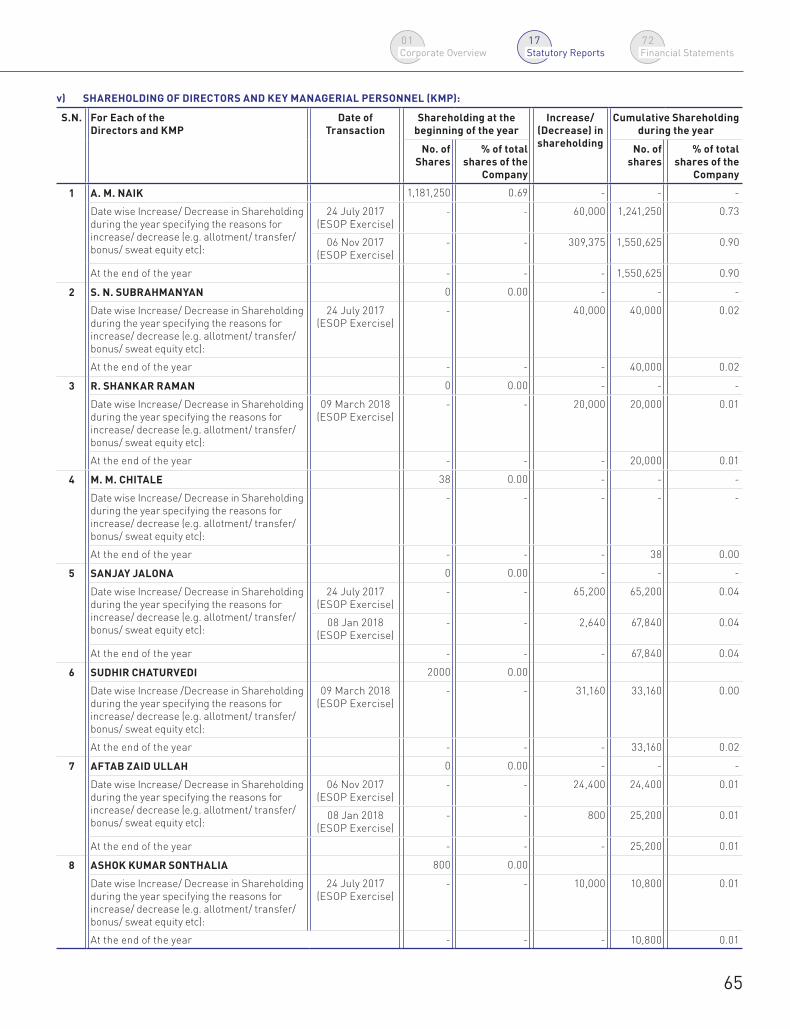
01Corporate Overview
17Statutory Reports
72Financial Statements
65
v) SHAREHOLDING OF DIRECTORS AND KEY MANAGERIAL PERSONNEL (KMP):
S.N. For Each of the Directors and KMP
Date of Transaction
Shareholding at thebeginning of the year
Increase/ (Decrease) in shareholding
Cumulative Shareholdingduring the year
No. of Shares
% of total shares of the
Company
No. of shares
% of total shares of the
Company
1 A. M. NAIK 1,181,250 0.69 - - -
Date wise Increase/ Decrease in Shareholding during the year specifying the reasons for increase/ decrease (e.g. allotment/ transfer/ bonus/ sweat equity etc):
24 July 2017(ESOP Exercise)
- - 60,000 1,241,250 0.73
06 Nov 2017(ESOP Exercise)
- - 309,375 1,550,625 0.90
At the end of the year - - - 1,550,625 0.90
2 S. N. SUBRAHMANYAN 0 0.00 - - -
Date wise Increase/ Decrease in Shareholding during the year specifying the reasons for increase/ decrease (e.g. allotment/ transfer/ bonus/ sweat equity etc):
24 July 2017(ESOP Exercise)
- 40,000 40,000 0.02
At the end of the year - - - 40,000 0.02
3 R. SHANKAR RAMAN 0 0.00 - - -
Date wise Increase/ Decrease in Shareholding during the year specifying the reasons for increase/ decrease (e.g. allotment/ transfer/ bonus/ sweat equity etc):
09 March 2018(ESOP Exercise)
- - 20,000 20,000 0.01
At the end of the year - - - 20,000 0.01
4 M. M. CHITALE 38 0.00 - - -
Date wise Increase/ Decrease in Shareholding during the year specifying the reasons for increase/ decrease (e.g. allotment/ transfer/ bonus/ sweat equity etc):
- - - - -
At the end of the year - - - 38 0.00
5 SANJAY JALONA 0 0.00 - - -
Date wise Increase/ Decrease in Shareholding during the year specifying the reasons for increase/ decrease (e.g. allotment/ transfer/ bonus/ sweat equity etc):
24 July 2017(ESOP Exercise)
- - 65,200 65,200 0.04
08 Jan 2018 (ESOP Exercise)
- - 2,640 67,840 0.04
At the end of the year - - - 67,840 0.04
6 SUDHIR CHATURVEDI 2000 0.00
Date wise Increase /Decrease in Shareholding during the year specifying the reasons for increase/ decrease (e.g. allotment/ transfer/ bonus/ sweat equity etc):
09 March 2018(ESOP Exercise)
- - 31,160 33,160 0.00
At the end of the year - - - 33,160 0.02
7 AFTAB ZAID ULLAH 0 0.00 - - -
Date wise Increase/ Decrease in Shareholding during the year specifying the reasons for increase/ decrease (e.g. allotment/ transfer/ bonus/ sweat equity etc):
06 Nov 2017(ESOP Exercise)
- - 24,400 24,400 0.01
08 Jan 2018(ESOP Exercise)
- - 800 25,200 0.01
At the end of the year - - - 25,200 0.01
8 ASHOK KUMAR SONTHALIA 800 0.00
Date wise Increase/ Decrease in Shareholding during the year specifying the reasons for increase/ decrease (e.g. allotment/ transfer/ bonus/ sweat equity etc):
24 July 2017(ESOP Exercise)
- - 10,000 10,800 0.01
At the end of the year - - - 10,800 0.01

Annual Report 2017-1866
vi) INDEBTEDNESS:
Indebtedness of the Company including interest outstanding/accrued but not due for payment: Nil
(` Million)
Particulars Secured Loans Excluding deposits
Unsecured Loans Deposits Total Indebtedness
Indebtedness at the beginning of the financial year:
i) Principal Amount
ii) Interest due but not paid
iii) Interest accrued but not due
-
-
-
-
-
-
-
-
-
-
-
-
Total (i+ii+iii) - - - -Change in Indebtedness during the financial year:
•Addition
•Reduction
-
-
-
-
-
-
-
-
Net Change - - - -Indebtedness at the end of the financial year:
i) Principal Amount
ii) Interest due but not paid
iii) Interest accrued but not due
-
-
-
-
-
-
-
-
-
-
-
-
Total (i+ii+iii) - - - -
vii) REMUNERATION OF DIRECTORS AND KEY MANAGERIAL PERSONNEL (DURING THE FINANCIAL YEAR 2017-18):
A. Remuneration to Managing Director (MD), Whole-time Directors (WTD) and/or Manager:
(` Million)
S. N. Particulars of Remuneration Name of MD/ WTD/ Manager
Sanjay Jalona
(CEO & MD)*
Aftab Zaid Ullah
(COO & WTD)
Sudhir Chaturvedi
(President – Sales & WTD)*
Total
Amount
1 Gross salary:Salary as per provisions contained in Section 17(1) of the Income-tax Act, 1961
50.76 19.08 39.98 109.82
Value of perquisites u/s 17(2) of the Income-tax Act, 1961 53.59 18.57 34.52 106.68Profits in lieu of salary under Section 17(3) of the Income-tax Act, 1961
- - - -
2 No. of Stock Options granted - - - -3 Sweat Equity - - - -4 Commission:
- as % of profit-others,
22.55 - - 22.55
5 Others (please specify):Variable Compensation 9.29 9.31 14.38 32.98Contribution to Provident Fund & Superannuation Fund 3.49 0.70 8.66 12.85Total (A) 139.68 47.66 97.54 284.88Ceiling as per the Act (1,294.45 Million) 10% of Net Profits of the Company
Note:*Mr. Sanjay Jalona and Mr. Sudhir Chaturvedi have been paid remuneration in USD and GBP respectively. The figures mentioned above are INR equivalent.

01Corporate Overview
17Statutory Reports
72Financial Statements
67
B. Remuneration to other Directors:
(` Million)
S. N. Particulars of Remuneration Fee for attending Board/ Committee
Meetings
Commission Others, please specify (No. of Stock Options
Granted)
Total Amount
1 Independent DirectorsSamir Desai 0.45 5.02 - 5.47M. M. Chitale 0.31 1.53 - 1.84Vedika Bhandarkar 0.30 1.30 - 1.60Arjun Gupta 0.20 2.17 - 2.37Subhalakshmi Panse1 0.05 0.23 - 0.28Sanjeev Aga 0.20 0.90 - 1.10Sudip Banerjee2 0.20 0.90 - 1.10
Total (1) 1.71 12.05 - 13.762 Other Non-Executive Directors
A. M. Naik 0.13 12.50 - 12.63S. N. Subrahmanyan - - - -R. Shankar Raman - - - -
Total (2) 0.13 12.50 - 12.63Total (B)=(1+2) 1.84 24.55 - 26.39Total Managerial Remuneration3 - 309.43 -Overall Ceiling as per the Act (1,423.90 Million) 11% of Net Profits of the Company
Notes:1. Ms. Shubhalakshmi Panse resigned as an Independent Director w.e.f. May 15, 2017. 2. Mr. Sudip Banerjee was appointed as an Independent Director w.e.f. May 20, 2017.3. The total managerial remuneration excludes the sitting fees paid.
C. Remuneration to Key Managerial Personnel other than MD/ Manager/ WTD:
(` Million)
S. N. Particulars of Remuneration Key Managerial Personnel Total AmountAshok Kumar
Sonthalia (CFO)Manoj Koul
(Company Secretary & Compliance Officer)1
1 Gross salary:Salary as per provisions contained in Section 17(1) of the Income-tax Act, 1961
7.14 3.32 10.46
Value of perquisites u/s 17(2) of the Income-tax Act, 1961 10.70 - 10.70Profits in lieu of salary under Section 17(3) of the Income-tax Act, 1961 - - -
2 No. of Stock Options granted - 3,100 3,1003 Sweat Equity - - -4 Commission
- as % of profit- others, specify
- - -
5 Others, please specify: - - -Variable Compensation 3.36 1.37 4.73Contribution to Provident Fund & Superannuation Fund 0.22 0.09 0.31Total 21.42 4.78 26.20
Note:1. Mr. Manoj Koul was appointed as the Company Secretary & Compliance Officer w.e.f. August 24, 2017.
viii) PENALTIES/ PUNISHMENT/ COMPOUNDING OF OFFENCES:
There were no penalties, punishment or compounding of offences during the year ended March 31, 2018.

Annual Report 2017-1868
Annexure F
Form
AO
C-I
(Pur
suan
t to
firs
t pro
viso
to s
ub-s
ecti
on (3
) of s
ecti
on 1
29 r
ead
wit
h ru
le 5
of C
ompa
nies
(A
ccou
nts)
Rul
es, 2
014)
Stat
emen
t con
tain
ing
sali
ent f
eatu
res
of th
e fi
nanc
ial s
tate
men
t of S
ubsi
diar
y C
ompa
nies
(` M
illio
n)
1Sl
. No.
12
34
56
78
910
1112
1314
2N
ame
of S
ubsi
diar
yLa
rsen
&
Tou
bro
Info
tech
G
mbH
1
Lars
en
& T
oubr
o In
fote
ch
Can
ada
Lim
ited
Lars
en
& T
oubr
o In
fote
ch
LLC2
L&T
Info
tech
Fi
nanc
ial
Serv
ices
Te
chno
logi
es
Inc.
3
Lars
en
And
Tou
bro
Sout
h A
fric
a (P
ty)
Lim
ited
L&T
Info
rmat
ion
Tech
nolo
gy
Serv
ices
(S
hang
hai)
Co. L
td.
Lars
en
& T
oubr
o In
fote
ch
Aus
tria
G
mbH
L&T
Info
rmat
ion
Tech
nolo
gy
Spai
n SL
L&T
Info
tech
S.
de. R
L.
C.V
Sync
ordi
s S.
A.
Sync
ordi
s Su
ppor
t Se
rvic
es
S.A
.
Sync
ordi
s Li
mite
d Sy
ncor
dis
SAR
L Sy
ncor
dis
Soft
war
e Se
rvic
es
Indi
a Pr
ivat
e Li
mite
d
Coun
try
Ger
man
yC
anad
aU
SAC
anad
aSo
uth
Afri
caCh
ina
Aus
tria
Spai
nM
exic
oLu
xem
bour
gLu
xem
bour
gU
KFr
ance
Indi
a
3D
ate
of A
cqui
sitio
nJu
ne 1
4,
1999
Oct
ober
14,
20
05Ju
ly 2
1,
2009
Janu
ary
1,
2011
Apri
l 5, 2
011
June
28,
20
13Ju
ne 1
8,
2015
Febr
uary
1,
2016
Mar
ch 0
1,
2017
Dec
embe
r 15
, 201
7D
ecem
ber
15, 2
017
Dec
embe
r 15
, 201
7D
ecem
ber
15, 2
017
Dec
embe
r 11
, 201
7
4R
epor
ting
peri
od fo
r the
su
bsid
iary
con
cern
ed, i
f di
ffer
ent f
rom
the
hold
ing
com
pany
’s r
epor
ting
peri
od
3/31
/201
83/
31/2
018
3/31
/201
812
/31/
2017
3/31
/201
812
/31/
2017
3/31
/201
83/
31/2
018
12/3
1/20
1712
/31/
2017
12/3
1/20
173/
31/2
018
12/3
1/20
173/
31/2
018
Rep
ortin
g cu
rren
cyEU
RC
ADU
SDC
ADZA
RC
NY
EUR
EUR
MXN
EUR
EUR
GB
PEU
RIN
R
5Ex
chan
ge r
ate
as o
n th
e la
st
date
of t
he r
elev
ant f
inan
cial
ye
ar in
the
case
of f
orei
gn
subs
idia
ries
80.
81
50.
65
65.
18
50.
65
5.5
8 1
0.31
8
0.81
8
0.81
3
.52
80.
81
80.
81
92.
28
80.
81
1.0
0
6Sh
are
capi
tal
3
-
-
1,6
80
3
11
3
4
-
3
2
-
1
5
7R
eser
ves
& s
urpl
us 1
,410
1
10
28
322
4
8 (1
4) 5
2
9 3
1
51
-
53
9
8To
tal A
sset
s 2
,558
1
84
35
2,4
01
209
9
9
2
24
42
420
1
0 -
1
83
16
9To
tal L
iabi
litie
s 1
,145
7
4 7
3
99
158
1
2 2
1
91
39
266
9
-
1
29
3
10In
vest
men
ts 1
,999
-
-
-
-
-
-
-
1
0 -
-
-
-
11Tu
rnov
er 8
54
1,1
03
68
2,5
34
303
1
0 3
0 6
48
90
365
-
-
1
19
18
12P
rofit
bef
ore
taxa
tion
16
46
3
548
2
4 (2
) 2
1
7 5
7
8 -
-
(1
1) 2
13P
rovi
sion
for t
axat
ion
8
13
-
162
8
-
-
5
2
2
0 -
-
(3
) 1
14P
rofit
aft
er ta
xatio
n 8
3
4 3
3
86
16
(2)
2
12
3
58
-
-
(8)
2
15P
ropo
sed
Div
iden
d -
-
-
-
-
-
-
-
-
-
-
-
-
-
16%
of s
hare
hold
ing
100.
0010
0.00
100.
0010
0.00
74.9
010
0.00
100.
0010
0.00
100.
0010
0.00
100.
0010
0.00
100.
0010
0.00
Not
es:
1.
Lar
sen
& T
oubr
o In
fote
ch G
mbH
has
pai
d di
vide
nd a
mou
ntin
g to
` 9
8.16
Mill
ion
2.
Lar
sen
& T
oubr
o In
fote
ch L
LC h
as p
aid
divi
dend
am
ount
ing
` 89
.04
Mill
ion
3.
L&
T In
fote
ch F
inan
cial
Ser
vice
s Te
chno
logi
es In
c. h
as p
aid
divi
dend
am
ount
ing
to `
402
.14
Mill
ion
4.
The
` M
illio
n fi
gure
s m
enti
oned
abo
ve, a
re b
ased
on
the
exch
ange
rat
es a
s on
Mar
ch 2
8, 2
018

01Corporate Overview
17Statutory Reports
72Financial Statements
69
Annexure G
CONSERVATION OF ENERGY, TECHNOLOGY ABSORPTION, FOREIGN EXCHANGE EARNINGS & OUTGO
A. CONSERVATION OF ENERGY
(i) Steps taken for conservation of energy:
LTI has always shown concern towards the environment and have taken continuous efforts to reduce the environmental impact on operations. We have initiated replacement of old and less efficient equipment with new energy efficient equipment eg., smart UPS, efficient chiller with part load facility. These initiatives will give annual savings of 21.26 L KWH energy units.
We continue to follow other proactive steps to support and promote energy conservation initiatives.
• Creating awareness amongst employees related toenergy conservation through campaigns & events.
• Monitoring of energy consumption throughsmart metering and integration with building management system.
• Best practices and initiatives are shared, adoptedand strengthened across all locations.
(ii) Steps taken by the Company for utilising alternate sources of energy:
Our offshore operations in India are spread across multiple locations. A road map has been chalked out to supplement part of our energy requirement through renewal energy source. As a part of this road map, in initial phase we have signed PPA with Green Energy Wheeling Agencies for two of our offices. The supplementation of Energy will be to the tune of 75% of below agreement values.
Powai : 35-40 Lakh Units through Solar & wind energy.
Bangalore : 40 Lakh Units through Solar energy
(iii) Capitalinvestmentonenergyconservationequipments: `21.4Million
B. TECHNOLOGY ABSORPTION & RESEARCH AND DEVELOPMENT
In a rapidly changing global landscape where disruption is the new normal, the Company is leveraging technology to create sustainable advantage not only for itself but more importantly, for its clients. As Industry 4.0, slowly but surely assumes shape, exponential technologies are turning business models upside-down. Enterprises, the world over are looking towards partners who not only understand domain but also have the technology expertise in helping them navigate through these challenging times. While the Company has the real-world expertise in diverse domains, it has also invested consciously towards building expertise in exponential technologies namely in the areas of Analytics, Internet-of-Things
(‘IoT’), Artificial Intelligence (‘AI’), Automation and so on. These are further enumerated below.
Cloud
Cloud is one of the pillars to bring disruptive technologies to change the way businesses are done in this Digital economy. The Company has incubated a dedicated Cloud practice to help customers embrace various Cloud enabled technologies to bring business disruption. LTI Cloud practices focusses on Public and Private Cloud technologies along with DevOps. Our focus area’s are Cloud native development, Cloud migration, Data Center modernization and highly efficient and automated operations. The Company has centered the efforts towards creating a pool of certified resources and develop differentiated IP’s and Solutions to help the customers adopt cloud faster, cheaper and efficiently.
Benefits Realized -
With the usage of Cloud Enablement IP’s the Company is now able to deliver up to 50% faster time to value for Cloud adoption programs.
Utilizing the Converged Operations and Intelligent Operations center for Cloud, the Company has reduced the admin ratios by up to 40%.
SpecificR&DArea’s-
1. Cloud Readiness Assessment Industrialization through RapidAdopt and PaaSify
2. DevOps enablement Suite for end to end DevOps lifecycle management
3. Cloud Operations Cockpit to centralize and automate entire Cloud Operations management
Imported Technology - Usage of platforms from AWS, Azure and OpenShift to enhance and build our solutions and IP’s.
Analytics
The Company is focused on creating possibilities and delivering business outcomes through its mature offerings for Advanced Analytics, Data Science, Data Visualization, Big Data, EPM and Information Management. It offers a wide range of services with respect to Analytics-as-a-Service, Data-as-a-Service, Big Data and Advanced Analytics solutions across various verticals, addressing their business requirements.
LTI’s NLP (Natural Language Processing) is a key technology enabling consumer analytics space. The Company has formed a

Annual Report 2017-1870
strategic partnership with a startup specializing in virtual data scientists to jointly go to market to deliver personal assistants for business users.
LTI is focused on training 3000+ data analytics professionals on next generation cloud based AI as a service platforms and offerings like GCP, AWS, Azure.
Benefits derived:
Analytics-as-a-Service and Data-as-a-Service offerings, driving transformational business outcomes at speed and scale
Accelerated Data-to-Insight-to-Action cycle by leveraging pre-built solutions and accelerators
Faster data ingestion and orchestration due to abstraction of complexity in the data layer
Cloud-native usage, deployment and monitoring, ensuring lower capex and pay-per-use service delivery
Cognitive/ AI
Driving enterprise-wide digital transformation initiatives to harness organizational efficiency and enhance customer experience requires strategic investments in solutions that leverage AI and cognitive computing. The Company is working with dedicated efforts & investments to devise ‘AI bots’ that intelligently automate repetitive workflows for straight-through processing, boosts productivity and optimizes operational costs. The Company’s Mosaic AI platform is a comprehensive AI-based solution suite which helps businesses accelerate operational digitization. The Company is working on Deep Learning and Cognitive Computing to extract value from Natural Language Processing, with audio-visual integration, thus catalysing Intuitive User Engagement.
IoT
The Company has a dedicated IoT practice, which enables clients to become more competitive in the new age economy by connecting the physical world with digital possibilities. Encompassing everything, right from more smart sensors to connected machinery, communication to real-time analytics & visualizations, the service offerings are oriented towards enhancing operations & production. The I2D Framework of Imagine, Innovate & Disrupt, helps to expand the sphere of innovation beyond enhanced performance & cost efficiency, to a paradigm of a connected and smarter organization. The Company’s top service offerings include: Asset Performance Management, Smart Manufacturing, Intelligent Supply Chain, Remote Operations Center and Industrial Cyber Security. The Company is involved in crucial solution integration and value added reselling partnerships with industry-leading IoT platforms such as GE Predix, etc. These investments are already starting to yield results in client engagements and analyst interactions.
Automation
The concept of automation has evolved from deterministic automation where repetitive processes were automated to smart automation that employs artificial cognition and heuristics. Clients are moving beyond mere process automation and implementing cutting-edge tools such as artificial neural networks, distributed control systems, human machine interfaces and robotics. The Company aims to firstly integrate automation tools in existing business workflows by leveraging process consulting capabilities, proven technical expertise and develop strategies based on DevOps and lean methodologies.
The strategic investment in this area includes a Mosaic automation platform which covers all aspects of automation, including robotic process automation, machine learning, software-defined everything, design thinking and includes a reusable asset library that fast-tracks implementation. Using comprehensive automation framework and process reengineering toolkit, companies can effectively drive strategic initiatives across business transformation, cost reduction and service experience enhancement.
The Company undertook an enterprise-wide automation initiative to improve Service Delivery efficiency using the Mosaic Framework. The initiative yielded tangible service cost reduction benefits in 200+ chosen engagements. The Company has launched 5 Mosaic automation solutions, targeting IT service delivery automation that enabled multi-year AMS/ IMS deal wins throughout the year.
Block Chain
The Company has a mature Blockchain practice and is working with global clients in BFS, Insurance, Energy & Utilities, Media and Entertainment and Manufacturing to build industry solutions to deliver exponential operational efficiencies. The Company has built 12 solutions on Blockchain technology in various areas like Trade Finance, Travel Insurance and Supply Chain on various platforms like Ethereum, Hyperledger and Corda.
Total Expenditure on R&D:(` Million)
S. N. Expenditure on R&D Amount1 Capital 332 Recurring 269
Total R&D expenditure (A+B) 302
C. FOREIGN EXCHANGE EARNINGS AND OUTGO
The Company exports IT professional services mainly to North America, Europe, South Africa, Middle East, Japan, Australia and Singapore.
(` Million)
Particulars 2017-18 2016-17Foreign Exchange Earned 64,002 57,498Foreign Exchange Used 32,231 27,708

01Corporate Overview
17Statutory Reports
72Financial Statements
71
Annexure H
ToThe Board of DirectorsLarsen & Toubro Infotech Limited
1. We have examined the Employee Stock Ownership Scheme 2000 (referred to as the “ESOS-2000”), Employees Stock Ownership Scheme 2006,US Stock Option Sub-Plan (referred to as “ESOS-2006”) and Employee Stock Option Scheme 2015 (referred to as the “ESOS-2015”) of Larsen & Toubro Infotech Limited (“the Company”) having its registered office at L&T House, Ballard Estate, Mumbai-400001.
For the purpose of examination, we have relied on the audited financial statements, books of account and other records of the Company for the period of twelve months from April 1, 2017 to March 31, 2018.
2. We conducted our examination in accordance with Guidance Note on Audit Reports and Certificates for Special Purpose, issued by the Institute of Chartered Accountants of India.
3. Based on our examination, as above, and the information and explanation given to us by the management of the Company, we certify that:
(i) the ESOS-2000 have been implemented in accordance with the Securities and Exchange Board of India (Share Based Employee Benefits) Regulations, 2014 (as amended) from time to time in terms of the special resolution passed in the General Meeting of the Company held on March 13th, 2000 and December 16th, 2005.
(ii) the ESOS - 2006 have been approved in accordance with the Securities and Exchange Board of India (Share Based Employee Benefits) Regulations, 2014 (as amended) from time to time as per the special resolution passed in General Meeting held on December 7th, 2006.
(iii) the ESOS - 2015 have been approved in accordance with the Securities and Exchange Board of India (Share Based Employee Benefits) Regulations, 2014 (as amended) from time to time as per the special resolution passed in General Meeting held on September 14th, 2015.
4. This certificate is issued at the request of the management of the Company solely for the purpose of the submission to the shareholders of the Company at the Annual General Meeting, and should not be used by any other person or for any other purpose.
For B. K. Khare & Co.,Chartered Accountants
Firm Registration No. 105102W
Ravi KapoorPartner
Membership No.040404 Place: MumbaiDate: May 23, 2018

Annual Report 2017-1872
To the Members of Larsen & Toubro Infotech Limited
Report on the Standalone Financial Statements
1. We have audited the accompanying standalone financial statements of Larsen & Toubro Infotech Limited (“the Company”), comprising the balance sheet as at 31 March 2018, and the related statements of profit and loss including Other Comprehensive Income, standalone cash flow statement and the statement of changes in Equity for the year then ended, and a summary of the significant accounting policies and other explanatory information.
Management’s Responsibility for the Standalone Financial Statements
2. The Company’s Board of Directors is responsible for the preparation of these standalone financial statements in terms of the requirements of the Section 134(5) of Companies Act, 2013 (“the Act”) that give a true and fair view of the financial position, financial performance including other comprehensive income, cash flows and changes in equity of the Company in accordance with the accounting principles generally accepted in India, including the Indian Accounting Standards (Ind AS) prescribed under Section 133 of the Act, read with relevant rule issues thereunder. This responsibility also includes maintenance of adequate accounting records in accordance with the provisions of the Act for safeguarding the assets of the Company and for preventing and detecting frauds and other irregularities; the selection and application of appropriate accounting policies; making judgements and estimates that are reasonable and prudent; and the design, implementation and maintenance of adequate internal financial controls, that were operating effectively for ensuring the accuracy and completeness of the accounting records, relevant to the preparation and presentation of the financial statements that give a true and fair view and are free from material misstatement, whether due to fraud or error.
Auditor’s Responsibility
3. Our responsibility is to express an opinion on these standalone financial statements based on our audit.
4. While conducting our audit, we have taken into account the provisions of the Act, the accounting and auditing standards and matters which are required to be included in the audit report under the provisions of the Act and the Rules made thereunder.
5. We conducted our audit in accordance with the Standards on Auditing specified under Section 143(10) of the Act. Those Standards require that we comply with ethical requirements and plan and perform the audit to obtain reasonable assurance about whether the financial statements are free from material misstatement.
Independent Auditor’s Report6. An audit involves performing procedures to obtain audit evidence
about the amounts and the disclosures in the standalone financial statements. The procedures selected depend on the auditor’s judgment, including the assessment of the risks of material misstatement of the standalone financial statements, whether due to fraud or error. In making those risk assessments, the auditor considers internal financial control relevant to the Company’s preparation of the standalone financial statements that give a true and fair view in order to design audit procedures that are appropriate in the circumstances. An audit also includes evaluating the appropriateness of the accounting policies used and the reasonableness of the accounting estimates made by the Company’s Board of Directors, as well as evaluating the overall presentation of the standalone financial statements.
7. We believe that the audit evidence we obtained is sufficient and appropriate to provide a basis for our audit opinion on the standalone financial statements.
Opinion
8. In our opinion and to the best of our information and according to the explanations given to us, the aforesaid standalone financial statements give the information required by the Act in the manner so required and give a true and fair view in conformity with the accounting principles generally accepted in India of the state of affairs of the Company as at 31 March 2018, and its profit, total comprehensive income, standalone cash flows and the changes in equity for the year ended on that date.
Report on Other Legal and Regulatory Requirements
9. As required by the Companies (Auditor’s Report) Order, 2016, issued by the Central Government of India in terms of sub-section (11) of section 143 of the Act (the “Order”), and on the basis of such checks of the books and records of the Company as we considered appropriate and according to the information and explanations given to us, we give in the Annexure I, a statement on the matters specified in paragraphs 3 and 4 of the Order.
10. As required by Section 143(3) of the Act, we report that:
a. we have sought and obtained all the information and explanations which to the best of our knowledge and belief were necessary for the purposes of our audit;
b. in our opinion proper books of account as required by law relating to preparation of the standalone financial statements have been kept by the Company so far as it appears from our examination of those books;
c. the Balance Sheet, the Statement of Profit and Loss including other comprehensive income, the Standalone Cash Flow statement and the Statement of Changes in

17Statutory Reports
72Financial Statements
01Corporate Overview
73
Equity dealt with by this Report are in agreement with the relevant books of account maintained for the purpose of preparation of the standalone financial statements;
d. In our opinion, the aforesaid standalone financial statements comply with the Indian Accounting Standards (Ind AS) specified under Section 133 of the Act, read with relevant rule issues thereunder.
e. on the basis of written representations received from the directors as on 31 March 2018 taken on record by the Board of Directors, none of the directors is disqualified as on 31 March 2018, from being appointed as a director in terms of Section 164(2) of the Act.
f. With respect to the adequacy of the internal financial controls over financial reporting of the Company and the operating effectiveness of such controls, refer our separate report in Annexure II. Our report expresses an unmodified opinion on the adequacy and operating effectiveness of the Company’s internal financial controls over financial reporting.
g. With respect to the other matters to be included in the Auditor’s Report in accordance with Rule 11 of the Companies (Audit and Auditors) Rules, 2014 (as amended),
in our opinion and to the best of our information and according to the explanations given to us:
i. The Company has disclosed the impact of pending litigations on the financial position in its standalone financial statements – Refer to Note 33 to the standalone financial statements
ii. The Company did not have any long-term contracts for which there were any material foreseeable losses. Provision has been made in the standalone financial statements as required under the applicable law or accounting standards, for material foreseeable losses, if any, on derivative contracts.
iii. There were no amounts required to be transferred, to the Investor Education and Protection Fund by the Company.
For B. K. Khare & Co.Chartered Accountants
Firm’s Registration Number 105102W
Ravi KapoorPartner
Mumbai, May 23, 2018 Membership Number: 040404

Annual Report 2017-1874
1. (a) The Company has maintained proper records showing full
particulars, including quantitative details and situation of
fixed assets.
(b) The Company has a rotational program for verification
of its fixed assets over a period of three years, which in
our opinion, is reasonable having regard to the size of the
Company and the nature of its assets. A portion of the fixed
assets has been physically verified by the management
of the Company during the year in accordance with the
above-mentioned program. No material discrepancies
were identified on such verification and have been properly
accounted for in the books of account.
(c) According to the information and explanations given to
us and to the best of our knowledge and belief, the title
deeds of the immovable properties are held in the name
of the Company.
2. The Company does not hold any physical inventories. Accordingly,
paragraph 3(ii) of the Order is not applicable to the Company.
3. According to the information and explanations given to us, the
Company has not granted any loans, secured or unsecured, to
companies, firms, limited liability partnerships or other parties
covered in the register maintained under section 189 of the Act.
Accordingly, paragraphs 3(iii) (a), (b) and (c) of the Order are not
applicable to the Company.
4. In our opinion and according to the information and explanations
given to us, the Company has complied with the provisions
of Section 185 and 186 of the Act, with respect to loans and
investments made.
Annexure I to the Independent Auditor’s Report(Referred to in paragraph 9 of our report of even date on the standalone financial statements of Larsen & Toubro Infotech Limited for the year ended 31 March 2018)
5. In our opinion and according to the information and explanations given to us, the Company has not accepted any deposits to which the directives of the Reserve Bank of India and the provisions of Sections 73-76 of the Act and the rules framed there under to the extent modified apply. Accordingly, the provisions of clause 3(v) of the Order are not applicable to the Company and no order has been passed by Company Law Board or National Company Law Tribunal or Reserve Bank of India or any court or any other tribunal.
6. According to the information and explanations given to us, the central government has not prescribed the maintenance of cost records under section 148(1) of the Act for any of the services rendered by the Company. Accordingly, paragraph 3(vi) of the Order is not applicable to the Company.
7. (a) According to the records of the Company examined by us and information and explanations given to us, the Company is generally regular in depositing with the appropriate authorities undisputed statutory dues including Goods and Service Tax, Provident Fund, Employees’ State Insurance, Income Tax, Sales Tax, Excise Duty, Service Tax, Customs Duty, Value Added Tax, cess and other statutory dues applicable to it. There are no undisputed amounts in respect of the aforesaid items which are unpaid at the balance sheet date for a period of more than 6 months from the date they became due.
(b) According to the information and explanations given to us, dues of goods and service tax, income-tax, sales tax, service tax, excise duty, customs duty and value added tax which have not been deposited on account of any dispute are as follows:
Name of Statute Nature of dues ` Million* Period to which amount relates
Forum where pending
Central Sales Tax and local sales tax Acts , Service tax
Software exports and service income revenue considered as domestic sales and other classification disputes
11.6 FY 2002-03 Maharashtra Sales Tax Tribunal, Mumbai
Service tax demand under reverse charge mechanism on the Agency commission paid in foreign currency
1.68 FY 2008-09 to 2013-14 CESTAT
Income-tax Act, 1961 Disallowance of exemption under section 10A 84.26 FY 2008-09 (AY 2009-10) ITATIncome Tax Act, 1961 Disallowance of exemption under section 10A 0.18 FY 2010-11 (AY 2011-12) Commissioner (Appeals)
Penalty u/s 271 (1)( c) 131.38 FY 2006-07(AY 2007-08)
Disputes regarding calculation of notional interest on transactions with related party and disallowance of FTC
1.21 FY 2010-11(AY 2011-12)

17Statutory Reports
72Financial Statements
01Corporate Overview
75
Name of Statute Nature of dues ` Million* Period to which amount relates
Forum where pending
Dispute regarding Disallowance of claim u/s 10A on the ground that it is allowable only for 10 consecutive Assessment years
2.35 FY 2010-11(AY 2011-12)
Disputes regarding short fall in tax deducted at source
5.14 FY 2010-11 and 2011-12 (AY 2011-12 and 2012-13)
Assessing Officer (DCIT(TDS))
Disputes regarding exclusion of interest income from section 10A calculation, addition of notional interest on transactions with related party and disallowance of FTC
2.08 FY 2008-09 (AY 2009-10)
Assessing Officer (Assistant Commissioner Of Income Tax)
Disallowance of ESOP discount 34.2 FY 2008-09 and FY 2010-11 (AY 2009-10 and AY 2011-12)
ITAT
*Net of pre-deposit paid in getting the stay / appeal admitted
8. Based on the records examined by us and according to the information and explanations given to us, the Company has not defaulted in repayment of dues to a financial institution and bank. The Company has not taken any loans or borrowings from government and has not issued any debentures.
9. The Company did not raise any money by way of initial public offer, further public offer (including debt instruments) or term loan during the year. Accordingly, paragraph 3(ix) of the Order is not applicable to the Company.
10. Based on the records examined by us and according to the information and explanations given to us, there were no material frauds by the Company or on the Company by its officers or employees noticed or reported during the year.
11. Based on the records examined by us and according to the information and explanations given to us, the Company has paid/provided managerial remuneration in accordance with the requisite approvals mandated by the provisions of Section 197 read with Schedule V to the Companies Act, 2013.
12. In our opinion and according to the information and explanations given to us, the Company is not a Nidhi Company and hence paragraph 3(xii) of the Order is not applicable to the Company.
13. Based on the records examined by us and according to the information and explanations given to us, transactions with related parties are in compliance with sections 177 and 188
of the Act where applicable and details of such transactions have been disclosed in the standalone financial statements as required by the applicable accounting standards.
14. Based on the records examined by us and according to the information and explanations given to us, the Company has not made any preferential allotment or private placement of shares or partly convertible debentures during the year. Accordingly, paragraph 3(xiv) of the Order is not applicable to the company.
15. Based on the records examined by us and according to the information and explanations given to us, the Company has not entered into non-cash transactions with directors or persons connected with them. Accordingly, paragraph 3(xv) of the Order is not applicable.
16. In our opinion and according to the information and explanations given to us, the Company is not required to be registered under section 45-IA of the Reserve Bank of India Act, 1934.
For B. K. Khare & Co.Chartered Accountants
Firm’s Registration Number 105102W
Ravi KapoorPartner
Mumbai, May 23, 2018 Membership Number: 040404

Annual Report 2017-1876
Report on the Internal Financial Controls under Clause (i) of Sub-
section 3 of Section 143 of the Companies Act, 2013 (“the Act”)
We have audited the internal financial controls over financial
reporting of Larsen & Toubro Infotech Limited (“the Company”) as of
31 March 2018 in conjunction with our audit of the standalone financial
statements of the Company for the year ended 31 March 2018.
Management’s Responsibility for Internal Financial Controls
The Company’s management is responsible for establishing and
maintaining internal financial controls based on the internal
control over financial reporting criteria established by the
Company considering the essential components of internal control
stated in the Guidance Note on Audit of Internal Financial Controls
Over Financial Reporting issued by the Institute of Chartered
Accountants of India (“ICAI”). These responsibilities include the
design, implementation and maintenance of adequate internal
financial controls that were operating effectively for ensuring the
orderly and efficient conduct of its business, including adherence
to the respective company’s policies, the safeguarding of its
assets, the prevention and detection of frauds and errors, the
accuracy and completeness of the accounting records, and the
timely preparation of reliable financial information, as required
under the Companies Act, 2013 (“the Act”).
Auditors’ Responsibility
Our responsibility is to express an opinion on the Company’s internal
financial controls over financial reporting based on our audit. We
conducted our audit in accordance with the Guidance Note on Audit of
Internal Financial Controls Over Financial Reporting (the “Guidance
Note”) and the Standards on Auditing, issued by ICAI and deemed to
be prescribed under section 143(10) of the Companies Act, 2013, to
the extent applicable to an audit of internal financial controls, both
applicable to an audit of internal financial controls and, both issued by
the Institute of Chartered Accountants of India. Those Standards and
the Guidance Note require that we comply with ethical requirements
and plan and perform the audit to obtain reasonable assurance about
whether adequate internal financial controls over financial reporting
was established and maintained and if such controls operated
effectively in all material respects.
Our audit involves performing procedures to obtain audit evidence
about the adequacy of the internal financial controls system over
Annexure II to the Independent Auditor’s ReportReferred to in paragraph 10(f) of our report of even date on the standalone financial statements of Larsen & Toubro Infotech Limited for the year ended 31 March 2018
financial reporting and their operating effectiveness. Our audit of
internal financial controls over financial reporting included obtaining
an understanding of internal financial controls over financial
reporting, assessing the risk that a material weakness exists, and
testing and evaluating the design and operating effectiveness of
internal control based on the assessed risk. The procedures selected
depend on the auditor’s judgement, including the assessment of the
risks of material misstatement of the financial statements, whether
due to fraud or error.
We believe that the audit evidence we have obtained is sufficient and
appropriate to provide a basis for our audit opinion on the Company’s
internal financial controls system over financial reporting.
Meaning of Internal Financial Controls Over Financial Reporting
A company’s internal financial control over financial reporting is
a process designed to provide reasonable assurance regarding
the reliability of financial reporting and the preparation of financial
statements for external purposes in accordance with generally
accepted accounting principles. A company’s internal financial control
over financial reporting includes those policies and procedures that
(1) pertain to the maintenance of records that, in reasonable detail,
accurately and fairly reflect the transactions and dispositions of
the assets of the company; (2) provide reasonable assurance that
transactions are recorded as necessary to permit preparation of
financial statements in accordance with generally accepted accounting
principles, and that receipts and expenditures of the company are
being made only in accordance with authorisations of management
and directors of the company; and (3) provide reasonable assurance
regarding prevention or timely detection of unauthorised acquisition,
use, or disposition of the company’s assets that could have a material
effect on the financial statements.
Inherent Limitations of Internal Financial Controls Over Financial
Reporting
Because of the inherent limitations of internal financial controls over
financial reporting, including the possibility of collusion or improper
management override of controls, material misstatements due to
error or fraud may occur and not be detected. Also, projections of any
evaluation of the internal financial controls over financial reporting to
future periods are subject to the risk that the internal financial control
over financial reporting may become inadequate because of changes
17Statutory Reports
72Financial Statements
01Corporate Overview
77
in conditions, or that the degree of compliance with the policies or
procedures may deteriorate.
Opinion
In our opinion, the Company has, in all material respects, an adequate
internal financial controls system over financial reporting and such
internal financial controls over financial reporting were operating
effectively as at 31 March 2018, based on the internal control over
financial reporting criteria established by the Company considering
the essential components of internal control stated in the Guidance
Note on Audit of Internal Financial Controls Over Financial Reporting
issued by the Institute of Chartered Accountants of India.
For B. K. Khare & Co.Chartered Accountants
Firm’s Registration Number 105102W
Ravi KapoorPartner
Mumbai, May 23, 2018 Membership Number: 040404

Annual Report 2017-1878
(` in Mn)
Particulars Note
No.
As at
31-03-2018
As at
31-03-2017 ASSETSNon-current assets (a) Property, plant and equipment 4 2,412 2,477 (b) Capital work-in-progress 4 10 9 (c) Other intangible assets 4 315 382 (d) Intangible assets under development 4 58 3 (e) Financial assets (i) Investments 5 2,959 2,905 (ii) Loans 6 384 311 (iii) Other financial assets 7 721 1,866 (f) Deferred tax assets (net) 8 1,919 1,439 (g) Income tax assets (net) 880 717 (h) Other non-current assets 9 1,020 1,273 Total Non-Current Assets 10,678 11,382 Current assets (a) Financial assets (i) Investments 10 12,644 9,406 (ii) Trade receivable 11 13,275 11,226 (iii) Unbilled revenue 8,191 4,668 (iv) Cash and cash equivalents 12 2,479 1,872 (v) Other bank balances 13 19 34 (vi) Loans 14 235 154 (vii) Other financial assets 15 1,966 2,512 (b) Other current assets 16 1,029 875 Total Current Assets 39,838 30,747 TOTAL ASSETS 50,516 42,129 EQUITY AND LIABILITIESEquity (a) Equity share capital 17 172 171 (b) Other equity (i) Other reserves 18 8,000 8,608 (ii) Retained earnings 18 29,014 20,990 (ii) Share application money pending allotment 18 0 0 Total Equity 37,186 29,769 LiabilitiesNon-current liabilities (a) Financial liabilities 19 204 - (b) Provisions 20 280 285 Total Non-Current Liabilities 484 285 Current liabilities (a) Financial liabilities (i) Trade payables 21 3,708 3,354 (ii) Other financial liabilities 22 5,831 5,925 (b) Other current liabilities 23 1,411 1,102 (c) Provisions 24 1,761 1,576 (d) Current income tax liabilities (net) 135 118 Total Current Liabilities 12,846 12,075 TOTAL EQUITY AND LIABILITIES 50,516 42,129 Significant accounting policies 2Other notes on accounts 33 to 49
Balance Sheetas at 31 March 2018
As per our report attached
B. K. Khare & Co Sanjay Jalona Aftab Zaid UllahChartered Accountants Chief Executive Officer & Managing Director Chief Operating Officer & Whole Time DirectorFirm's Registration No. 105102W DIN : 07256786 DIN : 05165334
Ravi Kapoor Ashok Kumar Sonthalia Manoj KoulPartner Chief Financial Officer Company Secretary & Compliance OfficerMembership No: 040404
MumbaiMay 23, 2018

17Statutory Reports
72Financial Statements
01Corporate Overview
79
(` in Mn)
Particulars Note No.
April 17 - March 18 April 16 - March 17
INCOME:
Revenue from operations 25 69,064 61,829
Other income 26 5,254 1,983
Total income 74,318 63,812
EXPENSES:
Employee benefit expense 27 41,348 35,975
Operating expenses 28 16,286 14,141
Finance costs 29 138 32
Depreciation and amortisation 4 913 1,089
Other expenses 30 949 733
Total expenses 59,634 51,970
Profit before tax 14,684 11,842
Tax expense
Current tax (net) 31 3,330 2,934
Deferred tax 31 (247) (468)
3,083 2,466
NET PROFIT FOR THE YEAR 11,601 9,376
OTHER COMPREHENSIVE INCOME 32 (994) 2,159
TOTAL COMPREHENSIVE INCOME FOR THE YEAR 10,607 11,535
Basic
Basic earning per equity share 67.74 55.11
Diluted
Diluted earning per equity share 66.23 53.89
Significant accounting policies 2
Other notes on accounts 33 to 49
Statement of Profit and Loss for the year ended 31 March 2018
As per our report attached
B. K. Khare & Co Sanjay Jalona Aftab Zaid UllahChartered Accountants Chief Executive Officer & Managing Director Chief Operating Officer & Whole Time DirectorFirm's Registration No. 105102W DIN : 07256786 DIN : 05165334
Ravi Kapoor Ashok Kumar Sonthalia Manoj KoulPartner Chief Financial Officer Company Secretary & Compliance OfficerMembership No: 040404
MumbaiMay 23, 2018

Annual Report 2017-1880
(` in Mn)
Particulars April 17 - March 18 April 16 - March 17
A. CASH FLOW FROM OPERATING ACTIVITIES
Net profit after tax 11,601 9,376
Adjustments to reconcile net profit to net cash provided by operating activities:
Depreciation and amortisation 913 1,089
Income tax expense 3,083 2,466
Expense recognised in respect of equity settled stock option 400 428
Realised gain from current investment in mutual funds (516) (194)
Unrealised gain from current investment in mutual funds (222) -
Gain on buyback of shares by subsidiary (388) -
Interest received (7) (16)
Interest expense 138 32
Unrealised foreign exchange loss/(gain),net (65) 270
Dividend received from subsidiaries (579) (141)
Net loss/(gain) on sale of property, plant and equipment 8 12
Operating cash before working capital changes 14,366 13,322
Changes in working capital
(Increase)/decrease in trade receivables and unbilled revenue (5,300) (1,375)
(Increase)/decrease in other receivables (205) 107
Increase/(decrease) in trade & other payables 1,537 825
(Increase)/decrease in working capital (3,968) (443)
Cash generated from operations 10,398 12,879
Income taxes paid (3,289) (2,407)
Net cash generated from/(used in) operating activities 7,109 10,472
B. CASH FLOW FROM INVESTING ACTIVITIES
Purchase of fixed assets (878) (619)
Sale of fixed assets 32 41
(Purchase)/sale of current investments (3,016) (8,978)
Payment towards business acquisition (125) (71)
Increase in non-current investment (1) -
Dividend received from subsidiaries 579 141
Realised gain from current investment in mutual funds 516 194
Interest received 7 16
Gain on buyback of shares by subsidiary 388 -
Net cash (used in)/generated from investing activities (2,498) (9,276)
Standalone Cash Flow Statementfor the year ended 31 March 2018

17Statutory Reports
72Financial Statements
01Corporate Overview
81
(` in Mn)
Particulars April 17 - March 18 April 16 - March 17
C. CASH FLOW FROM FINANCING ACTIVITIES
Proceeds from issue of share capital 3 4
Proceeds from/(repayment) of borrowings - (546)
Deposit under Credit support agreement received/(paid) (407) 2,025
Interest paid (138) (32)
Dividend paid (3,034) (1,610)
Tax on dividend paid (500) (278)
Net cash (used in)/generated from financing activities (4,076) (437)
Net increase/(decrease) in cash and cash equivalents 535 759
Cash and cash equivalents at beginning of the period 1,906 1,222
Effect of exchange differences on translation of foreign currency cash and cash equivalents
35 (75)
Increase in Cash and Cash Equivalents on Amalgamation 22 0
Cash and cash equivalents at end of the period 2,498 1,906
As per our report attached
B. K. Khare & Co Sanjay Jalona Aftab Zaid UllahChartered Accountants Chief Executive Officer & Managing Director Chief Operating Officer & Whole Time DirectorFirm's Registration No. 105102W DIN : 07256786 DIN : 05165334
Ravi Kapoor Ashok Kumar Sonthalia Manoj KoulPartner Chief Financial Officer Company Secretary & Compliance OfficerMembership No: 040404
MumbaiMay 23, 2018

Annual Report 2017-1882
Statement of Changes in Equityfor the year ended 31 March 2018
(` in Mn)
Particulars Share Capital
Share capital
pending allotment
General Reserve
Share Premium
Retained Earnings
Employee Stock option outstanding
Deferred Employee
Compensation Expense
Capital Reserve
Other Components
of Equity
Total Equity
Hedging Reserve
Balance as on April 1, 2017 171 0 3,463 1,498 20,990 1,511 (945) 0 3,081 29,769
Employee Stock Compensation Expense
- - 2 - - 83 (83) - - 2
On account of amalgamation
- - (60) - - - - - - (60)
Net Profit for the year - - - - 11,601 - - - - 11,601
Other Comprehensive Income
- - - - 62 - - - (1,056) (994)
Dividends (Including DDT) - - - - (3,639) - - - - (3,639)
Other changes/ Trf to general reserve.
1 (0) 321 - (377) 562 - - 507
Balance as on 31 March 2018
172 0 3,405 1,819 29,014 1,217 (466) 0 2,025 37,186
for the year ended 31 March 2017(` in Mn)
Particulars Share Capital
Share capital
pending allotment
General Reserve
Share Premium
Retained Earnings
Employee Stock option outstanding
Deferred Employee
Compensation Expense
Capital Reserve
Other Components
of Equity
Total Equity
Hedging Reserve
Balance as on April 1, 2016 170 - 3,772 1,473 13,272 77 - 0 877 19,641
Changes in equity for the year ended on 31 March 2017
1 1
Employee Stock Compensation Expense
8 1,492 (1,492) 8
On account of amalgamation
365 365
Net Profit for the year - 9,376 9,376
Other Comprehensive Income
(45) 2,204 2,159
Dividends (Including DDT) (1,978) (1,978)
Other changes/ Trf to general reserve.
0 (317) 25 (58) 547 197
Balance as on 31 March 2017
171 0 3,463 1,498 20,990 1,511 (945) 0 3,081 29,769
As per our report attached
B. K. Khare & Co Sanjay Jalona Aftab Zaid UllahChartered Accountants Chief Executive Officer & Managing Director Chief Operating Officer & Whole Time DirectorFirm's Registration No. 105102W DIN : 07256786 DIN : 05165334
Ravi Kapoor Ashok Kumar Sonthalia Manoj KoulPartner Chief Financial Officer Company Secretary & Compliance OfficerMembership No: 040404
MumbaiMay 23, 2018

17Statutory Reports
72Financial Statements
01Corporate Overview
83
Notes forming part of accounts1. COMPANY OVERVIEW
Larsen & Toubro Infotech Limited (‘the Company’) offers extensive range of IT services like application development, maintenance and outsourcing, enterprise solutions, infrastructure management services, testing, digital solutions and platform based solutions to the clients in diverse industries.
The Company is a public limited company incorporated and domiciled in India and has its registered office at L&T House, Ballard Estate, Mumbai, Maharashtra, India. The company’s equity shares are listed on the National Stock Exchange Limited and BSE Limited in India.
2. SIGNIFICANT ACCOUNTING POLICIES
a. Basis of accounting
Accounting policies have been consistently applied except where a newly issued accounting standard is initially adopted or a revision to an existing accounting standard requires a change in the accounting policy hitherto in use. Further the guidance notes or announcements issued by the Institute of Chartered Accountants of India (ICAI) are also considered wherever applicable.
Preparation of financial statements in conformity with Accounting Standards requires management of the Company to make estimates and assumptions that affect the income and expense reported for the period and assets, liabilities and disclosures reported as of the date of the financial statements. Examples of such estimates include useful lives of tangible and intangible assets, provision for doubtful debts, future obligations in respect of retirement benefit plans, etc. Actual results could vary from these estimates.
The financial statements have been prepared in accordance with Indian Accounting Standards (Ind AS) as prescribed under section 133 of the Companies Act, 2013, read with rule 3 of the Companies (Indian Accounting Standards) Rules, 2015, relevant amendment rules issued thereafter and guidelines issued by the Securities and Exchange Board of India (SEBI).
Amounts in the financial statements are presented in Indian Rupees in millions [10 lakhs = 1 million] as permitted by Schedule III to the Companies Act, 2013. Per share data are presented in Indian Rupees.
b. Presentation of financial statements
The statement of financial position (including statement of changes in equity) and the statement of profit and loss are prepared and presented in the format prescribed in Schedule III to the Companies Act, 2013. The cash flow statement has been prepared and presented as per the requirements of Ind
AS 7 “Cash Flow Statements”. The disclosure requirements with respect to items in the balance sheet and statement of profit and loss, as prescribed in Schedule III to the Act, are presented by way of notes forming part of accounts along with the other notes required to be disclosed under the notified Accounting Standards.
c. Operating cycle for current and non-current classification
The company identifies asset/liabilities as current if the same are receivable/payable within twelve months else the same are considered as non-current.
d. Revenue recognition
Revenue is recognised only when evidence of an arrangement is obtained and the other criteria to support revenue recognition are met, including the price is fixed or determinable, services have been rendered and collectability of the resulting receivables is reasonably assured. Revenue is measured at the fair value of the consideration received or receivable and is reduced for estimated rebates and other similar allowances.
Revenue from contracts priced on time and material basis is recognized when services are rendered and related costs are incurred.
Revenue from services performed on fixed-price basis is recognized over the life of contract using the proportionate completion method.
Revenue from sale of products and licenses is recognized upon delivery when all risks and rewards are transferred.
Unbilled revenue represents value of services performed in accordance with the contract terms but not billed.
e. Other income
I) Interest income is recognized using the effective interest method.
II) Dividend income is accounted in the period in which the right to receive the same is established.
III) Other items of income are accounted as and when the right to receive arises.
f. Employee benefits
I) Short term employee benefits
All employee benefits falling due wholly within twelve months of rendering the service are classified as short term employee benefits. The benefits like salaries, wages, and short term compensated absences and performance incentives are recognized in the period in which the employee renders the related service.

Annual Report 2017-1884
Notes forming part of accounts
II) Post-employment benefits
i) Defined contribution plan:
The Company’s superannuation fund and state governed provident fund scheme are classified as defined contribution plans. The contribution paid / payable under the schemes is recognized during the period in which the employee renders the related service.
ii) Defined benefit plans:
The provident fund scheme managed by trust, employees gratuity fund scheme managed by Life Insurance Corporation of India and post-retirement medical benefit scheme are the Company’s defined benefit plans. Wherever applicable, the present value of the obligation under such defined benefit plans is determined based on actuarial valuation using the Projected Unit Credit Method, which recognizes each period of service as giving rise to additional unit of employee benefit entitlement and measures each unit separately to build up the final obligation.
The obligation is measured at the present value of the estimated future cash-flows. The discount rates used for determining the present value of the obligation under defined benefit plans is based on the market yields on government bonds as at the balance sheet date, having maturity periods approximating to the terms of related obligations. Actuarial gains and losses through re-measurement of the defined benefit liability/ (asset) are recognized in other comprehensive income. The actual return of portfolio of plan assets, in excess of yields computed by applying the discount rate used to measure the defined benefit obligation are recognized in other comprehensive income. The effect of any plan amendments are recognized in statement of profit and loss.
Gains or losses on the curtailment or settlement of any defined benefit plan are recognized when the curtailment or settlement occurs. Past service cost resulting from a plan amendment or curtailment are recognized immediately in the statement of profit and loss.
(iii) Long term employee benefits:
The obligation for long term employee benefits like long term compensation absences is recognized as determined by actuarial valuation performed
by independent actuary at each balance sheet date using Projected Unit Credit Method on the additional amount expected to be paid/availed as a result of unused entitlement that has accumulated at balance sheet date. Actuarial gains and losses are recognised immediately in statement of profit and loss.
(iv) Social security plans
Employer’ contribution payable with respect to social security plans, which are defined contribution plans, is charged to the statement of profit and loss in the period in which employee renders the services.
g. Property, plant and equipment
Property plant and equipment are stated at cost less accumulated depreciation and impairment losses if any. Cost includes expenditure directly attributable to the acquisition of the asset and cost incurred for bringing the asset to its present location and condition.
h. Intangible assets
Assets like customer relationship, computer software, and internally developed software are stated at cost, less accumulated depreciation, amortisation and impairment.
i. Impairment
I) Impairment of trade receivable
The Company assesses at each date of statement of
financial position whether a financial asset in form of
trade receivable is impaired. In accordance with Ind AS
109, the Company applies expected credit loss (ECL)
model for measurement and recognition of impairment
loss. As a practical expedient, the Company uses a
provision matrix to determine impairment loss on
portfolio of its trade receivable. The provision matrix
is based on available external and internal credit risk
factors such as credit default, credit rating from credit
rating agencies and Company’s historically observed
default rates over the expected life of trade receivable.
Impairment loss allowance or reversal is recognised
during the period as expense or income respectively in
the statement of profit and loss.
II) Impairment of intangible assets
At the end of each reporting period, the Company reviews the carrying amount of its intangible assets to determine if there is any indication of loss suffered. If such indication exists, the recoverable amount of the asset is estimated to determine the extent of the impairment loss.

17Statutory Reports
72Financial Statements
01Corporate Overview
85
Notes forming part of accounts
j. Leases
I) Finance lease
Assets acquired under lease where the Company has substantially all the risks and rewards of ownership are classified as finance lease. Such assets are capitalised at the inception of the lease at the lower of the fair value and the present value of minimum lease payments and a liability is created for an equivalent amount. Each lease rental paid is allocated between the liability and the interest cost, so as to obtain a constant periodic rate of interest on the outstanding liability for each period.
II) Operating lease
Assets acquired under lease where a significant portion of the risks and rewards of ownership are retained by the lessor are classified as operating lease. Lease rentals are charged to the profit and loss account on accrual basis.
k. Depreciation
I) Tangible assets
Depreciation on assets have been provided as mentioned in below table except for the leasehold improvements which is depreciated over the lease period. Depreciation or amortisation on additions and disposals are calculated on pro-rata basis from and to the month of additions and disposals.
Particulars Useful life• Computers and IT peripherals Upto 6 years• Plant and machinery Upto 15 years• Office equipment Upto 5 years• Vehicles Upto 8 years• Furniture and fixtures Upto 10 years
II) Intangible assets and amortisation
The estimated useful life of an identifiable intangible asset is based on number of factors including the effects of obsolescence, demand, competition and other economic factors and the level of maintenance expenditure required to obtain the expected future cash flows from the asset. The basis of amortization of intangible assets is as follows:
Particulars Useful life
• Computer software Upto 5 years
l. Employee stock ownership schemes
In respect of stock options granted pursuant to the Company’s stock options scheme, the excess of fair value of the share over the exercise price of the option is treated as discount and accounted as employee compensation cost over the vesting
period. The amount recognized as expense each year is arrived
at based on the number of grants expected to vest. If options
granted lapse after the vesting period, the cumulative discount
recognized as expense in respect of such options is transferred
to the general reserve. If options granted lapse before the
vesting period, the cumulative discount recognized as expense
in respect of such options is transferred to the profit and loss.
m. Functional and presentation currency
The functional and presentation currency of the Company is
the Indian Rupee as it is the currency of the primary economic
environment in which the Company operates.
n. Foreign currency transactions and balances
Foreign currency transactions are initially recorded at the rates
prevailing on the date of the transaction. At the balance sheet
date, foreign currency monetary items are reported using the
closing rate. Exchange gains and losses arising on settlement
and restatement are recognised in the statement of profit
and loss. Non-monetary items which are carried at historical
cost denominated in foreign currency are reported using the
exchange rate at the date of the transaction.
o. Financial instruments
Financial assets and liabilities are recognised when the
Company becomes a party to the contractual provisions of the
instrument.
I) Initial measurement
Financial assets and liabilities are initially measured at
fair value. Transaction costs that are directly attributable
to the acquisition or issue of financial assets and financial
liabilities (other than financial assets and financial
liabilities at fair value through profit or loss) are added
to or deducted from the fair value measured on initial
recognition of financial asset or financial liability.
II) Subsequent measurement
i) Non-derivative financial assets
A) Financial assets at amortised cost
Financial assets at amortised cost are represented by trade receivables, cash and cash equivalents, employee and other advances and eligible current and non current assets Financial assets are subsequently measured at amortised cost if:
a) the financial asset is held within a business model whose objective is to hold financial assets in order to collect contractual cash flows and

Annual Report 2017-1886
b) the contractual terms of financial assets give rise on specified dates to cash flows that are solely payments of principal and interest on the principal amount outstanding.
B) Financial assets at fair value through other comprehensive income (FVTOCI)
Financial assets are subsequently measured at fair value through other comprehensive income if the financial asset is held within a business model whose objective is achieved by both:
a) Collecting contractual cash flows and selling financial assets and
b) the contractual terms of the financial asset give rise on specified dates to cash flows that are solely payments of principal and interest on the principal amount outstanding.
C) Financial assets at fair value through profit and loss (FVTPL)
Fair value through profit and loss is a residual category for financial assets. Any financial asset which does not meet the criteria for categorisation as at amortised cost or as financial asset at fair value through other comprehensive income is classified as financial assets fair valued through profit and loss.
ii) Non-derivative financial liability
Financial liabilities at amortised cost represented by trade and other payables are initially recognized at fair value, and subsequently carried at amortized cost using the effective interest method.
iii) Derivative financial instrument
The Company holds derivative financial instrument such as foreign exchange forward contracts to mitigate the risk of changes in exchange rates on foreign currency exposures.
A) Cash flow hedges
Changes in the fair value of the derivative hedging instruments designated as cash flow hedges on net basis are recognized in other comprehensive income and presented within equity as hedging reserve. The cumulative gain or loss previously recognized in the cash flow hedging reserve in respect of hedges on net basis is transferred to the statement of profit or loss upon the occurrence of the related forecasted transaction and reported as part of foreign exchange gains or losses. Changes in fair value of foreign currency derivative instruments not designated
as cash flow hedges and ineffective portion of cash flow hedges are recognized in statement of profit and loss and reported as part of foreign exchange gains or losses.
B) Fair value hedges
Changes in the fair value of the derivative instuments designated as fair value hedges are recognised in statement of profit and loss.
(III) Derecognition
The Company derecognizes a financial asset when the contractual rights to the cash flows from the financial assets expire or it transfers the financial asset and the transfer qualifies for derecognition under Ind AS 109. A financial liability is derecognised from the Company’s balance sheet where the obligation specified in the contract is discharged or cancelled or expired.
p. Taxes on income
Income tax expense comprises current and deferred income tax. Tax on income for the current period is determined on the basis of taxable income and tax credits computed in accordance with the provisions of the Indian Income tax Act, 1961. Foreign branches recognize current tax and deferred tax liabilities and assets in accordance with the applicable local laws.
Income tax and deferred tax expense is recognized in the statement of profit and loss except to the extent that it relates to items recognised directly in other comprehensive income, in which case income tax expense is recognised in other comprehensive income. Current income tax for current and prior periods is recognised at the amount expected to be paid to or recovered from the tax authorities (Refer note 7 for applicable tax rates in various jurisdiction).
The Company offsets current tax assets and current tax liabilities, where it has a legally enforceable right to set off the recognised amounts and where it intends either to settle on a net basis, or to realize the asset and settle the liability simultaneously. Deferred income tax assets and liabilities are recognised for all temporary differences arising between the tax bases of assets and liabilities and their carrying amounts in the financial statements except when the deferred income tax arises from the initial recognition of goodwill or an asset or liability in a transaction that is not a business combination and affects neither accounting nor taxable profit or loss at the time of the transaction. Other deferred tax assets are recognised and carried forward to the extent that there is a reasonable certainty that sufficient future taxable income will be available against which such deferred tax assets can be realised. Deferred tax
Notes forming part of accounts

17Statutory Reports
72Financial Statements
01Corporate Overview
87
assets are reviewed at each reporting date and are reduced to the extent that it is no longer probable that the related tax benefit will be realised.
Deferred income tax assets and liabilities are measured using tax rates and tax laws that have been enacted or substantively enacted as on the balance sheet date and are expected to apply to taxable income in the years in which those temporary differences are expected to be recovered or settled. Deferred income taxes are not provided on the undistributed earnings of branches where it is expected that the earnings of the branch will not be distributed in the foreseeable future.
q. Borrowing costs
Borrowing costs include interest, commitment charges and finance charges in respect of assets acquired on finance lease and exchange differences arising from foreign currency borrowings, to the extent they are regarded as an adjustment to interest costs.
r. Provisions, contingent liabilities and contingent assets
Provisions are recognized for liabilities that can be measured only by using a substantial degree of estimation, if
I) the Company has a present obligation as a result of a past event;
II) a probable outflow of resources is expected to settle the obligation; and
III) the amount of the obligation can be reliably estimated
Provision is measured using the cash flows estimated to settle the present obligation and when the effect of time value of money is material, the carrying amount of the provision is the present value of those cash flow. Reimbursement expected in respect of expenditure required to settle a provision is recognized only when it is virtually certain that the reimbursement will be received.
Contingent liability is disclosed in case of,
I) a present obligation arising from a past event when it is not probable that an outflow of resources will be required to settle the obligation; or
II) a possible obligation unless the probability of outflow of resources is remote.
Contingent assets are neither recognised nor disclosed.
Provisions, contingent liabilities and contingent assets are reviewed at each balance sheet date.
s. Segment accounting
Operating segments are defined as components of an enterprise for which discrete financial information is used regularly by the Company’s Chief Operating Decision Maker in deciding how to allocate resources and assessing performance.
i) Segment revenue is the revenue directly identifiable with the segment.
ii) Expenses that are directly identifiable with or allocable to segments are considered for determining the segment result. Expenses which relate to the Company as a whole and not identifiable with / allocable to segments are included under “Unallocable expenses”.
iii) Other income relates to the Company as a whole and is not identifiable with / allocable to segments.
iv) Assets and liabilities used in the Company’s business are not identified to any of the reportable segments as these are used interchangeably.
t. Cash flow statement
Cash flow statement is prepared segregating the cash flows from operating, investing and financing activities. Cash flow is reported using indirect method as per the requirements of Ind AS 7 (“Cash flow statements”).
3. RECENT ACCOUNTING PRONOUNCEMENTS
Indian Accounting Standards (Ind AS) 115 - Revenue from Contracts with Customers
The Ministry of Corporate Affairs (MCA) has notified on 28th Mar’18 Ind AS 115 - Revenue from Contracts with Customers. This Standard will be applicable from the financial years beginning on or after April 1, 2018.
The core principle of Ind AS 115 is that an entity recognises revenue to depict the transfer of promised goods or services to customers in an amount that reflects the consideration to which the entity expects to be entitled in exchange for those goods or services. The standard specifically adopts a five step model as below for recognising revenue:
a) Identify the contract(s) with a customer
b) Identify the performance obligations in contract
c) Determine the transaction price
d) Allocate the transaction price to the performance obligations in the contract
e) Recognise revenue when (or as) the entity satisfies a performance obligation
Notes forming part of accounts

Annual Report 2017-1888
Under Ind AS 115, an entity recognises revenue when (or as) a performance obligation is satisfied, i.e. when ‘control’ of the goods or services underlying the particular performance obligation is transferred to the customer.
The Company will apply Ind AS 115 from April 1, 2018, retrospectively to all the contracts with customers which are not completed as on April 1, 2018. The cumulative effect of initially
applying the standard will be recognised as an adjustment to
the opening balance in retained earnings on April 1, 2018 at
the time of reporting for financial year 2018-19. The Company
has evaluated its major contracts with customers and does
not expect any material impact of the adoption of this Standard
on its retained earnings as on April 1, 2018 as well as to its net
income on an ongoing basis.
4. INTANGIBLE ASSETS
The balance useful life of intangible assets as on the respective balance sheet dates is as follows:-
(` in Mn)
Class of assets As at 31 March 2018 As at 31 March 2017
Balance useful life
Carrying amount Balance useful life
Carrying amount
Software upto 5 years 315 upto 5 years 382Total 315 382
Notes forming part of accounts

17Statutory Reports
72Financial Statements
01Corporate Overview
89
Not
es fo
rmin
g p
art o
f acc
oun
ts
4.
FIX
ED
AS
SETS
- A
s of
31
Mar
ch 2
018
(` in
Mn)
Fix
ed a
nd in
tang
ible
ass
ets
Gro
ss B
lock
D
epre
ciat
ion/
Am
orti
sati
onN
et B
lock
As
at
Pur
suan
t to
Am
alga
mat
ion*
Add
itio
ns
Ded
ucti
ons
As
at
As
at
Pur
suan
t to
Am
alga
mat
ion*
For
the
On
As
at
As
at
1-A
pr-1
731
-Mar
-18
1-A
pr-1
7 y
ear
dedu
ctio
ns31
-Mar
-18
31-M
ar-1
8
Tang
ible
ass
ets
- ow
n
Leas
ehol
d la
nd 1
0 -
-
-
1
0 0
-
0
-
0
1
0
Bui
ldin
gs -
ow
n 1
26
-
-
-
126
1
6 -
8
-
2
4 1
02
Leas
ehol
d im
prov
emen
ts 3
51
-
67
4
414
6
1 -
4
8 0
1
09
305
Pla
nt a
nd m
achi
nery
676
-
5
7 1
0 7
23
154
-
8
4 8
2
30
493
Ow
ned
com
pute
rs 9
33
1
255
0
1
,189
4
57
1
239
0
6
97
492
Off
ice
equi
pmen
ts 5
18
0
101
2
6
17
209
0
1
19
2
326
2
91
Furn
itur
e an
d fi
xtur
es 6
75
0
88
2
761
1
61
0
98
1
258
5
03
Vehi
cles
335
-
5
2 5
4 3
33
89
-
51
23
117
2
16
Cap
ital
wor
k in
pro
gres
s -
-
-
-
-
-
1
0
Tota
l of t
angi
ble
asse
ts 3
,624
1
6
20
72
4,1
73
1,1
47
1
647
3
4 1
,761
2
,422
Inta
ngib
le a
sset
s
Sof
twar
e 2
,167
0
1
99
-
2,3
66
1,7
85
0
266
-
2
,051
3
15
Bus
ines
s ri
ghts
98
-
-
98
-
98
-
-
98
-
-
Inta
ngib
le a
sset
s un
der
deve
lopm
ent
-
-
-
-
-
-
-
-
58
Tota
l of i
ntan
gibl
e as
sets
2
,265
0
1
99
98
2,3
66
1,8
83
0
266
9
8 2
,051
3
73
1.
Im
pair
men
t upt
o 31
Mar
ch 2
018
- N
IL
2.
A
ugm
entI
Q D
ata
Sci
ence
s P
riva
te L
imite
d ha
s be
en a
mal
gam
ated
wit
h th
e C
ompa
ny fr
om th
e ap
poin
ted
date
of 1
Apr
il 20
17

Annual Report 2017-1890
Not
es fo
rmin
g p
art o
f acc
oun
ts
4.
FIX
ED
AS
SETS
- A
s of
31
Mar
ch 2
017
(` in
Mn)
Fixe
d an
d in
tang
ible
as
sets
Gro
ss B
lock
D
epre
ciat
ion/
Am
orti
sati
onN
et B
lock
As
at
Add
itio
ns
Ded
ucti
ons
As
at
As
at
For
the
year
On
As
atA
s at
01-A
pr-1
631
-Mar
-17
01-A
pr-1
6de
duct
ions
31-M
ar-1
731
-Mar
-17
Tang
ible
ass
ets
- ow
n
Leas
ehol
d la
nd 1
0 -
-
1
0 (0
) 0
-
(0
) 1
0
Bui
ldin
gs -
ow
n 1
26
-
-
126
8
8
-
1
6 1
10
Leas
ehol
d im
prov
emen
ts 2
90
76
15
351
3
6 4
0 1
5 6
1 2
90
Pla
nt a
nd m
achi
nery
628
5
0 2
6
76
77
79
2
154
5
22
Ow
ned
com
pute
rs 8
26
159
5
2 9
33
249
2
60
52
457
4
76
Off
ice
equi
pmen
ts 4
06
121
9
5
18
106
1
12
9
209
3
09
Furn
itur
e an
d fix
ture
s 6
50
59
34
675
9
5 9
5 2
9 1
61
514
Vehi
cles
336
6
2 6
3 3
35
51
54
16
89
246
Cap
ital
wor
k in
pr
ogre
ss 9
Tota
l of t
angi
ble
asse
ts 3
,272
5
27
175
3
,624
6
22
648
1
23
1,1
47
2,4
86
Inta
ngib
le a
sset
s
Sof
twar
e 2
,110
2
69
212
2
,167
1
,556
4
41
212
1
,785
3
82
Bus
ines
s ri
ghts
98
-
-
98
98
-
-
98
-
Inta
ngib
le a
sset
s un
der
deve
lopm
ent
-
-
-
-
-
-
-
-
3
Tota
l of i
ntan
gibl
e as
sets
2
,208
2
69
212
2
,265
1
,654
4
41
212
1
,883
3
85
1.
Im
pair
men
t upt
o 31
Mar
ch 2
017
- N
IL

17Statutory Reports
72Financial Statements
01Corporate Overview
91
Notes forming part of accounts
5 NON-CURRENT INVESTMENTS
(` in Mn) As at
31-03-2018 As at
31-03-2017 Long term investment in subsidiaries:Equity Shares (Unquoted) :2 (previous year - 1) fully paid equity shares of Euro 25,000 each in Larsen & Toubro Infotech GmbH * 1,219 1 100 fully paid equity shares of CAD 1 each in Larsen & Toubro Infotech Canada Limited 7 7 600,000 (previous year - 1,000,000) equity shares at no par value in L&T Infotech Financial Services Technologies Inc.**
1,686 2,806
332,350 equity shares at no par value in Laresen And Toubro Infotech South Africa (Pty) Ltd 2 2 175,000 fully paid equity shares of USD 1 each in L&T Information Technology Services (Shanghai) Co. Ltd.
11 11
1,102,419 fully paid equity shares of ` 10 each in AugmentIQ Data Sciences Pvt Ltd *** - 71 1 fully paid equity share of Euro 5,000 in Larsen & Toubro Infotech Austria GmbH 3 3 50,000 fully paid equity shares of Euro 1 each in L&T Information Technology Spain, SL 4 4 450,000 fully paid equity shares of ̀ 10 each in Syncordis Software Services India Private Limited $ 26 - Other :Membership interest of MXN 2,970 in L & T Infotech S.de. RL. C.V # 0 - Other equity investments (Unquoted) :2500 equity shares of USD 1 each in Larsen & Toubro LLC @ 1 -
2,959 2,905
* The Company has made additional investment of ` 1,218 Million on 07 December 2017 in Larsen & Toubro Infotech GmbH (LTI GmbH) for acquisition of Syncordis S.A, Luxembourg, by LTI GmbH along with its fully owned subsidiaries France, UK and Luxembourg.
** On 21 March 2018, L&T Infotech Financial Services Technologies Inc. (“LTIFST”) bought back 40% of its total equity capital (i.e. 400,000 shares) from its Shareholder (the Company) for a consideration of ` 1,507 Mn against cost of ` 1,119 Mn. As a result, other income for the year ended 31 March 2018 includes gain of ` 388 Mn arising from this buy back.
*** AugmentIQ Data Sciences Private Limited has been amalgamated with the Company from the appointed date of 1 April 2017 (refer note 40 to notes to accounts)
# L & T Infotech S.de. RL. C.V was formed in Mexico in March 2017 and started its operations in September 2017. The Company has invested ` 10,842 towards 99% of the Equity Stock in July 2017. Balance 1% is held by L&T Infotech Financial Services Technologies Inc.
$ The Company has acquired “Syncordis Software Service India Private Limited” on 11 December 2017 (refer note 41).
@ The Company has acquired 4.76% shareholding of Larsen & Turbo LLC on 14 August 2017. The Company does not have control over its operations.
Impairment upto 31 March 2018 - NIL
6 NON CURRENT LOANS
(` in Mn) As at
31-03-2018 As at
31-03-2017 Unsecured, considered goodSecurity deposits 384 311
384 311
7 OTHER NON CURRENT FINANCIAL ASSETS
(` in Mn) As at
31-03-2018 As at
31-03-2017 Forward contract receivable 721 1,866
721 1,866

Annual Report 2017-1892
Notes forming part of accounts
8 DEFERRED TAX ASSETS
(` in Mn) As at
31-03-2018 As at
31-03-2017 MAT credit 2,530 2,576 Less: Deferred tax liability (611) (1,137)
1,919 1,439
8 (I) Deferred tax liabilities/assets as at 31 March 2018
(` in Mn) Particulars Deferred
tax asset/(liability) as at
31-03-2017
Current year (charge) /
credit
(Charge) / credit to Hedging Reserve
Charge pursuant to
amalgamation (Refer note 40)
Deferred Tax asset/
(liability) as at 31-03-2018
Deferred tax liabilitiesGain on cash flow hedges (920) - 234 (686)Branch profit tax (542) (141) (683)Unrealised gains on investments - (53) - - (53)Others (1) - - - (1)
(1,463) (194) 234 - (1,423)Deferred tax assetsProvision for doubtful debts & advances 51 31 - - 82 Provision for employee benefits 153 71 - - 224 Realised gain on forward contracts 95 25 - - 120 MTM on derivative instruments designated as fair value hedges
(46) 111 - - 65
Depreciation / amortisation 63 146 - - 209 Capital Loss on buyback of shares by LTIFST - 63 - - 63 Others 10 38 - 1 49 MAT Credit* 2,576 (46) - - 2,530
2,902 439 - 1 3,342 Net deferred tax assets/(liabilities) 1,439 245 234 1 1,919
*MAT credit for year ended 31 March 2018 of ` 59 Mn is net off reduction in MAT for year ending 31 March 2017 ` 106 Mn due to Ind AS transitional deductions as per section 115JB of Income Tax Act 1961.
8 (II) Net Schedule of Deferred tax assets as at 31 March 2018
(` in Mn) Particulars Deferred
tax asset/(liability) as at
31-03-2017
Current year (charge) /
credit
(Charge) / credit to Hedging Reserve
Charge pursuant to
amalgamation (Refer note 40)
Deferred Tax asset/
(liability) as at 31-03-2018
Gain on cash flow hedges (920) - 234 - (686)Branch profit tax (542) (141) - - (683)MTM on derivative instruments designated as fair value hedges
(46) 111 - - 65
Unrealised gains on investments - (53) - - (53)Provision for doubtful debts & advances 51 31 - - 82 Provision for employee benefits 153 71 - - 224 Realised gain on forward contracts 95 25 - - 120 Depreciation / amortisation 63 146 - - 209 Capital Loss on buyback of shares by LTIFST - 63 - - 63 Others 9 38 - 1 48 MAT Credit 2,576 (46) - - 2,530 Net deferred tax assets/ (liabilities) 1,439 245 234 1 1,919

17Statutory Reports
72Financial Statements
01Corporate Overview
93
Notes forming part of accounts
8 (III) Deferred tax liabilities/assets as at 31 March 2017
(` in Mn)
Particulars Deferred tax asset/
(liability) as at 31-03-2016
Current year (charge) /
credit
(Charge) / credit to Hedging Reserve
Charge pursuant to
amalgamation (Refer note 40)
Deferred Tax asset/
(liability) as at 31-03-2017
Deferred tax liabilitiesGain on cash flow hedges (172) - (748) - (920)Branch profit tax (427) (115) - - (542)MTM on derivative instruments designated as fair value hedges
- (46) - - (46)
Others (1) - - - (1) (600) (161) (748) - (1,509)
Deferred tax assetsProvision for doubtful debts & advances 43 8 - - 51 Depreciation / amortisation 32 31 - - 63 Provision for employee benefits 98 55 - - 153 Realised gain on forward contracts 41 95 (41) - 95 Others 10 - - - 10 MAT Credit 2,574 440 (440) 2 2,576
2,798 629 (481) 2 2,948 Net deferred tax assets/(liabilities) 2,198 468 (1,229) 2 1,439
8 (IV) Net Schedule of Deferred tax assets as at 31 March 2017
(` in Mn)
Particulars Deferred tax asset/
(liability) as at 31-03-2016
Current year (charge) /
credit
(Charge) / credit to Hedging Reserve
Charge pursuant to
amalgamation (Refer note 40)
Deferred Tax asset/
(liability) as at 31-03-2017
Deferred tax liabilitiesGain on cash flow hedges (172) - (748) - (920)Branch profit tax (427) (115) - - (542)MTM on derivative instruments designated as fair value hedges
- (46) - - (46)
Depreciation / amortisation 32 31 - - 63 Provision for doubtful debts & advances 43 8 - - 51 Provision for employee benefits 98 55 - - 153 Realised gain on forward contracts 41 95 (41) - 95 Others 9 - - 9 MAT Credit 2,574 440 (440) 2 2,576 Net deferred tax assets/(liabilities) 2,198 468 (1,229) 2 1,439

Annual Report 2017-1894
Notes forming part of accounts
8 (V) Summary of minimum alternate tax (MAT) credit available for set off against future tax liability arising under normal provision of Income tax Act, 1961 for the year ended 31 March 2018
(` in Mn)
Financial year MAT credit Set-off in earlier years
Balance brought forward in
current year
MAT Credit tilised during the
Current Year
Balance MAT to be carried
forward to next year
2007-08 184 184 - - - 2008-09 218 218 - - - 2009-10 272 87 185 - 185 2010-11 454 - 454 - 454 2011-12 (0) - (0) - (0) 2012-13 0 - 0 - 0 2013-14 366 - 366 - 366 2014-15 485 - 485 - 485 2015-16 647 - 647 - 647 2016-17* 334 - 334 - 334 2017-18 59 - 59 - 59 Total 3,019 489 2,530 - 2,530
*Reduction in MAT for the year ended 31 March 2017 is ` 106 Mn due to Ind AS transitional deductions as per section 115JB of Income Tax Act 1961.
8 (VI) Summary of minimum alternate tax (MAT) credit available for set off against future tax liability arising under normal provision of Income tax Act, 1961 for the year ended 31 March 2017
(` in Mn)
Financial year MAT credit Set-off in earlier years
Balance brought forward in
current year
MAT Credit tilised during the
Current Year
Balance MAT to be carried
forward to next year
2007-08 184 184 - - - 2008-09 218 218 - - - 2009-10 272 87 185 - 185 2010-11 454 - 454 - 454 2011-12 (0) - (0) - (0) 2012-13 0 - 0 - 0 2013-14 365 - 365 - 365 2014-15 485 - 485 - 485 2015-16 647 - 647 - 647 2016-17 440 - 440 - 440 Total 3,065 489 2,576 - 2,576
9 OTHER NON CURRENT ASSETS
(` in Mn) As at
31-03-2018 As at
31-03-2017 Prepaid expenses 106 155 Advance recoverable in cash or kind including Indirect tax recoverable 914 1,118
1,020 1,273

17Statutory Reports
72Financial Statements
01Corporate Overview
95
10 CURRENT INVESTMENTS
(` in Mn)
Particulars Face value per unit
Units as at 31-03-2018
Amount as at 31-03-2018
Amount as at 31-03-2017
Mutual funds - UnquotedAditya Birla SL Cash Manager Direct-G 100 1,647,931 719 - Aditya Birla SL Savings Direct-G 100 2,082,654 717 - Aditya Birla SL Banking & PSU Debt Direct-G 10 9,318,580 488 - ABSL Interval Income Fund - Quarterly Plan - Series 1 10 8,954,034 202 - Birla Sun Life Savings Fund - Dir - DDR 100 - - 222 Birla Sun Life Short Term Fund - Dir - MDR 10 - - 553 ICICI Pru Savings Direct-G 10 2,691,513 728 - ICICI Prudential FMP Series 82 - 103 Days Plan O 10 20,000,000 201 - ICICI Pru Flexible Income Direct-G 10 450,196 151 - ICICI Prudential Savings Fund - Direct Plan - Growth 10 593,833 160 - ICICI Prudential Flexible Income Plan - Direct - DDR 100 - - 200 ICICI Prudential Ultra Short Term Plan - Dir - DDR 10 - - 811 ICICI Prudential Short Term Fund - Dir - MDR 10 - - 89 ICICI Prudential Savings Plan - Direct - DDR 100 - - 60 ICICI Prudential Banking & PSU Debt Fund -Dir- DDR 10 - - 131 Invesco India Liquid Direct-G 1,000 144,417 345 - Invesco India Medium Term Bond Direct-G 1,000 221,719 403 - Invesco India Medium Term Bond Fund-Dir-DDR 1,000 - - 166 Kotak Equity Arbitrage Direct-G 10 39,495,646 1,008 - Kotak Low Duration Direct-G 100 394,800 865 - Kotak FMP Series 218 - 92 Days Direct-G 10 10 242 - Kotak Bond Short Term Plan - Dir -MDR 10 - - 745 Kotak Low Duration Fund - Direct Plan - MDR 1,000 - - 406 L&T Liquid-G 100 115,569 275 - L&T Liquid Fund Direct Plan -G 100 100,863 240 - L&T Short Term Opportunity Fund-Dir-MDR 10 - - 451 L&T Ultra Short Term Fund -Dir- DDR 10 - - 384 L&T Floating Rate Fund - Direct - MDR 10 - - 523 L&T Banking and PSU Debt Fund -Dir- MDR 10 - - 732 Reliance Medium Term Direct-G 10 27,398,180 1,019 - Reliance Arbitrage Advantage Fund- Direct-G 10 5,487,812 403 - Reliance Fixed Horizon Fund XXXVI Series 4 Direct-G 10 35,000,000 353 - Reliance Monthly Interval Fund Series II Direct - Growth 10 13,033,618 302 - Reliance Medium Term Fund-Dir - DDR 10 - - 397 Reliance Short-term Direct-MDR 10 - - 250 Reliance Money Manager Fund-Dir - DDR 1,000 - - 554 UTI SPrEAD Direct-G 10 23,116,745 554 - UTI Banking & PSU Debt Fund -Dir- DDR 10 - - 667 UTI Treasury Advantage Fund - Direct - MDR 1,000 - - 292 Franklin India Low Duration Direct-G 10 37,561,903 762 580 Franklin India Ultra Short Bond Super Inst Direct-G 10 42,447,366 1,025 - Edelweiss Arbitrage Direct-G 10 15,244,367 201 - IDFC Cash Plan Direct- G 100 293,792 620 - HDFC Liquid Direct-G 100 70,191 240 - HDFC Cash Mgmt Fund- Treasury Advantage- Dir- DDR 10 - - 205 HDFC Short Term Opportunities Fund - FDR 10 - - 356 HDFC Banking and PSU Debt Direct-WDR 10 - - 370 SBI Treasury Advantage Fund - Direct Plan - Growth 100 212,823 421 - SBI Short Term Debt Fund -Dir- MDR 10 - - 262 Total 12,644 9,406
Notes forming part of accounts

Annual Report 2017-1896
11 TRADE RECEIVABLES
(` in Mn) As at
31-03-2018 As at
31-03-2017 Unsecured, considered good Due from related parties (refer note 42) 761 638 Due from others 12,514 10,588 Unsecured, considered doubtful 327 230 Less : Allowance for bad & doubtful debts (327) (230)
13,275 11,226
Allowance for bad & doubtful debts movement
(` in Mn) As at
31-03-2018 As at
31-03-2017 Balance at the beginning of the year 230 219 Additions during the year, net 104 16 Uncollectable receivables charged against allowances (31) - Exchange gain/(loss) 24 (5)Balance at the end of year 327 230
12 CASH AND CASH EQUIVALENT
(` in Mn) As at
31-03-2018 As at
31-03-2017 Cash on hand - - Balances with bank- in current accounts Overseas 1,401 914 Domestic 428 231 - in deposit accounts - 159 Remittance in transit 650 568
2,479 1,872
13 OTHER BANK BALANCES
(` in Mn) As at
31-03-2018 As at
31-03-2017 Earmarked balances with banks (unclaimed dividend) 4 3 Cash and bank balance not available for immediate use 15 31
19 34
14 CURRENT LOANS
(` in Mn) As at
31-03-2018 As at
31-03-2017 Unsecured, considered goodSecurity deposits 235 154
235 154
Notes forming part of accounts

17Statutory Reports
72Financial Statements
01Corporate Overview
97
15 OTHER CURRENT FINANCIAL ASSETS
(` in Mn) As at
31-03-2018 As at
31-03-2017 Advances to employees 385 260 Forward contract receivable 1,581 2,251 Others - 1
1,966 2,512
16 OTHER CURRENT ASSETS
(` in Mn) As at
31-03-2018 As at
31-03-2017 Prepaid expenses 674 809 Advances recoverable in cash or in kind 277 44 Advances to vendors 78 22
1,029 875
17 SHARE CAPITAL
I) Share capital authorised, issued, subscribed and paid up:
(` in Mn) As at
31-03-2018 As at
31-03-2017 Authorised :260,000,000 equity shares of ` 1 each * 260 240 (Previous year 240,000,000 of ` 1 each)
260 240 Issued, paid up and subscribed171,999,263 equity shares for ` 1 each 172 171 (Previous year 170,571,113 of ` 1 each)
172 171
* Pursuant to scheme of amalgamation of AugmentIQ Data Sciences Private Limited (transferor company) with the Company, the authorised share capital of ` 20 Mn is transferred to the Company (refer no. 40)
II) Terms/rights attached to equity shares
The Company has only one class of equity shares having a par value of ` 1 per share. Each holder of equity shares is entitled to one vote per share. The Company declares and pays dividend in Indian rupees.
III) Shareholders holding more than 5% of equity shares as at the end of the year:
(` in Mn) Name of Shareholder Number of
SharesShareholding %
As at 31-03-2018Larsen & Toubro Limited 142,693,637 82.96%
As at 31-03-2017Larsen & Toubro Limited 143,750,000 84.28%
Notes forming part of accounts

Annual Report 2017-1898
IV) Reconciliation of the number of equity shares and share capital:
Due to allotment of shares on exercise of stock options by employees, there was a movement in share capital for the year ended 31 March 2018 and the year ended 31 March 2017 as given below:
(` in Mn) As at
31-03-2018 As at
31-03-2017 Issued, subscribed and fully paid up equity shares outstanding at the beginning 170,571,113 169,816,188Add: Shares issued on exercise of employee stock options 1,428,150 754,925Issued, subscribed and fully paid up equity shares 171,999,263 170,571,113
V) Stock option plans:
Employee Stock Ownership Scheme (‘ESOS Plan’)
The grant of options to the employees under ESOS Plan is on the basis of their performance and other eligibility criteria.
Sr. no
Particulars ESOP scheme 2000 I,II & III
ESOP scheme 2000 IV - XXI
U.S. Stock Option Sub-plan 2006
ESOP scheme 2015
2017-18 2016-17 2017-18 2016-17 2017-18 2016-17 2017-18 2016-17i Grant Price ` 5 ` 5 ` 2 ` 2 USD 2.4 USD 2.4 ` 1 ` 1ii Grant Dates 01 April 2001
onwards01 October 2001
onwards15 March 2007
onwards10 June 2016
onwardsiii Vesting commences on 01 April 2002
onwards01 October 2002
onwards15 March 2008
onwards10 June 2017
onwardsiv Options granted & outstanding at the
beginning of the year 36,720 82,660 1,450,725 2,350,106 47,000 143,650 3,596,300 -
v Options reinstated during the year - - - - - - vi Options granted during the year - - - - - 129,300 3,658,000 vii Options allotted/execised during the
year 3,375 11,830 673,315 725,445 8,000 17,650 743,460 -
viii Options Lapsed/cancelled during the year
12,000 34,110 92,108 173,936 - 79,000 132,000 61,700
ix Options granted & outstanding at the end of the year
21,345 36,720 685,302 1,450,725 39,000 47,000 2,850,140 3,596,300
x Options vested at the end of the year out of (ix)
21,345 36,720 447,852 223,760 39,000 47,000 312,600 -
xi Options unvested at the end of the year out of (ix)
- - 237,450 1,226,965 - - 2,537,540 3,596,300
xii Weighted average remaining contractual life of options (in years)
- - 0.7 1.7 - - 5.3 6.2
The number and weighted average exercise price of stock options are as follows:
Particulars 2017-18 2016-17No. of stock
optionsWeighted average
exercise priceNo. of stock
optionsWeighted average
exercise pricei Options granted & outstanding at the beginning of the year 5,130,745 2.73 2,576,416 11.14 ii Options reinstated during the year - - - - iii Options granted during the year 129,300 1.00 3,658,000 1.00 iv Options allotted during the year 1,428,150 2.35 754,925 5.64 v Options Lapsed/cancelled during the year 236,108 1.59 348,746 36.92 vi Options granted & outstanding at the end of the year 3,595,787 2.90 5,130,745 2.73 vii Options vested at the end of the year out of (v) 820,797 9.03 307,480 25.84
Notes forming part of accounts

17Statutory Reports
72Financial Statements
01Corporate Overview
99
VI) The aggregate number of equity shares allotted as fully paid up by way of bonus shares in immediately preceding five years ended 31 March 2018 are Nil (previous period of five years ended 31 March 2017 - Nil)
VII) The aggregate number of equity shares issued pursuant to contract, without payment being received in cash in immediately preceding five years ended 31 March 2018 – Nil (previous period of five years ended 31 March 2017 - Nil)
VIII) During the year ended 31 March 2018, the amount of interim dividend distributed to equity shareholder was ` 8.00 per equity share for the year ended 31 March 2018 and final dividend of ` 9.70 per equity share for the year ended 31 March 2017.
IX) Weighted average share price at the date of exercise for stock options exercised during the year is ` 850 per share.
X) Weighted average fair value of options granted during the year is ` 644.71
XI) The fair value has been calculated using the Black-Scholes Option Pricing model and significant assumptions and inputs to estimate the fair value options granted during the year are as follows:
Sr. no
Particulars 2017-18 2016-17
i Weighted average risk-free interest rate 6.69% 7.10%ii Weighted average expected life of options 3 years 3 yearsiii Weighted average expected volatility 17.88% 19.23%iv Weighted average expected dividends over the life of option ` 115.33 ` 115.56 v Weighted average share price ` 644.71 ` 407.74 vi Weighted average exercise price ` 1 ` 1 vii Method used to determine expected volatility The expected volatility has been
calculated based on historic volatility IT Index
The expected volatility has been calculated based on historic
volatility IT Index
XII) The balance in share option outstanding account as at 31 March 2018 is ` 1,217 Mn (previous year ` 1,511 Mn)
18 OTHER EQUITY
(` in Mn)
Sr. no
Particulars 2017-18 2016-17
I) General ReserveOpening balance 3,463 3,772 Add: Employee stock compensation expense 2 8 Less: General Reserve on amalgamation (Refer note 40) (60) (317)
3,405 3,463 II) Hedging Reserve
Opening balance 3,081 877 Add: Movement in forward contracts receivable 1,477 4,641 Less: Amount reclassified to profit or loss (2,966) (1,460)Add/(Less): Deferred tax related to above 433 (977)
2,025 3,081 III) Share Premium
Opening balance 1,498 1,473 Add: Additions during the year 321 25
1,819 1,498 IV) Employee Stock option outstanding
Opening balance 1,511 77 Add: Additions during the year 83 1,492 Less: Transferred to general reserve (377) (8)Less: Deductions during the year - (50)
Notes forming part of accounts

Annual Report 2017-18100
(` in Mn)
Sr. no
Particulars 2017-18 2016-17
1,217 1,511 Deferred employee compensation expenseOpening balance (945) - Add: Additions during the year 562 547 Less: Deductions during the year (83) (1,492)
(466) (945)Balance to be carried forward 751 566
V) Capital ReserveOpening balance 0 0 Add: Additions during the year - -
0 0 VI) Retained Earnings
Opening balance 20,990 13,272 Add: Transfer due to amalgamation - 365 Add: Profit for the year 11,601 9,376 Add: Other comprehensive income 62 (45)Less: Dividend (including dividend distribution tax) (3,639) (1,978)
29,014 20,990 37,014 29,598
19 OTHER NON CURRENT FINANCIAL LIABILITIES
(` in Mn) As at
31-03-2018 As at
31-03-2017 Liability for customer settlement expense 204 -
204 -
20 (I) NON CURRENT PROVISIONS
(` in Mn) As at
31-03-2018 As at
31-03-2017 Post retirement medical benefits 169 174 Others 111 111
280 285
20 (II) Disclosure pursuant to Accounting Standard (Ind-AS) 37 “Provisions, Contingent Liabilities and Contingent Assets” movement in provisions.
Sr. No.
Particulars Class of provisions Sales Tax Others Total
i Balance as at 1-4-2017 4 107 111ii Additional provision during the year - - -iii Provision used during the year - - -iv Provision reversed during the year - - -v Balance as at 31-03-2018 4 107 111
Notes forming part of accounts
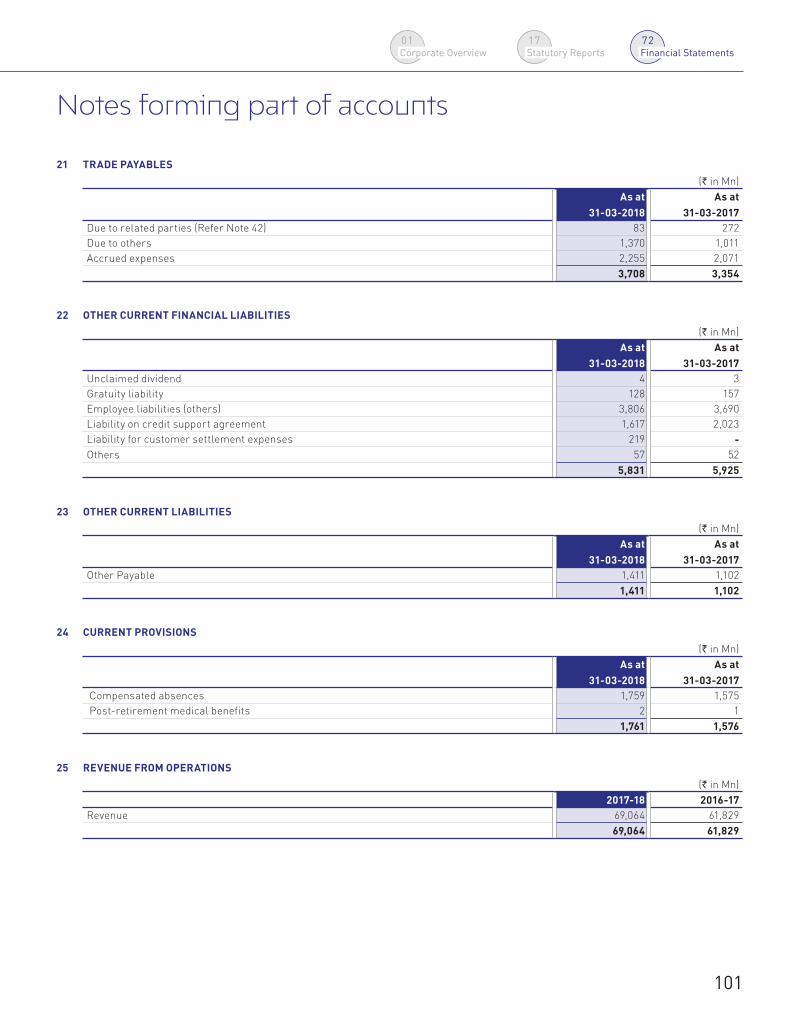
17Statutory Reports
72Financial Statements
01Corporate Overview
101
Notes forming part of accounts
21 TRADE PAYABLES
(` in Mn) As at
31-03-2018 As at
31-03-2017 Due to related parties (Refer Note 42) 83 272 Due to others 1,370 1,011 Accrued expenses 2,255 2,071
3,708 3,354
22 OTHER CURRENT FINANCIAL LIABILITIES
(` in Mn) As at
31-03-2018 As at
31-03-2017 Unclaimed dividend 4 3 Gratuity liability 128 157 Employee liabilities (others) 3,806 3,690 Liability on credit support agreement 1,617 2,023 Liability for customer settlement expenses 219 -Others 57 52
5,831 5,925
23 OTHER CURRENT LIABILITIES
(` in Mn) As at
31-03-2018 As at
31-03-2017 Other Payable 1,411 1,102
1,411 1,102
24 CURRENT PROVISIONS
(` in Mn) As at
31-03-2018 As at
31-03-2017 Compensated absences 1,759 1,575 Post-retirement medical benefits 2 1
1,761 1,576
25 REVENUE FROM OPERATIONS
(` in Mn) 2017-18 2016-17
Revenue 69,064 61,829 69,064 61,829

Annual Report 2017-18102
Notes forming part of accounts
26 OTHER INCOME
(` in Mn) 2017-18 2016-17
Income from current investments in mutual fund 738 194 Interest received from bank and others 7 16 Foreign exchange gain * 3,468 1,522 Dividends from subsidiaries 579 141 Miscellaneous income 74 110 Gains from buyback of shares by subsidiary 388 -
5,254 1,983
* The foreign exchange gain reported above includes gain on forward contracts which are designated as cash flow hedges of ` 2,966 Mn (previous year 31 March 2017 ` 1,460 Mn). Since the Company hedges its operational business exposure on a net basis (i.e. expected revenue in foreign currency less expected expenditure in related currency), the aforesaid gain on forward contracts relates to the business operations of the company.
27 EMPLOYEE BENEFIT EXPENSES
(` in Mn) 2017-18 2016-17
Salaries including overseas staff expenses 38,013 32,862 Share based payments to employees 400 428 Staff welfare 408 516 Contribution to provident and other funds 480 377 Contribution to superannuation fund 45 54 Contribution to gratuity fund 155 115 Contribution to social security and other funds 1,847 1,623
41,348 35,975
28 OPERATING EXPENSES
(` in Mn) 2017-18 2016-17
Consultancy charges 5,400 4,462 Cost of equipment, hardware and software packages 3,386 3,313 Travelling and conveyance 2,343 2,343 Rent and establishment expenses 1,757 1,615 Repairs and maintenance 813 798 Customer settlement expense * 617 - Telephone charges and postage 352 317 Recruitment expenses 352 205 Power and fuel 328 318 Advertisement 219 191 Rates and taxes 218 204 Communication expenses 147 187 Insurance charges 53 51 Allowance for doubtful debts and advances 121 16 Bad debts 31 - Less:Provision written back (17) - Miscellaneous expenses 166 121
16,286 14,141
* Customer settlement expense are in relation to one time commercial settlement entered by the Company with one of its clients on 27 March 2018.

17Statutory Reports
72Financial Statements
01Corporate Overview
103
Notes forming part of accounts
29 FINANCE COST
(` in Mn) 2017-18 2016-17
Interest on deposits with respect to credit support agreement 133 29 Others 5 3
138 32
30 OTHER EXPENSES
(` in Mn) 2017-18 2016-17
Legal and professional charges 765 620 Books and periodicals 20 10 Directors fees 31 11 Other miscelleneous expenses 133 92
949 733
31 (I) CURRENT TAX (NET)
(` in Mn) 2017-18 2016-17
Current tax 3,429 2,915 Provision for earlier year written (back)/off (99) 19
3,330 2,934
31 (II) DEFERRED TAX
(` in Mn) 2017-18 2016-17
Deferred tax charge/(credit) (294) (28)MAT credit entitlement for current year * 47 (440)
(247) (468)
*MAT credit for year ended 31 March 2018 of ` 59 Mn is net off reduction in MAT for year ending 31 March 2017 ` 106 Mn due to Ind AS transitional deductions as per section 115JB of Income Tax Act 1961.
31 (III) A reconciliation of the income tax provision to the amount computed by applying enacted income tax rate to the profit before income taxes is summarized below:
(` in Mn) 2017-18 2016-17
Profit before income taxes 14,684 11,842 Enacted tax rates in India 34.608% 34.608%Computed expected tax expense 5,082 4,098 Effect due to non-taxable income for Indian tax purposes (1,817) (1,360)Overseas taxes 126 166 Short/(excess) provision, Overseas and Domestic 7 19 Effect of non taxable income (101) (741)Effect of allowances of eligible expenses (774) (410)Effect of non-deductible expenses 772 480 Effect of deferred taxes (294) (28)Book profit related to capital loss for income tax purpose (133) - Others 215 242 Tax expense as per statement of profit and loss 3,083 2,466
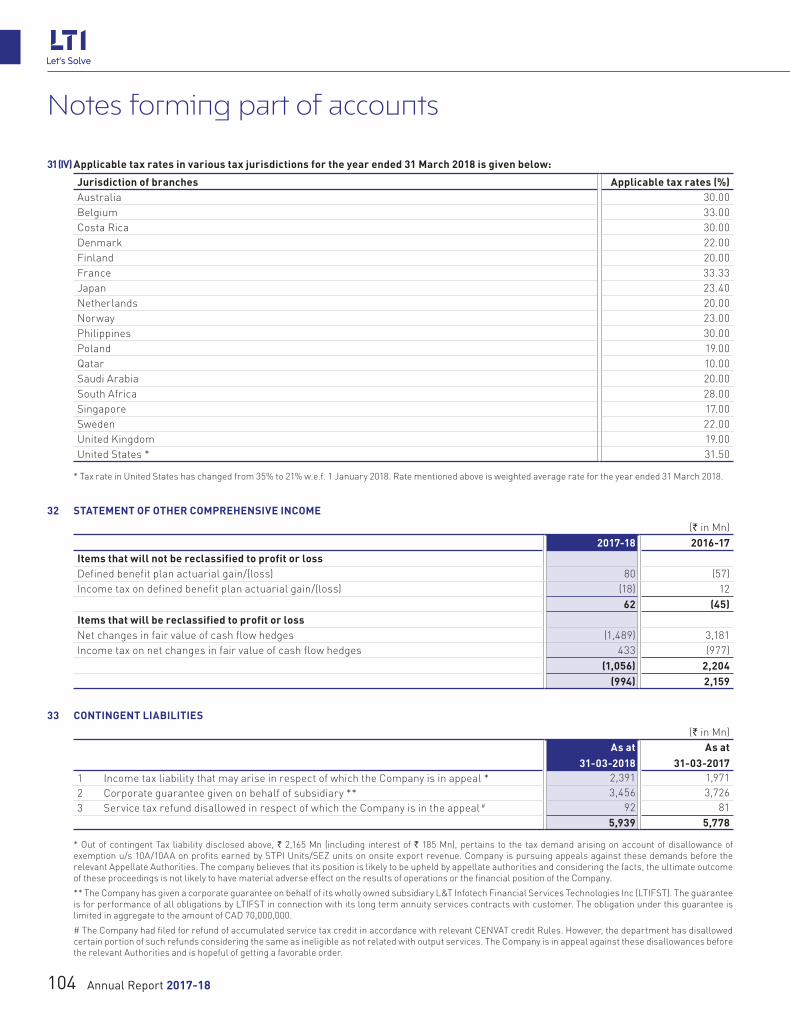
Annual Report 2017-18104
31 (IV) Applicable tax rates in various tax jurisdictions for the year ended 31 March 2018 is given below:
Jurisdiction of branches Applicable tax rates (%)Australia 30.00Belgium 33.00Costa Rica 30.00Denmark 22.00Finland 20.00France 33.33Japan 23.40Netherlands 20.00Norway 23.00Philippines 30.00Poland 19.00Qatar 10.00Saudi Arabia 20.00South Africa 28.00Singapore 17.00Sweden 22.00United Kingdom 19.00United States * 31.50
* Tax rate in United States has changed from 35% to 21% w.e.f. 1 January 2018. Rate mentioned above is weighted average rate for the year ended 31 March 2018.
32 STATEMENT OF OTHER COMPREHENSIVE INCOME
(` in Mn) 2017-18 2016-17
Items that will not be reclassified to profit or lossDefined benefit plan actuarial gain/(loss) 80 (57)Income tax on defined benefit plan actuarial gain/(loss) (18) 12
62 (45)Items that will be reclassified to profit or lossNet changes in fair value of cash flow hedges (1,489) 3,181 Income tax on net changes in fair value of cash flow hedges 433 (977)
(1,056) 2,204 (994) 2,159
33 CONTINGENT LIABILITIES
(` in Mn) As at
31-03-2018 As at
31-03-2017 1 Income tax liability that may arise in respect of which the Company is in appeal * 2,391 1,971 2 Corporate guarantee given on behalf of subsidiary ** 3,456 3,726 3 Service tax refund disallowed in respect of which the Company is in the appeal # 92 81
5,939 5,778
* Out of contingent Tax liability disclosed above, ` 2,165 Mn (including interest of ` 185 Mn), pertains to the tax demand arising on account of disallowance of exemption u/s 10A/10AA on profits earned by STPI Units/SEZ units on onsite export revenue. Company is pursuing appeals against these demands before the relevant Appellate Authorities. The company believes that its position is likely to be upheld by appellate authorities and considering the facts, the ultimate outcome of these proceedings is not likely to have material adverse effect on the results of operations or the financial position of the Company.
** The Company has given a corporate guarantee on behalf of its wholly owned subsidiary L&T Infotech Financial Services Technologies Inc (LTIFST). The guarantee is for performance of all obligations by LTIFST in connection with its long term annuity services contracts with customer. The obligation under this guarantee is limited in aggregate to the amount of CAD 70,000,000.
# The Company had filed for refund of accumulated service tax credit in accordance with relevant CENVAT credit Rules. However, the department has disallowed certain portion of such refunds considering the same as ineligible as not related with output services. The Company is in appeal against these disallowances before the relevant Authorities and is hopeful of getting a favorable order.
Notes forming part of accounts

17Statutory Reports
72Financial Statements
01Corporate Overview
105
Notes forming part of accounts
34 Estimated amount of contracts remaining to be executed on capital account (net of advances) and not provided for: ` 178 Mn (previous year ` 151 Mn).
35 EMPLOYEE BENEFITS
I) The amounts recognised in balance sheet are as follows:
(` in Mn) Gratuity plan
As at 31-03-2018 As at 31-03-2017 a) Present value of defined benefit obligation - Wholly funded 798 684 - Wholly unfunded - - b) Fair value of plan assets as on* 670 527 Amount to be recognised as liability or (asset) (a-b) 128 157 Net liability/(asset)-current 128 157 Net liability/(asset)- non current - -
* Asset is not recognised in the balance sheet
(` in Mn) Post-retirement medical
benefit plan As at 31-03-2018 As at 31-03-2017
A.a) Present value of defined benefit obligation - Wholly funded - - - Wholly unfunded 171 175b) Fair value of plan assets - - Amount to be recognised as liability or (asset) (a-b) 171 175B. Amounts reflected in the balance sheet Liability 171 175 Assets - - Net liability/(asset) 171 175 Net liability/(asset)-current 2 1 Net liability/(asset)- non current 169 174
(` in Mn) Provident fund plan
(refer note (X)(iii) below) As at 31-03-2018 As at 31-03-2017
A.a) Present value of defined benefit obligation - Wholly funded 5,865 4,910 - Wholly unfunded - - b) Fair value of plan assets 5,914 4,939 Amount to be recognised as liability or (asset) (a-b)* (49) (29)B. Amounts reflected in the balance sheet Liability 78 62 Assets - - Net liability/(asset)# 78 62 Net liability/(asset)-current 78 62 Net liability/(asset)- non current - -
# Employer’s and employee’s contribution for March 2018 paid in April 2018 * Asset is not recognised in the balance sheet

Annual Report 2017-18106
Notes forming part of accounts
II) The amounts recognised in statement of profit and loss are as follows:
(` in Mn) Gratuity plan
As at 31-03-2018 As at 31-03-2017 i. Current service cost 135 112 ii. Past service cost 13 - iii. Administration expenses - - iv. Interest on net defined benefit liability / (asset) 7 3 v. (Gains) / losses on settlement - - Total expense charged to profit and loss account 155 115
(` in Mn) Post-retirement medical benefit plan
2017-18 2016-17 i. Current service cost 43 27 ii. Past service cost (7) - iii. Administration expenses - - iv. Interest on net defined benefit liability / (asset) 12 10 v. (Gains) / losses on settlement - - Total expense charged to profit and loss account 48 37
(` in Mn) Provident fund plan 2017-18 2016-17
1. Current service cost 271 274 2. Interest cost 440 373 3. Expected return on plan assets (440) (373)Total expense for the year included in staff cost 271 274
III) The amounts recognised in statement of other comprehensive income (OCI) are as follows:
(` in Mn)
Gratuity plan Post retirement medical benefit plan
2017-18 2016-17 2017-18 2016-17
Opening amount recognized in OCI 28 (14) 3 (11)
Re-measurements during the period due to:
Changes in financial assumptions 8 41 (32) 32
Experience adjustments (10) (5) (20) (18)
Actual return on plan assets less interest on plan assets (24) 6 - -
Closing amount recognized in OCI 2 28 (49) 3

17Statutory Reports
72Financial Statements
01Corporate Overview
107
IV) The changes in the present value of defined benefit obligation representing reconciliation of opening and closing balances thereof are as follows:
(` in Mn) Gratuity plan
2017-18 2016-17 Opening balance of defined benefit obligation 684 579 Current service cost 135 112 Past service cost 13 - Interest on defined benefit obligation 43 41 Re-measurements due toActurial loss / (gain) arising from change in financial assumption 8 41 Acturial loss / (gain) arising from change in demographic assumptions - - Acturial loss/ (gain) arising on account of experience changes (10) (5)Benefits paid (75) (84)Liabilities assumed / (settled)* - - Liabilities extinguished on settlements - - Closing balance of defined benefit obligation 798 684
* On account of business combination or inter -company transfer
(` in Mn) Post-retirement medical benefit plan
2017-18 2016-17 Opening balance of defined benefit obligation 174 124 Current service cost 44 27 Past service cost (7) - Interest on defined benefit obligation 12 10 Re-measurements due toActurial loss / (gain) arising from change in financial assumption (32) 31 Acturial loss / (gain) arising from change in demographic assumptions - - Acturial loss/ (gain) arising on account of experience changes (20) (18)Benefits paid - - Liabilities assumed / (settled)* - - Liabilities extinguished on settlements - - Closing balance of defined benefit obligation 171 174
* On account of business combination or inter-company transfer
(` in Mn) Provident fund plan 2017-18 2016-17
Opening balance of defined benefit obligation 4,910 4,254 Add : Interest cost 440 373 Add : Current service cost 271 274 Add : Contribution by plan participants 599 617 Add/(Less) : actuarial (gains)/losses - - Add: Business combination/acquisition - - Less: Assets acquired/(settled)* 287 (50)Liabilities assumed on acquisition/ (settled on divestiture) - - Less : Benefits paid (642) (558)Closing balance of defined benefit obligation 5,865 4,910
* On account of business combination or inter-company transfer
Notes forming part of accounts

Annual Report 2017-18108
V) Changes in the fair value of plan assets representing reconciliation of the opening and closing balances thereof are as follows:
(` in Mn)
Gratuity plan Post retirement medical benefit plan 2017-18 2016-17 2017-18 2016-17
Post-retirement medical benefit plan 527 493 4,939 4,264 Employer’s contributions 157 87 265 271 Expected return on plan assets 36 38 440 373 Administration expenses - - - - Actuarial gains / (loss) - - 312 47 Re-measurements due to:Actual return on plan assets less interest on plan assets 24 (7) - - Contribution by plan participants - - 602 592 Benefits paid (75) (84) (642) (558)Assets acquired/(settled)* - - (1) (50)Assets distributed on settlements - - Closing balance of plan assets 669 527 5,915 4,939
* On account of business combination or inter-company transfer
The Company expects to contribute ` 128 Mn (` 157 Mn in 2016-17) towards its gratuity, in the next financial year.
VI) The major categories of plan assets as a percentage of total plan assets are as follows:
(` in Mn) 2017-18
Gratuity plan Provident fund plan
Government of India securities
Scheme with LIC
23.05%State government securities 20.03%Corporate bonds 17.27%Fixed deposits under Special Deposit Scheme framed by central government for provident funds 5.74%Public sector bonds 28.45%Mutual Funds 3.01%Others 2.45%
VII) Principal actuarial assumptions at the balance sheet date :
(` in Mn) 2017-18 2016-17
i. Discount rate For gratuity 7.60% 6.75% For post -retirement medical benefits 7.60% 6.75%ii. Annual increase in healthcare costs (see note below) 5.00% 5.00%iii. Attrition rate : Varies between
2% to 18%Varies between
2% to 18%iv. Salary growth rate * 6.00% 5.00%
* Salary growth rate assumption has been revised to reflect the Company’s average salary growth rate and current market conditions
Notes forming part of accounts

17Statutory Reports
72Financial Statements
01Corporate Overview
109
VIII) Projected plan cash flow:
The table below shows the expected cash flow profile of the benefits to be paid to the current membership of the plan (which in case of serving employees, if any, is based on service accrued by employee up to valuation date):
As on 31 March 2018
(` in Mn) Maturity profile Gratuity Post-Retirement medical benefit liability Expected benefits for year 1 106 2 Expected benefits for year 2 101 2 Expected benefits for year 3 100 3 Expected benefits for year 4 98 3 Expected benefits for year 5 94 4 Expected benefits for year 6 89 5 Expected benefits for year 7 83 5 Expected benefits for year 8 76 6 Expected benefits for year 9 74 7 Expected benefits for year 10 and above 640 1,186
As on 31 March 2017
(` in Mn) Maturity profile Gratuity Post-Retirement medical benefit liabilityExpected benefits for year 1 96 1 Expected benefits for year 2 87 2 Expected benefits for year 3 86 2 Expected benefits for year 4 82 3 Expected benefits for year 5 77 3 Expected benefits for year 6 72 4 Expected benefits for year 7 66 5 Expected benefits for year 8 61 5 Expected benefits for year 9 54 6 Expected benefits for year 10 and above 469 1,036
The estimates of future salary increases considered in actuarial valuation, take into account inflation, seniority, promotion and other relevant factors, such as supply and demand in the employment market
IX) Sensitivity analysis
i) Post retirement benefits:
Although the obligation of the Company under the post-retirement medical benefit plan is limited to the overall ceiling limits, assumed healthcare cost trend rates may affect the amounts recognised in the statement of profit and loss. The benefit obligation results for the cost of paying future hospitalization premiums to insurance company and reimbursement of domiciliary medical expenses in future for the employee / beneficiaries during their lifetime is sensitive to discount rate, future increase in healthcare costs and longevity. The following table summarizes the impact in percentage terms on the reported defined benefit obligation at the end of the reporting period arising on account changes in these three key parameters:
Period ended 31 March 2018Discount RateImpact of increase in 100 bps on defined benefit obligation -17.38%Impact of decrease in 100 bps on defined benefit obligation 22.74%Healthcare costs rateImpact of increase in 100 bps on defined benefit obligation 17.71%Impact of decrease in 100 bps on defined benefit obligation -14.09%Life expectancyImpact of increase by 1 year on defined benefit obligation 0.57%Impact of decrease by 1 year on defined benefit obligation -0.59%
Notes forming part of accounts

Annual Report 2017-18110
ii) Gratuity:
Gratuity is a lump sum plan and the cost of providing these benefits is typically less sensitive to small changes in demographic assumptions. The key actuarial assumptions to which the benefit obligation results are particularly sensitive to are discount rate and future salary escalation rate. The following table summarizes the impact in percentage terms on the reported defined benefit obligation at the end of the reporting period arising on account of an increase or decrease in the reported assumption as below:
Period ended 31 March 2018Discount rate Salary
escalation rateImpact of increase in 100 bps on defined benefit obligation -6.08% 6.80%Impact of decrease in 100 bps on defined benefit obligation 6.82% -6.19%
X) General descriptions of defined benefit plans:
i) Gratuity plan
The Company makes contributions to the Company’s employees’ Company Gratuity-cum-Life Assurance Scheme of the Life Insurance Corporation of India, a funded defined benefit plan for qualifying employees. The scheme provides for lump sum payment to employees at retirement or death while in employment or termination of employment of an amount equivalent to 15 days salary for every completed year of service or part thereof in excess of six months, provided the employee has completed five years in service.
ii) Post-retirement medical benefit plan
The post-retirement medical benefit plan provides for reimbursement of health care costs to certain categories of employees post their retirement. The reimbursement is subject to an overall ceiling limit sanctioned at the time of retirement. The ceiling limits are based on cadre of the employee at the time of retirement.
i) Provident fund plan
The Company’s provident fund plan is managed by its holding company through a Trust permitted under the Provident Fund Act, 1952. The plan envisages contribution by employer and employees and guarantees interest at the rate notified by the Provident Fund Authority. The contribution by employer and employee together with interest are payable at the time of separation from service or retirement whichever is earlier. The benefit under this plan vests immediately on rendering of service.
The interest payment obligation of trust managed provident fund is assumed to be adequately covered by the interest income on long term investments of the fund. Any shortfall in the interest income over the interest obligation is recognised immediately in the statement of profit and loss as actuarial loss. Any loss arising out of the investment risk and actuarial risk associated with the plan is also recognised as expense in the period in which such loss occurs. Further, on amount of ` Nil has been provided based on actuarial valuation towards the future obligation arising out of interest rate guarantee associated with the plan.
36 FINANCIAL INSTRUMENTS BY CATEGORY
I) Carrying value of financial instruments by categories are as follows:
(` in Mn) As at 31-03-2018 As at 31-03-2017
Fair value through P&L
(FVTPL)
Fair value through OCI
(FVTOCI)
Amortised cost
Total Fair value through P&L
(FVTPL)
Fair value through OCI
(FVTOCI)
Amortised cost
Total
Financial assetsInvestments 12,645 - - 12,645 9,406 - - 9,406 Trade receivables - - 13,275 13,275 - - 11,226 11,226 Unbilled revenue - - 8,191 8,191 - - 4,668 4,668 Cash and cash equivalents - - 2,479 2,479 - - 1,872 1,872 Other bank balances - - 19 19 - - 34 34 Loans - - 619 619 - - 465 465 Derivative financial instruments (50) 2,351 - 2,301 220 3,897 - 4,117Other financial assets - - 386 386 - - 262 262 Total 12,595 2,351 24,969 39,915 9,626 3,897 18,527 32,050
Notes forming part of accounts

17Statutory Reports
72Financial Statements
01Corporate Overview
111
(` in Mn) As at 31-03-2018 As at 31 March 2017
Fair value through P&L
(FVTPL)
Fair value through OCI
(FVTOCI)
Amortised cost
Total Fair value through P&L
(FVTPL)
Fair value through OCI
Amortised cost
Total
Financial liabilityCurrent maturities of long term borrowings
- - - - - - - -
Trade payables - - 3,708 3,708 - - 3,354 3,354 Other financial liabilities - - 6,035 6,035 - - 5,925 5,925 Total - - 9,743 9,743 - - 9,279 9,279
II) Fair value hierarchy used by the Company for valuation of financial assets and liabilities recognised at FVTPL and FVTOCI is as below:
Level 1- Quoted prices (unadjusted) in the active markets for identical assets or liabilities.
Level 2- Inputs other than quoted prices included with in level 1 that are observable for assets or liabilities either directly or indirectly.
Level 3- Inputs for assets or liabilities that are not based on observable market data
(` in Mn)
As at 31-03-2018 As at 31-03-2017Level 1 Level 2 Level 3 Total Level 1 Level 2 Level 3 Total
Investments 12,644 - 1 12,645 9,406 - - 9,406 Derivative financial instruments - 2,301 - 2,301 - 4,117 - 4,117 Total 12,644 2,301 1 14,946 9,406 4,117 - 13,523
III) Financial risk management
The Company is exposed to foreign currency risk, interest rate risk, credit or counterparty risk and liquidity risk.
i) Currency risk
Primary market risk to the Company is foreign exchange risk.
The Company uses derivative financial instruments to mitigate foreign exchange related exposures. All derivative activities for risk management purposes are carried out by specialist teams that have the appropriate skills, experience and supervision.
The Company’s revenues are principally in foreign currencies and the maximum exposure is in US dollars.
The Board of Directors has approved the Company’s financial risk management policy covering management of foreign currency exposures. The treasury department monitors the foreign currency exposures and takes appropriate forward covers to mitigate its risk. The Company hedges its exposure on a net basis (i.e. expected earnings in foreign currency less expected expenditure in related currency) These hedges are cash flow hedges as well as hedges not designated as cash flow hedges.
The Company does not enter into hedge transactions for either trading or speculative purposes.
The outstanding forward contracts at the year end their maturity profile and sensitivity analysis are as under.
Fair value of forward contracts designated as cash flow hedges of USD-INR as at 31 March 2018 and 31 March 2017 was ̀ 49,722 Mn and ` 57,886 Mn respectively. Outstanding number of contracts as at 31 March 2018 were 266 and 31 March 2017 were 269
A) Notional value of forward contracts designated as cash flow hedges is given as below:
(` in Mn)
Currency As at 31-03-2018 As at 31-03-2017Amount in
USD MnAmount in ` Mn Amount in
USD MnAmount in ` Mn
USD-INR 730 52,945 848 61,818
Notes forming part of accounts

Annual Report 2017-18112
B) The foreign exchange forward contracts designated as cash flow hedges mature maximum within 36 months. The table below analyses the derivative financial instrument into relevant maturity Companying based on the remaining period as of the balance sheet. Contracts with maturity not later than twelve months include certain contracts which can be rolled over to subsequent periods in line with underlying exposures:
(` in Mn) In USD As at
31-03-2018As at
31-03-2017Not later than twelve months 26,192 29,509 Later than twelve months 26,753 32,309 Total 52,945 61,818
C) Value-at-Risk (VaR)
To provide a meaningful assessment of the foreign currency risk associated with the Company’s foreign currency derivative positions against off balance sheet exposures and unhedged portion of on-balance sheet exposures, the Company uses a multi-currency correlated VaR model. The VaR model uses a Monte Carlo simulation to generate thousands of random market price paths for foreign currencies against Indian rupee taking into account the correlations between them. The VaR is the expected loss in value of the exposures due to overnight movement in spot exchange rates, at 95% confidence interval. The VaR model is not intended to represent actual losses but is used as a risk estimation tool. The model assumes normal market conditions and is a historical best fit model. Because the Company uses foreign currency instruments for hedging purposes, the loss in fair value incurred on those instruments are generally offset by increases in the fair value of the underlying exposures for on-balance sheet exposures. The overnight VaR of the Company at 95% confidence level is ` 313 Mn as at 31 March 2018 (` 410 Mn as at 31 March 2017).
Actual future gains and losses associated with forward contracts designated as cash flow hedge may differ materially from the sensitivity analyses performed as of 31 March 2018 due to the inherent limitations associated with predicting the timing and amount of changes in foreign currency exchanges rates and the Company’s actual exposures and position.
ii) Interest risk
The Company has no interest rate risk in case of borrowings as on 31 March 2018. However the Company invests its surplus funds in Debt mutual funds. The Company mitigates the risk of counter-party failure by investing in mutual fund schemes with large asset under management and having investments in debt instruments issued with sound credit rating.
Net assets value (NAV) of debt mutual funds are subject to changes in interest rates. Every one percent increase or decrease in the NAV of debt mutual funds where the company holds investments will impact he Company’s profit after tax by ` 126 Mn in 2017-18 (` 94 Mn in 2016-17).
iii) Credit risk
The principal credit risk that the Company exposed to is non-collection of trade receivable and late collection of receivable leading to credit loss. The risk is mitigated by reviewing creditworthiness of the prospective customers prior to entering into contract and post contracting, through continuous monitoring of collections by a dedicated team.
The Company makes adequate provision for non-collection of trade receivable. Further, the Company has not suffered significant payment defaults by its customers.
In addition, for delay in collection of receivable, the Company has made provision for Expected Credit loss (‘ECL’) based on ageing analysis of its trade receivable. These range from 1.5% for dues outstanding up to six months to 19.2% for dues outstanding for more than 36 months for 2017-18 (Previous year 1.7% and 21.3% for dues outstanding up to 6 months and for more than 36 months respectively). No provision has been made on trade receivables in not due category.
Notes forming part of accounts

17Statutory Reports
72Financial Statements
01Corporate Overview
113
ECL allowance for non-collection of receivable and delay in collection, on a combined basis was ` 67 Mn and ` 65 Mn for the financial years 2017-18 and 2016-17 respectively. The movement in allowance for doubtful debts comprising provision for both non-collection of receivables and delay in collections is as follows:
(` in Mn) 2017-18 2016-17
Opening balance 65 62 Impairment loss recognised or (reversed) 2 3 Closing balance 67 65
The percentage of revenue from its top five customers is 36.8% for 2017-18 (37.6% for 2016-17).
The Company is exposed to counter-party risk in relation to financial instruments taken to hedge its foreign currency risks. The counter- parties are banks and the Company has entered into contracts with the counter-parties for all its hedge instruments and in addition, entered into suitable credit support agreements to cap counter party risk where necessary.
iv) Liquidity risk
The Company’s treasury department monitors the cash flows of the Company and surplus funds are invested in non- speculative financial instruments that are usually highly liquid funds.
The Company has no borrowings as on 31 March 2018 but it has credit facilities with banks that will help it to generate funds for the business if required.
The contractual maturities of financial assets and financial liabilities is as follows:
(` in Mn)
As at 31-03-2018 As at 31-03-2017Within a year More than
one yearTotal Within a year More than
one yearTotal
Trade payables 3,708 - 3,708 3,354 - 3,354 Other financial liabilities 5,831 204 6,035 5,926 - 5,926 Total 9,539 204 9,743 9,280 - 9,280
(` in Mn)
As at 31-03-2018 As at 31-03-2017Within a year More than
one yearTotal Within a year More than
one yearTotal
Investments 12,644 1 12,645 9,406 9,406 Trade receivables 13,275 13,275 11,226 - 11,226 Unbilled revenue 8,191 8,191 4,668 - 4,668 Cash and cash equivalent 2,479 2,479 1,872 - 1,872 Other bank balances 19 19 34 - 34 Loans 235 384 619 154 311 465 Derivative financial instruments 1,580 721 2,301 2,251 1,866 4,117 Other financial assets 386 - 386 262 262 Total 38,808 1,106 39,915 29,873 2,177 32,050
Notes forming part of accounts

Annual Report 2017-18114
37 LEASES
Operating leases
The Company has taken certain premises, office equipment and employee cars under non-cancellable operating leases. The rental expense in respect of operating leases was ` 1,842 Mn. (previous year ` 1,686 Mn) and the future rentals payable are as follows:
(` in Mn) 2017-18 2016-17
Minimum lease payments -payable not later than 1 year 993 917 -payable after 1 year but not later than 5 years 3,263 3,643 -payable after 5 years 502 584
4,758 5,144
38 AUDITOR’S REMUNERATION (excluding taxes) charged to the accounts include:
(` in Mn) 2017-18 2016-17
Audit fees 2 2 Tax audit fees 1 0Other services 2 2 Expense reimbursement - -
5 4
39 BASIC AND DILUTED EARNINGS PER SHARE (EPS) AT FACE VALUE OF ` 1
2017-18 2016-17 Profit after tax (` in Mn) 11,601 9,376 Weighted average number of shares outstanding 171,250,145 170,112,899 Basic EPS (`) 67.74 55.11 Weighted average number of shares outstanding 171,250,145 170,112,899 Add:Weighted average number of potential equity shares on account of employee stock options 3,927,388 3,879,583 Weighted average number of shares outstanding 175,177,533 173,992,482 Diluted EPS (`) 66.23 53.89
Notes forming part of accounts

17Statutory Reports
72Financial Statements
01Corporate Overview
115
40 AMALGAMATION OF SUBSIDIARY
AugmentIQ Data Sciences Private Limited (‘AugmentIQ’) and the Company on 23 June 2017 had filed, an application with Hon’ble National Company Law Tribunal, Mumbai Bench (NCLT), for sanctioning the Scheme of Amalgamation of AugmentIQ with the Company under section 230 – 232 of the Companies Act, 2013 and the rules made thereunder. NCLT had admitted the application and ordered a meeting of shareholders of AugmentIQ and the Company on 23 August 2017 and 24 August 2017, respectively. The Shareholders of AugmentIQ and the Company, respectively had approved the scheme of amalgamation. Subsequently, AugmentIQ and the Company had filed a petition with NCLT on 07 September 2017. The Scheme was sanctioned by the NCLT vide its order dated 02 May 2018. The Scheme was filed with the Registrar of Companies on 21 May 2018 and came into effect on that day with appointed date being 01 April 2017. Consequently, the business, assets, liabilities, duties and obligations of AugmentIQ have been transferred to and vested in the Company from the appointed date of 01 April 2017.
Pursusant to the aforementioned scheme of amalgamation, figures for the year ended 31 March 2018 includes the results of AugmentIQ for the year ended 31 March 2018.
The amalgamation is accounted in accordance with ‘pooling of interest method’ as per Ind AS 103 ‘Business Combinations’ and in accordance with scheme approved by NCLT.
I) All assets and liabilities (including contingent liabilities),reserves, benefits under income-tax, duties and obligations of AugmentIQ have been recorded in the books of account of the Company at their carrying amounts.
II) The amount of share capital of AugmentIQ has been adjusted against the corresponding investment balance held by the Company in the amalgamating company and the excess of share capital over the investment has been adjusted against general reserve.
III) Accordingly, the amalgamation has resulted in transfer of assets and liabilities as on 1 April 2017 in accordance with the terms of the Scheme at the following summarized values:
(` in Mn) Particulars AmountProperty, Plant and Equipment/Intangible Assets 1Income tax and other non-current assets 5Other Current assets 44Total assets 50Total Liabilities 39Net assets 11
The following balances as on 1 April 2017 have been added to the respective opening balances of the Company:
(` in Mn) General reserve - Profit and loss balance (0)
The amount charged against general reserve of the Company pursuant to amalgamation is as follows:
(` in Mn) Investment in the AugmentIQ Data Sciences Private Limited 71Share capital taken over from AugmentIQ Data Sciences Private Limited 11Amount charged against general reserve 60
41 ACQUISITION OF SUBSIDIARY
On 11 December 2017, the company acquired Syncordis Software Services India Private Limited, a wholly owned subsidiary of Syncordis S.A with an enterprise value of Euro 0.35 million, revenue of which was ` 30.22 million for the year 2016-17.
Notes forming part of accounts

Annual Report 2017-18116
42 RELATED PARTY DISCLOSURE:
(I) Parent company / Ultimate holding company: Larsen & Toubro Limited
(II) List of related parties over which control exists/exercised:
Name RelationshipLarsen & Toubro Infotech GmbH (LTI GmbH) Wholly owned subsidiaryLarsen & Toubro Infotech Canada Limited Wholly owned subsidiaryLarsen & Toubro Infotech LLC Wholly owned subsidiaryL&T Infotech Financial Services Technologies Inc. Wholly owned subsidiaryLarsen & Toubro Infotech South Africa (Pty) Limited SubsidiaryL&T Information Technology Services (Shanghai) Co. Ltd. Wholly owned subsidiaryLarsen & Toubro Infotech Austria GmbH Wholly owned subsidiaryL&T Information Technology Spain, SL Wholly owned subsidiaryL&T Infotech S.de. RL. C.V SubsidiarySyncordis Software Services India Private Limited Wholly Owned SubsidiarySyncordis S.A. Luxembourg # Wholly Owned Subsidiary of LTI GmbHSyncordis SARL, France Wholly Owned Subsidiary of LTI GmbHSyncordis Limited, UK Wholly Owned Subsidiary of LTI GmbHSyncordis PSF S.A. Wholly Owned Subsidiary of LTI GmbH
(III) Key Management Personnel:
Name Status Mr. Sanjay Jalona Chief Executive Officer & Managing Director Mr. Aftab Zaid Ullah Chief Operating Officer & Whole Time Director Mr. Sudhir Chaturvedi President – Sales & Whole Time Director Mr. Ashok Kumar Sonthalia Chief Financial Officer
(IV) List of related parties with whom there were transactions during the year:
Name RelationshipLarsen & Toubro Limited Holding CompanyL&T Hydrocarbon Engineering Limited Fellow SubsidiaryLarsen & Toubro (East Asia) SDN.BHD Fellow SubsidiaryL&T Electrical and Automation Saudi Arabia Company Limited LLC Fellow SubsidiaryLarsen and Toubro ATCO Saudia LLC Fellow SubsidiaryL&T Finance Limited Fellow SubsidiaryL&T Infrastructure Finance Company Limited Fellow SubsidiaryL&T Metro Rail (Hyderabad) Limited Fellow SubsidiaryL&T Technology Services Limited Fellow SubsidiaryL&T Valves Limited Fellow SubsidiaryL&T Investment Management Limited Fellow SubsidiaryL&T Construction Equipment Limited Fellow SubsidiaryLarsen & Tourbro LLC Fellow SubsidiaryNabha Power Limited Fellow SubsidiaryL&T Electrical & Automation FZE Fellow SubsidiaryL&T Thales Technology Services Private Limited Fellow SubsidiaryL&T Housing Finance Limited Fellow SubsidiaryL&T Technology Services LLC Fellow SubsidiaryLarsen Toubro Arabia LLC Fellow SubsidiaryL&T SAUDIARABIA LLC Fellow SubsidiaryL&T Infrastructure Development Projects Limited Joint venture of Holding CompanyL&T MHPS Boilers Private Limited Joint venture of Holding CompanyL&T Deccan Tollways Limited Joint venture of Holding CompanyL&T Sambalpur - Rourkela Tollway Limited Joint venture of Holding Company
Notes forming part of accounts

17Statutory Reports
72Financial Statements
01Corporate Overview
117
Details of transactions between the Company and other related parties are disclosed below.
(` in Mn) Transaction Holding company
2017-18 2016-17Sale of services / products 1,180 1,279 Sale of assets 4 1 Purchases of services / products 99 161 Overheads charged by 543 557 Overheads charged to 70 223 Trademark fees paid 191 167 Trade receivable 185 82 Interim dividend 1,150 985 Contributions to PF 265 271 Guarantees received 2,023 2,023 Final dividend paid 1,394 441
(` in Mn) Transaction Joint venture of Holding Company
2017-18 2016-17Sale of services / products 17 11 L&T Infrastructure Development Projects Limited 10 7 L&T MHPS Boilers Private Limited - 2 L&T Deccan Tollways Limited 3 - L&T Sambalpur - Rourkela 4 -
(` in Mn) Transaction Fellow subsidiaries
2017-18 2016-17Sale of services / products 415 366 - L&T Technology Services Limited 128 114 - L&T Hydrocarbon Engineering Limited 87 69 - L&T Thales Technology Services Private Limited 68 101 Sale of assets 1 8 L&T Technology Services Limited 1 7 Purchases of services / products 649 553 - L&T Technology Services Limited 644 553 Overheads charged by 54 40 - Larsen & Toubro East Asia 50 23 - L & T Electrical & Automation FZE - 2 - Larsen & Toubro Kuwait Construction General Contracting Company, WLL - - - L&T Technology Services Limited 2 14 Overheads charged to 215 290 - L&T Technology Services Limited 193 279 Commission charged 3 3 Trade receivable 95 477 Trade payable 60 154
Notes forming part of accounts

Annual Report 2017-18118
(` in Mn) Transaction Subsidiaries
2017-18 2016-17Sale of services / products 1,659 1,887 - Larsen & Toubro Infotech GmbH 376 449 - L&T Infotech Financial Services Technologies Inc. 310 317 - Larsen & Toubro Infotech South Africa (Pty) Limited 213 223 - Larsen & Toubro Infotech Canada Limited 373 443 - L&T Information Technology Spain, SL 375 413 Purchases of services / products 444 435 - Larsen & Toubro Infotech LLC 68 94 - Larsen & Toubro Infotech Canada Limited 310 215 - L&T Information Technology Spain, SL - 51 - Larsen & Toubro Infotech Austria GmbH - 60 Overheads charged by 1 27 - Larsen & Toubro Infotech GmbH - 13 - L&T Information Technology Spain, SL - 6 - Larsen & Toubro Infotech South Africa (Pty) Limited - 7 - L&T Infotech Financial Services Technologies Inc. 1 - Overheads charged to 227 344 - Larsen & Toubro Infotech Canada Limited 73 67 - Larsen & Toubro Infotech GmbH 35 59 - Larsen & Toubro Infotech South Africa (Pty) Limited 2 13 - L&T Information Technology Spain, SL 80 177 Commission charged 2 4 - Larsen & Toubro Infotech South Africa (Pty) Limited 2 4 Dividend received 579 141 - Larsen & Toubro Infotech Canada Limited - 50 - L&T Infotech Financial Services Technologies Inc. 393 90 - Larsen & Toubro Infotech GmbH 98 - Larsen & Toubro Infotech LLC 88 Trade receivable 482 79 Trade payable 24 118 Guarantees given (Refer note 33) 3,456 3,726
(V) Outstanding material balances with related parties*
(` in Mn)
Transaction Nature Amount (Payable) / Receivable2017-18 2016-17
L&T Thales Technology Services Private Limited Trade receivable 23 15 Larsen & Toubro LLC Trade receivable 16 - L & T Hydrocarbon Engineering Limited Trade receivable 21 - L&T Technology Services Limited Trade (payable)/receivable (54) (145)L&T Infotech Financial Services Technologies Inc. Trade receivable 56 L&T Information Technology Spain, SL Trade receivable 147 194 Larsen & Toubro Infotech South Africa (Pty) Limited Trade receivable 152 66 Larsen & Toubro Infotech GmBH Trade receivable 114 98 Larsen & Toubro Infotech LLC Trade (payable) (23) (117)
* All balances are unsecured and to be settled in cash.
Entities listed above account for 10% or more of the aggregate for that category of transaction during respective period.
Notes forming part of accounts

17Statutory Reports
72Financial Statements
01Corporate Overview
119
(VI) Managerial remuneration
(` in Mn) 2017-18 2016-17
(i) Short term employee benefits 176 169 (ii) Contribution to funds 13 10 (iii) Share based payments (on employee stock options granted) - 286
(` in Mn) 2017-18 2016-17
Mr. Sanjay Jalona 86 214 Mr. Aftab Zaid Ullah 29 97 Mr. Sudhir Chaturvedi 63 123
43 SEGMENT REPORTING
Segments have been identified in accordance with Indian Accounting Standards (“Ind AS”) 108 on Operating Segments, considering the risk or return profiles of the business. As required under Ind AS 108, the Chief Operating Decision Maker (CODM) evaluates the performance and allocates resources based on analysis of various performance indicators. Accordingly, information has been presented for the Company’s operating segments.
Reportable segments have been changed during the year ended 31 March 2018 to align with the Industry vertical of customers. The Company has identified segments as Banking, Financial Services & Insurance (BFSI), Manufacturing (MFG), Energy & Utilities (E&U), High–Tech, Media & Entertainment (HIME) and CPG, Retail, Pharma & Others (CRP & Others). The Company has presented its segment results accordingly. The reportable segment information for the corresponding previous year has been restated to reflect the above changes to facilitate comparability.
I) The revenue and operating profit by segment is as under:
(` in Mn) 2017-18 2016-17
Segment revenueBanking, Financial Services & Insurance 31,341 28,140 Manufacturing 11,867 11,639 Energy & Utilities 8,488 7,151 High-Tech, Media & Entertainment 7,535 6,651 CPG, Retail, Pharma & Others 9,833 8,248 Revenue from operations 69,064 61,829 Segment resultsBanking, Financial Services & Insurance 5,994 6,118 Manufacturing 1,597 2,082 Energy & Utilities 1,403 997 High-Tech, Media & Entertainment 1,044 1,159 CPG, Retail, Pharma & Others 1,340 1,053 Segment results 11,378 11,409 Unallocable expenses (net)* 897 429 Other income 5,254 1,983 Finance costs 138 32 Depreciation & amortisation expense 913 1,089 Profit before tax 14,684 11,842
* Unallocated expenses includes customer settlement expense which is in relation to one time commercial settlement entered by the Company with one of its clients on 27 March 2018.
Notes forming part of accounts

Annual Report 2017-18120
Notes forming part of accounts
II) Segmental reporting of revenues on the basis of the geographical location of the customers is as under:
(` in Mn) Geography Revenue from operations
2017-18 2016-17North America 46,973 42,249 Europe 11,927 11,267 India 5,326 4,361 APAC 1,849 1,562 ROW 2,989 2,390 Total 69,064 61,829
44 DUES TO MICRO ENTERPRISES AND SMALL ENTERPRISES:
(` in Mn) As at
31-03-2018As at
31-03-2017i) the principal amount and the interest due thereon remaining unpaid to any supplier as at the
end of each accounting year;
- -
ii) the amount of interest paid by the Company in terms of section 16 of MSMED Act, 2006, along with the amounts of the payment made to the suppliers beyond the appointed day during the year
- -
iii) the amount of interest due and payable for the period of delay in making payment (which have been paid but beyond the appointed day during the year) but without adding the interest specified under MSMED Act, 2006
- -
iv) the amount of interest accrued and remaining unpaid at the end of each accounting year; and - -
v) the amount of further interest remaining due and payable even in the succeeding years, until such date when the interest dues as above are actually paid to the small enterprise, for the purpose of disallowance as a deductible expenditure under section 23 of the MSMED Act, 2006.
- -
# The management has identified micro and small enterprises as defined under Micro, Small and Medium Enterprises Development Act, 2006 (MSMED) on the basis of information made available by the supplier or vendors of the Company. Based on the information available with the Company, as at the year end, there are- no dues to micro and small Enterprises that are reportable under the MSMED Act, 2006.
- -
45 Amount required to be spent by the Compnay on Corporate Social Responsibility (CSR) related activities during the year 2017-18 is ` 191 Mn. The amount recognised as expense in the statement of profit & loss on CSR related activities during the year ended 31 March 2018 is ` 117 Mn, which comprises of:
(` in Mn)
Particulars Disclosed under In cash Yet to be paid in cash TotalGeneral purposes Miscellaneous expenses
in Note No 28116 1 117

17Statutory Reports
72Financial Statements
01Corporate Overview
121
Notes forming part of accounts
46 EVENTS OCURRING AFTER THE REPORTING PERIOD:
The Board of Directors at its meeting held on 23 May 2018, has declared final dividend of ` 13.50 per equity share (Face value ` 1) for the financial year ended 31 March 2018.
47 The company is not required to transfer any amount to Investor Education and Protection Fund.
48 Previous year’s figures have been regrouped/reclassified wherever applicable to facilitate comparability.
49 The financial statements were approved by the Board of Directors on 23 May 2018.
As per our report attached
B. K. Khare & Co Sanjay Jalona Aftab Zaid UllahChartered Accountants Chief Executive Officer & Managing Director Chief Operating Officer & Whole Time DirectorFirm's Registration No. 105102W DIN : 07256786 DIN : 05165334
Ravi Kapoor Ashok Kumar Sonthalia Manoj KoulPartner Chief Financial Officer Company Secretary & Compliance OfficerMembership No: 040404
MumbaiMay 23, 2018

Annual Report 2017-18122
To the Members of Larsen & Toubro Infotech Limited.
Report on the Consolidated Financial Statements
1. We have audited the accompanying consolidated Ind AS financial statements of Larsen & Toubro Infotech Limited (“the Holding Company”) and its subsidiaries (the Holding Company and its subsidiaries together are referred to as “the Group”), comprising the consolidated balance sheet as at 31 March 2018, and the consolidated statement of profit and loss (including other comprehensive income), the consolidated cash flow statement, and consolidated statement of changes in equity for the year then ended, and a summary of the significant accounting policies and other explanatory information (hereinafter referred to as “the consolidated financial statements”).
Management’s Responsibility for the Consolidated Financial Statements
2. The Holding Company’s Board of Directors is responsible for the preparation of these consolidated financial statements in terms of the requirements of the Companies Act, 2013 (“the Act”) that give a true and fair view of the consolidated financial position, consolidated financial performance (including other comprehensive income), consolidated cash flows and consolidated statement of changes in equity of the Group in accordance with the accounting principles generally accepted in India, including the Accounting Standards specified under Section 133 of the Act, read with the Companies (Indian Accounting Standards) Rules, 2015 as amended. The respective Board of Directors of the companies included in the Group are responsible for maintenance of adequate accounting records in accordance with the provisions of the Act for safeguarding the assets of the Group and for preventing and detecting frauds and other irregularities; the selection and application of appropriate accounting policies; making judgements and estimates that are reasonable and prudent; and the design, implementation and maintenance of adequate internal financial controls, that were operating effectively for ensuring the accuracy and completeness of the accounting records, relevant to the preparation and presentation of the financial statements that give a true and fair view and are free from material misstatement, whether due to fraud or error, which have been used for the purpose of the preparation of the consolidated financial statements by the directors of the Holding Company, as aforesaid.
Auditor’s Responsibility
3. Our responsibility is to express an opinion on these consolidated financial statements based on our audit.
4. While conducting our audit, we have taken into account the provisions of the Act, the accounting and auditing standards and matters which are required to be included in the audit report under the provisions of the Act and the Rules made there under.
5. We conducted our audit in accordance with the Standards on Auditing specified under Section 143(10) of the Act. Those
Independent Auditor’s ReportStandards require that we comply with ethical requirements and plan and perform the audit to obtain reasonable assurance about whether the financial statements are free from material misstatement.
6. An audit involves performing procedures to obtain audit evidence about the amounts and the disclosures in the consolidated financial statements. The procedures selected depend on the auditor’s judgment, including the assessment of the risks of material misstatement of the consolidated financial statements, whether due to fraud or error. In making those risk assessments, the auditor considers internal financial control relevant to the Holding Company’s preparation of the consolidated financial statements that give a true and fair view in order to design audit procedures that are appropriate in the circumstances. An audit also includes evaluating the appropriateness of the accounting policies used and the reasonableness of the accounting estimates made by the Holding Company’s Board of Directors, as well as evaluating the overall presentation of the consolidated financial statements.
7. We believe that the audit evidence obtained by us and the audit evidence obtained by the other auditors in terms of their reports referred to paragraph 9 of the Other Matter paragraph below, is sufficient and appropriate to provide a basis for our audit opinion on the consolidated financial statements.
Opinion
8. In our opinion and to the best of our information and according to the explanations given to us, the aforesaid consolidated financial statements give the information required by the Act in the manner so required and give a true and fair view in conformity with the accounting principles generally accepted in India of the consolidated state of affairs of the Group, as on 31 March 2018, and its consolidated profit (financial performance including other comprehensive income), consolidated cash flows and consolidated statement of changes in equity for the year ended.
Other Matters
9. a. We did not audit the financial statements of seven subsidiaries included in the consolidated financial statements, whose financial statements reflect total assets (before consolidation adjustments) of ` 5,620 million as at 31 March 2018, total revenue (before consolidation adjustments) of ` 5,539 million and total cash flow of ̀ 240 million for the year ended 31 March 2018. These financial statements and other financial information have been audited by other auditors whose reports have been furnished to us, and our opinion on the Consolidated Financial Statements, to the extent they have been derived from such financial statements is based solely on the report of such other auditors.
b. We did not audit the financial statements of seven subsidiaries whose financial statements reflect total assets

17Statutory Reports
72Financial Statements
01Corporate Overview
123
(before consolidation adjustments) of ` 680 million as at 31 March 2018 as well as total revenue (before consolidation adjustments) of ` 602 million and total cash flow of ` 206 million for the year then ended. These financial statements and other financial information are unaudited and have been furnished to us by the management, and our opinion on the consolidated financial statements, insofar as it relates to the amounts and disclosures included in respect of these subsidiaries and our report in terms of sub sections (3) and (11) of Section 143 of the Act, insofar as it relates to the aforesaid subsidiaries is based solely on such unaudited financial statements / financial information. In our opinion and according to the information and explanations given to us by the management, these financial statements / financial information after consolidation adjustments, are not material to the Group.
c. Subsidiaries referred to in para (a) and (b) above which are located outside India whose financial statements and other financial information have been prepared in accordance with the accounting principles applicable in their respective countries. The Holding Company‘s management has converted the financial statements of such subsidiaries located outside India from accounting principles generally accepted in their respective countries to accounting principles generally accepted in India. We have audited these conversion adjustments made by the Holding Company‘s management. Our opinion in so far as it relates to the balances and affairs of such subsidiaries located outside India is based on the report of other auditors and the conversion adjustments prepared by the management of the Holding Company and audited by us.
d. Our opinion on the consolidated financial statements, and our report on Other Legal and Regulatory Requirements below, is not modified in respect of the above matters with respect to our reliance on the work done and the reports of the other auditors.
Report on Other Legal and Regulatory Requirements
10. As required by Section 143(3) of the Act, we report that:
a. we have sought and obtained all the information and explanations which to the best of our knowledge and belief were necessary for the purposes of our audit of the consolidated financial statements;
b. in our opinion proper books of account as required by law relating to preparation of the consolidated financial statements have been kept by the Holding Company so far as it appears from our examination of those books and the reports of the other auditors;
c. the consolidated balance sheet, the consolidated statement of profit and loss, the consolidated cash flow statement and consolidated statement of changes in equity dealt with by this Report are in agreement with the relevant books of account maintained for the purpose of preparation of the consolidated financial statements;
d. In our opinion, the aforesaid consolidated financial statements comply with the Accounting Standards specified under Section 133 of the Act, read with the Companies (Indian Accounting Standards) Rules, 2015 as amended;
e. on the basis of written representations received from the directors of the Holding Company as on 31 March 2018 taken on record by the Board of Directors of the Holding Company and the report of the statutory auditors of its subsidiary companies, incorporated in India, none of the directors of the aforesaid companies, is disqualified as on 31 March 2018, from being appointed as a director in terms of Section 164(2) of the Act.
f. With respect to the adequacy of the internal financial controls over financial reporting of the Holding Company and its Indian subsidiaries and the operating effectiveness of such controls, refer our separate report in Annexure I, which is based on auditors’ reports of Holding Company. Our report express an unmodified opinion on the adequacy and operating effectiveness of the Holding Company internal financial control over financial reporting.
g. With respect to the other matters to be included in the Auditor’s Report in accordance with Rule 11 of the Companies (Audit and Auditors) Rules, 2014 (as amended), in our opinion and to the best of our information and according to the explanations given to us:
i. The consolidated financial statements disclose the impact of pending litigations on the consolidated financial position of the Group in accordance with the generally accepted accounting practice – Refer Note 32 to the consolidated financial statements.
ii. The Group did not have any long-term contracts for which there were any material foreseeable losses. Provision has been made in the consolidated financial statements as required under the applicable law or accounting standards, for material foreseeable losses, if any, on derivative contracts.
iii. There are no amounts which are required to be transferred to the Investor Education and Protection Fund by the Holding Company and its subsidiary companies incorporated in India during the year ended 31 March 2018.
For B. K. Khare & Co.Chartered Accountants
Firm’s Registration Number 105102W
Ravi KapoorPartner
Mumbai, May 23, 2018 Membership Number: 040404

Annual Report 2017-18124
Report on the Internal Financial Controls under Clause (i) of Sub-
section 3 of Section 143 of the Companies Act, 2013 (“the Act”)
In conjunction with our audit of the consolidated financial statements
of the Larsen & Toubro Infotech Limited as of 31 March 2018 and for the
year then ended we have audited the internal financial controls over
financial reporting of Larsen & Toubro Infotech Limited (hereinafter
referred to as “the Holding Company”) and its one subsidiary company
incorporated in India, whose financials statements are unaudited
(“hereinafter referred as the “Group”), as of that date.
Management’s Responsibility for Internal Financial Controls
The respective Board of Directors of the of the Holding company
and its Indian Subsidiary Company are responsible for establishing
and maintaining internal financial controls based on the internal
control over financial reporting criteria established by the respective
Companies considering the essential components of internal control
stated in the Guidance Note on Audit of Internal Financial Controls
Over Financial Reporting issued by the Institute of Chartered
Accountants of India (“ICAI”). These responsibilities include the
design, implementation and maintenance of adequate internal
financial controls that were operating effectively for ensuring the
orderly and efficient conduct of its business, including adherence
to the respective company’s policies, the safeguarding of its assets,
the prevention and detection of frauds and errors, the accuracy and
completeness of the accounting records, and the timely preparation
of reliable financial information, as required under the Companies
Act, 2013 (“the Act”).
Auditors’ Responsibility
Our responsibility is to express an opinion on the Company’s internal
financial controls over financial reporting based on our audit. We
conducted our audit in accordance with the Guidance Note on Audit of
Internal Financial Controls Over Financial Reporting (the “Guidance
Note”) and the Standards on Auditing, issued by ICAI and deemed to
be prescribed under section 143(10) of the Companies Act, 2013, to
the extent applicable to an audit of internal financial controls, both
applicable to an audit of internal financial controls and, both issued by
the Institute of Chartered Accountants of India. Those Standards and
the Guidance Note require that we comply with ethical requirements
and plan and perform the audit to obtain reasonable assurance about
whether adequate internal financial controls over financial reporting
was established and maintained and if such controls operated
effectively in all material respects.
Annexure I to the Independent Auditor’s ReportReferred to in paragraph 10(f) of our report of even date on the Consolidated Financial Statements of Larsen & Toubro Infotech Limited for the year ended 31 March 2018
Our audit involves performing procedures to obtain audit evidence
about the adequacy of the internal financial controls system over
financial reporting and their operating effectiveness. Our audit of
internal financial controls over financial reporting included obtaining
an understanding of internal financial controls over financial
reporting, assessing the risk that a material weakness exists, and
testing and evaluating the design and operating effectiveness of
internal control based on the assessed risk. The procedures selected
depend on the auditor’s judgement, including the assessment of the
risks of material misstatement of the financial statements, whether
due to fraud or error.
We believe that the audit evidence we have obtained is sufficient
and appropriate to provide a basis for our audit opinion on the
internal financial controls system over financial reporting of the
Holding Company.
Meaning of Internal Financial Controls Over Financial Reporting
A company’s internal financial control over financial reporting is
a process designed to provide reasonable assurance regarding
the reliability of financial reporting and the preparation of financial
statements for external purposes in accordance with generally
accepted accounting principles. A company’s internal financial control
over financial reporting includes those policies and procedures that
(1) pertain to the maintenance of records that, in reasonable detail,
accurately and fairly reflect the transactions and dispositions of
the assets of the company; (2) provide reasonable assurance that
transactions are recorded as necessary to permit preparation of
financial statements in accordance with generally accepted accounting
principles, and that receipts and expenditures of the company are
being made only in accordance with authorisations of management
and directors of the company; and (3) provide reasonable assurance
regarding prevention or timely detection of unauthorised acquisition,
use, or disposition of the company’s assets that could have a material
effect on the financial statements.
Inherent Limitations of Internal Financial Controls Over Financial
Reporting
Because of the inherent limitations of internal financial controls over
financial reporting, including the possibility of collusion or improper
management override of controls, material misstatements due to
error or fraud may occur and not be detected. Also, projections of any
evaluation of the internal financial controls over financial reporting to

17Statutory Reports
72Financial Statements
01Corporate Overview
125
future periods are subject to the risk that the internal financial control
over financial reporting may become inadequate because of changes
in conditions, or that the degree of compliance with the policies or
procedures may deteriorate.
Opinion
In our opinion, to the best of our information and according to the
explanations given to us and based on the consideration of unaudited
Indian subsidiary referred to in Other Matter paragraph below, the
Holding Company, have, in all material respects, an adequate internal
financial controls system over financial reporting and such internal
financial controls over financial reporting were operating effectively as
at 31 March 2018, based on the internal control over financial reporting
criteria established by the Holding Company considering the essential
components of internal control stated in the Guidance Note.
Other Matters
Our aforesaid report under Section 143(3)(i) of the Act on the adequacy
and operating effectiveness of the internal financial controls over
financial reporting insofar as it relates to a subsidiary company
incorporated India, whose financials statements/information are
unaudited and our opinion on the adequacy and operating effectiveness
of the internal financial control over financial reporting of the Group is
not affected as this financial statements/information is not material
to the Group.
Our opinion is not modified in respect of the above matters.
For B. K. Khare & Co.
Chartered Accountants
Firm’s Registration Number 105102W
Ravi Kapoor
Partner
Mumbai, May 23, 2018 Membership Number: 040404

Annual Report 2017-18126
(` in Mn)Particulars Note
No.
As at
31-03-2018
As at
31-03-2017 ASSETSNon-current assets (a) Property, plant and equipment 5 2,508 2,578 (b) Capital work-in-progress 5 10 9 (c) Goodwill 5 2,763 993 (d) Other Iintangible assets 5 1,535 1,848 (e) Intangible assets under development 5 58 4 (f) Financial assets (i) Investments 6 1 - (ii) Loans 7 387 311 (iii) Other financial assets 8 721 1,866 (g) Deferred tax assets (net) 9 1,921 1,434 (h) Income tax assets 900 722 (i) Other non-current assets 10 1,080 1,292 Total Non-Current Assets 11,884 11,057 Current assets (a) Financial assets (i) Investments 12,643 9,406 (ii) Trade receivable 11 13,962 11,697 (iii) Unbilled revenue 8,365 4,724 (iv) Cash and cash equivalents 12 3,323 2,291 (v) Other bank balances 13 310 1,504 (vi) Loans 14 238 159 (vi) Other financial assets 15 1,976 2,518 (b) Other current assets 16 1,125 988 Total Current Assets 41,942 33,287 TOTAL ASSETS 53,826 44,344 EQUITY AND LIABILITIESEquity (a) Equity Share capital 17 172 171 (b) Other Equity (i) Other Reserves 18 9,521 9,910 (ii) Retained Earnings 18 28,905 21,362 (iii) Share application money pending allotment 18 0 0 (iv) Non-controlling interests 18 13 8 Total Equity 38,611 31,451 LiabilitiesNon-current liabilities (a) Financial Liabilities 19 1,042 - (b) Deferred tax liabilities (net) 9 132 171 (c) Provisions 20 279 285 Total Non-Current Liabilities 1,453 456 Current liabilities (a) Financial Liabilities (i) Trade Payables 21 3,888 3,366 (ii) Other Financial Liabilities 22 6,106 5,998 (b) Other Current Liabilities 23 1,617 1,158 (c) Provisions 24 1,844 1,614 (d) Current Tax Liabilities (Net) 307 301 Total Current Liabilities 13,762 12,437 TOTAL EQUITY AND LIABILITIES 53,826 44,344 Significant accounting policies 2Other notes to accounts 32 to 45
Consolidated Balance Sheetas at 31 March 2018
As per our report attached
B. K. Khare & Co Sanjay Jalona Aftab Zaid UllahChartered Accountants Chief Executive Officer & Managing Director Chief Operating Officer & Whole Time DirectorFirm's Registration No. 105102W DIN : 07256786 DIN : 05165334
Ravi Kapoor Ashok Kumar Sonthalia Manoj KoulPartner Chief Financial Officer Company Secretary & Compliance OfficerMembership No: 040404
MumbaiMay 23, 2018

17Statutory Reports
72Financial Statements
01Corporate Overview
127
(` in Mn)
Particulars Note No.
April 17 - March 18 April 16 - March 17
INCOME:
Revenue from operations 25 73,065 65,009
Other income 26 4,261 1,867
Total Income 77,326 66,876
EXPENSES:
Employee benefit expense 27 43,289 37,153
Operating expenses 28 16,845 14,764
Finance costs 29 157 32
Depreciation and amortisation 5 1,563 1,779
Other expenses 1,057 790
Total Expenses 62,911 54,518
Profit before tax 14,415 12,358
Tax expense
Current tax (net) 30 3,654 3,181
Deferred tax 30 (363) (532)
3,291 2,649
NET PROFIT FOR THE PERIOD 11,124 9,709
OTHER COMPREHENSIVE INCOME 31 (835) 1,945
TOTAL COMPREHENSIVE INCOME FOR THE YEAR 10,289 11,654
Profit attributable to :
Owners of the company 11,120 9,707
Non-controlling interests 4 2
11,124 9,709
Total comprehensive income attributable to :
Owners of the company 10,283 11,652
Non-controlling interests 6 2
10,289 11,654
Basic
Basic earning per equity share 64.93 57.08
Diluted
Diluted earning per equity share 63.48 55.80
Significant accounting policies 2
Other notes to accounts 32 to 45
Consolidated Statement of Profit and Loss for the year ended 31 March 2018
As per our report attached
B. K. Khare & Co Sanjay Jalona Aftab Zaid UllahChartered Accountants Chief Executive Officer & Managing Director Chief Operating Officer & Whole Time DirectorFirm's Registration No. 105102W DIN : 07256786 DIN : 05165334
Ravi Kapoor Ashok Kumar Sonthalia Manoj KoulPartner Chief Financial Officer Company Secretary & Compliance OfficerMembership No: 040404
MumbaiMay 23, 2018

Annual Report 2017-18128
(` in Mn)
Particulars April 17 - March 18 April 16 - March 17
A. CASH FLOW FROM OPERATING ACTIVITIES
Net profit after tax 11,124 9,709
Adjustments to reconcile net profit to net cash provided by operating activities:
Depreciation and amortisation 1,563 1,780
Income tax expense 3,291 2,649
Expense recognised in respect of equity settled stock option 400 428
Realised income from current investment in mutual funds (516) (194)
Unrealised income from current investment in mutual funds (222) -
Interest received (23) (27)
Interest expense 157 32
Unrealised foreign exchange (gain)/loss, Net (1) 176
Net loss/(gain) on sale of property, plant and equipment 6 15
Operating profit before working capital changes 15,779 14,568
Changes in working capital
(Increase)/decrease in trade receivables & unbilled revenue (5,531) (1,156)
(Increase)/decrease in other receivables (230) 57
Increase/(decrease) in trade & other payables 2,001 686
(Increase)/decrease in working capital (3,760) (413)
Cash generated from operations 12,019 14,155
Income taxes paid (3,581) (2,459)
Net cash (used in)/generated from operating activities 8,438 11,696
B. CASH FLOW FROM INVESTING ACTIVITIES
Purchase of fixed assets (1,019) (729)
Sale of fixed assets 37 41
(Purchase)/sale of current investments (3,016) (8,977)
Payment towards business acquisition (1,146) (71)
Increase in non-current investment (1) -
Interest received 23 27
Income from current investment in mutual funds 516 194
Net cash (used in)/generated from investing activities (4,606) (9,515)
Consolidated Cash Flow Statementfor the year ended 31 March 2018

17Statutory Reports
72Financial Statements
01Corporate Overview
129
(` in Mn)
Particulars April 17 - March 18 April 16 - March 17
C. CASH FLOW FROM FINANCING ACTIVITIES
Proceeds from issue of share capital 3 4
Proceeds from/(repayment) of borrowings - (437)
Deposit under Credit support agreement received/(paid) (407) 2,025
Interest paid (138) (32)
Dividend paid (3,034) (1,610)
Tax on dividend paid (500) (278)
Net cash (used in)/generated from financing activities (4,076) (328)
Net increase/(decrease) in cash and cash equivalents (244) 1,853
Cash and cash equivalents at beginning of the period 3,795 2,035
Effect of exchange differences on translation of foreign currency cash and cash equivalents 82 (94)
Cash and cash equivalents at end of the period 3,633 3,795
As per our report attached
B. K. Khare & Co Sanjay Jalona Aftab Zaid UllahChartered Accountants Chief Executive Officer & Managing Director Chief Operating Officer & Whole Time DirectorFirm's Registration No. 105102W DIN : 07256786 DIN : 05165334
Ravi Kapoor Ashok Kumar Sonthalia Manoj KoulPartner Chief Financial Officer Company Secretary & Compliance OfficerMembership No: 040404
MumbaiMay 23, 2018

Annual Report 2017-18130
Consolidated Statement of Changes in Equityfor the year ended 31 March 2018
(` in Mn)Particulars Share
CapitalShare
application money
pending allotment
General Reserve
Share Premium
Retained Earnings
Employee Stock option outstanding
Deferred Employee
Compensation Expense
Other Components of Equity
Equity attributable to the equity
holders of the company
Non-controlling
interest
Total Equity
Hedging Reserve
FCTR
Balance as on 1 April 2017 171 0 4,501 1,498 21,362 1,511 (945) 3,081 264 31,443 8 31,451
Employee Stock Compensation Expense
2 83 (83) 2 2
Net Profit for the year 11,120 11,120 4 11,124
Other Comprehensive Income 62 (1,056) 160 (835) 1 (834)
Dividends (including DDT) (3,639) (3,639) (3,639)
Any other changes 1 (0) 321 (378) 562 507 507
Balance as on 31 March 2018 172 0 4,503 1,819 28,905 1,216 (466) 2,025 424 38,598 13 38,611
for the year ended 31 March 2017(` in Mn)
Particulars Share Capital
Share application
money pending
allotment
General Reserve
Share Premium
Retained Earnings
Employee Stock option outstanding
Deferred Employee
Compensation Expense
Other Components of Equity
Equity attributable to the equity
holders of the company
Non-controlling
interest
Total Equity
Hedging Reserve
FCTR
Balance as on 1 April 2016 170 4,492 1,473 13,678 77 877 479 21,246 5 21,250
Changes in equity for the year ended on 31 March 2017
1 1,442 (1,492) 1 1
Employee Stock Compensation Expense
(50) (49)
Net Profit for the year 9,707 9,707 2 9,709
Other Comprehensive Income (45) 2,204 (215) 1,945 1 1,945
Dividends (including DDT) (1,978) (1,978) (1,978)
Any other changes 0 9 25 (8) 547 572 573
Balance as on 31 March 2017 171 0 4,501 1,498 21,362 1,511 (945) 3,081 264 31,443 8 31,451
As per our report attached
B. K. Khare & Co Sanjay Jalona Aftab Zaid UllahChartered Accountants Chief Executive Officer & Managing Director Chief Operating Officer & Whole Time DirectorFirm's Registration No. 105102W DIN : 07256786 DIN : 05165334
Ravi Kapoor Ashok Kumar Sonthalia Manoj KoulPartner Chief Financial Officer Company Secretary & Compliance OfficerMembership No: 040404
MumbaiMay 23, 2018

17Statutory Reports
72Financial Statements
01Corporate Overview
131
Notes forming part of Consolidated accounts1. COMPANY OVERVIEW
Larsen & Toubro Infotech Limited (‘the Company’) together with its subsidiaries shall mean Larsen and Toubro Infotech Limited (“Group”). The Group offers extensive range of IT services like application development, maintenance and outsourcing, enterprise solutions, infrastructure management services, testing, digital solutions, and platform based solutions to the clients in diverse industries.
The Company is a public limited company incorporated and domiciled in India and has its registered office at L&T House, Ballard Estate, Mumbai, Maharashtra, India. The company’s equity shares are listed on the National Stock Exchange Limited and BSE Limited in India.
2. SIGNIFICANT ACCOUNTING POLICIES
A. Basis of accounting
Accounting policies have been consistently applied except where a newly issued accounting standard is initially adopted or a revision to an existing accounting standard requires a change in the accounting policy hitherto in use. Further the guidance notes/announcements issued by the Institute of Chartered Accountants of India (ICAI) are also considered wherever applicable.
Preparation of financial statements in conformity with Accounting Standards requires the management of the Group to make estimates and assumptions that affect the income and expense reported for the period and assets, liabilities and disclosures reported as of the date of the financial statements. Examples of such estimates include useful lives of tangible and intangible assets, provision for doubtful debts, future obligations in respect of retirement benefit plans, etc. Actual results could vary from these estimates.
The consolidated financial statements have been prepared in accordance with Indian Accounting Standards (Ind AS) as prescribed under Section 133 of the Companies Act, 2013, read with Rule 3 of the Companies (Indian Accounting Standards) Rules, 2015, relevant amendment rules issued there after and guidelines issued by the Securities and Exchange Board of India (SEBI).
The financial statements of Indian subsidiaries have been prepared in compliance with Ind AS as prescribed under Section 133 of the Companies Act, 2013, read with Rule 3 of the Companies (Indian Accounting Standards) Rules, 2015 relevant amendment rules issued thereafter and guidelines issued by the Securities and Exchange Board of India (SEBI). Financial statements of foreign subsidiaries have been prepared in compliance with the local laws and
applicable Accounting Standards. Necessary adjustments for differences in the accounting policies, if any, have been made in the consolidated financial statements.
Amounts in the consolidated financial statements are presented in Indian Rupees in millions [10 lakhs = 1 million] as permitted by Schedule III to the Companies Act, 2013. Per share data are presented in Indian Rupees.
B. Presentation of financial statements
The statement of financial position (including statement of changes in equity) and the statement of profit and loss are prepared and presented in the format prescribed in the Schedule III to the Companies Act, 2013. The cash flow statement has been prepared and presented as per the requirements of Ind AS 7 “Cash Flow Statements”. The disclosure requirements with respect to items in the statement of financial position and statement of profit and loss, as prescribed in Schedule III to the Act, are presented by way of notes forming part of financial statements along with the other notes required to be disclosed under the notified Accounting Standards.
C. Operating cycle for current and non-current classification
The company identifies asset/liabilities as current if the same are receivable/payable within twelve months else the same are considered as non-current.
D. Principles of consolidation
The consolidated financial statements comprise the financial statements of the Company and its subsidiaries. Control is achieved when the group is exposed to or has rights to variable returns from its involvement with the investee and has the ability to affect those returns through its power over the investee. Specifically, the Group controls an investee if and only if the Group has:
i) Power over the investee,
ii) Exposure or rights to variable return from its involvement with the investee, and
iii) Ability to use its power over the investee to affect its returns.
Generally, it is presumed that, a majority of voting rights results in control. To support this presumption and when the Group has less than a majority of the voting or similar rights of an investee, the Group considers all relevant facts and circumstances in assessing whether it has power over an investee, including:
i) Contractual arrangement with the other vote holders of the investee,

Annual Report 2017-18132
ii) Rights arising from other contractual arrangements,
iii) The Group’s voting rights and potential voting rights and
iv) Size of the Group’s holding of voting rights relative to the size and dispersion of holdings of other investees with voting rights.
The Group re-assesses whether or not it controls an investee if facts and circumstances indicate that there are changes to one or more of the three elements of control. Consolidation of a subsidiary begins when the Group obtains control over the subsidiary and ceases when the Group loses control of the subsidiary. Assets, liabilities, income and expenses of a subsidiary acquired or disposed of during the year are included in consolidated financial statements from the date the Group gains control until the date the Group ceases to control the subsidiary. The Company; for convenience, may designate a date at the beginning or end of the month as a date on which it gains control, unless events between the convenience date and the actual date of gaining control result in material changes in the amounts recognized.
Consolidated financial statements are prepared using uniform accounting policies for like transactions and other events in similar circumstances. If an entity of the Group uses accounting policies other than those adopted in the consolidated financial statements for like transactions and other events in similar circumstances, appropriate adjustments are made to that entity’s financial statements in preparing the consolidated financial statements to ensure conformity with the Group’s accounting policies.
The financial statements of all entities used for the purpose of consolidation are drawn up to the same reporting date as that of the Group, i.e., year ended on 31 March 2018. When the end of the reporting period of the parent is different from that of a subsidiary, the subsidiary prepares; for consolidation purposes, additional financial information as of the same date as the financial statements of the parent to enable the parent to consolidate the financial statements of the subsidiaries, unless it is impracticable to do so.
Consolidation procedure followed is as under:
i) Items of assets, liabilities, equity, income, expenses and cash flows of the parent with those of its subsidiaries are combined like to like basis. For this purpose, income and expenses of the subsidiary are based on the amounts of the assets and liabilities recognized in the consolidated financial statements at the acquisition date,
ii) The difference between carrying amount of the parent’s investment in each subsidiary and the parent’s portion of equity of each subsidiary is subject to adjustment of goodwill and
iii) Intragroup assets and liabilities, equity, income, expenses and cash flows relating to transactions between entities of the Group are eliminated subject to impact of deferred taxes. Profit or loss and each component of other comprehensive income (OCI) are attributable to equity holders of the parent of the Group and to the non-controlling interest, even if this results in the non-controlling interests having deficit balance.
A change in the ownership interest of a subsidiary, without loss of control, is accounted for as an equity transaction. If the Group loses control over a subsidiary, it:
i) Derecognizes the assets (including goodwill) and liabilities of the subsidiary,
ii) Derecognizes carrying amount of any non-controlling interest,
iii) Derecognizes the cumulative translation differences recorded in equity,
iv) Recognizes the fair value of consideration received,
v) Recognizes the fair value of any investments retained,
vi) Recognizes any surplus or deficit in profit or loss and
vii) Reclassifies the parent’s share of components previously recognized in OCI to profit or loss or retained earnings, as appropriate, as would be required if the Group had directly disposed of the related assets or liabilities,
E. Business Combination
The Company accounts for its business combinations under the acquisition method of accounting using fair valuation of the net asset taken over. Intangible assets acquired in a business combination are recognized and reported separately from goodwill.
Goodwill represents the cost of the acquired businesses in excess of the fair value of identifiable tangible and intangible net assets purchased.
F. Revenue recognition
Revenue is recognised only when evidence of an arrangement is obtained and the other criteria to support revenue recognition are met, including the price is fixed or determinable, services have been rendered and collectability of the resulting receivables is reasonably assured. Revenue is measured at the fair value of the consideration received or receivable and is reduced for estimated rebates and other similar allowances.
Notes forming part of Consolidated accounts

17Statutory Reports
72Financial Statements
01Corporate Overview
133
Revenue from contracts priced on time and material basis are recognised when services are rendered and related costs are incurred.
Revenue from services performed on fixed-price basis is recognized over the life of contract using the proportionate completion method.
Revenue from sale of products and licenses is recognised upon delivery when all risks and rewards are transferred.
Revenue from services rendered as Application Service provider (“ASP”) services are recognized by applying the contracted rates on the total number of active and inactive fund accounts across all client customer environments.
Unbilled revenue represents value of services performed in accordance with the contract terms but not billed.
G. Other income
i) Interest income is recognised using effective interest method.
ii) Dividend income is accounted in the period in which the right to receive the same is established.
iii) Other items of income are accounted as and when the right to receive arises.
H. Employee benefits
I) Short term employee benefits
All employee benefits falling due wholly within twelve months of rendering the service are classified as short term employee benefits. The benefits like salaries, wages, and short term compensated absences and performance incentives are recognized in the period in which the employee renders the related service.
II) Post-employment benefits
i) Defined contribution plan:
The Group’s superannuation fund and state governed provident fund scheme are classified as defined contribution plans. The contribution paid / payable under the schemes is recognized during the period in which the employee renders the related service.
ii) Social security plans
Employer’s contribution payable with respect to the social security plans, which are defined contribution plans, is charged to the statement of profit and loss in the period in which employee renders the services.
iii) Defined benefit plans:
The provident fund scheme managed by trust, employee’s gratuity fund scheme managed by Life Insurance Corporation of India and post-retirement medical benefit scheme are the Group’s defined benefit plans. Wherever applicable, the present value of the obligation under such defined benefit plans is determined based on actuarial valuation using the Projected Unit Credit Method, which recognizes each period of service as giving rise to additional unit of employee benefit entitlement and measures each unit separately to build up the final obligation.
The obligation is measured at the present value of the estimated future cash-flows. The discount rates used for determining the present value of the obligation under defined benefit plans, is based on the market yields on government bonds as at the balance sheet date, having maturity periods approximating to the terms of related obligations. Actuarial gains and losses through re-measurement of the defined benefit liability/ (asset) are recognized in other comprehensive income. The actual return of portfolio of plan assets, in excess of yields computed by applying the discount rate used to measure the defined benefit obligation are recognized in other comprehensive income. The effect of any plan amendments are recognized in statement of profit and loss.
Gains or losses on the curtailment or settlement of any defined benefit plan are recognized when the curtailment or settlement occurs. Past service cost resulting from a plan amendment or curtailment are derecognized immediately in the statement of profit and loss.
(iv) Long term employee benefits:
The obligation for long term employee benefits like long term compensation absences is recognized as determined by actuarial valuation performed by independent actuary at each balance sheet date using Projected Unit Credit Method on the additional amount expected to be paid/availed as a result of unused entitlement that has accumulated at balance sheet date. Actuarial gains and losses are recognised immediately in statement of profit and loss.
I. Property plant and equipment
Property plant and equipment are stated at cost less accumulated depreciation and impairment losses, if any. Cost includes expenditure directly attributable to the acquisition of the asset and cost incurred for bringing the asset to its present location and condition.
Notes forming part of Consolidated accounts

Annual Report 2017-18134
J. Intangible assets
Assets like customer relationship, computer software,
and internally developed software are stated at cost, less
accumulated depreciation, amortisation and impairment.
Intangible assets are tested for impairment at each balance
sheet date. Goodwill represents the cost of acquired businesses
in excess of the fair value of net identifiable assets acquired.
K. Impairment
I) Impairment of trade receivables:
The Group assesses at each date of statement of financial position whether a financial assets in form of trade receivable is impaired. In accordance with Ind AS 109, the Group applies Expected Credit Loss (ECL) model for measurement and recognition of impairment loss. As a practical expedient, the Group uses a provision matrix to determine impairment loss on portfolio of its trade receivable. The provision matrix is based on available external and internal credit risk factors such as credit default, credit rating from credit rating agencies and Group’s historically observed default rates over the expected life of trade receivable. ECL impairment loss allowance (or reversal) recognised during the period as expense/(income) respectively in the statement of profit and loss.
II) Impairment of intangible assets:
i) Goodwill
Goodwill represents the cost of acquired businesses in excess of the fair value of net identifiable assets acquired. Goodwill is not amortized but is tested for impairment annually or immediately when events or changes in circumstances indicate that an impairment loss would have occurred. For the purposes of impairment testing, the carrying amount of the reporting unit, including goodwill, is compared with its fair value. When the carrying amount of the reporting unit exceeds its fair value, a goodwill impairment loss is recognized, up to a maximum amount of the recorded goodwill related to the reporting unit. Goodwill impairment losses are not reversed. The growth rate and discount rates as applicable are used for impairment testing.
ii) Other intangible assets
At the end of each reporting period, the Group reviews the carrying amounts of intangible assets to determine if there is any indication of loss suffered. If such indication exists, the recoverable amount of the asset is estimated to determine the extent of the impairment loss.
L. Leases
i) Finance lease
Assets acquired under leases where the Group has substantially all the risks and rewards of ownership are classified as finance leases. Such assets are capitalized at the inception of the lease at the lower of the fair value and the present value of minimum lease payments and a liability is created for an equivalent amount. Each lease rental paid is allocated between the liability and the interest cost, so as to obtain a constant periodic rate of interest on the outstanding liability for each period.
ii) Operating lease
Assets acquired under leases where a significant portion of the risks and rewards of ownership are retained by the lessor are classified as operating leases. Lease rentals are charged to the profit and loss account on accrual basis.
M. Depreciation
i) Tangible assets
Depreciation on assets have been provided as mentioned in below table except for the leasehold improvements which is depreciated over the lease period. Depreciation or amortization on additions and disposals are calculated on pro-rata basis from and to the month of additions and disposals.
Particulars Useful life• Computers and IT peripherals Upto 6 years• Plant and machinery Upto 15 years• Office equipment Upto 5 years• Vehicles Upto 8 years• Furniture and fixtures Upto 10 years
II) Intangible assets and amortisation
The estimated useful life of an intangible asset is based on a number of factors including the effects of obsolescence, demand, competition and other economic factors and the level of maintenance expenditures required to obtain the expected future cash flows from the asset. The basis of amortization of intangible assets is as follows:
Particulars Useful life• Computer software Upto 5 years• Customer contracts Upto 10 years
N. Employee stock ownership schemes
In respect of stock options granted pursuant to the Group’s stock options scheme, the excess of fair value of the share over the exercise price of the option is treated as discount and accounted as employee compensation cost over the vesting period. The amount recognized as expense each year is arrived at based on
Notes forming part of Consolidated accounts

17Statutory Reports
72Financial Statements
01Corporate Overview
135
the number of grants expected to vest. If options granted lapse after the vesting period, the cumulative discount recognized as expense in respect of such options is transferred to the general reserve. If options granted lapse before the vesting period, the cumulative discount recognized as expense in respect of such options is transferred to the profit and loss.
O. Functional and presentation currency
The functional currency of the Group is the Indian Rupee. The functional currency of Indian subsidiaries is the Indian Rupee and the functional currency of foreign subsidiaries is the currency of the primary economic environment in which these subsidiaries operate. The consolidated financial statements of group are prepared in the Indian Rupee.
P. Foreign currency transactions & balances
Foreign currency transactions are initially recorded at the rates prevailing on the date of the transaction. At the balance sheet date, foreign currency monetary items are reported using the closing rate. Non-monetary items which are carried at historical cost denominated in foreign currency are reported using the exchange rate at the date of the transaction.
Translation of foreign currency transaction of foreign subsidiaries is treated as under:
• Revenueitemsattheaverageratefortheperiod;
• Allassetsandliabilitiesatyearendrates
Exchange difference on settlement / year end conversion is recognized in foreign currency translation reserve.
Q. Financial Instruments
Financial assets and liabilities are recognized when the Group becomes a party to the contractual provisions of the instrument.
I) Initial measurement
Financial assets and liabilities are initially measured at fair value. Transaction costs that are directly attributable to the acquisition or issue of financial assets and financial liabilities (other than financial assets and financial liabilities at fair value through profit or loss) are added to or deducted from the fair value measured on initial recognition of financial asset or financial liability.
II) Subsequent measurement
a) Non-Derivative financial assets
A) Financial assets at amortised cost
Financial assets are subsequently measured at amortised cost if:
Financial assets at amortised cost are represented by trade receivables, cash and cash equivalents, employee and other advances and eligible current and non-current assets.
i) the financial asset is held within a business model whose objective is to hold financial assets in order to collect contractual cash flows and
ii) the contractual terms of the financial asset give rise on specified dates to cash flows that are solely payments of principal and interest on the principal amount outstanding.
B) Financial assets at fair value through other comprehensive income (FVTOCI)
Financial assets are subsequently measured at fair value through other comprehensive income if the financial asset is held within a business model whose objective is achieved by both
i) Collecting contractual cash flows and selling financial assets and
ii) the contractual terms of the financial asset give rise on specified dates to cash flows that are solely payments of principal and interest on the principal amount outstanding.
C) Financial assets at fair value through profit and loss (FVTPL)
Fair value through profit and loss is a residual category for financial assets. Any financial asset which does not meet the criteria for categorization as at amortised cost or as Financial assets at fair value through other comprehensive income is classified as Financial assets fair valued through profit and loss.
ii) Non-Derivative financial liability
A) Financial liabilities at amortized cost represented by trade and other payables are initially recognized at fair value, and subsequently carried at amortized cost using the effective interest method, except for contingent consideration recognized in a business combination which is subsequently measured at fair value through profit or loss. For trade and other payables maturing within one year from the Balance Sheet date, the carrying amounts approximate fair value due to the short maturity of these instruments.
iii) Derivative financial instrument
The Group holds derivative financial instrument such as foreign exchange forward contract to mitigate the risk of changes in exchange rates on foreign currency exposures.
Notes forming part of Consolidated accounts

Annual Report 2017-18136
A) Cash flow hedges
Changes in the fair value of the derivative hedging instruments designated as cash flow hedges on net basis are recognized in other comprehensive income and presented within equity as hedging reserve. The cumulative gain or loss previously recognized in the cash flow hedging reserve in respect of hedges on net basis is transferred to the statement of profit or loss upon the occurrence of the related forecasted transaction and reported as part of foreign exchange gains or losses. Changes in fair value of foreign currency derivative instruments not designated as cash flow hedges and ineffective portion of cash flow hedges are recognized in statement of profit and loss and reported as part of foreign exchange gains or losses.
B) Fair Value hedges
Changes in the fair value of the derivative hedging instrument designated as fair value hedges are recognized in statement of profit or loss.
III) Derecognition
The group derecognizes a financial asset when the contractual rights to the cash flows from the financial assets expire or it transfers the financial asset and the transfer qualifies for derecognition under Ind AS 109. A financial liability is derecognised from the group’s balance sheet where the obligation specified in the contract is discharged or cancelled or expires.
R. Taxes on income
Income tax expense comprises current and deferred income tax. Tax on income for Indian companies for the current period is determined on the basis of taxable income and tax credits computed in accordance with the provisions of the Indian Income tax Act, 1961. Foreign subsidiaries recognize current tax/ deferred tax liabilities and assets in accordance with the applicable local laws.
Income tax and deferred tax expense is recognized in the statement of profit and loss except to the extent that it relates to items recognized directly in other comprehensive income, in which case income tax expense is recognized in other comprehensive income. Current income tax for current and prior periods is recognized at the amount expected to be paid to or recovered from the tax authorities. (Refer note 8 for applicable tax rates in various jurisdiction).
The Group offsets current tax assets and current tax liabilities, where it has a legally enforceable right to set off the recognized amounts and where it intends either to settle on a net basis, or to realize the asset and settle the liability simultaneously.
Deferred income tax assets and liabilities are recognized for all temporary differences arising between the tax bases of assets and liabilities and their carrying amounts in the financial statements except when the deferred income tax arises from the initial recognition of goodwill or an asset or liability in a transaction that is not a business combination and affects neither accounting nor taxable profit or loss at the time of the transaction. Other deferred tax assets are recognized and carried forward to the extent that there is a reasonable certainty that sufficient future taxable income will be available against which such deferred tax assets can be realized. Deferred tax assets are reviewed at each reporting date and are reduced to the extent that it is no longer probable that the related tax benefit will be realized.
Deferred income tax assets and liabilities are measured using tax rates and tax laws that have been enacted or substantively enacted as on the statement of position and are expected to apply to taxable income in the years in which those temporary differences are expected to be recovered or settled. Deferred income taxes are not provided on the undistributed earnings of subsidiaries and branches where it is expected that the earnings of the subsidiary or branch will not be distributed in the foreseeable future. Deferred Income taxes are not provided on dividend receivable from subsidiaries as the Group is able to control the timing of reversal of such temporary difference. Deferred tax is provided on unrealized intra Group profit at the rate of tax applicable to the purchasing entity.
S. Borrowing costs
Borrowing costs include interest, commitment charges, finance charges in respect of assets acquired on finance lease and exchange differences arising from foreign currency borrowings, to the extent they are regarded as an adjustment to interest costs.
T. Provisions, contingent liabilities and contingent assets
Provisions are recognized for liabilities that can be measured only by using a substantial degree of estimation, if
I) the Group has a present obligation as a result of a past event;
II) a probable outflow of resources is expected to settle the obligation; and
III) the amount of the obligation can be reliably estimated.
Provision is measured using the cash flows estimated to settle the present obligation and when the effect of time value of money is material, the carrying amount of the provision is the present
Notes forming part of Consolidated accounts

17Statutory Reports
72Financial Statements
01Corporate Overview
137
Notes forming part of Consolidated accounts
value of those cash flows. Reimbursement expected in respect of expenditure required to settle a provision is recognised only when it is virtually certain that the reimbursement will be received. Reimbursement expected in respect of expenditure required to settle a provision is recognized only when it is virtually certain that the reimbursement will be received.
Contingent liability is disclosed in case of
I) a present obligation arising from a past event when it is not probable that an outflow of resources will be required to settle the obligation; or
II) a possible obligation unless the probability of outflow of resources is remote
Contingent assets are neither recognized nor disclosed.
Provisions, contingent liabilities and contingent assets are reviewed at each balance sheet date.
U. Segment accounting
Operating segments are defined as components of an enterprise for which discrete financial information is used regularly by the Group’s Chief Operating Decision Maker in deciding how to allocate resources and assessing performance.
i) Segment revenue is the revenue directly identifiable with the segment.
ii) Expenses that are directly identifiable with or allocable to segments are considered for determining the segment result. Expenses which relate to the Company as a whole and not identifiable with / allocable to segments are included under “Unallocable expenses”.
iii) Other income relates to the Company as a whole and is not identifiable with / allocable to segments.
iv) Assets and liabilities used in the Company’s business are not identified to any of the reportable segments as these are used interchangeably.
V. Cash flow statement
Cash flow statement is prepared segregating the cash flows from operating, investing and financing activities. Cash flow is
reported using indirect method as per the requirements of Ind AS 7 (“cash flow statements”).
3. RECENT ACCOUNTING PRONOUNCEMENTS
Indian Accounting Standards (Ind AS) 115 - Revenue from Contracts with Customers
The Ministry of Corporate Affairs (MCA) has notified on 28 Mar 2018 Ind AS 115 - Revenue from Contracts with Customers. This Standard will be applicable from the financial years beginning on or after 1 April 2018.
The standard specifically adopts a five step model as below for recognising revenue:
i. Identify the contract(s) with a customer
ii. Identify the performance obligations in contract
iii. Determine the transaction price
iv. Allocate the transaction price to the performance obligations in the contract
v. Recognize revenue when (or as) the entity satisfies a performance obligation
Under Ind AS 115, an entity recognises revenue when (or as) a performance obligation is satisfied, i.e. when ‘control’ of the goods or services underlying the particular performance obligation is transferred to the customer.
The Company will apply Ind AS 115 from 1 April 2018, retrospectively to all the contracts with customers which are not completed as on 1 April 2018. The cumulative effect of initially applying the standard will be recognised as an adjustment to the opening balance in retained earnings on 1 April 2018 at the time of reporting for financial year ending 31 March 2019. The Company has evaluated major contracts entered into with customers and does not expect any material impact of the adoption of this Standard on its retained earnings as on 1 April 2018 as well as to its net income on an ongoing basis.

Annual Report 2017-18138
Notes forming part of Consolidated accounts
4(I) The list of subsidiaries included in the consolidated financial statements are as under
(` in Mn)
Name of the subsidiary Company Country of incorporation
Proportion of ownership as at
31 March 2018 (%)
Proportion of ownership as at
31 March 2017 (%)
1 Larsen & Toubro Infotech Canada Limited Canada 100 1002 Larsen & Toubro Infotech GmbH # Germany 100 1003 Larsen & Toubro Infotech LLC USA 100 1004 L&T Infotech Financial Services Technologies Inc. Canada 100 1005 Larsen And Toubro Infotech South Africa (Proprietary) Limited South Africa 74.9 74.96 L&T Information Technology Services (Shanghai) Co. Ltd. China 100 1007 Larsen & Toubro Infotech Austria GmbH Austria 100 1008 L&T Information Technology Spain, Sociedad Limitada Spain 100 1009 L&T Infotech S.de. RL. C.V Mexico 100 10010 Syncordis S.A. Luxembourg # Luxembourg 100 -11 Syncordis Software Services India Private Limited* India 100 -12 Syncordis SARL, France France 100 -13 Syncordis Ltd, UK UK 100 -14 Syncordis PSF S.A. Luxembourg 100 -
# Larsen & Toubro Infotech GmbH has acquired shares of “Syncordis S.A”, Luxembourg on 15 December 2017.
* The Company has acquired shares of “Syncordis Software Services India Private Limited” on 11 December 2017 (refer note “39”).
4(II) Additional Disclosure as per Schedule III of Companies Act 2013: (` in Mn)
Name of entity Net assets, i.e. total assets minus total liabilities
Share in profit Share in other comprehensive income
Share in total comprehensive income
As % of consolidated
net assets
Amount As % of consolidated profit or loss
Amount As % of consolidated
other comprehensive
income
Amount As % of consolidated
total comprehensive
income
Amount
A- Parent-Larsen & Toubro Infotech Limited 96.31% 37,186 104.29% 11,601 119.18% -994 103.08% 10607SubsidiariesB - Indian2.Syncordis Software Services India Private Limited 0.04% 14 0.02% 2 0.00% 0 0.02% 2Sub Total 0.04% 14 0.02% 2 0.00% 0 0.02% 2C-Foreign1. Larsen & Toubro Infotech GmbH 3.66% 1413 0.07% 8 -0.60% 5 0.13% 132. Larsen & Toubro Infotech Canada Limited 0.28% 110 0.31% 34 -0.36% 3 0.36% 373. Larsen & Toubro Infotech LLC 0.07% 28 0.03% 3 0.00% 0 0.03% 34. L&T Infotech Financial Services Technologies Inc. 5.19% 2,002 3.47% 386 0.60% -5 3.70% 3815. Larsen And Toubro South Africa (Proprietary) Limited 0.10% 38 0.11% 12 -0.60% 5 0.17% 176. L&T Information Technology Services (Shanghai) Co. Ltd.
-0.01% -4 -0.02% -2 0.00% 0 -0.02% -2
7. Larsen & Toubro Infotech Austria GmbH 0.02% 7 0.01% 1 -0.12% 1 0.02% 28. L&T Information Technology Spain, Sociedad Limitada
0.09% 33 0.11% 12 -0.48% 4 0.16% 16
9. L&T Infotech S.de. RL. C.V (Maxico) 0.01% 3 0.03% 3 0.00% 0 0.03% 310. Syncordis S.A. Luxembourg 0.40% 154 0.52% 58 -0.72% 6 0.62% 6411. Syncordis SARL, France 0.14% 54 -0.07% -8 -0.36% 3 -0.05% -512. Syncordis Ltd, UK 0.00% 0 0.00% 0 0.00% 0 0.00% 013. Syncordis PSF S.A. 0.01% 2 0.00% 0 0.00% 0 0.00% 0Sub Total 9.95% 3,840 4.56% 507 -2.64% 22 5.14% 529Total A+B+C 106.29% 41,040 108.86% 12,110 116.55% -972 108.24% 11,138Less : CFS adjustments and eliminations -6.29% -2,429 -8.86% -986 -16.55% 138 -8.24% -848Total 100.00% 38,611 100.00% 11,124 100.00% -834 100.00% 10,290

17Statutory Reports
72Financial Statements
01Corporate Overview
139
5 C
ON
SO
LID
ATE
D F
IXE
D A
SSE
TS -
As
of 3
1 M
arch
201
8
(` in
Mn)
Fixe
d an
d in
tang
ible
asse
ts
Gro
ss B
lock
D
epre
ciat
ion/
Amor
tisat
ion
Net
Blo
ckN
et B
lock
As
at
Pur
suan
t to
acqu
isiti
on o
f
subs
idia
ry
Refe
r N
ote
39
Add
ition
s D
educ
tions
Fo
reig
n
curr
ency
tran
slat
ion
rese
rve
As
at
As
at
Purs
uant
to
acqu
isiti
on
of S
ubsi
diar
y
Refe
r N
ote
39
For
the
OnFo
reig
n
curr
ency
tran
slat
ion
rese
rve
As
at
As
at
As
at
1-Ap
r-17
31-M
ar-1
81-
Apr-
17 y
ear
dedu
ctio
ns31
-Mar
-18
31-M
ar-1
831
-Mar
-17
Tang
ible
ass
ets-
ow
n
Leas
ehol
d la
nd 1
0 -
-
-
-
1
0 0
-
0
-
-
-
1
0 1
0
Bui
ldin
gs
126
-
-
-
-
1
26
16
-
8
-
-
24
102
1
10
Leas
ehol
d im
prov
emen
ts 3
50
-
67
4
-
413
6
1 -
4
8 0
-
1
09
304
2
89
Plan
t and
mac
hine
ry 6
77
-
58
10
1
726
1
54
-
85
8
0
231
4
95
523
Com
pute
rs 1
,145
1
6 2
77
4
11
1,4
45
587
7
2
87
2
6
885
5
60
558
Off
ice
equi
pmen
ts 5
22
-
112
3
1
6
32
209
-
1
20
2
0
327
3
05
313
Furn
iture
and
fixt
ures
706
-
9
4 4
2
7
98
177
-
1
06
2
1
282
5
16
529
Vehi
cles
335
-
5
2 5
4 -
3
33
89
-
51
23
-
117
2
16
246
Cap
ital w
ork
in p
rogr
ess
-
10
9
Tota
l Of t
angi
ble
asse
ts 3
,871
1
6 6
60
79
15
4,4
83
1,2
93
7
705
3
7 8
1
,975
2
,518
2
,587
Inta
ngib
le a
sset
s
Goo
dwill
on
acqu
sitio
n 3
32
-
-
-
15
347
-
-
-
-
-
-
3
47
332
Goo
dwill
on
cons
olid
atio
n 6
61
1,7
55
-
-
-
2,4
16
-
-
-
-
-
-
2,4
16
661
Soft
war
e 5
,436
1
3
05
-
141
5
,883
3
,964
0
7
33
-
99
4,7
96
1,0
87
1,4
72
Cust
omer
con
trac
ts 1
,009
1
81
-
-
43
1,2
33
633
-
1
24
-
27
784
4
49
376
Bus
ines
s ri
ghts
98
-
-
98
-
-
98
-
-
98
-
-
-
-
Cap
ital w
ork
in p
rogr
ess
- in
tern
ally
cap
tital
ised
soft
war
es
-
58
4
Tot
al o
f int
angi
ble
asse
ts
7,5
36
1,9
37
305
9
8 1
99
9,8
79
4,6
95
- 8
57
98
126
5
,580
4
,357
2
,845
1.
Im
pair
men
t upt
o 31
Mar
ch 2
018
- N
IL
2.
A
ugm
entI
Q D
ata
Sci
ence
s P
riva
te L
imite
d (‘A
ugm
entI
Q’)
has
been
am
alga
mat
ed w
ith
the
Com
pany
wit
h ef
fect
from
1 A
pril
2017
[ref
er n
ote
38 to
not
es to
acc
ount
s]
3
. Th
e C
ompa
ny a
cqui
red
Syn
cord
is S
.A, L
uxem
bour
g, a
long
-wit
h it
s fu
lly
owne
d su
bsid
iari
es S
ynco
rdis
SA
RL
, Fra
nce,
Syn
cord
is L
td. U
K, S
ynco
rdis
PS
F S
.A ,
on 1
5 D
ecem
ber
2017
& S
ynco
rdis
S
oftw
are
Ser
vice
s In
dia
Pri
vate
Lim
ited
on 1
1 D
ecem
ber
2017
. The
Com
pany
has
use
d cu
t-of
f da
te o
f 30
Nov
embe
r 20
17 a
s th
e ac
quis
itio
n da
te f
or c
onve
nien
ce, s
ince
the
tra
nsac
tion
s fr
om
1 D
ecem
ber
2017
till
the
date
s of
acq
uisi
tion
of r
espe
ctiv
e en
titi
es w
ere
not m
ater
ial.
[ref
er n
ote
39 to
not
es to
acc
ount
s]
Not
es fo
rmin
g p
art o
f Co
nso
lidat
ed a
cco
unts

Annual Report 2017-18140
Not
es fo
rmin
g p
art o
f Co
nso
lidat
ed a
cco
unts
5 C
ON
SO
LID
ATE
D F
IXE
D A
SSE
TS -
As
of 3
1 M
arch
201
7
(` in
Mn)
Fixe
d an
d in
tang
ible
asse
ts
Gro
ss B
lock
D
epre
ciat
ion/
Amor
tisat
ion
Net
Blo
ckN
et B
lock
As
at
Pur
suan
t to
acqu
isiti
on o
f
subs
idia
ry
Add
ition
s D
educ
tions
Fo
reig
n
curr
ency
tran
slat
ion
rese
rve
As
at
As
at
Purs
uant
to
acqu
isiti
on o
f
Subs
idia
ry
For
the
OnFo
reig
n
curr
ency
tran
slat
ion
rese
rve
As
at
As
at
As
at
1-Ap
r-16
31-M
ar-1
71-
Apr-
16 y
ear
dedu
ctio
ns31
-Mar
-17
31-M
ar-1
731
-Mar
-16
Tang
ible
ass
ets
Leas
ehol
d la
nd 1
0 -
-
-
-
1
0 -
-
0
-
-
0
1
0 1
0
Bui
ldin
gs
126
-
-
-
-
1
26
8
-
8
-
-
16
110
1
18
Leas
ehol
d im
prov
emen
ts 2
89
-
76
15
-
350
3
6 -
4
0 1
5 -
6
1 2
89
253
Plan
t and
mac
hine
ry 6
29
-
50
2
(0)
677
7
7 -
7
9 2
(0
) 1
54
523
5
52
Com
pute
rs 1
,028
1
1
80
53
(11)
1,1
45
328
1
3
17
52
(7)
587
5
58
700
Off
ice
equi
pmen
ts 4
06
0
125
9
(0
) 5
22
105
0
1
13
9
(0)
209
3
13
301
Furn
iture
and
fixt
ures
677
0
6
4 3
4 (1
) 7
06
104
0
1
03
29
(1)
177
5
29
573
Vehi
cles
336
-
6
2 6
3 -
3
35
51
(0)
54
16
-
89
246
2
85
Cap
ital w
ork
in p
rogr
ess
9
7
Tota
l Of t
angi
ble
asse
ts 3
,501
1
5
57
176
(1
2) 3
,871
7
09
1
714
1
23
(8)
1,2
93
2,5
87
2,7
99
Inta
ngib
le a
sset
s
Goo
dwill
on
acqu
sitio
n 3
50
-
-
-
(18)
332
-
-
-
-
-
-
3
32
350
Goo
dwill
on
cons
olid
atio
n 6
28
-
33
-
-
661
-
-
-
-
-
-
6
61
628
Soft
war
e 5
,444
0
3
83
214
(1
77)
5,4
36
3,3
41
0
956
2
12
(121
) 3
,964
1
,472
2
,103
Cust
omer
con
trac
ts 1
,061
-
3
-
(5
5) 1
,009
5
58
-
109
-
(3
4) 6
33
376
5
03
Bus
ines
s ri
ghts
98
-
-
-
-
98
98
-
-
-
-
98
-
-
Cap
ital w
ork
in p
rogr
ess
- in
tern
ally
cap
tital
ised
soft
war
es
4
188
Tot
al o
f int
angi
ble
asse
ts
7,5
81
- 4
19
214
(2
50)
7,5
36
3,9
97
- 1
,065
2
12
(155
) 4
,695
2
,845
3
,772
1.
Impa
irm
ent u
pto
31 M
arch
201
7 -
NIL
2.
GD
A Te
chno
logi
es L
imite
d (G
DA
) has
bee
n am
alga
mat
ed w
ith
the
Com
pany
wit
h ef
fect
from
1 A
pril
2016
.
3.
Aug
men
t IQ
has
bee
n aq
uire
d w
ith
effe
ct fr
om 3
0 N
ovem
ber’
2016
.

17Statutory Reports
72Financial Statements
01Corporate Overview
141
5 INTANGIBLE ASSETSThe balance useful life of intangible assets as on the respective balance sheet dates is as follows:
(` in Mn)
As at 31-03-2018 As at 31-03-2017 Balance
Useful LifeCarrying Amount
Balance Useful Life
Carrying Amount
Software upto 5 years 1,086 upto 5 years 1,472Customer contracts upto 5 years 449 upto 5 years 376 1,535 1,848
6 NON CURRENT INVESTMENTS
(` in Mn) As at
31-03-2018 As at
31-03-2017 2500 equity shares of USD 1 each in L&T LLC * 1 -
1 -
* The company acquired 4.76% share holding of L&T LLC on 14 August 2017. The company does not have control over its operations
7 NON CURRENT LOANS
(` in Mn) As at
31-03-2018 As at
31-03-2017 Unsecured, considered goodSecurity deposits 387 311
387 311
8 OTHER NON CURRENT FINANACIAL ASSETS
(` in Mn) As at
31-03-2018 As at
31-03-2017 Forward contract receivable 721 1,866
721 1,866
9 DEFERRED TAX ASSETS
(` in Mn) As at
31-03-2018 As at
31-03-2017 MAT credit 2,530 2,576Less: Deferred tax liability (630) (1,157)Deferred tax assets 21 15Total 1,921 1,434
Notes forming part of Consolidated accounts

Annual Report 2017-18142
9 Deferred tax liabilities or assets for the year ended 31 March 2018
9 (I) Deferred tax liabilities
(` in Mn) Deferred tax asset/(liability)
as at 31-03- 2017
Deferred tax asset/(liability)
charged to retained earnings
Current year
(charge) / credit to profit and
loss a/c
(Charge) / credit to hedging reserve
Foreign currency
translation reserve
Charge pursuant to acquisition
of subsidiary
Deferred tax asset/ (liability)
as at 31-03-2018
Deferred tax liabilitiesDepreciation / amortisation (194) - 101 - (7) (64) (164)
(194) 101 - (7) (64) (164)Deferred tax assetsNon capital losses and deferred expenses
23 - 8 1 - 32
23 - 8 - 1 - 32 Net deferred tax assets/(liabilities)(A)
(171) - 109 - (6) (64) (132)
9 (II) Deferred tax assets
(` in Mn) Deferred tax asset/(liability)
as at 31-03- 2017
Deferred tax asset/(liability)
charged to retained earnings
Current year
(charge) / credit to
profit & loss A/c
(Charge) / credit to hedging reserve
Foreign currency
translation reserve
Charge pursuant to acquisition
of subsidiary
Deferred tax asset/ (liability)
as at 31-03-2018
Deferred tax liabilitiesGain on cash flow hedges (920) 234 - - (686)Branch Profit Tax (542) (141) - - (683)Unrealised gains on investments - (53) (53)Others (1) - - - (1)
(1,463) - (194) 234 - - (1,423)Deferred tax assetsProvision for doubtful debts and advances
51 - 31 - - 82
Provision for employee benefits 153 - 72 - - 225 Realised gain on forward contracts 95 25 - - 120 Depreciation / amortisation 71 146 - - 217 MTM on ineffective hedges (46) 112 - - 66 Capital Loss on buyback of shares by L&T Infotech Financial Services Technologies Inc.
- 63 - - 63
Others (3) 45 (1) - 41 MAT credit 2,576 - (46) - - 2,530
2,897 - 448 - (1) - 3,344 Net deferred tax assets/(liabilities)(B)
1,434 - 254 234 (1) - 1,921
Net deferred tax assets/(liabilities)(A+B)
1,263 - 363 234 (7) (64) 1,789
*MAT credit for year ended 31 March 2018 of ` 59Mn net off reduction in MAT for year ended 31 March 2017 ` 106Mn due to Ind AS transitional deductions as per section 115JB of Income Tax Act 1961.
Notes forming part of Consolidated accounts

17Statutory Reports
72Financial Statements
01Corporate Overview
143
9 (III) Net schedule of Deferred tax for the year ended 31 March 2018
(` in Mn)
Deferred tax asset / (liability)
as at 31-03- 2017
Charge to retained earnings
Current year
(charge) / credit
(Charge) / credit to hedging reserve
Foreign currency
translation reserve
Charge pursuant to acquisition
of subsidiary
Deferred tax asset / (liability)
as at 31-03-2018
Gains on cash flow hedges (920) 234 - (686)
Branch profit tax (542) (141) - - - (683)
Unrealised gain on investments - (53) - - (53)
Provision for doubtful debts and advances
51 31 - - 82
Provision for employee benefits 153 72 - - 225
Realised gain on forward contracts 95 25 - - 120
Depreciation / amortisation (123) 247 (7) (64) 53
MTM on ineffective hedges (46) 112 - - 66
Capital Loss on buyback of shares by L&T Infotech Financial Services Technologies Inc.
- 63 - - 63
Non capital losses and deferred expenses
23 8 1 32
Others (4) 45 (1) - 40
MAT credit 2,576 (46) - - 2,530
Net Deferred Tax Asset/(Liabilities)
1,263 - 363 234 (7) (64) 1,789
9 (IV) Deferred tax liabilities or assets for the year ended 31 March 2017
9 (V) Deferred tax liabilities
(` in Mn)
Deferred tax asset/(liability)
as at 31-03- 2016
Deferred tax asset/(liability)
charged to retained earnings
Current year
(charge) / credit to profit and
loss a/c
(Charge) / credit to hedging reserve
Foreign currency
translation reserve
Charge pursuant to acquisition
of subsidiary
Deferred tax asset/ (liability)
as at 31-03- 2017
Deferred tax liabilities
Depreciation / amortisation (313) - 108 - 11 - (194)
(313) 108 11 (194)
Deferred tax assets
Non capital losses and deferred expenses
65 - (41) - (1) - 23
65 - (41) - (1) - 23
Net deferred tax assets/(liabilities)(A)
(248) - 67 - 10 - (171)
Notes forming part of Consolidated accounts

Annual Report 2017-18144
9 (VI) Deferred tax assets
(` in Mn) Deferred tax asset/(liability)
as at 31-03- 2016
Deferred tax asset/(liability)
charged to retained earnings
Current year
(charge) / credit to
profit & loss A/c
(Charge) / credit to hedging reserve
Foreign currency
translation reserve
Charge pursuant to acquisition
of subsidiary
Deferred tax asset/ (liability)
as at 31-03- 2017
Deferred tax liabilities - Income received in advance (2) - 2 - - - - Gain on cash flow hedges (172) - - (748) - - (920)MTM on ineffective hedges (46) (46)Branch Profit Tax (427) - (115) - - - (542)Others (1) - - - - (1)
(602) - (159) (748) - - (1,509)Deferred tax assetsIncome received in advance 2 - (2) - - - - Provision for doubtful debts and advances
43 - 8 - - - 51
Provision for employee benefits 99 - 54 - - 153 Realised gain on forward contracts 41 95 (41) - - 95 Depreciation / amortisation 44 - 27 - - - 71 loss carried forward as per provisions of Income Tax Act,1961
1 1
Others 10 - 1 - - (15) (4)MAT credit 2,576 - 440 (440) - - 2,576
2,815 - 624 (481) - (15) 2,943 Net deferred tax assets/(liabilities)(B)
2,213 - 465 (1,229) - (15) 1,434
Net deferred tax assets/(liabilities)(A+B)
1,965 - 532 (1,229) 10 (15) 1,263
9 (VII) Net schedule of Deferred tax for the year ended 31 March 2017
(` in Mn) Deferred
tax asset / (liability)
as at 31-03- 2016
Charge to retained earnings
Current year
(charge) / credit
(Charge) / credit to hedging reserve
Foreign currency
translation reserve
Charge pursuant to acquisition
of subsidiary
Deferred tax asset / (liability)
as at 31-03- 2017
Depreciation / amortisation (269) - 135 - 11 - (123)Gains on cash flow hedges (172) (748) - - (920)Branch profit tax (427) - (115) (542)Loss carried forward as per provisions under Income Tax Act, 1961
- - 1 - - - 1
MTM on ineffective hedges - - (46) - - - (46)Non capital losses and deferred expenses
65 - (41) - (1) - 23
Provision for doubtful debts and advances
43 - 8 - - - 51
Provision for employee benefits 99 - 54 - - - 153 Realised gain on forward contracts
41 - 95 (41) - - 95
Others 9 - 1 (15) (5)MAT credit 2,576 - 440 (440) - - 2,576 Net Deferred Tax Asset/(Liabilities)
1,965 - 532 (1,229) 10 (15) 1,263
Notes forming part of Consolidated accounts

17Statutory Reports
72Financial Statements
01Corporate Overview
145
Notes forming part of Consolidated accounts
9 (VIII) Summary of minimum alternate tax (MAT) credit available for set off against future tax liability arising under provisions of Income tax Act, 1961 for the year ended on 31 March 2018
(` in Mn)
Financial year MAT credit Set-off in earlier years
Balance brought forward for the
current year
MAT credit utilised in
current year
Balance MAT carried forward
to next year
Year of expiry
2007-2008 184 184 - - - 2008-2009 218 218 - - - 2009-2010 272 87 185 - 185 2024-252010-2011 454 - 454 - 454 2025-262011-2012 - - - - - 02012-2013 - - - - - 2027-282013-2014 366 - 366 - 366 2028-292014-2015 485 - 485 - 485 2029-302015-2016 647 - 647 - 647 2030-312016-2017 * 334 - 334 - 334 2031-322017-2018 59 - 59 - 59 2032-33Total 3,019 489 2,530 - 2,530
* MAT credit reinstated as per Income tax records.
# Impact of MAT credit due to postponement of ICDS given in financial year 2016-17
*Reduction in MAT for year ended 31 March 2017 of ` 106Mn due to Ind AS transitional deductions as per section 115JB of Income Tax Act 1961.
9 (IX) Summary of minimum alternate tax (MAT) credit available for set off against future tax liability arising under provisions of Income tax Act, 1961 for the year ended on 31 March 2017
(` in Mn)
Financial year MAT credit Set-off in earlier years
Balance brought forward for the
current year
MAT credit utilised in
current year
Balance MAT carried forward
to next year
Year of expiry
2007-2008 184 184 - - - -2008-2009 218 218 - - - -2009-2010 272 87 185 - 185 -2010-2011 454 - 454 - 454 2025-20262011-2012 - - - - - -2012-2013 - - - - - -2013-2014 365 - 365 - 365 2028-20292014-2015 485 - 485 - 485 2029-20302015-2016 647 - 647 - 647 2030-20312016-2017 440 - 440 - 440 2031-2032Total 3,065 489 2,576 - 2,576
10 OTHER NON CURRENT ASSETS
(` in Mn) As at
31-03-2018 As at
31-03-2017 Prepaid Expenses 147 155 Advance recoverable in cash or kind 933 1,137
1,080 1,292
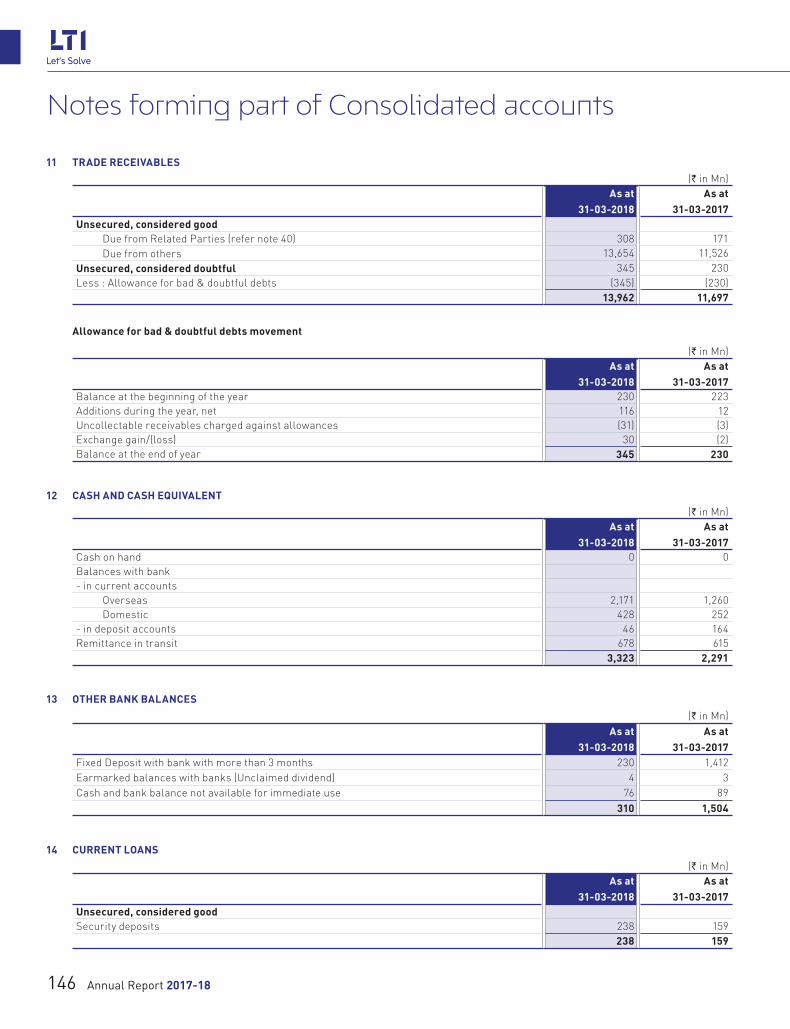
Annual Report 2017-18146
11 TRADE RECEIVABLES
(` in Mn) As at
31-03-2018 As at
31-03-2017 Unsecured, considered good Due from Related Parties (refer note 40) 308 171 Due from others 13,654 11,526 Unsecured, considered doubtful 345 230 Less : Allowance for bad & doubtful debts (345) (230)
13,962 11,697
Allowance for bad & doubtful debts movement
(` in Mn) As at
31-03-2018 As at
31-03-2017 Balance at the beginning of the year 230 223 Additions during the year, net 116 12 Uncollectable receivables charged against allowances (31) (3)Exchange gain/(loss) 30 (2)Balance at the end of year 345 230
12 CASH AND CASH EQUIVALENT
(` in Mn) As at
31-03-2018 As at
31-03-2017 Cash on hand 0 0 Balances with bank- in current accounts Overseas 2,171 1,260 Domestic 428 252 - in deposit accounts 46 164 Remittance in transit 678 615
3,323 2,291
13 OTHER BANK BALANCES
(` in Mn) As at
31-03-2018 As at
31-03-2017 Fixed Deposit with bank with more than 3 months 230 1,412 Earmarked balances with banks (Unclaimed dividend) 4 3 Cash and bank balance not available for immediate use 76 89
310 1,504
14 CURRENT LOANS
(` in Mn) As at
31-03-2018 As at
31-03-2017 Unsecured, considered goodSecurity deposits 238 159
238 159
Notes forming part of Consolidated accounts

17Statutory Reports
72Financial Statements
01Corporate Overview
147
Notes forming part of Consolidated accounts
15 OTHER CURRENT FINANCIAL ASSETS
(` in Mn) As at
31-03-2018 As at
31-03-2017 Advances to employees 391 266 Forward contract receivable 1,580 2,251 Others 5 1
1,976 2,518
16 OTHER CURRENT ASSETS
(` in Mn) As at
31-03-2018 As at
31-03-2017 Prepaid expenses 743 915 Advances recoverable in cash or kind 304 51 Advances to vendors 78 22
1,125 988
17 SHARE CAPITAL
I) Share capital authorised, issued, subscribed and paid up:
(` in Mn) As at
31-03-2018 As at
31-03-2017 Authorised :260,000,000 equity shares of ` 1 each * 260 240 (Previous year 240,000,000 of ` 1 each)
260 240 Issued, paid up and subscribed171,999,263 equity shares for ` 1 each 172 171 (Previous year 170,571,113 of ` 1 each)
172 171
* Pursuant to scheme of amalgamation of AugmentIQ Data Sciences Private Limited (transferor company) with the Company, the authorised share capital of INR 20 Mn is transferred to the Company (refer no. 38)
II) Terms/rights attached to equity shares
The Company has only one class of equity shares having a par value of Re. 1 per share. Each holder of equity shares is entitled to one vote per share. The Company declares and pays dividend in Indian Rupees.
III) Shareholders holding more than 5% of equity shares as at the end of the year:
Name of Shareholder Number of Shares
Shareholding %
As at 31-03-2018Larsen & Toubro Limited 142,693,637 82.96%
As at 31-03-2017Larsen & Toubro Limited 143,750,000 84.28%

Annual Report 2017-18148
Notes forming part of Consolidated accounts
IV) Reconciliation of the number of equity shares and share capital:
Due to allotment of shares on exercise of stock options by employees, there was a movement in share capital for the year ended 31 March 2018 and 31 March 2017 as given below
(` in Mn) As at
31-03-2018 As at
31-03-2017 Issued, subscribed and fully paid up equity shares outstanding at the beginning 170,571,113 169,816,188 Add: Shares issued on exercise of employee stock options 1,428,150 754,925 Issued, subscribed and fully paid up equity shares outstanding at the end 171,999,263 170,571,113
V) Stock option plans:
Employee Stock Ownership Scheme (‘ESOS Plan’) The grant of options to the employees under ESOS Plan is on the basis of their performance and other eligibility criteria.
Sr. no
Particulars ESOP scheme 2000 I,II & III
ESOP scheme 2000 IV - XXI
U.S. Stock Option Sub-plan 2006
ESOP scheme 2015
2017-18 2016-17 2017-18 2016-17 2017-18 2016-17 2017-18 2016-17i Grant Price ` 5 ` 5 ` 2 ` 2 USD 2.4 USD 2.4 ` 1 ` 1ii Grant Dates 01 April 2001
onwards01 October 2001
onwards15 March 2007
onwards10 June 2016
onwardsiii Vesting commences on 01 April 2002
onwards01 October 2002
onwards15 March 2008
onwards10 June 2017
onwardsiv Options granted & outstanding at the
beginning of the year36,720 82,660 1,450,725 2,350,106 47,000 143,650 3,596,300 -
v Options reinstated during the year - - - - - -vi Options granted during the year - - - - - 129,300 3,658,000vii Options allotted/execised during the year 3,375 11,830 673,315 725,445 8,000 17,650 743,460 -viii Options Lapsed/cancelled during the year 12,000 34,110 92,108 173,936 - 79,000 132,000 61,700
ix Options granted & outstanding at the end of the year
21,345 36,720 685,302 1,450,725 39,000 47,000 2,850,140 3,596,300
x Options vested at the end of the year out of (ix)
21,345 36,720 447,852 223,760 39,000 47,000 312,600 -
xi Options unvested at the end of the year out of (ix)
- - 237,450 1,226,965 - - 2,537,540 3,596,300
xii Weighted average remaining contractual life of options (in years)
- - 0.7 1.7 - - 5.3 6.2
(VI) The aggregate number of equity shares allotted as fully paid up by way of bonus shares in immediately preceding five years ended 31 March 2018 are Nil (previous period of five years ended 31 March 2017 - Nil)
(VII) The aggregate number of equity shares issued pursuant to contract, without payment being received in cash in immediately preceding five years ended 31 March 2018 – Nil (previous period of five years ended 31 March 2017 - Nil)
(VIII) During the year ended 31 March 2018, the amount of interim dividend distributed to equity shareholder was ` 8.00 per share at face value of ` 1 (previous year ` 6.85 per share at face value of ` 1) for the year ended 31 March 2018 and final dividend of ` 9.70 per share at face value of ` 1.
(IX) The number and weighted average exercise price of stock options are as follows:
Particulars 2017-18 2016-17No. of stock
optionsWeighted average
exercise priceNo. of stock
optionsWeighted average
exercise pricei Options granted & outstanding at the beginning of the year 5,130,745 2.73 2,576,416 11.14 ii Options reinstated during the year - - - - iii Options granted during the year 129,300 1.00 3,658,000 1.00 iv Options allotted during the year 1,428,150 2.35 754,925 5.64 v Options Lapsed/cancelled during the year 236,108 1.59 348,746 36.92 vi Options granted & outstanding at the end of the year 3,595,787 2.90 5,130,745 2.73 vii Options vested at the end of the year out of (v) 820,797 9.03 307,480 25.84

17Statutory Reports
72Financial Statements
01Corporate Overview
149
(X) Weighted average share price at the date of exercise for stock options exercised during the year is ` 850 per share (previous year ` 621 per share).
(XI) Weighted average fair value of options granted during the year is ` 644.71 (previous year ` 407.39).
(XII) The fair value has been calculated using the Black-Scholes Option Pricing model and significant assumptions and inputs to estimate the fair value options granted during the year are as follows::
Sr. no
Particulars 2017-18 2016-17
i Weighted average risk-free interest rate 6.69% 7.10%ii Weighted average expected life of options 3 years 3 yearsiii Weighted average expected volatility 17.88% 19.23%iv Weighted average expected dividends over the life of option ` 115.33 ` 115.56v Weighted average share price ` 644.71 ` 407.74 vi Weighted average exercise price ` 1 ` 1vii Method used to determine expected volatility The expected volatility has been
calculated entirely based on historic volatility IT Index.
The expected volatility has been calculated entirely based on historic volatility IT Index, as historical data of the Croup is not available being an unlisted Company.
XII) The balance in share option outstanding account as on 31 March, 2017 is ` 1,216 Mn (previous year ` 1,510 Mn).
18 OTHER EQUITY
(` in Mn)
Sr. no
Particulars 2017-18 2016-17
I) General Reserve
Opening balance 4,501 4,492
Add: Employee stock compensation outstanding 2 -
Add: transfer from employee outstanding - 9
4,503 4,501
II) Hedging Reserve
Opening balance 3,081 877
Add: Movement in forward contracts receivable 1,477 4,641
Less: Amount reclassified to profit or loss (2,966) (1,460)
Less: Deferred tax related to above 433 (977)
2,025 3,081
III) Share Premium
Opening balance 1,498 1,473
Add: Additions during the year 321 25
1,819 1,498
IV) Employee Stock option outstanding
Opening balance 1,511 77
Add: Additions during the year 83 1,492
Less: Transferred to general reserve - (8)
Less: Deductions during the year (378) (50)
1,216 1,511
Notes forming part of Consolidated accounts

Annual Report 2017-18150
(` in Mn)
Sr. no
Particulars 2017-18 2016-17
Deferred employee compensation expenseOpening balance (945) - Add: Additions during the year (83) (1,492)Less: Deductions during the year 562 547
(466) (945)Balance to be carried forward 750 566
V) Foreign currency translation reserveOpening balance 264 479 Add: Transfer 160 (215)
424 264 VI) Retained Earnings
Opening balance 21,362 13,678 Add: Profit for the year 11,120 9,707 Add: Other comprehensive income 62 (45)Less: Dividend (including dividend distribution tax) (3,639) (1,978)
28,905 21,362 38,426 31,272
19 OTHER NON CURRENT FINANCAL LIABILITY
(` in Mn) As at
31-03-2018 As at
31-03-2017 Liability for customer settlement 204 - Payable for acquisition of business 837 -
1,042 -
20 (I) NON CURRENT PROVISIONS
(` in Mn) As at
31-03-2018 As at
31-03-2017 Post-retirement medical benefit 169 174 Others 111 111
280 285
20 (II) DISCLOSURE PURSUANT TO ACCOUNTING STANDARD (IND- AS) 37 “PROVISIONS, CONTINGENT LIABILITIES AND CONTINGENT ASSETS”MOVEMENT IN PROVISIONS:
Sr. No.
Particulars Class of provisions Sales Tax Others Total
i Balance as at 1-4-2017 4 107 111ii Additional provision during the year - - -iii Provision used during the year - - -iv Provision reversed during the year - - -v Balance as at 31-03-2018 4 107 111
Nature of provisions: a) Provision for sales tax pertains to claim made by the authorities on certain transaction of capital nature for the year 2002-03. b) Provision for others represents liabilities relating to matters in dispute
Notes forming part of Consolidated accounts

17Statutory Reports
72Financial Statements
01Corporate Overview
151
21 TRADE PAYABLES
(` in Mn) As at
31-03-2018 As at
31-03-2017 Due to Related Parties (Refer Note 40) 60 167 Due to others 1,468 1,059 Accrued expenses 2,360 2,140
3,888 3,366
22 OTHER CURRENT FINANCIAL LIABILITIES
(` in Mn) As at
31-03-2018 As at
31-03-2017 Unclaimed dividend 4 3 Employee liabilities (others) 4,081 3,761 Gratuity liability 128 157 Credit Support Agreement Deposit 1,617 2,025 Liability for customer settlement expense 219 -Others 57 52
6,106 5,998
23 OTHER CURRENT LIABILITIES
(` in Mn) As at
31-03-2018 As at
31-03-2017 Other payables 1,617 1,158
1,617 1,158
24 CURRENT PROVISIONS
(` in Mn) As at
31-03-2018 As at
31-03-2017 Compensated absences 1,841 1,613 Post retirement medical benefits 2 1 Other provisions 1 -
1,844 1,614
25 REVENUE FROM OPERATIONS
(` in Mn) 2017-18 2016-17
Revenue 73,065 65,009 73,065 65,009
Notes forming part of Consolidated accounts

Annual Report 2017-18152
26 OTHER INCOME
(` in Mn) 2017-18 2016-17
Income from current investment in mutual funds 738 194 Interest received 23 27 Foreign exchange gain * 3,427 1,539 Profit on sale of fixed assets 2 - Miscellaneous income 71 107
4,261 1,867
* The foreign exchange gain reported above includes `2,966 Mn (previous year ended 31 March 2017 `1,460 Mn) gain on derivative instruments which are designated as cash flow hedges. Since the Company hedges its operational business exposure on a net basis (i.e. expected earnings in foreign currency less expected expenditure in related currency), the aforesaid gain/loss on derivative instruments relates to the business operations of the company.
27 EMPLOYEE BENEFIT EXPENSES
(` in Mn) 2017-18 2016-17
Salaries including overseas staff expenses 39,754 33,947 Share based payments to employees 400 428 Staff welfare 439 518 Contribution to provident and other funds 542 377 Contribution to superannuation Fund 45 54 Contribution to gratuity fund 155 115 Contribution to SSA & other funds 1,954 1,714
43,289 37,153
28 OPERATING EXPENSES
(` in Mn) 2017-18 2016-17
Consultancy charges 5,360 4,371 Cost of equipment, hardware and software packages 3,474 3,364 Travelling and conveyance 2,375 2,357 Rent and establishment expenses 1,842 1,688 Repairs and maintenance 815 804 Customer settlement expenses * 617 - Miscellaneous expenses 438 617 Telephone charges and postage 365 331 Recruitment expenses 359 211 Power and fuel 330 318 Rates and taxes 254 199 Advertisement 222 196 Communication expenses 189 238 Allowance for doubtful debts and advances 133 12 Less : Provision written back (17) - Insurance charges 58 55 Bad debts 31 3
16,845 14,764
* Customer settlement expenses are in relation to one time commercial settlement entered by the Company with one of its clients on 27 March 2018
Notes forming part of Consolidated accounts

17Statutory Reports
72Financial Statements
01Corporate Overview
153
29 FINANCE COST
(` in Mn) 2017-18 2016-17
Interest on deposits with respect to Credit support agreement 133 29 Notional interest on financial liability * 20 - Fixed loans - 1 On others 4 2
157 32
* Contingent consideration payable on business acquisition of syncordis group
30 (I) CURRENT TAX (NET)
(` in Mn) 2017-18 2016-17
Currrent Tax 3,754 3,159 Provision for earlier year (written back)/off (100) 22
3,654 3,181
30 (II) DEFERRED TAX
(` in Mn) 2017-18 2016-17
Deferred tax charge/(credit) (409) (92)MAT credit entitlement for current year 46 (440)
(363) (532)
*MAT credit for year ended 31 March 2018 of ` 59 Mn is net off reduction in MAT for year ending 31 March 2017 ` 106 Mn due to Ind AS transitional deductions as per section 115JB of Income Tax Act 1961.
30 (III) Applicable tax rates in various tax jurisdictions for the year ended 31 March 2018 is given below:
Jurisdiction of subsidiaries Applicable tax rates (%)Austria 25.00China 25.00Canada 26.50France 33.33Germany 15.83India 34.61Luxembourg * 19.00Mexico 30.00Spain 25.00South Africa 28.00United States 31.50UK 19.00
Jurisdiction of branches Applicable tax rates (%)Australia 30.00Belgium 33.00Costa Rica 30.00Denmark 22.00Finland 20.00France 33.33Japan 23.40Netherlands 25.00Norway 23.00Philippines 30.00Poland 19.00
Notes forming part of Consolidated accounts

Annual Report 2017-18154
Notes forming part of Consolidated accounts
Jurisdiction of branches Applicable tax rates (%)Qatar 10.00Saudi Arabia 20.00South Africa 28.00Singapore 17.00Sweden 22.00United Kingdom 19.00United States ** 31.50
** Tax rate in United States has changed from 35% to 21% w.e.f. 1 January 2018. Rate mentioned above is weighted average rate for the year ended 31 March 2018.
30 (IV) A reconciliation of the income tax provision to the amount computed by applying enacted income tax rate to the profit before income taxes is as follows:
(` in Mn) 2017-18 2016-17
Profit before income taxes 14,415 12,358 Enacted tax rates in India 34.608% 34.608%Computed expected tax expense 4,989 4,277 Tax effect due to non-taxable income for Indian tax purposes (1,817) (1,360)Overseas taxes 446 413 Short/excess provision 7 20 Effect of exempt income for Indian tax purposes (101) (741)Capital losses carried forward (133)Effect of allowances of eligible expenses (774) (410)Effect of non-deductible expenses 772 480 Effect of deferred taxes (410) (94)Others 312 64Tax expense as per statement of profit and loss 3,291 2,649
31 STATEMENT OF OTHER COMPREHENSIVE INCOME
(` in Mn) 2017-18 2016-17
Items that will not be reclassified to profit or lossDefined benefit plan actuarial gain/(loss) 80 (57)Income tax on defined benefit plan actuarial gain/(loss) (18) 12
62 (45)Items that will be reclassified to profit or lossNet changes in fair value of cash flow hedges (1,489) 3,181 Income tax on net changes in fair value of cash flow hedges 433 (977)Foreign currency translation reserve 159 (214)
(897) 1,990 (835) 1,945

17Statutory Reports
72Financial Statements
01Corporate Overview
155
32 CONTINGENT LIABILITIES
(` in Mn) As at
31-03-2018 As at
31-03-2017 1 Income tax liability that may arise in respect of which the Company is in appeal * 2,391 1,971 2 Corporate guarantee given on behalf of subsidiary ** 3,546 3,726 3 Service tax refund disallowed, in respect of # 92 81
6,029 5,778
*Out of contingent Tax liability disclosed above, ` 2,165 Mn (including interest of ` 185 Mn), pertains to the tax demand arising on account of disallowance of exemption u/s 10A/10AA on profits earned by STPI Units/SEZ units on onsite export revenue. Company is pursuing appeal against these demands before the relevant Appellate Authorities. The company believes that its position is likely to be upheld by appellate authorities and considering the facts, the ultimate outcome of these proceedings is not likely to have material adverse effect on the results of operations or the financial position of the Company.
** The Company had given a corporate guarantee on behalf of its wholly owned subsidiary L&T Infotech Financial Services Technologies Inc. The guarantee is for performance of all obligations by LTIFST Canada in connection with its long term annuity services contracts with customer. The obligation under this guarantee is limited in aggregate to the amount of CAD 70,000,000.
# The Company had filed for refund of accumulated service tax credit in accordance with relevant CENVAT credit Rules. However, the department has disallowed certain portion of such refunds considering the same as ineligible as not related with output services. The Company is in appeal against these disallowances before the relevant Authorities and is hopeful of getting a favourable order.
33 Estimated amount of contracts remaining to be executed on capital account (net of advances) and not provided for: ` 178 Mn (previous year ` 151 Mn).
34 EMPLOYEE BENEFITS
I) The amounts recognised in balance sheet are as follows:
(` in Mn) Gratuity plan
As at 31-03-2018 As at 31-03-2017 a) Present value of defined benefit obligation - Wholly funded 798 684 - Wholly unfunded - - b) Fair value of plan assets as on* 670 527 Amount to be recognised as liability or (asset) (a-b) 128 157 Net liability/(asset)-current 128 157 Net liability/(asset)- non current - 0
* Asset is not recognised in the balance sheet
(` in Mn) Post-retirement medical benefit plan As at 31-03-2018 As at 31-03-2017
A.a) Present value of defined benefit obligation - Wholly funded - 0 - Wholly unfunded 170 175b) Fair value of plan assets - 0 Amount to be recognised as liability or (asset) (a-b) 170 175B.Amounts reflected in the balance sheetLiability 170 175Assets - 0Net liability/(asset) 170 175Net liability/(asset)-current 1 1Net liability/(asset)- non current 169 174
Notes forming part of Consolidated accounts

Annual Report 2017-18156
Notes forming part of Consolidated accounts
(` in Mn) Provident fund plan
(refer note (X)(iii) below) As at 31-03-2018 As at 31-03-2017
A.a) Present value of defined benefit obligation - Wholly funded 5,865 4910 - Wholly unfunded - - b) Fair Value of plan assets 5,914 4939 Amount to be recognised as liability or (asset) (a-b)* (49) (29)B.Amounts reflected in the balance sheetLiability 78 62Assets - 0Net liability/(asset)# 78 62Net liability/(asset)-current 78 62Net liability/(asset)- non current - -
# Employer’s and employee’s contribution for March 2018 paid in April 2018
* Asset is not recognised in the balance sheet
II) The amounts recognised in statement of profit and loss are as follows:
(` in Mn) Gratuity plan
As at 31-03-2018 As at 31-03-2017 i. Current service cost 135 112ii. Past service cost 13 0iii. Administration expenses - 0iv. Interest on net defined benefit liability / (asset) 7 3v. (Gains) / losses on settlement - 0Total expense charged to profit and loss account 155 115
(` in Mn) Post-retirement medical benefit plan
2017-18 2016-17 i. Current service cost 43 27 ii. Past service cost (7) - iii. Administration expenses - - iv. Interest on net defined benefit liability / (asset) 12 10 v. (Gains) / losses on settlement - - Total expense charged to profit and loss account 48 37
(` in Mn) Provident fund plan 2017-18 2016-17
1. Current service cost 271 2742. Interest cost 440 3733. Expected return on plan assets (440) (373)Total expense for the year included in staff cost 271 274

17Statutory Reports
72Financial Statements
01Corporate Overview
157
III) The amounts recognised in statement of other comprehensive income (OCI) are as follows:
(` in Mn)
Gratuity plan Post retirement medical benefit plan 2017-18 2016-17 2017-18 2016-17
Opening amount recognized in OCI 28 (14) 3 (11)Re-measurements during the period due to:Changes in financial assumptions 8 41 (32) 32 Experience adjustments (10) (5) (20) (18)Actual return on plan assets less interest on plan assets (24) 6 - - Closing amount recognized in OCI 2 28 (49) 3
IV) The changes in the present value of defined benefit obligation representing reconciliation of opening and closing balances thereof are as follows:
(` in Mn) Gratuity plan
2017-18 2016-17 Opening balance of defined benefit obligation 684 579Current service cost 135 112Past service cost 13 0Interest on defined benefit obligation 43 41Re-measurements due toActurial loss / (gain) arising from change in financial assumption 8 41Acturial loss / (gain) arising from change in demographic assumptions - 0Acturial loss/ (gain) arising on account of experience changes (10) -5Benefits paid (75) -84Liabilities assumed / (settled)* - - Liabilities extinguished on settlements - - Closing balance of defined benefit obligation 798 684
* On account of business combination or inter -company transfer
(` in Mn) Post-retirement medical benefit plan
2017-18 2016-17 Opening balance of defined benefit obligation 174 124Current service cost 43 27Past service cost (7) - Interest on defined benefit obligation 12 10Re-measurements due toActurial loss / (gain) arising from change in financial assumption (32) 31Acturial loss / (gain) arising from change in demographic assumptions - - Acturial loss/ (gain) arising on account of experience changes (20) (18)Benefits paid - 0Liabilities assumed / (settled)* - 0Liabilities extinguished on settlements - 0Closing balance of defined benefit obligation 170 174
* On account of business combination or inter-company transfer
Notes forming part of Consolidated accounts

Annual Report 2017-18158
(` in Mn) Provident fund plan 2017-18 2016-17
Opening balance of defined benefit obligation 4,910 4,254 Add : Interest cost 440 373 Add : Current service cost 271 274 Add : Contribution by plan participants 599 617 Add/(Less) : actuarial (gains)/losses - - Add: Business combination/acquisition - - Less: Assets acquired/(settled)* 287 (50)Liabilities assumed on acquisition/ (settled on divestiture) - - Less : Benefits paid (642) (558)Closing balance of defined benefit obligation 5,865 4,910
* On account of business combination or inter-company transfer
V) Changes in the fair value of plan assets representing reconciliation of the opening and closing balances thereof are as follows:
(` in Mn)
Gratuity plan Provident fund plan 2017-18 2016-17 2017-18 2016-17
Opening balance of the fair value of the plan assets 527 493 4,939 4,264 Employer’s contributions 157 87 265 271 Expected return on plan assets 36 38 440 373 Administration expenses - - - - Actuarial gains / (loss) - - 312 47 Re-measurements due to:Actual return on plan assets less interest on plan assets 24 (7) - - Contribution by plan participants - - 602 592 Benefits paid (75) (84) (642) (558)Assets acquired/(settled)* - - (1) (50)Assets distributed on settlements - - Closing balance of plan assets 670 527 5,914 4,939
* On account of business combination or inter-company transfer
The Company expects to contribute ` 128 Mn (` 157 Mn in 2016-17) towards its gratuity, in the next financial year.
VI) The major categories of plan assets as a percentage of total plan assets are as follows:
(` in Mn) 2017-18
Gratuity plan Provident fund plan
Government of India securities
Scheme with LIC
23.05%State government securities 20.03%Corporate bonds 17.27%Fixed deposits under Special Deposit Scheme framed by central government for provident funds 5.74%Public sector bonds 28.45%Mutual Funds 3.01%Others 2.45%
Notes forming part of Consolidated accounts

17Statutory Reports
72Financial Statements
01Corporate Overview
159
VII) Principal actuarial assumptions at the balance sheet date :
(` in Mn) 2017-18 2016-17
i. Discount rate For gratuity 7.60% 6.75% For post -retirement medical benefits 7.60% 6.75%ii. Annual increase in healthcare costs (see note below) 5.00% 5.00%iii. Attrition rate : Varies between
2% to 18%Varies between
2% to 18%iv. Salary growth rate * 6.00% 5.00%
* Note - Salary growth rate assumption has been revised to reflect Company’s average salary growth rate and current market conditions
VIII) Projected plan cash flow:
The table below shows the expected cash flow profile of the benefits to be paid to the current membership of the plan (which in case of serving employees, if any, is based on service accrued by employee up to valuation date):
As on 31 March 2018
(` in Mn) Maturity profile Gratuity Post-Retirement medical benefit liability Expected benefits for year 1 106 2 Expected benefits for year 2 101 2 Expected benefits for year 3 100 3 Expected benefits for year 4 98 3 Expected benefits for year 5 94 4 Expected benefits for year 6 89 5 Expected benefits for year 7 83 5 Expected benefits for year 8 76 6 Expected benefits for year 9 74 7 Expected benefits for year 10 and above 640 1,186
As on 31 March 2017
(` in Mn) Maturity profile Gratuity Post-Retirement medical benefit liabilityExpected benefits for year 1 96 1 Expected benefits for year 2 87 2 Expected benefits for year 3 86 2 Expected benefits for year 4 82 3 Expected benefits for year 5 77 3 Expected benefits for year 6 72 4 Expected benefits for year 7 66 5 Expected benefits for year 8 61 5 Expected benefits for year 9 54 6 Expected benefits for year 10 and above 469 1,036
The estimates of future salary increases considered in actuarial valuation, take into account inflation, seniority, promotion and other relevant factors, such as supply and demand in the employment market
Notes forming part of Consolidated accounts

Annual Report 2017-18160
IX) Sensitivity analysis
i) Post retirement benefits:
Although the obligation of the Group under the post-retirement medical benefit plan is limited to the overall ceiling limits, assumed healthcare cost trend rates may affect the amounts recognised in the statement of profit and loss. The benefit obligation results for the cost of paying future hospitalization premiums to insurance company and reimbursement of domiciliary medical expenses in future for the employee / beneficiaries during their lifetime is sensitive to discount rate, future increase in healthcare costs and longevity. The following table summarizes the impact in percentage terms on the reported defined benefit obligation at the end of the reporting period arising on account changes in these three key parameters:
Period ended 31 March 2018
Discount Rate
Impact of increase in 100 bps on defined benefit obligation -17.38%
Impact of decrease in 100 bps on defined benefit obligation 22.74%
Healthcare costs rate
Impact of increase in 100 bps on defined benefit obligation 17.71%
Impact of decrease in 100 bps on defined benefit obligation -14.09%
Life expectancy
Impact of increase by 1 year on defined benefit obligation 0.57%
Impact of decrease by 1 year on defined benefit obligation -0.59%
ii) Gratuity:
Gratuity is a lump sum plan and the cost of providing these benefits is typically less sensitive to small changes in demographic assumptions. The key actuarial assumptions to which the benefit obligation results are particularly sensitive to are discount rate and future salary escalation rate. The following table summarizes the impact in percentage terms on the reported defined benefit obligation at the end of the reporting period arising on account of an increase or decrease in the reported assumption as below:
Period ended 31 March 2018
Discount rate Salary escalation rate
Impact of increase in 100 bps on defined benefit obligation -6.08% 6.80%
Impact of decrease in 100 bps on defined benefit obligation 6.82% -6.19%
Notes forming part of Consolidated accounts

17Statutory Reports
72Financial Statements
01Corporate Overview
161
35 FINANCIAL INSTRUMENTS BY CATEGORY
I) Carrying value of financial instruments by categories are as follows: (` in Mn)
As at 31-03-2018 As at 31-03-2017 Fair value
through P&L
(FVTPL)
Fair value through
OCI (FVTOCI)
Amortised cost
Total Fair value through
P&L (FVTPL)
Fair value through
OCI (FVTOCI)
Amortised cost
Total
Financial assetsInvestments 12,644 12,644 9,406 9,406Trade receivables 13962 13,962 11,697 11,697Unbilled revenue 8365 8,365 4,724 4,724Cash and cash equivalents 3323 3,323 2,291 2,291Other bank balances 310 310 1504 1504Loans 625 625 470 470Derivative financial instruments (50) 2,351 2,301 220 3,897 0 4117Other financial assets 395 395 - - 267 267 Total 12,594 2,351 26,980 41,925 9,626 3,897 20,953 34,476
(` in Mn) As at 31-03-2018 As at 31 March 2017
Fair value through
P&L (FVTPL)
Fair value through
OCI (FVTOCI)
Amortised cost
Total Fair value through
P&L (FVTPL)
Fair value through
OCI
Amortised cost
Total
Financial liabilityBorrowings - - - - - - - Current maturities of long term borrowings
- - - - - - -
Trade payables - - 3,888 3,888 - - 3,366 3,366Other financial liabilities - - 7,148 7,148 - - 5,998 5,998Total - - 11,036 11,036 - - 9,364 9,364
II) Fair value hierarchy used by the Group for valuation of financial assets and liabilities recognised at FVTPL and FVTOCI is as below: Level 1- Quoted prices (unadjusted) in the active markets for identical assets or liabilities. Level 2- Inputs other than quoted prices included with in level 1 that are observable for assets or liabilities either directly or indirectly. Level 3- Inputs for assets or liabilities that are not based on observable market data
(` in Mn) As at 31 March 2018 As at 31 March 2017
Level 1 Level 2 Level 3 Total Level 1 Level 2 Level 3 TotalInvestments 12,643 1 12,644 9,406 9,406Derivative financial instruments 2,301 2,301 4,117 4,117Total 12,643 2,301 1 14,945 9,406 4,117 - 13,523
III) Financial risk management
The Company is exposed to foreign currency risk, interest rate risk, credit or counterparty risk and liquidity risk. i) Currency risk Primary market risk to the Group is foreign exchange risk. The Group uses derivative financial instruments to mitigate foreign exchange related exposures. All derivative activities for risk
management purposes are carried out by specialist teams that have the appropriate skills, experience and supervision.
The Group’s operations are principally in foreign currencies and the maximum exposure is in US dollars.
The Board of Directors has approved the Group’s financial risk management policy covering management of foreign currency exposures. The treasury department monitors the foreign currency exposures and takes appropriate forward covers to mitigate its risk. The Group hedges its exposure on a net basis (i.e. expected earnings in foreign currency less expected expenditure in related currency) These hedges are cash flow hedges as well as hedges not designated as cash flow hedges.
Notes forming part of Consolidated accounts

Annual Report 2017-18162
The Group does not enter into hedge transactions for either trading or speculative purposes.
The outstanding forward contracts at the year end their maturity profile and sensitivity analysis are as under.
Fair value of forward contracts of USD ` as at 31 March 2018 and 31 March 2017 was ` 49,722 Mn and 57,886 Mn respectively. Outstanding number of contracts as at 31 March 2018 were 266 and 31 March 2017 were 269
A) Notional value of forward contracts designated as cash flow hedges is given as below:
(` in Mn) Currency As at 31 March 2018 As at 31 March 2017
Amount in USD Mn
Amount in ` Mn Amount in USD Mn
Amount in ` Mn
USD-` 730 52,945 848 61,818
B) The foreign exchange forward contracts designated as cash flow hedges mature maximum within 36 months. The table below analyses the derivative financial instrument into relevant maturity Companying based on the remaining period as of the balance sheet. Contracts with maturity not later than twelve months include certain contracts which can be rolled over to subsequent periods in line with underlying exposures:
(` in Mn) In USD As at
31 March 2018As at
31 March 2017Not later than twelve months 26,192 29,509Later than twelve months 26,753 32,309Total 52,945 61,818
C) Value-at-Risk (VaR)
To provide a meaningful assessment of the foreign currency risk associated with the Group’s foreign currency derivative positions against off balance sheet exposures and unhedged portion of on-balance sheet exposures, the Group uses a multi-currency correlated VaR model. The VaR model uses a Monte Carlo simulation to generate thousands of random market price paths for foreign currencies against Indian rupee taking into account the correlations between them. The VaR is the expected loss in value of the exposures due to overnight movement in spot exchange rates, at 95% confidence interval. The VaR model is not intended to represent actual losses but is used as a risk estimation tool. The model assumes normal market conditions and is a historical best fit model. Because the Group uses foreign currency instruments for hedging purposes, the loss in fair value incurred on those instruments are generally offset by increases in the fair value of the underlying exposures for on-balance sheet exposures. The overnight VAR of the Group at 95% confidence level is ` 287 Mn as at 31 March 2018 ` 396 Mn as at 31 March 2017.
Actual future gains and losses associated with the Group’s investment portfolio and derivative positions may differ materially from the sensitivity analyses performed as of 31 March 2018 due to the inherent limitations associated with predicting the timing and amount of changes in foreign currency exchanges rates and the Group’s actual exposures and position.
ii) Interest risk
The Group has no interest rate risk in case of borrowings as on 31 March 2017. However the Group invests its surplus funds in Debt mutual funds. The Group mitigates the risk of counter-party failure by investing in mutual fund schemes with large assets under management and having investments in debt instruments issued with sound credit rating.
Net assets value(NAV) of mutual funds are subject to changes in interest rates. Every one percent increase or decrease in the NAV of debt mutual funds where the company holds investments will impact he Company’s profit after tax by ` 126 Mn in 2017-18 and ` 94 Mn in 2016-17.
iii) Credit risk
The principal credit risk that the Group exposed to is non-collection of trade receivable and late collection of receivable leading to credit loss. The risk is mitigated by reviewing creditworthiness of the prospective customers prior to entering into contract and post contracting, through continuous monitoring of collections by a dedicated team.
The Group makes adequate provision for non-collection of trade receivable. Further, the Group has not suffered significant payment defaults by its customers.
Notes forming part of Consolidated accounts

17Statutory Reports
72Financial Statements
01Corporate Overview
163
In addition, for delay in collection of receivable, the Group has made provision for Expected Credit loss (‘ECL’) based on ageing analysis of its trade receivable. These range from 1.5% for dues outstanding up to six months to 19.2% for dues outstanding for more than 36 months for 2017-18 (Previous year 1.7% and 21.3% for dues outstanding up to 6 months and for more than 36 months respectively). No provision has been made on trade receivables in not due category.
ECL allowance for non-collection of receivable and delay in collection, on a combined basis were ` 78 Mn and ` 65 Mn for the financial years 2017-18 and 2016-17 respectively. The movement in allowance for doubtful debts comprising provision for both non-collection of receivables and delay in collections is as follows:
(` in Mn) 2017-18 2016-17
Opening balance 65 62Impairment loss recognised or (reversed) 13 3Closing balance 78 65
The percentage of revenue from its top five customers is 36.8% for 2016-17 (37.6% for 2017-18).
The counter-party risk that Group is exposed to is principally for financial instruments taken to hedge its foreign currency risks. The counter- parties are mainly banks and the Group has enter into contracts with the counter-parties for all its hedge instruments and in addition, entered into suitable credit support agreements to limit counter party risk where necessary.
iv) Liquidity risk
The Group’s treasury department monitors the cash flows of the Group and surplus funds are invested in non- speculative financial instruments that are usually highly liquid funds.
The Group has no borrowings as on 31 March 2018 but it has credit facilities with banks that will help it in generating funds for the business if required.
The contractual maturities of financial assets and financial liabilities is as follows:
(` in Mn) 31-03-2018 31-03-2017
Within a year More than one year
Total Within a year More than one year
Total
Trade payables 3,888 3888 3,366 - 3,366Other financial liabilities 6,106 1042 7148 5,998 - 5,998Total 9,994 1042 11,036 9,364 - 9,364
(` in Mn) 31-03-2018 31-03-2017
Within a year More than one year
Total Within a year More than one year
Total
Investments 12,643 1 12,644 9,406 - 9,406Trade receivables 13,962 13,962 11,697 - 11,697Unbilled revenue 8,365 8,365 4,724 - 4,724Cash and cash equivalent 3,323 3,323 2,291 - 2,291Other bank balances 310 310 1504 - 1,504Loans 238 387 625 159 310 469Derivative financial instruments 1,580 721 2,301 2,251 1,866 4,117Other financial assets 396 - 396 267 267Total 40,817 1,109 41,926 32,299 2,176 34,475
Notes forming part of Consolidated accounts
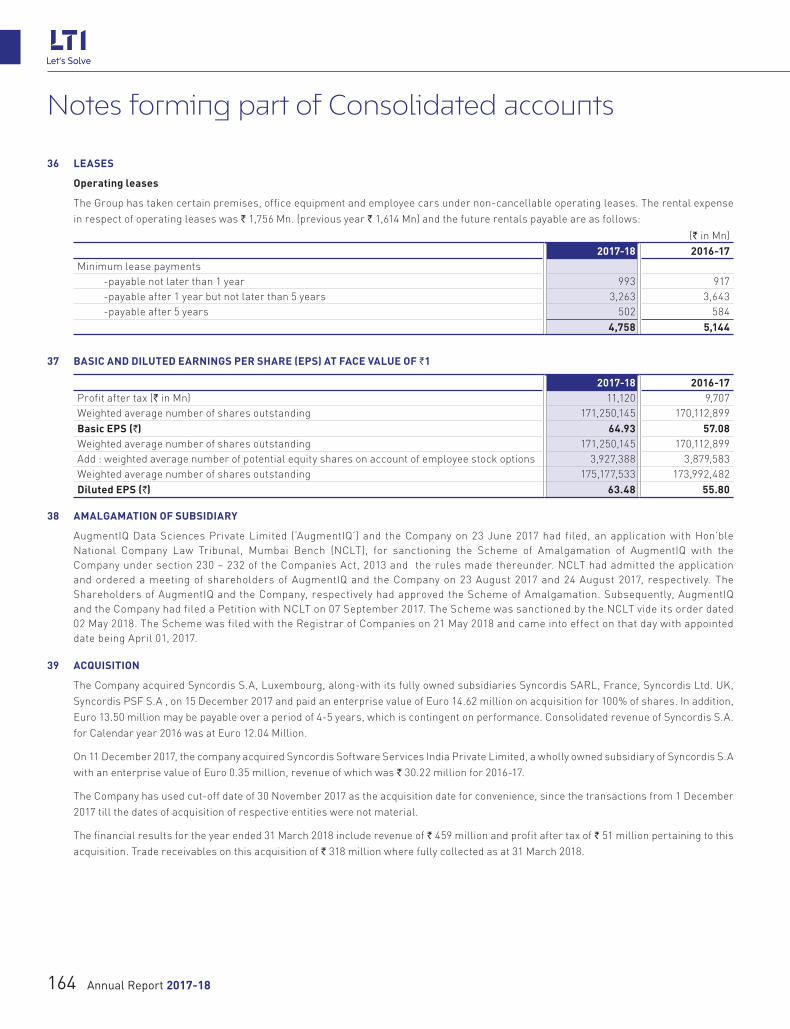
Annual Report 2017-18164
36 LEASES
Operating leases
The Group has taken certain premises, office equipment and employee cars under non-cancellable operating leases. The rental expense in respect of operating leases was ` 1,756 Mn. (previous year ` 1,614 Mn) and the future rentals payable are as follows:
(` in Mn) 2017-18 2016-17
Minimum lease payments -payable not later than 1 year 993 917 -payable after 1 year but not later than 5 years 3,263 3,643 -payable after 5 years 502 584
4,758 5,144
37 BASIC AND DILUTED EARNINGS PER SHARE (EPS) AT FACE VALUE OF `1
2017-18 2016-17 Profit after tax (` in Mn) 11,120 9,707 Weighted average number of shares outstanding 171,250,145 170,112,899 Basic EPS (`) 64.93 57.08 Weighted average number of shares outstanding 171,250,145 170,112,899 Add : weighted average number of potential equity shares on account of employee stock options 3,927,388 3,879,583 Weighted average number of shares outstanding 175,177,533 173,992,482 Diluted EPS (`) 63.48 55.80
38 AMALGAMATION OF SUBSIDIARY
AugmentIQ Data Sciences Private Limited (‘AugmentIQ’) and the Company on 23 June 2017 had filed, an application with Hon’ble National Company Law Tribunal, Mumbai Bench (NCLT), for sanctioning the Scheme of Amalgamation of AugmentIQ with the Company under section 230 – 232 of the Companies Act, 2013 and the rules made thereunder. NCLT had admitted the application and ordered a meeting of shareholders of AugmentIQ and the Company on 23 August 2017 and 24 August 2017, respectively. The Shareholders of AugmentIQ and the Company, respectively had approved the Scheme of Amalgamation. Subsequently, AugmentIQ and the Company had filed a Petition with NCLT on 07 September 2017. The Scheme was sanctioned by the NCLT vide its order dated 02 May 2018. The Scheme was filed with the Registrar of Companies on 21 May 2018 and came into effect on that day with appointed date being April 01, 2017.
39 ACQUISITION
The Company acquired Syncordis S.A, Luxembourg, along-with its fully owned subsidiaries Syncordis SARL, France, Syncordis Ltd. UK, Syncordis PSF S.A , on 15 December 2017 and paid an enterprise value of Euro 14.62 million on acquisition for 100% of shares. In addition, Euro 13.50 million may be payable over a period of 4-5 years, which is contingent on performance. Consolidated revenue of Syncordis S.A. for Calendar year 2016 was at Euro 12.04 Million.
On 11 December 2017, the company acquired Syncordis Software Services India Private Limited, a wholly owned subsidiary of Syncordis S.A with an enterprise value of Euro 0.35 million, revenue of which was ` 30.22 million for 2016-17.
The Company has used cut-off date of 30 November 2017 as the acquisition date for convenience, since the transactions from 1 December 2017 till the dates of acquisition of respective entities were not material.
The financial results for the year ended 31 March 2018 include revenue of ` 459 million and profit after tax of ` 51 million pertaining to this acquisition. Trade receivables on this acquisition of ` 318 million where fully collected as at 31 March 2018.
Notes forming part of Consolidated accounts

17Statutory Reports
72Financial Statements
01Corporate Overview
165
The purchase price allocation as per Ind AS 103 Business Combination has resulted into recognition of following assets and liabilities:
(` in Mn)
Syncordis S.A, Luxembourg,
Syncordis Software Services India Private
Limited (India)
Total
Present value of consideration (A) 1,999 27 2,026 Non-current assets:Customer contracts 181 - 181 Other non-current assets 11 3 14
- Current assets: - Trade receivables 318 4 321 Cash and bank balancesw 276 6 282 Short term loans - 1 1 Other current financial assets - - - Other current assets 127 0 127 Total Assets 913 14 927
Non-current Liabilities:Deferred Tax Liabilities (63) - (63)Current Liabilities:Trade payables (132) (2) (134)Other current financial liabilities - - - Other current liabilities (457) - (457)Provisions (4) - (4)Total Liabilities (655) (2) (656)Net Assets acquired (B) 259 12 270 Goodwill on consolidation (A)-(B) 1,740 15 1,755
Initial recognition of goodwill on business combination is not deductible for tax purposes.
40 RELATED PARTY DISCLOSURE:
(I) Key Management Personnel:
Name Status Mr. Sanjay Jalona Chief Executive Officer & Managing Director Mr. Aftab Zaid Ullah Chief Operating Officer & Whole time Director Mr. Sudhir Chaturvedi President – Sales & Whole time Director Mr. Ashok Kumar Sonthalia Chief Financial Officer
Notes forming part of Consolidated accounts

Annual Report 2017-18166
(II) List of related parties with whom there were transactions during the year:
Name RelationshipLarsen & Toubro Limited Holding CompanyL&T Hydrocarbon Engineering Limited Fellow SubsidiaryLarsen & Toubro (East Asia) SDN.BHD Fellow SubsidiaryL&T Electrical and Automation Saudi Arabia Company Limited LLC Fellow SubsidiaryLarsen and Toubro ATCO Saudia LLC Fellow SubsidiaryL&T Finance Limited Fellow SubsidiaryL&T Infrastructure Finance Company Limited Fellow SubsidiaryL&T Metro Rail (Hyderabad) Limited Fellow SubsidiaryL&T Technology Services Limited Fellow SubsidiaryL&T Valves Limited Fellow SubsidiaryL&T Investment Management Limited Fellow SubsidiaryL&T Construction Equipment Limited Fellow SubsidiaryLarsen & Tourbro LLC Fellow SubsidiaryNabha Power Limited Fellow SubsidiaryL&T Electrical & Automation FZE Fellow SubsidiaryL&T Thales Technology Services Private Limited Fellow SubsidiaryL&T Housing Finance Limited Fellow SubsidiaryL&T Technology Services LLC Fellow SubsidiaryLarsen Toubro Arabia LLC Fellow SubsidiaryL&T SAUDIARABIA LLC Fellow SubsidiaryL&T Infrastructure Development Projects Limited Joint venture of Holding CompanyL&T MHPS Boilers Private Limited Joint venture of Holding CompanyL&T Deccan Tollways Limited Joint venture of Holding CompanyL&T Sambalpur - Rourkela Tollway Limited Joint venture of Holding Company
Balances and transactions between the Company and its subsidiaries, which are related parties of the Company, have been eliminated on consolidation and are not disclosed in this note. Details of transactions between the Group and other related parties are disclosed below.
(` in Mn) Transaction Holding company
2017-18 2016-17Sale of services / products 1180 1,279Sale of assets 4 1Purchases of services / products 99 161Overheads charged by 543 557Overheads charged to 70 223Trademark fees paid 191 167Trade receivable 185 82Interim dividend 1150 985Contributions to PF 265 271Final dividend paid 1394 419
(` in Mn) Transaction Joint venture of Holding Company
2017-18 2016-17Sale of services / products 17 11 - L&T Infrastructure Development Projects Limited 10 7 - L&T MHPS Boilers Private Limited - 2 - L&T Deccan Tollways Limited 3 - - L&T Sambalpur - Rourkela Tollway Limited 4 -
Notes forming part of Consolidated accounts

17Statutory Reports
72Financial Statements
01Corporate Overview
167
(` in Mn) Transaction Fellow subsidiaries
2017-18 2016-17Sale of services / products 549 377 - L&T Technology Services Limited 252 125 - L&T Hydrocarbon Engineering Limited 87 69 - L&T Thales Technology Services Private Limited 68 101Sale of assets 1 8 L&T Technology Services Limited 1 7Purchases of services / products 649 553 - L&T Technology Services Limited 644 552Overheads charged by 62 49 - Larsen & Toubro East Asia 50 23 - L&T Technology Services Limited 11 23Overheads charged to 225 293 - L&T Technology Services Limited 205 282Trade receivable 95 89Trade payable 32 167
(V) Outstanding material balances with related parties*
(` in Mn) Transaction Nature Amount (Payable) / Receivable
2017-18 2016-17L&T Metro Rail (Hyderabad) Limited Trade receivable 4 21L&T Thales Technology Services Private Limited Trade receivable 23 15Larsen & Toubro LLC Trade receivable 16 - L & T Hydrocarbon Engineering Limited Trade receivable 21 - L&T Technology Services Limited Trade (payable)/receivable (26) (148)
* All balances are unsecured and to be settled in cash.
Entities listed above account for 10% or more of the aggregate for that category of transaction during respective period.
(VI) Managerial remuneration
(` in Mn) 2017-18 2016-17
(i) Short term employee benefits 176 169(ii) Contribution to funds 13 10(iii) Share based payments (on options granted) - 286
(` in Mn) 2017-18 2016-17
Mr. Sanjay Jalona 86 214Mr. Aftab Zaid Ullah 29 97Mr. Sudhir Chaturvedi 63 123
41 SEGMENT REPORTING
Segments have been identified in accordance with Indian Accounting Standards (“Ind AS”) 108 on Operating Segments, considering the risk or return profiles of the business. As required under Ind AS 108, the Chief Operating Decision Maker (CODM) evaluates the performance and allocates resources based on analysis of various performance indicators. Accordingly, information has been presented for the Company’s operating segments.
Reportable segments have been changed during the year ended 31 March 2018 to align with the Industry vertical of customers. The Company has identified segments as Banking, Financial Services & Insurance (BFSI), Manufacturing (MFG), Energy & Utilities (E&U), High–Tech, Media & Entertainment (HIME) and CPG, Retail, Pharma & Others (CRP & Others). The Company has presented its segment results accordingly. The reportable segment information for the corresponding previous year has been restated to reflect the above changes to facilitate comparability.
Notes forming part of Consolidated accounts

Annual Report 2017-18168
I) The revenue and operating profit by segment is as under: (` in Mn)
2017-18 2016-17Segment revenueBanking, Financial Services & Insurance 34,515 30,711Manufacturing 12,269 11,891Energy & Utilities 8,556 7,214High-Tech, Media & Entertainment 7,823 6,927CPG, Retail, Pharma & Others 9,902 8,266Revenue from operations 73,065 65,009Segment resultsBanking, Financial Services & Insurance 7,332 7,417Manufacturing 1,630 2,102Energy & Utilities 1,405 1,002High-Tech, Media & Entertainment 1,065 1,212CPG, Retail, Pharma & Others 1,334 1,057Segment results 12,766 12,790Unallocable expenses (net)* 885 488Other Income 4,259 1,867Finance costs 158 31Depreciation & amortisation expense 1,563 1,780Profit before tax 14,418 12,358
* Customer settlement expenses are in relation to one time commercial settlement entered by the Company with one of its clients on 27 March 2018.
II) Segmental reporting of revenues on the basis of the geographical location of the customers and is as under: (` in Mn)
Geography Revenue from operations2017-18 2016-17
North America 49,691 44,760Europe 13,128 11,861India 5,326 4,356APAC 1,850 1,560ROW 3,070 2,472Total 73,065 65,009
42 Events occurring after the reporting period:
The Board of Directors at its meeting held on 23 May 2018, has declared final dividend of ` 13.50 per equity share (Face value ` 1) for the financial year ended 31 March 2018
43 The Group is not required to transfer any amount to Investor Education and Protection Fund.
44 Previous year’s figures have been regrouped/reclassified wherever applicable to facilitate comparability.
45 The financial statements were approved by the Board of Directors on 23 May 2018.
Notes forming part of Consolidated accounts
As per our report attached
B. K. Khare & Co Sanjay Jalona Aftab Zaid UllahChartered Accountants Chief Executive Officer & Managing Director Chief Operating Officer & Whole Time DirectorFirm's Registration No. 105102W DIN : 07256786 DIN : 05165334
Ravi Kapoor Ashok Kumar Sonthalia Manoj KoulPartner Chief Financial Officer Company Secretary & Compliance OfficerMembership No: 040404
MumbaiMay 23, 2018

www.Lnt infotech.com
Let’s Solve