A Search for Submillimeter Polarization by Rayleigh Scattering

ALMA Observations of Polarization from Dust Scattering in the IM Lup Protoplanetary Disk
Chat HullNAOJ Fellow —
National Astronomical Observatory of JapanNAOJ Chile ObservatoryJoint ALMA Observatory
IAU General AssemblyVienna, Austria
27-31 Aug 2018
Photo credit: C. Hull
Many thanks to my collaborators: Meredith Hughes • David Wilner • Sean Andrews • Xuening Bai • Haifeng Yang • Zhi-Yun Li • Lesley Looney • Ian Stephens • Akimasa Kataoka • Ilse Cleeves • Laura Pérez
Chat Hull – IAU General Assembly, Vienna – 27-31 Aug 2018
Polarization from mm-wave scattering
2
Comparison of model & data
grain density distribution is assumed to be
r rw h
zh
exp12
12
exp12
, 2d 0d
d
2
g g
2
( )rp
= S --
-⎡⎣⎢⎢
⎛⎝⎜
⎞⎠⎟
⎤⎦⎥⎥
⎡⎣⎢⎢
⎛⎝⎜
⎞⎠⎟
⎤⎦⎥⎥
where r is the orbital radius. The mass of the central star istaken to be M1.9 :. The adopted values are 0.6 g cm0
2S = - ,r 173d = AU, w 27d = AU, and h r19.8 AU 173 AUg
1.5( )= ,which corresponds to the isothermal disk of 36 K. The dustmass of the disk is M5.0 10 3´ -
:. We confirm that the resultsin the case of a power-law temperature distribution do not showany significant difference from the constant temperatureadopted here (see Appendix B for more details).
These choices of parameters are motivated by recent resultsof the modeling of HD 142527 (Muto et al.), although we usedifferent dust models. In addition, the dust density is assumedto be zero if R 70< AU or if R 300> AU. We assume thatthe target is at 140 pc and thus 1 arcsec = 140 AU. Notethat the optical depth at the peak is 0 abst k= S ´ =0.6 g cm 0.51 cm g 0.312 2 1´ =- - . Thus, this object is opti-cally thin.
Figure 7 shows the intensity, the polarized intensity, and thepolarization degree overlaid with polarization vectors. Thepolarization degree has a double-ring structure. The polariza-tion vectors are orientated to totally opposite directions in thetwo rings. The vectors in the outer polarization ring are in theazimuthal direction. This is because the background thermalemission has a strong radial gradient at the location of the outer
polarized ring. This corresponds to point B in Figure 6. Bycontrast, the vectors are in the radial direction in the innerpolarization ring. This is due to the net flux from the azimuthaldirection being larger than the net flux in the radial direction.This corresponds to point A in Figure 6. This double-ringpattern is a unique feature of the polarization due to dustscattering, and thus this will be a clue to distinguish thepolarization mechanism.
3.2. Polarization from Lopsided Protoplanetary Disks
We now calculate the expected polarization from a lopsideddisk. To mimic the lopsided disk structure observed withALMA (e.g., Fukagawa et al. 2013), we further add anazimuthally Gaussian distribution (e.g., Pérez et al. 2014) asfollows:
h
zh
r rw
exp12
12
exp12
exp12
. 3
d maxd
d
2
min
g g
2d
d
2
( )
( )
rq q
f
p
= S --
+ S
´ - --
⎛
⎝⎜⎜
⎡⎣⎢⎢
⎛⎝⎜⎜
⎞⎠⎟⎟
⎤⎦⎥⎥
⎞
⎠⎟⎟
⎡⎣⎢⎢
⎛⎝⎜
⎞⎠⎟
⎤⎦⎥⎥
⎡⎣⎢⎢
⎛⎝⎜
⎞⎠⎟
⎤⎦⎥⎥
Since the broad range of azimuthal contrast of dustcontinuum emission has been reported so far (1.5 forSAO206462, Pérez et al. 2014; 24 for HD 142527, Fukagawaet al. 2013; 130 for IRS 48, van der Marel et al. 2013), weconsider two cases: model A for low azimuthal contrast andmodel B for high azimuthal contrast. In model A, we use the
Figure 7. Same as Figure 5, but for the case of the ring-shaped protoplanetary disk.
Figure 8. Same as Figure 5, but for model A in the case of the lopsided protoplanetary disk. The object is optically thin everywhere.
5
The Astrophysical Journal, 809:78 (15pp), 2015 August 10 Kataoka et al.
Kataoka et al. 2015,ApJ, 809, 78
polarization
3
100 AU
Figure 1. In the left panel, the color scale represents the polarized intensity in units of mJy beam�1
with a log scale,
the gray contours the continuum emission, and the white vectors show the polarization vectors. Note that the lengths of the
polarization vectors are set to be the same. The levels of the contours are (3, 10, 30, 100, 300, 600, 900, 1200, 1500, 1800) ⇥�I(= 185 µJy beam
�1) for Stokes I. Polarization vectors are plotted where the polarized intensity is larger than 3�PI =
0.128 mJy beam�1
. In the right panel, the color scale displays the polarization fraction overlaid with the polarization vec-
tors. The gray contours display the continuum emission with the same levels of the left panel. The color scale is only shown
with the same threshold of the polarization vectors in the left panel.
distribution with azimuthal asymmetry, for which thesubstructure is di↵erent from the continuum and alsoshows two regions with azimuthal polarization. Al-though the continuum emission has a peak at the north-east region, the polarized intensity has a peak on theeast side. The peak emission of the polarized emissionis 5.22 mJy beam�1. The ring of the polarized intensityis located slightly inside of the ring center of the contin-uum. The maps of each Stokes component is shown inFig. 2.The polarization vectors on the main ring of the polar-
ized emission have a radial direction everywhere. How-ever, the polarization vectors are rotated by 90� in tworegions. The northeast region is ⇠ 1.300 from the startoward the position angle of ⇠ 42� while the northwestone is ⇠ 1.400 from the star toward the position angle of⇠ �60�. The two regions are clearly seen in Fig. 2 as aflip of the sign of Stokes Q or U from inside to outside.Furthermore, the polarized intensity is relatively
bright in the southwest direction, where Stokes I is thefaintest. This causes high polarization fraction in thesouth region. The right panel of Fig. 1 shows the po-larization fraction overlaid with the polarization vectorswith the continuum as solid contours. The polarizationfraction is 3.26 ± 0.02 % at the peak of the polarizedintensity and as low as 0.220 ± 0.010 % at the peak ofthe continuum. The polarization fraction has a peak atthe south-west region with a fraction of 13.9 ± 0.6 %,which corresponds to around the local minimum of theintensity of the main ring.Here we note that the polarization maps at low signal-
to-noise ratio regions could be a↵ected by the positivepolarization bias (Vaillancourt 2006). The discussion in
this paper is concerning at the regions where the detec-tion is larger than 5 �PI and thus the positive polariza-tion bias does not a↵ect the results.
4. DISCUSSIONS
We have detected spatially resolved polarized contin-uum emission from the disk around HD 142527. Thereare three distinct observational signatures - (1) di↵er-ence of the locations of the brightest emission betweenStokes I and PI, (2) 90� flip of the polarization vec-tors in the northeast and northwest region, and (3) thehigh fraction of polarization (13.9± 0.6%) in the south-west region. Two possible mechanisms to produce po-larized emission in protoplanetary disks are suggestedto date: grain alignment by the magnetic field or dustself-scattering. In this section, we qualitatively discusswhich mechanism is more likely to take place in the diskaround HD 142527.
4.1. Grain alignment
Here we discuss the possibility that the polarizationis due to the grain alignment with magnetic fields. Themagnetic field direction is rotated by 90� from the polar-ization vectors in the thermal emission regime. There-fore, the morphology of the main polarization ring indi-cates the presence of toroidal magnetic fields, which isconsistent with the common understanding of the mag-netic field in disks (e.g., Brandenburg et al. 1995; Stoneet al. 1996).The di↵erence between the peak position of the po-
larized intensity and the peak of the continuum couldbe explained with the depolarization due to the highoptical depth at the peak of the continuum (e.g., Alveset al. 2014). We will also discuss the e↵ects of the opti-
Kataoka et al. 2016b, ApJL, 831, 12
HD 142527 E-field polarization,
not inferred magnetic fields• High optical depth at high resolution could lead to polarization from self-scattering by large dust grains
• Submillimeter polarization from Class II disks appears to be cause by dust scattering
• This could allow us to study the grain properties in the regions where planets will eventually form

Chat Hull – IAU General Assembly, Vienna – 27-31 Aug 2018 3
Yang et al. 2016a, MNRAS, 456, 2794
ALMA 870 µm IM Lup polarization
20 30 40 50 60 70 80
Polarization angle (deg)
0
2
4
6
8
10
12
No.
ofpol
.or
ient
atio
ns
IM Lup
Spread in polarization angles
Polarization is not perfectly along the minor axis.
• This could indicate a small contribution from radiatively aligned grains (Tazaki et al. 2017, ApJ, 839, 56)
• However, this is still consistent with models of pure scattering
Model of scattering from an inclined disk
• In an inclined disk, scattering should be predominantly along the minor axis of the disk
870 µm (ALMA Band 7)
200 AU
1%
IM Lup
Hull+2018, ApJ, 860, 82
Hull+2018, ApJ, 860, 82
IM Lup

Chat Hull – IAU General Assembly, Vienna – 27-31 Aug 2018 4
2
(Cox et al. 2015), the Herbig AE late-stage protoplane-tary disk HD 142527 (Kataoka et al. 2016), and the diskcandidate of the high-mass protostar Cepheus A HW2(Fernandez-Lopez et al. 2016). Polarization toward diskshave also been detected at mid-infrared wavelengths of8.7, 10.3, and 12.5µm (Li et al. 2016, 2017). However,polarized emission at mid-infrared wavelengths can occurdue to absorption, emission, and sometimes scattering,causing di�culty in interpreting the polarization mor-phology.Despite these detections, the polarization morpholo-
gies usually were not consistent with what would be ex-pected from magnetically aligned dust grains. In par-ticular, Stephens et al. (2014) used the Combined Arrayfor Research in Millimeter-wave Astronomy (CARMA)to measure the 1.25 mm polarization morphology inHL Tau. The morphology was inconsistent with grainsaligned with the commonly-expected toroidal magneticfields (polarization/E-field vectors distributed radially inthe disk). Instead, the E-vectors were oriented moreor less along the minor axis of the disk. Kataoka etal. (2015, 2016) and Yang et al. (2016) suggested thatthe polarization morphology is actually consistent withthat expected from self-scattering (also see Pohl et al.2016; Yang et al. 2017). Indeed, several disks where po-larization is detected show consistency with the polar-ization morphology expected from self-scattering ratherthan grains aligned with the magnetic field. However, ex-cept for the ALMA observations of HD 142527 (Kataokaet al. 2016) and HL Tau (Kataoka et al. 2017), the pub-lished observations are too coarse to resolve more thana few independent beams across the disk, making it dif-ficult to distinguish between scattering and other polar-ization mechanisms.The high-resolution ALMA observations of HD 142527
by Kataoka et al. (2016) resolved polarization for many10s of independent resolution elements across the disk.The polarization was radial throughout most of the disk,which is expected for grains aligned with a toroidal field,but toward the edges the morphology changed from ra-dial to azimuthal, which is more consistent with scatter-ing. Models in Kataoka et al. (2016) found that scatter-ing can broadly reproduce the features observed in partsof the disk – especially where the polarization orienta-tions change sharply – but not everywhere. A completeunderstanding of this interesting case is still missing.HL Tau is one of the brightest Class I/II disks in the
sky at (sub)millimeter wavelengths, and thus the polar-ization morphology can be determined at high resolutionwith reasonable integration times. Kataoka et al. (2017)followed up on the Stephens et al. (2014) observationswith 3.1mm observations of HL Tau. Surprisingly, theyfound that the polarization morphology was azimuthal,which suggests grains aligned with their long axes per-pendicular to the radiation field, as predicted by Tazakiet al. (2017) (also see Lazarian & Hoang 2007). Hence-forth, we will call this grain alignment mechanism “align-ment with the radiation anisotropy.”The very di↵erent polarization morphologies observed
at 1.25mm with CARMA (0.006 resolution, Stephens et al.2014) and 3.1mm with ALMA (0.004 resolution, Kataokaet al. 2017) suggest that the morphology of the po-larization emission is strongly dependent on the wave-length. The CARMA observations poorly constrained
Figure 1. ALMA polarimetric observations at 3.1mm (top,Kataoka et al. 2017), 1.3mm (middle), and 870µm (bottom),where the red vectors show the >3� polarization morphology (i.e.,vectors have not been rotated). Vector lengths are linearly propor-tional to P . The color scale shows the polarized intensity, whichis masked to only show 3� detections. Stokes I contours in eachpanel are shown for [3, 10, 25, 50, 100, 200, 325, 500, 750, 1000]⇥�I ,where �I is 44, 154, and 460µJy bm�1 for 3.1mm, 1.3mm, and870µm, respectively.
the 1.25mm polarization morphology since they only re-
HL Tau
200 AU
1%
IM Lup
�200 �150 �100 �50 0 50 100 150 200
Position along major axis (au)
0.002
0.004
0.006
0.008
0.010
0.012
Pol
ariz
atio
nfr
action
IM Lup
HL Tau
Major axisIM Lup
�200 �150 �100 �50 0 50 100 150 200
(Projected) position along minor axis (au)
0.002
0.004
0.006
0.008
0.010
0.012
Pol
ariz
atio
nfr
action
IM Lup
HL TauMinor axis
Position along axis (au)
Hull+2018, ApJ, 860, 82
Polarization fraction cuts along major/minor axes
IM Lup has a higher polarization fraction than HL Tau
• This be due to enhanced grain growth in the more evolved IM Lup disk
• Or it could be due to the higher optical depth in HL Tau
Stephens et al. 2017b, ApJ, 851, 55
Chat Hull – IAU General Assembly, Vienna – 27-31 Aug 2018
200 AU1%
IM Lup
5
�200 �150 �100 �50 0 50 100 150 200
Position along major axis (au)
0.004
0.006
0.008
0.010
0.012
0.014
Pol
ariz
atio
nfr
action
amax = 50 µm
amax = 61 µm
amax = 70 µm
�200 �150 �100 �50 0 50 100 150 200
(Projected) position along minor axis (au)
0.002
0.004
0.006
0.008
0.010
0.012
0.014
Pol
ariz
atio
nfr
action
amax = 50 µm
amax = 61 µm
amax = 70 µm
�200�150�100 �50 0 50 100 150 200
Distance (au)
�200
�150
�100
�50
0
50
100
150
200
Dis
tance
(au)
1%
IM Lup model
0.2
0.4
0.6
0.8
1.0
1.2
Pol
ariz
edflux
den
sity
(mJy
bea
m�
1)
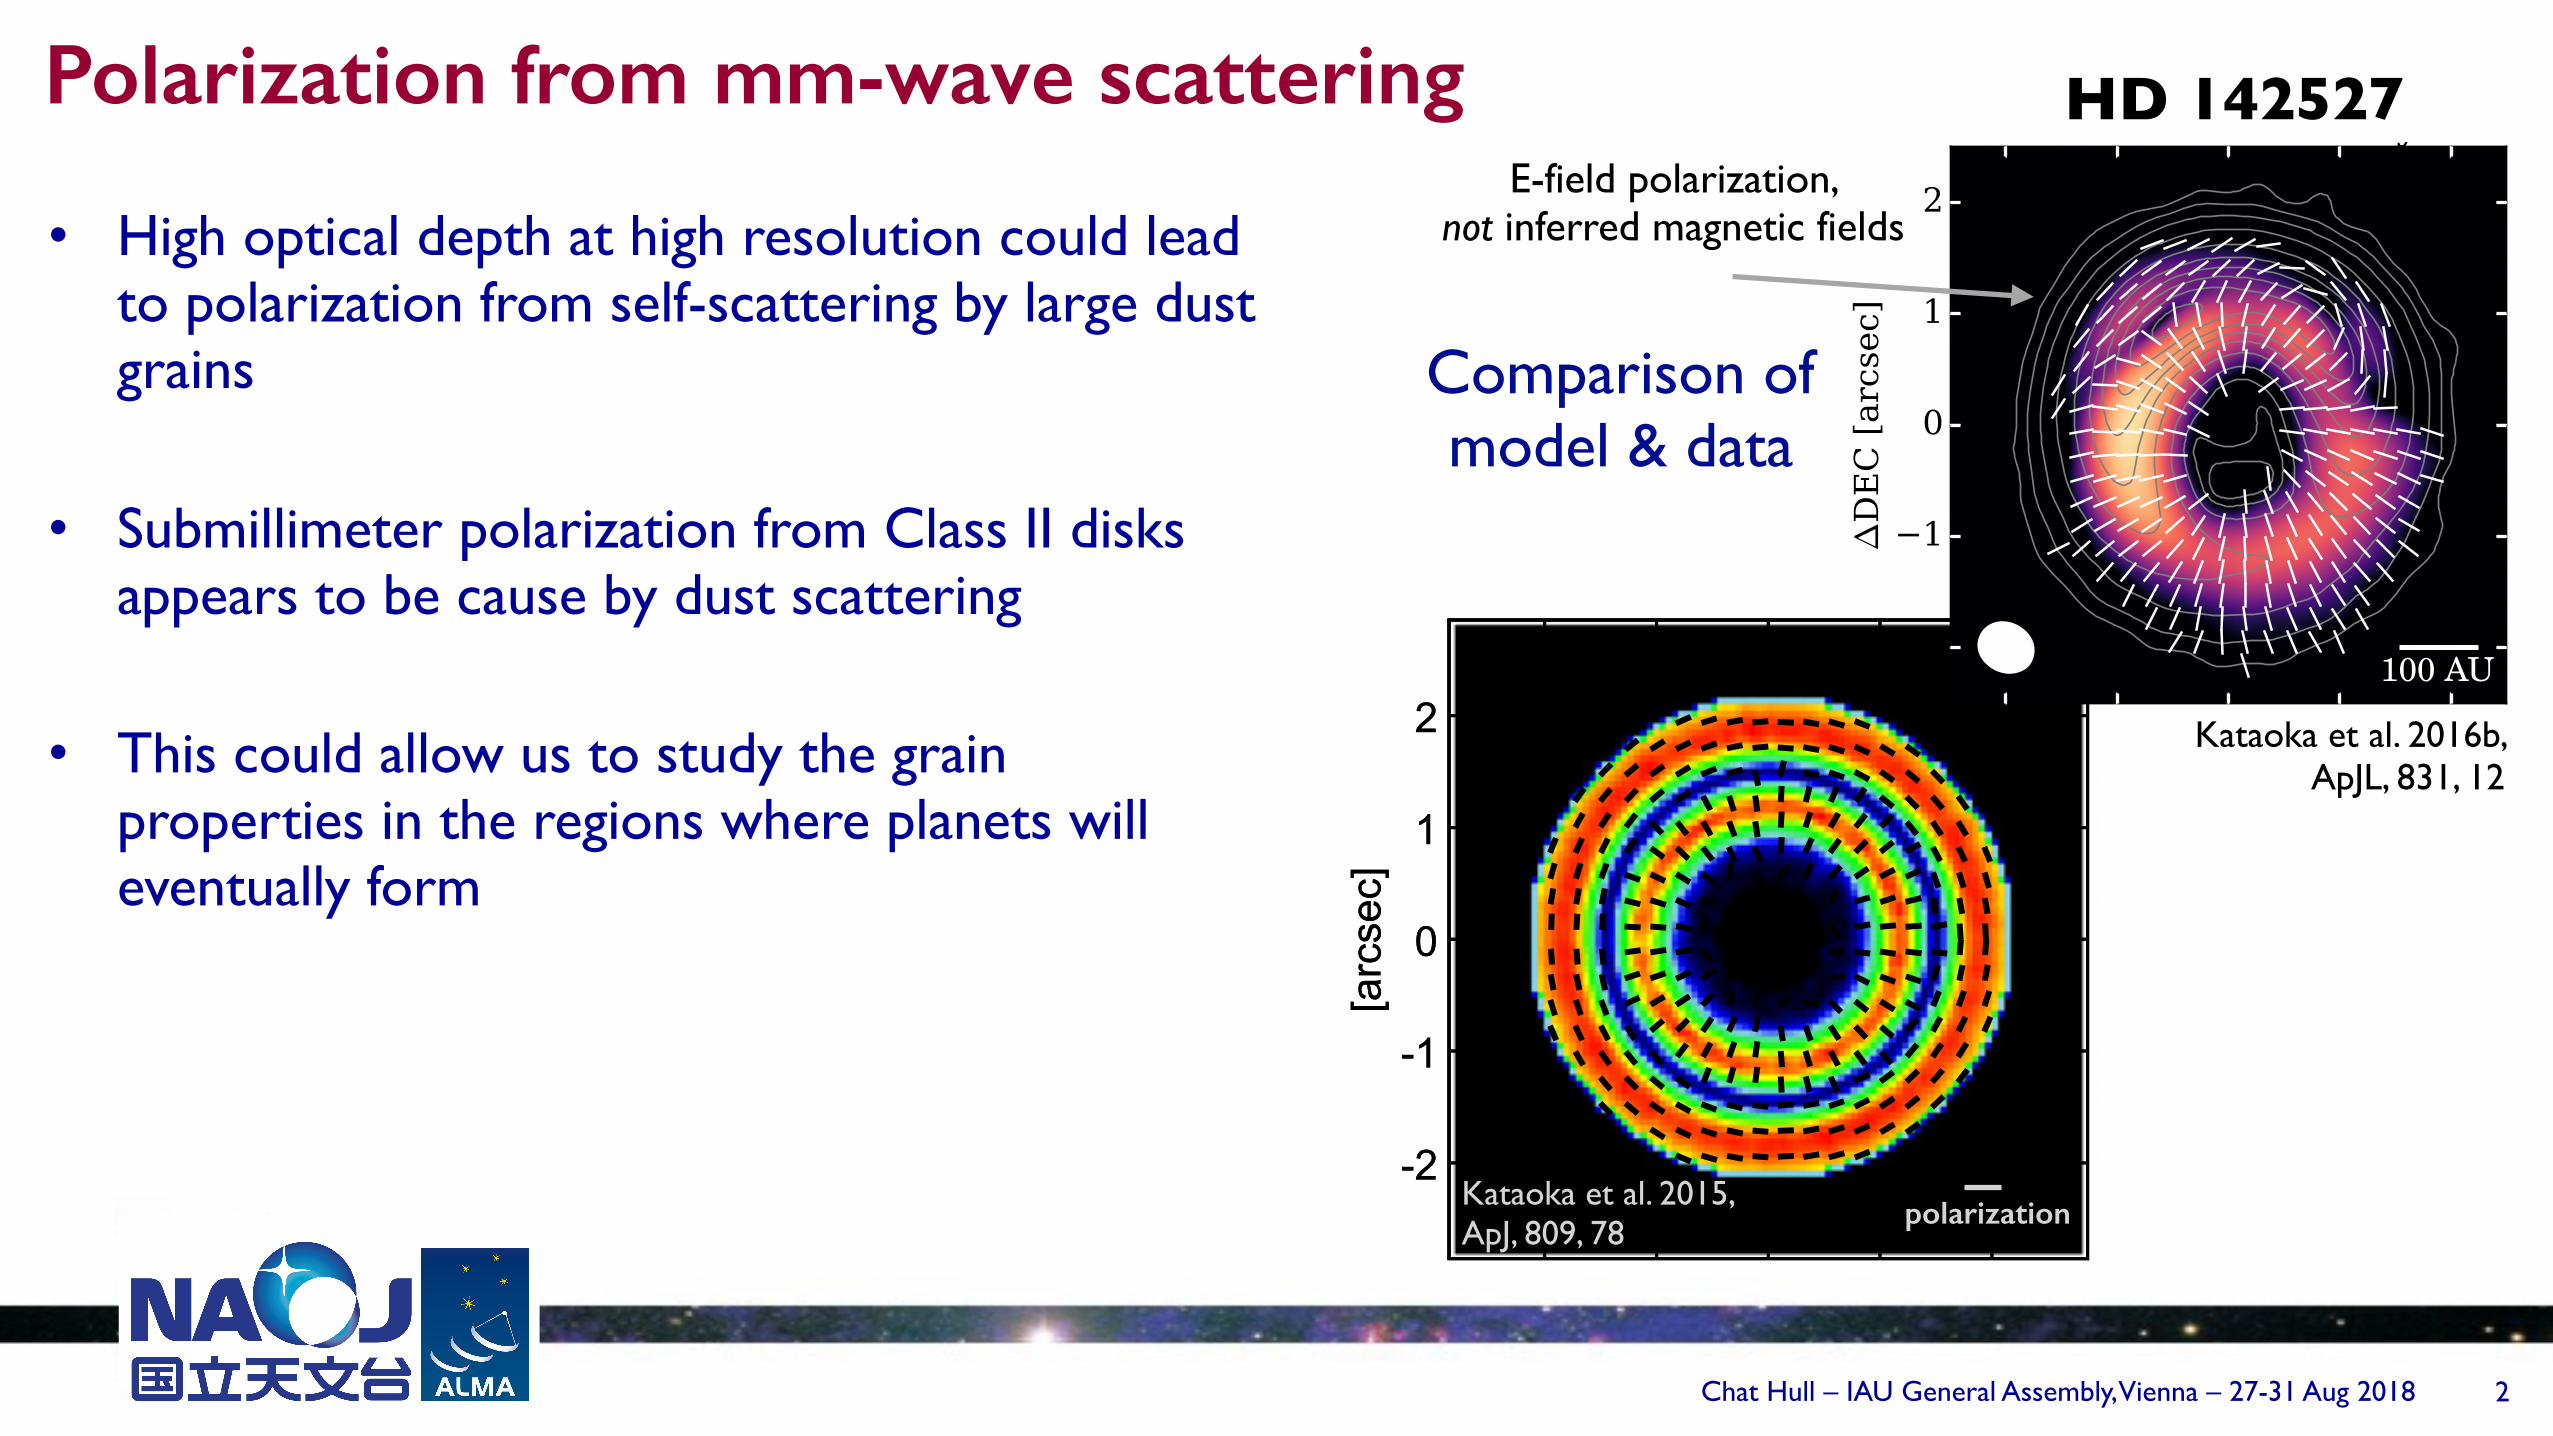
Pfrac profilesExtremely sensitive to grain size!
Hull+2018, ApJ, 860, 82
Synthetic observation70 μm
61 μm
50 μm
ALMA observation
• Models find similar maximum grain sizes for HL Tau (72 μm) and IM Lup (61 μm) • This reveals continued tension with models of the dust emission spectrum, which
find that the bulk of the (unpolarized) emission in disks is from millimeter (or even centimeter) sized grains (e.g., Pérez et al. 2012, ApJL, 760, 17).
Best-fit models to IM Lup