Air Travelers in America Findings of a Survey Conducted...
45
Air Travelers in America Findings of a Survey Conducted by Ipsos February 20, 2018 John P. Heimlich Vice President & Chief Economist Airlines for America Chris Jackson Vice President Ipsos Public Affairs
Transcript of Air Travelers in America Findings of a Survey Conducted...
Air Travelers in America
Findings of a Survey Conducted by Ipsos
February 20, 2018
John P. Heimlich
Vice President & Chief Economist
Airlines for America
Chris Jackson
Vice President
Ipsos Public Affairs
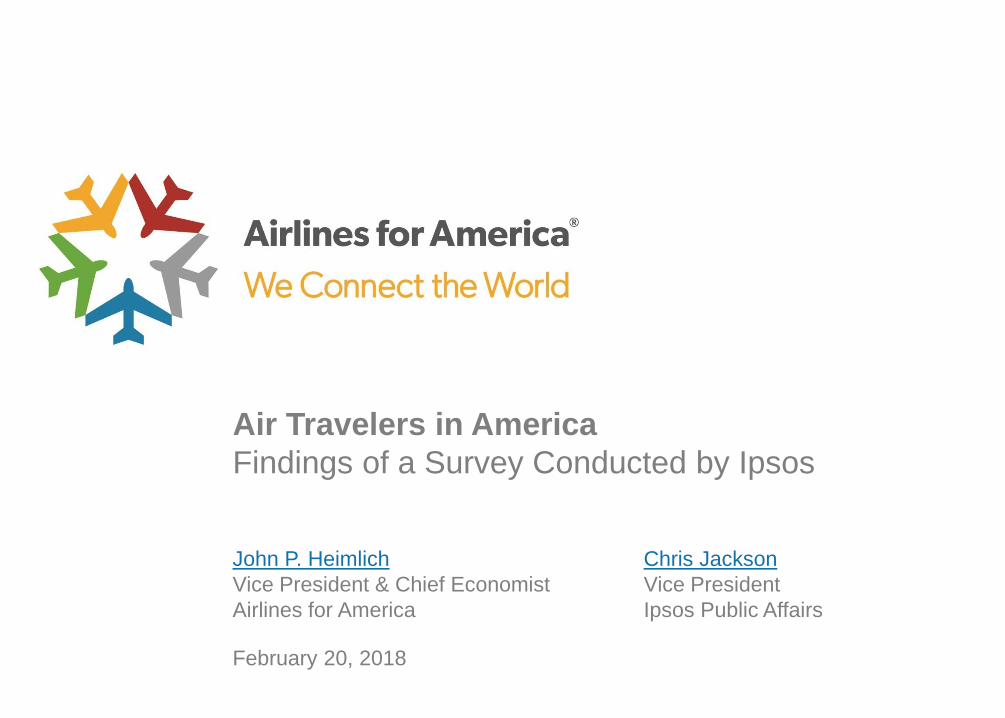
Ipsos Research Approach and Poll Accuracy
airlines.org
» A4A selected Ipsos Public Affairs (“Ipsos”), one of the top polling firms1 in the country, to conduct a poll2
January 8-17, 2018, on behalf of Airlines for America (A4A). For the survey, a sample of 5,046 adults age
18+ from the continental U.S., Alaska and Hawaii was interviewed online in English. The precision of Ipsos online polls is measured using a credibility interval. In this case, the poll has a credibility interval3 of ±1.6
percentage points for all respondents and ±2.3 percentage points for those who flew on an airline in 2017.
» The sample for this study was randomly drawn from Ipsos’s online panel,3 partner online panel sources,
and “river” sampling3 and does not rely on a population frame in the traditional sense. Ipsos uses fixed
sample targets, unique to each study, in drawing sample. After a sample has been obtained from the Ipsos
panel, Ipsos calibrates respondent characteristics to be representative of the U.S. population using
standard procedures such as raking-ratio adjustments. The source of these population targets is U.S.
Census 2016 American Community Survey data. The sample drawn for this study reflects fixed sample
targets on demographics. Post-hoc weights were made to the population characteristics on gender, age,
region, race/ethnicity and income.
» Statistical margins of error are not applicable to online polls. All sample surveys and polls may be subject to
other sources of error, including, but not limited to coverage error and measurement error. Where figures do
not sum to 100, this is due to the effects of rounding. Ipsos calculates a design effect (DEFF) for each study
based on the variation of the weights, following the formula of Kish (1965). This study had a credibility
interval adjusted for design effect of the following (n=5,046, DEFF=1.5, adjusted Confidence Interval=3.1).
2
Source: Ipsos survey of American adults (January 2018)
1. https://projects.fivethirtyeight.com/pollster-ratings/
2. https://www.ipsos.com/en-us/news-polls/airlines-america-air-travelers-america-2017
3. https://www.ipsos.com/en-us/public-opinion-polling-and-communication-research
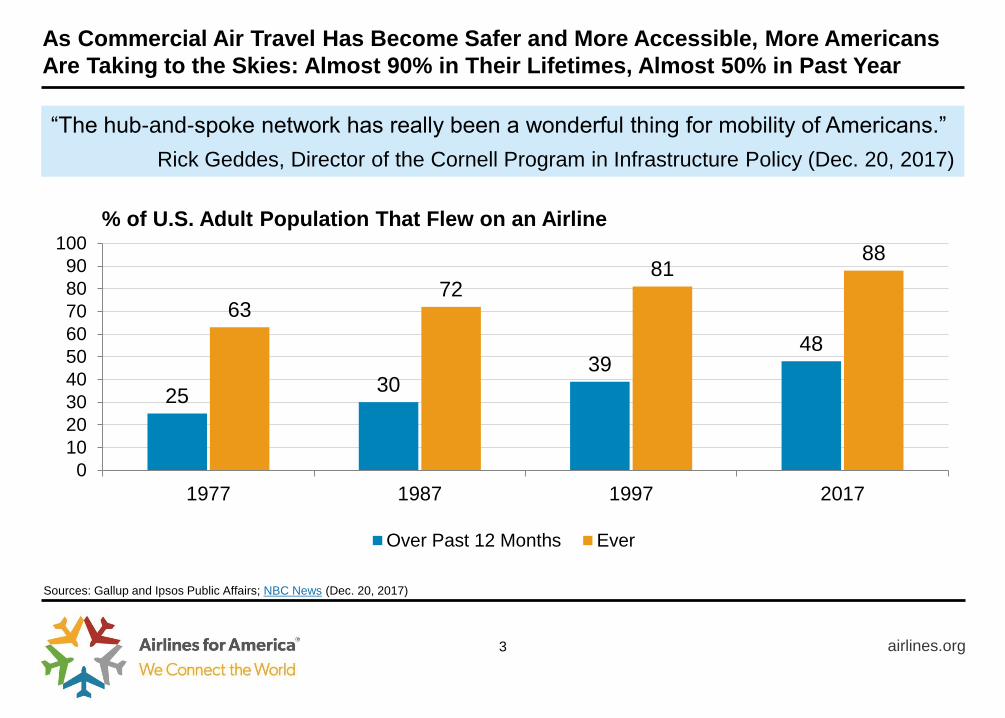
As Commercial Air Travel Has Become Safer and More Accessible, More Americans
Are Taking to the Skies: Almost 90% in Their Lifetimes, Almost 50% in Past Year
airlines.org
25 30
39 48
63 72
81 88
0
10
20
30
40
50
60
70
80
90
100
1977 1987 1997 2017
Over Past 12 Months Ever
% of U.S. Adult Population That Flew on an Airline
3
Sources: Gallup and Ipsos Public Affairs; NBC News (Dec. 20, 2017)
“The hub-and-spoke network has really been a wonderful thing for mobility of Americans.”
Rick Geddes, Director of the Cornell Program in Infrastructure Policy (Dec. 20, 2017)
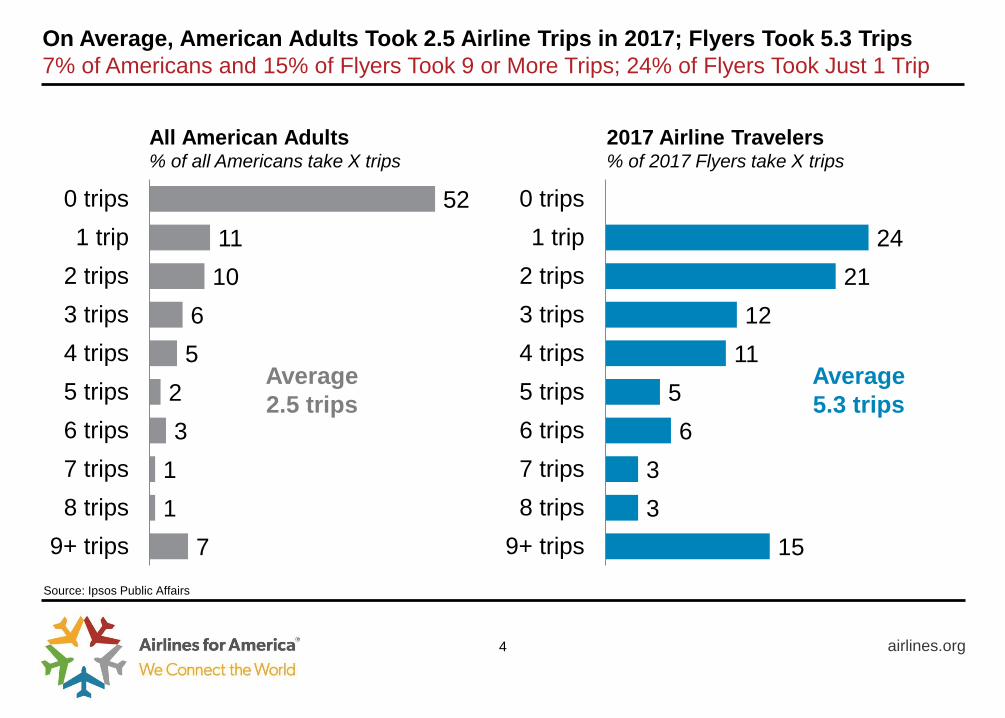
On Average, American Adults Took 2.5 Airline Trips in 2017; Flyers Took 5.3 Trips
7% of Americans and 15% of Flyers Took 9 or More Trips; 24% of Flyers Took Just 1 Trip
airlines.org
15
3
3
6
5
11
12
21
24
9+ trips
8 trips
7 trips
6 trips
5 trips
4 trips
3 trips
2 trips
1 trip
0 trips
2017 Airline Travelers % of 2017 Flyers take X trips
Average
5.3 trips
7
1
1
3
2
5
6
10
11
52
9+ trips
8 trips
7 trips
6 trips
5 trips
4 trips
3 trips
2 trips
1 trip
0 trips
All American Adults % of all Americans take X trips
Average
2.5 trips
4
Source: Ipsos Public Affairs

Americans of All Age Groups and All Household Income Levels – Except the Top
Earners – Took More Airline Trips in 2017 Than They Did in 2016
airlines.org
Airline Trips by Age Group
1.3
3.3
1.5
1.1
2.2 2.3
3.8
1.8
1.3
2.5
18-24 25-44 45-64 65+ All
2016 2017
5
Source: Ipsos survey of American adults (January 2018)
Airline Trips by Annual Household Income ($000)
0.6 0.8
1.6
3.4 3.0
5.6
2.2
1.0 0.9
1.7
5.1
3.2
5.4
2.5
<25 25-49 50-74 75-99 100-149 >150 Total
2016 2017

More Than Ever Before, Americans Are Traveling by Airline for Personal Reasons
airlines.org
29
71
0
10
20
30
40
50
60
70
80
90
100
1977
1979
1981
1983
1984
1985
1986
1987
1988
1989
1990
1991
1992
1993
1997
2015
2016
2017
Business Personal
% of Trips by Purpose
Source: Gallup and Ipsos Public Affairs
6
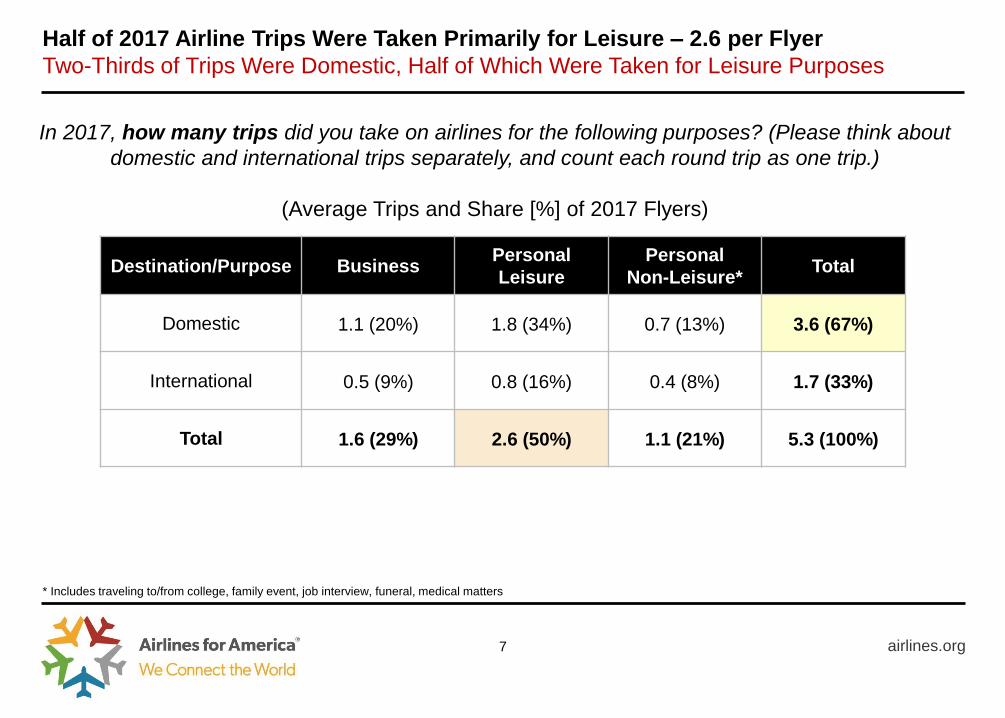
Half of 2017 Airline Trips Were Taken Primarily for Leisure – 2.6 per Flyer
Two-Thirds of Trips Were Domestic, Half of Which Were Taken for Leisure Purposes
airlines.org 7
Destination/Purpose Business Personal
Leisure
Personal
Non-Leisure* Total
Domestic 1.1 (20%) 1.8 (34%) 0.7 (13%) 3.6 (67%)
International 0.5 (9%) 0.8 (16%) 0.4 (8%) 1.7 (33%)
Total 1.6 (29%) 2.6 (50%) 1.1 (21%) 5.3 (100%)
In 2017, how many trips did you take on airlines for the following purposes? (Please think about
domestic and international trips separately, and count each round trip as one trip.)
(Average Trips and Share [%] of 2017 Flyers)
* Includes traveling to/from college, family event, job interview, funeral, medical matters
35%
44%
14%
5%
1%
43%
42%
10%
5%
1%
37%
44%
13%
4%
1%
Very satisfied
Somewhat satisfied
Neutral
Somewhat dissatisfied
Very dissatisfied
2015 2016 2017
airlines.org
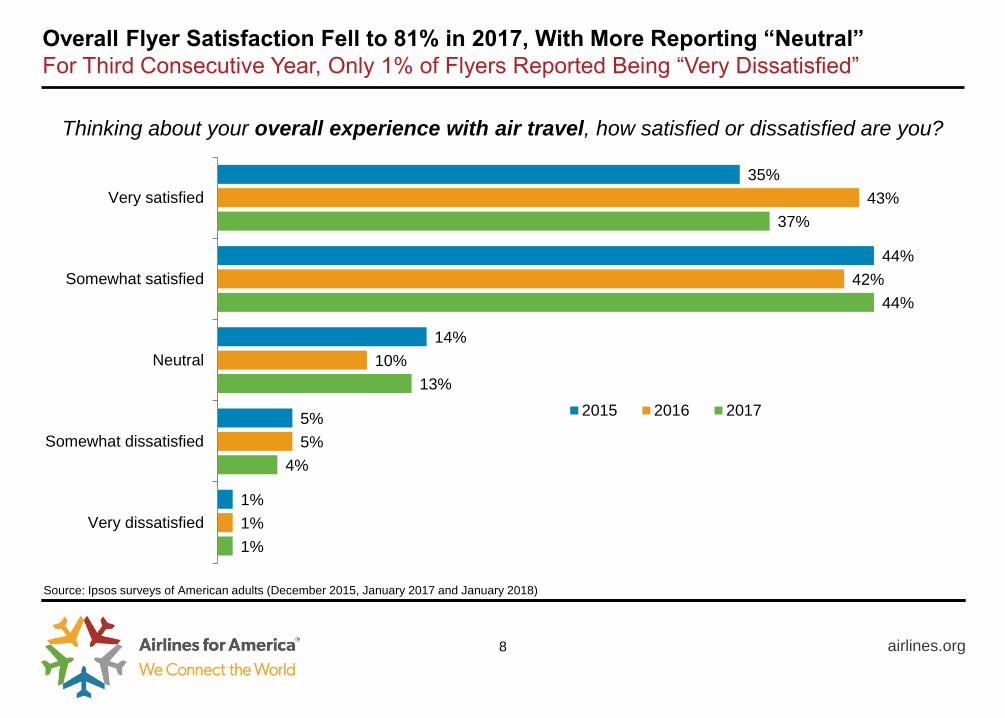
Overall Flyer Satisfaction Fell to 81% in 2017, With More Reporting “Neutral”
For Third Consecutive Year, Only 1% of Flyers Reported Being “Very Dissatisfied”
8
Source: Ipsos surveys of American adults (December 2015, January 2017 and January 2018)
Thinking about your overall experience with air travel, how satisfied or dissatisfied are you?
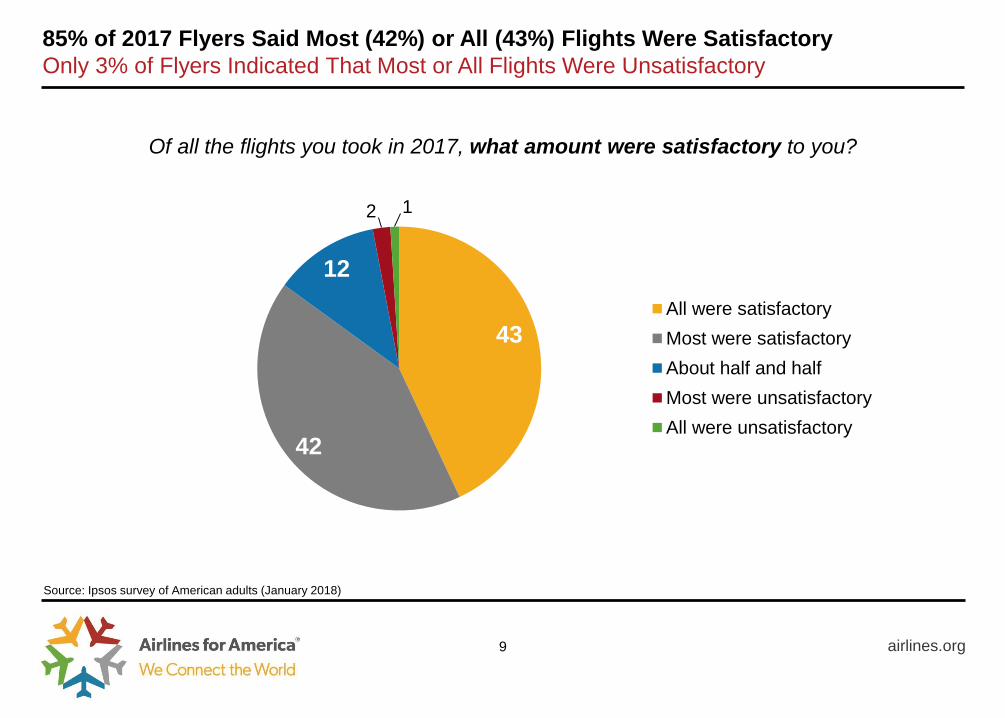
43
42
12
2 1
All were satisfactory
Most were satisfactory
About half and half
Most were unsatisfactory
All were unsatisfactory
85% of 2017 Flyers Said Most (42%) or All (43%) Flights Were Satisfactory
Only 3% of Flyers Indicated That Most or All Flights Were Unsatisfactory
airlines.org 9
Source: Ipsos survey of American adults (January 2018)
Of all the flights you took in 2017, what amount were satisfactory to you?
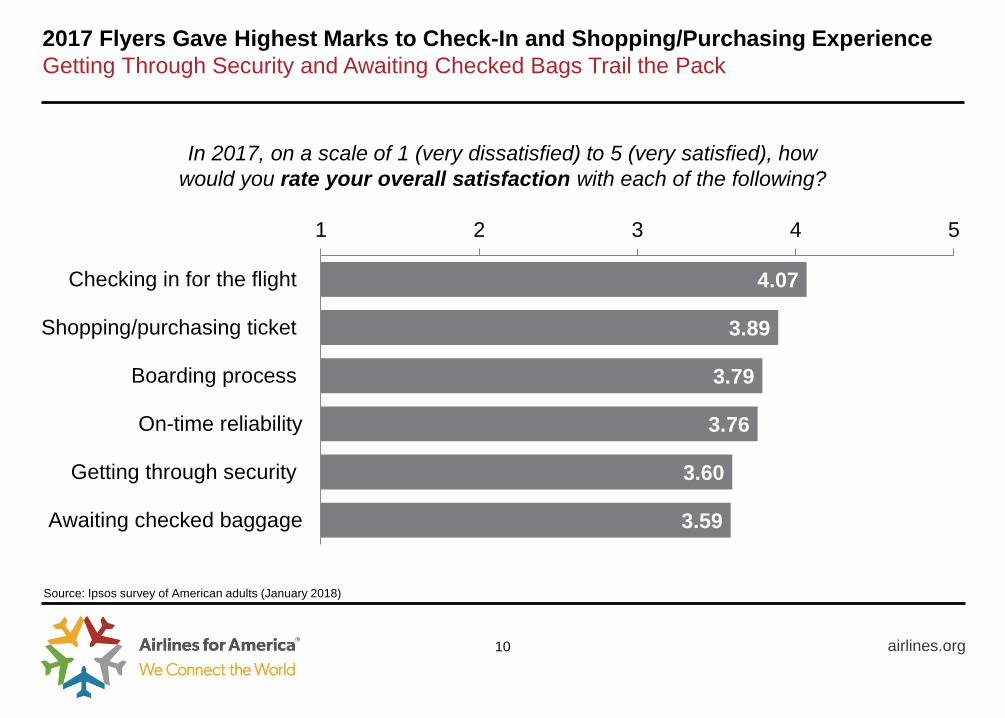
4.07
3.89
3.79
3.76
3.60
3.59
1 2 3 4 5
Checking in for the flight
Shopping/purchasing ticket
Boarding process
On-time reliability
Getting through security
Awaiting checked baggage
2017 Flyers Gave Highest Marks to Check-In and Shopping/Purchasing Experience
Getting Through Security and Awaiting Checked Bags Trail the Pack
airlines.org 10
In 2017, on a scale of 1 (very dissatisfied) to 5 (very satisfied), how
would you rate your overall satisfaction with each of the following?
Source: Ipsos survey of American adults (January 2018)
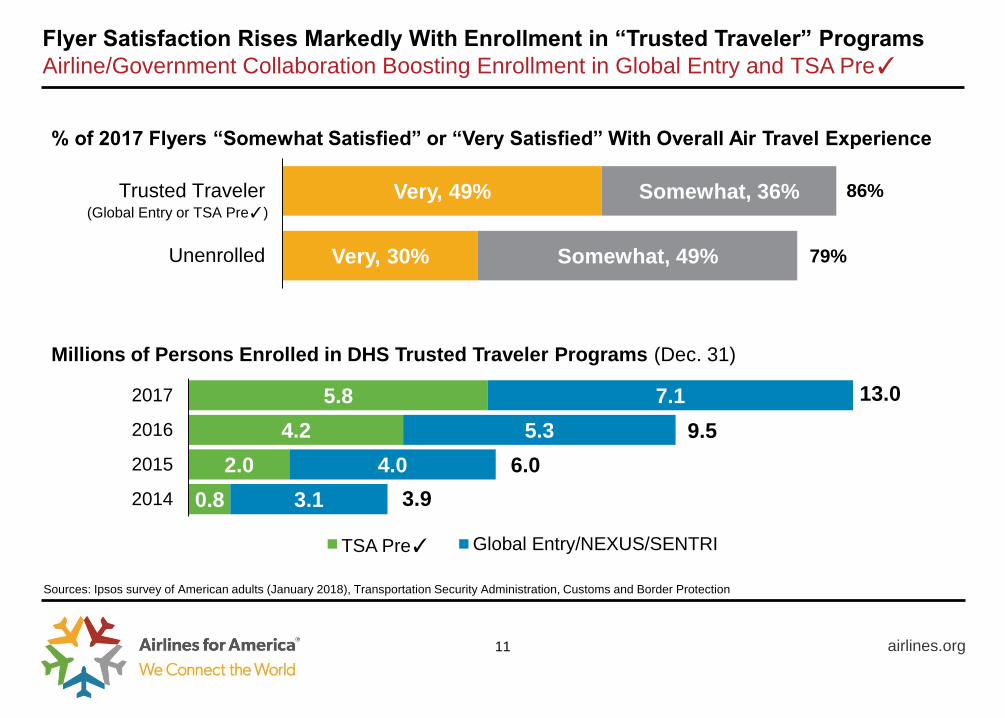
Flyer Satisfaction Rises Markedly With Enrollment in “Trusted Traveler” Programs
Airline/Government Collaboration Boosting Enrollment in Global Entry and TSA Pre✓
airlines.org
Very, 49%
Very, 30%
Somewhat, 36%
Somewhat, 49%
Trusted Traveler
Unenrolled
% of 2017 Flyers “Somewhat Satisfied” or “Very Satisfied” With Overall Air Travel Experience
Sources: Ipsos survey of American adults (January 2018), Transportation Security Administration, Customs and Border Protection
11
Millions of Persons Enrolled in DHS Trusted Traveler Programs (Dec. 31)
0.8
2.0
4.2
5.8
3.1
4.0
5.3
7.1
2014
2015
2016
2017
TSA Pre✓ Global Entry/NEXUS/SENTRI
86%
79%
(Global Entry or TSA Pre✓)
13.0
3.9
9.5
6.0
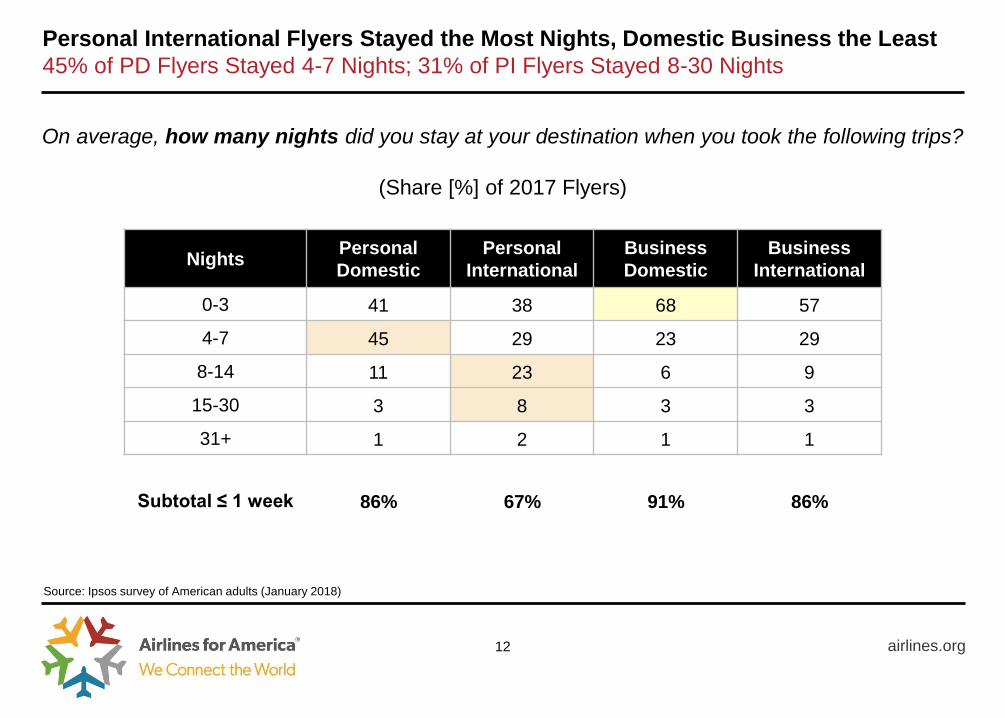
Personal International Flyers Stayed the Most Nights, Domestic Business the Least
45% of PD Flyers Stayed 4-7 Nights; 31% of PI Flyers Stayed 8-30 Nights
airlines.org 12
Nights Personal
Domestic
Personal
International
Business
Domestic
Business
International
0-3 41 38 68 57
4-7 45 29 23 29
8-14 11 23 6 9
15-30 3 8 3 3
31+ 1 2 1 1
Subtotal ≤ 1 week 86% 67% 91% 86%
On average, how many nights did you stay at your destination when you took the following trips?
(Share [%] of 2017 Flyers)
Source: Ipsos survey of American adults (January 2018)
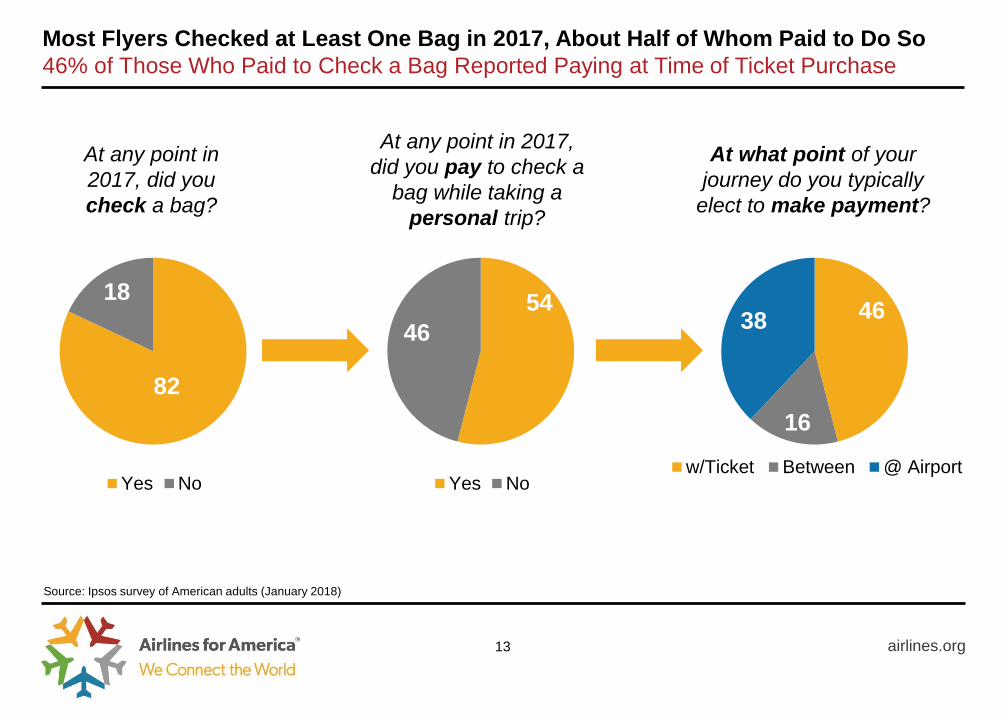
Most Flyers Checked at Least One Bag in 2017, About Half of Whom Paid to Do So
46% of Those Who Paid to Check a Bag Reported Paying at Time of Ticket Purchase
airlines.org
82
18
Yes No
13
At any point in
2017, did you
check a bag?
54
46
Yes No
At any point in 2017,
did you pay to check a
bag while taking a
personal trip?
46
16
38
w/Ticket Between @ Airport
At what point of your
journey do you typically
elect to make payment?
Source: Ipsos survey of American adults (January 2018)
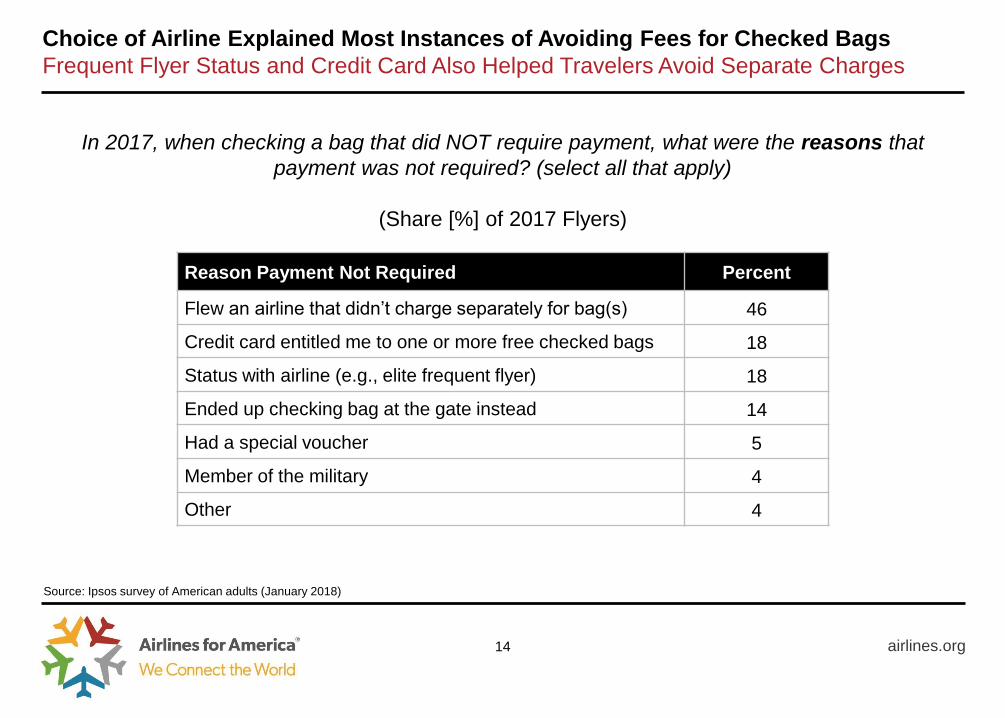
Choice of Airline Explained Most Instances of Avoiding Fees for Checked Bags
Frequent Flyer Status and Credit Card Also Helped Travelers Avoid Separate Charges
airlines.org 14
Reason Payment Not Required Percent
Flew an airline that didn’t charge separately for bag(s) 46
Credit card entitled me to one or more free checked bags 18
Status with airline (e.g., elite frequent flyer) 18
Ended up checking bag at the gate instead 14
Had a special voucher 5
Member of the military 4
Other 4
In 2017, when checking a bag that did NOT require payment, what were the reasons that
payment was not required? (select all that apply)
(Share [%] of 2017 Flyers)
Source: Ipsos survey of American adults (January 2018)
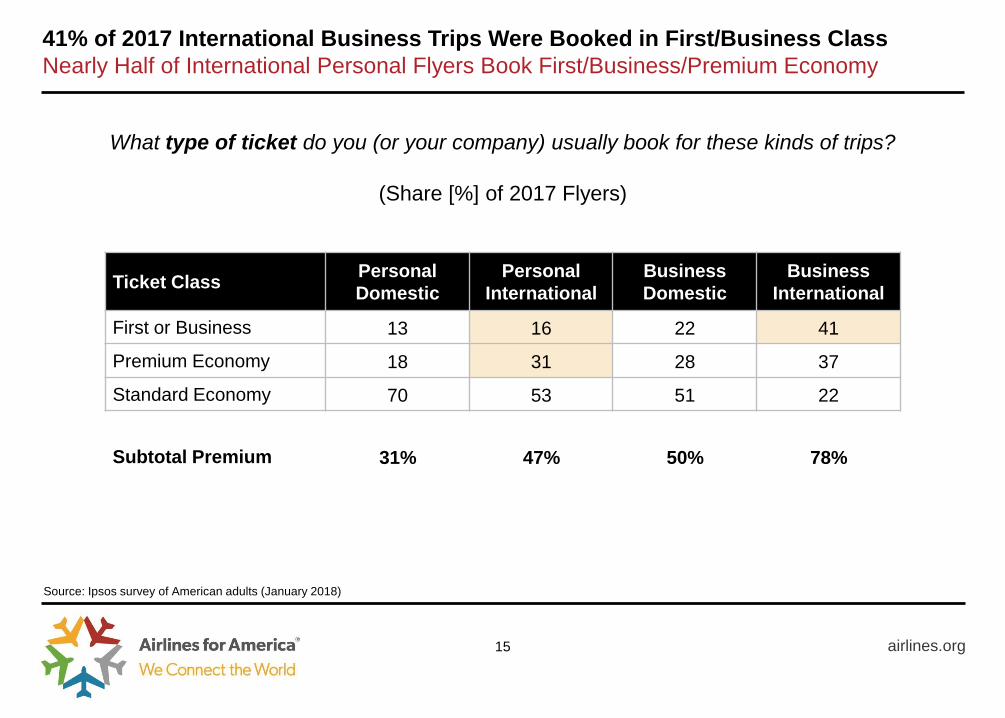
41% of 2017 International Business Trips Were Booked in First/Business Class
Nearly Half of International Personal Flyers Book First/Business/Premium Economy
airlines.org 15
Ticket Class Personal
Domestic
Personal
International
Business
Domestic
Business
International
First or Business 13 16 22 41
Premium Economy 18 31 28 37
Standard Economy 70 53 51 22
Subtotal Premium 31% 47% 50% 78%
What type of ticket do you (or your company) usually book for these kinds of trips?
(Share [%] of 2017 Flyers)
Source: Ipsos survey of American adults (January 2018)
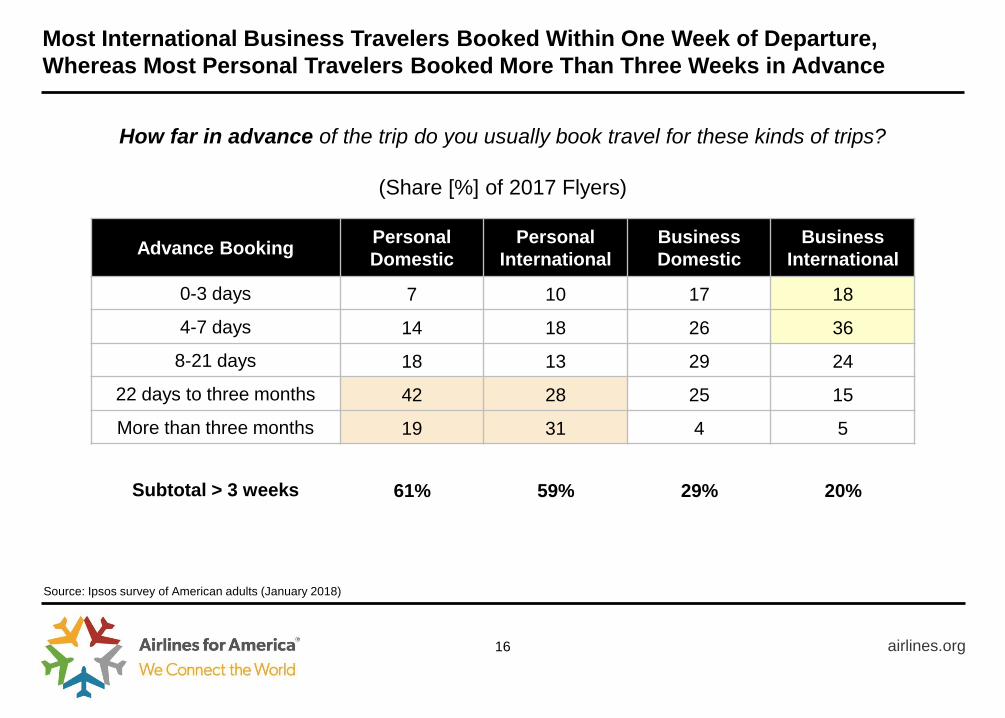
Most International Business Travelers Booked Within One Week of Departure,
Whereas Most Personal Travelers Booked More Than Three Weeks in Advance
airlines.org 16
Advance Booking Personal
Domestic
Personal
International
Business
Domestic
Business
International
0-3 days 7 10 17 18
4-7 days 14 18 26 36
8-21 days 18 13 29 24
22 days to three months 42 28 25 15
More than three months 19 31 4 5
Subtotal > 3 weeks 61% 59% 29% 20%
How far in advance of the trip do you usually book travel for these kinds of trips?
(Share [%] of 2017 Flyers)
Source: Ipsos survey of American adults (January 2018)
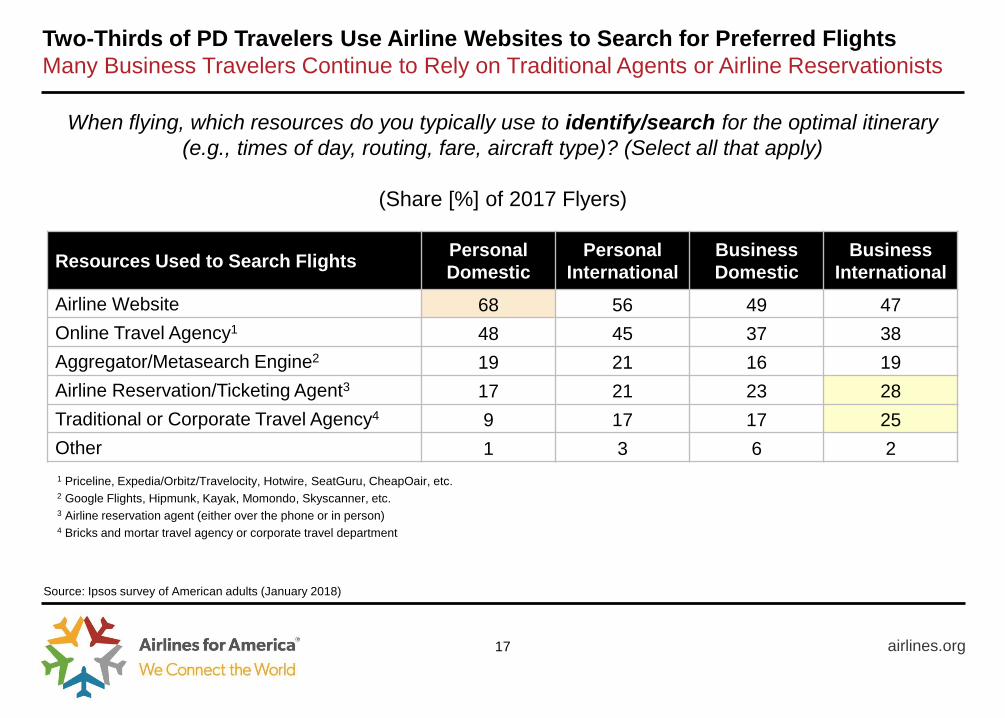
Two-Thirds of PD Travelers Use Airline Websites to Search for Preferred Flights
Many Business Travelers Continue to Rely on Traditional Agents or Airline Reservationists
airlines.org 17
Resources Used to Search Flights Personal
Domestic
Personal
International
Business
Domestic
Business
International
Airline Website 68 56 49 47
Online Travel Agency1 48 45 37 38
Aggregator/Metasearch Engine2 19 21 16 19
Airline Reservation/Ticketing Agent3 17 21 23 28
Traditional or Corporate Travel Agency4 9 17 17 25
Other 1 3 6 2
When flying, which resources do you typically use to identify/search for the optimal itinerary
(e.g., times of day, routing, fare, aircraft type)? (Select all that apply)
(Share [%] of 2017 Flyers)
Source: Ipsos survey of American adults (January 2018)
1 Priceline, Expedia/Orbitz/Travelocity, Hotwire, SeatGuru, CheapOair, etc. 2 Google Flights, Hipmunk, Kayak, Momondo, Skyscanner, etc. 3 Airline reservation agent (either over the phone or in person) 4 Bricks and mortar travel agency or corporate travel department
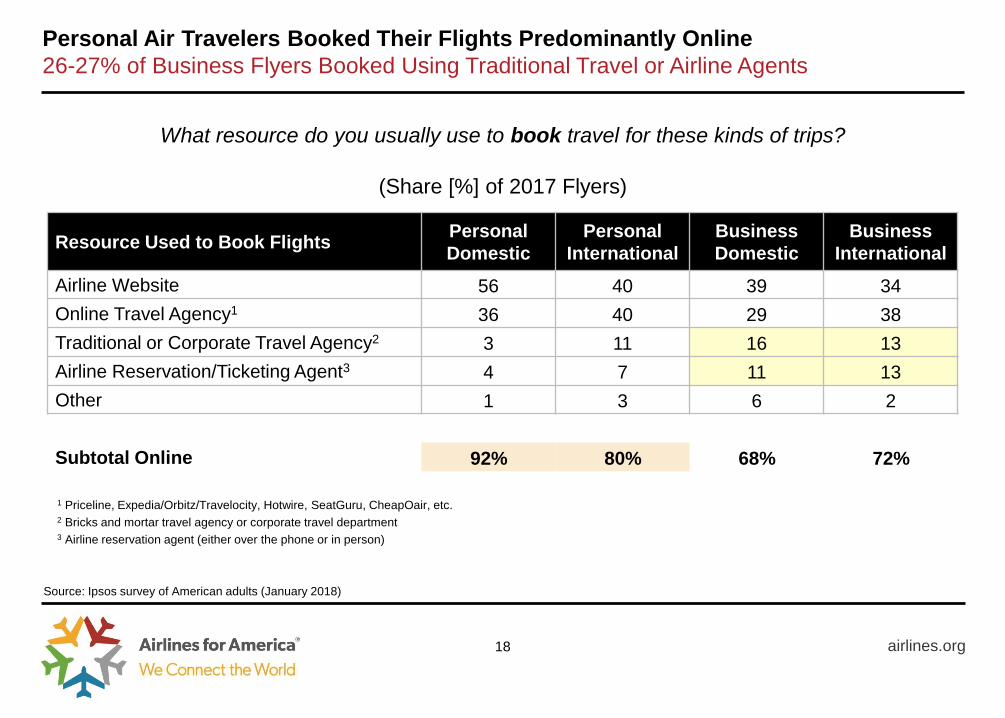
Personal Air Travelers Booked Their Flights Predominantly Online
26-27% of Business Flyers Booked Using Traditional Travel or Airline Agents
airlines.org 18
What resource do you usually use to book travel for these kinds of trips?
(Share [%] of 2017 Flyers)
Source: Ipsos survey of American adults (January 2018)
Resource Used to Book Flights Personal
Domestic
Personal
International
Business
Domestic
Business
International
Airline Website 56 40 39 34
Online Travel Agency1 36 40 29 38
Traditional or Corporate Travel Agency2 3 11 16 13
Airline Reservation/Ticketing Agent3 4 7 11 13
Other 1 3 6 2
Subtotal Online 92% 80% 68% 72%
1 Priceline, Expedia/Orbitz/Travelocity, Hotwire, SeatGuru, CheapOair, etc. 2 Bricks and mortar travel agency or corporate travel department 3 Airline reservation agent (either over the phone or in person)
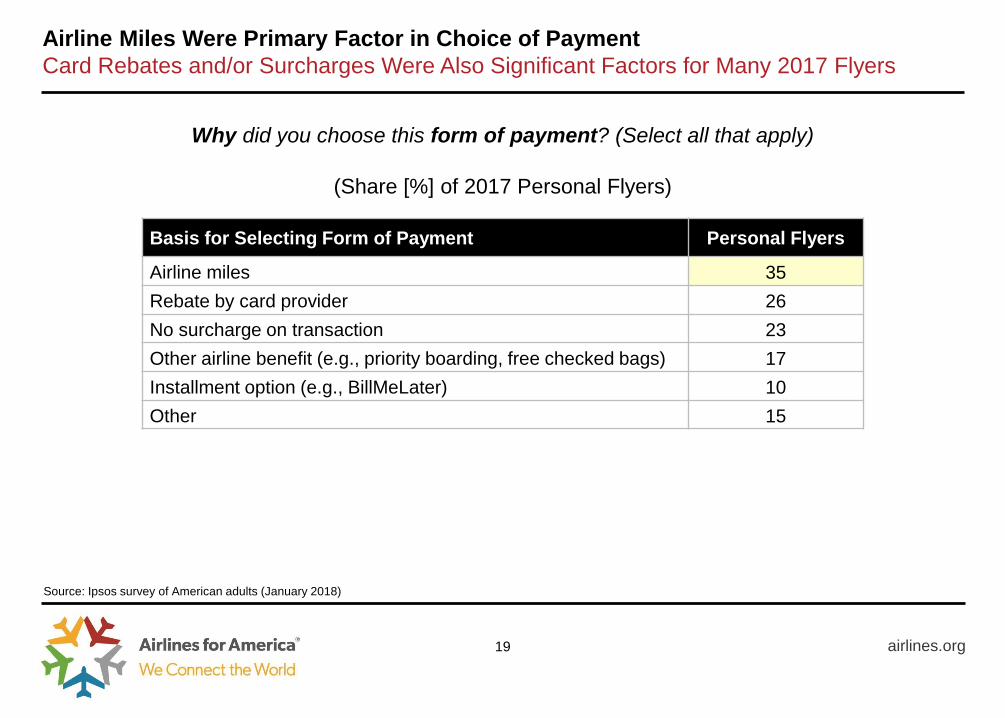
Airline Miles Were Primary Factor in Choice of Payment
Card Rebates and/or Surcharges Were Also Significant Factors for Many 2017 Flyers
airlines.org 19
Why did you choose this form of payment? (Select all that apply)
(Share [%] of 2017 Personal Flyers)
Source: Ipsos survey of American adults (January 2018)
Basis for Selecting Form of Payment Personal Flyers
Airline miles 35
Rebate by card provider 26
No surcharge on transaction 23
Other airline benefit (e.g., priority boarding, free checked bags) 17
Installment option (e.g., BillMeLater) 10
Other 15
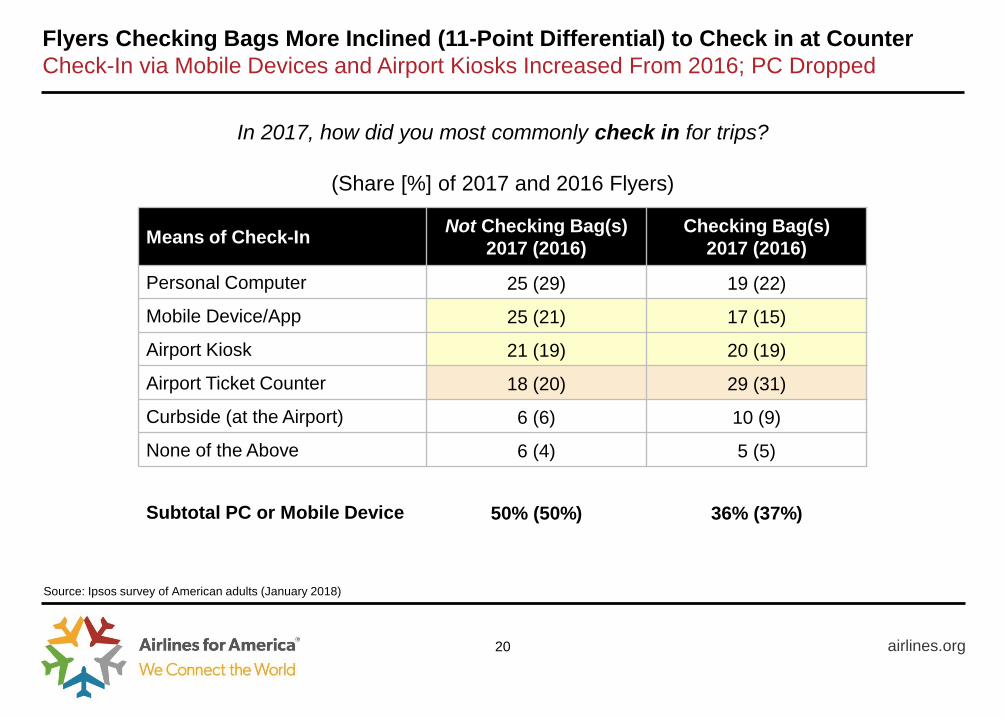
Flyers Checking Bags More Inclined (11-Point Differential) to Check in at Counter
Check-In via Mobile Devices and Airport Kiosks Increased From 2016; PC Dropped
airlines.org 20
Means of Check-In Not Checking Bag(s)
2017 (2016)
Checking Bag(s)
2017 (2016)
Personal Computer 25 (29) 19 (22)
Mobile Device/App 25 (21) 17 (15)
Airport Kiosk 21 (19) 20 (19)
Airport Ticket Counter 18 (20) 29 (31)
Curbside (at the Airport) 6 (6) 10 (9)
None of the Above 6 (4) 5 (5)
Subtotal PC or Mobile Device 50% (50%) 36% (37%)
In 2017, how did you most commonly check in for trips?
(Share [%] of 2017 and 2016 Flyers)
Source: Ipsos survey of American adults (January 2018)

Most Americans Describe the Airline Industry as Competitive or Are Neutral
Only 2-4% Describe the Airline Industry as “Not at All Competitive”
airlines.org 21
How competitive or not is the airline industry to be when it comes to the following?
(Share [%] of All Americans)
Source: Ipsos survey of American adults (January 2018)
Rating (1 to 5) Choice of Carriers
(e.g. number, type) Price / Affordability Flight Times / Routes
5 – Very competitive 18 21 16
4 – Somewhat competitive 42 39 40
3 – Neutral 28 22 31
2 – Not very competitive 9 15 11
1 – Not at all competitive 2 4 3
Mean Rating 3.6 3.6 3.6
Not very/at all competitive 11% 19% 13%
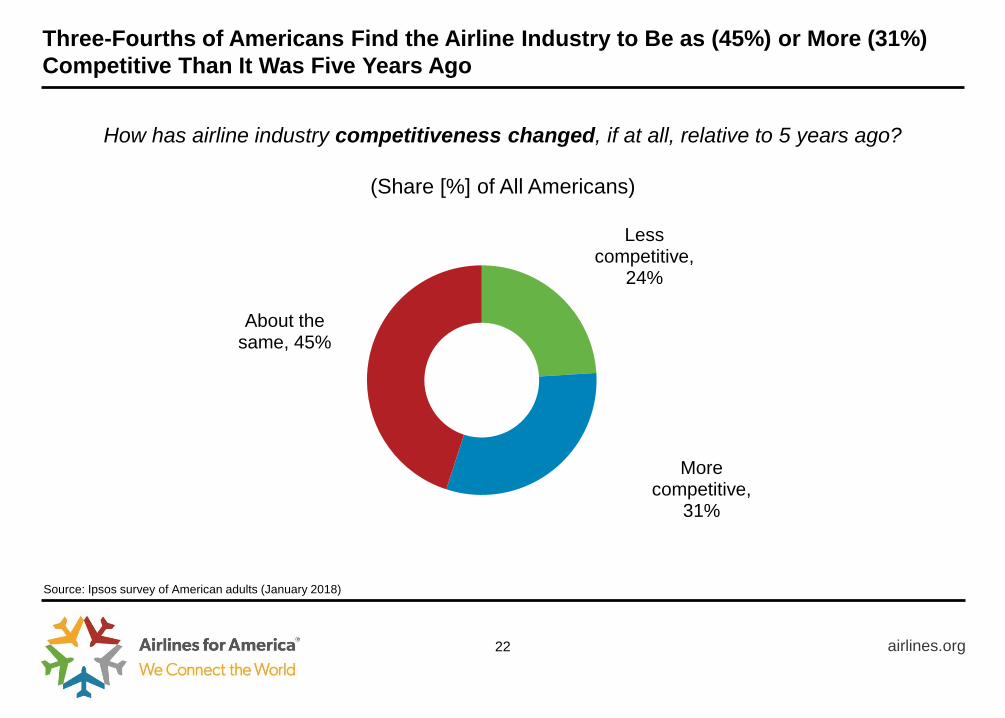
Less competitive,
24%
More competitive,
31%
About the same, 45%
airlines.org
Three-Fourths of Americans Find the Airline Industry to Be as (45%) or More (31%)
Competitive Than It Was Five Years Ago
22
Source: Ipsos survey of American adults (January 2018)
How has airline industry competitiveness changed, if at all, relative to 5 years ago?
(Share [%] of All Americans)
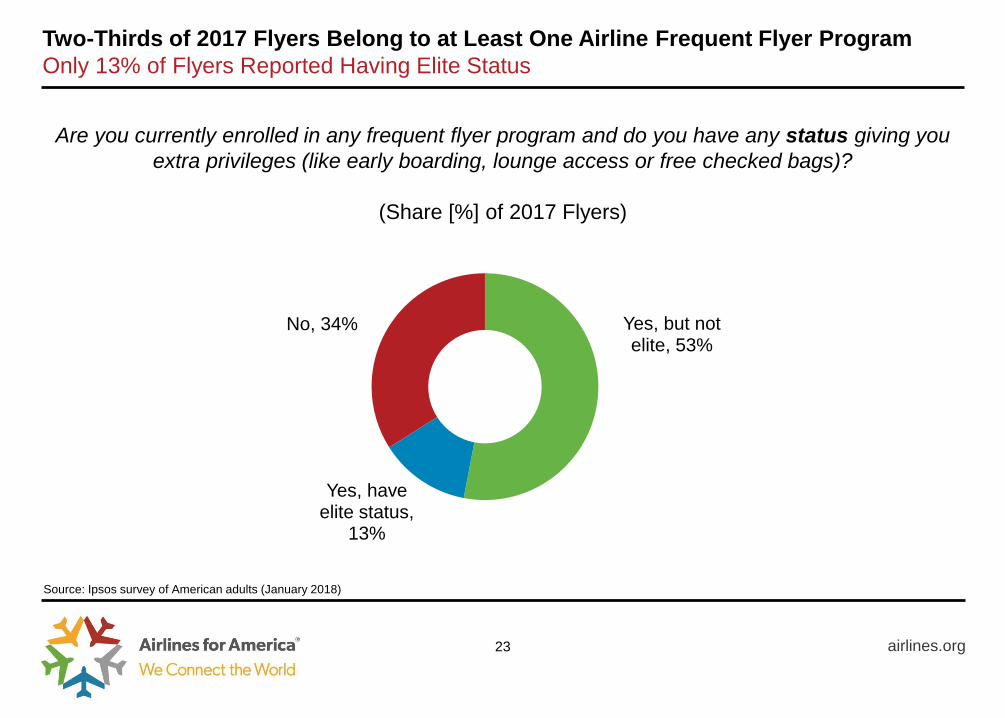
Yes, but not elite, 53%
Yes, have elite status,
13%
No, 34%
airlines.org
Two-Thirds of 2017 Flyers Belong to at Least One Airline Frequent Flyer Program
Only 13% of Flyers Reported Having Elite Status
23
Source: Ipsos survey of American adults (January 2018)
Are you currently enrolled in any frequent flyer program and do you have any status giving you
extra privileges (like early boarding, lounge access or free checked bags)?
(Share [%] of 2017 Flyers)
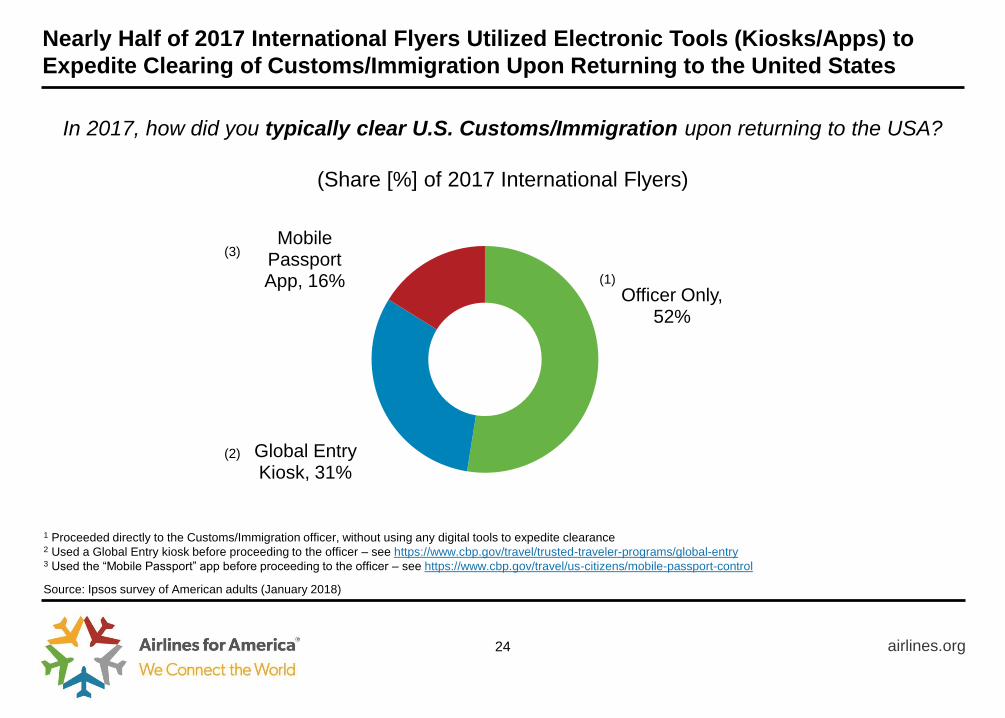
Officer Only, 52%
Global Entry Kiosk, 31%
Mobile Passport App, 16%
airlines.org
Nearly Half of 2017 International Flyers Utilized Electronic Tools (Kiosks/Apps) to
Expedite Clearing of Customs/Immigration Upon Returning to the United States
24
Source: Ipsos survey of American adults (January 2018)
In 2017, how did you typically clear U.S. Customs/Immigration upon returning to the USA?
(Share [%] of 2017 International Flyers)
1 Proceeded directly to the Customs/Immigration officer, without using any digital tools to expedite clearance 2 Used a Global Entry kiosk before proceeding to the officer – see https://www.cbp.gov/travel/trusted-traveler-programs/global-entry 3 Used the “Mobile Passport” app before proceeding to the officer – see https://www.cbp.gov/travel/us-citizens/mobile-passport-control
(1)
(2)
(3)
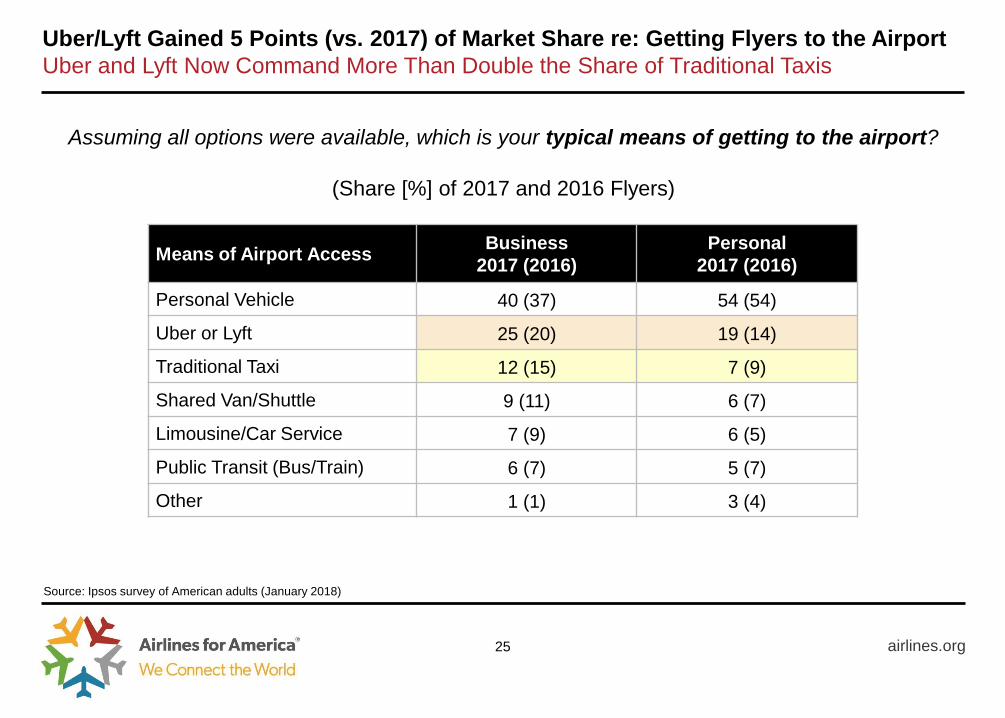
Uber/Lyft Gained 5 Points (vs. 2017) of Market Share re: Getting Flyers to the Airport
Uber and Lyft Now Command More Than Double the Share of Traditional Taxis
airlines.org 25
Means of Airport Access Business
2017 (2016)
Personal
2017 (2016)
Personal Vehicle 40 (37) 54 (54)
Uber or Lyft 25 (20) 19 (14)
Traditional Taxi 12 (15) 7 (9)
Shared Van/Shuttle 9 (11) 6 (7)
Limousine/Car Service 7 (9) 6 (5)
Public Transit (Bus/Train) 6 (7) 5 (7)
Other 1 (1) 3 (4)
Assuming all options were available, which is your typical means of getting to the airport?
(Share [%] of 2017 and 2016 Flyers)
Source: Ipsos survey of American adults (January 2018)
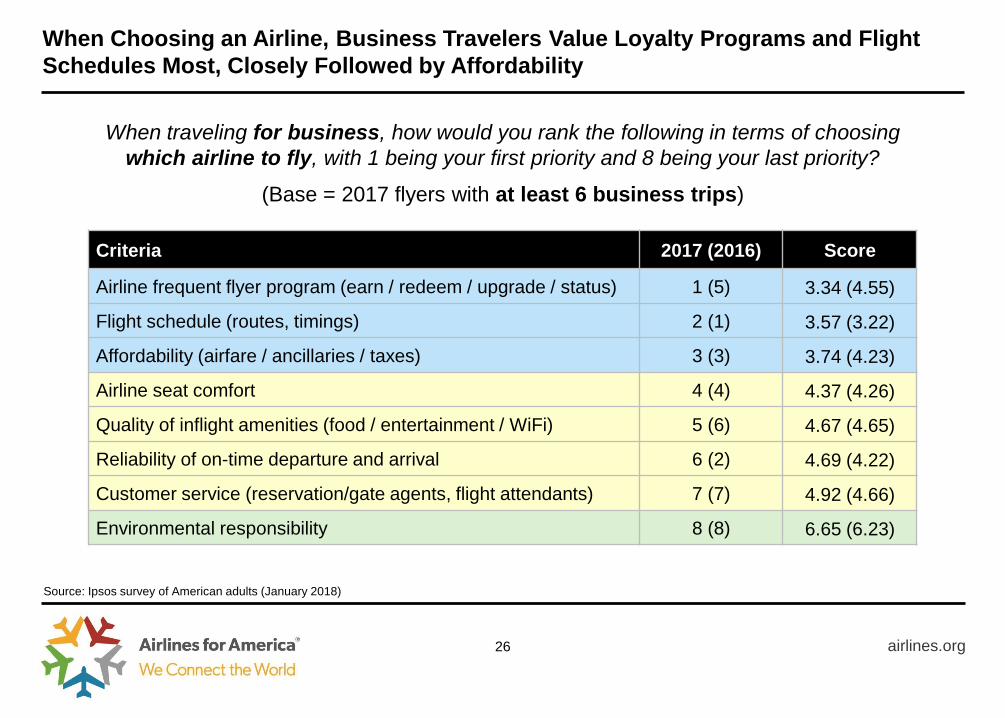
When Choosing an Airline, Business Travelers Value Loyalty Programs and Flight
Schedules Most, Closely Followed by Affordability
airlines.org 26
Criteria 2017 (2016) Score
Airline frequent flyer program (earn / redeem / upgrade / status) 1 (5) 3.34 (4.55)
Flight schedule (routes, timings) 2 (1) 3.57 (3.22)
Affordability (airfare / ancillaries / taxes) 3 (3) 3.74 (4.23)
Airline seat comfort 4 (4) 4.37 (4.26)
Quality of inflight amenities (food / entertainment / WiFi) 5 (6) 4.67 (4.65)
Reliability of on-time departure and arrival 6 (2) 4.69 (4.22)
Customer service (reservation/gate agents, flight attendants) 7 (7) 4.92 (4.66)
Environmental responsibility 8 (8) 6.65 (6.23)
When traveling for business, how would you rank the following in terms of choosing
which airline to fly, with 1 being your first priority and 8 being your last priority?
Source: Ipsos survey of American adults (January 2018)
(Base = 2017 flyers with at least 6 business trips)
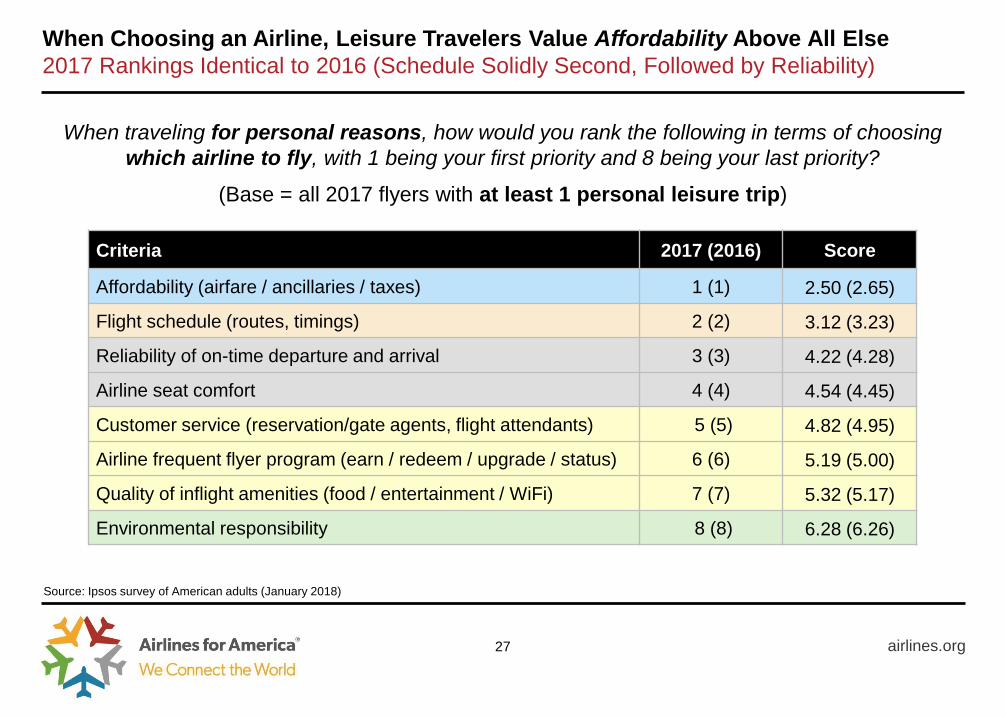
When Choosing an Airline, Leisure Travelers Value Affordability Above All Else
2017 Rankings Identical to 2016 (Schedule Solidly Second, Followed by Reliability)
airlines.org 27
Criteria 2017 (2016) Score
Affordability (airfare / ancillaries / taxes) 1 (1) 2.50 (2.65)
Flight schedule (routes, timings) 2 (2) 3.12 (3.23)
Reliability of on-time departure and arrival 3 (3) 4.22 (4.28)
Airline seat comfort 4 (4) 4.54 (4.45)
Customer service (reservation/gate agents, flight attendants) 5 (5) 4.82 (4.95)
Airline frequent flyer program (earn / redeem / upgrade / status) 6 (6) 5.19 (5.00)
Quality of inflight amenities (food / entertainment / WiFi) 7 (7) 5.32 (5.17)
Environmental responsibility 8 (8) 6.28 (6.26)
When traveling for personal reasons, how would you rank the following in terms of choosing
which airline to fly, with 1 being your first priority and 8 being your last priority?
Source: Ipsos survey of American adults (January 2018)
(Base = all 2017 flyers with at least 1 personal leisure trip)
APPENDIX
airlines.org 29
airlines.org
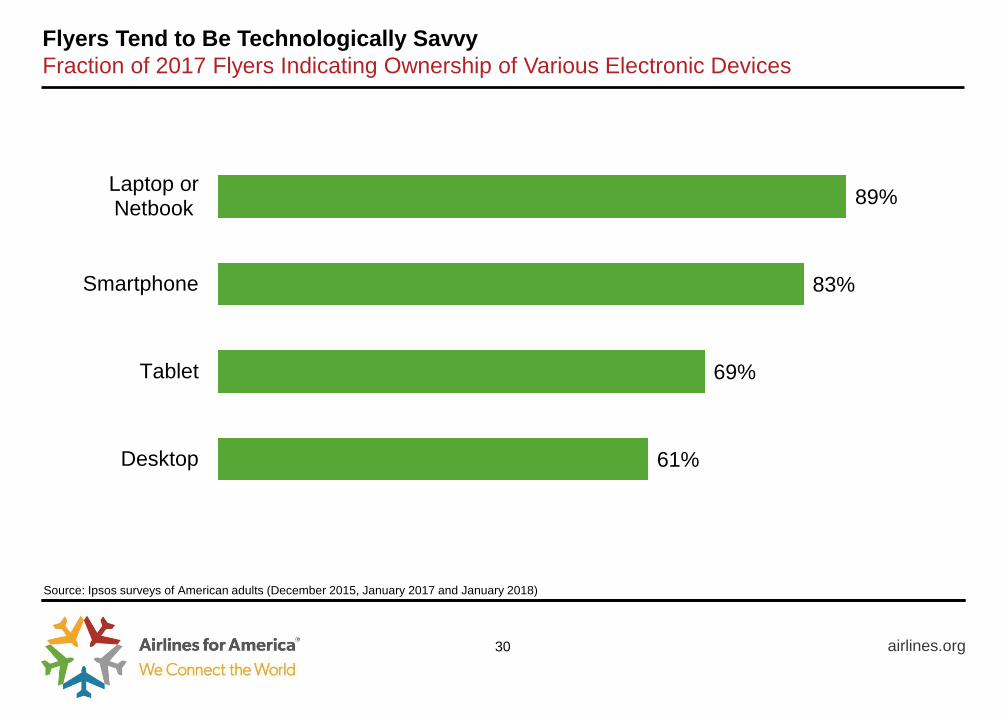
Flyers Tend to Be Technologically Savvy
Fraction of 2017 Flyers Indicating Ownership of Various Electronic Devices
30
Source: Ipsos surveys of American adults (December 2015, January 2017 and January 2018)
89%
83%
69%
61%
Laptop orNetbook
Smartphone
Tablet
Desktop
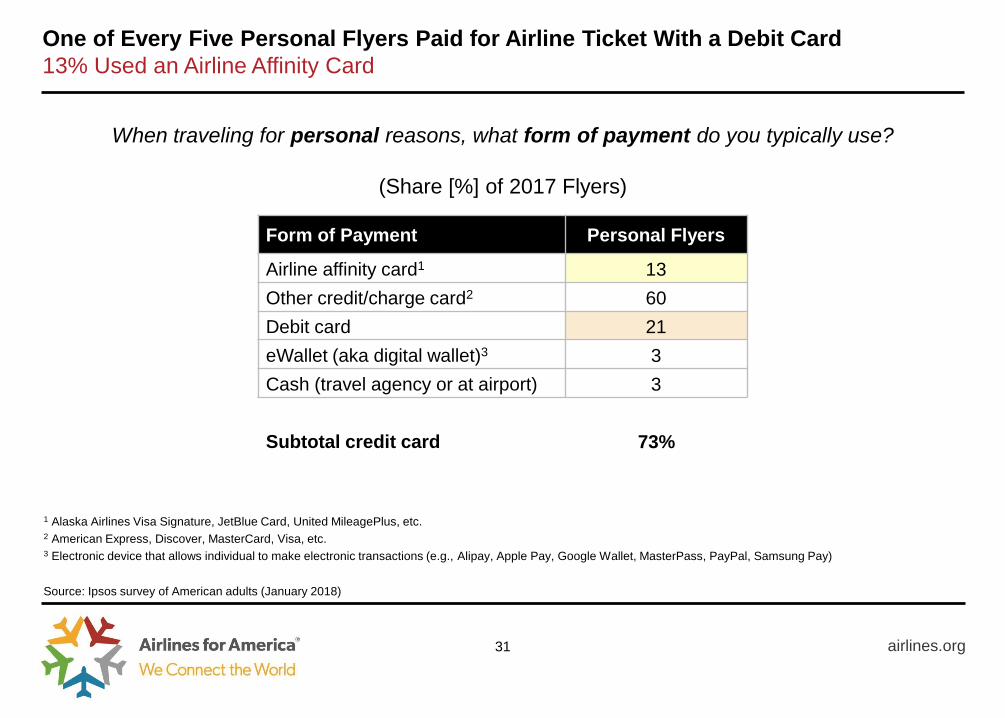
One of Every Five Personal Flyers Paid for Airline Ticket With a Debit Card
13% Used an Airline Affinity Card
airlines.org 31
When traveling for personal reasons, what form of payment do you typically use?
(Share [%] of 2017 Flyers)
Source: Ipsos survey of American adults (January 2018)
Form of Payment Personal Flyers
Airline affinity card1 13
Other credit/charge card2 60
Debit card 21
eWallet (aka digital wallet)3 3
Cash (travel agency or at airport) 3
Subtotal credit card 73%
1 Alaska Airlines Visa Signature, JetBlue Card, United MileagePlus, etc. 2 American Express, Discover, MasterCard, Visa, etc. 3 Electronic device that allows individual to make electronic transactions (e.g., Alipay, Apple Pay, Google Wallet, MasterPass, PayPal, Samsung Pay)
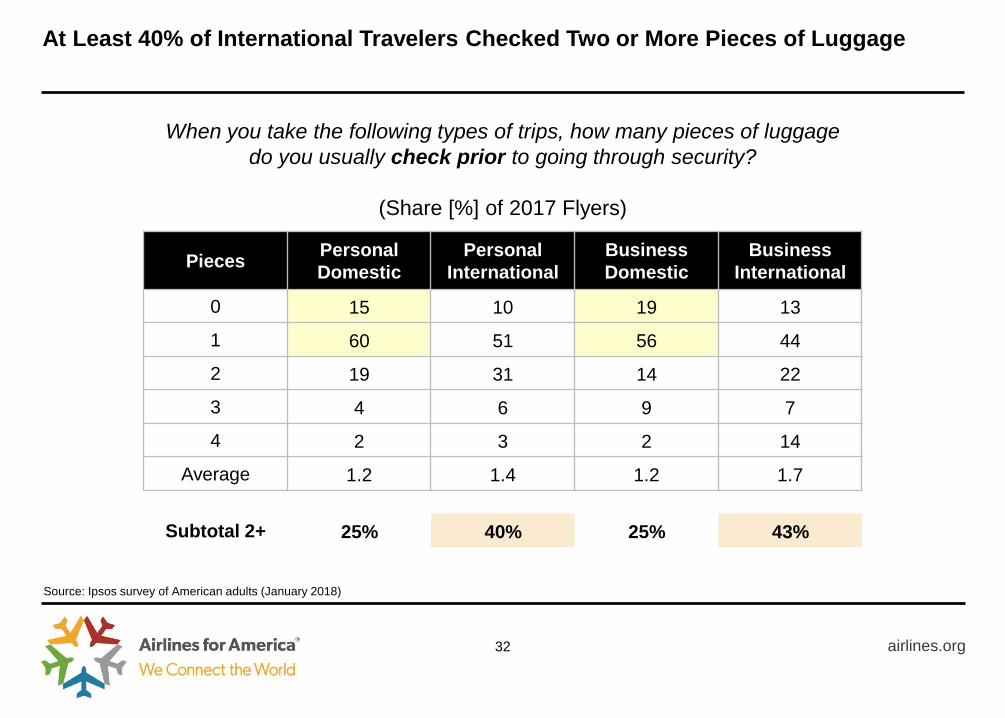
At Least 40% of International Travelers Checked Two or More Pieces of Luggage
airlines.org 32
Pieces Personal
Domestic
Personal
International
Business
Domestic
Business
International
0 15 10 19 13
1 60 51 56 44
2 19 31 14 22
3 4 6 9 7
4 2 3 2 14
Average 1.2 1.4 1.2 1.7
Subtotal 2+ 25% 40% 25% 43%
When you take the following types of trips, how many pieces of luggage
do you usually check prior to going through security?
(Share [%] of 2017 Flyers)
Source: Ipsos survey of American adults (January 2018)
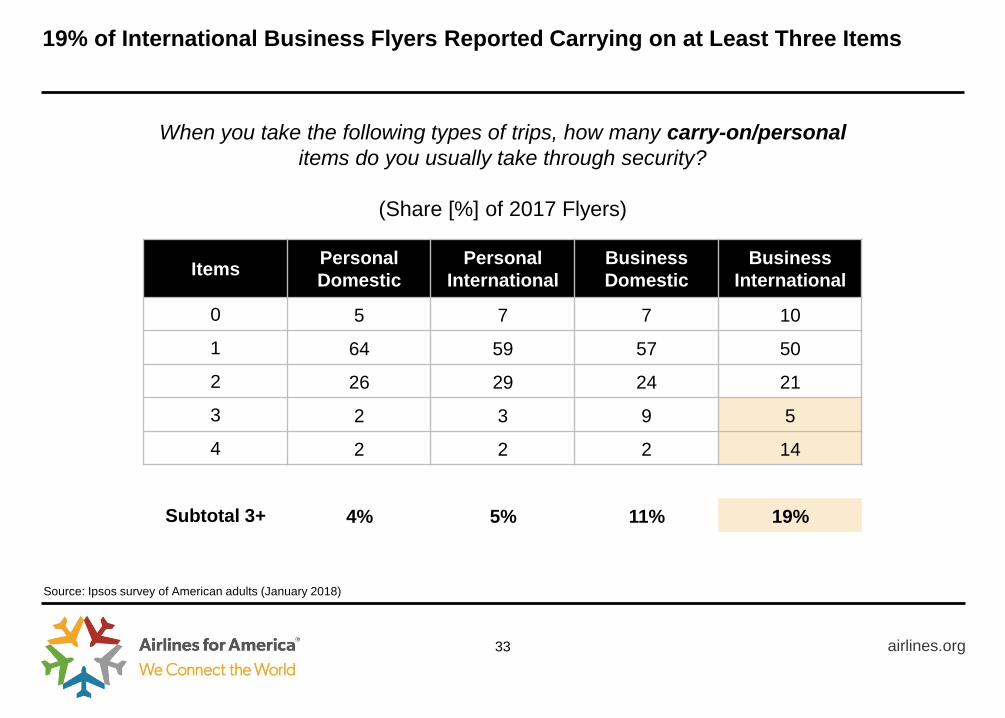
19% of International Business Flyers Reported Carrying on at Least Three Items
airlines.org 33
Items Personal
Domestic
Personal
International
Business
Domestic
Business
International
0 5 7 7 10
1 64 59 57 50
2 26 29 24 21
3 2 3 9 5
4 2 2 2 14
Subtotal 3+ 4% 5% 11% 19%
When you take the following types of trips, how many carry-on/personal
items do you usually take through security?
(Share [%] of 2017 Flyers)
Source: Ipsos survey of American adults (January 2018)

As Expected, Global Entry Program Enrollees Express Significantly Higher Levels of
Satisfaction With Respect to Clearing U.S. Customs/Immigration
airlines.org 34
Thinking about all your international trips in 2017, how would you rate your
satisfaction with clearing U.S. Customs/Immigration?
(Share [%] of 2017 International Flyers)
Source: Ipsos survey of American adults (January 2018)
Rating (1 to 5) All International Global Entry Non-Global Entry
5 – Very satisfied 35 51 29
4 – Somewhat satisfied 37 33 38
3 – Neutral 20 14 22
2 – Somewhat dissatisfied 6 2 7
1 – Very dissatisfied 1 0 1
Not applicable 1 0 2
Mean Rating 4.0 4.3 3.9
Very/somewhat satisfied 72% 83% 67%
Very/somewhat dissatisfied 7% 3% 9%
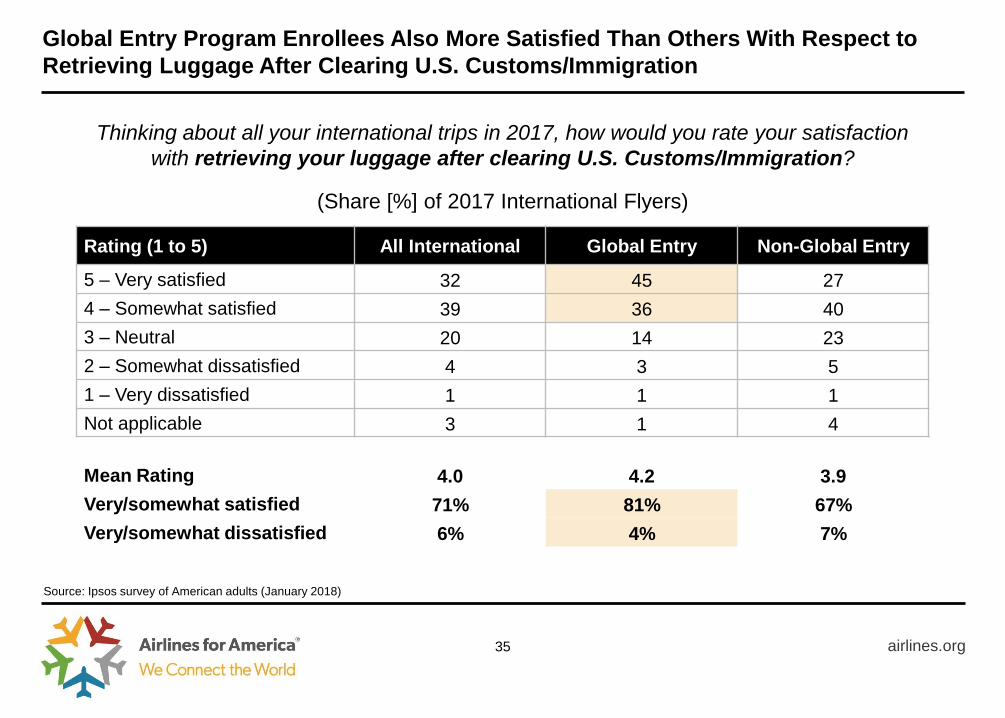
Global Entry Program Enrollees Also More Satisfied Than Others With Respect to
Retrieving Luggage After Clearing U.S. Customs/Immigration
airlines.org 35
Thinking about all your international trips in 2017, how would you rate your satisfaction
with retrieving your luggage after clearing U.S. Customs/Immigration?
(Share [%] of 2017 International Flyers)
Source: Ipsos survey of American adults (January 2018)
Rating (1 to 5) All International Global Entry Non-Global Entry
5 – Very satisfied 32 45 27
4 – Somewhat satisfied 39 36 40
3 – Neutral 20 14 23
2 – Somewhat dissatisfied 4 3 5
1 – Very dissatisfied 1 1 1
Not applicable 3 1 4
Mean Rating 4.0 4.2 3.9
Very/somewhat satisfied 71% 81% 67%
Very/somewhat dissatisfied 6% 4% 7%
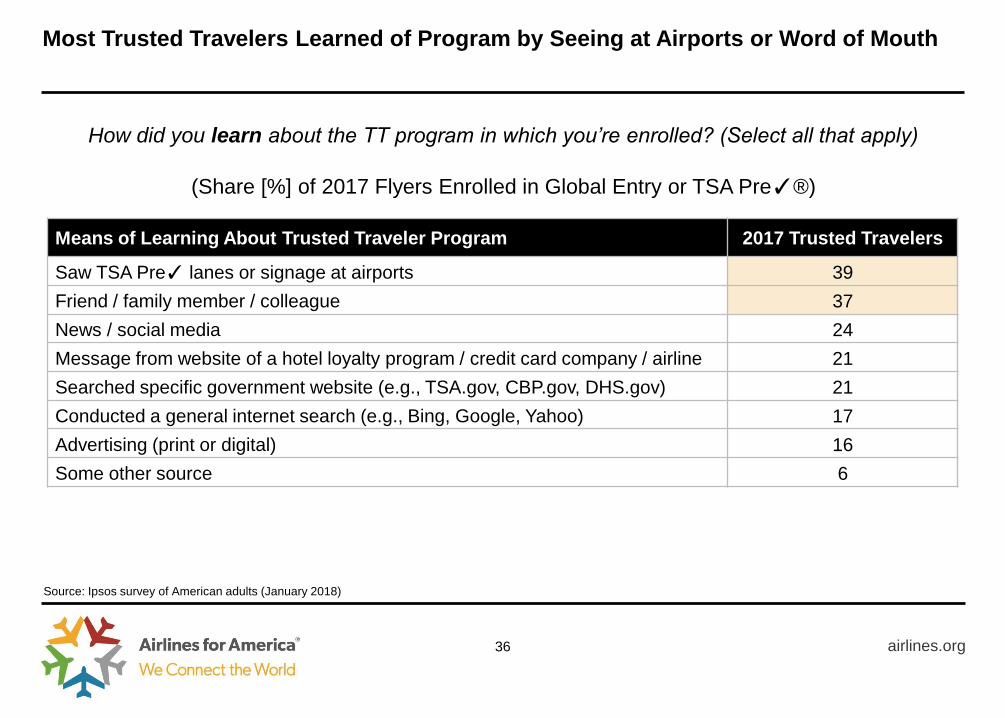
Most Trusted Travelers Learned of Program by Seeing at Airports or Word of Mouth
airlines.org 36
How did you learn about the TT program in which you’re enrolled? (Select all that apply)
(Share [%] of 2017 Flyers Enrolled in Global Entry or TSA Pre✓®)
Source: Ipsos survey of American adults (January 2018)
Means of Learning About Trusted Traveler Program 2017 Trusted Travelers
Saw TSA Pre✓ lanes or signage at airports 39
Friend / family member / colleague 37
News / social media 24
Message from website of a hotel loyalty program / credit card company / airline 21
Searched specific government website (e.g., TSA.gov, CBP.gov, DHS.gov) 21
Conducted a general internet search (e.g., Bing, Google, Yahoo) 17
Advertising (print or digital) 16
Some other source 6
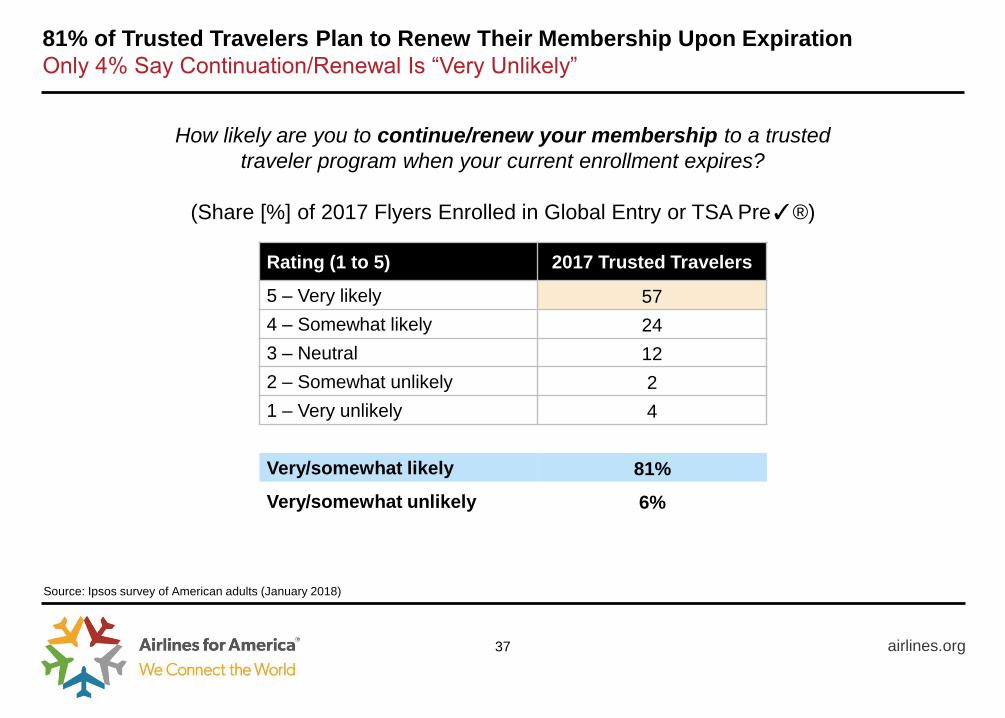
81% of Trusted Travelers Plan to Renew Their Membership Upon Expiration
Only 4% Say Continuation/Renewal Is “Very Unlikely”
airlines.org 37
How likely are you to continue/renew your membership to a trusted
traveler program when your current enrollment expires?
(Share [%] of 2017 Flyers Enrolled in Global Entry or TSA Pre✓®)
Source: Ipsos survey of American adults (January 2018)
Rating (1 to 5) 2017 Trusted Travelers
5 – Very likely 57
4 – Somewhat likely 24
3 – Neutral 12
2 – Somewhat unlikely 2
1 – Very unlikely 4
Very/somewhat likely 81%
Very/somewhat unlikely 6%
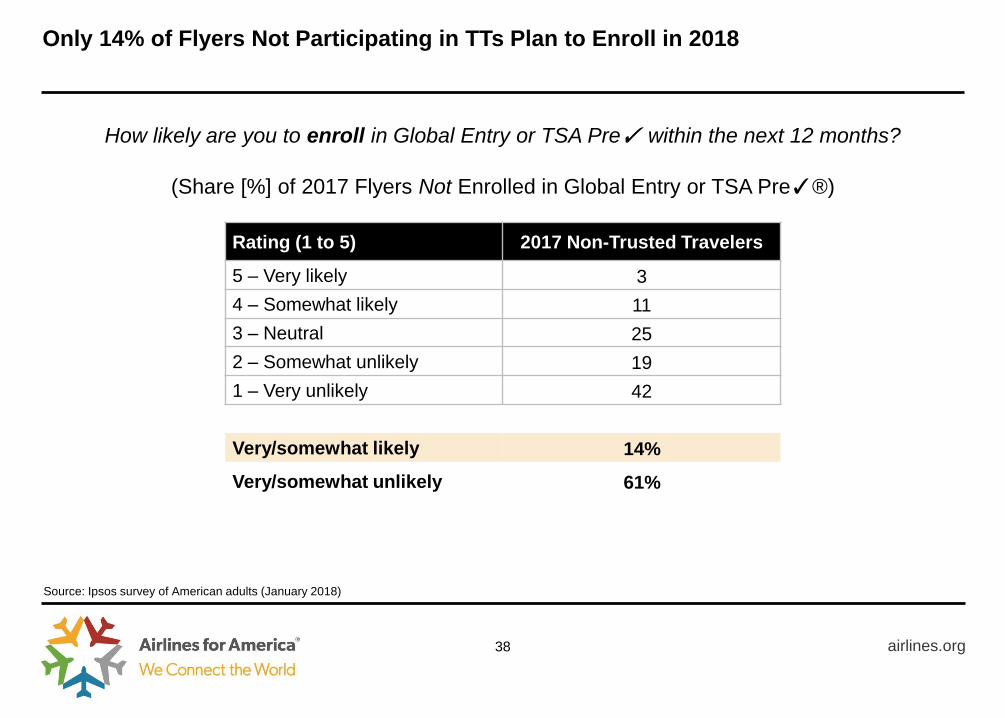
Only 14% of Flyers Not Participating in TTs Plan to Enroll in 2018
airlines.org 38
How likely are you to enroll in Global Entry or TSA Pre✓ within the next 12 months?
(Share [%] of 2017 Flyers Not Enrolled in Global Entry or TSA Pre✓®)
Source: Ipsos survey of American adults (January 2018)
Rating (1 to 5) 2017 Non-Trusted Travelers
5 – Very likely 3
4 – Somewhat likely 11
3 – Neutral 25
2 – Somewhat unlikely 19
1 – Very unlikely 42
Very/somewhat likely 14%
Very/somewhat unlikely 61%

Half of Non-Enrollees Don’t Fly Often Enough to Sign Up for TT Programs
Additional 8% Cite Lack of Awareness and 6% Don’t Know Where/How to Apply
airlines.org 39
Source: Ipsos survey of American adults (January 2018)
What is the primary reason you are not enrolled in either of these expedited screening programs?
(Share [%] of 2017 Flyers Not Enrolled in Global Entry or TSA Pre✓®)
Reason Not Enrolled in Global Entry or TSA Pre✓ 2017 Non-TT Flyers
I don’t travel often enough to justify the time and money to enroll 52
The application fee ($85 for 5-year Pre✓, $100 for 5-year Global Entry) is too high 12
I’m not aware of these programs or their benefits 8
The regular (non-expedited) lanes at TSA/Customs are fast enough for me 7
I don’t know how/where to apply 6
It’s too difficult/cumbersome to enroll in the program1 5
I choose not to share biometric or other personal information with the government 3
I haven’t been able to get a convenient appointment time 3
I’m not eligible to apply (e.g., non-permanent U.S. resident) 1
Other 2
1 Application process, location of enrollment center, time required to spend in person at enrollment center, etc.
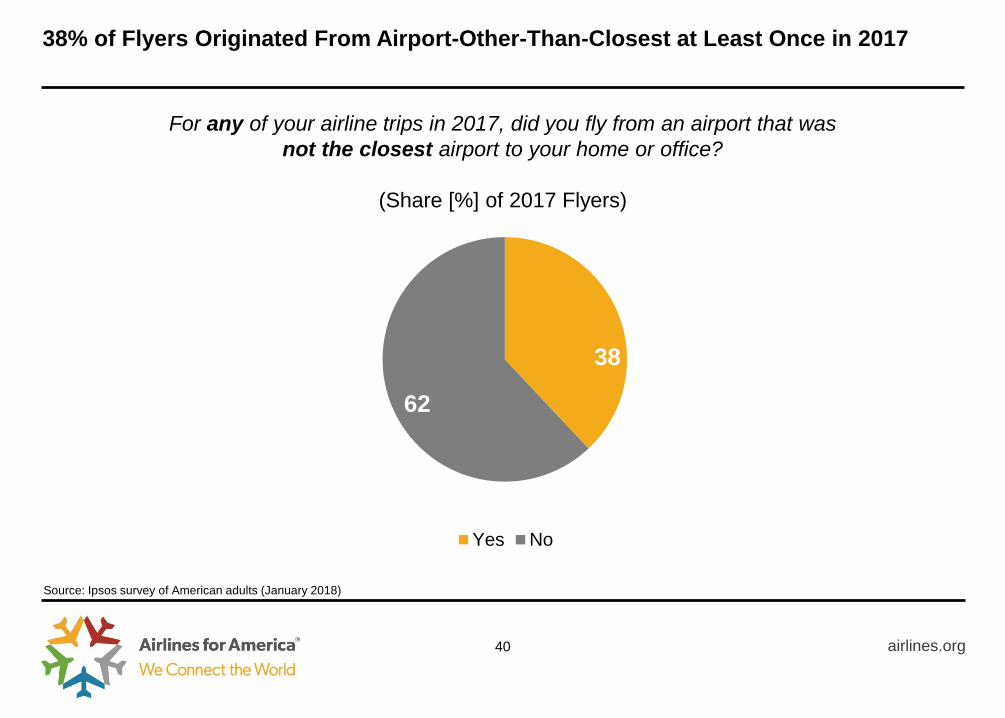
38% of Flyers Originated From Airport-Other-Than-Closest at Least Once in 2017
airlines.org
38
62
Yes No
40
For any of your airline trips in 2017, did you fly from an airport that was
not the closest airport to your home or office?
(Share [%] of 2017 Flyers)
Source: Ipsos survey of American adults (January 2018)
27
33
18
12
4 2 3
0
5
10
15
20
25
30
35
30 mins 60 mins 90 mins 2 hrs 3 hrs 4 hrs >4 hrs
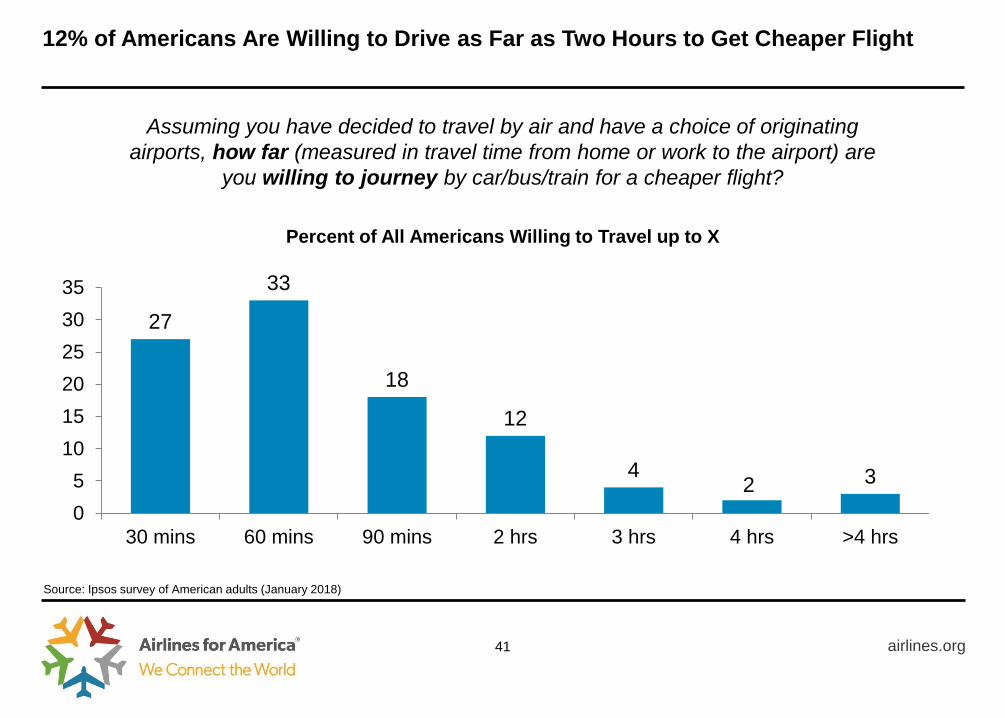
12% of Americans Are Willing to Drive as Far as Two Hours to Get Cheaper Flight
airlines.org 41
Source: Ipsos survey of American adults (January 2018)
Assuming you have decided to travel by air and have a choice of originating
airports, how far (measured in travel time from home or work to the airport) are
you willing to journey by car/bus/train for a cheaper flight?
Percent of All Americans Willing to Travel up to X
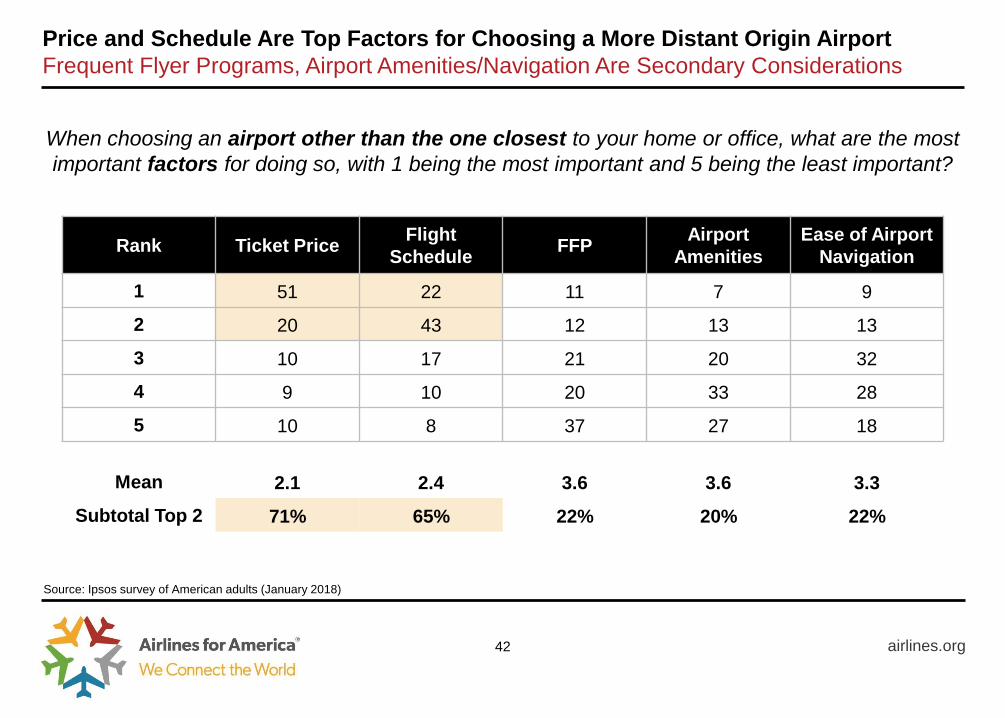
Price and Schedule Are Top Factors for Choosing a More Distant Origin Airport
Frequent Flyer Programs, Airport Amenities/Navigation Are Secondary Considerations
airlines.org 42
Source: Ipsos survey of American adults (January 2018)
When choosing an airport other than the one closest to your home or office, what are the most
important factors for doing so, with 1 being the most important and 5 being the least important?
Rank Ticket Price Flight
Schedule FFP
Airport
Amenities
Ease of Airport
Navigation
1 51 22 11 7 9
2 20 43 12 13 13
3 10 17 21 20 32
4 9 10 20 33 28
5 10 8 37 27 18
Mean 2.1 2.4 3.6 3.6 3.3
Subtotal Top 2 71% 65% 22% 20% 22%
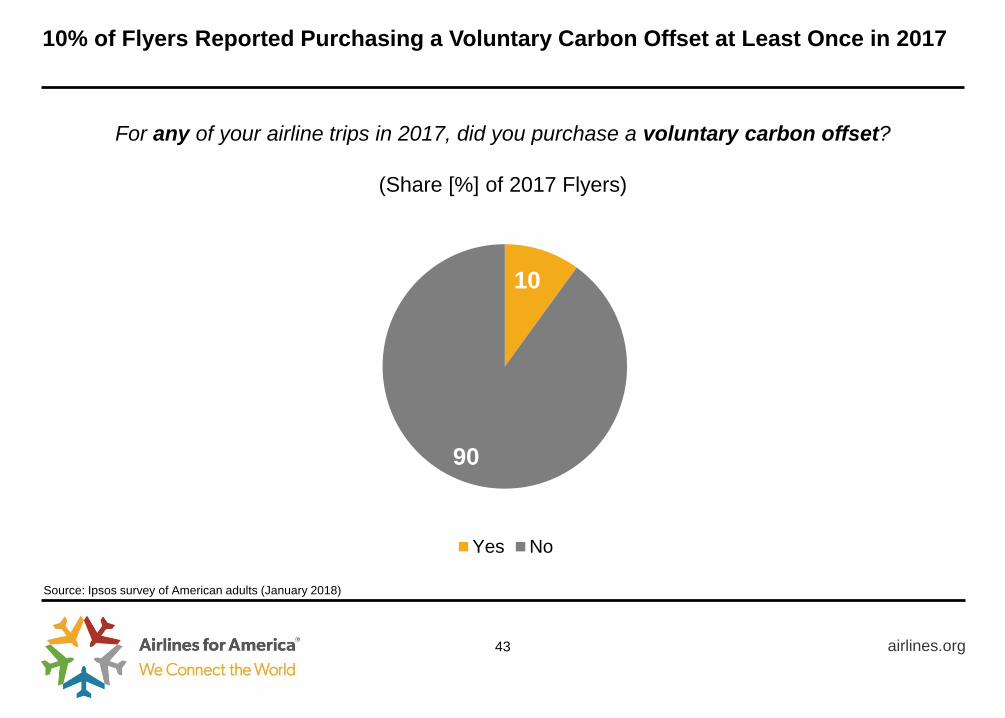
10% of Flyers Reported Purchasing a Voluntary Carbon Offset at Least Once in 2017
airlines.org
10
90
Yes No
43
For any of your airline trips in 2017, did you purchase a voluntary carbon offset?
(Share [%] of 2017 Flyers)
Source: Ipsos survey of American adults (January 2018)
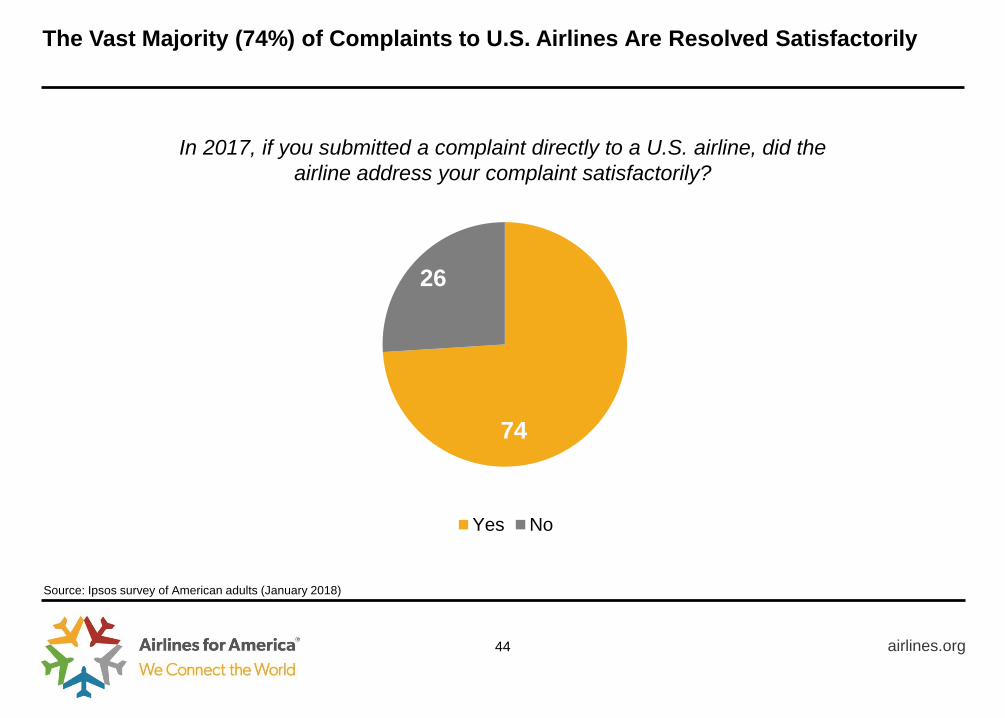
The Vast Majority (74%) of Complaints to U.S. Airlines Are Resolved Satisfactorily
airlines.org
74
26
Yes No
44
In 2017, if you submitted a complaint directly to a U.S. airline, did the
airline address your complaint satisfactorily?
Source: Ipsos survey of American adults (January 2018)
END OF APPENDIX
airlines.org 45