Air Pollution (1) - Texas A&M UniversityOzone and photochemical smog “Air pollution in the Los...
46
Air Pollution (1) CVEN 301 Introduction to Environmental Engineering Fall 2012 Dr. Qi Ying Department of Civil Engineering Introduction
Transcript of Air Pollution (1) - Texas A&M UniversityOzone and photochemical smog “Air pollution in the Los...

Air Pollution (1)
CVEN 301 Introduction to Environmental EngineeringFall 2012
Dr. Qi Ying
Department of Civil Engineering
Introduction
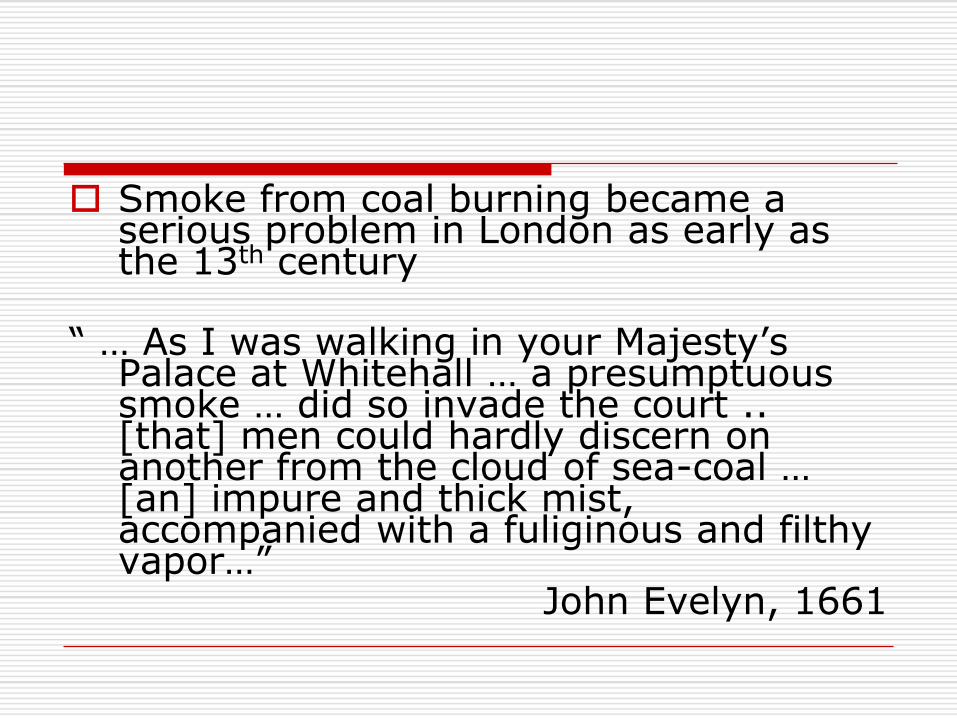
Smoke from coal burning became a serious problem in London as early as the 13th century
“ … As I was walking in your Majesty’s Palace at Whitehall … a presumptuous smoke … did so invade the court .. [that] men could hardly discern on another from the cloud of sea-coal … [an] impure and thick mist, accompanied with a fuliginous and filthy vapor…”
John Evelyn, 1661

“… whosoever found guilty of burning coal shall suffer the loss of his head.”
King Edward II, circa 1300 AD

Criteria Pollutants
(CO)
(P)
(NOx)
(SOx)
(O3)

Nonattainment Areas
Definition: A locality where air pollution levels persistently exceed NAAQS, or that contributes to ambient air quality in a nearby area that fails to meet standards

Maintenance areas are those geographic areas that had a history of nonattainment, but are now consistently meeting the NAAQS.

PARTICULATE MATTER (PM)


National Ambient Air Quality Standard = 15 µg/m3

Air Toxics (Hazardous Air Pollutants - HAPs)
Definition: Pollutants that are known or suspected to cause cancer or other serious health effects.
Example HAPs: Benzene, toluene, asbestos, metals such as mercury and chromium.
Exposure pathways: Breathing contaminated air. Eating contaminated food products. Drinking water contaminated by toxic air pollutants. Ingesting contaminated soil. Touching (making skin contact with) contaminated
soil, dust, or water.
Effects of Air Pollution
Material Deterioration
Vegetation damage
Adverse health effects on humans
Respiratory (asthma, lung cancer, etc)
Cardiovascular
Global climate change

London Smog
Smog = smoke + fog
Adverse effects due to soot particles + acid fog droplets
http://www.metoffice.gov.uk/education/secondary/students/smog.html
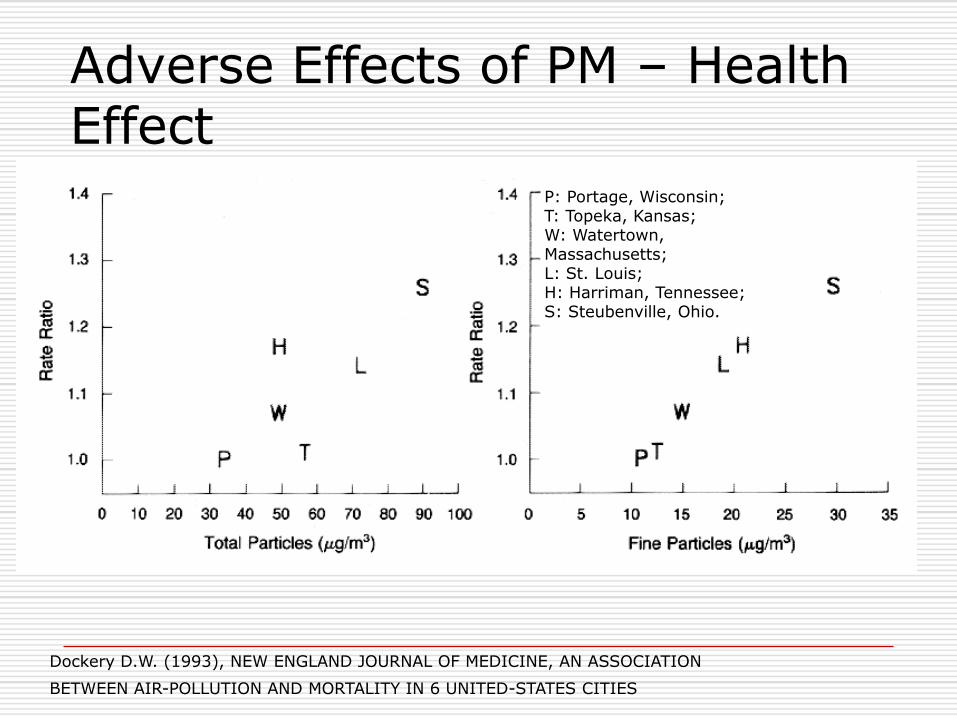
Adverse Effects of PM – Health Effect
Dockery D.W. (1993), NEW ENGLAND JOURNAL OF MEDICINE, AN ASSOCIATION
BETWEEN AIR-POLLUTION AND MORTALITY IN 6 UNITED-STATES CITIES
P: Portage, Wisconsin; T: Topeka, Kansas; W: Watertown, Massachusetts; L: St. Louis; H: Harriman, Tennessee;S: Steubenville, Ohio.

Adverse Effects of PM - Visibility
Same PM loading as Houston today(visual range = 10 miles)
Clear Day
(Simulated with WinHaze)

Smog over Burbank, CA

Air Pollution in Various Scales
Indoor Air Pollution (Home and work environment)
Local (near emission source)
Regional
“Smog” and “Photochemical Smog”
Global
Stratospheric Ozone Depletion
Global warming /climate change

GLOBAL ISSUES
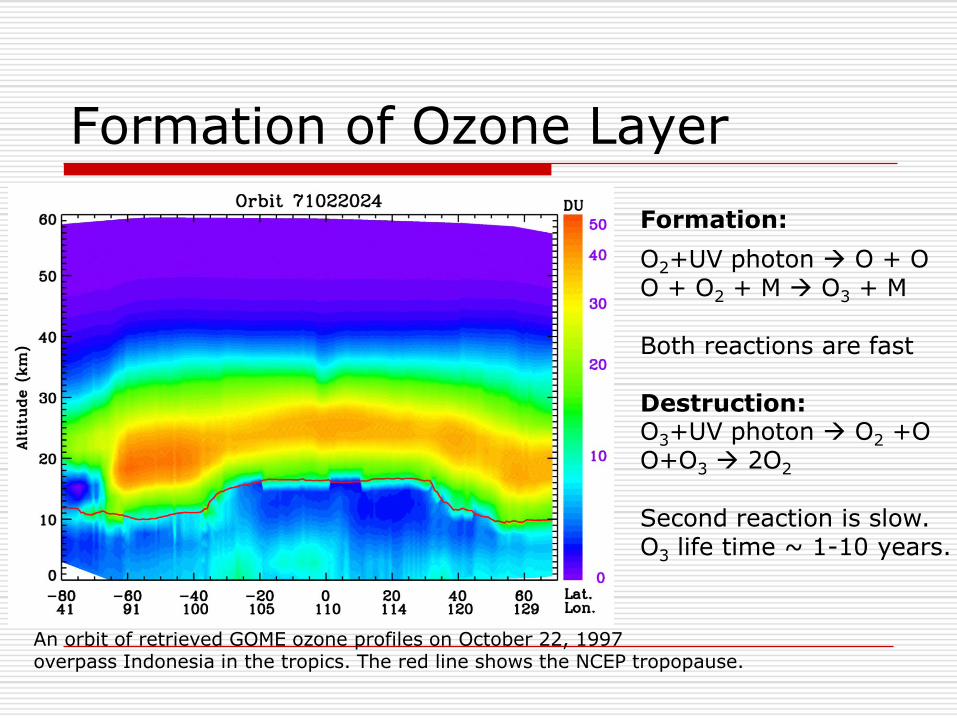
Formation of Ozone Layer
An orbit of retrieved GOME ozone profiles on October 22, 1997 overpass Indonesia in the tropics. The red line shows the NCEP tropopause.
O2+UV photon O + OO + O2 + M O3 + M
Both reactions are fast
Formation:
Destruction:O3+UV photon O2 +OO+O3 2O2
Second reaction is slow.O3 life time ~ 1-10 years.

Vertical Structure of the Atmosphere
Each layer is characterized by a uniform change in temperature with increasing altitude. In some layers there is an increase in temperature with altitude, whilst in others it decreases with increasing altitude. The top or boundary of each layer is denoted by a 'pause' where the temperature profile abruptly changes

Ozone depletion
In 1976, Rowland and Molina at UC Irvine proposed that long-lived organic halocarbon compounds used by the chemical industry may cause the destruction of ozone layer
The Chair of the Board of DuPont was quoted as saying that ozone depletion theory is "a science fiction tale...a load of rubbish...utter nonsense"

Ozone Depletion Mechanism
CFCs (Chlorofluorocarbon) have shown to be the major cause of ozone depletion.
They are non-reactive in the troposphere due to lack of UV
They gradually fill the troposphere and diffuse into the stratosphere
3 2
3 22
Cl O ClO O
ClO O Cl O
3 3 23ClO O O
UVCFCs Cl
Net:
Step1: Photolysis (splitting by sunlight) of CFC’s in the stratosphere
Step2: Catalytic destruction of ozone

However …

Largest ozone hole –September 2006
From September 21-30, 2006 the average area of the ozone hold was the largest ever observed. 11.4 million square miles
(Area of USA: 3.5 million square miles)
http://www.nasa.gov/vision/earth/lookingatearth/ozone_record.html

CFC and Montreal Protocol
CFCs are very stable (life time ~100 years) and have been used extensively before 1990 Refrigerants Propellants Solvents
The Montreal Protocol led to the phase out of CFCs by 2000
Recovery of ozone layer won’t happen until ~2050 due to the long life time of CFCs
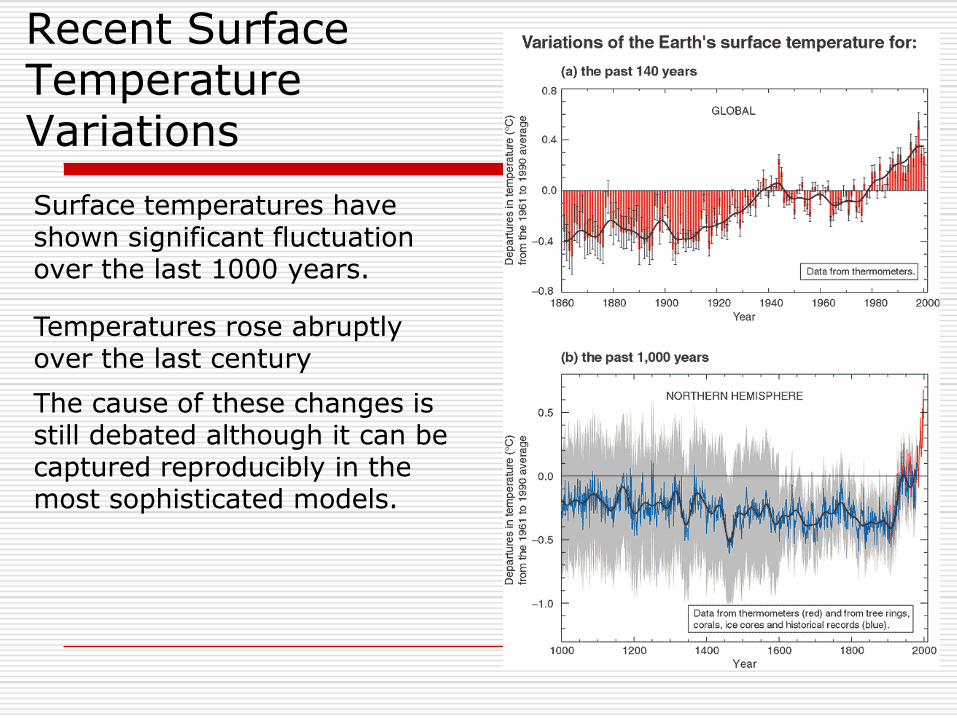
Recent Surface Temperature Variations
Surface temperatures have shown significant fluctuation over the last 1000 years.
Temperatures rose abruptly over the last century
The cause of these changes is still debated although it can be captured reproducibly in the most sophisticated models.

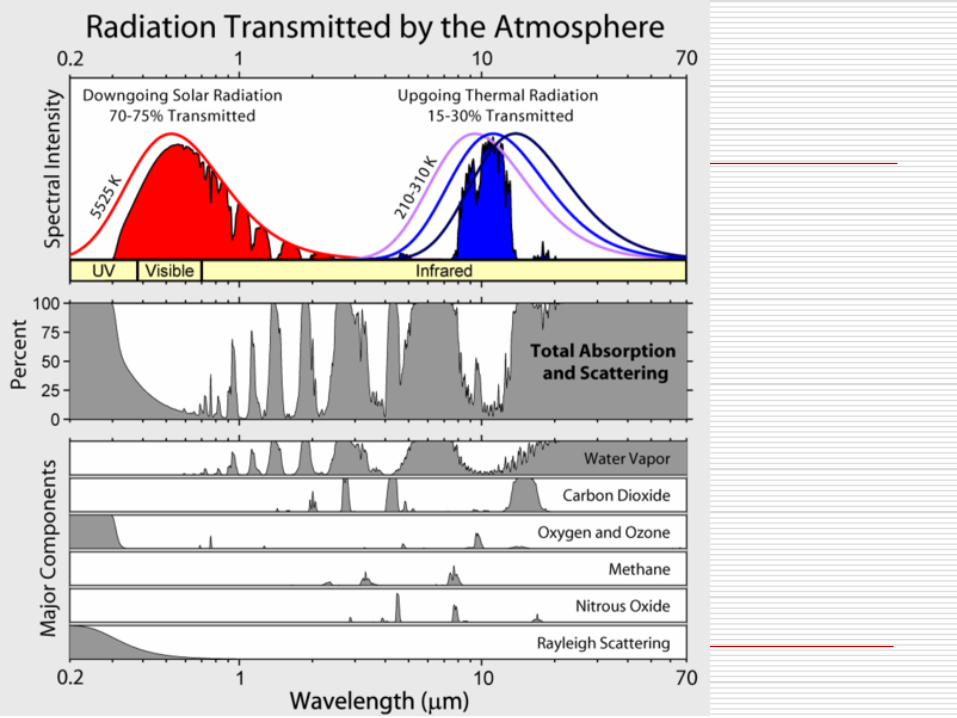

The Greenhouse Effect
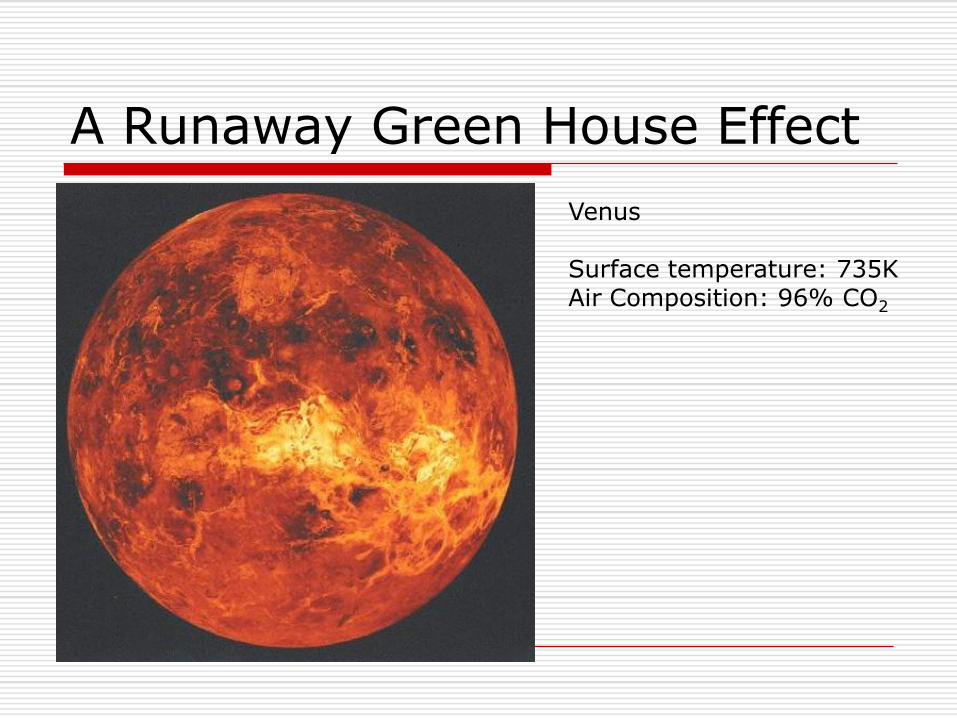
A Runaway Green House Effect
Venus
Surface temperature: 735KAir Composition: 96% CO2

Trend in Green House Gases

Global warming is only the beginning…
Sea level increase

Extreme Weather


The Kyoto Protocol
UN treaty entered into enforce February 2005
Developed countries to reduce their green house emission by an average of 5% below their 1990 level.
EU: 8%
US: 7%
Japan: 6%
United States signed the protocol but didn’t ratify it.

Participation in the Kyoto Protocol
Participation in the Kyoto Protocol: dark green indicates countries that have signed and ratified the treaty, yellow indicates those that have signed and hope to ratify it, and red indicates those that have signed but not ratified it.

REGIONAL AIR POLLUTION
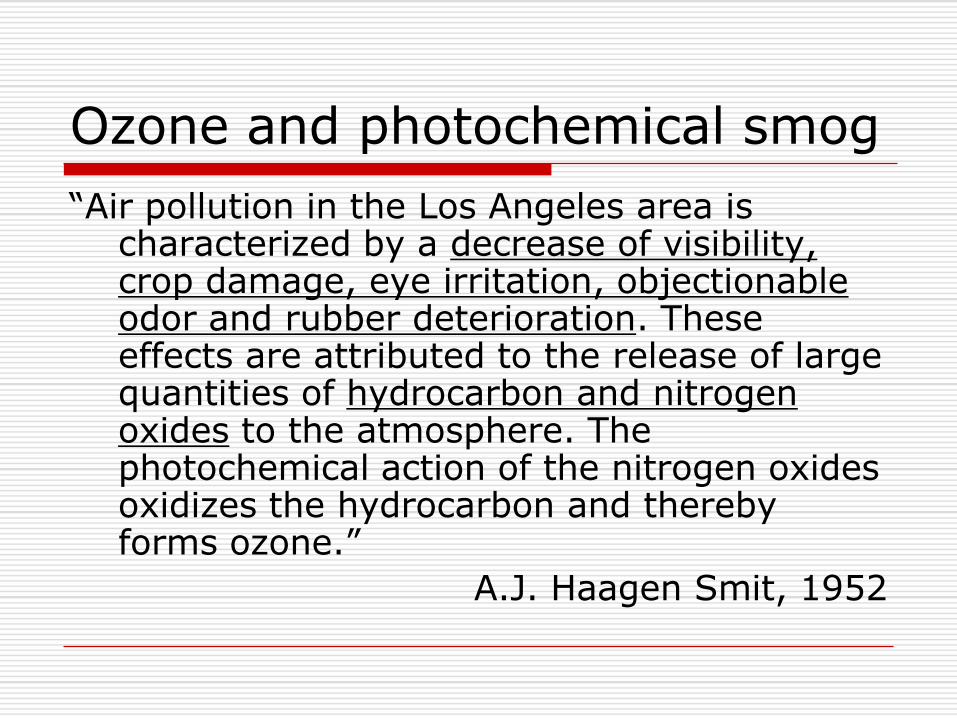
Ozone and photochemical smog
“Air pollution in the Los Angeles area is characterized by a decrease of visibility, crop damage, eye irritation, objectionable odor and rubber deterioration. These effects are attributed to the release of large quantities of hydrocarbon and nitrogen oxides to the atmosphere. The photochemical action of the nitrogen oxides oxidizes the hydrocarbon and thereby forms ozone.”
A.J. Haagen Smit, 1952
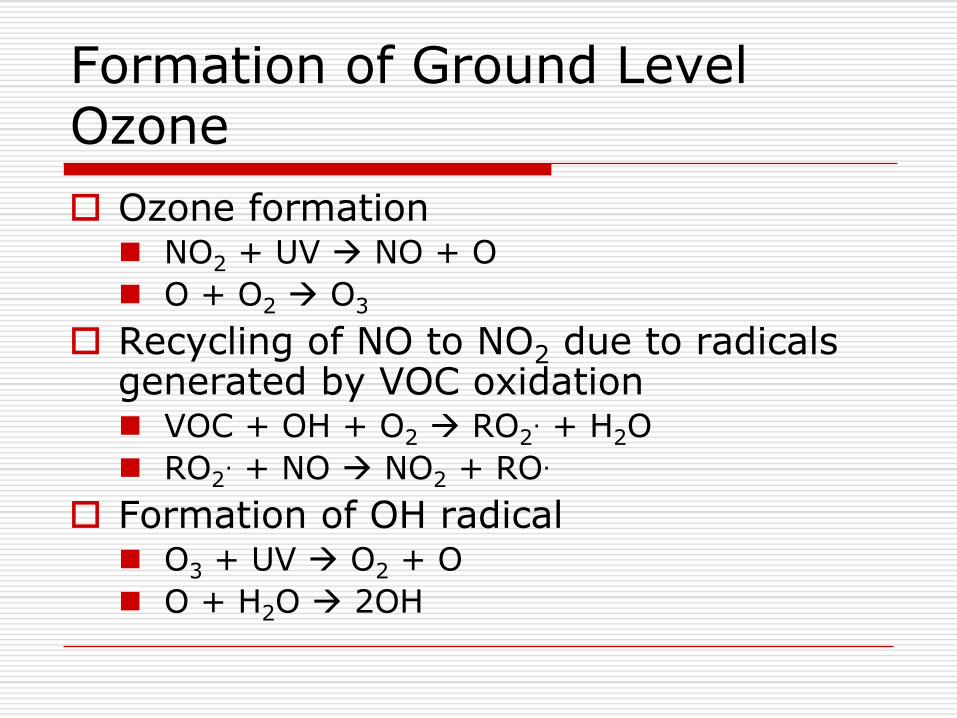
Formation of Ground Level Ozone
Ozone formation NO2 + UV NO + O
O + O2 O3
Recycling of NO to NO2 due to radicals generated by VOC oxidation VOC + OH + O2 RO2
. + H2O
RO2. + NO NO2 + RO.
Formation of OH radical O3 + UV O2 + O
O + H2O 2OH

Effects of photochemical smog
Ozone
Severe eye, nose and throat irritants
Lung damage
Plant damage, including leaf discoloration and cell collapse
A factor causing forest losses
NO2
Visibility reduction (brownish color)


Sources of VOC

http://www.tceq.state.tx.us/cgi-bin/compliance/monops/ozone_animation.pl

Calculate Pollutant Emissions
Emission Factor
Representative value that relates the quantity of a pollutant released to the atmosphere with an activity associated with the release of the pollutant.
E = A x EF x (1-ER/100)
E: emission rate
A: activity rate
ER: overall emission reduction efficiency

AP-42
EPA document AP-42 is a compilation of emissions factors
Lists uncontrolled emission factors
Also lists possible controls and their efficiency
Websitehttp://www.epa.gov/ttn/chief/ap42/index.html
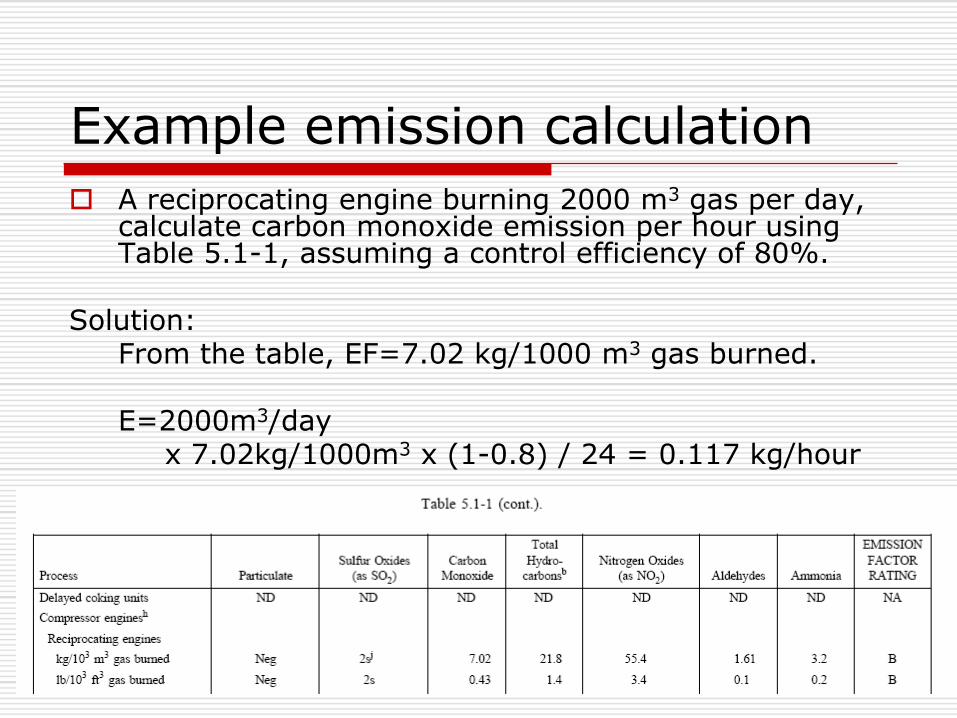
Example emission calculation
A reciprocating engine burning 2000 m3 gas per day, calculate carbon monoxide emission per hour using Table 5.1-1, assuming a control efficiency of 80%.
Solution:From the table, EF=7.02 kg/1000 m3 gas burned.
E=2000m3/day x 7.02kg/1000m3 x (1-0.8) / 24 = 0.117 kg/hour


![Urban Air Pollution Smog- Complex mixture of hydrocarbon, nitrogen oxides, ozone, and submicrometer particles. A useful reference point for Smog [O 3 ]>0.15.](https://static.fdocuments.in/doc/165x107/56649f525503460f94c7606c/urban-air-pollution-smog-complex-mixture-of-hydrocarbon-nitrogen-oxides.jpg)