History of significant air pollution eventszwang/atsc2000/Ch17.pdf · History of significant air...
14
1 Ch17 Air Pollution A thick layer of smoke and haze covers Santiago, Chile. History of significant air pollution events • Many of the worst air pollution episodes occurred in the last two centuries in London – key ingredients - calm winds, fog, smoke from coal burning – 1873 - 700 deaths – 1911- 1150 deaths – 1952 - over 4000 deaths • this last event prompted the parliament to pass a Clean Air Act in 1956 • other events around the world: – 1930 – Belgium’s Meuse Valley • pollution became trapped in a narrow valley - 600 people became ill, 63 were killed. • In the U.S., air quality degraded quickly shortly after the industrial revolution due to coal burning in the central and mid western U.S. – 1948 - Donora, PA in the Monongahela River Valley – five-day episode - 1000's became ill, 20 were killed • 1960s - NYC experience several dangerous episodes • 1960s-70s - Los Angeles - increase in industry and automobile usage led to many pollution episodes • The above events led to passing the Clean Air Act of 1970 (updated in 1977 and again in 1990) – empowered the federal government to set emission standards that each state would have to meet • Even the most remote areas are affected by air pollution
Transcript of History of significant air pollution eventszwang/atsc2000/Ch17.pdf · History of significant air...

1
Ch17 Air Pollution
A thick layer of smoke and haze covers Santiago, Chile.
History of significant air pollution events• Many of the worst air pollution episodes occurred in the last two centuries in
London – key ingredients - calm winds, fog, smoke from coal burning – 1873 - 700 deaths – 1911- 1150 deaths – 1952 - over 4000 deaths
• this last event prompted the parliament to pass a Clean Air Act in 1956 • other events around the world:
– 1930 – Belgium’s Meuse Valley • pollution became trapped in a narrow valley - 600 people became ill, 63 were killed.
• In the U.S., air quality degraded quickly shortly after the industrial revolution due to coal burning in the central and mid western U.S. – 1948 - Donora, PA in the Monongahela River Valley – five-day episode - 1000's became ill, 20 were killed
• 1960s - NYC experience several dangerous episodes • 1960s-70s - Los Angeles - increase in industry and automobile usage led to
many pollution episodes • The above events led to passing the Clean Air Act of 1970 (updated in
1977 and again in 1990) – empowered the federal government to set emission standards that each state
would have to meet • Even the most remote areas are affected by air pollution
2
Primary Pollutants• Injected into the atmosphere directly..... examples include:• Carbon monoxide (CO)
– odorless, colorless, poisonous gas – created by incomplete combustion (especially bad with older cars) – generates headaches, drowsiness, fatigue, can result in death
• Oxides of nitrogen (NOx, NO) – NO - nitric oxide – emitted directly by autos, industry
• Sulfur oxides (SOx) – SO2 - sulfur dioxide – produced largely through coal burning – responsible for acid rain problem
• Volatile organic compounds (VOCs) – highly reactive organic compounds – release through incomplete combustion and industrial sources
• Particulate matter (dust, ash, salt particles) – bad for your lungs
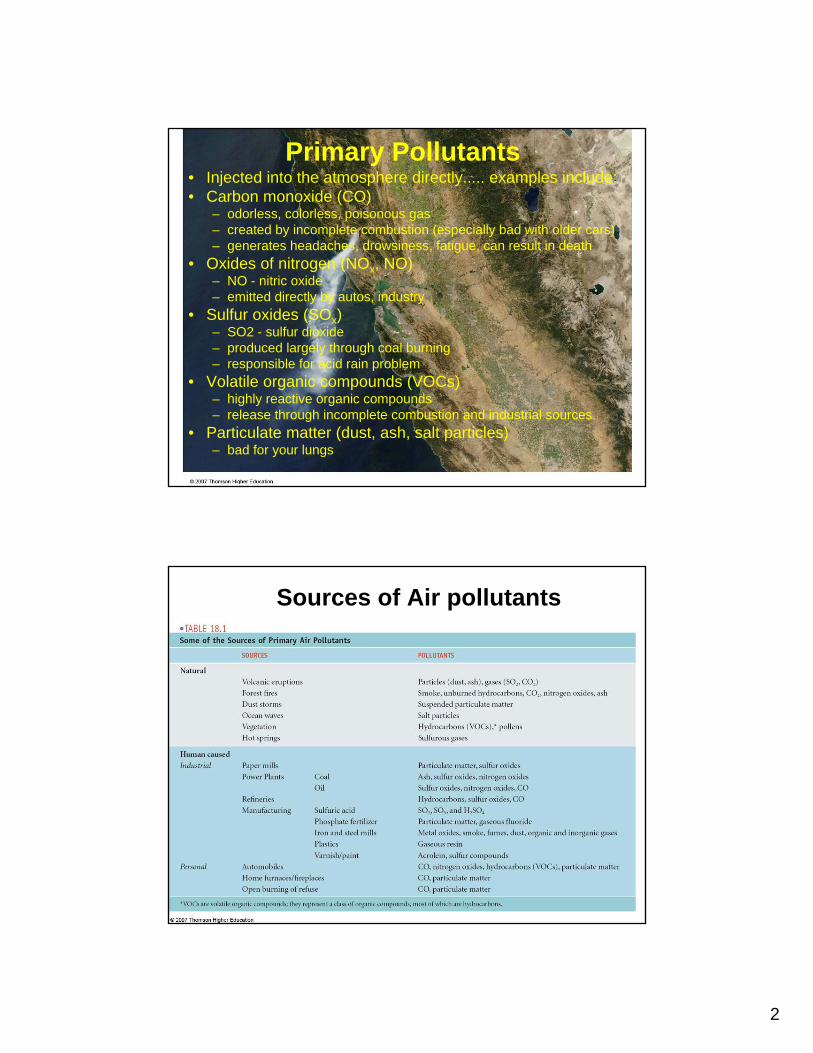
Sources of Air pollutants
3
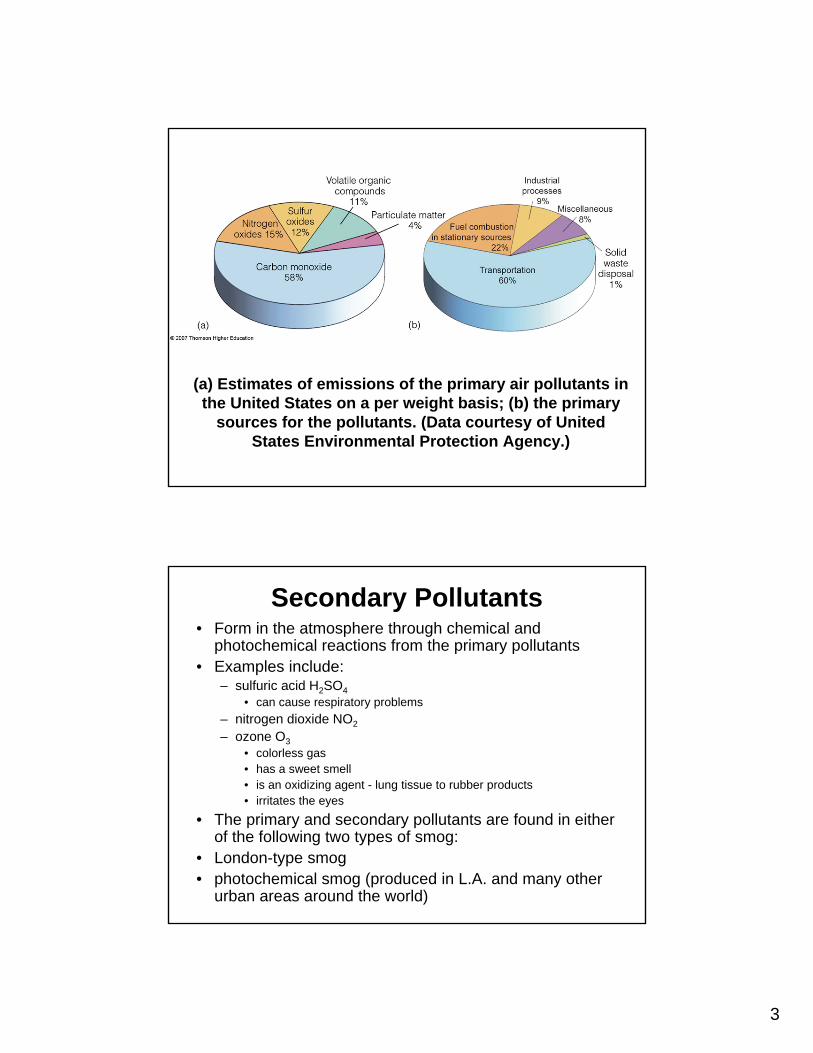
(a) Estimates of emissions of the primary air pollutants in the United States on a per weight basis; (b) the primary
sources for the pollutants. (Data courtesy of United States Environmental Protection Agency.)
Secondary Pollutants• Form in the atmosphere through chemical and
photochemical reactions from the primary pollutants • Examples include:
– sulfuric acid H2SO4• can cause respiratory problems
– nitrogen dioxide NO2– ozone O3
• colorless gas • has a sweet smell • is an oxidizing agent - lung tissue to rubber products • irritates the eyes
• The primary and secondary pollutants are found in either of the following two types of smog:
• London-type smog • photochemical smog (produced in L.A. and many other
urban areas around the world)
4
Smog = smoke + fog• London Smog - This type of smog comes from coal smoke
combining with the water vapor and liquid water in cool, humid or foggy air.
• L.A. smog has been identified as coming from auto exhaust, primarily (we will see later that there is a significant "stationary" source).
• London smog: – requires humid/foggy, stagnant air – have lots of coal burning – SO2 + H20 -> H2SO4
• LA. smog: – requires clear, sunny skies (since L.A. photochemical smog requires
sunlight for at one of the key chemical reactions). – NOx + ROG + sunlight --> O3 + NO2– ROG are reactive organic gases from unburned gasoline – NOx are oxides of nitrogen
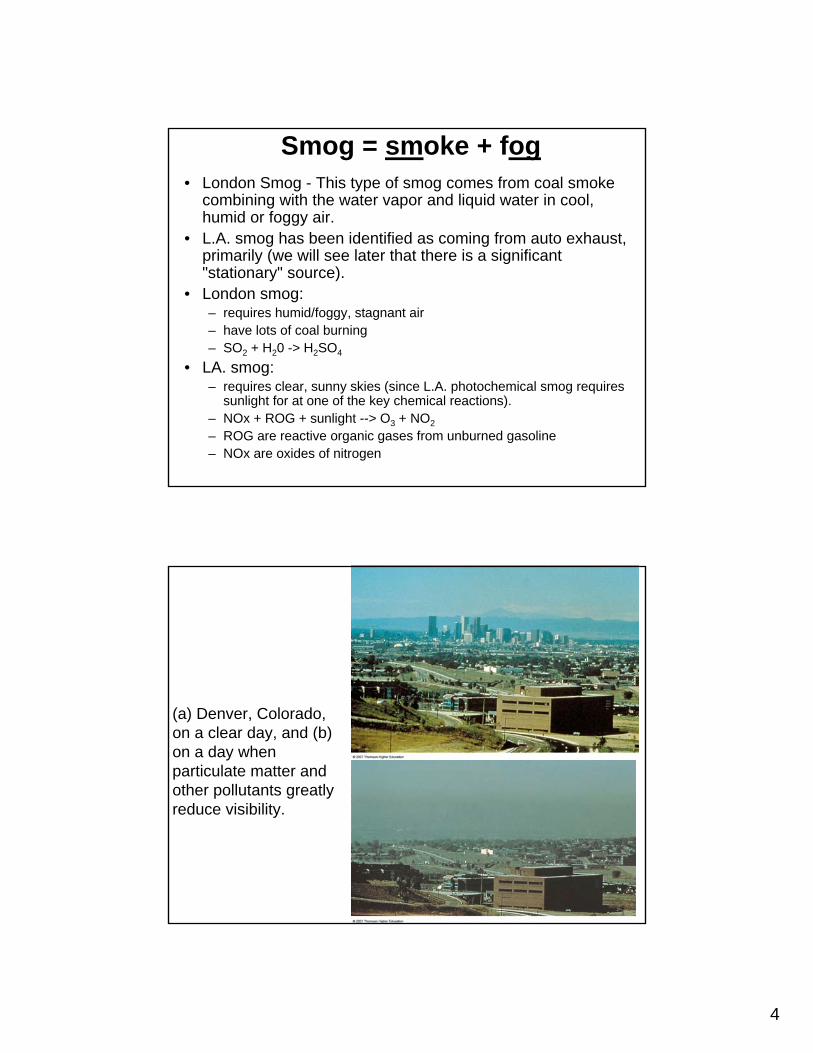
(a) Denver, Colorado, on a clear day, and (b) on a day when particulate matter and other pollutants greatly reduce visibility.

5
A thick haze about 200 km wide and about 600 km long covers a portion of the East China Sea on March 4, 1996. The haze is probably a mixture of
industrial air pollution, dust, and smoke.
Cumulus clouds and a thunderstorm rise above the thick layer of haze that frequently covers the eastern half of the United States on humid summer days.

6
•Ozone in the boundary layer causes adverse health effectsNO2 + solar radiation NO +O
O2+O +M O3
Average hourly concentrations of ozone measured at six major cities over a two-year period.
Ozone in the Stratosphere• Ozone in the stratosphere, however,
in necessary for our survival – absorbs UV radiation before it
reaches the ground – maximum concentrations of about 12
ppm are at about 25 km AGL • Anticipated health effects due to
ozone layer depletion:– increase in skin cancer cases – increase in eye cataracts and sun
burns – suppression of the human immune
system – an adverse impact on crops and
animals due to increased UV radiation reaching the ground
– reduction in the growth of ocean phytoplankton
– cooling of the stratosphere that could alter stratospheric wind patterns, possibly affecting the production (and destruction) of ozone.
7
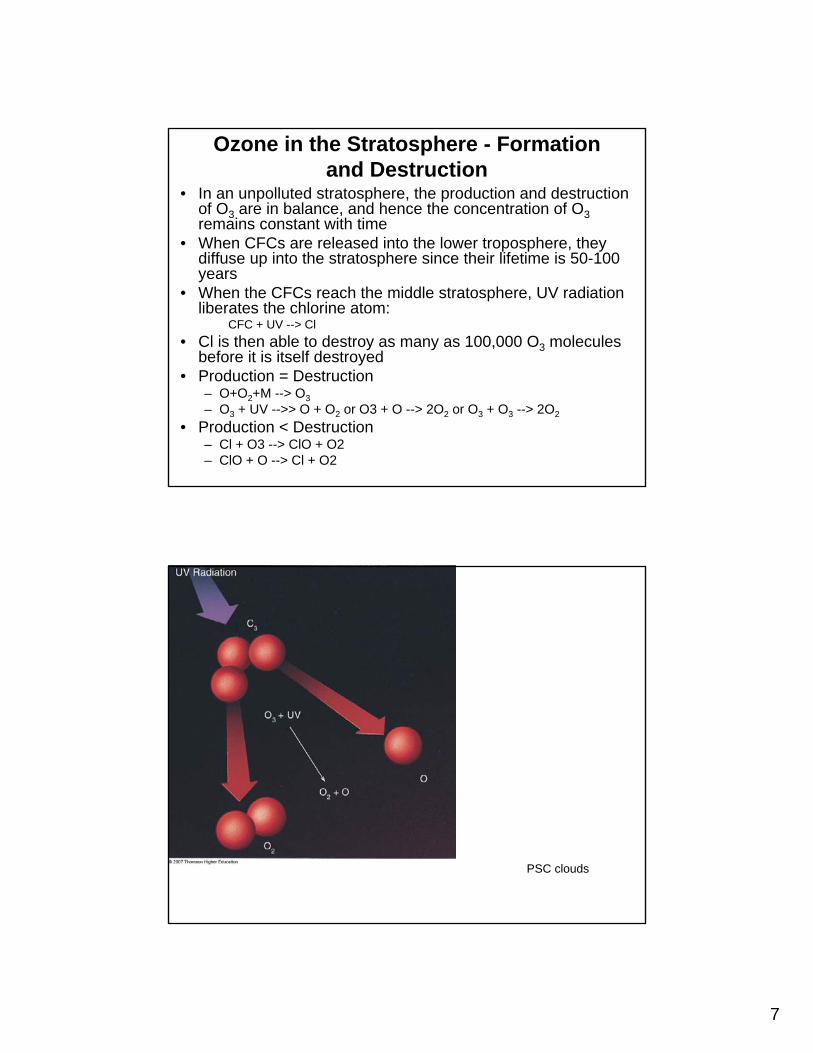
Ozone in the Stratosphere - Formation and Destruction
• In an unpolluted stratosphere, the production and destruction of O3 are in balance, and hence the concentration of O3remains constant with time
• When CFCs are released into the lower troposphere, they diffuse up into the stratosphere since their lifetime is 50-100 years
• When the CFCs reach the middle stratosphere, UV radiation liberates the chlorine atom:
CFC + UV --> Cl• Cl is then able to destroy as many as 100,000 O3 molecules
before it is itself destroyed • Production = Destruction
– O+O2+M --> O3– O3 + UV -->> O + O2 or O3 + O --> 2O2 or O3 + O3 --> 2O2
• Production < Destruction– Cl + O3 --> ClO + O2– ClO + O --> Cl + O2
PSC clouds
8
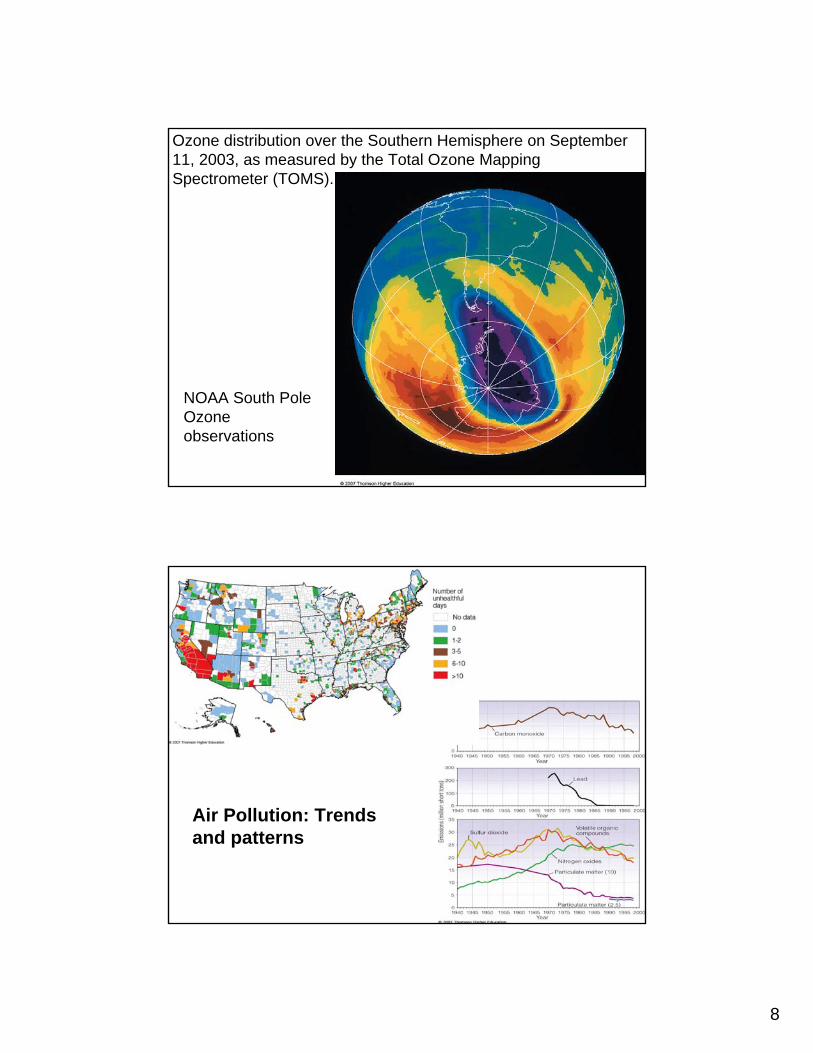
Ozone distribution over the Southern Hemisphere on September 11, 2003, as measured by the Total Ozone Mapping Spectrometer (TOMS).
NOAA South Pole Ozone observations
Air Pollution: Trends and patterns

9
The AQI includes the pollutants carbon monoxide, sulfur dioxide,nitrogen dioxide, particulate matter, and ozone. When the
pollutant’s value is the same as the primary ambient air quality standard, the pollutant is assigned an AQI number of 100

10
The number of days ozone exceeded the 1-hour federal standard and maximum 1-hour ozone concentration (ppm) for Los Angeles and surrounding areas in the South Coast air basin.
Factors Affect Air Quality• The role of the Wind
– The greater the wind speeds and mixing heights the lower the smog concentration
– In addition, the direction of the wind will control the areas where smog is transported
11
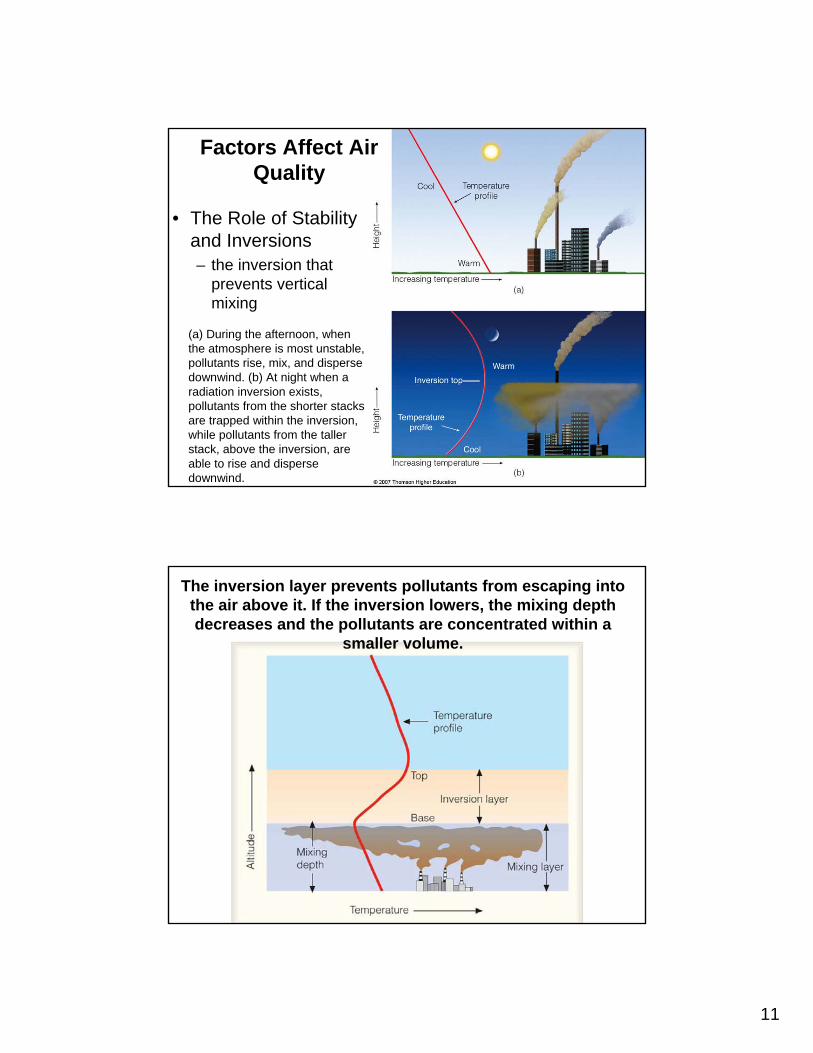
Factors Affect Air Quality
• The Role of Stability and Inversions– the inversion that
prevents vertical mixing
(a) During the afternoon, when the atmosphere is most unstable, pollutants rise, mix, and disperse downwind. (b) At night when a radiation inversion exists, pollutants from the shorter stacks are trapped within the inversion, while pollutants from the taller stack, above the inversion, are able to rise and disperse downwind.
The inversion layer prevents pollutants from escaping into the air above it. If the inversion lowers, the mixing depth decreases and the pollutants are concentrated within a
smaller volume.
12
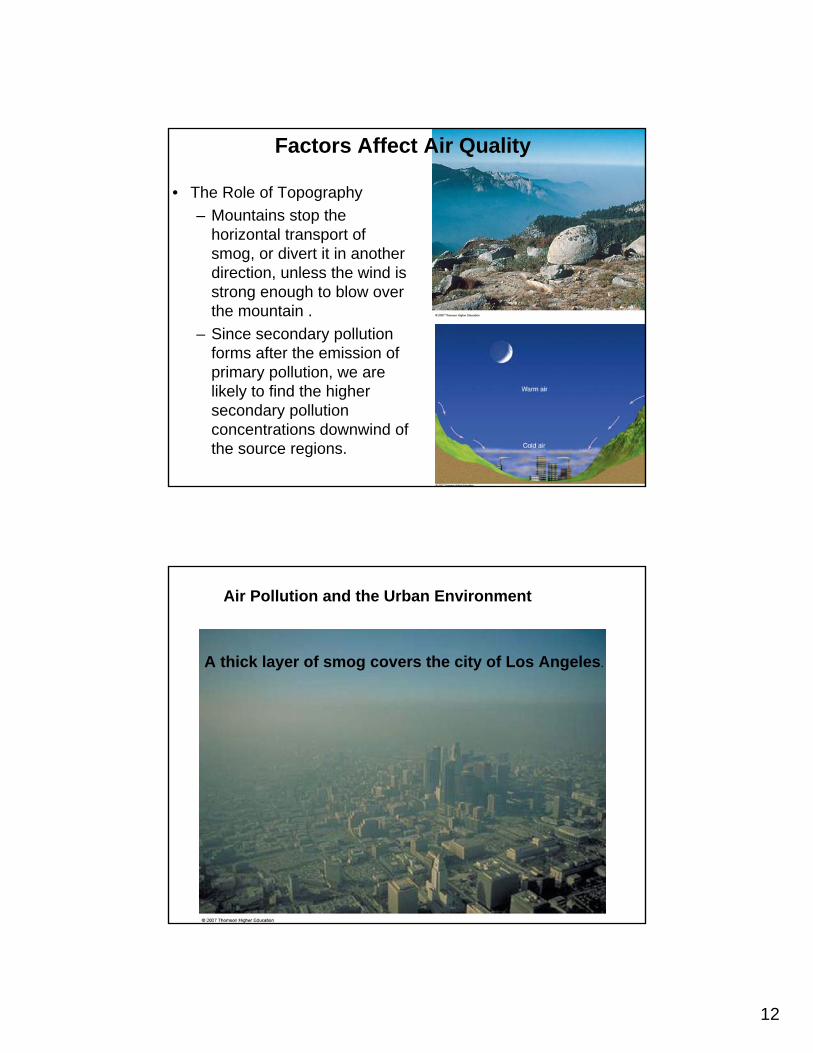
Factors Affect Air Quality
• The Role of Topography– Mountains stop the
horizontal transport of smog, or divert it in another direction, unless the wind is strong enough to blow over the mountain .
– Since secondary pollution forms after the emission of primary pollution, we are likely to find the higher secondary pollution concentrations downwind of the source regions.
A thick layer of smog covers the city of Los Angeles.
Air Pollution and the Urban Environment
13
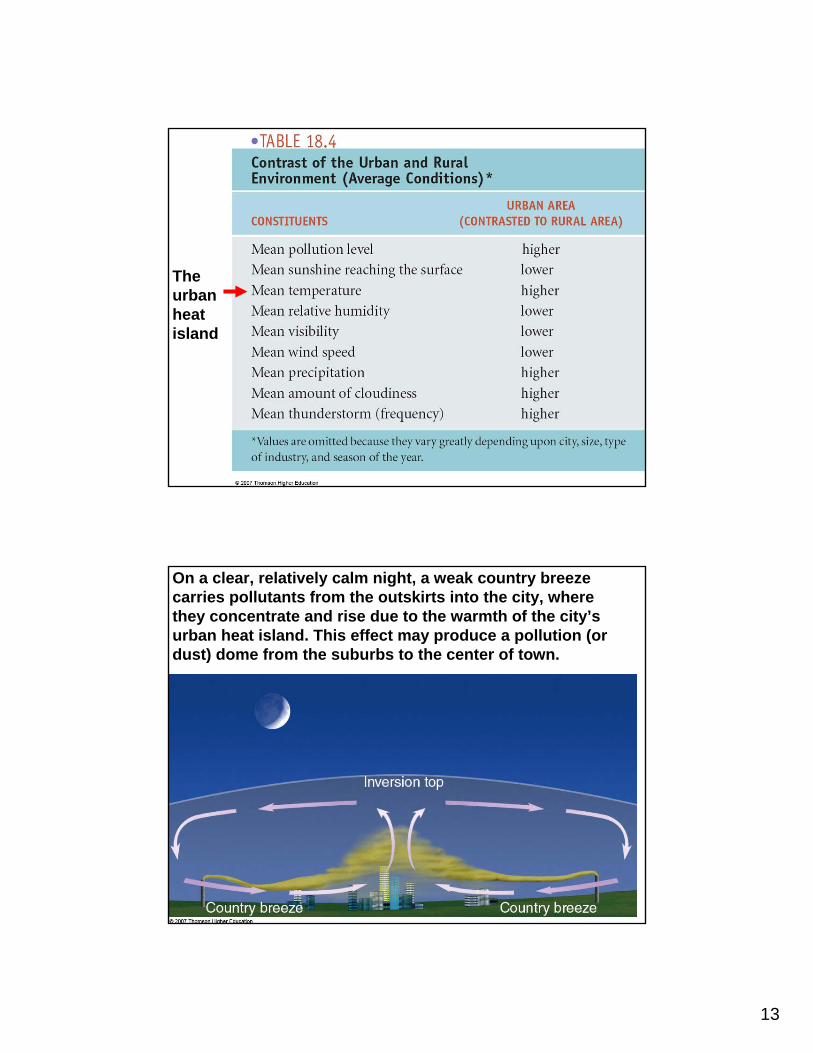
The urban heat island
On a clear, relatively calm night, a weak country breeze carries pollutants from the outskirts into the city, where they concentrate and rise due to the warmth of the city’s urban heat island. This effect may produce a pollution (or dust) dome from the suburbs to the center of town.

14
Acid Rain and deposition• Within clouds (including fog) sulfur
dioxide (SO2) and oxides of nitrogen (NOx) can form acidic particles when they react with water: – SO2 + H2O --> H2SO4 (sulfuric acid) – NOx + H2O --> HNO3 (nitric acid)
• Problem is worse downstream of the source
• Affects: – trees – lakes – architecture
• It's a world-wide problem: – Germany – China – Italy – Canada
The effects of acid fog in the Great Smoky Mountains of Tennessee.
Annual average value of pH in precipitation weighted by the amount of precipitation in the United States and Canada. (After U.S. and Canada Work Group No. 2.)