AGRICULTURAL SITUATION IN INDIA
56
APRIL, 2016 FARM SECTOR NEWS ARTICLES GENERAL SURVEY OF AGRICULTURE Watershed Approach for Sustainable Management of Natural Resources and Enhancing Rural Livelihood Security Soybean Sector in Maharashtra: Bring Hope, Not despair Horticultural Crops in India- Growth, instabilityand Decomposition Approach Advancements in Dairy Feed Industry - An Alternative way to Overcome The scarcity of Fodder in India AGRO-ECONOMIC RESEARCH Productivity of Horticulture Crops in North-East and Himalayan States Baseline Data on Area, Production and COMMODITY REVIEWS Foodgrains Commercial Crops TRENDS IN AGRICULTURE Wages & Prices AGRICULTURAL SITUATION IN INDIA AGRICULTURAL SITUATION IN INDIA
Transcript of AGRICULTURAL SITUATION IN INDIA
APRIL, 2016
FARM SECTOR NEWS
ARTICLES
GENERAL SURVEY OF AGRICULTURE
Watershed Approach for SustainableManagement of Natural Resources andEnhancing Rural Livelihood Security
Soybean Sector in Maharashtra:Bring Hope, Not despair
Horticultural Crops inIndia- Growth, instabilityandDecomposition Approach
Advancements in Dairy FeedIndustry - An Alternative way toOvercome The scarcity ofFodder in India
AGRO-ECONOMIC RESEARCH
Productivity of Horticulture Crops inNorth-East and Himalayan States
Baseline Data on Area, Production and
COMMODITY REVIEWSFoodgrainsCommercial Crops
TRENDS IN AGRICULTUREWages & Prices
AGRICULTURAL
SITUATION IN INDIA
AGRICULTURAL
SITUATION IN INDIA

Agricultural Situationin India
VOL. LXXIII April, 2016 No.1
CONTENTS
PAGES
Editorial Board
ChairmanSangeeta Verma
EditorP. C. Bodh
Addl. Economic AdviserYogita Swaroop
Economic OfficerProsenjit Das
Officials Associated in Preparation of thePublication
D.K. Gaur — Tech. Asstt.S.K. Kaushal — Tech. Asstt. (Printing)
Uma Rani — Tech. Asstt. (Printing)V.M. Shobhana — P.A.
Cover Design By:Yogeshwari Tailor— Asstt. Graph
Publication DivisionDIRECTORATE OF ECONOMICS
AND STATISTICS
DEPARTMENT OF AGRICULTURE, COOPERATION & FARMERS WELFARE
MINISTRY OF AGRICULTURE & FARMERS
WELFARE
GOVERNMENT OF INDIA
C-1, HUTMENTS, DALHOUSIE ROAD,NEW DELHI-110 011PHONE : 23012669
(Email: [email protected])
SubscriptionInland Foreign
Single Copy : `40.00 £ 2.9 or $ 4.5Annual : `400.00 £ 29 or $ 45
Available fromThe Controller of Publications,
Ministry of Urban Development,Deptt. of Publications,
Publications Complex (Behind Old Secretariat),Civil Lines, Delhi-110 054.
Phone : 23817823, 23819689, 23813761,23813762, 23813764, 23813765
(Email: [email protected])
©Articles Published in the Journal cannot bereproduced in any form without the permissionof Economic and Statistical Adviser.
FARM SECTOR NEWS 1
GENERAL SURVEY OF AGRICULTURE 10
ARTICLES
Watershed Approach for Sustainable Management of Natural 13Resources and Enhancing Rural Livelihood Security-Hari OmSharma, Sunil Nahatkar & Deepak Rathi
Soyabean Sector in Maharashtra: Bring Hope, Not Distress 18Jayanti Kajale, Sangeeta Shroff and Naresh Bodkhe
Horticultural Crops in India- Growth, Instability and Decomposition 26Approach-Punit Kumar Agarwal, Pushpa Yadav, Santosh kumarand Divya Pandey
Advancements in Dairy Feed Industry- An Alternative Way to 31Overcome the Scarcity of Fodder in India-Kashish and VikrantDhawan
AGRO-ECONOMIC RESEARCH
Baseline Data on Area, Production and Productivity of 37Horticultural Crops in North-East and Himalayan States- A Studyin Assam-Dr. Moromi Gogoi and Debajit Borah--AERC for North-East India, Assam Agricultural University, Jorhat, Assam
COMMODITY REVIEWS
Foodgrains 42 COMMERCIAL CROPS :
Oilseeds and Edible oils 44Fruits and Vegetables 44Potato 44Onion 44Condiments and Spices 44Raw Cotton 44
Raw Jute 44

The Journal is brought out by the Directorateof Economics and Statistics, Ministry ofAgriculture & Farmers Welfare, it aims atpresenting an integrated picture of the foodand agricultural situation in india on monthto month basis. The views expressed are notnecessarily those of the Government of India.
NOTE TO CONTRIBUTORS
Articles on the State of Indian Agriculture andallied sectors are accepted for publication in theDirectorate of Economics & Statistics,Department of Agriculture, Cooperation &Farmers Welfare’s monthly Journal “AgriculturalSituation in India”. The Journal intends to providea forum for scholarly work and also to promotetechnical competence for research in agriculturaland allied subjects. Good articles in Hard Copyas well as Soft Copy ([email protected])in MS Word, not exceeding five thounsand words,may be sent in duplicate, typed in double spaceon one side of foolscap paper in Times NewRoman font size 12, addressed to the Editor,Publication Division, Directorate of Economicsand Statistics, M/o Agriculture & Farmers Welfare,C-1, Hutments Dalhousie Road, New Delhi-110011 along with a declaration by the author(s) thatthe article has neither been published norsubmitted for publication elsewhere. The author(s) should furnish their e-mail address, Phone No.and their permanent address only on theforwarding letter so as to maintain anonymity ofthe author while seeking comments of the refereeson the suitability of the article for publication.
Although authors are solely responsible forthe factual accuracy and the opinion expressed intheir articles, the Editorial Board of the Journal,reserves the right to edit, amend and delete anyportion of the article with a view to making itmore presentable or to reject any article, if notfound suitable. Articles which are not foundsuitable will not be returned unless accompaniedby a self-addressed and stamped envelope. Nocorrespondence will be entertained on the articlesrejected by the Editorial Board.
An honorarium of Rs. 2000/- per article ofatleast 2000 words for the regular issue andRs. 2500/- per article of at least 2500 words forthe Special/Annual issue is paid by the Directorateof Economics & Statistics to the authors of thearticles accepted for the Journal.
Disclaimer: Views expressed in the articles andstudies are of the authors only and may notnecessarily represent those of Government ofIndia.
Soft copy of the journal may be seen in PDF at thefollowing URL : eands.dacnet.nic.in/publication.htm
We are pleased to inform that our monthly journalAgricultural Situation in India has been accredited bythe National Academy of Agricultural Sciences (NAAS)and it has been given a score of 2.76 out of 6. The scoreis effective from January, 2016 onwards. The score maybe seen in the following website: www.naasindia.org
STATISTICAL TABLESPAGES
Wages1. Daily Agricultural Wages in Some States—Category-wise. 46
1.1. Daily Agricultural Wages in Some States—Operation-wise. 47
Prices
2. Wholesale Prices of Certain Important Agricultural 49Commodities and Animal Husbandry Products at SelectedCentres in India.
3. Month-end Wholesale Prices of Some Important Agricultural 51 Commodities in International Market during the year 2016.
Crop Production
4. Sowing and Harvesting Operations Normally in Progress 52during May, 2016.
Abbreviations usedN.A. — Not Available.N.Q. — Not Quoted.N.T. — No Transactions.N.S. — No Supply/No Stock.R. — Revised.M.C. — Market Closed.N.R. — Not Reported.Neg. — Negligible.Kg. — Kilogram.Q. — Quintal.(P) — Provisional.Plus (+) indicates surplus or increase.Minus (–) indicates deficit or decrease.

April, 2016 1
Farm Sector News
Main Features of the Agriculture Budget 2016-17
The budget to make the farmers income double Tremendous increase in agriculture and irrigation budget
This is a budget dedicated to villages, the poor and thefarmers. A new dimension has been added to agriculturalsector by fresh focus on progress and welfare of farmers.A tremendous enhancement has been made in the budgetrelated to agriculture and irrigation.
Main focus of the budget is to revitalize the ruraleconomy through the enhancement of employmentopportunities for the rural sector and also to make thefarmers income double.
The budgetary provision for Agriculture and FarmersWelfare Ministry for 2016-2017 is a sum of 35,984 crorerupees. Government aims to make the farmers income asdouble in the forthcoming five years.
Main Features of the Budget
Irrigation
Under the budgetary provisions, Pradhan Mantri KrishiSinchai Yojana is to be implemented in mission mode and28.5 lakh hectare area will be brought under irrigation forwhich a sum of rupees 5,717 crore has been earmarked forthe year 2016-2017. The Ministry of Agriculture andFarmers Welfare has obtained 2,340 crore rupees in placeof 1,550 crore rupees as compared to the year 2015-2016and it is an enhancement of 51%. Besides, this year, throughNABARD, it has been decided to create a fund of rupees20,000 crore for irrigation and expeditious implementationof 89 irrigation projects lying incomplete for a long periodunder Macro And Mild Irrigation Scheme (AIBP) it willfacilitate to irrigate an area of 80.6 lakh hectare. For thispurpose, a sum of rupees 86,500 crore will be required inthe forthcoming five years. Out of them, during the year2016-2017, a sum of 12,517 crore rupees will be incurredby Ministry of Water Resources to operate 23 schemes.Alongwith, under MANREGA, in rainfed area, 5 lakh farmponds and wells will also be arranged.
Incentives have been provided in the Agriculturebudget for pulse production through a programme of lesswater incentive cropping Rs. 500 corers have beensanctioned under the National Food Security Mission toincrease productivity and production of pulses. Rs. 900corers have been allocated under the price stabilization
fund for creating the buffer stock of pulses. The budgetproposes to increase the scope of minimum support priceoperations for pulses for long terms through an increase inthe decentralized procurement of pulses an also to take uponline procurement through Food Corporation of India.
Krishi Development Scheme
Under Soil Health Card and Soil Health Management, asum of 362 crore rupees has been allocated as comparedto 142 crore rupees in the year 2015-2016 which is soleincrease of 155%. The Agriculture Ministry is committedto fulfill its objective for distributing SoilHealth Card forall 14 crore farmers in the country by March, 2017.Alongwith 2000 model retail centres of fertilizerscompanies will be opened in the forthcoming three years.Also soil andseeds tests facilities will be provided. All the643 agriculture Agro Science Centres,
Agricultural Universities and Institutes of ICAR in thecountry will be comprised of soil test facilities and minilabs. It has been decided to impart 80% subsidy for settingup 2000 mini labs for farmers’ clusters.
To improve the organic value chain for North EasternStates, a sum of rupees 400 crore has been allocated in2015-2016 for the forthcoming three years meant for thedevelopment of North Eastern States and organic valuechains. This scheme has been initiated with the allocationof rupees 125 crore in 2015-2016 which will pave the wayfor the growth of Organic Agriculture Scheme. Theremaining 275 crore rupees will meet the needs of theprojects being conducted in the next year (2016-2017 and2017-2018). Alongwith 10 lakh compost ditches will beprepared for organic manure under MANREGA.
Conventional agriculture development scheme fordevelopment of organic farming is important and it is acomprehensive organic farming scheme with the totalallocation of Rs. 297 cr from the Central Government andit has increased 19 % from the allocation of Rs. 250 cr forthe year 2015-16.
The Integrated Agriculture Marketing Scheme:Additional resources has been provided during the currentbudget for increasing the Rural storage. The allocation hasbeen increased from Rs. 750 cr in 2015-16 to Rs. 788 cr incurrent year that is an increase of 5 %.
Under National Agriculture and Technology Mission(NMET), the Government is giving requisite importance
Source: www.pib.nic.in
2 Agricultural Situation in India
for technology transfer by giving assistance in strengtheningof Agriculture Extension Machinery of the StateGovernments. For this mission, the budgetary allocationin 2015-16 is Rs. 598 cr. Apart from this, Rs. 40 cr hasbeen allocated for strengthening of agriculture informationsystem.
Under National Food Security Mission, thegovernment is committed to increasing the productivity ofvarious crops and it may be seen from the budgetaryallocation for food security of the country is Rs. 1700 cr.has been allocated in the current year as against Rs. 1137cr. In 2015-16.
Under National Sustainable Agriculture Mission(NMSA), the government is committed to encouragesustainable agriculture from the budgetary allocation. Inthe year 2015-16 an allocation of Rs. 730 cr. was made,now it is Rs. 1062 cr. it is an increase of 45%.
Market Reforms through National Agriculture Market(NAM) – The government understand that marketing is veryimportant in agriculture secter and the government iscommitted to the establishment of national agriculturemarket. Reforms have been made in APMC Act in 12 statesand excluding Punjab. All the States have given concurrences.The government has launched the scheme on the 14th April,2016 and till September, 2016, 200 markets will be coveredand till March, 2017 another 200 markets will be covered. itis targeted to cover 585 APMC in country till March2018.Credit flow has been increased to Rs. 9 lakh crorewhich was Rs. 8.5 lakh crore in the 2015-16.
In order to reduce the burden of debt payment onfarmers, Rs. 15,000 crore has been provided in budgetestimate in 2016-17 as interest assistance. The allocationunder this head was Rs. 13,000 crore in 2015-16.
An allocation of Rs. 5500 crore has been madeunder PradhanMantriFasalBimaYojana which was Rs.3185 crore in previous budget. There is an increase of about73 % in this scheme.
National Agriculture Development Yojana – as againsta provision of Rs. 3900 crore in 2015-16, this time Rs.5400 crore has been provided in the budget of 2016-17,this amount to an increase of 38%.
A provision of Rs. 75 crore as central share has beenmade in the budget for the first time for NationalAgriculture Forestry Program. An amount of Rs. 1600crore has been allocated for Animal Husbandry, Diary andFisheries 2016-17 which was Rs. 1491 crore in 2015-16.
A total financial resources of Rs. 5387.95 crore wasprovided to DARE/ ICAR in the year 2015-16whereas inthe year 2016-17 financial resources of Rs. 6309.89 crorehas been made available with an increase of about 17 %
compared to the last year which will give impetus toeducation, research and agricultural extension.
A competition of national level will be organizedamong 643 KVKs with a total award amount of Rs. 50lakh for bringing reforms in the efficiency and performanceof the KVKs.
Other Schemes For the Benefit of Village And Farmers
Under Pradhan Mantri Gramin Sadak Yojana, the allocationhas been increased to Rs. 19,000 crore which is almostdouble from the amount released last year. By 2019,remaining Rs. 65000 eligible villages will be linked withthe road.
Rs. 850 crore for 4 dairying projects, namely, PasudhanSanjivini, Nakul Swasthya Patra, ‘E-Pashudhan Haat’ andNational Genomic Centre for indigenous breeds, has beenallocated.
Every block affected from drought and naturalcalamities will work at special block underDeenDayalAntodaya Mission. In this scheme self- helpground will be constituted by the government and they willbe imparted training in various disciplines. Further, clusterprivileges team will be constituted under MNREGA whichwill ensure water conservation and management of naturalresources. These districts will be given priority underPradhan Mantri Krishi Sinchai Yojana.
Under the scheme “Shayam Prasad Mukherjee fordevelopment of infrastructure in villages”, 300 rural urbanclusters will be developed in which agriculture processing,agriculture market, godowns and warehouses will beconstructed. Apart from this, cleanness campaign, watersupply, solid and liquid water management, cementing ofstreets and drains, street lights, strengthening of educationalinstitutions and the development of inter-rural link fromother villages road, LPG gas connection and mobile healthunit will be made available to the villages.
The Government extends to achieve 100% ruralelectrification by 01st May, 2018.
A new scheme, namely, Rastriya Gram SwarajAbhiyan with an allocation of Rs. 655 crore has beenlaunched in the budget.
In statutory support will be provided for the baseplatform so as to facilitate the access to the benefits byeligible persons.
A sum of rupees 38,500 crore has been allotted forMANREGA for the year 2016-2017.
Union Cabinet has sanctioned a “Stand Up IndiaScheme” for encouraging entrepreneurship amongscheduled caste/ schedule tribe and women. For thispurpose a sum of rupees 500 crore has been provided.

April, 2016 3
Under Prime Minister’s “Skill Development Scheme”,it has been aimed at to get entrepreneurship at the thresholdof the youth. For these Programmes, a sum of 17000 croresrupees has been earmarked separately.
The Budget to Change the Destiny of RuralBackground and Farmers in the Country—said byShri Radha Mohan Singh
Union Agriculture and Farmers Welfare MinisterShri Radha Mohan Singh, while addressing a PressConference, said that for the first time, there is a budgetwhich is dedicated to villages, the poor and farmers. A newdimension has been initiated in agricultural sector for theprogress and welfare of farmers. This time, a tremendousenhancement has been made in the budget related toagriculture and irrigation. No one had witnessed such achange earlier. Therefore, this budget will change thescenario of the country’s villages, the poor and farmersand pave their way towards substantial development. Underthe dynamic leadership of Prime Minister Shri NarendraModi the budget meant for 2016-2017 submitted by UnionFinance Minister Shri Arun Jaitley has proved that ModiGovernment is the Government for villages, the poor andfarmers.
The Minister said that the country has witnessed theseries of droughts in various parts of the country, keepingthese circumstances in mind, it was the need of time to befocused on agriculture and villages and it is must forformidable rural economy of the country. This will resultin the enhancement of employment opportunities on ruralscenario but it will also make the farmers income as double.For the first time in the country, Modi Government hastaken a concrete step for strengthening the economiccondition of the farmers in the country.
Shri Singh said that Prime Minister Shri NarendraModi had addressing the Members Of Parliament in CentralHall of Parliament, said that his Government will bededicated for villages, the poor and farmers and whateverModi Government had uttered he proved that in practicein its second budget. So, I, on behalf of the farmers of thecountry salute to the Prime Minister Shri Narendra Modiand Union Finance Minister Shri Arun Jaitley. A recordenhancement has been seen in budget allocation keepingin view villages, farmers and agricultural development.
Animals are Often the Forgotten Victims of Disasters—said by Shri Radha Mohan Singh
Union Agriculture and Farmers Welfare Minister,Shri Radha Mohan Singh inaugurated the two-day workshopon ‘Management of Animals in Emergencies’ organisedby National Institute of Disaster Management (NIDM).
Addressing the gathering, Shri Radha Mohan Singhsaid that the NIDM is playing pivotal role not only indisasters occurring in the country but also in ourneighbouring countries like Nepal where massiveearthquake struck impacting adjoining States in our country
as well. The role of disaster management agencies in rescueand rehabilitation of several people during recent Chennaifloods was highly appreciated, he added. The Minister saidthat it is important to note that animals are often theforgotten victims of disasters and thousands of animalssuffer and perish each year.
Considering the importance of livestock in theeconomy of the nation and also lives of rural Population,Shri Radha Mohan Singh said that the management oflivestock during disaster becomes imperative. He said thatthe NIDM along with organisation like Policy ProspectiveFoundation and World Animal Protection have beenworking together to address much needed issue of‘management of animals in emergencies’. For better policysupport, measures to protect animals from disasters shouldalso be included into the Disaster Management Act, headded.
Shri Radha Mohan Singh said that this workshop isgoing to identify the challenges and focus on the wayforward to mitigate and prevent loss of livestock resourcesbefore, during and after disasters.
Following the inaugural, the Minister released theDisaster Management Plan for the Department of AnimalHusbandry, Dairying & Fisheries and Government of India.The Plan has been developed to protect animals before,during and after disasters.
The two-day workshop included sessions to brief onsubjects like Veterinary Emergency Preparedness Measures(Pre Disaster stage), Veterinary Emergency ResponseMeasures (During Disaster stage), Veterinary EmergencyRecovery Measures (Post Disaster stage), NationalLegislative & Institutional Perspectives and AnimalCentred DRR measures.
Schemes for Agro Startups
Government of India is implementing schemes for Start-ups, including Agro Start-ups through Schemes such as‘Start-up India Scheme’ of Department of Industrial Policyand Promotion (DIPP) and ‘A Scheme for Promotion ofInnovation, Entrepreneurship and Agro-Industry’(ASPIRE) scheme under Ministry of Micro, Small andMedium Enterprises (MSMEs).
Assessment of Demand and Supply of AgriculturalProduces
The Working Group on Crop Husbandry Demand andSupply Projections, Agricultural Inputs and AgriculturalStatistics constituted as a part of the formulation of theTwelfth Five Year Plan (2012-17) projected demand andsupply for different agricultural crops till 2016-17.
The Working Group estimated demand and supply onthe basis of various approaches of supply and demandprojection methods. The relevant information on variousaspects, such as prices, production, supply etc., ofagricultural commodities is extensively disseminated to

4 Agricultural Situation in India
farmers through agricultural extension services, Kisan Call Centres, farmers portal and m-Kisan portal underNational e-Governance Plan in Agriculture (NeGP-A) tohelp in their farming/cropping decision which are profitableto them.
Government has taken a number of initiatives toimprove quality of statistical inputs used for demand andsupply projections through improved survey methodologyon Household Consumer Expenditure Surveys of NationalSample Survey Office as well as use of modern techniques/technologies such as remote-sensing, etc., in Crop CuttingExperiments for assessment of yield/production, besidesthorough scrutiny of data on production reported by StateGovernments.
Extending Support to Farmers in Case of Crop Failure
Farmers are indebted to both institutional and non-institutional sources of credit. However, borrowing fromnon-institutional sources is the major reason for debt-relatedfarmers’ distress which is one of the reported reasons forfarmers’ suicide in the country. In order to reduce thedependence of farmers on private money lenders formeeting their credit needs and for providing relief to theindebted farmers, Government has already taken severalmeasures which include the following:Financial Institutions(Commercial Banks, Cooperative Banks and RegionalRural Banks) have been directed to provide short term croploans and medium/ long term loan to farmers for variousagricultural activities. Short term crop loan of upto Rs.3.00lakh is provided to farmers at an interest rate of 7% perannum. Farmers, who promptly repay their crop loans asper the repayment schedule fixed by the banks, get thebenefit of interest subvention of 3%. Thus, the effectiveinterest rate for the short term crop loan is 4% per annum.
The limit of collateral free farm loan has beenincreased from Rs.50000 to Rs.100000.
Kisan Credit Card (KCC) Scheme, which enables thefarmers to purchase agricultural inputs such as seeds,fertilizers, pesticides, etc. and to draw cash to satisfy theirconsumption needs. The KCC Scheme has since beensimplified and converted into ATM enabled debit card(Rupay KCC- RKCC).
Reserve Bank of India has allowed State LevelBankers’ Committee/ District Level ConsultativeCommittees/ Banks to take a view on rescheduling of loansif the crop loss is 33% or more. Banks have been advisedto allow maximum period of repayment of upto 2 years(including the moratorium period of 1 year) if the croploss is between 33% and 50%. If the crop loss is 50% ormore, the restructured period for repayment is extended toa maximum of 5 years (including the moratorium periodof 1 year).
To provide financial support to the farmers in the eventof failure of crops as a result of natural calamities,
Government is implementing crop insurance schemes since1985. At present, two Crop Insurance Schemes namely,National Agricultural Insurance Scheme (NAIS) andNational Crop Insurance Schemes (NCIP) with threecomponent schemes namely, Modified NationalAgricultural Insurance Scheme (MNAIS), Weather BasedCrop Insurance Scheme (WBCIS) & Coconut PalmInsurance Scheme (CPIS) are under implementation in thecountry.
Horticulture Production Outpacing Production ofFoodgrains
Despite the deficit monsoon, unseasonal rains and hailstormin the major part of the country, the production ofhorticulture crops have outpaced the production of foodgrains since 2012-13 as may be seen in the table below:
Year Production (In Million Tonnes)Total Horticulture* Total Foodgrains**
2012-13 268.85 257.13
2013-14 277.35 265.04
2014-15 280.99 252.02
Source: * Horticulture Statistics Division, DAC&FW** Directorate of Economics and Statistics
There has been an increase of 1.3% in horticultureproduction and reduction of 4.9% in foodgrain productionin 2014-15 as compared to 2013-14.
Buffer Stock of Pulses
It has been decided to create a buffer stock of pulses of 1.5lakh tonnes to control fluctuation of prices of pulses. Government has engaged National AgriculturalCooperative Marketing Federation of India Limited(NAFED), Small Farmers Agri-business Consortium(SFAC) and Food Corporation of India (FCI) to procurepulses for buffer stock. The progress of procurement ofpulses by these agencies so far is as under:-
(Quantity in quintals)
FCI NAFED SFAC Total
2,01,046.36 2,17,603.25 83,809.51 5,02,459.12
Per Capita, Per Day Net Availability of Pulses
The per capita, per day net availability of pulses from 2012to 2014 (latest available) are as under:
Year Per Capita Net Availability of pulses(Gram per day)
2012 41.7
2013 43.3
2014(P) 47.2
(P): Provisional
April, 2016 5
In order to increase production of pulses in the country,Government of India has been implementing through StateGovernments, the National Food Security Mission(NFSM)-Pulses since 2007-08. Presently, around 50% ofthe funds under the umbrella scheme of NFSM are allocatedfor promoting cultivation of pulses. Since 2014-15, NFSM-Pulses is being implemented in 622 districts of 27 Statesincluding all districts of North-Eastern and hill States.
Further, since 2010-11 the Scheme “Bringing GreenRevolution in Eastern India (BGREI)” is beingimplemented in Eastern States of Assam, Bihar, Odisha,Chhattisgarh, Jharkhand, West Bengal and Eastern UttarPradesh. To give a boost to their area and production, pulseshave also been included under BGREI from 2015-16 aspart of demonstrations under cropping systems basedapproach to target rice fallow areas.
In order to increase productivity of pulses, the IndianCouncil of Agricultural Research (ICAR) has undertakenresearch programmes in different pulses at commoditybased research institutes. The research programmes includebasic and strategic research related to crop improvementand production technologies in different pulse crops. Fordeveloping location-specific varieties/hybrids and suitableproduction technologies of pulses to improve theirproduction and quality, the research findings are validatedin relevant agro-ecologies by crop-specific All IndiaCoordinated Research Projects (AICRPs), mostly situatedin the State Agricultural Universities (SAUs).
To encourage farmers to grow more pulses by ensuringremunerative prices, the Minimum Support Prices (MSPs)of pulses have also been increased over the years. Further,for 2015-16, over and above MSPs, the Government hasannounced a bonus of Rs.200/- per quintal for kharif pulsesand Rs.75/- per quintal for rabi pulses.
Reforms in Agricultural Marketing
To address the demands for marketing of increased anddiversified agricultural marketable surplus, there is a needto strengthen the network of regulated markets and augmentit with alternative marketing channels. As per therecommendation of the National Farmers Commission(2004), that a regulated market should be available tofarmers within a radius of 5 Km (corresponding marketarea of about 80 square km.). However, presently, all-Indiaaverage area served by a regulated market is 487.40 squarekm. The number of commodity specific markets withrequisite infrastructure is also limited.
Agriculture Marketing is governed by the AgriculturalProduce Marketing Committee (APMC) Acts, which areadministered by respective State Governments. Some StateGovernments have ushered reforms in their marketingsector to meet the challenges.
In order to keep pace with the changing productionpattern and growing marketable surplus, the Government
advocates development of adequate number of marketsequipped with modern infrastructure, with increased privatesector participation and development of other marketingchannels like direct marketing and contract farming etc.The Government is actively pursuing with States to amendtheir marketing laws to provide suitable legal frameworkand policy atmosphere to usher such developments. Thereform agenda of the Government focuses on 7 vital areasfor reforms. State-wise progress is given below.Further, asa part of reforms, Government announced a scheme forsetting up of National Agriculture Market (NAM). UnderNAM, a common e-market platform is to be deployed foron-line trading across the States/ Country. It is expectedthat NAM would address the marketing constraints offragmentation, lack of transparency in bidding, poor pricediscovery, information asymmetry between sellers andbuyers and provide farmers with a larger share of theconsumer rupee.
Subsidy for Purchasing Combine Harvester
Under the Sub-Mission on Agricultural Mechanizationbeing implemented by the Department of Agriculture,Cooperation & Farmers Welfare, subsidy @ 40% of theproject cost limited to a maximum of Rs. 24 lakhs,whichever is less, is extended to the rural entrepreneurs,progressive farmer and self help groups for establishmentof farm machinery banks for custom hiring comprising ofvarious agricultural machinery & equipment includingcombine harvester.
Unified National Market for Agricultural Commodities
The Government has approved a scheme for setting up ofNational Agriculture Market (NAM) through Agri-TechInfrastructure Fund (ATIF) on 01.07.2015 with a budgetof Rs.200 crore and to be implemented during 2015-16 to2017-18.
The scheme envisages implementation of the NationalAgricultural Market (NAM) by setting up of an appropriatecommon e-market platform that would be deployable inregulated wholesale markets in States/UTs desirous ofjoining the e-platform. Small Farmers AgribusinessConsortium (SFAC) will implement the national e-platformin 585 selected regulated markets and will cover 400mandis in 2016-17 and 185 mandis in 2017-18. Departmentof Agriculture, Cooperation & Farmers Welfare(DAC&FW) will meet expenses on software and itscustomization for the States and provide it free of cost tothe States and Union Territories (UTs). DAC&FW will alsogive grant as one time fixed cost subject to the ceiling ofRs.30.00 lakhs per Mandi (other than to the private mandis)for related equipment / infrastructure in 585 regulatedmandis, for installation of the e-market platform. StateGovernments will propose the regulated markets which areto be integrated with NAM.
6 Agricultural Situation in India
Integration of regulated markets with NAM requirescertain pre-requisites in the State Agricultural ProduceMarketing Committee (APMC) Acts, namely- (i) a singlelicense to be valid across the State, (ii) single point levy ofmarket fee and (iii) provision for electronic auction as amode for price discovery. Only those States/UTs that haveprovided for these three pre-requisites will be eligible forassistance under the scheme.
Promotion of Soil Test Based Balanced and JudiciousUse of Chemical Fertilizers, Bio-Fertilizers and LocallyAvailable Organic Manures
The Government is promoting soil test based on balancedand judicious use of chemical fertilizers, bio-fertilizers andlocally available organic manures like Farm Yard Manure,compost, Vermi Compost and Green manure to maintainsoil health and its productivity.
‘Soil Health Card’ (SHC) scheme has been launchedin February 2015 to assist State Governments to evaluatefertility in all 14 crore farm holdings and issue soil healthcards to farmers regularly in a cycle of 2 years. Soil healthcards provide information to farmers on nutrients status oftheir soil along with recommendations on appropriatedosage of nutrients to be applied for improving soil healthand its fertility.
In order to reduce use of pesticides and chemicalfertilizers in the country, Indian Council of AgriculturalResearch (ICAR) is recommending Integrated PestManagement (through a combination of agronomic,chemical and biological methods) and Integrated NutrientManagement (INM) envisaging conjunctive use of bothinorganic and organic sources of nutrients. Besides, splitapplication and placement of fertilizers, use of slowreleasing N-fertilizers and nitrification inhibitors, inclusionof legumes in cropping system, adoption of ResourceConservation Technologies (RCTs) and fertigation are alsobeing advocated. ICAR also imparts training, organizesFront Line Field Demonstrations to educate farmers on allthese aspect.
Under the scheme ‘Strengthening and Modernisationof Pest Management Approach in India, farmers areeducated to adopt Integrated Pest Management (IPM) ascardinal principle and main plank of plant protectionstrategy in overall crop production programme. Under theambit of (IPM) programme, the Government of India hasestablished 31 Central IPM Centres which conduct FarmersField Schools (FFSs) to educate farmers about mechanical,cultural and biological control measures including use ofbiopesticides against different crop pests and weeds andjudicious use of chemical pesticides as a measure of lastresort.
The Insecticides Act 1968 and the Rules framed thereunder mandate that pesticides are registered for use inagriculture in India only after a detailed evaluation of safety.
Once registered, a pesticide is legally obligated to displayand carry approved labels and leaflets containing criticalinformation on safe use of pesticides for the benefit offarmers & extension functionaries etc. Application ofpesticides in accordance with instructions on the label andleaflets is not likely to cause any harm to human health.
Fix a Uniform Price of Bt Cotton Seed across theCountry for the Benefit of Farmers—said by ShriRadha Mohan Singh
Union Agriculture and Farmers Welfare Minister ShriRadha Mohan Singh said that “As there was no uniformityin pricing of Bt cotton seeds across the country, the centralgovernment has recently intervened and issued a CottonSeed Price (Control) Order, 2015, to fix a uniform price ofBt cotton seed across the states in the country for the benefitof farmers,”
The Agriculture & Farmers Welfare Minister said thatboth the public and private sectors have a role in the supplyof quality seeds, including Bt cotton, to farmers. Thelicensing of Bt cotton seeds by Mahyco Monsanto to 50companies is an example of the private sector’s role in theproduction and supply of such seeds.
Shri Singh said that “In order to safeguard the interestsof the farming community, this department issued theCotton Seed Price (Control) Order, 2015, under section 3of the Essential Commodities Act, 1955, to regulate Btcotton seed prices. “Some state governments had alsopassed legislations to ensure supply of Bt cotton seeds tofarmers,” Shri Singh added.
Agriculture & Farmers Welfare Minister also said that ”based on the representations, this department also madea reference to the Competition Commission of India forinvestigation of dominance of MMBL and abuse ofmonopoly in Bt cotton technology so as to ensurecompetition in the market.
Shri Singh also said that as per the order, a nine-member committee was set up to recommend the maximumsale price of Bt cotton seeds after taking into considerationthe seed value, licence fees including one-time andrecurring royalty (trait value), trade margins and other taxesand government declared the maximum sale price of Bt.cotton seed packets (9450grams of Bt. Cotton plus 120grams refugia) for the financial year 2016-17 for the wholeof India.
Promotion of Micro Irrigation
The Micro Irrigation technologies (both Drip and Sprinkler)are quite popular amongst the farmers and adoption rate isalso high.
The National Mission on Micro Irrigation programmein the country, State-wise including West Bengal, wassubsumed under National Mission on Sustainable

April, 2016 7
Agriculture (NMSA) and implemented as “On farm WaterManagement” (OFWM) during 2014-15. The same is nowbeing implemented as “Per Drop More Crop” componentunder PradhanMantriKrishiSinchyeeYojana (PMKSY)from 2015-16 onwards.
Various steps taken by Government for promotion ofmicro irrigation include (i) Training and awarenessprogrammes, (ii) Awareness through print media and radio& TV talks, (iii) Organization of workshops, seminars andinteractive meetings, (iv) Publicity creation throughExhibitions, Fairs and KisanMelas, (v) Publication ofliterature and (vi) Short duration films.
Intervention Made in Drought Affected Areas
Intervention made in drought affected areas:
(i) Implementation of Diesel Subsidy Scheme forprotective irrigation of crops;
(ii) Enhancement of ceiling on seed subsidy to partiallyrecompense the farmer for the additional expenditureincurred in resoling and/or purchasing appropriatevarieties of seeds;
(iii) Implementation of interventions on perennialhorticulture crops under Mission for IntegratedDevelopment of Horticulture (MIDH);
(iv) Implementation of Additional Fodder DevelopmentProgramme (AFDP) as a sub-scheme of RashtriyaKrishi Vikas Yojana (RKVY).
Central Research Institute of Dryland Agriculture(CRIDA), in collaboration with State AgriculturalUniversities, has prepared contingency plans for 600districts for implementing location specific interventionsto sustain agriculture production in the eventuality of anyextreme climatic events.
Pradhan Mantri Krishi Sinchayee Yojana (PMKSY)has been launched with the objective of extending thecoverage of irrigation in a focused manner. Under PMKSY,focus has been given for: Creation of new water sources;Repair, restoration and renovation of defunct water sources;Construction of water harvesting structures, secondary µ storage, ground water development and Enhancingpotentials of traditional water bodies at village level.
Central Government has relaxed the norms underMGNREGA to provide additional employment of 50 daysover and above the 100 days per household in the areasaffected by natural calamities including drought for thecurrent year.
Further, in order to protect farmers against crop failuredue to natural calamities, pests & diseases, weatherconditions, Government of India had introduced theNational Crop Insurance Programme (NCIP) from Rabi2013-14 season with component schemes of Modified
National Agricultural Insurance Scheme (MNAIS),Weather Based Crop Insurance Scheme (WBCIS) andCoconut Palm Insurance Scheme (CPIS). In addition,National Agricultural Insurance Scheme (NAIS) which wasto be withdrawn after implementation of NCIP from Rabi2013-14, has been extended further. These schemes havebeen recently reviewed and a new scheme, namely,PradhanMantriFasalBimaYojana (PMFBY) has beenapproved for implementation from Kharif 2016 season.
News Report of ASSOCHAM stating that WheatProduction in the Country this year is Likely to beLower is Factually Incorrect- said by Shri RadhaMohan Singh
Union Agriculture and farmers Welfare Minister, ShriRadhaMohan Singh saidsaid that “the news report ofASSOCHAM stating that wheat production in the countrythis year is likely to be lower by 1.5 crore tonne is factuallyincorrect. In 2015-16, wheat production in the country isestimated at 93.82 million tonnes (2nd Advance Estimate).The recent untimely rains and hailstorm in some parts ofthe country have caused some damage but, as per presentassessment, production of wheat in the country would stillbe around 92-93 million tonne which is substantially higherthan the wheat production of 86.53 million tonnes during2014-15”.
Shri Singh said that the present stock of wheat withthe Food Corporation of India is higher than the stockingnorms. Against the stocking norm of 7.6 million tonnes ason 1st April, 2016, the present stock of wheat in the centralpool is 13.5 million tonne. During the last one year FCIhas sold 7 million tonnes of wheat through open marketoperations. For the past some time, the market response tothe tenders floated by FCI has been weak which impliesthat there is no shortage of wheat in the country at present.
Agriculture and Farmers’ Welfare Minister informedthat during the last one year international price of wheathave been subdued. In order to protect the interests offarmers, Government of India, imposed 25 per cent importduty on wheat. He further said that the harvesting of wheathas started. With a target of 30.5 million tonne, FCI hasalready started procurement activity.
Shri Singh also said that at this juncture, such incorrectinformation is being publicized with a view to compelgovernment to reduce import duty on wheat. Lower importduty on wheat would lead to a fall in wheat price in thedomestic market and farmers will incur heavy loss whiletraders will purchase from farmers at lowered price.
Prime Minister Inaugarates ‘Krishi Unnati Mela’: PMConfers Krishi Karman Awards
Hon’ble Prime Minister Shri Narendra Modiinaugurated ‘Krishi Unnati Mela’- the National LevelAgriculture Fair-cum-Exhibition in New Delhi on 19th
march, 2016. Hon’ble Prime Minister conferred Krishi

8 Agricultural Situation in India
Karman Awards. He also visited the Theme Pavilion andaddressed the farmers. ‘KrishiUnnatiMela’ was organizedjointly by the Department of Agriculture, Ministry ofAgriculture and Farmers Welfare, Government of India andIndian Agriculture Research Institute (IARI), Pusa, NewDelhi at Indian Agriculture Research Institute from March19-21, 2016.
On inauguration day, the prestigious National level‘Krishi Karman Awards’ for the Best performing States ofthe year 2014-15 were presented to 8 State Governments,which were received by the Chief Minister of respectivestates. Besides this, 3 states were also be givencommendation awards for total food grains production.These awards are instituted to facilitate the best performingStates in food grains production. The objective of theseawards is to encourage and motivate the states to enhanceproduction and productivity of rice, wheat, pulses andcoarse cereals and oilseeds.
Prime Minister also visited ‘Theme Pavilion’, one ofthe major attractions at the Krishi Unnati Mela, hasshowcased the entire scheme of things happening in theagriculture sector. The pavilion has 8 zones viz. agro-climatic variety in India; water as an input to agriculture;Soil Health; Technology theme showcasing importantGovernment schemes; Animal Husbandry and Fisheries;Agri-rejuvenation, Agri- Technology; and Horticulture.
With the initiative of Hon’ble Prime Minister, a newscheme PM Fasal Bima Yojana has been approved forimplementation across the country. An allocation of Rs.5500 crore has been made in the Budget 2016-17 underPradhanMantriFasalBimaYojana which was Rs. 3185 crorein previous budget. There is an increase of about 73 % inthis scheme.
Technical session on PradhanMantriFasalBimaYojanachaired by Secretary, department of Agriculture andFarmer’s Welfare was also held on inaugural day. In thenew scheme, short-comings in Crop Insurance Scheme havebeen removed. Salient Features of PM FasalBimaYojanawere discussed are as follows:
This is the biggest financial support till date by theCentral Government in Crop Insurance, whilefarmers will now have to pay the lowest premiumtill date for availing Crop Insurance.
The balance premium burden will be borne by theGovernment - even if it is more than 90% of thetotal premium.
For food-grains, pulses and oilseeds, there will beone season – one rate for the farmer. Different ratesfor different crops for different districts have beenremoved. For Kharif: maximum 2% and for Rabi:maximum 1.5% premium is to be paid by farmers.
Farmers will get full financial security – there willbe no capping on the premium rates and no reductionin the sum insured.
For the first time, inundation has been included inthe category of localized risks.
For the first time, risks of post harvest losses due tocyclone and unseasonal rainfall have been includedfor coverage across the country.
For the first time, mobile and satellite technologywill be used for correct estimation and quickpayment of claims to farmers.
Under this scheme, provisions have been made forcreation of mass awareness and publicity throughmedia so that the number of insured farmers can beincreased from present 20% to 50% in the next 2-3years.
Organic Farming Mandates Meeting the CompleteNutrient Requirement of the Crop Only ThroughPermitted Organic Inputs And Pest Management byNon-Chemical Methods- said by Shri Radha MohanSingh
Union Agriculture and Farmers Welfare Minister,ShriRadha Mohan Singh addressed the NationalSymposium on Organic Farming for Farmers Prosperity,organized by CRIDA and NIRD, Hyderabad on 20th March,2016. In his address,Shri Singh said that the Organicfarming mandates meeting the complete nutrientrequirement of the crop only through permitted organicinputs and pest management by non-chemical methods. However, in view of large requirements of food in termsof cereals, legumes, oil seed, fodder, fruit/vegetables, fibreetc. organic farming need be promoted in the niche areas.
Shri Singh said that at present, it appears that the onlystrategy to sustain food production on long term basis inthe country is to adopt integrated nutrient management andintegrated pest management to meet the ever growingdemand for food, while organic farming practices can beadopted in isolated and niche areas to produce qualityproducts and minimize the adverse effects on theenvironment. Future organic farming need to be linkedwith market avenues and export of organic products
Memorandum of Understanding between India andLithuania for Cooperation in the Field of Agriculture
The Union Cabinet chaired by the Prime MinisterShriNarendraModi has given its approval for signing of aMemorandum of Understanding between India andLithuania for cooperation in the field of agriculture.
The MoU provides for cooperation in the fields ofagriculture production including horticulture, post-harvestmanagement, organic farming, cold chain development andagro processing industry, animal husbandry, dairying and
April, 2016 9
aquaculture etc. The cooperation between the two countriesshall be undertaken through biennial work plan to be drawnup mutually to give effect to the objectives of the instantMoU.
It is expected that the MoU would help in capacitybuilding, knowledge exchange between scientists andtechnicians, exchange of genetic resources, developmentof appropriate technologies and farm practices forenhancing agriculture productivity at farmer’s field.
Agriculture Ministry Issues Directives to the States toCheck the Adverse Affect of White Fly on Cotton
Union Agriculture and Farmers Welfare Ministry has issuedextensive directives to the States producing cotton to checkthe adverse affect of white fly on cotton. Ministry ofAgriculture and Farmers Welfare has given these directivesin view the likely menace to the crop of cotton in Punjab,Haryana and Rajasthan from white fly. White fly hadinflicted tremendous damage to cotton last year in Punjaband Haryana.
To save crop of cotton from the likely menace of whitefly, the Ministry of Agriculture and Farmers Welfare hastaken various preventive measures. Elaborate assessmentand analysis has been carried out about the loss inflictedlast year. The sowing process of cotton is set in, in thebeginning of April in the States of Punjab, Haryana andRajasthan. Central Cotton Research Regional Centre, Sirsa(Haryana) has recently held a meeting in which officials ofthe Ministry of Agriculture, Scientists of Indian Councilof Agricultural Research and senior officials ofDepartments of Agriculture from Punjab, Haryana andRajasthan reviewed the preventive measures to check themenace of white fly.
After the review, the Government of India hasforwarded extensive directives to the States of Punjab,Haryana and Rajasthan. The directives say that the sowingprocess may be carried out within the precincts of scheduledtimeframe, only recommended seeds might be utilized,close watch might be kept on the movement of pests andtimely sprinkling to check its spread. Indian Council ofAgricultural Research has also provided a list of the pestsresist seeds 4for the farmers. This year emphasis is beinggiven on the timely sowing of cotton.
360 Additional Soil Test Labs to be set up during2016-17
Soil Health Card (SHC) Scheme is an important scheme
of the Government. It aims at promoting soil test basedand balanced use of fertilizers, so that the farmer can realizehigher yields at lower cost. Simultaneously, soil health canbe sustained. Earlier soil health cards were being given tofarmers. However, these were largely the initiatives of StateGovernments, implemented over varying periods of time.These initiatives were sporadic & random and therefore,did not cover all the farmers within a particular time cycle.The approach also was not comprehensive in term ofprocedure for collection of soil samples and standards forsoil test. It was limit to, assisting the State Governmentsfor Static Soil Testing Laboratories (SSTLs) and MobileSoil Testing Laboratories (MSTLs). Earlier, Governmentof India has never provided any assistance to the StateGovernments to undertake collection of soil samples andtheir analysis. As seen a major threat towards deterioratingsoil health, there has never been comprehensive ‘SoilHealth Card’ Scheme of the magnitude that Governmentlaunched in the year 2014-15 to provide SHC to all 14crore farmers once in a cycle of 2 years, on a continuousbasis. Comprehensive testing of soil samples for 12parameters including micronutrients is being carried outunder the scheme. The first cycle of the scheme will becompleted in 2 years (2015-16 & 2016-17) with an outlayof Rs 568.54 crore.
The target for the year 2015-16 is to collect 104 lakhsoil samples and test them for issue of Soil Health Cards tofarmers. More than 90 percent samples have been collectedin states like Andhra Pradesh, Kerala, Meghalaya,Nagaland, Telangana, Sikkim, Gujarat, Bihar, Tripura,Tamil Nadu, Maharashtra, Punjab, Chhattisgarh, WestBengal and Himachal Pradesh.
Out of 90 lakh samples collected 60 lakh soil sampleshave been tested so far. Andhra Pradesh, Telangana,Gujarat, Meghalaya, Sikkim, Tamil Nadu, Maharashtra,Tripura and Kerala have taken soil analysis in a big wayand completed the targets between 75% to 100%. Stateslike Bihar, Punjab, Chhattisgarh, West Bengal, Jharkhand,Odisha, Uttarakhand, Rajasthan, Arunachal Pradesh,Madhya Pradesh, Jammu & Kashmir, Mizoram, Haryana,Manipur, Assam, Karnataka and Uttar Pradesh are laggingbehind.
In 2016-17, 360 number of additional soil testlaboratories will be made operational to test major andmicro nutrients. This will increase the annual analyzingcapacity of state laboratories from 1.78 crore to 2.14 crore.

10 Agricultural Situation in India
Trends in Foodgrain PricesDuring the month of February, 2016, the All India IndexNumber of Wholesale Price (2004-05=100) of food grainsdecreased by1.15 percent from 260.1 in January, 2016 to257.1 in February, 2016.
The Wholesale Price Index (WPI) Number of cerealsdecreased by 0.25 percent from 236.7 to236.1 and WPI ofpulses decreased by 3.70 percent from 370.1 to 356.4during the same period.
The Wholesale Price Index Number of Wheatincreased by 0.85 percent from 223.5to 221.6 while thatof Rice increased by 0.30 percent from 235.9 to 235.2during the same period.Rainfall Situation during March, 2016Cumulative Pre-Monsoon Season (March to May) rainfallfor the country as a whole during the period 01st March to30th March, 2016 is equal to Long Period Average (LPA).Rainfall in the four broad geographical divisions of thecountry during the above period was lower than LPA by24% in East & North East India and 49% in South Peninsulaand higher than LPA by 21% in North West India & 12%in Central India. Out of a total of 36 meteorologicalsubdivisions, 18 subdivisions received excess/normalrainfall, 16 subdivisions received deficient/scanty rainfalland 02 subdivisions received no rain.Water Storage in Major Reservoirs during March, 2016Central Water Commission monitors 91 major reservoirsin the country which have a total live capacity of 155.80Billion Cubic Metre (BCM) at Full Reservoir Level (FRL).Current live storage in these reservoirs as on 31st March,2016 was 39.65 BCM as against 57.18 BCM on 31.03.2015(last year) and 52.74 BCM of normal storage (averagestorage of last 10 years). Current year’s storage is 69% ofthe last year’s storage and 75% of the normal storage.Economic GrowthAs per the Advance Estimates released by Central StatisticsOffice on 8th February 2016, the growth rate of GrossDomestic Product (GDP) at constant (2011-12) pricesfor the year 2015-16 is estimated to be 7.6 per cent ascompared to the growth of 7.2 per cent, 6.6 per cent,, and5.6 per cent for 2014-15, 2013-14, and 2012-13respectively (Table 1].
The growth in Gross Value Added (GVA) at constant(2011-12) basic prices for the year 2015-16 is estimated tobe 7.3 per cent as compared to the growth of 7.1 per cent,6.3 per cent, and 5.4 per cent respectively for 2014-15,
2013-14, and 2012-13. At the sectoral level, the growthrate of GVA at constant (2011-12) basic prices foragriculture & allied sectors, industry and services sectorsfor the year 2015-16 are estimated to be 1.1 per cent, 7.3per cent, and 9.2 per cent respectively [Table 1].
According to the quarterly estimates, the growth inGDP in Q3 of 2015-16 [October-December] was 7.3 percent, compared to the corresponding growth of 6.6 per centin 2014-15. Growth during the first three quarters of 2015-16 (April-December) works out to be7.5 per cent ascompared to the corresponding growth of 7.4 per cent in2014-15 [Table 2].
The share of total final consumption in GDP at currentprices in 2015-16 is estimated to have improved to 70.5per cent from 68.5 per cent in 2014-15. Though the shareof fixed investment rate (gross fixed capital formation toDGP) is expected to decline in 2015-16, its growth rate isestimated to improve to 5.3 per cent 2015-16 as comparedto 4.9 per cent in 2014-15.
The saving rate (gross saving to GDP) for both theyears 2014-15 and 2013-14 was 33.0 per cent as comparedto 33.8 per cent in 2012-13. The investment rate (grosscapital formation to GDP) in 2014-15 was 34.2 per cent,compared to 34.7 per cent and 38.6 per cent in 2013-14and 2012-13 respectively.Agriculture and Food ManagementRainfall: The cumulative rainfall received during theperiod 1st March - 16th March 2016 has been 19 per centabove normal. The actual rainfall received during thisperiod has been 17.0mm as against the normal at 14.3 mm.Out of the total 36 meteorological subdivisions, 20subdivisions received excess season rainfall, 4 subdivisionreceived normal season rainfall and the remaining 12subdivisions received deficient/scanty/no season rainfall.All India Production of Foodgrains: As per the 2ndadvance estimates released by Ministry of Agriculture on15th February 2016, production of foodgrains during 2015-16 is estimated at 253-2 million tonnes compared to 252.0million tonnes in 2014-15 (Table 3).Procurement: procurement of rice as on 17th March 2016was 29.2 million tones during kharif marketing season2015-16 and procurement of wheat as on 17th March 2016was 28.1 million tones during rabi marketing season2015-16 (Table 4).Off-take: Off-take of rice in January 2016 was 26.5 lakhtones. This comprises 23.6 lakh tones under TPDS/NFSA
General Survey of Agriculture

April, 2016 11
(offtake against the allocation for the month of February,2016) and 2.9 lakh tonnes under other schemes. The totaloff-take of wheat in January 2016 was 34.1 lakh tonescomprising 18.2 lakhs tones under TPDS/NFSA (off takeagainst the allocation for the month of February, 2016) and15.9 lakh tones under other schemes. Cumulative off-take
of foodgrains during 2015-16 (till January 2016) was 558.8lakh tones (Table 5).Stocks: Stocks of food-grains (rice and wheat) held by FCIas on March, 1, 2016 were 46.1 million tonnes, comparedto 43.6 million tones as on March 1, 2015(Table 6).
TABLESTABLE 1: GROWTH OF GVA AT BASIC PRICES BY ECONOMIC ACTIVITY (AT 2011-12 PRICES) (IN PER CENT)
Growth Share in GVA
Sector 2013-14 2014-15 2015-16 2013-14 2014-15 2015-16(AE) (AE)
Agriculture, forestry & fishing 4.2 -0.2 1.1 17.5 16.3 15.3
Industry 5.0 5.9 7.3 31.6 31.2 31.2
Mining & quarrying 3.0 10.8 6.9 2.9 3.0 3.0
Manufacturing 5.6 5.5 9.5 17.4 17.1 17.5
Electrictiy, gas, water supply & other utility Services 4.7 8.0 5.9 2.2 2.2 2.2
Construction 4.6 4.4 3.7 9.0 8.8 8.5
Services 7.8 10.3 9.2 51.0 52.5 53.4
Trade, hotels, transport, Communication 7.8 9.8 9.5 18.4 18.9 19.2and services related to broadcasting
Financial, real estate & professional Services 10.1 10.6 10.3 20.3 21.0 21.5
Public administration, defence and Other Services 4.5 10.7 6.9 12.3 12.7 12.7
GVA at basic prices 6.3 7.1 7.3 100.0 100.0 100.0
GDP at market prices 6.6 7.2 7.6 ... ... ...
Source: Central Statistics Office (CSO). AE: Advance Estimates
TABLE 2: QUARTER-WISE GROWTH OF GVA AT CONSTNAT (2011-12) BASIC PRICES (PER CENT)
2013-14 2014-15 2015-16
Sectors Q1 Q2 Q3 Q4 Q1 Q2 Q3 Q4 Q1 Q2 Q3
Agriculture, forestry & fishing 2.8 3.3 5.7 4.3 2.3 2.8 -2.4 -1.7 1.6 2.0 -1.0
Industry 3.1 3.9 4.0 1.7 8.0 5.9 3.8 5.7 6.8 6.4 9.0
Mining & quarrying 2.2 -3.0 0.5 7.2 4.5 7.0 9.1 10.1 6.6 5.0 6.5
Manufacturing -0.8 0.5 2.4 -0.7 7.9 5.8 1.7 6.6 7.3 9.0 12.6
Electrictiy, gas, water supply & -2.6 1.0 -1.5 0.4 10.2 8.8 8.8 4.4 4.0 7.5 6.0other utility
Services
Construction 13.3 14.6 9.9 5.2 5.0 5.3 4.9 2.6 6.0 1.2 4.0
Services 8.7 9.3 7.7 5.4 8.6 10.7 12.9 9.3 9.0 9.4 9.4
Trade, hotels, transport, 6.8 8.4 9.2 6.9 11.6 8.4 6.2 13.1 10.5 8.1 10.1Communication and servicesrelated to broadcasting
Financial, real estate & 9.8 14.0 9.1 6.9 8.5 12.7 12.1 9.0 9.3 11.6 9.9professional Services
Public administration, defence 9.6 2.9 3.2 1.2 4.2 10.3 25.3 4.1 6.1 7.1 7.5and Other Services
GVA at Basic prices 5.9 6.7 6.2 4.0 7.4 8.1 6.7 6.2 7.2 7.5 7.1
GDP at market prices 6.2 7.7 6.0 4.4 7.5 8.3 6.6 6.7 7.6 7.7 7.3

12 Agricultural Situation in India
TABLE 3: PRODUCTION OF MAJOR AGRICULTURAL CROPS (2ND ADV. EST.)
Crops Production (in Million Tonnes)
2012-13 2013-14 2014-15 2015-16(2nd AE)
Total Foodgrains 257.1 265.0 252.0 253.2
Rice 105.2 106.7 105.5 103.6
Wheat 93.5 95.9 86.5 93.8
Total Coarse Cereals 40.0 43.3 42.9 38.4
Total Pulses 18.3 19.3 17.2 17.3
Total Oilseeds 30.9 32.8 27.5 26.3
Sugarcane 341.2 352.1 362.3 346.4
Cotton 34.2 35.9 34.8 30.7
Source: DES, DAC&FW, M/o Agriculture & Farmers Welfare, 2nd AE: Second Estimates
TABLE 4: PROCUREMENT OF CROPS IN MILLION TONNES
Crops 2010-11 2011-12 2012-13 2013-14 2014-15 2015-16
Rice# 34.2 35.0 34.0 31.8 32.2 29.2$
Wheat@ 22.5 28.3 38.2 25.1 28.0 28.1$
Total 56.7 63.4 72.2 56.9 60.2 57.3
Source: DFPD, M/o Consumer Affairs and Public Distribution;# Kharif Marketing Season (October-September),@ Rabi Marketing Season (April-March),$ Position as on 17.03.2016.
TABLE 5: OFF-TAKE OF FOOD GRAINS (MILLION TONNES)
Crops 2012-13 2013-14 2014-15 2015-16(Till January)
Raice 32.6 29.2 30.7 28.9
Wheat 33.2 30.6 25.2 26.9
Total65.9 59.8 55.9 55.8 (Rice & Wheat)
Source: DFPD, M/o Consumer Affairs and Public Distribution
TABLE 6: STOCKS OF FOOD GRAINS (MILLION TONNES)
Crops March 1, 2015 March 1, 2016
1. Rice 15.2 19.4
2. Unmilled Paddy# 13.2 14.6
3. Converted Unmilled Paddy in Terms of Rice 8.8 9.8
4. Wheat 19.5 16.9
5. Total (Rice & Wheat) (1+3+4) 43.6 46.1
Source: FCI;#Since September, 2013, FCI gives separate figures for rice and unmilled paddy lying with FCI & state agencies in terms of rice.

April, 2016 13
Abstract
India is classified as water stressed country, becauseavailable water supply in the country is between 1000 and1700 cubic meters per person per year (Harris and Roach,2013). As a result of climate change on precipitation pattern,arid areas of the country are likely to become drier resultedin increasing the probability of drought. Only about 20%of rainfall is utilized and as much as two-thirds run off asfloods. 10% increase in irrigation efficiency can bringadditional 14 million ha area under assured irrigation. Morethan 90 percent of sorghum, pearl millets and pulses aregrown in arid and semiarid areas (Khaper & Rao, 1987).Rainfed agriculture added about 44 per cent of total foodproduction and 75 per cent of oilseeds and pulsesproduction in India (Ranbabu,1987). The rainfed areas hassubstantial production potential which is not yet fullytapped, due to limited availability of water conservationand utilization of in-situ rain water and water harvesting,forms a basis for the rainfed agriculture (Swaminathan,1987). New Pradhan Mantri Krishi Sinchai Yojana(PMKSY) aimed at ensuring access to water to every farm(“Har Khet Ko Pani”) and improving water use efficiency(“Per Drop More Crop”). Pradhan Mantri Krishi SinchayeeYojana ensures access to some means of protectiveirrigation to all agricultural farms in the country in orderto produce ‘per drop more crop’ to bring desired ruralprosperity. This can be achieved successfully throughwatershed approach,besides bringing synergy betweendifferent irrigation schemes especially in rainfed agro-ecosystem of the country.
The most limiting feature i.e. water availability canbe improved through watershed technology. Watershedmanagement can be defined as an integrated areadevelopment approach in rainfed/dry land areas of thecountry to promote rainfed/dryland farming system undermultifarious,different and riskprone environment forsustainable production of bio mass for food, fodder, fuel,fiber and wood.
These are brought about by scientific utilization ofland, water, plant and human resources in a geological areathat drains at a common point in the natural drainage lines
(Anonymous, 1993). Watershed is a natural drainage areaof a river, tank, lake or a nala. In the watershed approach awatershed is used as a unit for efficient planning andmanagement of natural and manmade resources and allinterrelated factors such as physical, biological,technological, economic, social cultural and managerialconsidered together in a system of frame work (Singh,1991). In a broad sense, it is an area having commondrainage. The rainfall of the area within the ridge line canbe harvested and drained out by a common drainage point.Thus, the watershed accomplishes both arable and the non-arable land management for its development irrespectiveof the administrative or ownership boundaries. There mustbe a comprehensive plan for use of land within integratedapproach in both arable and non-arable land based on theircapability, to result in higher productivity. The watershedprogramme endeavor to improve, optimize and sustainproduction and productivity of all categories of land. Thespecific object of the programme include, promotion of insitu soil and water conservation, optimum use of land tominimize risk in rainfed farming, increase productivity ofland and provide higher returns to the farmers on asustainable basis through adoption of better technology,cropping pattern and diversification of sources of income,proper management to non-arable land, improvement ofground water recharge and production on food, fodder, fuel,fiber, fruits and timber to maintain the ecological balance(Ramana, 1991). Most of the watershed projects in Indiaare implemented with the twin objectives of soil and waterconservation and enhancing the livelihood of rural poor(Sharma and Scott, 2005).
The major land mark in the evolution of watershedapproach in India includes. (a) A centrally sponsoredscheme of soil conservation in catchment of river valleyprojects in 1974. (b) 46 model watershed projects by Indiancouncil of agricultural research in the dry land areas of thecountry launched in 1982, (c) world bank aided rainfedwatershed development projects of Andhra Pradesh,Karnataka, Madhya Pradesh and Maharashtra in early andmid-eighties(d)a national watershed developmentprogramme for rainfed agriculture by the union ministryof agriculture in 1988 (Singh, 1988), and (e) Integrated
Articles
Watershed Approach for Sustainable Management of Natural Resources and EnhancingRural Livelihood Security
HARI OM SHARMA*, SUNIL NAHATKAR**& DEEPAK RATHI***
* Director, Agro-Economics Research Centre.** Principal Scientist, Directorate of Research Services.
*** Deputy Director, Agro-Economics Research Centre, Jawaharlal Nehru Agricultural University, Jabalpur-482004.

14 Agricultural Situation in India
Watershed Development Programme has been underimplementation since 1993-94. The future of Indianagriculture lies in rainfed farming because this type offarming constitutes majority of cultivated area in thecountry and it is from these areas that higher productionwill have to be expected. Despite the creation of hugeirrigation potential at present, more than 55 per cent of thearea in country is under rainfed condition.These furtherincrease the importance of rainfed in decade to come.Concentration on these areas would help not only inremoving regional disparities but would also insure greaterstability of agriculture production and income. To meetout the increasing demand of the food grains, output fromrainfed farming will have to be raised to about 69 per centover the present level of 42 per cent. A proper strategyshould be to utilized to present irrigation facilities to thefullest possible extent and concentrate on the bettermanagement methods for rainfed areas. The dry landfarming technology involves crop rotation, adoption ofvarities and practices adjusted to moisture regime ofagroclimatically homogenous region - more specifically,it consists of making the best use of limited water supply,storing in soil as much rain water as possible and growingsuitable crops by methods that makes the best use of thismoisture. Thus, our future planning for agriculture mustgive concentrated attention on development and transferof techniques for rainfed farming and watersheddevelopment.
The various studies which were done so for inthis particular field area are classified in to following subheads.
Planning and Policies
The integrated watershed development approach can beformulated through participation of various committeesrelated to project planning, implementation and sharing ofbenefits. The development work not only generatesemployment but also increase productivity of all the classesof land and hence, integrated approach has been acceptedas a suitable model of growth for upliftment of backwardarea (Sandhu and Kumar, 1986). The identification ofscientifically sound traditional practices area helpful to thescientist in technology blending programme and ingeneration of low cost location specific appropriatetechnology modified to suit the dryland farmers (Pandariaand Singh, 1990).The major programme initiated in theproject includes contour bunding, submergence bunding,still trap bund, afforestation and digging of wells, whichcause significant shift in land use pattern due to reductionin the area under barren, cultivable waste land andpermanent fellow (Singh, 1991).The farm yard manuresand the fertilizers are the major items of energy input factorsunder watershed programme while, human labor andbullock labor were identified as a major energy input factorsin non-watershed villages (Rao, 1991).Participatorywatershed development as experienced in PimpalgaonWagha village of Maharashtra is an approach that allows
the creative potential and wisdom of the people to assert itas result to timely and appropriate exogenous inputs, thusleading to the unfolding of a "development dynamics"which creates possibilities for the change in the village(GTZ, 1995).The factors like increase in net sown areaand gross sown area, area under assured irrigation (tubewell and wells) and annual agricultural income will help indiversification of crops in the cropping pattern of the stateof Madhya Pradesh (Nahatkar, 2008). Draft interim reportof working sub group II of watershed plus policies for thedevelopment of rainfed areas, Ministry of Agriculture, GOI,2006 suggested that there is a need for revisiting theinvestment need of watershed since the life of oneprogramme can be no longer than 10-12 years (Deshpande,2008). Further convergence of various rural developmentprogrammes in around the watershed could be ensured topromote holistic development of watersheds (Palanisamiand Kumar, 2009).
Extension Strategies
Although, there is considerable potential to increase cropyield by fertilizer use for most of the dryland crops (Hebberand Shaspurkar, 1990) specially bajra, jowar, groundnutand safflower by mentioning optimum plant population(Verma et al. 1990). But it will not turn in to sustainableagriculture. To create awareness before execution of watermanagement programme and enlist participation whileplanning and execution, the number of informal meetings,discussions be arranged with the farmers (Algumani, 1991).The training should be given to large number of farmersabout improved dryland practices was significantlyassociated with extension participation. The extensionagencies should implement the dryland practices onwatershed basis (Bavalatti & Sunderswamy, 1990). Highpriority is needed for transfer of technology related to useof improved seed varieties, fertilizer application so thatthe yield of barani wheat can be doubled in MalwaRegionof Madhya Pradesh (Saxena et al, 1990). The informationabout cultural practices of crops, plant protection and newverities are needed by the tribal farmers of rainfed area(Singh, 1990). These tribal people need special trainingand education programmes. The extension agencies andmass media influences knowledge, attitude and adoptionbehavior of the farmers. Lack of proper communicationpattern is the main reason for agricultural backwardnessof the area. The need for management support for watersheddevelopment, credit supply, and infrastructural facilitiesfor supply of seeds, fertilizers and the need for farmers'participation in training has been stressed (Krishirsagar andGhotake, 1991).
Monitoring and Evaluation
The farm income of the dry land areas can further beincreased by adoption of optimum crop plan in watershedareas (Tilekar et al. 1986). The watershed managementdevelopment programme significantly increases theproduction and income of beneficiaries (Sandhu, 1988).
April, 2016 15
The increase income generated by soil and waterconservation measures is rather low, compared to thequantum jump experienced when coupled with improvedcrop production techniques, but soil is a natural resources,such programme should therefore be heavily subsidisedfrom the point of view of economics and ecology becausethe cost can go as high as Rs.4000/ha (Tarol, 1988).Theimplementation of the watershed development programmehas considerably increased the socio-economic status, landproductivity and annual income of the small and marginalfarmers (Gowda and Jayaramaiah, 1990). Theimplementation of watershed development programmethrough reclamation of soil drained, soil and landdevelopment activity increase par ha gross income by 88per cent (Alshi et al. 1991). The watershed developmentapproach in Gukbarga, Karnataka increased crop yield by80 to 100 per cent and double the income of farmer withinthree years (Biradar, 1991). The average yield of all cropsis higher in command area of watershed project than innon-command areas. The intensity of labor use as well asproductivity of labor in command area recorded a markedincrease over the time (Ghose, 1991).
The watershed programme depicted following impacts(Singh, 1991).
As a result of land development, the area underirrigation increased from 189 ha in 1984 to 1979 hain 1990 without lowering the water levels.
Increase in adoption of improved technology Increase use of fertilizers Increase in cropping intensity due to increased
availability of water. Increase in productivity and production of crops and Increase in areas under oilseed and pulses.
The programme had a very favourable response inagriculture as well as dairy sectors by increasingemployment opportunity. Improved agronomic practiceswhich were the major part of the programme, led to increasein the gross income from agriculture crops from 44.85 to73.70 per cent (Mahnot, et al. 1992). The watershedprogramme in addition to increasing labour employmentalso has led to increase in productivity of farm land up toRs. 1829/ha. in the forestation and has also improved thefuel resources (Mishra, 1991).The intensity of cropping intreated watershed was higher by 13 to 20 per cent thanthose in the non-treated areas. More than 50 per cent ofthe farmers have adopted improved technology in commandarea (Nema, 1991). The watershed technology significantlyraised water level in the area at the rate of 3.7 m per yearafter the implementation of the National WatershedDevelopment Project in Bundhelkhand region of UttarPradesh which significantly increased the intensity ofcropping (Singh &Thapaliyal, 1991). The productivitylevel, cost- benefit ratio, additional cost-benefit ratio and
employment in crop production increased significantly inwatershed area as compared to those in non-treated villages.Though, the productivity level of crops varied from yearto year in watershed villages vis-à-vis non watershedvillages (Raju et al. 1991). National watershedDevelopment Project in rainfed agriculture in HimachalPradesh lacked proper infrastructural facilities i.e. adequatestaff, proper storage facilities, contingency etc. whichhinder its working (Sikka et al, 1991).Total area of 77.12ha was benefited by soil conservation measures. Out ofthis, 51.44 per cent of the area was due to bund terracing,15.71 per cent due to bunding operation and 12.14 percent due to pasture development measures. The cultivatedarea increased by 0.50 ha/farm and irrigated area 1.42 perha per farm (Shrivastava, et al. 1991) in Mandsour districtof Madhya Pradesh. About 25 per cent of beneficiarieshave benefitted by land development work by way ofincrease in yield, irrigation potential and subsequent changein cropping pattern. The net irrigated area increased byabout 5 per cent. Almost all the farmers reported that supplyof seed and fertilizer under the programme could reducethe cost during the year. The increase in total income perhousehold worked out to be 5.5 per cent (Norman, et al.1991). The greatest efficiency gains in water use can bemade in agriculture where traditional irrigation by floodingor channeling water by gravity is inefficient (60% of thewater is lost by evaporation or infiltration), new techniquesof micro irrigation by drip systems allow an efficiency of95 % (Postel,1992). Agriculture and allied activities werefound to be the major source of income and this was 17per cent higher on watershed beneficiary farms as comparedto non-beneficiary farms (Nahatkar et al, 2003).Implementation of watershed development projects hasresulted in area expansion, increase in livestock production,and improvement in crop productivity (Babu et al,2004).Sharma et al (2008) observed that the gross returns,farm business income, return to labour. net returns, benefitcost ratio, cropping intensity and per cent area irrigated tototal land holdings were higher on sprinkler irrigated farmsthan on surface irrigated farms in typical rainfed areas ofRajasthan. The watershed-based development prorammehas resulted in increased crop production, productivity,employment generation, and farm income and groundwaterstatus, leading to overall rural prosperity in the area(Thomas et al 2009).
Thus, integrated watershed development approachimproves farm productivity and it is relevant to the Indianeconomy, considering its substantial benefits, impact onliving standard and employment in the vast dry area. Thefollowing need urgent attention in watershed areas formaking efforts more effective.
1. For achieving the goal of bringing irrigation waterto every farm, there is need to converge all ongoingefforts and to bridge the gaps through locationspecific micro-level interventions. This type of

16 Agricultural Situation in India
policy intervention is urgently needed looking to thelikely impact of climate change on agriculture.
2. The integrated approach for enhancing livelihood ofthe project area should be adopted throughidentification of income generating activities, itsvalue chain and needed technological interventionsaccordingly.
3. The identification of the areas with considerabledevelopment potential as growth centers and thepriorities needs to be fixed for its coverage underintegrated watershed development project.
4. The selected local government (Panchyats) withtechnical support from the State government and non-governmental organizations should be initiated andshould involve local people from the project planningand orientation.
5. There are some conspicuous grey areas in planning,implementation and evaluation of the projects. Assuch, no practice of performance, evaluation andmonitoring in many areas exist. After completion ofthe project, effective follow up mechanism shouldbe developed.
6. There is a need to improve the existing level oftechnology, especially for rainfed areas looking tothreat of climate change, linkage between research,extension and farmer training, appreciation offarmers, transfer of technology, and the flow of creditneeds to be strengthened. For instance there isabsence of farm client oriented research fordeveloping, adopting and evaluating technology. Thetechnology transfer on the basis of top downapproach does not seem to produce expected resultssince the farmers in India by and large are moreinfluenced by their neighbours than the scientist andthe extension personnel at district place. Furtherextension approach at present is generally specificcrop oriented and not an integrated approachaccomplished by rainfed agricultural technologies.
7. There should be proper coordination betweenimplementing authorities as well as potentialbeneficiaries in increasing soil conservation, waterharvesting structures, maintenance of these works andimproving quality of these structures.
8. Finally, the problem relating to the development ofPost-HarvestTechnology i.e. storage and marketingoff arm product etc., and development and linkagein command area must be considered. This will helpto ensure stability in return and thereby lead tosustained growth of output and employment.
Finally for sustainable development, management andutilization of natural resources in rainfed area/dry land areacan be achieved successfully through watershed approach.
This approach not only helps in sustainable managementof natural resources but will also assist in enhancing rurallivelihood security in India.
REFERENCES
Andhalkar, G.K., D.H. Ulemale, N.P. Tayde and S.U.Mokhale (2010). Arrival and Prices of major pulses inselected A.P.M.C's. in Amravati District, International Res.Journal of Agril. Econ. And Stat. 2(1)126.
Alshi, M.R. et.al (1991), Indian Journal of Agric. Econ.46(3): 310-311
Alagumani, T. (1991), Indian Journal of Agric. Econ.46(3): 300-301
Babu, Govind, Singh, R. K. and Singh, Babu (2004). AgrilEcon. Res. Rev., 17: 125-130.
Bavalatri,V.C. and Sunderaswamy, B. (1990), IndianJournal of Ext. Edu. 26: 67-69
Biradar, A.A. (1991), Indian Journal of Agric. Econ. 46(3):313
Deshpande, R.S. (2008), Indian Journal of Agril. Econ.,63 (3): 565-576.
Ghose, M.C. (1991), Indian Journal of Agric.Econ.46 (3):299-300
Gowada, Chadre,M.J. and jayaramana, K.M. (1990), IndianJournal of Ext.Edu. 25: 44-47
GTZ (1995), PimpalgoanWagha “The rain decided to helpus” Pub.by GTZ, Federal Republic of Germany
Harris, J.M. & Roach, Brian. (2013). Environmental andNatural Resource Economics: A Contemporary Approach,M.E.Sharpe, Armonk.
Khaper, S.D. and Rao B.N. (1987), Agril. Engg. Today,11: 71-79
Kahirsagar, K.G. and Goodake, R.D. (1991), Indian Journalof Agric.Econ. 46(3): 270-277
Mahnot, S.C. et.al (1992), Indian Journal of RuralDeelopment, 11: 219-227
Mishra, Siberannjan (1991), Indian Journal ofAgric.Econ.46(3): 298-299
Nahatkar, S. B., Mishra, P.K., Behoar, B.B. andRaghuwanshi, N.K. (2003). Indian Journal of Agric. Econ.,58 (3): 512.
Nahatkar, S. B. (2008). Indian Journal of Agril.Econ. 63(3): 531-532.
Nema, M.G. et.al (1991), Indian Journal ofAgric.Econ.46(3): 300-306
Norman, T.S.J. et.al (1991), Indian Journal of Agric. Econ.46 (3): 302
April, 2016 17
Palanisami, K. and Kumar, D. Suresh, 2009. Agril.Econ.Res. Rev. 22, pp 387-396.
Pararia, R.N. and Singh, R.P. (1990), Indian Journal ofExt. Edu. 26 (3&4) : 1-7
Postel, Sandra. (1992). Last Oasis: Facing Water Scarcity.New York
Ram Babu (1991), Indian Journal of Soil Conserv. 15 :145-151
Ramana (1991), Indian Journal of Agric.Econ.46 (3):251-259
Raju, P.V.V.S.C.K. et.al (1991), Indian Journal of Agric.Econ. 46 (3): 316
Rao, G.V.K.. et.al (1991), Indian Journal of Agric. Econ.46 (3): 316-317
Randhir, O.T. and Ravichandra (1991), Indian Journal ofAgric. Econ. 46 (3): 301
Reddy, T.N. and Shankarmurthy, G.G. (1991), IndianJournal of Agric. Econ. 46 (3): 316-317
Sandhu, H.S. and Kumar, Balbir (1986), Indian Journal ofAgric. Econ. 41 (4): 543
Saxena, K.K. et.al (1990), Indian Journal of Ext.Edu.26(3&4): 70-73
Sharma, H.O. et. al (2000) Crop Res. !9(3) : 447-451
Sharma, Madhu, Bhati, Javed and Sharma, Rajesh (2008).Indian journal of Agric. Econ, 63 (3): 532.
Sharma, B.R. and Scott, C.A. (2005). International WaterManagement Institute (IWMI) and International CropResearch Institute for Semiarid Tropics (ICIRSAT):Malhotra Publishing House, New Delhi: 245-257.
Shrivastava, A. et.al (1991), Indian Journal of Agric. Econ.46 (3): 297-298
Sikka, B.K. et.al (1991),, Indian Journal of Agric. Econ.46 (3): 308-309
Sandhu, R.S. (1998), Agril. Situ, in India, 2 (10): 117-119
Singh, Baldeo (1990), Indian Journal of Ext. Edu..26(3 & 4): 53-58
Singh, D.K. (1991), Indian Journal of Agric. Econ.4 6 (3):324-325
Singh, Karam et.al. (1991), Indian Journal of Agric. Econ.46 (3): 131-141
Singh, Katar (1991), Indian Journal of Agric. Econ. 46 (3):121-131
Singh, M.P. (1990), Indian Journal of Ext. Edu. 26(3 & 4): 48-52
Singh, Rajendra and Thapaliyal, K.N. (1991), IndianJournal of Agric.Econ.46 (3): 309-310
Surywanshi, S.D. et. al (1991), Indian Journal of Agric.Econ. 46 (3): 326-327
Taori, K.J. (1988), Indian Banking Today & Tomorrow15(5): 37-38
Thomas, K. et.al (2009). Agril.Econ. Res. Review, 22:407-414.
Tilekar, S.N. et.al (1986), Indian Journal of Agric. Econ.41 (4): 487-488
Undirwade, S.B. et.al (1991), Indian Journal of Agric. Econ.46 (3):311

18 Agricultural Situation in India
Abstract
The paper examines trends and pattern of growth ofSoyabean over time and across districts of Maharashtraduring 2000-01 to 2013-14.The analysis shows that thegrowth rates of area, production and productivity haveslowed down in the post 2000 period and in most of thedistricts, productivity levels are much below the potentialyield. Soybean, being a kharif crop, availability of water isextremely important for increasing its yield However, thearea under irrigation in case of Soyabean is only 0.4 percentat the state level in the year 2010-11.Thus, area expansionin case of Soybean is not followed by expansion of areaunder irrigation. Production of the crop may get adverselyaffected in case of scanty rainfall ultimately affectingincomes of farmers.Assured irrigation,timely provision ofquality seed and information regarding market prices andmarketing channels are of utmost importance to enhancethe yield of the crop for sustaining its growth and forprotecting incomes of the farmers dependent on itscultivation.
Keywords: soyabean productivity, increasing yield,assured irrigation, growth, protecting farmers income.
Introduction
The successful implementation of seed- water – fertilizertechnology in the 1960s lead to a remarkable increase inthe yields of foodgrain crops such as wheat and rice. Theneed to spread this technology to other crops was felt inview of increasing demand for these crops. Oilseeds wasone such class of crops, demand for which outpaced itssupply and India had to import edible oil. The TechnologyMission on Oilseeds (TMO) was launched in 1986 withthe objective of increasing production of oilseeds. As aresult, the oilseeds production increased and it wasobserved that after the launch TMO and during 1986-87until 1996-97, oilseeds production performed much betterthan the cereals. The area under and production of oilseedsgrew rapidly. This particular phenomenon was called‘yellow revolution’ wherein the crop pattern showedchanges - area under coarse cereals got replaced by oilseedsand pulses (Gulati and Kelly, 1999).India is now the fifthlargest producer of oilseeds after USA (20 percent)followedby Brazil (17 percent), China (12 percent), Argentina (11percent) and contributes 8 percent to the world productionof oilseeds.
With increasing production of oilseeds, per capitaavailability of edible oils started increasing. It was 3.2 kgin 1960-61 increased to 9 kg in 1999-2000 and was 15.8kg in 2012-13 (GoI, 2014a). However, it is observed thatthe consumption of edible oils has been growing faster thanits production. Since 2000-01, production of oilseeds grewat the rate of 4.7 percent per annum, but edible oilconsumption increased at the rate of 6.5 percent per annum(http://www.business-standard.com/article/press-releases/, February 20, 2013). As a result, imports of edible oilshave been playing an important role in increasing domesticavailability and satisfying domestic demand. The share ofimports in total domestic availability of edible oils is almost50 percent. Edible oil is an important category in our importbasket.It is observed that the share of agricultural importsin total merchandise imports was 3.2 percent in 2013-14.Out of this, the share of edible oils was 2.1 percent andduring 2000-01 to 2012-13and it grew at the rate of 19.6percent (GoIb, 2014).
Groundnut, Rapeseed-Mustard and Soybean are themajor oilseeds that contribute (2013-14) around 80 percentto the area and more than 85 percent to the total oilseedsproduction in the Indian context. The share of Soybean inarea and production of major oilseeds increased veryrapidly after it was introduced in 1970s. In 2013-14, around43 percent of the area and 36 percent of the production ofmajor oilseeds at all India level was contributed bySoybean. Area and production of Soybean increased rapidlyafter 1988-89 almost for a decade. However, with theinitiation of India’s own programme of economicliberalisation and the Uruguay Round Agreement, majorpolicy decision relating to edible oils was taken. Theseedible oils were put under open general license and theduty was lowered from 65 percent to 15 percent over aperiod of four years- from 1994 to 1998. Consequently,imports increased to the benefit of the consumers, pricesof edible oils crashed leading to temporary period of declinein area and production. However, there was again a spurtin 2004-05. Area and production of Soybean have beenincreasing since then.
In view of the growing demand for edible oils andgrowing dependence on imports for satisfying domesticdemand, it is important to increase production of oilseeds.As there are limits to area expansion, the production has toincrease through yield increase. However, inter countrycomparison of yields show that as compared to major
Soyabean Sector in Maharashtra: Bring Hope, Not Distress
JAYANTI KAJALE, SANGEETA SHROFF AND NARESH BODKHE*
*Gokhale Institute of Politics and Economics, [email protected] and [email protected]

April, 2016 19
Soyabean producing countries like the U.S. and Brazil,yield of Soyabean at all India level is very low.
Soyabean is grown mainly in Madhya Pradesh andMaharashtra which currently (2013-14)contribute morethan 80 percent to the total area and production.MadhyaPradesh, the highest producing state contributes around 52percent to the total area and 45 percent to total productionof Soybean. It is followed by Maharashtra which occupiesaround one third area under Soybean and contributes about40 percent to its total production. It is however observedthat per hectare yield in case of Maharashtra (1222 kg/ha)is higher than that in Madhya Pradesh (842 kg/ ha) in theyear 2013-14. Thus,Maharashtra is a major Soybeanproducing state with higher productivity of thiscrop.Though it is a major oilseed of the state, the currentlevel of its production has to be sustained and increasedfor the benefit of consumers as well as cultivators.In viewof the above, therefore, the main objective of this paper isto examine trends and pattern of growth of Soybean overtime and across districts of Maharashtra during 2000-01to 2013-14. The paper discusses leading and lagging
districts of Soybean and constraints facing this sector.Thepaper finally discusses policy implications. The study isbased on secondary data obtained from the stategovernment website (www.mahaagri.gov.in) and‘Agricultural Statistics at a Glance’, DES,GoI. Section Ipresents an overview of the cropping pattern of Maharashtraand growing importance of the oilseed sector. Section IIfocuses on district wise performance of Soybean in thepost 2000 period and the constraints faced. Section IIIdiscusses policy implications.
Section I
The Cropping Pattern of Maharashtra
Food grains occupy more than 50 percent of the area undercultivation in the state. However, gradually, the croppingpattern has been shifting towards non-food grain crops suchas oilseeds. Table 1presents area under major crops of thestate. It reveals that the share of food grains has declinedfrom 69 percent to around 54 percent and that of totaloilseeds has increased from 9 percent to 17 percentduring1973-74 to 2011-12.
TABLE 1: CROPPING PATTERN IN MAHARASHTRA (IN PERCENT)
Crop TE TE TE TE TE Percentage1973-74 1983-84 1993-94 2003-04 2011-12 change (%)
Total foodgrains 68.87 66.75 65.23 56.09 52.25 -24.13
Groundnut 3.27 2.45 2.69 1.54 1.25 -61.77
Soybean - - 1.78 5.90 12.71 614.04
Total oilseeds 9.27 7.88 12.24 11.36 16.28 75.62
Cotton 13.57 12.72 12.48 12.94 16.69 22.99
Sugarcane 0.91 1.45 1.93 2.38 3.89 327.47
Note: Gross cropped area for the latest years was not available; hence cropping patter was calculated for TE 2011-12.
Source: Calculated from District wise Statistical Information relating to Agriculture, GOM, Season and Crop Reports,GoM, various issues and www.mahagri.gov.in
Whereas area under cotton has increased marginally,that under sugarcane has increased considerably from 0.9percent to 3.86 percent. Today, food grains, oilseeds andcotton together contribute around 85 percent to the croppingpattern of the state. The growing importance of oilseedcultivation in Maharashtra’s agriculture is clear fromincreasing trend in area under oilseeds which was around15 lakh ha in 1970-71 and 44 lakh ha in 2013 -14 thusregistering an increase of more than 150 percent.
The Oilseed Sector:
As has been discussed earlier, the derived demand foroilseeds has been increasing due to a very high andincreasing demand for edible oils (which are highlysubstitutable) from consumers and from exporters ofSoybean meal. The per capita consumption of all edibleoils in India is 14.3 kg (2011) and is rising at the rate of
3-4 percent per annum (http://seaofindia.com/cdn/gallery/1424.pdf).
The major oilseed crop of Maharashtra was groundnuttill mid-1980s. Since then, the farmers have startedcultivating the non-conventional oilseed crop- Soybean.The area under this crop increased at a fast rate primarilyin the north east region of the state where the climaticconditions were suitable for its cultivation.
Table 2 shows shares of major oilseeds in total areaand production of oilseeds in Maharashtra after 1990s,when production of oilseeds other than groundnut startedincreasing. It is seen that share of all major oilseeds hasdeclined and that of Soybean has increased from 7 percentof the total oilseed area and 10 percent of the oilseedproduction in 1991to89 percent of the total oilseed areaand 92 percent of the total production in 2013-14.

20 Agricultural Situation in India
TABLE 2: PERCENTAGE SHARE OF MAJOR EDIBLE OILSEEDS IN AREA AND PRODUCTION OF TOTAL OILSEEDS IN MAHARASHTRA
Oilseed 1990-91 2000-01 2010-11 2013-14
A P A P A P A P
Groundnut 22.66 30.73 15.78 17.18 7.59 6.83 4.47 4.37
Soybean 7.27 10.12 44.61 63.13 75.23 85.36 89.47 92.71
Other oilseeds 70.07 59.15 39.61 19.69 17.18 7.81 6.06 2.92
Total oilseeds 100 100 100 100 100 100 100 100
Source: Same as in table 1.
payment 3-3.5 months after the crop was sown. Thus,shorter duration of crop was the major reason for cultivatingthis crop. Soybean seems to have replaced area not onlyunder other kharif oilseeds but also other kharif crops likeJowar, Rice etc. This phenomenon is noted by some studies(Khare, 1994; Gulati and Kelly, 1999.).
Section II
Area, Production and Productivity of Soyabean inMaharashtraFigure 1 depicts the movement of area, production andproductivity of Soybean in Maharashtra.
Shorter duration of the crop (i.e. 3 to 3.5 months- fromJuly to August) enables cultivators to increase the croppingintensity and add to their income/profits, which is notpossible for a kharif crop like cotton. One time harvest ofthe crop makes harvesting operation comparatively easier.Easy cultivation of the crop and benefits in terms ofimprovement in fertility also prompted farmers to undertakeSoybean cultivation. Studies have found that the crop isvery profitable as compared to other kharif crops likeCotton and Groundnut (Kajale, 2002: Kajale and Shroff2013).These studies found that Soybean cultivation wasvery profitable due to its high share in total gross value ofoutput and total net return and its potential to get onetime
It is observed that area under the crop increased bymore than 4000percent and the production by more than5000 percent during this period. It is the only crop whichhas registered a considerable area increase among allprincipal crops of the state during last two decades. It isobserved however that yield of Soybean has beenfluctuating from year to year. Nevertheless, it is higherthan other major Soybean growing states of MadhyaPradesh and Rajasthan.
Area, Production and Productivity of Soybean inVarious Districts
Table 3 shows shares ofdistricts in total state Soybeanacreage and production during last 20 years. It is observedthat Soybean is grown mainly in the north east region i.e.Vidarbha (Amravati and Nagpur divisions) and the centralregion i.e. Marathwada (Latur and Aurangabad divisions).Nagpur was the dominant district and the division in early1990s.This was followed by Kolhapur and Amravatidivisions. However, share of Nagpur and Kolhapur
M a h a ra s h tra
02 0 04 0 06 0 08 0 0
1 0 0 01 2 0 01 4 0 01 6 0 01 8 0 0
1987
-88
1989
-90
1991
-92
1993
-94
1995
-96
1997
-98
1999
-00
2001
-02
2003
-04
2005
-06
2007
-08
2009
-10
2011
-12
2013
-14
Y e a r
Prod
uctiv
ity (K
g. p
er h
a.)
0
1 0 0 0 0
2 0 0 0 0
3 0 0 0 0
4 0 0 0 0
5 0 0 0 0
6 0 0 0 0
Are
a (0
0 ha
.)
Prod
uctio
n (0
0 to
nne s
A r e a P ro d u c tio n P ro d u c tiv itySource: Same as in table 1
FIGURE 1: AREA, PRODUCTION AND PRODUCTIVITY OF SOYABEAN IN MAHARASHTRA

April, 2016 21
divisions declined continuously and that of Amravatiincreased.
Share of Amaravati as well as Latur divisions hasincreased and their combined share in total Soybean areais more than 66 percent in TE 2014. On the other hand,combined share of Nagpur and Kolhapur divisions hascome down from around 80 percent in TE 1993-94 to
around 23 percent in 2013-14.
A similar pattern is observed as far as production ofSoybean is concerned. The share of districts in Kolhapurand Nagpur divisions has been reducing over a period oftime. Currently, districts in Amravati and Latur divisionsare major Soybean districts and contribute around 70percent to the state Soybean production.
TABLE 3: SHARE OF DISTRICTS IN TOTAL STATE SOYBEAN ACREAGE AND PRODUCTION ( IN PERCENT)
Districts/Divisions Share in State Acreage Share in State Production
TE TE TE TE TE TE1993-94 2003-04 2013-14 1993-94 2003-04 2013-14
Konkan Dn. 0 0 0 0 0 0
Nasik 0.24 0.55 1.74 0.26 0.72 1.94Dhule 0.21 0.14 0.36 0.22 0.17 0.40Nandurbar 0 0.13 0.88 0 0.13 1.08Jalgaon 0.26 0.26 0.48 0.24 0.42 0.65Nasik Dn. 0.71 1.08 3.46 0.72 1.44 4.08Ahmednagar 0.11 1.03 1.89 0.11 0.89 1.74
Pune 0.13 0.04 0.16 0.12 0.06 0.33Solapur 0.13 0.04 0.17 0.15 0.03 0.26Pune Dn. 0.37 1.11 2.21 0.38 0.99 2.34Satara 1.01 1.13 1.37 0.92 1.59 1.85Sangli 9.58 4.12 2.08 14.09 5.33 2.78Kolhapur 7.56 4.86 1.59 13.95 6.99 2.97
Kolhapur Dn. 18.14 10.11 5.05 28.96 13.91 7.60Aurangabad 0.51 0.23 0.28 0.59 0.24 0.23Jalna 0.12 0.58 2.06 0.14 0.56 1.99Beed 0.66 1.24 2.57 0.57 1.08 3.24Aurangabad Dn. 1.29 2.05 4.91 1.3 1.87 5.46Latur 0.47 3.74 8.75 0.52 3.02 13.40
Osmanabad 0.01 0.8 3.50 0.01 0.31 3.94Nanded 0.17 3.28 6.06 0.18 3.4 6.12Parbhani 0.34 2.15 4.21 0.36 2.52 3.99Hingoli 0 4.43 4.87 0 5.2 5.23Latur Dn. 0.99 14.4 27.39 1.07 14.45 32.68Buldhana 1.23 6 8.98 1.51 6.76 9.93
Akola 1.1 2.26 4.99 1.18 2.1 5.03Washim 0 7.28 7.25 0 7.64 6.66Amravati 12.21 11.77 10.14 9.49 9.84 9.26Yavatmal 1.99 6.28 7.75 2.09 6.6 6.53Amravati Dn. 16.53 33.6 39.11 14.27 32.95 37.40Wardha 12.92 11.7 5.58 12.16 11.39 3.56
Nagpur 35.87 15.67 7.41 29.56 13.39 3.83Bhandara 3.77 0.63 0.22 2.7 0.61 0.10Gondia 0 0.01 0.00 0 0 0.00Chandrapur 9.35 9.46 4.49 8.83 8.83 2.81Gadchiroli 0.05 0.19 0.17 0.06 0.17 0.13Nagpur Dn. 61.97 37.65 17.87 53.31 34.39 10.44
Total Maharashtra 100 100 100.00 100 100 100.00Source: Same as in table 1.
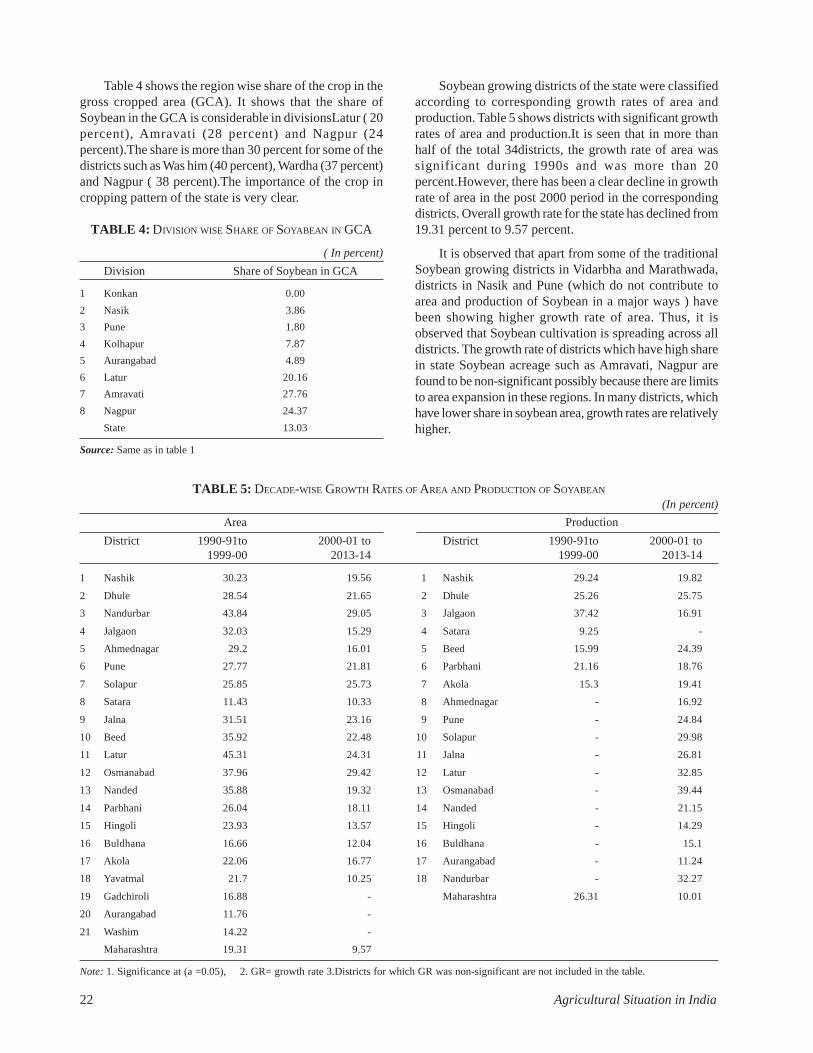
22 Agricultural Situation in India
Table 4 shows the region wise share of the crop in thegross cropped area (GCA). It shows that the share ofSoybean in the GCA is considerable in divisionsLatur ( 20percent), Amravati (28 percent) and Nagpur (24percent).The share is more than 30 percent for some of thedistricts such as Was him (40 percent), Wardha (37 percent)and Nagpur ( 38 percent).The importance of the crop incropping pattern of the state is very clear.
TABLE 4: DIVISION WISE SHARE OF SOYABEAN IN GCA
( In percent)Division Share of Soybean in GCA
1 Konkan 0.002 Nasik 3.863 Pune 1.804 Kolhapur 7.875 Aurangabad 4.896 Latur 20.167 Amravati 27.768 Nagpur 24.37
State 13.03
Source: Same as in table 1
Soybean growing districts of the state were classifiedaccording to corresponding growth rates of area andproduction. Table 5 shows districts with significant growthrates of area and production.It is seen that in more thanhalf of the total 34districts, the growth rate of area wassignificant during 1990s and was more than 20percent.However, there has been a clear decline in growthrate of area in the post 2000 period in the correspondingdistricts. Overall growth rate for the state has declined from19.31 percent to 9.57 percent.
It is observed that apart from some of the traditionalSoybean growing districts in Vidarbha and Marathwada,districts in Nasik and Pune (which do not contribute toarea and production of Soybean in a major ways ) havebeen showing higher growth rate of area. Thus, it isobserved that Soybean cultivation is spreading across alldistricts. The growth rate of districts which have high sharein state Soybean acreage such as Amravati, Nagpur arefound to be non-significant possibly because there are limitsto area expansion in these regions. In many districts, whichhave lower share in soybean area, growth rates are relativelyhigher.
TABLE 5: DECADE-WISE GROWTH RATES OF AREA AND PRODUCTION OF SOYABEAN(In percent)
Area Production District 1990-91to 2000-01 to District 1990-91to 2000-01 to
1999-00 2013-14 1999-00 2013-14
1 Nashik 30.23 19.56 1 Nashik 29.24 19.82
2 Dhule 28.54 21.65 2 Dhule 25.26 25.75
3 Nandurbar 43.84 29.05 3 Jalgaon 37.42 16.91
4 Jalgaon 32.03 15.29 4 Satara 9.25 -
5 Ahmednagar 29.2 16.01 5 Beed 15.99 24.39
6 Pune 27.77 21.81 6 Parbhani 21.16 18.76
7 Solapur 25.85 25.73 7 Akola 15.3 19.41
8 Satara 11.43 10.33 8 Ahmednagar - 16.92
9 Jalna 31.51 23.16 9 Pune - 24.84
10 Beed 35.92 22.48 10 Solapur - 29.98
11 Latur 45.31 24.31 11 Jalna - 26.81
12 Osmanabad 37.96 29.42 12 Latur - 32.85
13 Nanded 35.88 19.32 13 Osmanabad - 39.44
14 Parbhani 26.04 18.11 14 Nanded - 21.15
15 Hingoli 23.93 13.57 15 Hingoli - 14.29
16 Buldhana 16.66 12.04 16 Buldhana - 15.1
17 Akola 22.06 16.77 17 Aurangabad - 11.24
18 Yavatmal 21.7 10.25 18 Nandurbar - 32.27
19 Gadchiroli 16.88 - Maharashtra 26.31 10.01
20 Aurangabad 11.76 -
21 Washim 14.22 -
Maharashtra 19.31 9.57
Note: 1. Significance at (a =0.05), 2. GR= growth rate 3.Districts for which GR was non-significant are not included in the table.

April, 2016 23
In case of production, growth rate is significant andpositive in more number of districts in the latter decade ascompared to the earlier decade. Districts which had non-significant growth in the earlier decade, experiencedsignificant growth in the post 2000 decade. However,forthe state as a whole, the rate of growth of productionreduced to10 percent in the post 2000 period from 26percent in the earlier decade.
Table 6 shows growth rate of productivity. It can beobserved that the rate of growth has reduced in the post2000 period as compared to the earlier decade in most ofthe districts. As a result, the state level growth rate hasreduced to 0.41 percent in the latter decade.
TABLE 6: DECADE WISE DISTRICT WITH SIGNIFICANT
GROWTH OF YIELD UNDER SOYABEAN (IN PERCENT) 1990-91 to 2000-01 2000-01 to 2013-14
1 Akola 5.77 1 Akola 2.262 Amaravati 9.03 2 Amaravati 3.163 Dhule 4.88 3 Dhule 3.374 Jalgaon 6.06 4 Jalgaon 1.415 Parbhani 7.99 5 Parbhani 0.556 Buldhana 3.06 6 Buldhana 2.737 Kolhapur 4.53 7 Kolhapur 3.578 Wardha 4.18 8 Nandurbar 2.499 Chandrapur 17.63 9 Pune 2.49
10 Sangli 3.81 11 Solapur 3.3811 Yavatmal 8.15 12 Aurangabad 2.3212 Bhandara 6.8 13 Jalna 2.9613 Nashik 6.13 14 Beed 1.5614 Satara 9.59 15 Latur 6.87
Maharashtra 5.87 16 Osmanabad 7.73 17 Nanded 1.53 18 Hingoli 0.63
Maharashtra 0.41Source: Same as in table 1
Following table shows classification of districts according to the level of productivity. It also shows the correspondinggrowth rates of productivity.
TABLE 7: DISTRICT-WISE LEVELS OF PRODUCTIVITY OF SOYABEAN IN MAHARASHTRA IN TE 2013-14( In Kg/ha)
<1000 1000-1500 1500-2000 2000-2500 2500
Wardha Ahmednagar Nasik Solapur (3.38) Pune (2.49)
Nagpur Aurangabad (2.32) Dhule (3.37) Latur (6.87) Kolhapur (3.57)
Bhandara Jalna (2.96) Nandurbar (2.49) — —
Gondia Osmanabad (7.73) Jalgaon (1.41) — —
Chandrapur Nanded (1.53) Satara — —
Parbhani (0.55) Sangli — —
Hingoli (0.63) Beed (1.56) — —
Buldhana (2.73) — — —
Akola (2.26) — — —
Washim — — —
— Amravati (3.16) — — —
— Yavatmal — — —
— Gadchiroli — — —
Maharashtra (0.41)
Note: Figures in the parenthesis are growth rates, only significant growth rates are mentioned.Source: Same as in table 1
At all India level, productivity of Soybean for TE2013-14 was very low - 1181.3kg. per hectare and a numberof districts of Maharashtra were above the all India average.However, as compared to the productivity levels (Tn/ ha)in countries such as Brazil (2.9), Canada (2.9), U.S.A. (2.8)
etc, productivity levels of most of the districts are verylow. In 2013-14, in only four districts, productivity levelwas above 2000kg/ ha. In almost 18 districts, productivitywas below 1500kg/ha.

24 Agricultural Situation in India
The experimental yield of soybean in case ofMaharashtra was 30 quintals per ha (GoM, 2011).Discussions with the government officials and scientistsof the Agricultural Colleges revealed that the yield onirrigated land can go up to 28 quintals per hectare. We takethis figure as the potential yield in case of Maharashtra.The actual yield at the state level was less than half of thepotential yield i.e.12 quintals per ha. inTE 2013-14. Thus,if ideal conditions are provided to the crop, the yield cango upto the potential yield of soybean.Table 8 shows thatmajority of the Soybean growing districts are in the loweryield band ( below 1500kg/ha) and occupy more than 80percent of the area under the crop. The data shows that formaintaining and increasing production of Soybean, it isextremely essential to step up productivity in majority ofthe districts.
TABLE 8: NUMBER OF DISTRICTS AND AREA COVERED INDIFFERENT YIELD BANDS.
Yield band Number of districts Area covered (%)(Kg./ ha) covered
500-1000 5 23.8
1000-1500 10 58
1500-2000 3 11.4
2000-2500 2 3
2500 -3000 1 1.5
Source: CACP Report, GoI(2015), page 44.
Soybean is one of the major crops of the stateoccupying around 13 percent of the GCA. It occupiesaround 89 percent of the oilseed area and is an extremelyprofitable crop. It is observed that its net returns and thenet returns relative to paddy are considerably higher thanmajority of the kharif crops during 2010-11 to 2012-13 (GoI, 2015).Considering its importance in the state acreageand its profitability, sustaining growth rate of productionthrough productivity enhancement assumes importance forprotecting incomes of farmers dependent on this crop inthe kharif season and for avoiding distress situation.
The Constraints
The above analysis underlines the slowdown in the overallgrowth in case of Soybean. This definitely calls forimplementation of policies for arresting the slowdown inthe Soybean sector.
Since 1980s, the farmers in Maharashtra startedcultivating soybean. As is mentioned above, due to thefavourable climatic conditions and shorter duration of thecrop, area under other kharif crops was diverted to Soybean.On the other hand, because of increasing demand for edibleoils and their increasing prices in the domestic as well asinternational markets, area under Soybean and itsproduction increased rapidly. However, the analysis reveals
that in majority of the districts, yield levels are much lowerthan the potential yield.It is also observed that yield levelscan rise under favourable conditions. Table 7 shows thatonly in 4 districts, the productivity is more than 2000 kgper ha. Soybean being a kharif crop, availability of wateris extremely important for increasing yield of the crop. Asper the data available (2010-11), only 4 percent of the totalarea under major oilseeds (kharif and rabi) in Maharashtrawas irrigated as against 25 percent at all India level (GoI,2014b). The area under irrigation in case of Soybean isonly 0.4 percent at the state level in the year 2010-11 andis marginally less than that at the all India level which standsat 0.6 percent for 2010-11. The data relating to the earlieryears shows that proportion of area under irrigation in caseof Soybean has been declining in the post 2000 period inMaharashtra. It was 1.3 percent in the year 1999-000, 1percent in 2004-05, 0.5 percent in 2005-06 and has nowreduced to 0.4 percent in 2014. Thus, area expansion incase of soybean is not followed by expansion of area underirrigation. This is a cause for concern as the productivityand production of the crop may get adversely affected incase of scanty rainfall, ultimately affecting the incomes ofthe farmers. Availability of water appears to be one of themajor reasons for productivity differentials. Productivitylevels are higher for districts in Western Maharashtra whichare better endowed with water resources in terms ofirrigation. The available data (2002-03) shows that whereasthe combined percentage of net area irrigated to net sownarea was 27.8 percent for Pune and Kolhapur divisions, itwas much lower for other regions.(GoM, 2013). Thisexplains the productivity differentials between districts ofwestern Maharashtra such as Kolhapur, Pune, Solapur andthose in rest of Maharashtra.
Section III
Conclusions and PolicySuggestions
The district wise and state level analysis of the secondarydata reveals the dominant position that the Soybean crophas come to occupy in the cropping pattern of the state. InTE 1993-94, only 1.78 percent of the GCA was under thiscrop, in 2011-12, it has increased to almost 13 percent ofthe GCA. The area and production of the crop have grown600 times and 399 times respectively during 1984-85(1987-88 in case of production) and 2013-14. Almost 90 percentof the acreage under total oilseeds is contributed bySoybean. Studies have noted shift of area under kharif cropssuch as Jowar, Paddy, Groundnut as well as Cotton andSugarcane over the years towards this crop. The growthrates of area under and production of Soybean indicatepositive and significant growth in the post 2000 period inalmost all the districts growing soybean. From the demandside, the increasing prices of Soybean and Soybean oil haveprovided incentive to the farmers for its cultivation. Thishighlights the relative profitability of the Soybean crop inMaharashtra.

April, 2016 25
However, the analysis also reveals that the growthrates of area and production – district wise as well as at thestate level have slowed down in the post 2000 period.Growth rate of productivity also is very low in most of thedistricts in the post 2000 period. The major factor thatseems to explain this is the lower extent of area underirrigation. It is a kharif crop and depends upon vagaries ofnature. The available data shows that the area irrigatedunder Soybean was only 0.4 percent. In view of increasingdemand for edible oil and increasing reliance on importsto satisfy the domestic demand, productivity enhancementthrough provision of assured irrigation would help inmaintaining and increasing the current level of Soybeanproduction. Other major constraints that are generally facedby the cultivators are the technological ones– relating toseed and the marketing constraints. Timely provision ofquality seed and information regarding market prices andmarketing channels are of utmost important to enhanceyield of the crop as there are limits to area expansion.Thus,astrong extension machinery is needed to advise the farmerson various aspects of production and marketing. Districtswhich have higher productivity levels need to be studiedin greater details so as to propagate /replicate farmingpractices and inputs used in these districts to other districtsthrough credible extension services ( GoI , 2015).
Sustaining growth of Soybean crop would help insustaining incomes of the farmers dependent on itscultivation. Also, considering the forward linkages ofSoybean seed sector with the industry, this would benefitnot only for the farmers but also the consumers and theagricultural sector as a whole.
References
Government of Maharashtra (2011), ‘ComprehensiveState Agricultural Plan: Maharashtra State (2007-2011-12)’,Prepared by Commissioner Agriculture, GoM andGokhale Institute of Politics and Economics,Pune.
.................. (various years), ‘District wise StatisticalInformation relating to Agriculture’,Part II, Ministry ofAgriculture, GOM, various issues.
.................. (2013) ‘Selected Indicators for Districtsin Maharashtra and States in India’, Directorate ofEconomics and Statistics, Mumbai.
Government of India (various years), ‘Season and CropReport’, Office of the Commissioner of Agriculture, Pune.
.................. (2014a), ‘Agricultural Statistics at aGlance’, Directorate of Economics and Statistics, Ministryof Agriculture, New Delhi.
.................. (2014b) ‘Economic Survey ofIndia’,Mistry of Finance, New Delhi.
.................. ( 2015), ‘Price Policy for Kharif Crops:Marketing Season 2015-16’, Commission for AgriculturalCosts and Prices, Ministry of Agriculture, New Delhi.
Gulati, Ashok and Tim Kelly (1999), TradeLiberalisation and Indian Agriculture, Oxford UniversityPress, New Delhi
Kajale, Jayanti (2002), ‘Likely Impact of LiberalisedImports and Low Tariffs on Edible Oil Sector in India: AQuick Survey of Soybean in Maharashtra’ unpublishedreport, Agro-Economic Research Centre, Gokhale Instituteof Politics and Economics, Pune.
Kajale and Shroff (2013), ‘Problems and Prospectsof Soybean Cultivation in Maharashtra’ unpublished report,Agro-Economic Research Centre, Gokhale Institute ofPolitics and Economics, Pune.
Khare, M.P. 1994.Pulses and Oilseeds Scene inMaharashtra, GIPE Monograph Series 39, Agro- EconomicResearch Centre, Gokhale Institute of Politics andEconomics, Pune
Websites
http://www.business-standard.com/article/press-releases/, February 20, 2013
http:// www.agrimah.gov.in
http://www.seaofindia.com
26 Agricultural Situation in India
Abstract
Horticulture, the fastest growing sector withinagriculture,presently contributes 30.4 per cent ofagricultural GDP. The farmers have shifted fromconventional crops to horticulture production and tofloriculture in recent years but the concern is that whetherproduction growth is at par with productivity growth andthus,in the following study, growth trend of area, productionand productivity of fruits, vegetables and flowers wasestimated. The riskiness in the production of horticulturalcrops was estimated using instability index. Thecontribution of area and productivity in the productiongrowth was also estimated. The results revealed that thegrowth in production was mainly due to the growth inproductivity area rather than production especially in flowerproduction and this means stress on land in coming years.The instability analysis reveals that there is high riskinessin flower production as compared to Fruits and vegetableproduction. The contribution of area in productivity washigh in all the three crops. The results show that availabletechnologies are not adequate to push up the yield of thesecrops. Therefore, generation and dissemination oftechnologies is a matter of great challenge for researchersand extension agencies.
Keywords: Horticulture, Compound Growth Rate,Instability Index, Decomposition
Introduction
The horticulture sector encompasses a wide range of cropse.g., fruit crops, vegetable crops, ornamental crops etc.India, with its wide variability of climate and soil, is highlyfavorable for growing a large number of horticultural crops.It is the fastest growing sector within agriculture. Itcontributes in poverty alleviation,nutritional security andhave ample scope for farmers to increase their income andbe helpful in sustaining large number of agro-basedindustries which generate huge employment opportunities.Presently horticulture contributes 30.4 per cent (ICAR) ofagricultural GDP. The national goal of achieving 4.0 per
cent growth in agriculture can be achieved through majorcontribution from horticulture growth.
After the Green Revolution in mid-sixties, it becameclear that horticulture, for which the Indian topography andagro climate are well suited, is the best option. India hasemerged as the largest producer of mango, banana andcashew and second largest producer of fruits & vegetablesin the world. The most significant development thathappened in the last decade is that horticulture has movedfrom rural confines to commercial production and thischanging scenario has encouraged private sector investmentin production system management. The last decade has seentechnological infusion like micro-irrigation, precisionfarming, greenhouse cultivation, and improved post harvestmanagement impacting the development, but during theprocess various issues have emerged.
The horticultural sector has received considerableattention in recent years as it is recognized as a potentiallyimportant source of growth, employment generation andforeign exchange earnings. The emphasis being given tothis sector is reflected by establishing National HorticultureMission in 2004.The priority areas under the missioninclude horticultural research and development, improvingpost harvest management and promoting processing andmarketing of horticultural crops. The special attention isdevoted to the promotion of horticultural export throughestablishment of focal Agricultural Export zones(AEZs).Horticultural crops play a unique role in India'seconomy by improving the income of the rural people.Cultivation of these crops is labor intensive and as suchthey generate lot of employment opportunities for the ruralpopulation. Fruits and vegetables are also rich source ofvitamins, minerals, proteins, and carbohydrates etc. whichare essential in human nutrition. Hence, these are referredto as protective foods and assumed great importance asnutritional security of the people. Thus, cultivation ofhorticultural crops plays a vital role in the prosperity of anation and is directly linked with the health and happinessof the people.
Horticultural Crops in India- Growth, Instability and Decomposition Approach
PUNIT KUMAR AGARWAL*, PUSHPAYADAV**SANTOSH KUMAR***AND DIVYA PANDEY****
* Assistant Professor, Ramakrishna Mission Vivekananda University Ranchi, 834008.** Assistant Professor, Junagadh Agricultural University, Gujarat.*** Research Scholar, Institute of Agricultural Science, Banaras Hindu University, Varanasi, U.P.**** Research Associate, NICRA, DESM Division, National Dairy Research Institute, Karnal, Haryana*[email protected].

April, 2016 27
The recent emphasis on horticulture in our countryconsequent to the recognition of the need for attainingnutrition security and for more profitable land use hasbrought about a significant change in the outlook of thegrowers. The need for great utilization of availablewastelands against the background of dwindling water andenergy resources has focused attention to dry land, to aridand semi-arid tracts and to horticultural; crops which havelesser demands on water and other inputs besides being 3to 4 times more remunerative than field crops. The farmershave shifted from conventional crops to flower productionbut the concern is that whether production growth is at parwith productivity growth or it is just due to area growth,which might not be sustainable in the long run. So thepresent study is undertaken with a view to analyze trend,growth and variability, of horticultural crops with thefollowing specific objectives:
(i) To examine the growth rate in area, production andproductivity of major horticultural crops.
(ii) To measure the instability in their area, productionand productivity.
(iii) To estimate the relative contribution of area andproductivity in their growth of production.
Methodology
Estimation of Growth Rates
Growth rates are worked out to examine the tendency ofvariable to increase, decrease or remain stagnant over aperiod of time. It also indicates the magnitude of the rateof change in the variable under consideration per unit oftime.
The rate of change of 'Yt' per unit of time to expressas a function of the magnitude of 'Yt' itself is usually termedas the Compound Growth Rate (CGR) which can beexpressed mathematically as:
Y
Y- Y
ddY
Y1 CGR
t
t1t
t
t
t
………………………. (i)
The above expression if multiplied by 100 gives thecompound growth rate of 'Yt' in percentage term.
There are many alternative forms of growth functionviz., linear exponential, modified exponential, Cobb-Douglas etc. which have been developed and used by theresearcher.
The mathematical form of log-linear function (alsoknown as exponential function) is as follows:
Yt = Aebt ........................................................... (2)
The log transformation of this function is as follows:
LogeYt = loge A + bt
Differentiating it with reference to 't' gives,
t
t
t ddY
Y1
= b
Or,
t
t
t bY d
dY ................................... (3)
The formula for calculating Compound Growth Rate(CGR) from the log-linear equation can be derived asfollows:
Let "Y0" be the value of variable under study in thebase period.
'Yt' be the value of variable in time't'. 'Y' be the valueof Compound Growth Rate (CGR) then using thecompounding formula, We get,
Yt = Y0 (1 + r)t.
Log - transformation of the above i.e.
Log Yt = logY0 + t log (1+r).
Assuming,
Log Y0 = log A.
Log (1+r) = b,
The same expression can be put as-
Log Yt = log A + bt
From the log-linear form, CGR can be worked out asfollows:
By differentiating,
b
dtYt logd
But, the estimate of 'b' in the log-linear function is insemi-log terms. Therefore, to convert it into the originalform of Yt following transformation is done—
Since b = log (1+r)
Antilog (b) = 1 + r
r = (Antilog 'b')- 1
CGR in percentage = [(Antilog 'b') - 1] x 100
28 Agricultural Situation in India
3.5.2 Measurement of Instability
Instability is the deviation from the trend and many of theresearchers have used the coefficient of variation (CV %)as a tool of instability. An index of instability was computedfor examining the nature and degree of instability in area,production and productivity of Horticultural crops atnational level . Simple CV does not explain properly thetrend component inherent in the time series data so theInstability Index suggested by Cuddy-Della Valle (1978)was used as a better measure of variability.
II = CV ×
CV =
100 x x
Where,
II = Instability index
R– 2 = Adjusted coefficient of determination
CV = Co-efficient of variation
= Standard deviation of the variable
x– = Mean of the variable.
3.5.3 Decomposition of Analysis
To estimate the contribution of area, productivity andinteraction of the two in total production, the followingadditive scheme of decomposition can be used:
YA AA Y YYA P 0n00n0
/PYA /PYA /PAY 1 00
Where,
P = Change in production
A0 = Area in base year
An = Area in current year
Y0 = Yield in base year
Yn = Yield in current year
A= Change in area (An - A0)
Y = Change in yield (Yn – Y0).
The Data
The data on area, production and productivity of fruits,vegetables and flowers for the present study has been takenfrom the Indian Horticulture Database (2011) publishedby National Horticulture Board. The data pertains to theperiod 1991-1992 to 2009-2010.
Result and Discussion
Measuring the Growth Rates of Horticultural Cropsviz. Fruits, Vegetables and Flowers
The growth in area, production and productivity of fruits,
vegetables and flowers in India has been presented in Table1. The area production and productivity of total fruits inIndia registered a positive growth rate, significant at 1percent probability level. The growth in production was largelyattributable to the growth in area (6.0 per cent per annum)and was supplemented by productivity growth of 0.90 percent per annum implying that the increase in production offruit crops was mainly due to the increase in its area ratherthan increase in productivity.
Area, Production and Productivity of Vegetables alsorecorded a significant and positive growth in study period(2001-2010). The growth in productivity of vegetables ishalf that of growth in its area. Growth rate of productionwas found much higher 6.3 per cent per annum and wasmainly due to major contribution of growth in area.
The production and area of flowers in India recordedpositive growth rate, and was higher than that of fruits andvegetables both, during the study period. Despite the highrate of area growth, the production did not show asignificant growth because of the decline in its productivity.
The above results show that the increase in productionof horticultural crops has largely been influenced by theincrease in area but in long term this is not feasible as areacan only be increased up to a certain level. Measures needto be taken to improve the productivity of the horticulturalcrops so that their production can be increased withoutputting a pressure on the land resource. Flower productionhas gained much importance in recent years and thus hasinterested horticulture growers who have increased the areaunder flower crop to increase the production but specialattention needs to be given to its productivity if benefitsare to be drawn in long run.
Instability Analysis
Coefficient of variation (%)and Instability Index of area,production and productivity of the Horticultural crops wereworked outand are presented in table 2.
It is revealed from the table that Instability index inarea, production and productivity was observed to behighest in flowers.This shows that there is riskiness in itsproduction. The instability in production was lowest in caseof fruits showing that it is less risk prone. High instabilityin flower production might be due the reason that there isno specific market available for flowers, as it is not directlyconsumed, as compared with fruits and vegetables.
Decomposition Analysis
The analysis of the factors affecting the total production ofthe Horticultural crops Table 3 indicate the area effect ismaximum in Flower crops (173 per cent) followed by Fruitcrops (86.32 per cent) and minimum in Vegetables (59.44per cent). The contribution of Productivity is negative inFlower crops (-37.38 per cent) whereas in the case ofVegetables and Fruits yield effect is positive but Fruit crop
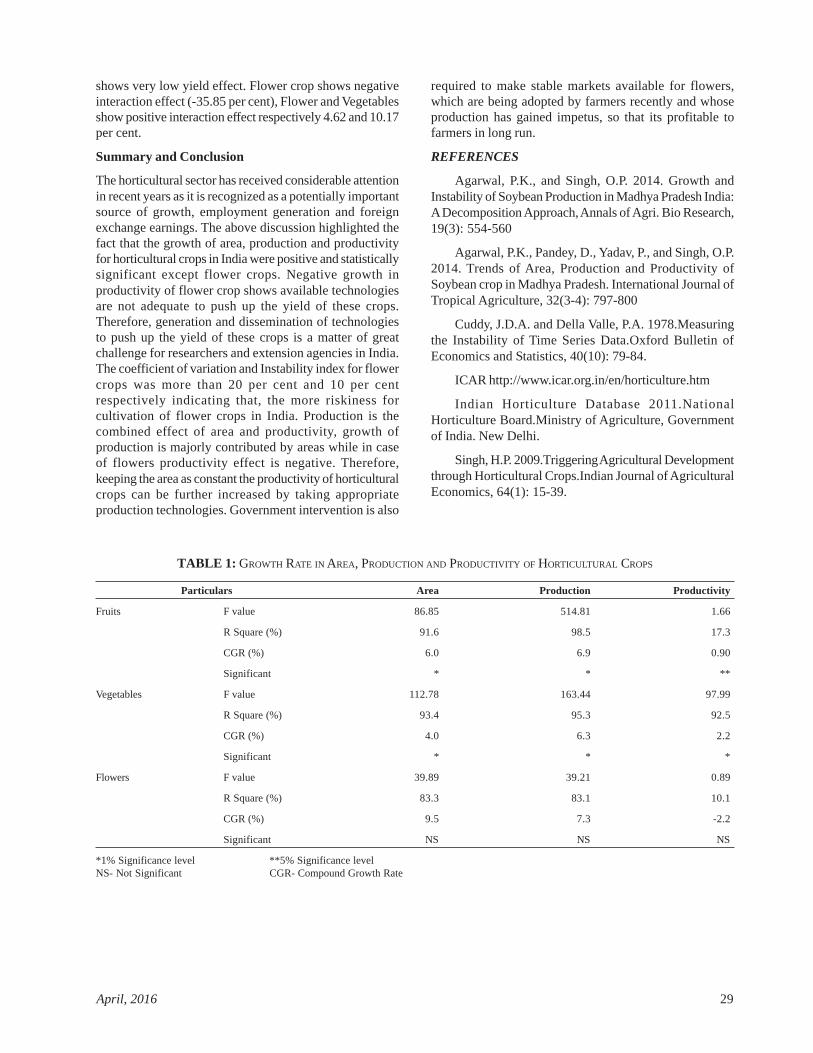
April, 2016 29
shows very low yield effect. Flower crop shows negativeinteraction effect (-35.85 per cent), Flower and Vegetablesshow positive interaction effect respectively 4.62 and 10.17per cent.
Summary and Conclusion
The horticultural sector has received considerable attentionin recent years as it is recognized as a potentially importantsource of growth, employment generation and foreignexchange earnings. The above discussion highlighted thefact that the growth of area, production and productivityfor horticultural crops in India were positive and statisticallysignificant except flower crops. Negative growth inproductivity of flower crop shows available technologiesare not adequate to push up the yield of these crops.Therefore, generation and dissemination of technologiesto push up the yield of these crops is a matter of greatchallenge for researchers and extension agencies in India.The coefficient of variation and Instability index for flowercrops was more than 20 per cent and 10 per centrespectively indicating that, the more riskiness forcultivation of flower crops in India. Production is thecombined effect of area and productivity, growth ofproduction is majorly contributed by areas while in caseof flowers productivity effect is negative. Therefore,keeping the area as constant the productivity of horticulturalcrops can be further increased by taking appropriateproduction technologies. Government intervention is also
required to make stable markets available for flowers,which are being adopted by farmers recently and whoseproduction has gained impetus, so that its profitable tofarmers in long run.
REFERENCES
Agarwal, P.K., and Singh, O.P. 2014. Growth andInstability of Soybean Production in Madhya Pradesh India:A Decomposition Approach, Annals of Agri. Bio Research,19(3): 554-560
Agarwal, P.K., Pandey, D., Yadav, P., and Singh, O.P.2014. Trends of Area, Production and Productivity ofSoybean crop in Madhya Pradesh. International Journal ofTropical Agriculture, 32(3-4): 797-800
Cuddy, J.D.A. and Della Valle, P.A. 1978.Measuringthe Instability of Time Series Data.Oxford Bulletin ofEconomics and Statistics, 40(10): 79-84.
ICAR http://www.icar.org.in/en/horticulture.htm
Indian Horticulture Database 2011.NationalHorticulture Board.Ministry of Agriculture, Governmentof India. New Delhi.
Singh, H.P. 2009.Triggering Agricultural Developmentthrough Horticultural Crops.Indian Journal of AgriculturalEconomics, 64(1): 15-39.
TABLE 1: GROWTH RATE IN AREA, PRODUCTION AND PRODUCTIVITY OF HORTICULTURAL CROPS
Particulars Area Production Productivity
Fruits F value 86.85 514.81 1.66
R Square (%) 91.6 98.5 17.3
CGR (%) 6.0 6.9 0.90
Significant * * **
Vegetables F value 112.78 163.44 97.99
R Square (%) 93.4 95.3 92.5
CGR (%) 4.0 6.3 2.2
Significant * * *
Flowers F value 39.89 39.21 0.89
R Square (%) 83.3 83.1 10.1
CGR (%) 9.5 7.3 -2.2
Significant NS NS NS
*1% Significance level **5% Significance levelNS- Not Significant CGR- Compound Growth Rate

30 Agricultural Situation in India
TABLE 2: VARIABILITY IN AREA, PRODUCTION AND PRODUCTIVITY OF HORTICULTURAL CROPS IN INDIA
Particulars Area Production Productivity
Fruits SD 923 11686 682
Mean 5306 58038 10916
CV (%) 17.40 20.14 6.25
Instability Index 5.36 2.63 6.03
Vegetables SD 897 21587 1098
Mean 7218 112723 15501
CV (%) 12.43 19.15 7.08
Instability Index 3.40 4.37 2.07
Flowers SD 39 186 1613
Mean 138 795 6017
CV (%) 28.67 23.42 26.81
Instability Index 12.43 10.24 26.97
TABLE 3: AREA EFFECT, YIELD EFFECT AND INTERACTION EFFECT ON PRODUCTION GROWTH OF HORTICULTURAL CROPS IN INDIA
S. No. Description Fruits Vegetables Flowers
1 Change in yield variance (%) 9.06 30.39 -37.38
2 Change in area variance (%) 86.32 59.44 173.34
3 Interaction between changes in mean area and mean yield (%) 4.62 10.17 -35.85
April, 2016 31
Abstract
The present study examined the feed and fodder status ofdairy animals in India. The study evaluated that livestockpopulation increased over the years with a growth rate of2.80 per cent whereas,in spite of growth in livestockpopulation, area under fodder crops has been decreasingover the years.The area under fodder crops which was18.41, 4.41 and 11.47 million hectares for jowar, maizeand bajra crops, respectively for the year 1960-61,hasdecreased to 2.68 and 8.39 million hectares for jowar andbajra crops, but in case of maize crop, there was littlepositive change during 2011-12 as area under maizeincreased to 7.27 million hectares with production of 15.86million tonnes. The growth rate for area under maize cropwas calculated to be 1.00 per cent whereas for jowar andbajra crops, there was negative growth rate of 3.68 and0.63 per cent, respectively. The demand and supply gapalso exists for green and dry fodder crops as according toan estimate, during 2025, the gap will tend to increase by64.87% for green and 24.92% for dry fodder, respectively.Nutrient deficiency is being the major constraint which wasobserved in feed and fodder. The best substitutes toovercome these problems are silage and hay making,compounded cattle feed, densified block technology andwanda-feeding material etcwhich need to be adopted forhealthy and long living life of dairy animals.
Keywords: Densified Feed Block, dairying, feed and fodderand livestock.
Introduction
India is predominantly an agricultural country and nearlythree-fourth of the population depends on agriculture,livestock and allied sectors for livelihood. Nearly 70percent of country’s population lives in rural areas.Livestock is also an important asset for them which provideemployment to millions of rural people. Rapid growth oflivestock sector is therefore most desirable not only tosustain steady agriculture growth but also to reduce ruralpoverty especially when a majority of land holders are lessthan 2 hectares and about 30 percent of rural householdsare landless. Before green revolution animal was the mainsource of draft power due to economic factors andnecessities of the new technology (Sidhu and Grewal, 1991and Sidhu and Singh, 2004).The demand of milk was
114.93 million tonnes in 2011 and will tend to increase to181.95 million tonnes in 2030 at a growth rate of 7 percent (Sekhonet al 2012). Milk production helps the farmersto engage the semi-employed family labour more efficientlyduring slack period of crop production. Additionally, itgenerates employment for landless labourers also. It alsoimproves the socio-economic profile of dairyfarmers(Gangasagare and karanjkar, 2009 and Kashish andDhawan, 2015). Though a positive relationship betweenland ownership and dairy farming existed but dominanceof small holders (< 2 ha) in commercial dairying (Brithal2008 and Sharma et al 2003), still prevails. Majority ofmilk producers are small holders and contribute more than70 per cent to total milk production in India (Dries et al2004, Minten et al 2007 and Maertens et al 2007).
Fodder is an agricultural term for animal feed andfodder crops are those plants that are raised to feed livestockanimals (Datta, 2013). With increasing animal population,the demand for feed and fodder is increasing year by yearbut the area under fodder crop was decreasingtremendously. So, with the decreasing area under foddercrop, the cattle feed demand was increasing over theyear.According to annual report of Department of AnimalHusbandry, Dairying (DAHD) 2013-14, the demand fordry fodder was 416 million tonnes, but the availability wasonly 253 million tonnes with a gap of 40 per cent and thedemand of green fodder was 222 million tonnes andavailability was only 143 million tonnes with a gap of 36per cent.
Data and Methodology
The present study was based on secondary data. The dataon livestock population, area under fodder crop, demandand availability of feed and fodder etc from 1980-81 to2012-13 was collected from various issues of StatisticalAbstracts of Punjab, Annual reports of Department ofAnimal Husbandry and Dairying (DAHD), Governmentof India, Ministry of Agriculture, New Delhi andIndiastat.com.
The growth rates were calculated for the data relatedto livestock population, demand and availability of greenfodder and dry fodder and area and production of differentfodder crops in India.
Advancements in Dairy Feed Industry- An Alternative Way to Overcomethe Scarcity of Fodder in India
KASHISH* AND VIKRANT DHAWAN**
*Quality Control Incharge, MARKFED cattle feed and allied Industries, Gidderbaha-152101, Distt- Sri Muktsar Sahib (Punjab),E-mail: [email protected]** Senior Research Fellow, Department of Agronomy, Punjab Agricultural University Ludhiana-141004 (Punjab)E-mail: [email protected]
32 Agricultural Situation in India
Results and DiscussionLivestock Population in IndiaThough animal serves a number of purposes but their utilityhas been undergoing a steady transformation driven by thechanging food consumption pattern. Livestock, as a draughtpower, has declined considerably due to mechanization ofagricultural operations. Livestock population in India waspresented in Table 1.The livestock population consists ofcattles, buffaloes, sheep, goat and poultry etc. The cattlepopulation in India was 198.88 million during 1997 censuswhich decreased to 185.20 million during 2003 census andthen increased to 190.9 million during 2012 census withan overall growth rate of - 0.31 per cent per annum from1997 to 2012. The sheep population consists of 57.49,61.50 and 65.10 million during 1997, 2003 and 2012census, respectively.
TABLE 1: LIVESTOCK POPULATION IN INDIA
Sr. Species Livestock census (Million No.) Growth rateNo. (%age)
1997 2003 2007 2012 (1997 to2012)
1. Cattle 198.88 185.2 199.1 190.9 -0.31
2. Buffalo 89.92 97.9 105.3 108.7 1.39
3. Sheep 57.49 61.5 71.6 65.1 0.77
4. Goat 122.72 124.4 140.5 135.2 0.61
5. Poultry 347.61 489.0 648.9 729.2 5.03
Total 816.62 958.0 1165.4 1229.1 2.80
Source: 19th livestock census Report, 2012.
Table 1 show that an overall growth rate for sheep,goat and poultry consists of 0.77, 0.61 and 5.03 per centper annum, respectively. The data clearly indicates that thecattle population was considerably decreasing over theyears. The buffalo’s population in India was 89.92 millionduring 1997 census, which increased to 97.90 millionduring 2003 census and then showed a huge increase to108.7 million during 2012 census with an overall annualgrowth rate of 1.39 per cent per annum from 1997 to 2012.
Feed and Fodder Status in IndiaAn uninterrupted availability of fodder is a pre-requisitefor improving the productivity of livestock and to makelivestock production cost efficient. It is impossible toachieve the targeted growth of livestock sector in thecoming years without adequate supply of quality feed andfodder. Grazing in pastures, commonly fallow lands andharvested grasses are the main fodder source of smallruminants like sheep and goat as well as large ruminants toa limited extent. Mostly landless farmers, who do not havesufficient land to grow fodder for their animals, generallytake their animals for grazing.
The supply of and demand for feed and fodder waspresented in Table 2. The table was clearly indicating thatthere exist a gap between demand and supply of fodder. In1995, the supply of green fodder and dry fodder was 379.30and 421 million MT against demand for 947 and 526million MT, respectively, with a deficit gap of 59.95 percent in green fodder and in dry fodder, the deficit gap was19.95 per cent. Later on, during the year 2000, the supplyof green and dry fodder increased to 384.50 and 428 millionMT and demand was 988 and 549 million MT, respectively.The demand deficit gap for green fodder, was 61.10 percent and for dry fodder it was 21.93 per cent. In 2015, thedemand and supply deficit gap would be 63.50 and 23.56per cent for green and dry fodder. In 2025, the demandand supply deficit gap will be increased by 759 millionMT for green and 162 million MT for dry fodder.
Low digestibility in improving utilization, scarcity ofprotein are other major constraints of cattle feed (Patel RK,1993). The availability and requirement of crude protein(CP) and total digestible nutrients (TDN) from concentrateswas presented in Table 3. During 2000, the availability ofCP was only 30.81 MT against requirement of 44.49 MTwith deficit of 30.75% and if we talk about the availabilityof TDN in concentrates, which was 242.42 MT againstrequirement of 321.29 MT with net deficit of 24.55%.During 2015, there is net deficit of CP and TDN was28.44% and 24.04%. In 2025, the availability andrequirement gap will increase with deficit of 25.38% forCP and 23.14% for TDN from concentrates. The available
TABLE 2: DEMAND AND AVAILABILITY OF GREEN AND DRY FODDER IN INDIA(Million MT)
Sr. Year Supply Demand Deficit as % demandNo. (actual demand)
Green Dry Green Dry Green Dry
1. 1995 379.30 421 947 526 59.95 (568) 19.95 (105)2. 2000 384.50 428 988 549 61.10 (604) 21.93 (121)3. 2005 389.90 443 1025 569 61.96 (635) 22.08 (126)4. 2010 395.20 451 1061 589 62.76 (666) 23.46 (138)5. 2015 400.60 466 1097 609 63.50 (696) 23.56 (143)6. 2020 405.90 473 1134 630 64.21 (728) 24.81 (157)7. 2025 411.30 488 1170 650 64.87 (759) 24.92 (162)
Growth Rate (%age) 0.23 0.54 0.76 0.69 0.23 0.77(1995 to 2025)
Source: Report of the working group on Animal Husbandry and dairying for the Eleventh five year plan (2007-2012), Planning Commission, Government of India
April, 2016 33
forages are poor in quality, and lack prooper energy, proteinand minerals.To compensate for the low productivity ofthe livestock, farmers maintain a large herd of animals,which adds to the pressure on land and fodder resources.
Area and Production of Different Fodder Crops in India
At this stage, there is a need to focus more on research ofdevelopment of forage varieties which are high yielding,more pest- resistant and have better nutritive value. Theinadequate production and availability of quality seedyielding varieties of fodder crops is also acting as one ofthe major constraints in enhancing fodder production.Owing to increasing pressure of population on land andhigher benefit-cost ratio, currently Indian farmers focusingmore on growing food grains, oilseeds and cash crops, as aresult production of fodder remains highly neglected. Thecurrent priorities given by farmers to food grains, oilseeds
and cash crops are likely to worsen supply position offodder. There are several reports and studies showingdemand and supply position of feed and fodder in thecountry.
Area, production and yield of different fodder cropswere presented in Table 4. During year 1980-81, the areaunder jowar crop was 18.41 million hectare which itdecreased to 9.86 million hectare for year 2000-01. During2011-12, it again decreased to 2.68 million hectare withproduction of 3.00 million tonnes. The growth rate was -3.68, -2.32 and 1.49 for area, production and yield of jowarcrop, respectively from year 1960-6 to 2011-12. The areaunder bajra crop was 11.47 million hectares with productionof 3.28 million tonnes for the year 1960-61. Area decreasedfrom 9.83 to 8.39 million hectares and production increasedfrom 6.76 to 9.15 million tonnes from 2000-01 to 2011-12.
TABLE 3: PROJECTED AVAILABILITY, REQUIREMENTS AND DEFICIT OF CP AND TDN (MILLION TONNES)INCLUDING CP AND TDN FROM CONCENTRATES
Year Requirement Availability Deficit (%)
CP TDN CP TDN CP TDN
2000 44.49 321.29 30.81 242.42 30.75 24.55
2005 46.12 333.11 32.62 253.62 29.27 23.86
2010 47.76 344.93 34.18 262.02 28.44 24.04
2015 49.39 356.73 35.98 273.24 27.15 23.41
2020 51.04 368.61 37.50 281.23 26.52 23.70
2025 52.68 380.49 39.31 292.45 25.38 23.14
Growth Rate (%age) 0.65 0.74 0.92 0.83 -0.82 -0.27(2000 to 2025)
Source: Handbook of Agriculture CP- Crude Protein TDN- Total Digestible Nutrients.
TABLE 4: AREA, PRODUCTION AND YIELD OF DIFFERENT FODDER CROPS IN INDIA
Year Jowar Maize Bajra
A P Y A P Y A P Y
1960-61 18.41 9.81 533 4.41 4.08 926 11.47 3.28 286
1970-71 17.37 8.11 466 5.85 7.49 1279 12.91 8.03 622
1980-81 15.81 10.43 660 6.01 6.96 1159 11.66 5.34 458
1990-91 14.36 11.68 814 5.90 8.96 1518 10.48 6.89 658
2000-01 9.86 7.53 764 6.61 12.04 1822 9.83 6.76 688
2010-11 7.06 6.74 956 8.49 21.28 2507 9.43 10.08 1069
2011-12 2.68 3.00 1117 7.27 15.86 2181 8.39 9.15 1091
Growth rate(%) -3.68 -2.32 1.49 1.00 2.70 1.68 -0.63 2.05 2.70
Source: Directorate of Economic and Statistics, Department of agriculture and cooperationArea (A)-Million hectares, Production (P)- Million Tonnes, Yield (Y)- Kg/Ha

34 Agricultural Situation in India
The overall (i. e., from1960-61 to 2011-12) growthrate was-0.63, 2.05 and 2.70 per cent for area, production and yieldof bajra crop respectively. The area under maize crop wasincreasing over the years during the study period. The factis that government was more emphasizing on cropdiversification. However, cropping pattern in Punjab hasnot witnessed any drastic changes and remained highlyfavorable towards wheat-paddy monoculture, which hasproduced ecological problems in the form of loss of soilfertility, water table depletion etc (Sharma and Mohan,2013).The overall (1960-61 to 2011-12) growth rate was1.00, 2.70 and 1.68 for area, production and yield of maizecrop respectively.Advances in Animal Feed IndustryAs data is clearly indicating that the area under fodder cropis decreasing year by year, there is need to focus to examinewhich substitute should we adopt to overcome theunavailability of fodder. Some researchers have developedtechniques and methods to overcome the deficiency offodder during lean season.Silage MakingFor making silage, generally fodder crops like maize,sorghum, bajra and guinea grass which are rich in sugarandcarbohydrates and low in protein possess excellent qualitiesfor conserving as silage. Silage is generally used duringthe lean season of fodder to overcome the availability offodder. For making silage, harvested crop is generallystored in silo trench under anaerobic conditions for 45 days.The benefits of silage are as following:
i) It helps to provide a balanced feed during lean periodof fodder availability.
ii) It also reduces the labour cost because cutting andbringing fodder involves maximum labourutilization.
iii) It also reduces the input cost without effecting milkproduction.
iv) Good silage also reduces the toxic contents in greenfodder.
Compounded Cattle FeedIndia has recently emerged as one of the largest and fastestgrowing compound cattle feed markets in the world. Thefeed industry is growing at CAGR of 8 per cent with poultry,cattle and aqua feed sector emerging as major growthdrivers and also in the dairy industry robust growth numberare registered. The requirement of cattle feed has gone upto 67 million tonnes and India is world’s largest milkproducer. Compounded feed is balanced feed for animalsand gives carbohydrates, proteins, fats, minerals andvitamins. If farmer is feeding raw materials like cottonseedcake and bran’s, many times it’s not balanced in all nutrientsand there exists uncertainty about how much quantity tobe added for different raw materials to make it balancedfeed. In compounded cattle feed generally raw materials
like rice bran extraction, rice bran, Cottonseed cake,mustard cake, mustard extraction, soybean extraction, byepass fat, maize and molasses are mixed in equal ratio tomeet minimum fat requirement from 2.5-5.0 per cent andprotein requirement 20-24 per cent. The benefits ofcompounded cattle feed are
i) Each and every raw material was fixed in equal ratioand increases feed intake.
ii) Higher nutrient density (reduce bulkiness of feed).iii) Reduction in dustiness of feed and uniformity in
productioniv) Destruction of pathogenic micro-organism.v) Increased digestibility of certain nutrients due to
cooking effect.DensifiedFeed Block (DFB) TechnologyThe growing feed shortage in region is pushing the feedcost higher and higher, so that most of the resource poorsmall holders, who constitute majority of livestock farmersin the tropical region, are unable to supply good qualityfeeds and balanced nutrient to their animals. There is littlehope to increase area under fodder production or toregenerate the degraded pasture land through intensivemanagement. To provide balanced feed and to overcomethe shortage of feed and fodder new technology, there isDensified Feed Block (DFB) Technology, a novelapproach, which provides a good opportunity to feedmanufacturers and entrepreneurs to remove regionaldisparities in feed availability and supplying balanced feedto dairy animals. In DFB, two major components areroughage and concentrates, added in different ratiosdepending upon the stage of lactation and level ofproduction. In roughages, mainly crop residues like wheatstraw, paddy straw, mustard straw and gram straw aregenerally used as a roughage component.In concentrates,mainly cakes like mustard cake, canola cake, cottonseedcake etc are used as a concentrates because these cakescontain crude protein in a higher percentage. Minerals andnutrients can also be used in these blocks because theseminerals provide energy and protect animals from diseases.The benefits of Densified feed block technology are
i) It provides balanced ration to ruminants becauseduring its preparation, every material was mixed infixed proportion which is beneficial to ruminants.
ii) It is easier to transport and cover less space becausedensification of straw based feed under mechanicalpressure reduces it bulk compared to loose straw.
iii) It is a time and labour saving technique whichreduces labour expenditure from 30-40 per cent andmostly 1-2 hours require for cutting of fodder.
Wanda-Feeding Material
The Punjab Livestock and Dairy DevelopmentBoard(PLDDB) has developed a new, low-cost cattle
April, 2016 35
feeding material, namely,wanda, made from maize cobs.According to PLDDB officials, the maize cobs meal issuitable for all kinds of domestic animals,are far cheaperthan other meals. It carries all nutritional values includingprotein and one kilogram of it can give animals 4000calories energy. Maize cobs, some varieties of corn anddry and green stalks of maize are used as animal feedingmaterial along with wheat straw, rice bran, cakes andmolasses etc.
Constraints in Forage Production
i) Non-availability of critical inputs such as goodquality seeds required for cultivating traditionalfodder crops is another problem. Thus the area underfodder cultivation has remained stagnant for a longperiod due to increasing pressure of humanpopulation. It is estimated that only 4.4% of the totalcropped area is devoted to fodder production(Hedge, 2006).
ii) Livestock population of animals was increasing overthe years so there exist a gap between demand andsupply of fodder.To fill this gap, population ofunproductive animal should be decreased. It is a factthat considerable fodder resources are wasted duringmaintenance of an excessive number of poorly fedand low yielding animals, which contributed to theprocess of pasture destruction.
iii) Uncontrolled grazing has led to decline in biomassavailability. Excessive and continuous grazing hasseverely damaged these lands.
Suggestions
i) There is no agency to collect accurate data on foddercrops production and productivity because withoutstatistical data, it is impossible to determine theavailability and requirement of fodder crop in Indiafor dairy animals.
ii) There is need for producing HYVs of fodder cropsto meet the demand of fodder.
iii) Extension services should reach at the door step offarmers to impart knowledge about fodder crops andproper scientific way of storage of fodder for a leanseason.
iv) Farmers are not aware about technical concepts offeed and fodder i.e., nutrient content, quality andquantity of feed and which animal requires whichtype of feed,so the Government should deployfodder specialist scientists to arrange farmerstraining camps at villages so that they may awareabout raw material (used for preparation of cattlefeed and silage making etc).
Conclusion
It was concluded from the study that area under foddercrop was decreasing over the years, besides decrease in
area, livestock population was increasing over the years,so there exists demand and supply gap of green fodder anddry fodder. To fill this gap, there is need to enhance theproduction of fodder crops through release of new HYV’sof fodder crops. From above another conclusion that canbe derived that there also exists a gap between nutrientrequirement and availability in concentrates. To overcomethese nutrient availability problems some substitutemeasures have relatively greater importance. TheSubstitutes are like silage and hay making, compoundedcattle feed, Densified Feed Block (DFB) technology etc.Compounded cattle feed generally used by majority offarmers because of easy availability and requires less labourbut the main problem is that due to increasing demand ofcattle feed, there is too much duplicacy in the market andsome feed processing industries do not produce cattle feedas per specifications given by ISI and mix high percentageof urea in the feed. So, extension services should reach atthe door step of farmers so that they can be made aware ofpercentage and composition of nutrient requirement in feedand their hazardous effects on dairy animals. Also, to meetthe present and future demand for milk and other animalorigin, sustainable feeding of the animals is the need of thehour.
REFERENCES
Brithal P S (2008) Linking small holder livestockproducers to market: issues and approaches.Indian Journalof Agricultural Economics 63:19-37.
Datta D (2013) Indian Fodder Management towards2030: A Case of Vision or Myopia” International Journalof Management and Social Sciences Research2(2): 33-41.
Dries L, Reardon T, Swinnen J (2004) The rapid riseof supermarkets in central and eastern Europe: Implicationsfor the agrifood sector and rural development. Developmentpolicy Review 22 (5):525-56.
Gangasagare,Karanjkar (2009) Status of milkproduction and economic profile of dairy farmers in themarathwada region of Maharashtra.Veterinary world 2:317-320.
Hegde, N G(2006) Livestock Development forSustainable Livelihood of Small Farmers. CLFMASouvenir: 50-63.
Kashish,Dhawan V (2015) Socio-economic profile ofdairy farmers in Punjab: A case study of Amritsar district.International Journal of Multidisciplinary Approach andstudies 2(2): 155-162.
Maertens B, Swwinnen J (2007) Trade, standards andpoverty: Evidence from Sengal, LICOS Discussion Paperno.177, Leuven: LICOS.
Minten B, Randrianarison L,Swwinnen J (2007)Global retail chains and poor farmers: Evidence from

36 Agricultural Situation in India
Madagascar. LICOS Discussion Paper no.164, Leuven:LICOS.
Patel RK (1993)Present status and promise of dairyingin India.Indian Journal of Agricultural Economics 48(1)1-33.
Sekhon M K, Dhaliwal T K, Kaur M (2012) Presentconsumption level and demand projections for livestockproducts in India.Indian Journal of Agricultural Marketing26(1): 116-122.
Sharma V P, Delgado C, Stall S, Singh R V (2003)Policy, technical and environment determinants andimplications of the scaling-up of milk production in India.
Final report livestock industrialization, trade and socio-health-environmental impact in developing countries,International Food Policy Research Institute, Washington,D.C., USA.
Sharma N, Mohan H (2013) Diversification ofagricultural sector in Punjab: Growth and challenges.Agricultural situation in India LXIX: 21-31.
Sidhu R S and Grewal S S (1991) Factors effectingdemand for human labour in Punjab agriculture. IndianJournalof Agricultural Economics46:158-162.
Sidhu R S and Singh S (2004) Agricultural wages andemployment in Punjab.Economic& political weekly 39.

April, 2016 37
Introduction
Horticulture, which has gained commercial tone in therecent years, is an important component of agriculture,having significant role in the economy of the country. India'svaried agro-climatic conditions allow it to produce a widevariety of horticultural crops such as fruits & vegetables,tuber crops, plantation crops, flowers, spices & condimentsetc. The horticultural crops put together coverapproximately 11.35% of the total cropped area (192.20million hectares) with an annual production of about 114million tonne, making an overall contribution of more than18% in terms of the gross agricultural output of the countryin 2010-11 (P). Following successful launching &implementation of various development programmes, therehas been tremendous progress in the production of fruitsand vegetables in terms of both quality and quantity.
Horticulture in Assam
Assam is endowed with diverse agro-climatic conditions,which permit cultivation of wide range of horticulturalcrops. It accommodates various fruits, vegetables, flowers,spieces, medicinal and aromatic plants, nut crops, tubercrops and also plantation crops. Horticulture crops coveran area of 5.75 lakh hectares which account for 14.04 percent of the total cultivable area of 40.99 lakh hectares inthe state in the year 2011-12. There has been a significantincrease in area and production of horticultural crops inAssam during the last two decades. It is observed thatalthough the area and production of fruit crops increasedduring the period of 2004-05 to 2011-12 by 19.12 per centand 22.70 per cent respectively, the increase in productivitywas almost negligible (4.40%). In case of vegetables, thearea increased by 16.17 per cent, production by 20.76 percent and productivity by 5.54 per cent during the period.In case of tuber crops, the increase in area, production andproductivity was 6.67 per cent, 13.10 per cent and 6.43per cent respectively while, for spices, the increase was15.31 per cent, 16.94 per cent and 2.09 per cent againstarea, production and productivity, respectively.
Scope of the Study
Horticultural sector can play a pivotal role in diversifyingagriculture in terms of increasing production andproductivity; providing food assortments, nutrition, incomeand employment. Despite impressive development inhorticultural sector in recent years, there is a general feeling
that data-base of horticultural crops is not comprehensiveand reliable in the country. The situation is still worse incase of North-East (NE) region and Himalayan states (11states). Besides, there is no systematic data on some of themajor and minor horticultural crops in these states. To fillthis gap, it is necessary to identify the methodologyfollowed in collection of horticultural statistics, identifyproblems faced in data collection of horticultural crops byvarious agencies and take some remedial measures in orderto made data on horticultural sector more scientific andfactual. The present study makes an attempt in this verydirection with a focus on NE and Himalayan states. Thestudy intends to collect baseline data on area, productionand yield of horticultural crops for some selected villagesand from the state agencies responsible for collection ofsuch data and then do the verification with the concernedhouseholds through primary survey to identify thediscrepancies, if any. This will help to highlight the changesrequired at the policy level for improvement of the datacollection process for horticultural commodities. This willalso help the policy makers in the Centre and States tochalk out effective programmes for further developmentof the sector.
Objectives of the Study
The broad objectives of the study are
1. To collect data on area, production and yield ofhorticultural crops and compare these with thebaseline data collected by the Department ofHorticulture, Revenue Department and Directorateof Economics and Statistics.
2. To identify the horticultural crops on which properstatistics is not being compiled at present amongthe selected states.
3. To study the problems encountered by the grass-root officials while collecting the horticultural data.
4. To identify the problems in estimation ofhorticultural crops and to suggest policy measures.
Methodology and Data Source of the Study
The study was confined to the state of Assam. Bothsecondary and primary data were collected to achieve theobjectives specified above. A set of structured questionnairewas prepared to collect information related to area,
AGRO-ECONOMIC RESEARCH
Baseline Data on Area, Production and Productivity of Horticulture Crops in North-East andHimalayan States—A Study in Assam
DR. MOROMI GOGOI AND DEBAYIT BORAH*
*A.E.R.C., for North-East India Assam Agricultural University Assam.

38 Agricultural Situation in India
production and yield of horticultural crops from the officialsat district/block/village level. The state agencies involvedin collection of data on horticultural crops includeDepartment of Horticulture/Agriculture and Directorate ofEconomics and Statistics, Government of Assam.Additional information was collected from the departmentalofficials on methodology adopted, verification processcarried out in collection of horticultural data and problemsencountered by them in compilation of horticulturalstatistics. Information on area, production and yield ofhorticultural crops/crop groups were collected from theconcerned state agencies for the selected village(s) andhousehold(s).
Based on the sample design, one district with highestarea under fruits and another district with highest area undervegetables were selected. Followed by this, two moredistricts were selected, growing highest area under otherhorticultural crop categories e.g., spices and plantationcrops. Thus, altogether four districts were selected for thisstudy. From each selected district, one block was selectedbased on the highest area under the respective crop groupcategories. From each selected block, one village havinghighest area under that category was selected for completeenumeration. Thus, four villages from four blocks in fourdistricts were selected for the primary survey.
Accordingly, Jadavpur village under Mandia block inBarpeta district was selected for spices, Satekona villageunder Bongaon block in Kamrup district for fruits, Sensowavillage under Khagarijan block in Nagaon district forplantation crops and Bhumuraguri village under Gabharublock in Sonitpur district was selected for vegetable cropsfor complete enumeration. For this purpose, a householdlevel schedule was prepared for the sample farmers.
During the primary survey, all the households of thesample villages were covered. The field survey providedthe household area, production and yield of horticulturalcrops grown in the village during the reference year togetherwith village wise aggregate data. Thereafter, a verificationexercise was carried out to match the household as well asvillage data with the data provided by the state agencies.
The secondary data for the village/household level wascollected from the state agencies.
Area, Production and Productivity of HorticulturalCrops Grown by the Sample Farmers
It was observed that, in Jadavpur village, fruit crops covered0.19 hectares of area and only banana was grown. Theyproduced 23.13 qtl. of banana with the yield rate of 12,325kg/ha.
In Satekona village, out of the total fruit crop area of34.82 hectares, 79.44 per cent (27.66 hectares) wereallocated for cultivation of orange (Mandarin) and the rest20.54 per cent (7.16 hectares) were allocated for cultivation
of pineapple. The estimated production and yield ofpineapple was 1,321.95 qtl. and 18,463 kg/ha in kharifseason and 293.77 qtl. and 4,103 kh/ha in rabi season.Production and yield of orange was found at 4,501.31 qtl.and 16,275 kg/ha., respectively.
In Sensowa village, only banana cultivation was foundin 0.35 hectare of un-irrigated land. The production andproductivity was found 35.41 qtl. and 10,245 kg/harespectively.
In Bhumuraguri village, both Assam lemon and bananawere grown by the farmers in un irrigated dry land. Of thetotal 1.22 hectares of land, 0.73 hectare was allocated toAssam lemon and 0.49 hectare for banana cultivation. Theproduction and productivity of Assam lemon was 48.12qtl. and 6,587 kg/ha and that of banana was 46.81 qtl. and9,538 kg/ha respectively.
Combining all the sample villages together, a total of36.57 hectares of area was devoted for cultivation of fruitcrops comprising 1.03 hectares of banana, 27.66 hectaresof orange, 7.16 hectares of pineapple and 0.73 hectares ofAssam lemon.
It was observed that almost all the kharif, rabi andsummer vegetables were grown by the sample farmers. InJadavpur village of Barpeta district, of the total land of28.00 hectares used for vegetable crops, 12.00 hectareswere irrigated and 16.00 hectares were dry land. In un-irrigated areas, pointed gourd and ridge gourd were grownin kharif season while potato and brinjal were grown inrabi season. In the village, there was no report of growingsummer and annual crops in any season. The productionand productivity in irrigated area was found to be 2,085.25qtl. and 17,377 kg/ha. while, in rainfed area it was found at1,561.50 qtl. and 9,759 kg/ha, respectively.
In Satekona village of Kamrup district, the unirrigatedareas were utilized for cultivating ridge gourd, snake gourdand bitter gourd during the kharif season. In summer season,the farmers grew red pumpkin and arum in 0.85 hectareand 1.50 hectare, respectively. The overall production andproductivity was estimated at 404.80 qtl. and 8016 kg/ha.,respectively. The production and productivity of potato wasfound at 45.73 qtl. and 6825 kg/ha and in case of brinjal,the respective figures were 72.29 qtl. and 23,320 kg/ha.
In Senchowa village of Nagaon district, no vegetablearea was allocated for kharif, summer and annual crops. Inrabi season potato and brinjal were grown in 0.67 hectareand 0.31 hectare of irrigated area, respectively.
In Bhumuraguri village of Sonitpur district, the farmersgrew almost all the vegetables in all the seasons. In fact, itis the most vegetables producing district of Assam. In kharifseason, water pumpkin and white gourd were grown. Potato,tomato, brinjal, onion, green chillies, sweet potato, cabbage,cauliflower, pea, radish, carrot, capsicum and other leafy
April, 2016 39
vegetables were grown in rabi season, and in summerseason, brinjal, long beans, lady's finger, red pumpkin,cucumber, kunduli etc. were grown by major samplegrowers. Combining all the vegetable crops, the productionand productivity was worked out at 20,569.94 qtl. and16,070 kg/ha., respectively.
In case of spices cultivation, all the crops were grownin un-irrigated land in all the sample villages. In Jadavpurvillage, the farmers produced 802.29 qtl. of spices withthe yield rate of 3,387 kg/ha.
In Satekona village, the farmers grew only blackpepper in 0.20 hectare of area and produced 3.08 qtl. with1,538 kg/ha. of yield rate.
In Senchowa village, ginger, turmeric and black pepperwere grown as annual crops with a total production of146.65 qtls. The yield rate was estimated at 3,770 kg/ha.
In Bhumuraguri village, 7.69 hectares of land werallocated to grow coriander, garlic, ginger and turmeric.Combining all the crops, the production and productivitywas found at 190.47 qtl. and 2,477 kg/ha., respectively.
In case of garden/plantation crops, Senchowa villageoccupied maximum area followed by Satekona village,Jadavpur village and Bhumuraguri village.
Major Problems of Horticultural Crops
Though the state of Assam has high potential for thedevelopment of horticultural crops, it is yet to become acommercial venture. Factors hindering the horticulturaldevelopment in the state are as follows:
1. Poor Cultivation Practices and Low Yield
General neglect and non-adoption of scientific cultivationpractices are the major constraints for poor return frommost of the horticultural crops in the state. Despiteconducive environment, the productivity and growth ofmost of the horticultural crops are lower than the all Indiaaverage.
2. Lack of Quality Planting Material
The disease free, true to type genuine planting material isabsolutely lacking in case of a number of horticulturalcrops. It is imperative to generate disease free & healthyplanting materials & screening of planting materials beforeits distribution is of utmost importance.
3. Lack of Marketing Facilities
Due to lack of organized marketing structure, the farmersare getting low return as compared to their counterparts inother states of India. The middlemen usually amass a largechunk of profit at the expenses of the farmers. Due toperishable nature of the products and absence of adequatemarket support, the farmers sell their produce at a throwaway prices to the middleman without even getting the
opportunity to display them. Transportation and storageare perhaps the most serious constraints in the horticulturaldevelopment of this region.
4. Scarcity of Trained Manpower and Extension Support
Dearth of trained manpower and inadequate extensionsupport can be considered yet another set of pressingproblem in the way of horticultural development in thispart of the country. In the states like Punjab, HimachalPradesh, Haryana, etc., where the extension services arereported to be very efficient, the pace of progress is alsoseen to be quite impressive.
5. Long Gestation Period
Since horticultural crops, more specifically, plantationcrops have long gestation period and initial cost ofestablishment of orchard or plantation is high, it becomesalmost impossible for the marginal/ small farmers to gofor such ventures without long-term credits from financialinstitutions.
6. Problems of Processing
The processing industry can help to a certain extent inmitigating the problem of proper disposal of perishablecommodities. In the state of Assam, the storage facilitiesare inadequate and only available; few processing unitsexist but are not functioning up to the desired capacity andthis is deemed to be one of the weakest areas in the entireregion.
7. Inadequate Investment on Research
Investments on research in horticulture have alwaysremained low when compared to the large number of cropsit covers. As a result, many more researchers issues remainunattended to for years together. There is an urgent need toincrease the level of investment on research front.
8. Absence of Adequate Insurance Coverage
Risk management in horticultural crops is almost non-existent although the crops like onion and potato arecovered under the National Agriculture Insurance Scheme.There is a need to cover the risk in case of other horticulturalcrops as well, perhaps on the basis of potential productioncoverage instead of average yield. This would encouragehigher investment to achieve higher productivity.
Other bottlenecks of horticultural development in theregion are as follows: -
i. Inadequate thrust on conservation and exploitationof horticultural germplasm.
ii. High rainfall, soil erosion and high rate of leachingof nutrients.
iii. Heavy infestation of weeds, insect-pests anddiseases.
40 Agricultural Situation in India
iv. Lack of funds and financial support fromGovernment to purchase, of equality seeds/plantingmaterials & other inputs.
v. Lack of awareness /needed information.Future ProspectAssam is traditionally a horticultural state due to its uniqueagro-climatic conditions which permit growing of a widerange of horticultural crops. Although, Assam has enormouspotential for development of horticulture, the state is yetto harness the potentiality. In a flood prone state like Assamwhere productivity of major crops like rice is not stable,increase in production of horticultural crops can minimizethe shock of crop failure and provide monetary security tothe farmers. There is ample scope of increasing the areaunder sweet potato, Assam lemon, guava, jackfruit andbanana. The scheme of Technology Mission for IntegratedDevelopment of Horticulture in Assam is in operation since2001-02 with overwhelming response from the farmers. Inspite of infrastructural problems, the state has startedachieving the desired targets in case of fruits, flowers andother commercial crops. Strengthening production base,quality improvement, better price to growers, marketaccess, value addition have become imperative and theDepartment of Agriculture is trying to touch upon all theseissues under the Mission. Assam is expected to become amajor player in emerging South East Asian markets in viewof its close proximity to those global markets as projectedin the latest round of ASEAN & SAARC deliberations.The state has to utilize its competitive and comparativeadvantages through commercialization and makehorticulture highly rewarding. It is expected that thecomprehensive approach through Horticulture TechnologyMission will help to transform the entire gamut ofhorticulture in Assam in the next few years.Difference Between the Two Estimates (Survey Datavis-a-vis Agency Data )It was observed that multiple agencies are involved inhorticulture base line data collection/generation processin Assam. But no systematic and accurate estimate of areaand production of different horticultural crops are available.The estimates made by various agencies also varyconsiderably. Each agency has its own methodology, oftenresulting in variations in the data besides problem ofrevisions and time-lag. Further, only a few crops could becompared in this study due to non availability of data fromthe agencies' end.
It was observed that there was a considerable gap inarea, production and productivity of almost all the crops.But no difference was found in area under guava and papayain Senchowa village and cauliflower, pea, carrot and onionin Bhumuraguri village. In case of production, the datawere almost same in chilly in Jadavpur village, black pepperin Satekona village, pineapple in Senchowa village andpumpkin and green chilies in I3humuraguri village. On yield
rate, small gap was noticed in chilly and turmeric inJadavpur and Senchol,va village, black pepper and arecanut in Satekona village and green chilies, mango, radishand carrot in Bhumuraguri village. But there was a vastgap between survey and agency data in the area of orangein Satekona village, production of coconut in all the samplevillages and betel vine in Senchowa village. Onproductivity, large gap was noticed in Banana in Jadavpurvillage, coconut and orange in Satekona village, papaya,betel vine and pineapple in Senchowa village and ginger,jackfruit and onion in Bhumuraguri village. For other crops,slight difference was observed on area, production and yieldrate between agency and survey data. The main reason forthe gap between the two estimates may be due to surveydone in different seasons by the concerned agencies.Further, in case of fruits and plantation crops, bearing stagesvary with different types and different varieties and mostof the times, eye estimation and farmers' responses weretaken in to account. Also, the areas under vegetables andfruit crops grown in backyard/ kitchen garden of the houseswere not considered by the Govt. Departments. Althoughthe Government officials are required to undertake interimcrop inspection between the two major seasons, namely,kharif and rabi, this does not appear to be done regularly.Even if short duration crops like vegetables, flowers,mushroom, etc. are covered during the crop inspection,they are not listed separately in the final crop abstract butclubbed together under "other crops". Thus; there is anurgent need to take necessary action to cover all the cropsgrown in all the seasons for all types of land withstandardized methodologies.Difficulties Encountered by the Agencies whileCompiling Horticulture DataAs reported, the main difficulty faced by the agenciesinvolved in collection of data was lack of updated ‘Chitha'book in the villages, which was supposed to be maintainedby the Revenue Department. Consequently, the personsengaged in base line data collection process face lot ofproblems in applying uniform statistical methodologies.Another problem was lack of cooperation from farmer'sfamily especially in crop cutting for some selected crops,like arecanut, coconut etc. Under this situation, the officialshad to keep the record of production by eye estimationonly. Moreover, some of the sample farmers very oftendemanded free inputs in order to supply the requiredinformation, which usually put the data collecting officialsin great difficulty.Policy ImplicationBased on the findings of the study and the problemsidentified at the grass root level, the followings aresuggested for improvement of base line data in horticulturein Assam:
1. The Horticulture Department in Assam should haveits own network throughout the state with a well

April, 2016 41
supported statistical cell for collection, monitoringand estimation of horticultural data. Presently it isworking under the shadow of the State AgricultureDepartment
2. There should be a set of prescribed format forindividual farmers covering all aspects ofhorticulture to facilitate the process of datacollection by different agencies.
3. A strong mechanism should be in place to have bettercoordination among the agencies like a NationalSample Survey Organisation (NSSO), and otherGovt. Departments.
4. For collection of base line data, the concernedagencies may involve the local farmer(s) orPanchayat representative(s) for better result.
5. There is need to train the officials on scientific datacollection/management.
6. Awareness programme may also be conducted toeducate the farmers on importance of book-keeping.
7. More funds are to be sanctioned/ released to thedepartments to meet the increasing expenses to covervillage survey and collection of data.
ConclusionAvailability of reliable data is crucial for determining thestatus of ongoing horticultural development programmesand for taking up new programmes and policies forimprovement of the sector. It is essential for estimating thegrowth, for carrying out analysis to assess the demand andsupply trend, to identify problems and constraints, for
evolving adaptive policies and exploring growth prospects.In fact, availability of reliable data can also preventmisdirection of policy objectives and misplacement ofpriorities. In other words, creation of a comprehensivehorticulture database is a must for effective planning andmonitoring & new policy preparation to promotehorticultural production in the state. Availability of properdata will also help in devising appropriate strategies toexploit the huge export potential of the region.
Therefore, there is an urgent need for generatingreliable base-line horticulture data, particularly at districtlevel, classified by different components. The ageniciesinvolved in generating the data should work in closecoordination so that complete and accurate data can beobtained avoiding all sorts of duplication. And in theprocess, it vill be useful to involve the farmers or Panchayatmembers to get better and accurate results. State-wise, thereshould be a nodal agency to handle all kinds of datagenerated by different agencies/Departments, which canbe held responsible for systematically & regularlymaintaining those valuable data. There can be a DataConsortium as well with representation from all concernedagencies/ departments.
For the instant study, there were data gaps and otherlimitations as well. And it is difficult for an outside agency(like AERC) to undertake complete enumeration of thepopulation at village/ tehsil/ subdivision level in order tocollect the household data. For a baseline study of suchmagnitude, the Government may consider revamping theexisting machineries with standard methodologies &continued support in terms of policy and funding.

42 Agricultural Situation in India
During the month of February,2016 the Wholesale Price Index (Base 2004-05=100) of pulses decreased by 3.70%,cereals decreased by 0.25% &foodgrains decreased by 1.15% respectively over the previous month.
ALL INDIA INDEX NUMBER OF WHOLESALE PRICES
(Base: 2004-2005=100)
Commodity Weight WPI for the WPI for the WPI Percentage change(%) Month of Month of during
February 2016 January 2016 A year ago A month A Year
1 2 3 4 5 6 7
Rice 1.793 235.2 235.9 239.1 -0.3 -1.63
Wheat 1.116 221.6 223.5 215.6 -0.85 2.78
Jowar 0.096 275.9 277.9 288.3 -0.72 -4.30
Bajra 0.115 285.1 278.9 240.0 2.22 18.79
Maize 0.217 263.9 261.6 243.4 0.88 8.42
Barley 0.017 252.4 243.8 241.6 3.53 4.47
Ragi 0.019 339.5 335.6 322.6 1.16 5.24
Cereals 3.373 236.1 236.7 233.5 -0.25 1.11
Pulses 0.717 356.4 370.1 256.7 -3.70 38.84
Foodgrains 4.09 257.1 260.1 237.6 -1.15 8.21
Source: Office of the Economic Adviser, M/O Commerce and Industry.
The following Table indicates the State-wise trend of Wholesale Prices of Cereals during the month of February, 2016.
Commodity Main Trend Rising Falling Mixed Steady
Rice Rising Haryana A.P. Karnataka KeralaJharkhand GujaratU.P.
Wheat Rising Haryana Gujarat KarnatakaMaharashtra Rajasthan M.P.U.P.
Jowar Rising Gujarat A.P. RajasthanKarnatakaMaharashtra
Bajra Mixed Rajasthan Gujarat
Maharashtra
Maize Rising Karnataka U.P.Rajasthan
COMMODITY REVIEWS
Foodgrains

April, 2016 43
Procurement of Rice
4.16 million tonnes of Rice (including paddy converted into rice) was procured during February 2016 as against 4.63million tonnes of rice (including paddy converted into rice) procured during February 2015. The total procurement of Ricein the current marketing season i.e 2015-2016, up to 29.02.2016 stood at 28.01 million tonnes, as against 23.21 milliontonnes of rice procured, during the corresponding period of last year. The details are given in the following table :
PROCUREMENT OF RICE
(In Thousand Tonnes)
State Marketing Season Corresponding Marketing Year2015-16 Period of last Year (October-September)
(upto 29.02.2016) 2014-15 2014-15 2013-14
Procurement Percentage Procurement Percentage Procurement Percentage Procurement Percentageto Total to Total to Total to Total
1 2 3 4 5 6 7 8 9
Andhra Pradesh 2678 9.56 1524 6.57 3591 11.17 3722 11.76
Chhatisgarh 3972 14.18 3354 14.45 3423 10.64 4290 13.56
Haryana 2860 10.21 2015 8.68 2015 6.27 2406 7.60
Maharashtra 129 0.46 116 0.50 199 0.62 161 0.51
Punjab 9350 33.37 7781 33.52 7786 24.21 8106 25.62
Tamil Nadu 627 2.24 602 2.59 1049 3.26 684 2.16
Uttar Pradesh 2652 9.47 1424 6.13 1698 5.28 1127 3.56
Uttarakhand 597 2.13 429 1.85 465 1.45 463 1.46
Others 5153 18.39 5967 25.70 11936 37.11 10678 33.75
Total 28018 100.00 23212 100.00 32162 100.00 31637 100.00
Source: Department of Food & Public Distribution.
Procurement of Wheat
The total procurement of wheat in the current marketing season i.e 2015-2016 up to July, 2015 is 28.09 million tonnesagainst a total of 27.17 million tonnes of wheat procured during last year. The details are given in the following table :
PROCUREMENT OF WHEAT
(In Thousand Tonnes)
State Marketing Season Corresponding Marketing Year2015-16 Period of last Year (April-March)
(upto 13.07.2015) 2014-15 2014-15 2013-14
Procurement Percentage Procurement Percentage Procurement Percentage Procurement Percentageto Total to Total to Total to Total
1 2 3 4 5 6 7 8 9
Haryana 6778 24.13 6414 23.61 6495 23.20 5873 23.41Madhya Pradesh 7309 26.02 7188 26.46 7094 25.34 6355 25.33Punjab 10344 36.83 10775 39.66 11641 41.58 10897 43.43Rajasthan 1300 4.63 2155 7.93 2159 7.71 1268 5.06Uttar Pradesh 2267 8.07 628 2.31 599 2.14 683 2.72Others 90 0.32 6 0.02 6 0.02 16 0.06
Total 28088 100.00 27166 100.00 27994 100.00 25092 100.00
Source: Department of Food & Public Distribution.

44 Agricultural Situation in India
Oilseeds and Edible Oils
The Wholesale Price Index (WPI) of nine major oilseedsas a group stood at 210.0 in February, 2016 showing adecrease of 2.5% over the previous month. However, it ishigher by 3.7 % over the previous year. The WPI ofsunflower seed increased by 0.7 % over the previous month.The WPI of gingelly seed decreased by 6.1%, niger seedby 5.8%, rape & mustard seed by 5.4 %, copra by 2.3%,groundnut seed 2.2 % and soyabean by 0.4% over theprevious month. The WPI of safflower seed and cottonseed remained unchanged over the month.The WholesalePrice Index (WPI) of edible oils as a group stood at 150.2in February, 2016 showing an increase of 0.4% and 3.2%over the previous month and year, respectively. The WPIof gingelly oil increased by 3.1 %, sunflower oil by 1.1 %and soyabean oil by 0.3% over the previous month. TheWPI of mustard & rapeseed oil decreased by 2.9 %, cottonseed by 0.5 %, copra oil by 0.3 % and groundnut oil by 0.3% over the previous month.
Fruits & Vegetable
The Wholesale Price Index (WPI) of fruits & vegetable asa group stood at 229.0 in February, 2016 showing adecrease of 11.1% and 2.5% over the previous month andyear, respectively.
Potato
The Wholesale Price Index (WPI) of potato stood at 152.2
in February, 2016 showing an increase of 0.5 % over theprevious month. However, it shows a decrease of 6.3 %over the previous year
Onion
The Wholesale Price Index (WPI) of onion stood at 299.4in February, 2016 showing a decrease of 14.1% and 13.2%over the previous month and year, respectively.
Condiments & Spices
The Wholesale Price Index (WPI) of condiments & spices(group) stood at 357.2 in February, 2016 showing adecrease of 1.7% over the previous month. However, itshows an increase of 13.6% over the previous year. TheWPI of black pepper (1.1 %) and turmeric (1.7 %)decreased over the previous month. However, chillies (dry)shows an increase of 3.5 % over the previous month.
Raw Cotton
The Wholesale Price Index (WPI) of raw cotton stood at184.6 in February, 2016 showing a decrease of 3.1 % overthe previous month. However, it shows an increase of 4.1% over the previous year
Raw Jute
The Wholesale Price Index (WPI) of raw jute stood at 493.8in February, 2016 showing an increase of 2.2% and 60.3%over the previous month and year, respectively.
Commercial Crops
Commodity Latest Month Year % Variation OverFebruary, 2016 January, 2016 February, 2015 Month Year
OIL SEEDS 210.0 215.3 202.6 -2.5 3.7
Groundnut Seed 236.9 242.2 215.0 -2.2 10.2
Rape & Mustard Seed 229.8 242.9 201.8 -5.4 13.9
Cotton Seed 211.5 211.4 154.0 0.0 37.3
Copra (Coconut) 125.0 128.0 176.8 -2.3 -29.3
Gingelly Seed (Sesamum) 276.8 294.9 392.9 -6.1 -29.5
Niger Seed 356.8 378.8 222.6 -5.8 60.3
Safflower (Kardi Seed) 148.4 148.4 127.4 0.0 16.5
Sunflower 199.3 197.9 180.0 0.7 10.7
Soyabean 207.8 208.7 199.4 -0.4 4.2
WHOLESALE PRICE INDEX OF COMMERCIAL CROPS
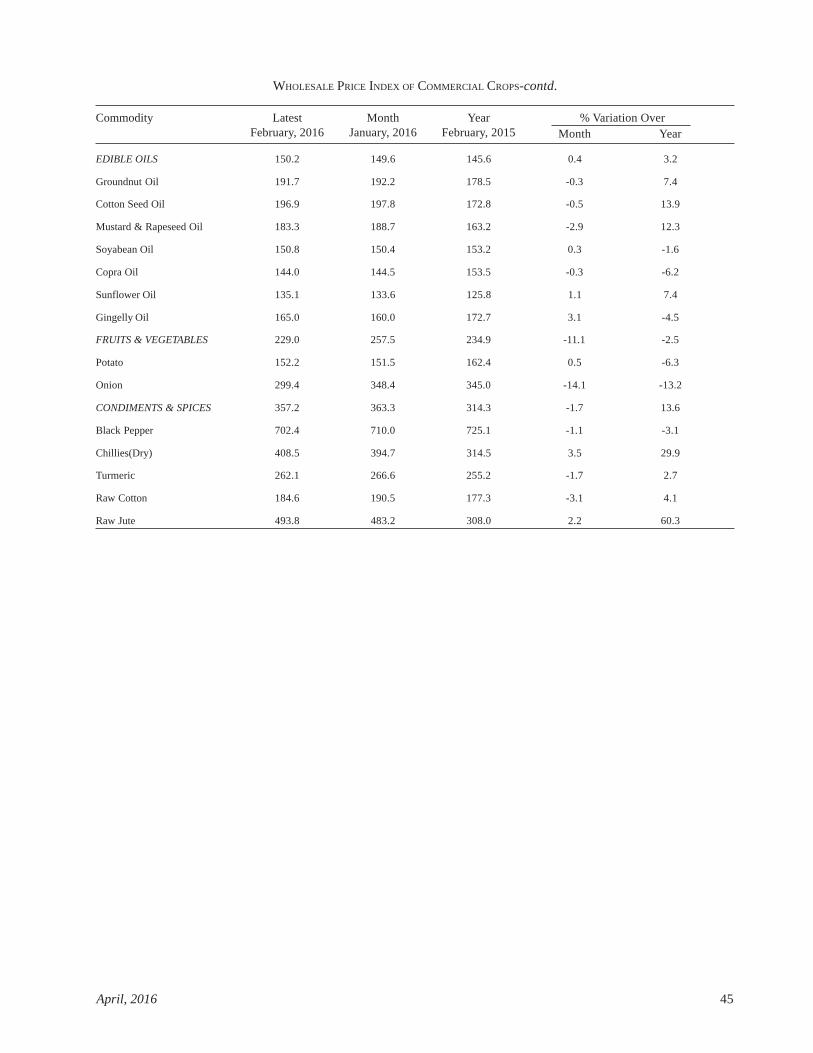
April, 2016 45
Commodity Latest Month Year % Variation OverFebruary, 2016 January, 2016 February, 2015 Month Year
EDIBLE OILS 150.2 149.6 145.6 0.4 3.2
Groundnut Oil 191.7 192.2 178.5 -0.3 7.4
Cotton Seed Oil 196.9 197.8 172.8 -0.5 13.9
Mustard & Rapeseed Oil 183.3 188.7 163.2 -2.9 12.3
Soyabean Oil 150.8 150.4 153.2 0.3 -1.6
Copra Oil 144.0 144.5 153.5 -0.3 -6.2
Sunflower Oil 135.1 133.6 125.8 1.1 7.4
Gingelly Oil 165.0 160.0 172.7 3.1 -4.5
FRUITS & VEGETABLES 229.0 257.5 234.9 -11.1 -2.5
Potato 152.2 151.5 162.4 0.5 -6.3
Onion 299.4 348.4 345.0 -14.1 -13.2
CONDIMENTS & SPICES 357.2 363.3 314.3 -1.7 13.6
Black Pepper 702.4 710.0 725.1 -1.1 -3.1
Chillies(Dry) 408.5 394.7 314.5 3.5 29.9
Turmeric 262.1 266.6 255.2 -1.7 2.7
Raw Cotton 184.6 190.5 177.3 -3.1 4.1
Raw Jute 493.8 483.2 308.0 2.2 60.3
WHOLESALE PRICE INDEX OF COMMERCIAL CROPS-contd.

46 Agricultural Situation in India
STAT
IST
ICA
L TA
BL
ES
Wag
es
1 D
AIL
Y A
GR
ICU
LTU
RA
L WA
GES
IN S
OM
E STA
TES (
CAT
EGO
RY-W
ISE)
(In
Rs.)
Stat
eD
istri
ctC
entre
Mon
th &
Yea
rD
aily
Fiel
d La
bour
Oth
er A
gri.
Her
dsm
anSk
illed
Lab
our
Nor
mal
Labo
urW
orki
ngC
arpe
nter
Bla
ckC
obbl
erH
ours
Sm
ith
MW
MW
MW
MM
M
And
hra
Prad
esh
Kris
hna
Gha
ntas
ala
Aug
,15
826
717
530
0N
A25
020
0N
AN
AN
A
Gun
tur
Tadi
kond
aA
ug,1
58
275
200
275
NA
225
NA
NA
NA
NA
Tela
ngan
aR
anga
Red
dyA
ruta
laSe
p,15
830
023
3N
AN
AN
AN
AN
AN
AN
A
Kar
nata
kaB
anga
lore
Har
isan
dra
Aug
,15
8N
AN
AN
AN
AN
AN
AN
AN
AN
A
Tum
kur
Gid
laha
liA
ug,1
58
168
160
180
180
180
180
180
180
180
Mah
aras
htra
Nag
pur
Mau
daSe
p, 1
48
100
80N
AN
AN
AN
AN
AN
AN
A
Ahm
edna
gar
Ako
leSe
p, 1
48
NA
NA
NA
NA
NA
NA
NA
NA
NA
Jhar
khan
dR
anch
iG
aita
lsoo
dM
arch
,14
812
012
010
010
075
7520
020
0N
A

April, 2016 47
1.1
DA
ILY
AG
RIC
ULT
UR
AL W
AG
ES IN
SO
ME S
TATE
S (O
PER
ATIO
N-W
ISE)
(In
Rs.)
Stat
eD
istri
ctC
entre
Mon
thTy
pe o
fN
orm
alPl
ough
ing
Sow
ing
Wee
ding
Har
vest
ing
Oth
erH
erds
man
Skill
ed L
abou
rs&
Yea
rLa
bour
Dai
lyA
gri-
Car
pent
erB
lack
Cob
bler
Wor
king
Labo
urSm
ithH
ours
Ass
amB
arpe
taLa
hara
para
June
,15
M8
250
250
250
250
250
200
300
300
250
W8
NA
NA
NA
NA
NA
NA
NA
NA
NA
Bih
ar
Muz
affa
rpur
Bha
luiR
asul
June
,14
M8
310
210
210
260
250
210
350
360
310
W8
NA
NA
NA
250
210
NA
NA
NA
NA
Shek
hpur
aK
utau
tJu
ne,1
4M
822
0N
AN
AN
A22
0N
A28
0N
AN
AW
8N
AN
AN
AN
AN
AN
AN
AN
AN
A
Chh
attis
garh
Dha
mta
riSi
hava
Dec
,15
M8
NA
170
NA
120
150
100
250
150
100
W8
NA
160
NA
100
100
100
200
100
100
Guj
arat
*
Raj
kot
Raj
kot
Sep,
15
M8
215
205
163
180
150
188
450
450
360
W8
NA
175
150
175
135
117
NA
NA
NA
Dah
odD
ahod
Sep,
15M
818
016
016
016
013
0N
A26
021
021
0W
8N
A16
016
016
013
0N
AN
AN
AN
A
Har
yana
Pani
pat
Uga
rakh
eri
Oct
,15
M8
400
400
400
400
400
NA
NA
NA
NA
W8
NA
NA
300
300
300
NA
NA
NA
NA
Him
acha
l Pra
desh
Man
diM
andi
Dec
,13
M8
NA
162
162
162
162
NA
260
240
240
W8
NA
162
162
162
162
NA
650
NA
NA
Ker
ala
Koz
hiko
deK
oduv
ally
July
,15
M4-
812
3066
0N
A66
095
7N
A76
0N
AN
AW
4-8
NA
NA
460
510
510
NA
NA
NA
NA
Pala
kkad
Elap
pally
July
,15
M4-
850
050
0N
AN
A46
7N
A60
0N
AN
AW
4-8
NA
NA
300
NA
300
NA
NA
NA
NA
Hos
hang
abad
Sang
arkh
era
Sep,
15M
810
013
013
0N
A10
010
050
050
0N
AW
8N
A13
013
0N
A10
0N
AN
AN
AN
A
Mad
hya
Prad
esh
Satn
aK
otar
Sep,
15M
8N
AN
AN
AN
AN
AN
AN
AN
AN
AW
8N
AN
AN
AN
AN
AN
AN
AN
AN
A
Shyo
purk
ala
Vija
ypur
Sep,
15M
8N
A30
0N
A30
0N
A25
030
0N
AN
AW
8N
AN
AN
AN
AN
AN
AN
AN
AN
A
{ { { {

48 Agricultural Situation in India
1.1
DA
ILY
AG
RIC
ULT
UR
EAL
WA
GES
IN S
OM
E ST
ATES
(OPE
RAT
ION
-WIS
E)—
Con
td.
(in R
s)
Stat
eD
istri
ctC
entre
Mon
thTy
pe o
fN
orm
alPl
ough
ing
Sow
ing
Wee
ding
Har
vest
ing
Oth
erH
erds
man
Skill
ed L
abou
rs&
Yea
rLa
bour
Dai
lyA
gri-
Car
pent
erB
lack
Cob
bler
Wor
king
Labo
urSm
ithH
ours
Bha
drak
Cha
ndba
liD
ec,1
5M
820
020
020
025
025
025
030
030
020
0
Odi
sha
W8
NA
150
180
200
200
200
NA
NA
NA
Gan
jam
Ask
aD
ec,1
5M
830
020
020
025
020
020
040
040
040
0W
8N
A10
015
015
010
010
0N
AN
AN
A
Punj
abLu
dhiy
ana
Pakh
owal
July
,14
M8
300
300
300
NA
365
NA
395
395
NA
W8
NA
NA
NA
NA
NA
NA
NA
NA
NA
Raj
asth
an
Bar
mer
Kus
eep
Aug
,15
M8
NA
NA
300
NA
NA
300
700
500
NA
W8
NA
NA
200
NA
NA
200
NA
NA
NA
Jalo
reSa
rnau
Aug
,15
M8
NA
NA
NA
NA
NA
NA
NA
NA
NA
W8
NA
NA
NA
NA
NA
NA
NA
NA
NA
Tam
il N
adu*
Than
javu
rPu
lvar
nath
amD
ec,1
5M
840
035
4N
A37
534
8N
AN
AN
AN
AW
8N
AN
A12
413
012
1N
AN
AN
AN
A
Tiru
nelv
eli
Mal
ayak
ulam
Dec
,15
M8
NA
350
350
250
488
NA
NA
NA
NA
W8
NA
NA
159
174
358
NA
NA
NA
NA
Trip
ura
Stat
e Ave
rage
Apr
, 14
M8
287
262
264
277
261
270
305
212
285
W8
NA
197
201
209
197
200
NA
NA
NA
Mee
rut
Gan
eshp
urN
ov,1
5M
828
026
826
2N
A26
2N
A37
5N
AN
AW
8N
A20
020
6N
A20
6N
AN
AN
AN
A
Utta
r Pra
desh
*A
urra
iya
Aur
raiy
aN
ov,1
5M
815
015
015
0N
A16
0N
A33
6N
A.N
AW
8N
AN
AN
AN
A16
0N
A36
4N
AN
A
Cha
ndau
liC
hand
auli
Nov
,15
M8
NA
NA
NA
200
200
NA
350
NA
NA
W8
NA
NA
NA
200
200
NA
NA
NA
NA
M-M
anW
-Wom
anN
A- N
ot A
vaila
ble
* St
ates
repo
rted
dist
rict a
vera
ge d
aily
wag
es
{ { { {

April, 2016 49
Prices2. WHOLESALE PRICES OF CERTAIN IMPORTANT AGRICULTURAL COMMODITIES AND ANIMAL HUSBANDRY PRODUCTS AT SELECTED
CENTRES IN INDIA
(Average wholesale Prices in Rs.)Commodity Variety Unit State Centre 2014-15 2013-14 Crop Year
Wheat PBW 343 Quintal Punjab Amritsar 1501 1486 May-April
Wheat Dara Quintal Uttar Pradesh Chandausi 1522 1530 May-April
Wheat Lokvan Quintal Madhya Pradesh Bhopal 1602 1633 May-April
Jowar - Quintal Maharashtra Mumbai 2360 2542 May-April
Gram No III Quintal Madhya Pradesh Sehore 2740 2942 May-April
Maize Yellow Quintal Uttar Pradesh Kanpur 1335 1358 May-April
Gram Split - Quintal Bihar Patna 4507 4733 May-April
Gram Split - Quintal Maharashtra Mumbai 4025 5325 May-April
Arhar Split - Quintal Bihar Patna 6948 6524 May-April
Arhar Split - Quintal Maharashtra Mumbai 6963 6725 May-April
Arhar Split - Quintal NCT of Delhi Delhi 6175 6312 May-April
Arhar Split Sort II Quintal Tamil Nadu Chennai 7767 6425 May-April
Gur - Quintal Maharashtra Mumbai 3238 3675 Nov-Oct
Gur Sort II Quintal Tamil Nadu Coimbatore 4096 4260 Nov-Oct
Gur Balti Quintal Uttar Pradesh Hapur 2320 2541 Nov-Oct
Mustard Seed Black (S) Quintal Uttar Pradesh Kanpur 3275 3248 Apr-Mar
Mustard Seed Black Quintal West Bengal Raniganj 3638 3746 Apr-Mar
Mustard Seed - Quintal West Bengal Kolkata 3925 3783 Apr-Mar
Linseed Bada Dana Quintal Uttar Pradesh Kanpur 4158 4123 Apr-Mar
Linseed Small Quintal Uttar Pradesh Varanasi 3832 3601 Apr-Mar
Cotton Seed Mixed Quintal Tamil Nadu Virudhunagar 1521 1700 Apr-Mar
Cotton Seed MCU 5 Quintal Tamil Nadu Coimbatore 1985 1550 Apr-Mar
Castor Seed - Quintal Andhra Pradesh Hyderabad 3740 3308 Apr-Mar
Sesamum Seed White Quintal Uttar Pradesh Varanasi 13559 7990 Nov-Oct
Copra FAQ Quintal Kerala Alleppey 8717 9367 Nov-Oct
Groundnut Pods Quintal Tamil Nadu Coimbatore 4500 4290 Nov-Oct
Groundnut - Quintal Maharashtra Mumbai 5875 5867 Nov-Oct
Mustard Oil - 15 Kg. Uttar Pradesh Kanpur 1202 1203 Apr-Mar
Mustard Oil Ordinary 15 Kg. West Bengal Kolkata 1254 1210 Apr-Mar
Groundnut Oil - 15 Kg. Maharashtra Mumbai 1434 1179 Nov-Oct
Groundnut Oil Ordinary 15 Kg. Tamil Nadu Chennai 1566 1271 Nov-Oct
Linseed Oil - 15 Kg. Uttar Pradesh Kanpur 1438 1291 Apr-Mar
Castor Oil - 15 Kg. Andhra Pradesh Hyderabad 1247 1238 Nov-Oct
Sesamum Oil - 15 Kg. NCT of Delhi Delhi 1831 1790 Nov-Oct
Sesamum Oil Ordinary 15 Kg. Tamil Nadu Chennai 2256 2628 Nov-Oct
Coconut Oil - 15 Kg. Kerala Cochin 1784 2107 Jan-Dec
Mustard Cake - Quintal Uttar Pradesh Kanpur 1778 1753 Apr-Mar
Groundnut Cake - Quintal Andhra Pradesh Hyderabad 3473 2992 Nov-Oct
Cotton/Kapas NH 44 Quintal Andhra Pradesh Nandyal 3867 4421 Sept-Aug
Cotton/Kapas LRA Quintal Tamil Nadu Virudhunagar 3436 3886 Sept-Aug
Jute Raw TD 5 Quintal West Bengal Kolkata 3180 2806 July-June
Jute Raw W 5 Quintal West Bengal Kolkata 3128 2757 July-June
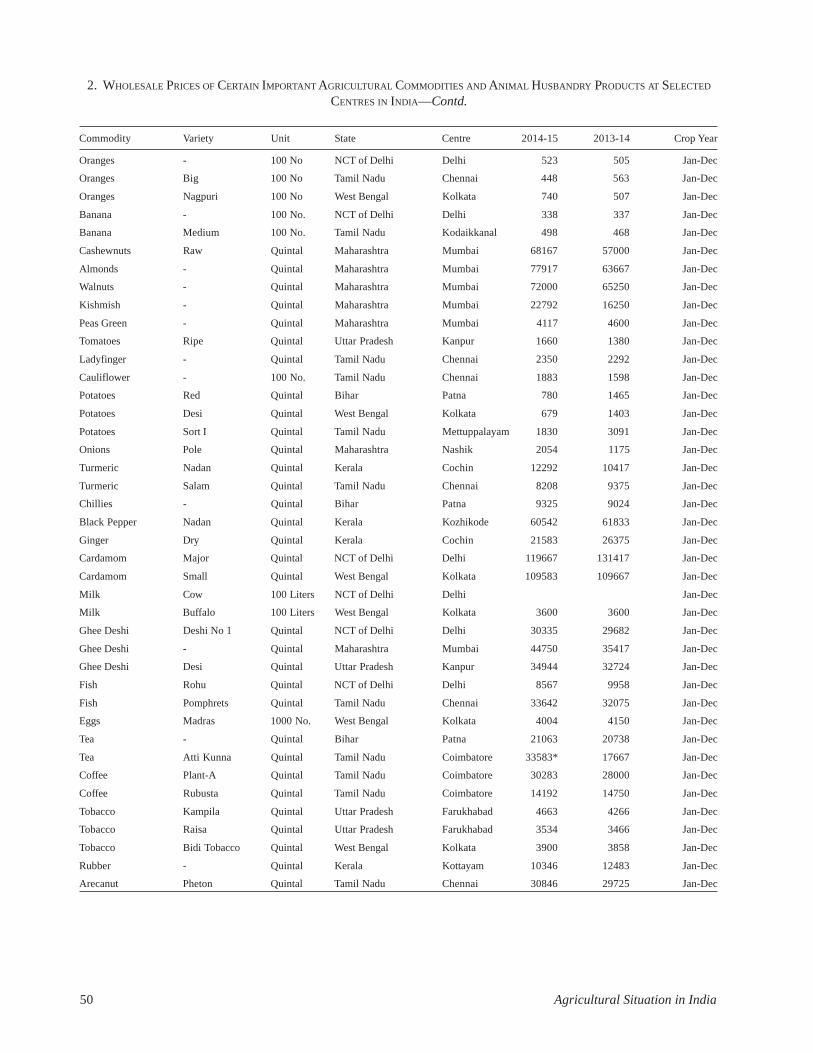
50 Agricultural Situation in India
Commodity Variety Unit State Centre 2014-15 2013-14 Crop Year
Oranges - 100 No NCT of Delhi Delhi 523 505 Jan-Dec
Oranges Big 100 No Tamil Nadu Chennai 448 563 Jan-Dec
Oranges Nagpuri 100 No West Bengal Kolkata 740 507 Jan-Dec
Banana - 100 No. NCT of Delhi Delhi 338 337 Jan-Dec
Banana Medium 100 No. Tamil Nadu Kodaikkanal 498 468 Jan-Dec
Cashewnuts Raw Quintal Maharashtra Mumbai 68167 57000 Jan-Dec
Almonds - Quintal Maharashtra Mumbai 77917 63667 Jan-Dec
Walnuts - Quintal Maharashtra Mumbai 72000 65250 Jan-Dec
Kishmish - Quintal Maharashtra Mumbai 22792 16250 Jan-Dec
Peas Green - Quintal Maharashtra Mumbai 4117 4600 Jan-Dec
Tomatoes Ripe Quintal Uttar Pradesh Kanpur 1660 1380 Jan-Dec
Ladyfinger - Quintal Tamil Nadu Chennai 2350 2292 Jan-Dec
Cauliflower - 100 No. Tamil Nadu Chennai 1883 1598 Jan-Dec
Potatoes Red Quintal Bihar Patna 780 1465 Jan-Dec
Potatoes Desi Quintal West Bengal Kolkata 679 1403 Jan-Dec
Potatoes Sort I Quintal Tamil Nadu Mettuppalayam 1830 3091 Jan-Dec
Onions Pole Quintal Maharashtra Nashik 2054 1175 Jan-Dec
Turmeric Nadan Quintal Kerala Cochin 12292 10417 Jan-Dec
Turmeric Salam Quintal Tamil Nadu Chennai 8208 9375 Jan-Dec
Chillies - Quintal Bihar Patna 9325 9024 Jan-Dec
Black Pepper Nadan Quintal Kerala Kozhikode 60542 61833 Jan-Dec
Ginger Dry Quintal Kerala Cochin 21583 26375 Jan-Dec
Cardamom Major Quintal NCT of Delhi Delhi 119667 131417 Jan-Dec
Cardamom Small Quintal West Bengal Kolkata 109583 109667 Jan-Dec
Milk Cow 100 Liters NCT of Delhi Delhi Jan-Dec
Milk Buffalo 100 Liters West Bengal Kolkata 3600 3600 Jan-Dec
Ghee Deshi Deshi No 1 Quintal NCT of Delhi Delhi 30335 29682 Jan-Dec
Ghee Deshi - Quintal Maharashtra Mumbai 44750 35417 Jan-Dec
Ghee Deshi Desi Quintal Uttar Pradesh Kanpur 34944 32724 Jan-Dec
Fish Rohu Quintal NCT of Delhi Delhi 8567 9958 Jan-Dec
Fish Pomphrets Quintal Tamil Nadu Chennai 33642 32075 Jan-Dec
Eggs Madras 1000 No. West Bengal Kolkata 4004 4150 Jan-Dec
Tea - Quintal Bihar Patna 21063 20738 Jan-Dec
Tea Atti Kunna Quintal Tamil Nadu Coimbatore 33583* 17667 Jan-Dec
Coffee Plant-A Quintal Tamil Nadu Coimbatore 30283 28000 Jan-Dec
Coffee Rubusta Quintal Tamil Nadu Coimbatore 14192 14750 Jan-Dec
Tobacco Kampila Quintal Uttar Pradesh Farukhabad 4663 4266 Jan-Dec
Tobacco Raisa Quintal Uttar Pradesh Farukhabad 3534 3466 Jan-Dec
Tobacco Bidi Tobacco Quintal West Bengal Kolkata 3900 3858 Jan-Dec
Rubber - Quintal Kerala Kottayam 10346 12483 Jan-Dec
Arecanut Pheton Quintal Tamil Nadu Chennai 30846 29725 Jan-Dec
2. WHOLESALE PRICES OF CERTAIN IMPORTANT AGRICULTURAL COMMODITIES AND ANIMAL HUSBANDRY PRODUCTS AT SELECTED
CENTRES IN INDIA—Contd.

April, 2016 51
3. MONTH-END WHOLESALE PRICES OF SOME IMPORTANT AGRICULTURAL COMMODITIES IN INTERNATIONAL MARKETS
DURING YEAR 2016
Currency JAN FEB
Foreign Exchange Rates CanDollar 48.52 49.90UKPound 97.80 99.17USDollar 68.09 68.47
Commodity Variety Country Centre Unit JAN FEB
CARDAMOM Guatmala Bold Green U.K. - Dollar/MT 9000.00 9000.00Rs./Qtl 61281.00 61542.00
CASHEW KERNELS Spot U.K. 320s U.K. - Dollar/lbs 8350.09 8143.20Rs./Qtl 56855.76 55683.20
CASTOR OIL Any Origin ex Netherlands - Dollar/MT 1374.00 1244.70tank Rotterdam Rs./Qtl 9355.57 8511.26
CHILLIES Birds eye 2005 crop Africa - Dollar/MT 4100.00 4100.00Rs./Qtl 27916.90 28035.80
CLOVES Singapore Madagascar - Dollar/MT 8650.00 8650.00Rs./Qtl 58897.85 59148.70
COCONUT OIL Crude Phillipine/ Netherlands - Dollar/MT 1155.00 1255.00Indonesia, cif Rotterdam Rs./Qtl 7864.40 8581.69
COPRA Phillipines cif Phillipine - Dollar/MT 687.50 714.50Rotterdam Rs./Qtl 4681.19 4885.75
CORRIANDER India - Dollar/MT 2000.00 2000.00Rs./Qtl 13618.00 13676.00
CUMMIN SEED India - Dollar/MT 2200.00 2200.00Rs./Qtl 14979.80 15043.60
GROUNDNUT OIL Crude Any Origin U.K. - Dollar/MT 1200.00 1200.00cif Rotterdam Rs./Qtl 8170.80 8205.60
MAIZE U.S.A. Chicago C/56 lbs 369.25 359.75Rs./Qtl 988.09 966.77
OATS Canada Winnipeg Dollar/MT 283.14 250.42Rs./Qtl 1927.90 1712.37
PALM KERNAL OIL Crude Malaysia/ Netherlands - Dollar/MT 890.00 1030.00Indonesia, cif Rotterdam Rs./Qtl 6060.01 7043.14
PALM OIL Crude Malaysian/ Netherlands - Dollar/MT 575.00 637.50Sumatra, cif Rotterdam Rs./Qtl 3915.18 4359.23
PEPPER (Black) Sarawak Black lable Malaysia - Dollar/MT 10000.00 10000.00Rs./Qtl 68090.00 68380.00
Canola CANADA Winnipeg Can Dollar/MT 481.20 460.70Rs./Qtl 2334.78 2298.89
RAPESEED UK delivered rapeseed, U.K. - Pound/MT 247.00 247.00delivered Erith(buyer) Rs./Qtl 2415.66 2352.43
RAPESEED OIL Refined bleached and U.K. - Pound/MT 660.00 614.00deodorised ex-tanks, Rs./Qtl 6454.80 5847.74broker price
SOYABEAN MEALUK produced 49% oil & U.K. - Pound/MT 248.00 255.00protein ('hi-pro') ex-mill Rs./Qtl 2425.44 2428.62seaforth UK bulk
SOYABEAN OIL U.S.A. - C/lbs 30.87 30.92Rs./Qtl 4632.67 4659.94
Refined bleached and U.K. - Pound/MT 618.00 639.00deodorised ex-tanks, Rs./Qtl 6044.04 6085.84broker price
SOYABEANS U.S.A. -C/60 lbs 883.00 867.50
Rs./Qtl 2206.53 2177.03
US NO.2 yellow Netherlands Chicago Dollar/MT 377.20 372.90Rs./Qtl 2568.35 2549.89
SUNFLOWER
SEED OIL Refined bleached and U.K. - Pound/MT 674.00 720.00deodorised ex-tanks, Rs./Qtl 6591.72 6857.28broker price
Wheat U.S.A. Chicago C/60 lbs 476.50 442.75Rs./Qtl 1190.73 1111.10
Source: Public Ledger.

52 Agricultural Situation in India
Crop Production4. SOWING AND HARVESTING OPERATIONS NORMALLY IN PROGRESS DURING MAY, 2016
State Sowing Harvesting
(1) (2) (3)
Andhra Pradesh Autumn Rice, Sugarcane, Groundnut Summer Rice, Onion.
Assam Winter Rice, Maize, Tur (R), Cotton. Summer Potato (Hills).
Bihar Autumn Rice, Jute, Mesta. Summer Rice, Wheat, Barley, Gram.Castoresed. Linseed.
Gujarat Sugarcane, Ginger, Turmeric. Onion
Himachal Pradesh Maize, Ragi, Small Millets (K), Summer Potato Wheat, Barley, Gram, Other Rabi Pulses,(Hills), Sugarcane, Ginger, Chillies (Dry), Linseed, Onion.Tobacco, Sesamum, Cotton, Turmeric.
Jammu & Kashmir Autumn Rice, Jowar (K), Maize, Ragi, Small, Wheat, Barley, Small Millets (R) Tur (K).Millets (K), Mung (K), Tur (K), Other Sesamum, Rapeseed and Mustard, Linseed.Tobacco, Sannhemp. Onion.
Karnataka Autumn Rice, Jowar (K), Maize, Ragi, Urad (K), Summer Rice, Ragi (R), Winter PotatoMung (K), Summer Potato (Hills), Tobacco, (Plain), Tapioca.Castorseed, Sesamum, Cotton, Sweet Potato,Turmeric, Sannhemp, Onion, Tapioca.
Kerala Autumn Rice, Ragi, Small Millets (K), Tur (K), Summer Rice, Other Rabi Pulses. TapiocaUrad (K), Mung (K), Other Kharif Pulses, (Late).Ginger, Turmeric, Tapioca (Early).
Madhya Pradesh Sugarcane, Ginger, Chillies (Dry), Turmeric. Winter Potato (Plains), Onion.
Maharashtra Termeric. —
Manipur Autumn Rice, Groundnut, Castorseed, Cotton, —Turmeric.
Orissa Autumn Rice, Sugarcane, Chillies (Dry), Jute. Summer Rice, Cotton, Chillies (Dry).
Punjab and Haryana Autumn Rice, Summer Rice, Ragi, Small Wheat, Barley, Winter Potato (Plains)Millets (K), Tur (K), Summer Potato (Hills) Summer Potato, Tabacco,Onion.Chillies (Dry), Cotton, Sweet Potato.
Rajsthan Sugarcane Wheat, Small Millets (R), Tabacco.
Tamil Nadu Autumn Rice, Bajra, Summer Potato, Sugarcane, Summer Rice, Jowar (R), Winter PotatoChillies (Dry), Groundnut, Turmeric, Sannhemp. (Hills), Sugarcane, Chillies (Dry). Sesamum,Tapioca Onion.
Tripura Autumn Rice, Maize, Sugarcane, Ginger, Chillies —(Dry), Seasmum, Cotton, Jute, Mesta.
Uttar Pradesh Autumn Rice, Tur (K), Chillies (Dry), Groundnut, Summer Rice, Wheat, Barley, Sugarcane,Cotton, Jute, Mesta, Linseed. Tabacco, Rapeseed and Mustard, Sannhemp,
Onion.
West Bengal Autumn Rice, Winter Rice, Tur (K), Ginger, Summer Rice Chillies (Dry). Sesamum.Chillies (Dry), Jute, Mesta.
Delhi Jowar (K), Onion.
(K)— Kharif. (R). Rabi.
PRINTED BY THE GENERAL MANAGER GOVERNMENT OF INDIA PRESS, MINTO ROAD, NEW DELHI-110002AND PUBLISHED BY THE CONTROLLER OF PUBLICATIONS, DELHI-110054-2016
Copies are available at:The Controller of Publications, Civil Lines, Delhi-110054
ISSN 0002-1679
Regn.No.:840
P. Agri. 21-04-2016
450
Other Publications of
the Directorate
Agricultural Prices in India
Glimpses of Indian Agriculture
Agricultural Statistics at a Glance
Agricultural Wages in India
Cost of Cultivation of Principal Crops in India
District-wise Area and Production ofPrincipal Crops in India
Farm Harvest Prices ofPrincipal Crops in India
Land Use Statistics at a Glance