AGRICULTURAL GROWTH IN THE PERIOD 1999-2004,...
32
140 AGRICULTURAL GROWTH IN THE PERIOD 1999-2004, OUTBURST IN SOYBEANS AREA AND ENVIRONMENTAL IMPACTS IN BRAZIL Antonio Salazar Pessoa Brandão Gervásio Castro de Rezende Roberta Wanderley da Costa Marques Originally published by Ipea in January 2005 as number 1062 of the series Texto para Discussão.
Transcript of AGRICULTURAL GROWTH IN THE PERIOD 1999-2004,...

140
AGRICULTURAL GROWTH IN THE PERIOD 1999-2004, OUTBURST IN SOYBEANS AREA AND ENVIRONMENTAL IMPACTS IN BRAZIL
Antonio Salazar Pessoa BrandãoGervásio Castro de RezendeRoberta Wanderley da Costa Marques
Originally published by Ipea in January 2005 as number 1062 of the series Texto para Discussão.

DISCUSSION PAPER
140B r a s í l i a , J a n u a r y 2 0 1 5
Originally published by Ipea in January 2005 as number 1062 of the series Texto para Discussão.
AGRICULTURAL GROWTH IN THE PERIOD 1999-2004, OUTBURST IN SOYBEANS AREA AND ENVIRONMENTAL IMPACTS IN BRAZIL
Antonio Salazar Pessoa Brandão1 Gervásio Castro de Rezende2 Roberta Wanderley da Costa Marques3
1. Professor of Economics, State University of Rio de Janeiro (UERJ). E-mail: <abrandã[email protected]>.2. Associate Researcher, Ipea and Visiting Professor, State University of Rio de Janeiro (UERJ). E-mail: <[email protected]>.3. Research Assistant (Ipea). E-mail: <[email protected]>.
DISCUSSION PAPER
A publication to disseminate the findings of research
directly or indirectly conducted by the Institute for
Applied Economic Research (Ipea). Due to their
relevance, they provide information to specialists and
encourage contributions.
© Institute for Applied Economic Research – ipea 2015
Discussion paper / Institute for Applied Economic
Research.- Brasília : Rio de Janeiro : Ipea, 1990-
ISSN 1415-4765
1. Brazil. 2. Economic Aspects. 3. Social Aspects.
I. Institute for Applied Economic Research.
CDD 330.908
The authors are exclusively and entirely responsible for the
opinions expressed in this volume. These do not necessarily
reflect the views of the Institute for Applied Economic
Research or of the Secretariat of Strategic Affairs of the
Presidency of the Republic.
Reproduction of this text and the data it contains is
allowed as long as the source is cited. Reproductions for
commercial purposes are prohibited.
Federal Government of Brazil
Secretariat of Strategic Affairs of the Presidency of the Republic Minister Roberto Mangabeira Unger
A public foundation affiliated to the Secretariat of Strategic Affairs of the Presidency of the Republic, Ipea provides technical and institutional support to government actions – enabling the formulation of numerous public policies and programs for Brazilian development – and makes research and studies conducted by its staff available to society.
PresidentSergei Suarez Dillon Soares
Director of Institutional DevelopmentLuiz Cezar Loureiro de Azeredo
Director of Studies and Policies of the State,Institutions and DemocracyDaniel Ricardo de Castro Cerqueira
Director of Macroeconomic Studies and PoliciesCláudio Hamilton Matos dos Santos
Director of Regional, Urban and EnvironmentalStudies and PoliciesRogério Boueri Miranda
Director of Sectoral Studies and Policies,Innovation, Regulation and InfrastructureFernanda De Negri
Director of Social Studies and Policies, DeputyCarlos Henrique Leite Corseuil
Director of International Studies, Political and Economic RelationsRenato Coelho Baumann das Neves
Chief of StaffRuy Silva Pessoa
Chief Press and Communications OfficerJoão Cláudio Garcia Rodrigues Lima
URL: http://www.ipea.gov.brOmbudsman: http://www.ipea.gov.br/ouvidoria
DISCUSSION PAPER
A publication to disseminate the findings of research
directly or indirectly conducted by the Institute for
Applied Economic Research (Ipea). Due to their
relevance, they provide information to specialists and
encourage contributions.
© Institute for Applied Economic Research – ipea 2015
Discussion paper / Institute for Applied Economic
Research.- Brasília : Rio de Janeiro : Ipea, 1990-
ISSN 1415-4765
1. Brazil. 2. Economic Aspects. 3. Social Aspects.
I. Institute for Applied Economic Research.
CDD 330.908
The authors are exclusively and entirely responsible for the
opinions expressed in this volume. These do not necessarily
reflect the views of the Institute for Applied Economic
Research or of the Secretariat of Strategic Affairs of the
Presidency of the Republic.
Reproduction of this text and the data it contains is
allowed as long as the source is cited. Reproductions for
commercial purposes are prohibited.
JEL: Q18.

SUMMARY
SINOPSE
ABSTRACT
1 INTRODUCTION 1
2 THE BEHAVIOR OF DOMESTIC AGRICULTURAL PRICES IN THE PERIOD 1999/2004: THE ROLES OF
THE EXCHANGE RATE AND OF THE INTERNATIONAL PRICES 2
3 BRAZILIAN AGRICULTURAL GROWTH PERSPECTIVES
IN THE FACE OF LOW INTERNATIONAL GRAIN PRICES SINCE MID-2004 7
4 INCREASES IN ACREAGE IN THE RECENT PERIOD,
WITH SPECIAL EMPHASIS IN THE CASE OF SOYBEANS 8
5 PASTURE CONVERSION AS THE MAIN SOURCE OF
THE RECENT GROWTH OF SOYBEANS ACREAGE IN BRAZIL 11
6 SOYBEANS AND THE AMAZON FOREST: FRIENDS OR FOES? 16
7 MODERFROTA AND THE RECENT EXPANSION OF CULTIVATED AREA IN BRAZIL 18
8 SUMMARY AND CONCLUSIONS 20
REFERENCES 21


SINOPSE
Este trabalho analisa o crescimento agrícola brasileiro após a mudança da políticacambial, em janeiro de 1999. Toma como base, para isso, o comportamento da taxade câmbio e dos preços internacionais das commodities ao longo do período 1999-2004. Discute, também, o comportamento da área cultivada nesse período recente,mostrando que ocorreu um aumento muito grande da área plantada com grãos nosanos agrícolas 2001/2002, 2002/2003 e 2003/2004, em grande parte devido àexpansão da soja. O trabalho propõe que essa expansão tão rápida da área plantadacom soja se deu preponderantemente com base em conversão de pastagens. Sugere,ainda, que a expansão da soja não deve ser vista como antagônica à políticaambiental, especialmente no que se refere à proteção da floresta amazônica.
ABSTRACT
This paper analyses the Brazilian agricultural growth since January 1999, when a newexchange rate policy was adopted by the country. The analysis focuses on thebehavior of the exchange rate and international commodity prices throughout theperiod 1999-2004. It is also analysed the behavior of cropped area in this recentperiod, with the conclusion that there has been a fast increase in area planted withgrains in the agricultural years 2001/2002, 2002/2003 and 2003/2004, due almostentirely to the growth of soybeans area. The paper proposes that this expansion ofarea planted with soybeans was based preponderantly on the conversion of pastures.It is also suggested that expansion of soybeans should not be seen as antagonistic tothe environmental policy, specially in what respects the protection of the Amazonforest.


1
1 INTRODUCTION This paper presents an analysis of Brazilian agricultural growth after the change in the exchange rate regime in 1999. It is clear that this policy shift affected favorably agriculture; however the literature does not contain an analysis of what happened and how it happened, particularly in face of the behavior of international agricultural prices.
The analysis here shows that the decline in international prices partially offset the stimulus provided by the change in the exchange rate regime in 1999. However, the increase in prices observed between 2002 and the first semester of 2004, reinforced the effect of the exchange rate devaluation, leading to a period of great dynamism in the agricultural sector, particularly in the last three agricultural years. This same analysis points to the fact that the decline in prices since the second semester of 2004 is likely to adversely affect the behavior of agriculture in the years ahead.
The data shows also that agricultural growth was leaded by a fast increase in grain acreage: 22.8 percent in the three agricultural years of 2001/02, 2002/03 and 2003/04. This is markedly different from the pattern observed during the 1990s, where acreage remained roughly constant and yield increases were the main source of production growth. We observe also that the recent expansion of the grain area was concentrated on soybeans, which increased 39.8 percent in the southern and southeastern regions and jumped 66.1 percent in the center-western region.
At first one could identify this as an extensive process of growth in the Ricardian sense. Nevertheless, the expansion of acreage seems to have been made possible by conversion of pastureland, which suggests an intensification, rather than extensive growth, of agriculture1.
In addition to indicate that the rapid acreage expansion was heavily based on pasture conversion, rather than on contemporaneous opening of new areas – either in the cerrado or in the Amazon forest – the paper shows that this was facilitated by easier acquisitions of machinery after 2000/01, thanks to a credit program named Moderfrota (Programa de Modernização da Frota de Tratores e Máquinas Agrícolas).
Finally, the paper argues that the expansion of soybeans acreage does not cause difficulties for environmental policy, particularly in respect to the Amazon Forest. As part of the argument, the paper advocates that BR 163 should be paved as quickly as possible. This will have the effect of reducing transportation costs and, additionally will facilitate planting of soybeans in the vicinity of the highway, increasing the efficacy of environmental preservation initiatives.
1. With respect to the connection between acreage growth and intensive livestock production, the authors owe much toProf. Guilherme Dias, of the University of São Paulo, who in private correspondence with one of the authors suggested that “the adequate area unit for calculations of yields should be the rotation corn/soybeans/pasture (…).” We warn the reader however, that the recent expansion of soybeans acreage is not a part of the on going process of agriculture and livestock integration. This is justified on the grounds that the expansion of soybean acreage was too fast (an explosion indeed) and also that it is common in the Brazilian cerrados to plant soybeans to renovate pastures. On this regard, see “Dupla Aptidão”, Globo Rural nº 229, November 2004, and “Reintegração de Produtividade”, Panorama Rural nº 70, November 2004.
2
The paper is organized as follows. Next section shows the behavior of domestic agricultural prices in the period 1998/2004, identifying the role of the exchange rate and of the international prices in the various subperiods. Section 3 analysis the growth perspectives in face of declining prices in 2004, looking in more depth to the effects of soybeans prices. Section 4 documents the expansion of acreage in the recent period. Section 5 contains evidence to support the claim that acreage expansion did not lead to the enlargement of the land base of agriculture and did not represent a threat to the environment. Section 6 argues that soybeans should be seen as a friend, and not as an enemy, of the environment and particularly of the Amazon Forest. Section 7 considers the impacts of Moderfrota and Section 8 concludes and summarizes the paper.
2 The Behavior of Domestic Agricultural Prices in the Period 1999/2004: The Roles of the Exchange Rate and of the International Prices
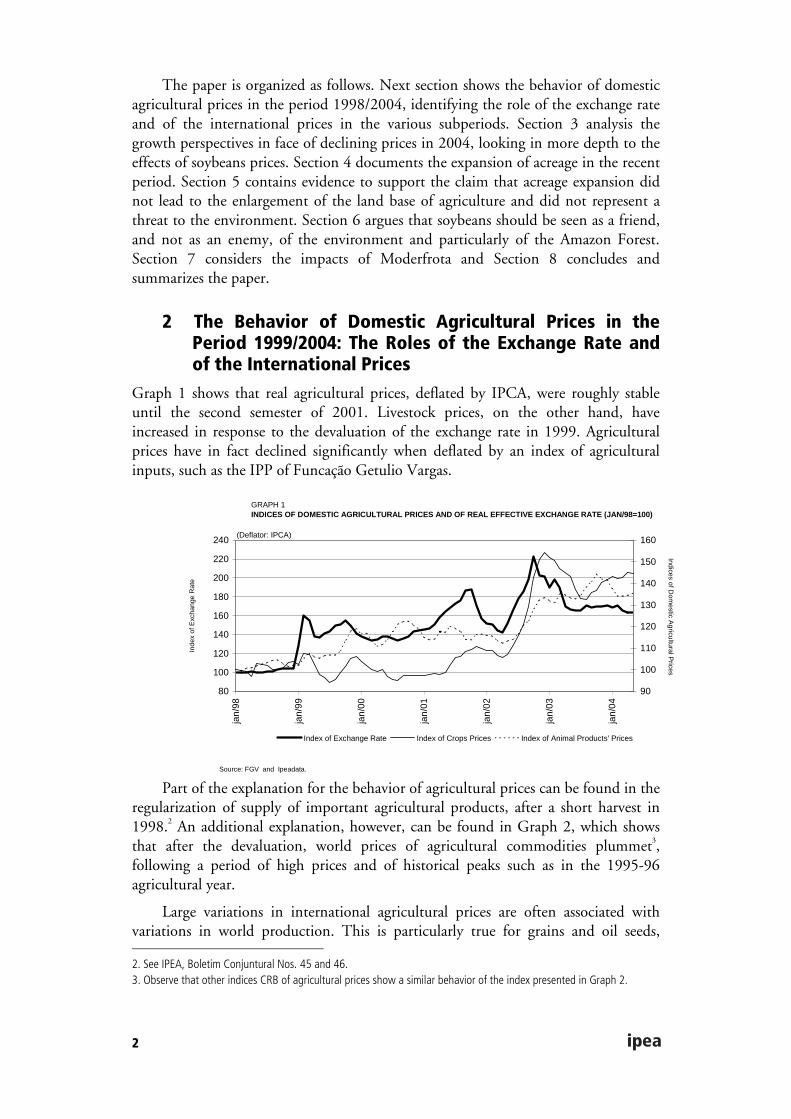
Graph 1 shows that real agricultural prices, deflated by IPCA, were roughly stable until the second semester of 2001. Livestock prices, on the other hand, have increased in response to the devaluation of the exchange rate in 1999. Agricultural prices have in fact declined significantly when deflated by an index of agricultural inputs, such as the IPP of Funcação Getulio Vargas.
Part of the explanation for the behavior of agricultural prices can be found in the regularization of supply of important agricultural products, after a short harvest in 1998.2 An additional explanation, however, can be found in Graph 2, which shows that after the devaluation, world prices of agricultural commodities plummet3, following a period of high prices and of historical peaks such as in the 1995-96 agricultural year.
Large variations in international agricultural prices are often associated with variations in world production. This is particularly true for grains and oil seeds,
2. See IPEA, Boletim Conjuntural Nos. 45 and 46.3. Observe that other indices CRB of agricultural prices show a similar behavior of the index presented in Graph 2.
GRAPH 1INDICES OF DOMESTIC AGRICULTURAL PRICES AND OF REAL EFFECTIVE EXCHANGE RATE (JAN/98=100)
80
100
120
140
160
180
200
220
240
jan/
98
jan/
99
jan/
00
jan/
01
jan/
02
jan/
03
jan/
04
Inde
x of
Exc
hang
e R
ate
90
100
110
120
130
140
150
160
Indices of Dom
estic Agricultural P
rices
Index of Exchange Rate Index of Crops Prices Index of Animal Products' Prices
Source: FGV and Ipeadata.
(Deflator: IPCA)

3
whose production is heavily concentrated in the United States and thus climate instability in this country influences world supply and world prices. Furthermore, macroeconomic variables also influence prices since they affect final demand through the variations in the value of the dollar, and through its effects in the world financial market, particularly in the behavior of the interest rate in the U.S.
The case of soybeans will shed more light on the behavior of the international markets of agricultural commodities. Graph 3 shows that the international price of soybeans was stable and low and sometimes declined between 1998 and 2001. Beginning in 2002, prices start to increase, and reach a peak in the first semester of 2004 which is followed by a sharp decline in the second semester of 2004.
Thus, in view of the coincidence of the devaluation of the exchange rate with the cycle of low prices in the world grain markets, one sees that the two effects offset each other, leading to the stability of domestic prices. With the recuperation of world
GRAPH 2CRB INDEX FOR GRAINS AND OILSEEDS (JAN/90=100)
50
70
90
110
130
150
170
jan/
90
jan/
91
jan/
92
jan/
93
jan/
94
jan/
95
jan/
96
jan/
97
jan/
98
jan/
99
jan/
00
jan/
01
jan/
02
jan/
03
jan/
04Source: CRB.
(Deflator: CPI) CPPEfla
GRAPH 3INDICES OF DOMESTIC AND INTERNATIONAL PRICES OF SOYBEANSAND OF REAL EFFEVTIVE EXCHANGE RATE (JAN/98=100)
40
80
120
160
200
240
jan/
98
jan/
99
jan/
00
jan/
01
jan/
02
jan/
03
jan/
04
Indi
ces
of D
omes
tic P
rice
of S
oybe
ans
and
of
Exc
hang
e R
ate
50
60
70
80
90
100
110
120
130
Index of International Price of S
oybeans
Index of Domestic Price of Soybeans (Deflator: IPCA)
Index of Real Effective Exchange Rate
Index of International Price of Soybeans
Source: Conab and Ipeadata.

4
prices in 2001/02, domestic prices increased, providing the incentives for the observed area expansion.
To make this more precise, Table 1 decomposes the variation of the domestic prices into two components: 1) variation of the exchange rate and 2) variation of the international price. The calculation was done for two successive years and two comparison periods: 1) planting period, August to October and 2) harvesting/marketing period, March to May. The variation in the soybeans price between two consecutive years, in the planting period, is certainly relevant for the planting decisions. On the other hand, the variation of the price in the harvesting/marketing period between any two years may lead to unexpected losses or windfall gains. Thus, these year to year price variations, in the two periods of the agricultural year, influence farmers’ decisions.
TABLE 1 BRAZIL: RATES OF CHANGE OF DOMESTIC AND INTERNATIONAL PRICES OF SOYBEANS AND OF REAL EFFECTIVE EXCHANGE RATE, BETWEEN PERIODS OF PLANTING AND PERIODS OF MARKETING [%]
Period of planting Period of marketing Periods
Domestic price International price Exchange rate Domestic price International price Exchange rate
1998/1999 32.1 –13.2 47.9 9.9 –27.8 42.8
1999/2000 –12.7 –4.8 –10.5 7.6 8.8 –5.4
2000/2001 43.6 –3.9 35.1 –7.4 –20.0 16.5
2001/2002 33.2 17.6 10.2 15.4 4.6 –7.5
2002/2003 –15.2 12.6 –16.2 42.8 25.6 20.0
2003/2004 –8.3 –6.8 –3.6 26.3 57.6 –6.3
Source: CONAB and FGV. Note: The periods of planting and of marketing were the months from August to October and from March to May, respectively. The rates of variation were calculated on the basis of the simple averages of the prices calculated for these periods.
As can be seen in Table 1, there was a persistent reduction in the international prices of soybeans between 1998 and 2001; if it were not for the devaluation, agriculture would have experienced a period of low or negative profitability. Nevertheless, this table shows that the increases in the price of soybeans between 1998/2001 were restricted to the planting period, without significant changes in the harvesting/marketing period. But the situation changed drastically afterwards. Price comparisons between 2001 and 2002, between 2002 and 2003 and between 2003 and 2004 show that soybeans producers obtained significant windfall gains mostly due to the behavior of the international market.
The period 1998/2004 can be divided in two sub periods, depending on the role of the exchange rate and of the international prices: 1) 1998/2001 where the exchange rate was instrumental do avoid a sharp reduction in domestic prices; and 2) 2002/2004 where the increase in the international prices feeded the upward movement of the domestic price.
Graph 4 shows that the period of declining world soybeans prices (1998/2001) coincided with a phase of high world stocks. It also shows that the recent price volatility is associated with volatile expectations with respect to estimated stock levels

5
at the end of the crop year 2004/2005. World prices of cotton, corn and wheat show the same cyclical pattern4.
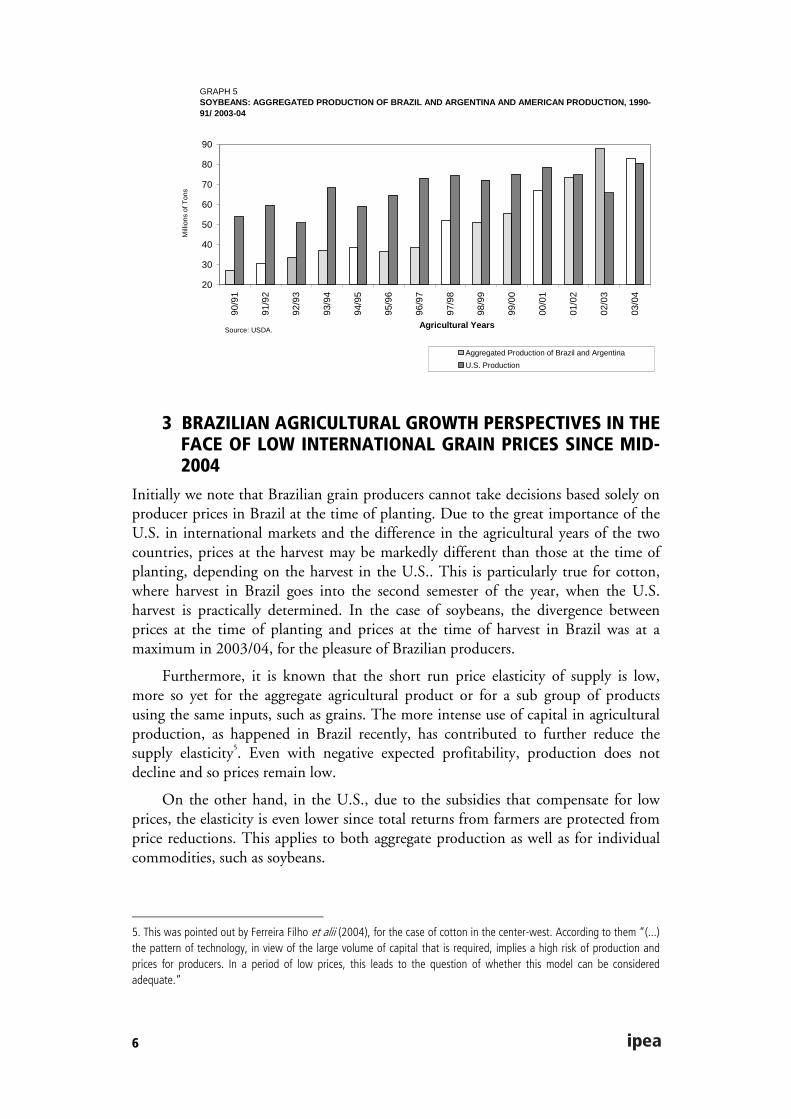
Incidentally, it is worth noting that the short harvests in the U.S. in 2002 and 2003 were instrumental to avoid a significant reduction in world prices due to the increase in soybeans production that took place in Brazil and in Argentina after 1999. Graph 5 shows this and we note the jumps in the joint production of the two countries in the agricultural years 2000/01, 2001/02 and particularly in 2002/03. In latter year the joint harvest was 88 million tons, 20 percent above the harvest of the previous year (73.5 million tons).
In 2003 the harvest in the U.S. was 65.8 million tons, a drop of 12 percent in relation to the previous year. This was indeed a second consecutive short harvest in the U.S.. If the harvests in 2002 and 2003 remained at the 2001 level of 78.7 million tons, world soybeans production would have increased 8.5 percent in 2002 and 0.9 percent in 2003 instead of the drop of 4 percent that actually took place in the latter year. Had this happened, world prices would not have reached the levels observed in 2002, 2003 and much less the stratospheric levels achieved in the beginning of 2004.
Let us open a parenthesis here to note the similarity between the achievement of high world prices even though strong devaluations took place in both Brazil and Argentina and a discussion that took place in the 1980s. In that discussion, some analysts were concerned that a generalized process of devaluation in developing countries pressed with high external debt would aggravate, rather than alleviate, the shortage of foreign exchange, to the extent that the increase in the world supply of agricultural products would reduce foreign revenues.
4. For details see Boletim de Conjuntura, IPEA, No. 66, September 2004.
GRAPH 4WORLD RATIO STOCK/USE AND INTERNATIONAL PRICE OF SOYBEANS, 1991/2005
170
190
210
230
250
270
290
310
330
350
1991
1992
1993
1994
1995
1996
1997
1998
1999
2000
2001
2002
2003
2004
2005
Inte
rnat
iona
l Pric
e of
Soy
bean
s (in
US
$/t)
10
15
20
25
30
World R
atio Stock/ U
se (in %)
International Price of Soybeans (Deflator: CPI-USA, Sept/04=100)
Ration Stock / Use
Source: Conab and USDA.
6
3 BRAZILIAN AGRICULTURAL GROWTH PERSPECTIVES IN THE FACE OF LOW INTERNATIONAL GRAIN PRICES SINCE MID-2004
Initially we note that Brazilian grain producers cannot take decisions based solely on producer prices in Brazil at the time of planting. Due to the great importance of the U.S. in international markets and the difference in the agricultural years of the two countries, prices at the harvest may be markedly different than those at the time of planting, depending on the harvest in the U.S.. This is particularly true for cotton, where harvest in Brazil goes into the second semester of the year, when the U.S. harvest is practically determined. In the case of soybeans, the divergence between prices at the time of planting and prices at the time of harvest in Brazil was at a maximum in 2003/04, for the pleasure of Brazilian producers.
Furthermore, it is known that the short run price elasticity of supply is low, more so yet for the aggregate agricultural product or for a sub group of products using the same inputs, such as grains. The more intense use of capital in agricultural production, as happened in Brazil recently, has contributed to further reduce the supply elasticity5. Even with negative expected profitability, production does not decline and so prices remain low.
On the other hand, in the U.S., due to the subsidies that compensate for low prices, the elasticity is even lower since total returns from farmers are protected from price reductions. This applies to both aggregate production as well as for individual commodities, such as soybeans.
5. This was pointed out by Ferreira Filho et alii (2004), for the case of cotton in the center-west. According to them “(...)the pattern of technology, in view of the large volume of capital that is required, implies a high risk of production and prices for producers. In a period of low prices, this leads to the question of whether this model can be considered adequate.”
GRAPH 5SOYBEANS: AGGREGATED PRODUCTION OF BRAZIL AND ARGENTINA AND AMERICAN PRODUCTION, 1990-91/ 2003-04
20
30
40
50
60
70
80
90
90/9
1
91/9
2
92/9
3
93/9
4
94/9
5
95/9
6
96/9
7
97/9
8
98/9
9
99/0
0
00/0
1
01/0
2
02/0
3
03/0
4
Agricultural Years
Mill
ions
of T
ons
Aggregated Production of Brazil and Argentina
U.S. Production
Source: USDA.

7
This analysis explains the cycles in the international grain markets, with dominance of low prices. A price reduction at a given moment in time does not reduce supply in the U.S. and neither in Brazil or Argentina. Thus, if there is an abundant harvest in the U.S., such as in 2004, and normal productivities in the following years, prices will fall and will remain there since supply will not be affected by the lower prices. Therefore the current stage of low prices will be changed if a short harvest takes place, particularly in the U.S. in view of her importance as a producer of grains. This was what happened in 2002 and 2003. One year of normal production was, however, sufficient to change the price scenario completely.
In summary, unless there is a short supply of soybeans in Brazil and Argentina in the agricultural year 2004/05, and/or in the U.S. in 2005 (a fact that wont be known until July or August 2005), it is likely that prices will remain low in 2005. This will reduce agricultural profitability and will, very likely, lead to a financial crisis due to the high level of indebtedness of farmers achieved in the period of high prices.
4 INCREASES IN ACREAGE IN THE RECENT PERIOD, WITH SPECIAL EMPHASIS IN THE CASE OF SOYBEANS
Recent Brazilian agricultural growth, characterized by a strong expansion of cropped area, represents a break up with the pattern observed during the 1990s where acreage remained constant6. This can be seen in the case of soybeans, where acreage has grown at an annual average rate of 3.6 percent during the period 1990/91 – 2000/01 and then experienced a spectacular increase to 13.8 percent during 2000/01 – 2003/04, as illustrated in Graph 6. Acreage with other grains has also changed its pattern, going from –3.5 percent to –0.7 percent between the two periods. Total acreage with all crops, except soybeans, has not changed its behavior between the periods.
Table 2 shows this switch of patterns in the case of soybeans. In the period 1990/91 – 2000/01, acreage increased only in the Center-West, North and Northeast.
6. This was noted in Brandão and Rezende (2004).
GRAPH 6INDICES OF PLANTED AREA OF SOYBEANS AND AGGREGATES OF CROPS, 1990/91-2003/04
40
100
160
220
280
90/9
1
91/9
2
92/9
3
93/9
4
94/9
5
95/9
6
96/9
7
97/9
8
98/9
9
99/0
0
00/0
1
01/0
2
02/0
3
03/0
4
Source: IBGE and CONAB.
Indi
ces
(Bas
e: 1
990/
91 =
100
)
All Crops, Less Soybeans
All Grains, Less Soybeans
Soybeans
13,8 % per year
3,6 % per year
-1,9 % per year
-1,3 % per year
-3,5 % per year -0,7 % per year

8
However, in the recent period acreage increased in all regions. Table 2 also shows that growth of soybeans area in the 1990s in the Center-West, North and Northeast was accompanied by expansion of total acreage, since area planted with crops that compete with soybeans (corn first crop, cotton and rice) did not diminish. It is worth noting also that during the 1990s soybeans acreage remained constant in the south and southeastern regions, despite the fact that acreage with other grains diminished.
The recent expansion of soybeans acreage, as can be seen in Table 2, contributed also for the increase in area of crops that use the same land during the winter period, such as corn second crop, wheat and even cotton.
TABLE 2 PLANTED AREA AND CHANGE OF PLANTED AREA BETWEEN SELECTED AGRICULTURAL YEARS, ACCORDING TO PRODUCTS AND REGIONS
Accumulated change Planted area (1000 ha)
Between 1990/91 and 2000/01 Between 2000/01 and 2003/04 Products
1990/91 2000/01 2003/04 (in 1000 ha) (in %) (in 1000 ha) (in %)
Soybeans 9,743 13,970 21,244 4,227 43.4 7,274 52.1
Center-West 2,946 5,760 9,568 2,813 95.5 3,808 66.1
South/Southeast 6,507 7,156 10,006 649 10.0 2,850 39.8
Corn 1st crop 12,652 10,546 9,457 –2,106 –16.6 –1,089 –10.3
Center-West 1,519 1,206 758 –313 –20.6 –448 –37.2
South/Southeast 8,000 6,482 5,573 –1,518 –19.0 –909 –14.0
Beans 1st crop 1,881 1,285 1,371 –595 –31.7 86 6.7
Center-West 40 55 61 16 39.7 6 11.2
South/Southeast 1,473 859 896 –614 –41.7 37 4.3
Cotton 1,939 868 1,069 –1,070 –55.2 200 23.0
Center-West 171 542 605 371 216.9 64 11.8
South/Southeast 935 173 167 –762 –81.5 –6 –3.2
Rice 4,233 3,249 3,598 –984 –23.3 349 10.7
Center-West 777 631 862 –146 –18.8 231 36.6
South/Southeast 1,821 1,326 1,392 –494 –27.1 66 4.9
Total for crops above 30,446 29,918 36,738 –528 –1.7 6,820 22.8
Center-West 5,452 8,193 11,854 2,741 50.3 3,660 44.7
South/Southeast 18,736 15,996 18,034 –2,740 –14.6 2,038 12.7
Corn 2nd crop 800 2,426 3,668 1,627 203.5 1,242 51.2
Wheat 2,146 1,710 2,727 –436 –20.3 1,017 59.5
Beans 2nd and 3rd crops 3,624 2,594 2,886 –1,030 –28.4 293 11.3
Total for winter crops* 7,447 7,929 10,525 482 6.5 2,595 32.7
Total for all crops 51,800 51,600 60,640 –200 –0.4 6,781 13.1
Source: CONAB and IBGE. * "Total for winter crops" includes: corn 2
nd crop, beans 2
nd and 3
rd crops, wheat, barley and other minor crops.

9
Notice also that the expansion of soybeans acreage in the Center-West, North and Northeast between 1990/01 – 2000/01 did not take place in areas occupied by competing crops, such as corn first crop and cotton. This land came from other sources even in the earlier period of expansion.
Before an explanation for the process of acreage expansion is offered, it is interesting to consider whether the expansion of area was accompanied by a reduction in yields for soybeans. As new areas are brought into production a reduction of yields could be seen due to use of less suitable soils. Or, it could be that the new pattern of production was more land intensive (in the neoclassical sense), using less of the other inputs, leading to a reduction of yields.
To verify this, Table 3 shows soybeans yields in the period 1991/92 – 2003/04. Unfortunately, the verification of the hypothesis can not be done in view of the fact that the three year period going from 2001/02 to 2003/04 is short to provide a good basis for conclusions, particularly in view of the short supply that occurred in 2003/04 in the Center-West and in the South and of the fact that 2000/01 was an year with record yields in all regions.
TABLE 3 PRODUCTIVITY INDEX OF SOYBEANS, BY REGION AND AGRICULTURAL YEAR
Center-West Southeast North/Northeast South Brazil
1991/1992 100 100 100 100 100
1992/1993 100 103 109 111 106
1993/1994 105 102 136 108 107
1994/1995 99 98 148 118 110
1995/1996 107 100 117 108 107
1996/1997 118 109 144 109 113
1997/1998 114 106 144 120 118
1998/1999 121 121 142 110 117
1999/2000 124 107 164 108 118
2000/2001 133 118 146 141 136
2001/2002 131 129 131 119 127
2002/2003 131 131 143 148 139
2003/2004 116 120 179 103 116
Coefficient of variation 0.10 0.10 0.15 0.12 0.09
Source: Conab.
5 PASTURE CONVERSION AS THE MAIN SOURCE OF THE RECENT GROWTH OF SOYBEANS ACREAGE IN BRAZIL
The hypothesis raised in this section is that the expansion of soybeans acreage in the 1990s, where it was confined to the Center-West, and in the period 2001/02 – 2003/04, where the expansion took place in all regions, was supported by conversion

10
of degraded pasture land and not of the virgin areas of the cerrado or the Amazon Forest.7
This same hypothesis has been advanced by Müeller (2003) in his analysis of the expansion of soybeans in the Center-West during the decade of the 1990s. He has shown that the expansion of acreage took place in the same micro regions where production was already concentrated in the beginning of the 1990s. In other word, the increase in production took place without the need to open new areas.
The expansion in the three-year period 2001/02 – 2003/04 was much faster than before and took place in all regions. The following observations indicate reasons that support the view that the same process noted by Müeller is still operating. First, note that it is impossible to open a virgin area, particularly in the Amazon Forest, in such a short time and use it in the same time period to produce soybeans. A virgin area, whether of cerrado land or Amazon Forest, requires time before it can be suitable for agricultural production.8 This is an empirical issue that can be verified and it is possible that due to the exceptional profitability in this period, technologies that were able to shorten the soybeans production period from the virgin areas have been adopted.9 Second, the virgin areas in the cerrado and in the Amazon Forest do not have the needed infrastructure for soybeans, a problem that does not exist in areas of livestock production, which are located in areas with good infrastructure and logistics. Third, areas already used for pasture can be converted to soybeans production, and the conversion can be made in one period. The main reason is that a number of operations necessary for soybeans production were already implemented, as, for example, application of lime. And last, but not least, the conversion of degraded pasture land into soybeans will allow, in the future, a more productive pasture, a fact that makes further increases in the profitability of soybeans production in these areas. In other words, the conversion is not only soybeans production, but also production of new pasture, a fact that raises returns above those associated with the conversion of virgin areas. Often this conversion takes place through renting, which eliminates the need of capital for land acquisition and, furthermore, reduce the rental value of land.10 Naturally the price of soybeans plays a key role in the determination of the rental value.11
7. There is a generalized belief that the expansion of soybeans acreage is based on deforestation of the cerrado land andthe Amazon Forest. On this, see, for example, “Plantio de Soja Avança sobre Amazônia”, O Globo, 18/9/03, which, in turn makes reference to an article in the New York Times about the same subject. See also “Amazônia: A Soja Avança na Floresta”, a special report of O Estado de São Paulo, 26/10/03, as well as “Produção de Soja Avança no Oeste do Pará”, in Gazeta Mercantil, 16/01/04. See also the report “Asphalt and the Jungle”, The Economist, 24/7/04, p. 33-35. 8. In this regard, see Rezende (2003), where, based on Cunha et alii (1994), he proposes a formal model of"production" of agricultural land in the cerrado with a lag between the allocation of factors of production to produce land and the allocation of other factors – together with the newly produced land – for agricultural production. 9. André Pessoa, in a personal comunication with the authors, informed that a new procedure, adopted in face of thehigh soybeans prices, allowed a faster conversion of cerrado land into land suitable for soybeans production. According to André, following the clearing of the cerrado, “a strong application of lime was used to correct the soil accidity, also a strong applicaton of phosporous was used some months before plating and during the planting period high volumes (500 kg per hectare) of fertilizer are appplied. This allows for yields of the order of 40 sacs (of 50 kgs) per hectare in the first year. The investment is high, but with the unusually high prices of soybeans the return was high either.” 10. Land renting for grain production (cotton, rice, corn and soybeans) accompanied by renovations of pasture at the endof the lease period is a common and long used practice in the areas of cerrado. A detailed analysis can be found in Romeiro and Reydon (1994). See also the interesting interview to Agroanalysis, November 2002, by Humberto

11
Thus the high prices for soybeans and livestock lead to an increase in both demand and supply of land for soybeans cultivation. The increase in production of soybeans through temporary leasing of areas previously occupied with livestock is an agronomical mechanism consistent with quick production (to take advantage of the favorable prices), but is also economically more adequate than to increase production through permanent substitution of pasture or conversion of virgin areas, since it reduces capital requirements and facilitates the management of situations where prices are highly volatile such as in the international grains markets.12
The above analysis does not exclude the possibility that areas of the Amazon Forest or of the cerrados that have initiated in the past their conversion into agricultural lands may have been a source for the current expansion of soybean acreage.
Notice that the fast expansion of the soybeans acreage in the last three years took place also in the South and Southeast, after a total stagnation during the decade of the 1990s. Evidently there could be no conversion of virgin areas in these regions since they no longer exist there. Since there was no crop substitution, the conversion of pasture is the unique sensible hypothesis to explain this radical shift in land use in the south and southeast of Brazil.
As far as the Center-West is concerned, it is worth mentioning that the State of Mato Grosso has large areas in extensive livestock production. These were deforested during the military governments induced by large colonization projects and by the chaotic occupation of the Amazon. This includes specifically, the so-called Nortão (the area located in the northern border of the State) of Mato Grosso. An interesting case is the municipality of Querência, where soybeans production is recent and is entirely based on pasture conversion of areas formed much before the recent boom. 13 Another similar case is the Araguaia Valley, analyzed by Müeller (2003). These examples show that it is not sufficient to look at spatial photos documenting the expansion of soybeans areas to conclude that the remaining forest or cerrado land in
Guimarães, founder of the “Lease Exchange” (Bolsa de Arrendamento) of Uberaba in the state of Minas Gerais. It should be noted, however, that André Pessoa, in message to the authors, asserted that “the major part of the pasture lands that migrated to soybeans were not rented, but rather bought by the soybeans producers.” Again, this is an empirical question, hard to be verified, in view of the amplitude of the area to be covered by research and the diversity of situations. In this paper, we defend the hypothesis that the expansion in cropped area with soybeans in the last agricultural years took place mostly through renting, not only because this is a very common practive in the center-west, but also because, in this way, it is easier to explain the rapidity of area expansion with soybeans, hardly explainable by the mechanism of purchase of land, what would have required a much greater capital investment, what would make this expansion much more risky. The fall in soybeans prices in 2004, by the way, would have confirmed the correctness of the strategy of risk minimization implicit in the of renting of land. 11. On this regard, Prof. Guilherme Dias, in a personal exchange with one of the authors, mentions the short term crisisthat is taking place in these regions, due to the fall in soybeans prices. The rental values are reduced due to bargaining forced by soybeans producers. 12. The expansion of soybeans through the conversion of pastures, in opposition to virgin lands in the cerrado, has beenadvocated as more adequate from the perspective of preservation of biodiversity (see Abramovay, 1999). Since in this case the conversion of pasture into soybeans will be permanent, this has a higher oportunity cost than the conversion of virgin areas of the cerrado, as argued by Rezende (2003, p. 202-3). 13. The dramatic changes in land use in Querência were documented in a report entitled “Mapa Redesenhado”, GloboRural August 2004, pp. 12/16. According to the report, soybeans acreage went from practically zero to 65 thousand hectares in 2002/03, increased further to 113 thousand hectares in 2003/04 and is expected to increase to nothing less than 180 thousand hectares in 2004/05. This strong expansion of acreage was totally based on pasture conversion, without requiring one single hectare of deforestation of the cerrado or the Amazon Forest.

12
these areas are being menaced by the expansion of this crop. It must be noted also that the legislation allows the use of 20 percent of the area of Amazon Forest and 80 percent of the cerrado for production. Thus, even if soybeans were expanding within these limits there would be no violation of the existing legislation.
It is interesting to note that, in a recent work, USDA noted the capacity that Brazil has to increase crop acreage through conversion of pastures, a fact that increases the competitive position of Brazil vis a vis the U.S.14
Finally, it is interesting to mention the work of Torres Jr. et alii (2004, p. 37) who estimate that this process of conversion involved some 4.9 million hectares in the period 2001/2003 and 3.0 millions in 2004. 15 These numbers are of the same order of magnitude of the 6.8 millions of hectares of increase in the total area planted with grains in Brazil in the period 2001/02 to 2003/04, as shown in Table 2. The authors point out also that, in the recent period, the profitability of raising livestock was low due to the low prices of calves. This fact was also noted by Abou Nehmi Filho16, a well-known analyst of the livestock sector, which stressed the fact that conversion of pasture coincided with an increase in the number of calves and the consequent decline in the price of matrices. According to him, “this is a natural movement, but which was exacerbated by the soybeans price which caused a further reduction in the size of the herd.” He goes on and says that meat prices did not drop further because of exports.
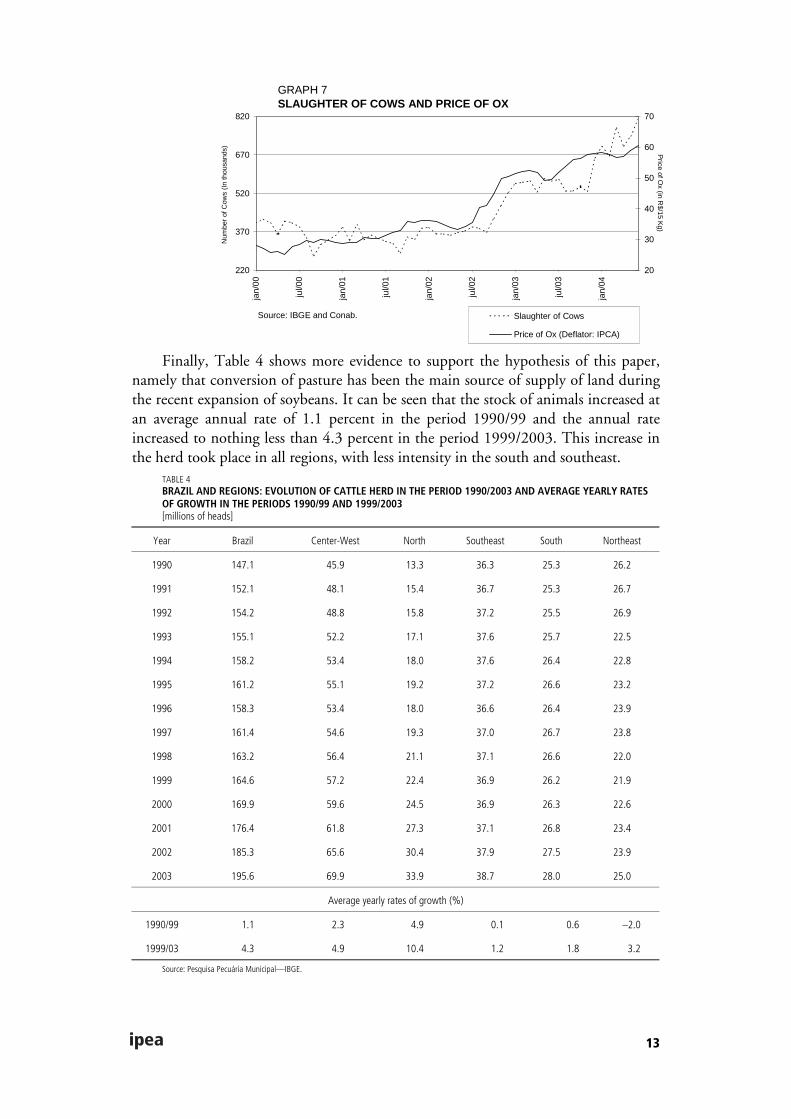
Graph 7 shows that it is indeed the case that from the second semester of 2002 there was an increase in the number of cows slaughtered, together with the increase in price of meat. Since normally, slaughtering of cows takes place when meat prices go down and not when they go up, this evidence is consistent with the hypothesis of Nehmi Filho, namely that the increase in the price of soybeans provided incentives for pasture conversion, which, in turn, led to the slaughtering of cows. Furthermore, the significant increase in the price of meat that started in January 2000 and which got stronger from July 2000, has contributed to the renewal of pastures to increase their carrying capacity.
14. See Shean (2003).15. In his comunication with the authors, André Pessoa informed that, according to his estimates, the area of pastureswitched to soybeans cultivation was 3.8 millions hectares. Even though this is inferior to the total expansion of soybeans acreage, this is still a large number, particularly considering the short time period in which it took place. 16. See the report “Boi Versus Soja”, Globo Rural no. 223 (May 2004), p. 444.
13
Finally, Table 4 shows more evidence to support the hypothesis of this paper, namely that conversion of pasture has been the main source of supply of land during the recent expansion of soybeans. It can be seen that the stock of animals increased at an average annual rate of 1.1 percent in the period 1990/99 and the annual rate increased to nothing less than 4.3 percent in the period 1999/2003. This increase in the herd took place in all regions, with less intensity in the south and southeast.
TABLE 4 BRAZIL AND REGIONS: EVOLUTION OF CATTLE HERD IN THE PERIOD 1990/2003 AND AVERAGE YEARLY RATES OF GROWTH IN THE PERIODS 1990/99 AND 1999/2003 [millions of heads]
Year Brazil Center-West North Southeast South Northeast
1990 147.1 45.9 13.3 36.3 25.3 26.2
1991 152.1 48.1 15.4 36.7 25.3 26.7
1992 154.2 48.8 15.8 37.2 25.5 26.9
1993 155.1 52.2 17.1 37.6 25.7 22.5
1994 158.2 53.4 18.0 37.6 26.4 22.8
1995 161.2 55.1 19.2 37.2 26.6 23.2
1996 158.3 53.4 18.0 36.6 26.4 23.9
1997 161.4 54.6 19.3 37.0 26.7 23.8
1998 163.2 56.4 21.1 37.1 26.6 22.0
1999 164.6 57.2 22.4 36.9 26.2 21.9
2000 169.9 59.6 24.5 36.9 26.3 22.6
2001 176.4 61.8 27.3 37.1 26.8 23.4
2002 185.3 65.6 30.4 37.9 27.5 23.9
2003 195.6 69.9 33.9 38.7 28.0 25.0
Average yearly rates of growth (%)
1990/99 1.1 2.3 4.9 0.1 0.6 –2.0
1999/03 4.3 4.9 10.4 1.2 1.8 3.2
Source: Pesquisa Pecuária Municipal—IBGE.
GRAPH 7SLAUGHTER OF COWS AND PRICE OF OX
220
370
520
670
820
jan/
00
jul/0
0
jan/
01
jul/0
1
jan/
02
jul/0
2
jan/
03
jul/0
3
jan/
04
Num
ber
of C
ows
(In
thou
sand
s)
20
30
40
50
60
70
Price of O
x (in R$/15 K
g)
Slaughter of Cows
Price of Ox (Deflator: IPCA)
Source: IBGE and Conab.
14
This expansion of the herd, which is a consequence of the increase in profitability of the livestock activity, has been supported by genetic improvements in the herd which is completed by improvement in pastures. This is entirely consistent with the view that the renewal of pastures is a key factor to explain the expansion of the soybeans area.
6 SOYBEANS AND THE AMAZON FOREST: FRIENDS OR FOES? The expansion of soybeans in the recent period lead us to take a closer look at the issue, which concerns many groups in Brazil and abroad, whether soybeans expansion is a threat to the Amazon Forest.
This concern has indeed stopped the process of improvement of the infrastructure to permit access to the areas of the Amazon Forest and other regions where preservation is needed. A particularly important aspect of this question is paving highway BR 163, which goes from Cuiabá, in the State of Mato Grosso, to Santarém in the State of Pará. Paving this highway will not only have a favorable impacts on economic activity in its borders, but also on soybeans producing areas in the center-west (specially the State of Mato Grosso) which have to transport production to the ports of Santos and Paranaguá. Furthermore, the benefit will also be extended to Zona Franca, in Manaus, through reduction of transportation costs to the center-south and even the northeast could benefit since the transport costs from food imported from the center-west will diminish.17
The key argument to support paving BR 163 is that as the soybeans activity becomes viable in the region, it will enhance the efficacy of environmental policy. As transportation costs are reduced, land prices will increase and turn current activities that are mostly responsible for deforestation uneconomical, such as itinerant agriculture with low technology and which uses fire to open new areas, irrational logging activities and low technology livestock production which destroys natural resources.18
Before this can happen, however, it is important that the government put additional emphasis in the regularization of property titles and other issues that will reduce tenure uncertainty. If there is tenure uncertainty, land prices will be lower than justified by the profitability of soybeans and thus the selective mechanism that would otherwise operate will fail. In any case, it can be expected that the possibility of utilization of land for soybeans production will create incentives for the process of property title regularization and a reduction of tenure uncertainty, since production of soybeans will not take place on an environment where there is tenure insecurity. On the contrary, small scale itinerant agriculture, that uses fire to clear the forest, and unsustainable logging do not create the incentives for title regularization and remain
17. For a comprehensive analysis of the issues involved in paving BR 163 see “Problemas na BR-163 desafiam governo”and “Asfalto deve abrir rotas na região e reduzir fretes”, Valor Econômico, 27.9.04, pp. A4 e A5. See also the already mentioned report of The Economist and “Novas Perspectivas na Amazônia”, in Desafios do Desenvolvimento, Year 1, no. 3 (October 2004), pp. 42-51. 18. These activities are called by Müeller (2003) “traditional commercial agriculture”, “subsistence agriculture”,“speculative activities” and “traditional livestock”. In contrast Müeller argues that soybeans is part of “modern comercial agriculture”.

15
viable even in the presence of high transportation costs. Thus, it is naive to think that if BR 163 remains unpaved the Amazon Forest will be preserved, on the contrary.
Moreover, a well organized activity such as soybeans production is easily monitored by the public sector, particularly in regard to compliance with environmental policy. In the first place the high visibility of the activity allows for easy detection of mistakes. In the second place because this activity is not compatible with paternalistic and complacent behavior on the part of State officials (in the Administration, in the Legislative and in the Judiciary) that often do not enforce properly environment legislation when the violators are poor. One well-known example of this mechanism can be found in the mountains in the city of Rio de Janeiro (and most other Brazilian cities), where the environment legislation prohibits construction in these areas. The application of the legislation to the construction of houses for the middle and high classes reduced the land value to zero. This has created incentives for house constructions by the poor population – expanding dramatically the number and size of the favelas – for which the legislation is not enforced by the responsible State officials.
Mutatis mutandis, this is analogous to the case of not paving BR 163 due to the fear of the expansion of soybeans. The final result of the refusal of accepting soybeans as an ally of environmental policy is to perpetuate the current unsustainable use of land and deforestation of the Amazon.
7 MODERFROTA AND THE RECENT EXPANSION OF CULTIVATED AREA IN BRAZIL
An additional element to support the argument of this paper, namely that the recent expansion of soybeans was based on pasture conversion, is that conversion was facilitated by Moderfrota, a credit program that fuelled a great expansion of the stocks of agricultural machinery and equipments in Brazil.
It is plausible to assume that an acreage expansion of the scale observed in the last three years in Brazil would not have been possible without availability of agricultural machinery, particularly tractors. Thus the area growth was a combination of availability of degraded pastureland and of agricultural machinery, in addition, of course, to the exceptional profitability of soybeans. Most of the land under pasture has suffered a process of compaction due to the movement of animals, a fact that required specific equipment, financed by Moderfrota, to allow conversion into soybeans.
Graph 8 shows the sharp increase in sales of tractors and harvesters in the 1990s after a period of stagnation of the domestic market. The graph also shows that the greatest expansion, within the category of tractors, occurred in wheel tractors, a fact that is consistent with the hypothesis that most of the expansion of acreage took place through conversion and not deforestation of the Amazon or the cerrado. Graph 9 shows the high correlation between domestic sales of agricultural machinery and BNDES loans. This program started in the beginning of the 1990s, with the creation

16
of Finame Agrícola, and in 2000, after several improvements, Moderfrota started operating.19
In this regard, we note the hypothesis of Ferreira Filho and Costa (1999) who argue that the intensive pattern of agricultural development observed in Brazil in the last decades may be a consequence of the low availability of tractors, which hampered the expansion of cultivated area. Despite this, Ferreira Filho and Costa note that the unavailability of tractors may also have imposed difficulties for the intensification of agriculture since it restricts the application of fertilizers and other inputs. These authors note that the fast expansion of no tillage practices is likely to be a response to
19. It was the extension of Finame to agriculture with the creation of Finame Agrícola, that initiated the increase inagricultural investment credit, after a period of almost zero loans. See Brandão and Rezende (2004).
GRAPH 8EVOLUTION OF AGRICULTURAL MACHINERY
10
20
30
40
50
60
70
1970
1971
1972
1973
1974
1975
1976
1977
1978
1979
1980
1981
1982
1983
1984
1985
1986
1987
1988
1989
1990
1991
1992
1993
1994
1995
1996
1997
1998
1999
2000
2001
2002
2003
Num
ber
of T
ract
ors
(In
thou
sand
s)
0
2
4
6
8
10
12
Num
ber of Harversters (In thousands)
Tractors Harvesters Track-Type Tractors
Source: Anfavea/Sindimaq/Abimaq.
GRAPH 9AMOUNT OF LOANS FOR THE PURCHASE AGRICULTURAL MACHINERY WITHIN THE BNDES SYSTEM AND DOMESTIC SALES OF AGRICULTURAL MACHINERY
0
500
1.000
1.500
2.000
2.500
3.000
3.500
4.000
1990
1991
1992
1993
1994
1995
1996
1997
1998
1999
2000
2001
2002
2003
Am
ount
of L
oans
(in
R$
mill
ions
)
10
20
30
40
50
Agricultural M
achinery (thousands of units)
Value of Loans Domestic Sales of Agricultural Machinery
Finame Especial Moderfrota
Plano Real
Finame Agrícola

17
the unavailability of tractors, since this technology reduces the use of these machines. Finally they note that the expansion of agricultural aviation can also be an indication of low availability of tractors.
Another positive impact of Moderfrota on agriculture is the reduction in the use of labor per hectare, particularly temporary labor, whose cost is high (because of the labor legislation and excessive taxes), whose qualification is low, and whose availability is subject to a high degree of uncertainty.
An additional question for further research is whether Moderfrota is contributing for the concentration of property due to the usual restrictions of access to credit by small farmers and due to the indivisibility of equipments. These issues, however, are left for future analysis.
8 SUMMARY AND CONCLUSIONS This paper is an attempt to contribute to the analysis of recent agricultural expansion in Brazil. It has shown how the change in the exchange rate regime in 1999 has affected the process of expansion, emphasizing two clearly marked periods, one in which the devaluation of the exchange rate was accompanied by a drop in international prices and the other where an upward burst in international prices was observed. The paper also has called attention to the behavior of acreage, which has experienced an outburst of growth, changing the earlier pattern of agricultural expansion in the country which was based on yield increases.
At first sight, the outburst of acreage may suggest a return to an old paradigm, where production growth was based on extensive technologies (in the Ricardian sense). Nevertheless, the paper has shown that on the contrary, with the conversion of degraded pastureland into soybeans production one notices in fact an increase in the intensity of the use of land. This process of course does not exclude the possibility that some conversion of cerrado lands has taken place. However, due to the limitations of these kinds of soils for agriculture, the scale in which this conversion took place was likely very modest. With respect to the areas of Amazon Forest, it would be a magic to be able, in such a short period, to develop all operations needed to clear the forest and make the soil ready for soybeans.
It is possible that some new areas of the cerrado and of the Amazon Forest are in the process of conversion into soybeans. The larger this area, the larger will be in the future the capacity of expansion of soybeans in times of favorable prices.
The fact that the main source of area for the expansion of soybeans was the conversion of degraded pastures, as opposed to incorporation of areas deforested in the same period, leads to the conclusion that the possibilities of continued expansion of soybeans in Brazil are big and it is naïve to fear that this will be a new menace to the environment, whether in the cerrado or in the Amazon Forest. The paper goes on to say that there is no reason to fear that soybeans expansion will reduce the effects of environmental policy, on the contrary. The improvement of the transportation infrastructure (as is the case of paving BR 163) together with a reduction in tenure insecurity in the region will enhance the effects of the instruments of environmental policy.

18
REFERENCES ABRAMOVAY, R. Moratória para os cerrados — elementos para uma estratégia de
agricultura sustentável. Consórcio Atech/Museu Emilio Goeldi/Procan, Agenda 21, 1999, mimeo.
BRANDÃO, A S. P., REZENDE, G. C. Brazilian Agriculture in the 1990s and Ahead: The Role of Government Programs to Support Development and Challenges Ahead. Paper prepared for OECD, 2004.
CUNHA, A. S. et al. Uma avaliação da sustentabilidade da agricultura nos cerrados. Brasília: IPEA, 1994 (Relatórios de Pesquisa, 11).
FERREIRA FILHO, J. B. S., COSTA, A. C. F. A. O crescimento da agricultura e o consumo de máquinas agrícolas no Brasil. Paper presented in the XXXVII Brazilian Congress of Economics and Rural Sociology (SOBER), held at Foz do Iguaçu, Paraná, in 1999.
FERREIRA FILHO, J. B. S., ALVES, L. R. A., GAMEIRO, A. H. Algodão: alta competitividade no Brasil Central. Agroanalysis, vol. 24, n. 3, p. 24-27, Mar. 2004.
MÜELLER, C. C. Expansion and Modernization of Agriculture in the Cerrado – the Case of Soybeans in Brazil’s Center-West. Brasília: Department of Economics, University of Brasília, Oct. 2003.
REZENDE, G. C. Ocupação agrícola, estrutura agrária e mercado de trabalho rural no cerrado: o papel do preço da terra, dos recursos naturais e das políticas públicas. In Helfand, S. M. and Rezende, G. C. (edit.). Região e espaço no desenvolvimento agrícola brasileiro. Rio de Janeiro, IPEA, p. 173-212, 2003.
ROMEIRO, A., REYDON, B. P. (coords.) O mercado de terras. Brasília: IPEA, Mar. 1994 (Estudos de Política Agrícola, 13).
SHEAN, M. J. Brazil: Future Agricultural Expansion Underrrated. Washington: Production Estimates and Crop Assessment Division, FAZ/USDA, Jan. 2003.
TORRES JR., A. M., ROSA, F. R. T., NOGUEIRA, M. P. Mais boi em menos pasto. Agroanalysis, p. 37-39, Aug. 2004.


Ipea – Institute for Applied Economic Research
PUBLISHING DEPARTMENT
CoordinationCláudio Passos de Oliveira
SupervisionEverson da Silva MouraReginaldo da Silva Domingos
TypesettingBernar José VieiraCristiano Ferreira de AraújoDaniella Silva NogueiraDanilo Leite de Macedo TavaresDiego André Souza SantosJeovah Herculano Szervinsk JuniorLeonardo Hideki Higa
Cover designLuís Cláudio Cardoso da Silva
Graphic designRenato Rodrigues Buenos
The manuscripts in languages other than Portuguese published herein have not been proofread.
Ipea Bookstore
SBS – Quadra 1 − Bloco J − Ed. BNDES, Térreo 70076-900 − Brasília – DFBrazilTel.: + 55 (61) 3315 5336E-mail: [email protected]


Composed in Adobe Garamond 11/13.2 (text)Frutiger 47 (headings, graphs and tables)
Brasília – DF – Brazil


Ipea’s missionEnhance public policies that are essential to Brazilian development by producing and disseminating knowledge and by advising the state in its strategic decisions.