AGRICULTURE PRODUCTIVITY GROWTH IN BRAZILIAN MICRO...
60
208 AGRICULTURE PRODUCTIVITY GROWTH IN BRAZILIAN MICRO-REGIONS Alexandre X. Ywata de Carvalho Camilo R. Laureto Marina G. Pena Originally published by Ipea in June 2015 as number 2099 of the series Texto para Discussão.
Transcript of AGRICULTURE PRODUCTIVITY GROWTH IN BRAZILIAN MICRO...
208
AGRICULTURE PRODUCTIVITY GROWTH IN BRAZILIAN MICRO-REGIONS
Alexandre X. Ywata de CarvalhoCamilo R. LauretoMarina G. Pena
Originally published by Ipea in June 2015 as number 2099 of the series Texto para Discussão.

AGRICULTURE PRODUCTIVITY GROWTH IN BRAZILIAN MICRO-REGIONS
Alexandre X. Ywata de Carvalho1
Camilo R. Laureto2
Marina G. Pena3
1. Institute of Applied Economic Research – Ipea, Brasília-DF, Brasil ([email protected]).2. Institute of Applied Economic Research – Ipea, Brasília-DF, Brasil ([email protected]).3. Institute of Applied Economic Research – Ipea, Brasília-DF, Brasil ([email protected]).
DISCUSSION PAPER
208B r a s í l i a , F e b r u a r y 2 0 1 6
Originally published by Ipea in June 2015 as number 2099 of the series Texto para Discussão.
Federal Government of Brazil
Ministry of Planning, Budget and Management Minister Valdir Moysés Simão
A public foundation affiliated to the Ministry of Planning, Budget and Management, Ipea provides technical and institutional support to government actions – enabling the formulation of numerous public policies and programs for Brazilian development – and makes research and studies conducted by its staff available to society.
PresidentJessé José Freire de Souza
Director of Institutional DevelopmentAlexandre dos Santos Cunha
Director of Studies and Policies of the State,Institutions and DemocracyRoberto Dutra Torres Junior
Director of Macroeconomic Studies and PoliciesCláudio Hamilton Matos dos Santos
Director of Regional, Urban and EnvironmentalStudies and PoliciesMarco Aurélio Costa
Director of Sectoral Studies and Policies,Innovation, Regulation and InfrastructureFernanda De Negri
Director of Social Studies and PoliciesAndré Bojikian Calixtre
Director of International Studies, Political and Economic RelationsJosé Eduardo Elias Romão
Chief of StaffFabio de Sá e Silva
Chief Press and Communications OfficerPaulo Kliass
URL: http://www.ipea.gov.brOmbudsman: http://www.ipea.gov.br/ouvidoria
DISCUSSION PAPER
A publication to disseminate the findings of research
directly or indirectly conducted by the Institute for
Applied Economic Research (Ipea). Due to their
relevance, they provide information to specialists and
encourage contributions.
© Institute for Applied Economic Research – ipea 2016
Discussion paper / Institute for Applied Economic
Research.- Brasília : Rio de Janeiro : Ipea, 1990-
ISSN 1415-4765
1. Brazil. 2. Economic Aspects. 3. Social Aspects.
I. Institute for Applied Economic Research.
CDD 330.908
The opinions expressed in this publication are of exclusive
responsibility of the authors, not necessarily expressing the
official views of the Institute for Applied Economic Research
and the Ministry of Planning, Budget and Management.
Reproduction of this text and the data contained within
is allowed as long as the source is cited. Reproduction for
commercial purposes is prohibited.
JEL: Q10; N56; O13.
CONTENTS
ABSTRACT
1 INTRODUCTION ....................................................................................................... 7
2 LITERATURE REVIEW ................................................................................................ 8
3 METHODOLOGY .................................................................................................... 13
4 CHALLENGES TO MAXIMIZE PRODUCTIVITY ........................................................... 15
5 EMPIRICAL ANALYSIS ............................................................................................. 18
6 RESULTS ................................................................................................................ 20
7 CONCLUSION ........................................................................................................ 46
REFERENCES ............................................................................................................. 48
APPENDIX A ............................................................................................................. 52


ABSTRACT
The Brazilian agricultural market is a key source of government revenues. Therefore, many studies are being done to assess the sector’s productivity gain over time. However, the regional analysis of agricultural productivity still is not investigated. This work focuses on mapping the gain of agricultural productivity in Brazil in the years 1990-2012 by micro-region. After an overview of the behavior of productivity in the major regions, will be studied the ten major crops relative to the production value. The soybean, sugar cane, corn, coffee, cotton, cassava, rice, orange, bean and tobacco leaf crops accounted, on average between 2010 and 2012, 83.5% of national production. These 23 years will be divided into two periods, justified by the existing economic outlook at the time: from 1990 to 2000 and 2001 to 2012. These two periods are compared in order to analyze the evolution of productivity over the years.
Keywords: agricultural productivity; mapping; agriculture; micro-regions; Brazil.

Discussion Paper
2 0 8
7
Agriculture Productivity Growth In Brazilian Micro-Regions
1 INTRODUCTION
Productivity gains in the domestic agricultural sector have always been the focus of studies, especially in recent decades, as this sector has positive annual growth rates over time. This reason leads several scholars to think about what are the determinants of this sector’s growth.
According to Gasques (2009a), the Brazilian agricultural sector has expanded as a result to an increase in productivity – mainly, due a large production. Their paper shows that, between 1975 and 2005, the agricultural sector grew in the order of 71.7%, while the annual growth in these thirty years was 2.51%.
However, the literature has focused on studies of the productivity gains in certain economic sectors without addressing these gains in regional context. Thus, there are few studies that seek mapping the productivity gains by regions, highlighting the work of Gasques (2009b) and Freitas et al. (2014). The first paper calculates the Total Factor Productivity index (TFP) for the Brazilian Federation Units (FU) based on data from the Agricultural Census. The second outlines a mapping of the production area by Brazilian meso-regions.
This study aims to map the productivity gains of agriculture through a TFP model for Brazilian micro-regions. For this, the used database will be the Municipal Agricultural Production (PAM) between the years 1990 to 2012, released by the Brazilian Institute of Geography and Statistics (IBGE). In addition, productivity gains will also be calculated for large regions (North, South, Southeast, Northeast and Midwest), for the entire national aggregate and for the ten major crops, all of them for the above period.
To calculate productivity, this study will focus on a model of TFP, based on Christensen and Jorgenson (1970). The TFP models seek to determine productivity from a combination of inputs. In addition, the Tornqvist formula will be used, since this structure does not require the inputs to be perfect substitutes in production, and this formula uses both prices referenced to a base period and prices for the period compared (Christensen, 1975).
The time-line of the study covers the period 1990-2012 divided into two major periods: 1990-2000 and 2001-2012. Thereby, productivity is estimated for these three aggregated periods, being presented, for each one, its annual growth rate. This division into periods is partly due to the inflection that occurs in agricultural trade gains in 2000,

8
B r a s í l i a , F e b r u a r y 2 0 1 6
i.e., the upward trend in earnings between 1989 to 1999 with the strongest growth be-tween 2000-2012 (Freitas et al., 2014), and partly due the commercial opening of the Chinese market since 2000, which increased the exports of primary goods in Brazil and the financial crisis in Russia and China in the late nineties (OECD, 2005).
Therefore, the first section is intended to introduce the article. The second section provides a brief history of the national and international scenario of productivity gains in agriculture. Thereafter, the TFP methodology is displayed. The fourth section discusses the database used and the composition of the data for the calculation of TFP. The fifth section shows the results obtained and, finally, the last section presents the conclusions of the article.
2 LITERATURE REVIEW
2.1 International Results
Analyzing the productivity of agriculture in international markets we should refer to the work of the Organization for Economic Cooperation and Development (OECD) which examined the global behavior of TFP in the years 1961 to 2007 (OECD, 2011). According to the study, the rate of TFP growth shows a different behavior among the world, comparing the years 1961 to 2007 with the period 2000 to 2007. In developing countries and transition economies (Central and Eastern Europe), TFP has a growing trend. However, in developed countries this growth rate is decreasing.
Investment in technology and expansion of the area are two examples of how agricultural productivity can increase. However, developed countries already have a high-tech production and a high utilization of usable areas. Developing and transition countries, yet, can still implement more advanced methods in productions, as well as use better the planting area. These are some of the causes of the result mentioned above.
TABLE 1Average annual growth of TFP worldwide, by period (1961-2007)(In %)
Period TFP
1961-1969 0.49
2000-2007 1.34
1961-2007 0.99
Source: Alston et al. (2010).
Discussion Paper
2 0 8
9
Agriculture Productivity Growth In Brazilian Micro-Regions
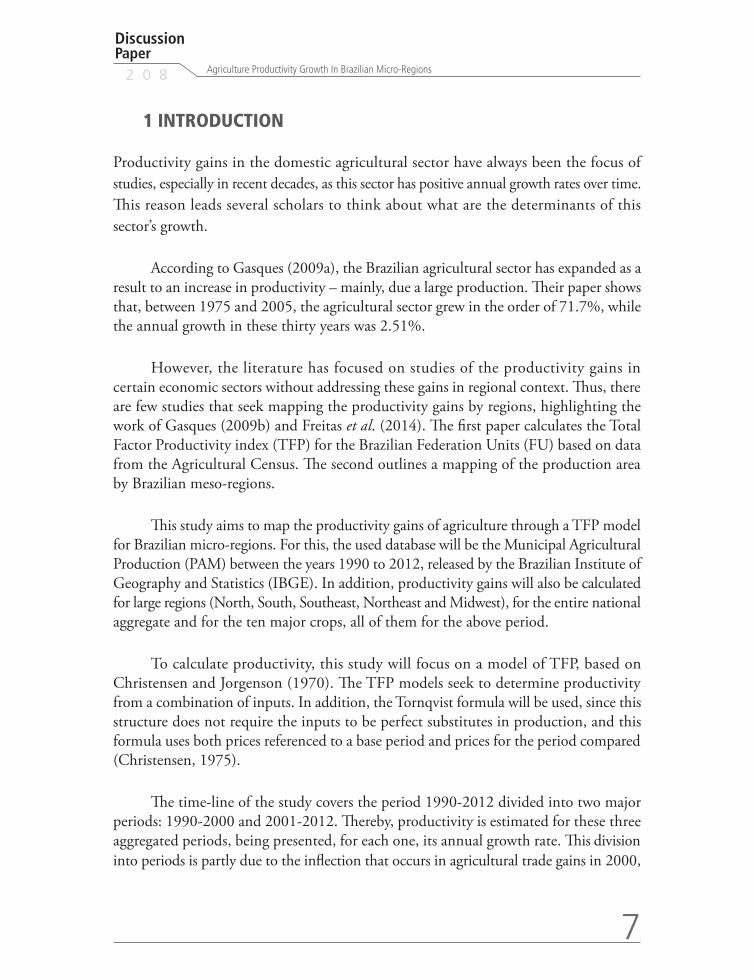
The annual growth rate in the period 1961 to 2007 of China, Brazil and South Africa stood out from the other countries. Table 2 shows that their growth was, respectively, 2.05, 1.97 and 1.88 times greater than the rate worldwide in the same years.
TABLE 2 Average annual growth of TFP, by world regions (1961-2007)(In %)
Region 1961-1969 2000-2007 1961-2007
North East Asia (mainly China) -0.12 2.83 2.03
South Africa 0.50 3.09 1.95
North East Latin America (mainly Brazil) -0.52 3.63 1.87
South East Asia 0.68 2.59 1.66
West Asia 1.06 2.04 1.64
South-East Europe 1.56 0.82 1.59
Andean countries (Latin America) 1.45 1.74 1.49
United States and Canada 0.86 0.33 1.29
Central Asia and Caucasus (Former Soviet Union) -0.56 2.47 1.28
Southern Cone Latin America 0.36 2.03 1.27
South Asia 0.77 1.70 1.23
North-West Europe 1.17 0.59 1.21
Eastern Europe (Former Soviet Union) 1.23 3.82 1.03
North Africa -0.10 0.95 0.89
Australia and New Zealand 0.93 -0.53 0.74
Central and Eastern Europe 0.63 -0.12 0.72
Sub-Saharan Africa 0.36 1.08 0.62
Baltic (Former Soviet Union) 1.96 2.28 0.61
Oceania -0.20 0.43 0.17
Asia (e.g. Japan, Korea) -7.47 1.80 -0.74
Source: Alston et al. (2010).
On the other hand, Japan and Korea stand adversely with a negative growth rate average for the period. This result was driven by a high decrease in agricultural productivity until the beginning of the 80s. Other regions that had lower negative rate in 1961-1969 rebounded in the next years and had positive average in the range of 1961 to 2007. Brazil was one of those cases, coming to have the third highest annual TFP growth average in the aggregate.
Another important study in this area is Barros (1979). The author said that agricultural policy was affected worldwide by the end of 1973. The priorities were changed, causing the replacement of policy inputs by credit and substitution of imports. According to Barros, this change in guidelines generated six consequences among the world: i) absence of long-term investments policy; ii) partial modernization and concentrated

10
B r a s í l i a , F e b r u a r y 2 0 1 6
in a few products and regions; iii) segmentation of the agricultural sector in domestic and exportable; iv) greater openness to the outside; v) pressure on food production; and vi) exhaustion of the credit policy on level of efficiency, equity and currency stability.
For the above reasons, the gains in productivity and development of international agriculture also contributed to boost Brazilian agriculture. So much so that the national agricultural productivity achieved great gains in recent decades due to internal and external factors, the theme of the next topic.
2.2 Brazilian results
Brazil is among the ten countries with the largest Gross Domestic Product (GDP) of the world, which is in part generated by agricultural production. In terms of possible planting areas, Brazil only has fewer areas than China, Australia and the United States. For these reasons, studies on agricultural production are vast in literature, in particular by the author José Garcia Gasques. However, there is a shortage of works that perform this study on a regional basis, mapping the Brazilian agriculture.
Agriculture in Brazil has always been important as a source of GDP share. Since the 40s, policies are geared to stimulate this sector. In the 40’s, was established the first price control in the sector. In the 50’s, the industrial model of import substitution provided in addition to the price control also a command over the supply of goods, a policy which strongly affected the agro food sector. This control continued until the mid-80, when this policy was no longer efficient. Trying to reverse this situation, the government removed the export licenses for primary products in 1987, but the measure did not produce many effects on the real value of exportable goods, which continued to decline. In the 90’s began a process of deregulation and liberalization of the agricultural export market, leading Brazil to the current level of major exporter of these goods.
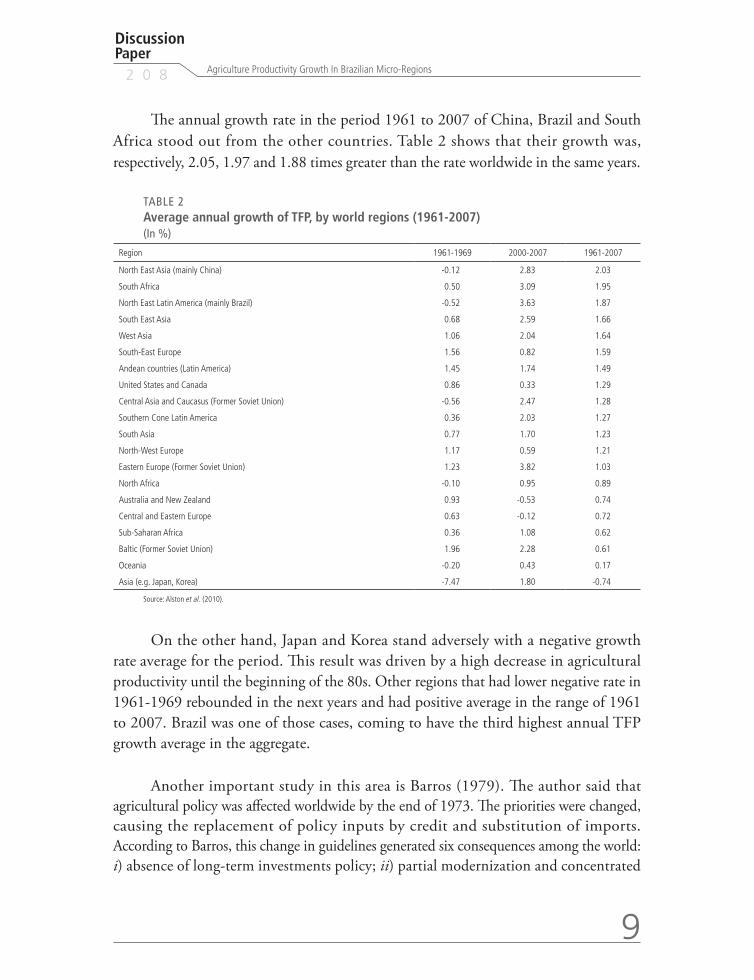
When analyzing the growth of the agricultural sector through the increase of productivity, in the work Gasques et al.(2012) the authorscalculate the TPF using the following combination: agriculture, livestock and rural agribusiness; and factors of production. As shown in Chart 1, the TFP index and the products are increasing over time, and the index of supplies is practically constant. Thereby, they concluded that TFP grows mainly with the introduction of new technologies that increase the productivity of land and not by a greater amount of inputs.
Discussion Paper
2 0 8
11
Agriculture Productivity Growth In Brazilian Micro-Regions
CHART 1 Comparison of TFP, product index and supply index (1975-2011)
450
400
350
300
250
200
150
100
50
0
Índ
ice
Índice
100
395
363
109
1975
1976
1977
1978
1979
1980
1981
1982
1983
1984
1985
1986
1987
1988
1989
1990
1991
1992
1993
1994
1995
1996
1997
1998
1999
2000
2001
2002
2003
2004
2005
2006
2007
2008
2009
2010
2011
Índice de insumo
Índice de produto PTF
Source: Gasques et al. (2012).
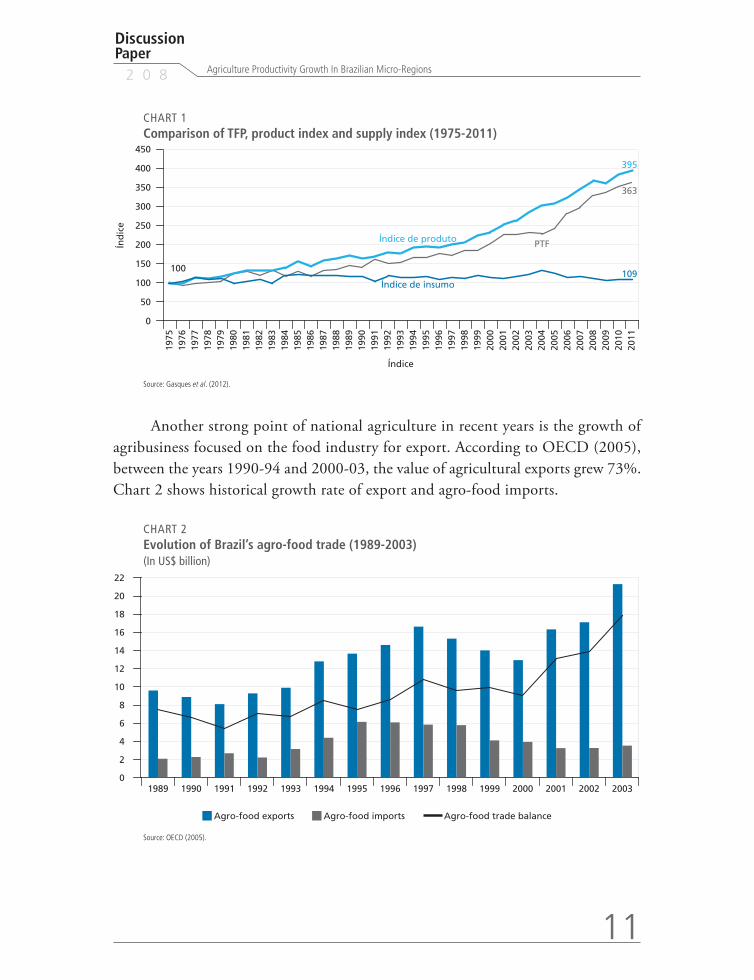
Another strong point of national agriculture in recent years is the growth of agribusiness focused on the food industry for export. According to OECD (2005), between the years 1990-94 and 2000-03, the value of agricultural exports grew 73%. Chart 2 shows historical growth rate of export and agro-food imports.
CHART 2 Evolution of Brazil’s agro-food trade (1989-2003) (In US$ billion)
Agro-food importsAgro-food exports Agro-food trade balance
22
1989 1990 1991 1992 1993 1994 1995 1996 1997 1998 1999 2000 2001 2002 2003
20
18
16
14
12
10
8
6
4
2
0
Source: OECD (2005).
12
B r a s í l i a , F e b r u a r y 2 0 1 6
This study also shows that the main object of export of Brazilian agriculture has been the soybean. In the 1990s, some facts boosted the export of this culture: i) in 1996 there was the withdrawal from tax movement of goods and services (ICMS) on exported primary products, which cheapened the product and encouraged foreign markets; and ii) the opening of the Chinese market for uncrushed beans, which increased the Brazilian soybean exports to the country by 400% between 1996 and 2003.
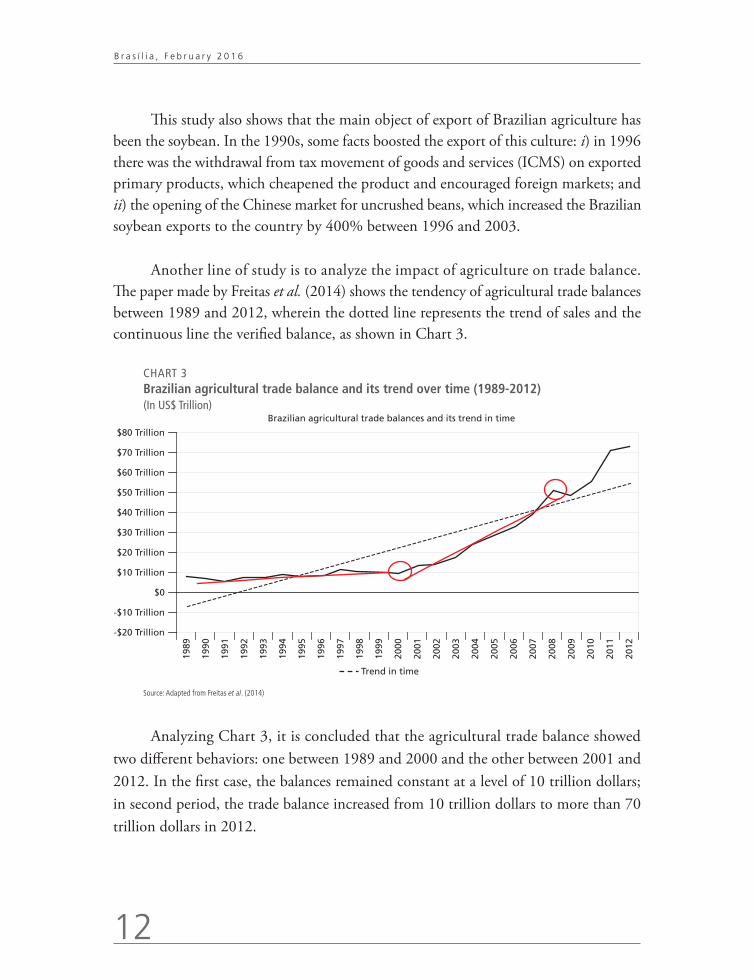
Another line of study is to analyze the impact of agriculture on trade balance. The paper made by Freitas et al. (2014) shows the tendency of agricultural trade balances between 1989 and 2012, wherein the dotted line represents the trend of sales and the continuous line the verified balance, as shown in Chart 3.
CHART 3 Brazilian agricultural trade balance and its trend over time (1989-2012)(In US$ Trillion)
$80 Trillion
$70 Trillion
$60 Trillion
$50 Trillion
$40 Trillion
$30 Trillion
$20 Trillion
$10 Trillion
$0
-$10 Trillion
-$20 Trillion
1989
1990
1991
1992
1993
1994
1995
1996
1997
1998
1999
2000
2001
2002
2003
2004
2005
2006
2007
2008
2009
2010
2012
2011
Brazilian agricultural trade balances and its trend in time
Trend in time
Source: Adapted from Freitas et al. (2014)
Analyzing Chart 3, it is concluded that the agricultural trade balance showed two different behaviors: one between 1989 and 2000 and the other between 2001 and 2012. In the first case, the balances remained constant at a level of 10 trillion dollars; in second period, the trade balance increased from 10 trillion dollars to more than 70 trillion dollars in 2012.
Discussion Paper
2 0 8
13
Agriculture Productivity Growth In Brazilian Micro-Regions
According to study of OECD (2005), external and internal factors contributed to this shift since the year 2000. Among the internal factors there is the change in production structure that now have as main product soybeans, and then the goods of sugar cane, pork, poultry and corn. Thus, the country reduced its dependence on the production of coffee and orange juice, but still focuses its production in a few commodities. The export of soybeans from Brazil to China jumped from 615,000 tons to 6 million tons between 1996 and 2003.
In addition to this, the economic/political stabilization, the liberalization and deregulation for exports, the elimination of taxes and tariffs – for example, the removal of Tax on Goods and Services in 1996 to export primary products – and the increase technology as a result of the national market liberalization – which boosted imports of agricultural machinery – contributed to the agribusiness trade balance present these disparities between the two periods mentioned above.
As for external factors there is the financial crisis in Asia and Russia in the late 90’s, besides the downturn in the agricultural market, also in this period. Nevertheless, the export of agri-food jumped from 9.8 billion dollars per year to 16.9 billion dollars between the periods 1990-1994 and 2000-2003, with strong momentum in 2000-2003.
For these reasons above, this study will mark out the division of the time-line into two separate blocks, one between 1990 and 2000 and the other between 2001 and 2012.
3 METHODOLOGY
In the national and international literature, the most used index for measure productivity growth in agriculture is the Total Factor Productivity (TFP). According to Thirtle and Bottomley (1992), the TFP indexes measure the aggregate output per unit of aggregate input, therefore providing a guide to check the efficiency of agricultural production. In another concept, given by Gasques et al. (2009b), TFP can be interpreted as the increased amount of product that is not explained by the increased quantity of inputs, but the gains in productivity thereof.
There is more than one way to build a TFP index, like Tornqvist index, Translog method and Laspeyres index. The Tornqvist index was chosen because it presents some peculiarities regarding the other methods traditionally used:

14
B r a s í l i a , F e b r u a r y 2 0 1 6
• the Laspeyres index assumes that all inputs are perfect substitutes and Tornqvist doesn’t;
• the Laspeyres index fixes prices compared to the base price, only varying quantities. The Tornqvist index considers prices year to year; and
• the Tornqvist index, according to Diewert (1976), is also better than the translog because the first function defines a more flexible production, i.e., this method makes it possible to approximate the structure of production functions with more arbitrary substitution possibilities.
The Tornqvist index for TFP is defined as follows:
. (1)
Applying the logarithm function, the following result is obtained:
; (2)
where:
• Yi and Xj are the quantities of products and supplies, respectively;
• Si and Ci are, respectively, the holdings of the product i in the total value of production and the holdings of supplies j in total input costs.
When there is only one factor, the TFP can be rewritten as:
. (3)
:
Discussion Paper
2 0 8
15
Agriculture Productivity Growth In Brazilian Micro-Regions
(4)
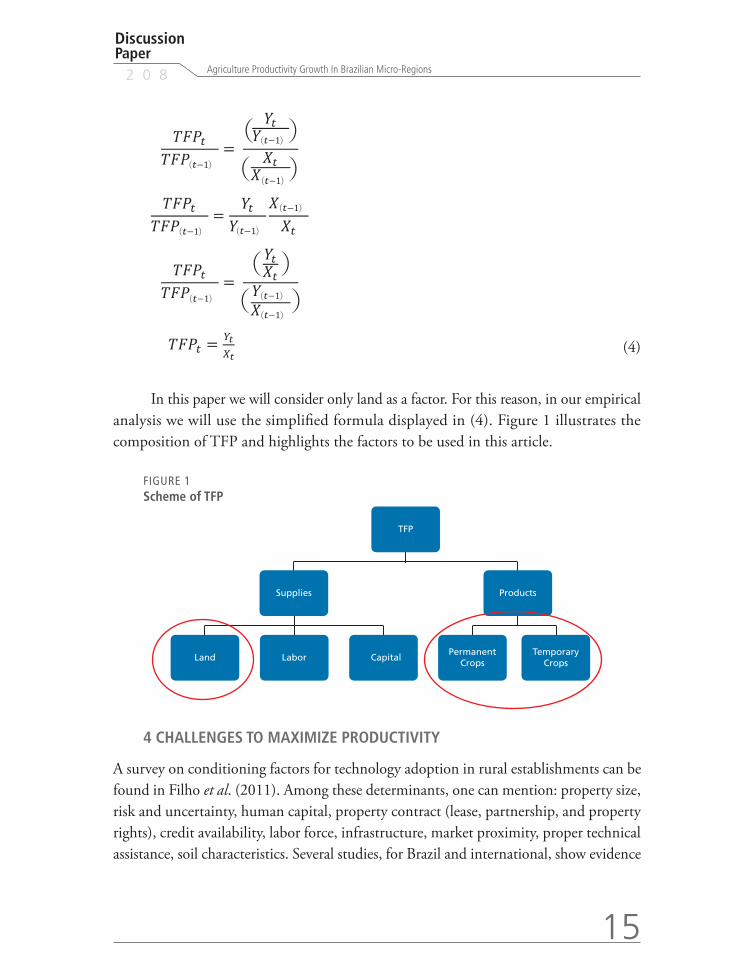
In this paper we will consider only land as a factor. For this reason, in our empirical analysis we will use the simplified formula displayed in (4). Figure 1 illustrates the composition of TFP and highlights the factors to be used in this article.
FIGURE 1Scheme of TFP
TFP
Supplies Products
Land Labor CapitalPermanent
CropsTemporary
Crops
4 CHALLENGES TO MAXIMIZE PRODUCTIVITY
A survey on conditioning factors for technology adoption in rural establishments can be found in Filho et al. (2011). Among these determinants, one can mention: property size, risk and uncertainty, human capital, property contract (lease, partnership, and property rights), credit availability, labor force, infrastructure, market proximity, proper technical assistance, soil characteristics. Several studies, for Brazil and international, show evidence
16
B r a s í l i a , F e b r u a r y 2 0 1 6
that lower schooling and experience may affect negatively technology adoption. It may be one of the important reasons explaining the lower observed innovation adoption in the Northeast region, as compared to the South region. Property size can affect, for example, the adoption of technologies that depend on a minimum scale; in these cases, small producers can alleviate this problem by forming collaborative schemes. Besides, property size is high correlated to other factors, such as credit availability and human capital.
Infrastructure also plays an important role because it will impact the attractiveness of investments for increasing productivity. Establishments better served of roads network connections will more likely have sufficient capital to spend in production improvements. On the other hand, some new techniques require usage of ingredients (for example, chalk for pH correction, among other benefits) demanding more transportation efforts. If the infrastructure available is deficient, the establishment may have difficulty incorporating the new techniques.
The credit lines, such as the ABC program1 (a part of a plan for low carbon agriculture), made available by the Brazilian government to quicken the diffusion of techniques for sustainable agriculture, address one of the many determinants pointed out in the literature. Another important factor, provided in part by the government programs, is technical assistance. Increasing technical assistance coverage may be expensive though, especially for remote areas in the country.
Several challenges have then to be taken into account for the success of the ABC program in Brazil. One can list, for example:
(a) Provision of proper training and technical assistance for the adoption of the new technologies;
(b) Support for research and development to improve the existing techniques;
(c) Provision of proper training for the financial agents and the rural technicians, so they can analyze appropriately the ABC projects to be financed;
(d) Mechanisms for easier credit access, with less bureaucracy and fewer warranty requirements;
(e) Implementation of policies of payment for environmental services generated from the adoption of these new technologies; and
1. ABC – Low-Carbon Agriculture.
Discussion Paper
2 0 8
17
Agriculture Productivity Growth In Brazilian Micro-Regions
(f ) Implementation of tax and fiscal incentives for the produces adopting the new technologies.
Even though the annual interest rate of 5.5% may sound attractive (for Brazilian standards), we have to keep in mind that the overall program incentives may not be enough; there are other incentive programs for rural producers, also with low interest rates and good credit conditions. One example is the Pronaf10 (National Program for Family Agriculture), available for small rural establishments. The Pronaf offers lower interest rates than the ABC Program.
Another issue that has to be considered is property rights for the rural establishments. As found in Börner et al. (2010), around 67% of endangered forest areas in Brazilian Amazon contain rural establishments with ill-defined or non-clarified tenure. Tenure problems may affect negatively ABC program penetration, because normally the rural property is used as collateral in the credit contracts. Therefore, rural producers without proper land ownership may not fulfill the proper requirements for ABC credit.
According to data from Banco do Brasil (see Sambuishi, 2012), from June 2011 to July 2012, there were 3,552 contracts in the ABC Program credit line, totalizing R$ 1.2 billion. Most of the contracts were directed to rural establishments in the South and the Southeast regions (66% of all contracts). Therefore, we observe that less than half of the total available amount in the program was actually taken as loans. Besides, a regional heterogeneity was observed.
These figures on the ABC Program dissemination may be explained by the lack of enough technical assistance to the potentially interested producers. Besides, more advertising seems to be needed. Nonetheless, a more thorough evaluation of the program is necessary so as to better pin point the main weaknesses, allowing future improvements. As discussed above, land tenure and other issues influencing technology adoption may also be investigated, so as to speed the diffusion of ABC techniques among producers in all Brazilian regions. We believe that for the program to be successful, more instruments have to be used, along with the special credit line. One way to proceed is to provide tax incentives.
18
B r a s í l i a , F e b r u a r y 2 0 1 6
5 EMPIRICAL ANALYSIS
The purpose of this work is to map the Brazilian agricultural productivity in a period of 23 years of production, as explained in the introduction. For this, we used the data released by IBGE from Municipal Agriculture Production (PAM). The research involves the collection of 64 tillage crops data – 31 temporary and 33 permanent – on an annual basis.2
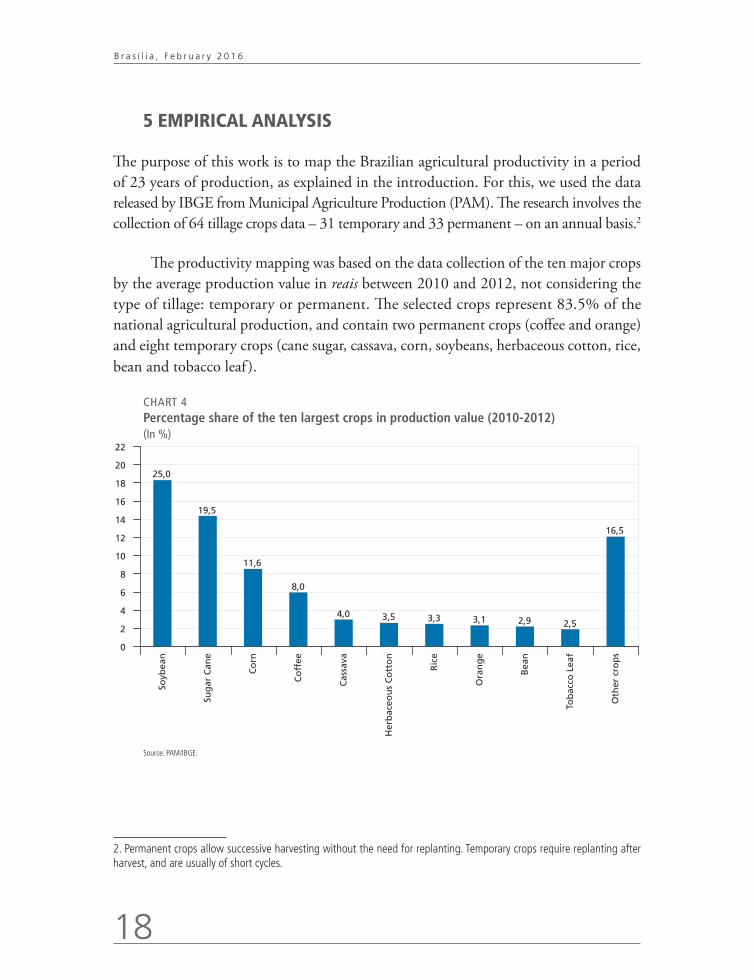
The productivity mapping was based on the data collection of the ten major crops by the average production value in reais between 2010 and 2012, not considering the type of tillage: temporary or permanent. The selected crops represent 83.5% of the national agricultural production, and contain two permanent crops (coffee and orange) and eight temporary crops (cane sugar, cassava, corn, soybeans, herbaceous cotton, rice, bean and tobacco leaf ).
CHART 4Percentage share of the ten largest crops in production value (2010-2012)(In %)
22
20
18
16
14
12
10
8
6
4
2
0
25,0
Soyb
ean
Sug
ar C
ane
Co
rn
Co
ffee
Cas
sava
Her
bac
eou
s C
ott
on
Ric
e
Ora
ng
e
Bea
n
Tob
acco
Lea
f
Oth
er c
rop
s
19,5
11,6
8,0
4,0 3,5 3,3 3,1 2,9 2,5
16,5
Source: PAM/IBGE.
2. Permanent crops allow successive harvesting without the need for replanting. Temporary crops require replanting after harvest, and are usually of short cycles.
Discussion Paper
2 0 8
19
Agriculture Productivity Growth In Brazilian Micro-Regions
The study time-line covers the years 1990 to 2012, grouped in blocks of three years. The reason for this aggregation is to reduce the variability of the produced quantities in the event of an annual comparison. From these grouping periods, it was extracted the following periods for analysis: 1990-1992; 1998-2000; 2001-2003; and 2010-2012. The purpose of this segregation is to divide the data between two groups for comparison between them and subsequently the analysis of the entire period.
Thus first it will be calculated TFP index for these four intervals; then it will be stipulated annual productivity growth, making use of the following scheme.
.
(5)
. (6)
This separation into two periods of analysis is justified by the inflection occurring in the agricultural market between 2000 and 2001, more especially for foreign policy adopted by China and Russian and the international crises at the external agricultural market, as explained in the topic 2.2. Thus, it is possible to study the different growth rates between the two periods.
Productivity, according to the TFP model, is calculated using variables classified as inputs and variables classified as products. In this study will be used the simplest form of TFP model, which takes into account only one input (harvested area in hectares), and a product (quantity produced in tons). Using this simplified model TFP corroborates the fact that the scope of this work is to map agricultural productivity, and not set the best inputs that determine the productivity of a sector. Thus, to avoid losing the focus of the study, we chose to use only an input and a product.
In conclusion, to map the productivity of the agricultural sector in the country, the area was divided into Brazilian micro-regions, geographical division established by the IBGE.3 Currently, the country is divided into 558 micro-regions distributed in 26 Brazilian states and the Federal District. To ease the mapping, micro-regions with
3. The term meso-region, an individual area in a unit of the Federation, which presents ways of organizing geographic space defined by the following dimensions: the social process, as a key; the natural framework, as a condition; and the communication network and places, as the hinge element. The micro-regions were defined as part of the meso-regions that have specific about the space organization. These features relate to the production structure: the farming, industrial, mineral extraction or fishing. The differentiated production structures may result from the presence of elements of the natural framework or social and private economic relations. (Source: IBGE).
20
B r a s í l i a , F e b r u a r y 2 0 1 6
production value less than 5% of the total value of output of national agriculture (5% percentile) were excluded from the maps.
6 RESULTS
This study seeks to map the productivity gains of agriculture through a TFP model for Brazilian micro-regions. For this, a mapping of the annual productivity growth of the domestic agricultural sector will be done. Recalling that the mapping of micro-regions shall be drawn for the ten crops that stood out in production value between 2010 and 2012.
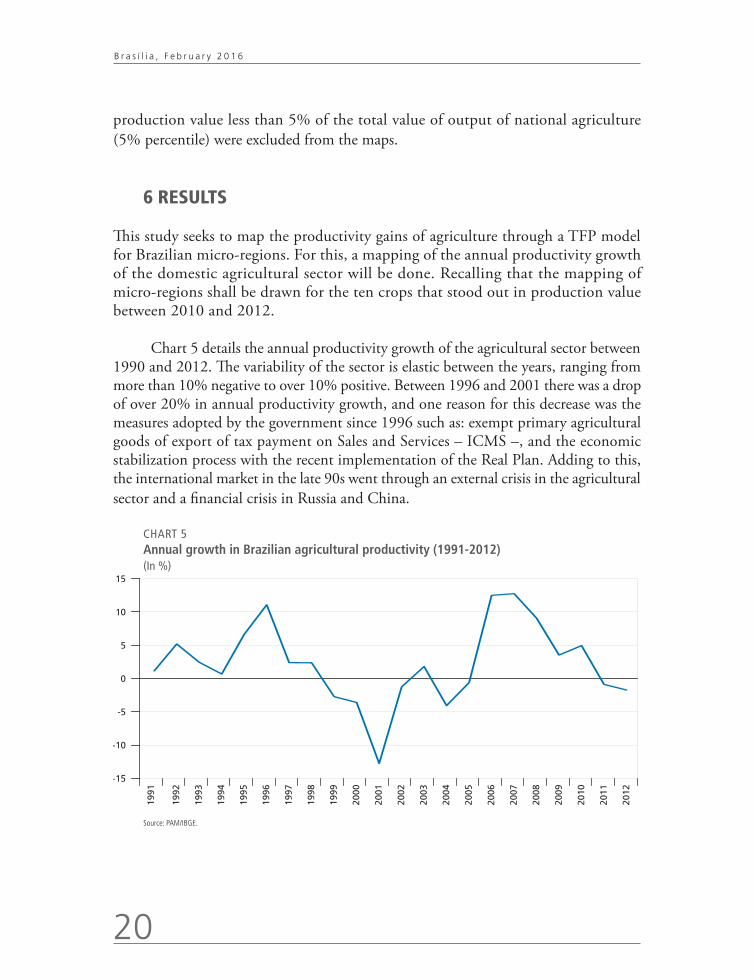
Chart 5 details the annual productivity growth of the agricultural sector between 1990 and 2012. The variability of the sector is elastic between the years, ranging from more than 10% negative to over 10% positive. Between 1996 and 2001 there was a drop of over 20% in annual productivity growth, and one reason for this decrease was the measures adopted by the government since 1996 such as: exempt primary agricultural goods of export of tax payment on Sales and Services – ICMS –, and the economic stabilization process with the recent implementation of the Real Plan. Adding to this, the international market in the late 90s went through an external crisis in the agricultural sector and a financial crisis in Russia and China.
CHART 5Annual growth in Brazilian agricultural productivity (1991-2012)(In %)
15
10
5
0
-5
-15
-10
1991
1992
1993
1994
1995
1996
1997
1998
1999
2000
2001
2002
2003
2004
2005
2006
2007
2008
2009
2010
2011
2012
Source: PAM/IBGE.

Discussion Paper
2 0 8
21
Agriculture Productivity Growth In Brazilian Micro-Regions
Nevertheless, since 2001, the trend of annual growth is reversed and it reaches, in 2008, annual percentage above 10% positive. Recalling that, since 2001 Brazil has a more stable and growing economy – due, among other measures, to more balanced exchange rate system, more controlled public accounts, low and stable inflation. The international market also recovered from the 2000s, driven by the expansion of the Chinese market.
As shown in Table 3, it is observed that the highest growth rates of productivity occurred from 2008 onwards, all above 13.56. The worst rates were observed between 1990 and 1992 and between 2004 and 2005, periods in which the yield was lower than 10. The quantity produced, on the other hand, always had positive annual growth, and between 1990 and 2012 the increase was over 100% while the area harvested increased during this period rose above 30%.
TABLE 3 Quantity produced, harvested area and yield in agriculture per year (1990-2012)
Year Quantity (ton) Harvested Area (ha) Productivity (ton/ha)
1990 467,389,637 50,514,696 9.25
1991 473,740,169 50,643,873 9.35
1992 498,814,490 50,714,599 9.83
1993 469,630,971 46,629,302 10.07
1994 520,514,224 51,354,033 10.13
1995 548,608,549 50,776,717 10.80
1996 548,625,801 45,733,907 11.99
1997 584,446,186 47,606,171 12.27
1998 587,795,254 46,795,724 12.56
1999 598,467,759 49,001,225 12.21
2000 590,724,953 50,197,382 11.76
2001 516,431,043 50,326,021 10.26
2002 538,452,298 53,158,726 10.12
2003 594,309,907 57,659,849 10.30
2004 612,727,494 61,998,723 9.88
2005 615,031,011 62,646,336 9.81
2006 677,297,005 61,349,475 11.04
2007 767,240,496 61,666,453 12.44
2008 876,384,279 64,616,551 13.56
2009 906,373,810 64,577,283 14.03
2010 950,374,088 64,550,603 14.72
2011 981,229,182 67,272,096 14.58
2012 965,052,222 67,351,812 14.32
Source: PAM/IBGE.
22
B r a s í l i a , F e b r u a r y 2 0 1 6
This boost in production can be explained in part by changes in the production structure. In 1990, the ten main agricultural products according to production value were in that order of magnitude: sugar cane, soy, corn, cassava, coffee, rice, orange, bean, potato and banana. In 2012, this structure has changed to: soy, sugar cane, corn, coffee, herbaceous cotton, cassava, rice, bean, tobacco leaf and orange. It may be noted that by comparing the two lists, 8 cultures appear among the 10 most important crops in both. This shows that these cultures have a historical importance in the country’s agriculture.
Another factor driving these productivity gains in the agricultural sector were the technological gains, as discussed in Gasques et al. (2009b). In this study, results show that the incorporation of technologies such as improved machinery and research development, especially by Embrapa, boosted agricultural productivity.
As noted above, the growth of national productivity was due to several structural changes in production over time, and these changes of planted crops necessarily led to exploration of new areas of cultivation. From above, as this study aims to map the agricultural productivity between 1990 and 2012 by micro-region, will not be exploited productive earnings related to technological innovations.
Map 1 shows an overview of how the productivity of permanent and temporary crops is distributed between this territorial division between the years 1990 and 2012.
Discussion Paper
2 0 8
23
Agriculture Productivity Growth In Brazilian Micro-Regions
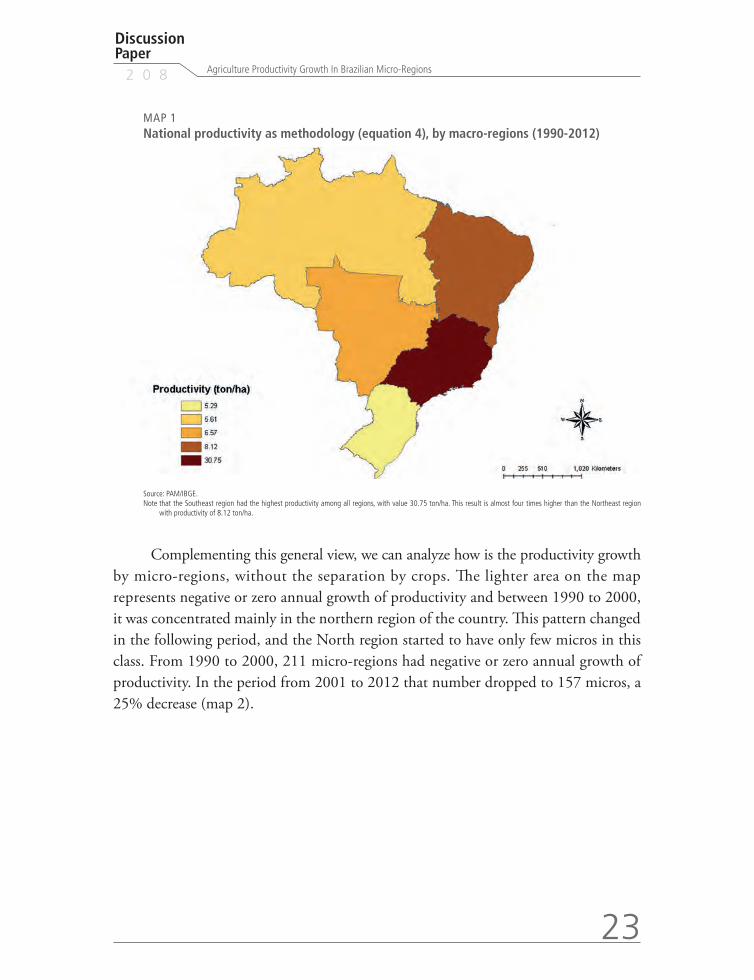
MAP 1National productivity as methodology (equation 4), by macro-regions (1990-2012)
Source: PAM/IBGE.Note that the Southeast region had the highest productivity among all regions, with value 30.75 ton/ha. This result is almost four times higher than the Northeast region
with productivity of 8.12 ton/ha.
Complementing this general view, we can analyze how is the productivity growth by micro-regions, without the separation by crops. The lighter area on the map represents negative or zero annual growth of productivity and between 1990 to 2000, it was concentrated mainly in the northern region of the country. This pattern changed in the following period, and the North region started to have only few micros in this class. From 1990 to 2000, 211 micro-regions had negative or zero annual growth of productivity. In the period from 2001 to 2012 that number dropped to 157 micros, a 25% decrease (map 2).

24
B r a s í l i a , F e b r u a r y 2 0 1 6
MAP 2Annual growth of Brazilian agricultural productivity, by micro-region
2A – 1990-2000 2B – 2001-2012
Fonte: PAM/IBGE.
Between 2001 and 2012, the region with the highest growth rate – Alto do Capibaribe – obtained a rate of 40% per year (p.e.). Between 1990 and 2000, the maximum rate was lower, only of 23% p.e., in the micro region of Franca. With this result, it is possible to compare and further analyze each culture by region.
After examination of the national productivity of the agricultural sector, in the following sections productivity will be reviewed by micro-region and by soybean, sugar cane, corn, coffee, herbaceous cotton, cassava, rice, orange, bean and tobacco crops.
6.1 Soybean crop
The first studied culture is the production of soy, since this culture is responsible for approximately 25% of the average production values in agriculture between 2010 and 2012. From map 3, we conclude that the production is concentrated in the Midwest and South regions.

Discussion Paper
2 0 8
25
Agriculture Productivity Growth In Brazilian Micro-Regions
MAP 3Annual growth of soy productivity, by micro-region
3A – 1990-2000 3B – 2001-2012
Source: PAM/IBGE.
It can be seen that the annual productivity between 1990-2000 was even more concentrated in the Midwest and South regions than the annual productivity between 2001-2012. In the first period, most of micro-regions of these areas had annual yield growth above 8%, while in the second period, most of these micro stood in the range with productivity growth between 5% and 7% p.y.
Another point to be noted is the amount of micro-regions allocated in the first interval of 1990-2000 annual productivity growth map compared to the period 2001-2012. According to the maps, in the first period, there were 38 micro-regions in the interval of annual productivity growth up to 1%. In the second period that number increased to 136 micro-regions, an increase above 250%. Most of these micro-regions left the growth level between 2% and 7% to join in the range of up to 1% of annual productivity growth.
It can be concluded that the number of micro-regions with soy production expanded between the two periods. At first, 211 micro-regions had soy production, rising to 236 micros on the second time. This trend can be explained in part by the expansion of the agricultural frontier and also by the increased of planted areas as a result of deforestation in the Amazon.
This expansion of the agricultural frontier observed between 2001-2012 confirms the work of Bragagnolo (2012), which studied the TFP of Brazilian Federative Units.
26
B r a s í l i a , F e b r u a r y 2 0 1 6
According to his work, there is an agricultural frontier in Brazil, i.e., places where native vegetation creates a barrier for agriculture. Thus, planting is possible only through deforestation, which prevents the expansion of planted area and makes agriculture present in such regions essentially subsistence. Basically, this boundary is restricted to the states of North and Midwest. The results of this study show that the states of the North region presented the highest growth rate of TFP in the period (value), which suggests an expansion of the agricultural frontier (see full table in the appendix).
Finally, according to the maps, it can be concluded that between 1990-2000, the annual productivity was more concentrated in the micro-regions of the Midwest and South regions. Among the periods of 2001-2012, the expansion of the agricultural frontier has led to soybean production also in the North, decreasing the intensity of production in the Midwest and South. Analyzing the two periods, it is concluded that the annual productivity growth during 1990-2000 was greater than in the period 2001-2012. In the first period 173 micro-regions showed yield growth above 2% per year and in the second period were 100 micro-regions with this productivity growth. Nevertheless, in both periods, most micro-regions had positive result in annual yield growth, since between 1990-2000 only 19 micro-regions showed decreased productivity growth and between 2001 to 2012 43 micro-regions had the same result.
6.2 Sugar cane crop
The second most representative crop in agricultural production is currently sugarcane. Its production, historically, is encouraged by the State through subsidies, government programs and facilitated credits, which led Brazil to be one of the largest exporters and sugar producers. Nevertheless, it should be noted that since 1999 the State has been liberalizing the market. According Moraes (2007), this liberalization led producers to invest more in production technology, diversification of sugar cane varieties, use of by--products, cost control and even changes in market structure to the process of mergers.
On average between 2010 and 2012, the production of sugar cane represented 19.8% of all agricultural production, and it is intended for the production of sugar, ethanol and some products such as sugar cane bagasse – used as fuel generating units steam power. According to Kohlhepp (2010), Brazil is the largest producer and exporter of sugar cane in the world, wherein from 1993 to 2001, its production was tripled. Also according to the author, in 2010, 55% of the sugar cane harvest was for ethanol production – the country is the second largest producer and consumer of this good.

Discussion Paper
2 0 8
27
Agriculture Productivity Growth In Brazilian Micro-Regions
Looking at the annual productivity growth of this good it is verified on the maps that in the period between 2001-2012 the annual productivity growth has increased considerably in the Midwest and in the North regions. According Kohlhepp (2010), the Inter-American Development Bank, Petrobras, Mitsui and Toyota are investing heavily in the central region of the country for export production of ethanol, so much so that distilleries are being built in the states of Mato Grosso, Mato Grosso do Sul and southern Goiás.
MAP 4Annual growth of sugar cane productivity, by micro-region
4A – 1990-2000 4B – 2001-2002
Source: PAM/IBGE.
Nevertheless, the sugar cane is produced in almost all the regions of the country, with production in 482 micro-regions in 2012 and only 76 micros without production of that good. However, this does not mean that sugar cane production is decentralized, since data from the 2008/2009 harvest show that the production of sugar cane in the states of São Paulo, Paraná and Minas Gerais represent respectively 60.9%, 7.9% and 7.5% of national production.
Analyzing the dispersion of productivity between the periods of 1990-2000 and 2001-2012, the number of micro-regions that did not have any annual productivity fell by 12%, going from 91 micro-regions to 80. However, the micro-regions which exceeded the level of annual productivity greater than 1.03 jumped from 42 to 64 in this period – an increase of 52%. Analyzing Table 4 it can be seen that the number of micro-regions in the two shorter intervals decreased whereas the three biggest increased. So it can be concluded that the productivity of this sector increased between these two periods.
28
B r a s í l i a , F e b r u a r y 2 0 1 6
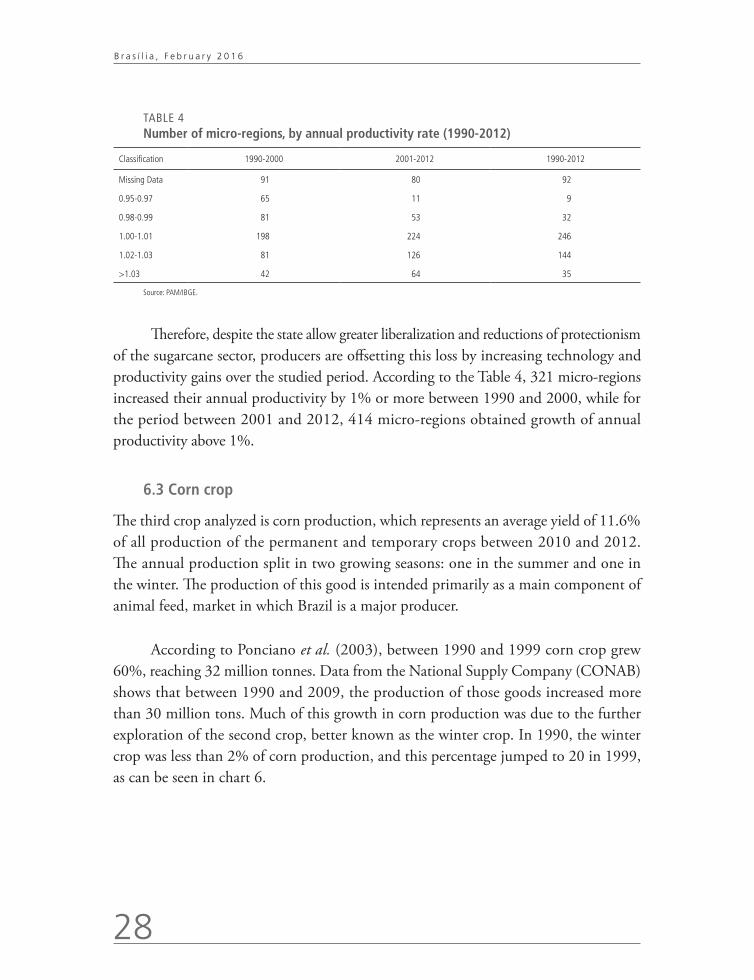
TABLE 4 Number of micro-regions, by annual productivity rate (1990-2012)
Classification 1990-2000 2001-2012 1990-2012
Missing Data 91 80 92
0.95-0.97 65 11 9
0.98-0.99 81 53 32
1.00-1.01 198 224 246
1.02-1.03 81 126 144
>1.03 42 64 35
Source: PAM/IBGE.
Therefore, despite the state allow greater liberalization and reductions of protectionism of the sugarcane sector, producers are offsetting this loss by increasing technology and productivity gains over the studied period. According to the Table 4, 321 micro-regions increased their annual productivity by 1% or more between 1990 and 2000, while for the period between 2001 and 2012, 414 micro-regions obtained growth of annual productivity above 1%.
6.3 Corn crop
The third crop analyzed is corn production, which represents an average yield of 11.6% of all production of the permanent and temporary crops between 2010 and 2012. The annual production split in two growing seasons: one in the summer and one in the winter. The production of this good is intended primarily as a main component of animal feed, market in which Brazil is a major producer.
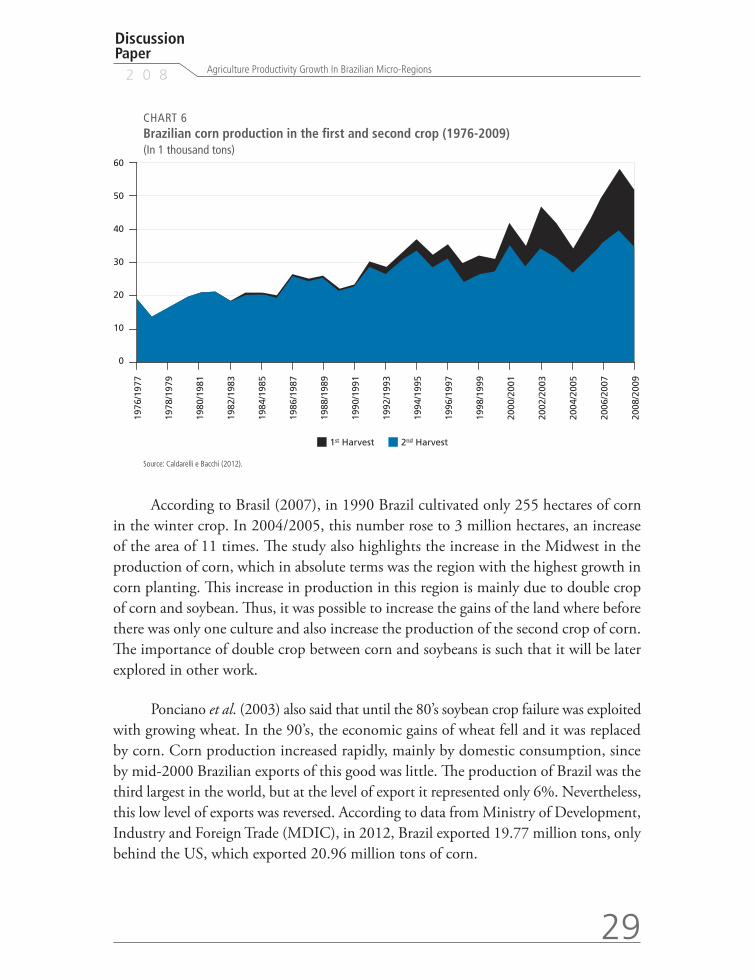
According to Ponciano et al. (2003), between 1990 and 1999 corn crop grew 60%, reaching 32 million tonnes. Data from the National Supply Company (CONAB) shows that between 1990 and 2009, the production of those goods increased more than 30 million tons. Much of this growth in corn production was due to the further exploration of the second crop, better known as the winter crop. In 1990, the winter crop was less than 2% of corn production, and this percentage jumped to 20 in 1999, as can be seen in chart 6.
Discussion Paper
2 0 8
29
Agriculture Productivity Growth In Brazilian Micro-Regions
CHART 6Brazilian corn production in the first and second crop (1976-2009)(In 1 thousand tons)
60
50
40
30
20
0
10
1976
/197
7
1978
/197
9
1980
/198
1
1982
/198
3
1984
/198
5
1986
/198
7
1988
/198
9
1990
/199
1
1992
/199
3
1994
/199
5
1996
/199
7
1998
/199
9
2000
/200
1
2002
/200
3
2004
/200
5
2006
/200
7
2008
/200
9
1st Harvest 2nd Harvest
Source: Caldarelli e Bacchi (2012).
According to Brasil (2007), in 1990 Brazil cultivated only 255 hectares of corn in the winter crop. In 2004/2005, this number rose to 3 million hectares, an increase of the area of 11 times. The study also highlights the increase in the Midwest in the production of corn, which in absolute terms was the region with the highest growth in corn planting. This increase in production in this region is mainly due to double crop of corn and soybean. Thus, it was possible to increase the gains of the land where before there was only one culture and also increase the production of the second crop of corn. The importance of double crop between corn and soybeans is such that it will be later explored in other work.
Ponciano et al. (2003) also said that until the 80’s soybean crop failure was exploited with growing wheat. In the 90’s, the economic gains of wheat fell and it was replaced by corn. Corn production increased rapidly, mainly by domestic consumption, since by mid-2000 Brazilian exports of this good was little. The production of Brazil was the third largest in the world, but at the level of export it represented only 6%. Nevertheless, this low level of exports was reversed. According to data from Ministry of Development, Industry and Foreign Trade (MDIC), in 2012, Brazil exported 19.77 million tons, only behind the US, which exported 20.96 million tons of corn.

30
B r a s í l i a , F e b r u a r y 2 0 1 6
Data from the 2007/2008 harvest showed that corn production is concentrated in the South, Midwest and Southeast regions of the country. The states of Paraná, Mato Grosso, Minas Gerais and Rio Grande do Sul represented, in the period, 51.04% of production of this good.
MAP 5Annual growth of corn productivity, by micro-region
5A – 1990-2000 5B – 2001-2012
Source: PAM/IBGE.
According to the maps, the major focus of annual productivity growth between 1990 and 2000 was concentrated, primarily, in the Midwest, South, Southeast and Northeast. This trend was softened when we observe the annual productivity growth in the period 2001-2012, although the Midwest, Southeast and Northeast continue having the highest annual rates. The darker area of the maps shows that these regions have increased annually over 9% in the periods (1990-2000, 2012-2001).
Of the five map intervals, the number of regions in the two intervals with lo-wer annual productivity growth grew over 17% comparing the maps of 1990-2000 and 2001-2012. However, the three major intervals decreased over 23% in number of regions in this period. In the first period, 17 micro-regions had growth of annual productivity above 9%, but this amount decreased to 13 micro-regions in the second period studied. In the annual productivity increase between 7% and 9% in the second great period analyzed, there was a decrease of 66% of the number of micros that no longer belongs to this range.
Discussion Paper
2 0 8
31
Agriculture Productivity Growth In Brazilian Micro-Regions
Despite the decrease in annual productivity growth of this crop, Brazil is still one of the largest producers and the second largest exporter of this product. The decrease in productivity growth occurred between the periods, but it can be concluded that of the five intervals of productivity maps, only in one productivity decreased. In other intervals, annual growth ranged from 1% to more than 9%. Thereby, it is concluded that the annual productivity is growing at a more slowed pace.
6.4 Coffee crop
On average between 2010 and 2012, its production accounted 8% of all national agricultural production. The cultivation of coffee began in the eighteenth century, in the Amazon region and especially in the state of Rio de Janeiro. According to Winkler and Souza (2012), Brazil is the largest producer and exporter in the world of commodity coffee, representing 48.9% of the world market, according to data of 2009.
In the 90’s, the coffee sector suffered great turbulence by deregulation imposed in this market, especially for the end of the International Coffee Agreements and extinction of the Brazilian Coffee Institute. These international agreements imposed strict price and exports quota controls and control the size of the coffee plantations made by producers. This deregulation imposed on producers to produce higher quality coffee to meet the new demands required by consumers, since, before this process, the producers were concerned only in keep prices high and produce a homogeneous product.
Anceles (2013) said that with the deregulation of the sector, in the early 1990s, world prices of sacks of coffee fell by oversupply and the Brazilian revenue from this good has dropped considerably. Leme (2007) showed that the coffee sector reached the highest recesses of history, since the system prioritized the sector’s productivity at the expense of the good quality offered.
Study of Ribeiro (2002) shows that with the liberalization of the market, the coffee sector can, for the first time, define their market strategies. This led to higher investment in the sector with a view to improve the quality, dissemination, etc. So much so that in 2004 was released the seal of Coffee Quality Program, which orders the qualities of coffee offered in the market.
32
B r a s í l i a , F e b r u a r y 2 0 1 6
According Oliveira et al. (2008), with the increase in international coffee standards, a restructuring of the domestic market was necessary to compete with foreign market. Brazil had to stand out in the mechanization of farming and diversification of products.
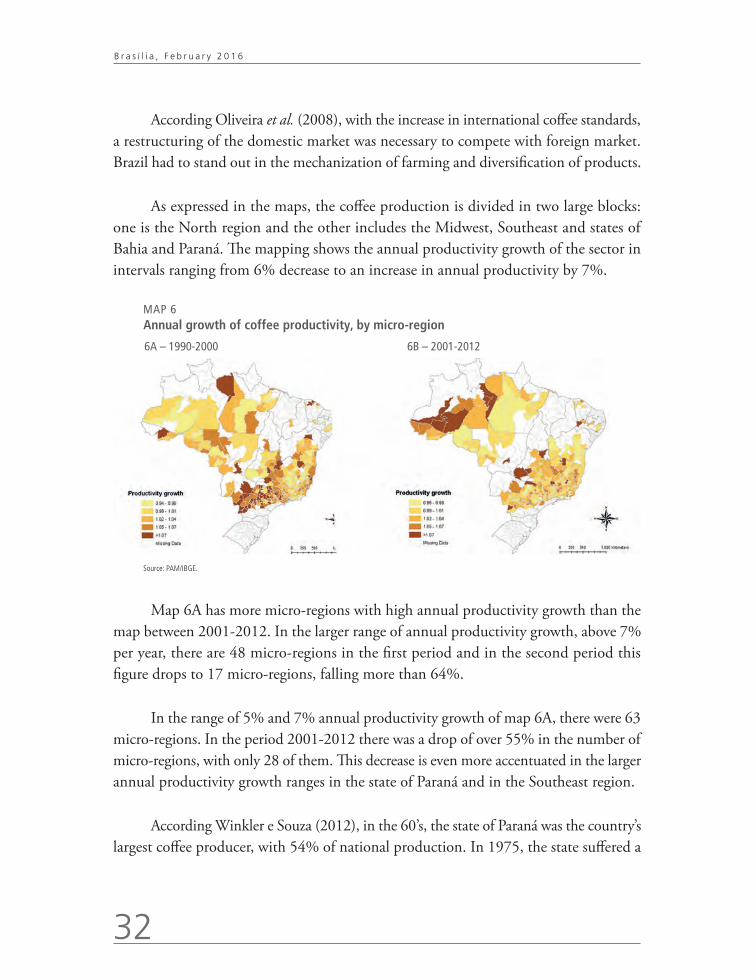
As expressed in the maps, the coffee production is divided in two large blocks: one is the North region and the other includes the Midwest, Southeast and states of Bahia and Paraná. The mapping shows the annual productivity growth of the sector in intervals ranging from 6% decrease to an increase in annual productivity by 7%.
MAP 6Annual growth of coffee productivity, by micro-region
6A – 1990-2000 6B – 2001-2012
Source: PAM/IBGE.
Map 6A has more micro-regions with high annual productivity growth than the map between 2001-2012. In the larger range of annual productivity growth, above 7% per year, there are 48 micro-regions in the first period and in the second period this figure drops to 17 micro-regions, falling more than 64%.
In the range of 5% and 7% annual productivity growth of map 6A, there were 63 micro-regions. In the period 2001-2012 there was a drop of over 55% in the number of micro-regions, with only 28 of them. This decrease is even more accentuated in the larger annual productivity growth ranges in the state of Paraná and in the Southeast region.
According Winkler e Souza (2012), in the 60’s, the state of Paraná was the country’s largest coffee producer, with 54% of national production. In 1975, the state suffered a
Discussion Paper
2 0 8
33
Agriculture Productivity Growth In Brazilian Micro-Regions
severe frost which damaged the crop and plantations. After that, Paraná never regained space in the producing market, mostly because the cultivated area decreased. In 2012, its production represented only 3.36%.
Studies of Pereira (2014) show that Minas Gerais is the main producer of Arabic coffee in the country and has more than half of the establishments of production of this crop. Given the appointed facts, this decrease in annual productivity in the state of Minas Gerais and throughout the Southeast is because of deregulation have led farmers to produce better quality coffee (due to higher consumer demand) in detriment of productivity gains. Diversification and focus on quality began to fight for space with productivity gains.
6.5 Cassava crop
The fifth analyzed culture is the production of cassava, which represents 4% of all national agricultural production in the average of 2010 and 2012. The main uses of cassava are the raw material of compound animal feed, human consumption in the form of cassava flour and starch extraction.
According Valle e Lorenzi (2014), cassava is the seventh most produced crop in the world, with 257 million tons produced in 2012, a volume that surpassed soybeans. Alves (2012) showed that Brazil was the world’s largest producer of this good in the 60s, with production of 22.2 million tons in 1964. This production level lasted until 1971, when production reached 31 million tons. From 1972 to 1996 domestic production decreased up to 24 million tons.
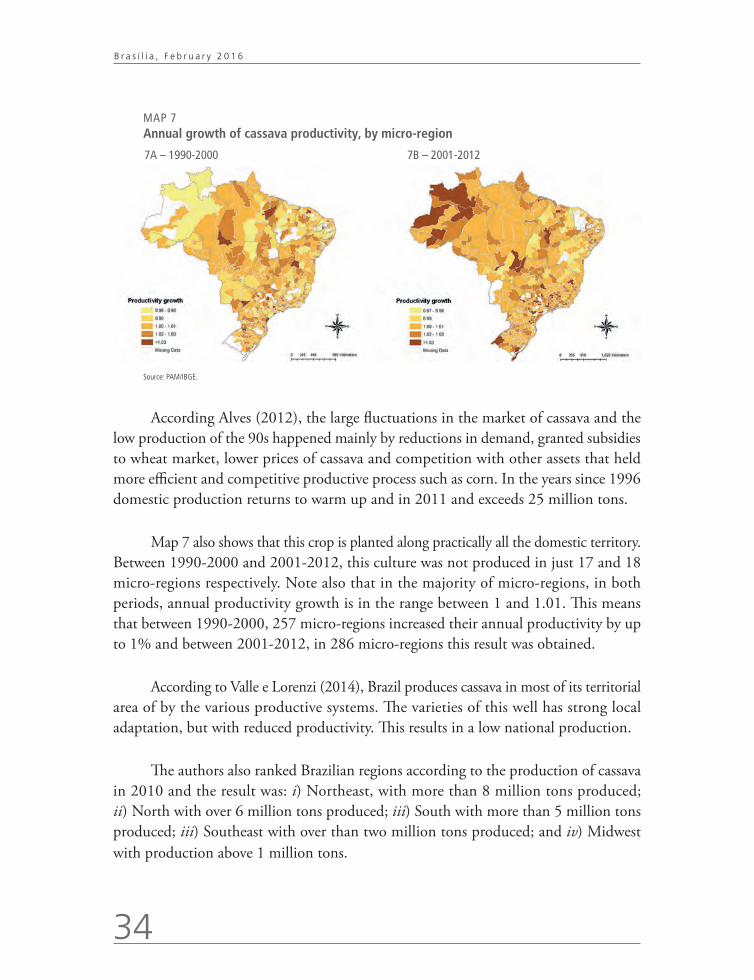
By mapping the productivity of cassava per micro-region, as shown in the maps below, we can see a further evolution of the northern region in the production of those goods comparing the period 2001-2012 with 1990-2000. The darker area on the maps shows that the annual productivity grew at a rate above 3% per year, i.e., in the 2000s, the North stood out compared to the rates of the last 1900s (when these rates were lower).
34
B r a s í l i a , F e b r u a r y 2 0 1 6
MAP 7Annual growth of cassava productivity, by micro-region
7A – 1990-2000 7B – 2001-2012
Source: PAM/IBGE.
According Alves (2012), the large fluctuations in the market of cassava and the low production of the 90s happened mainly by reductions in demand, granted subsidies to wheat market, lower prices of cassava and competition with other assets that held more efficient and competitive productive process such as corn. In the years since 1996 domestic production returns to warm up and in 2011 and exceeds 25 million tons.
Map 7 also shows that this crop is planted along practically all the domestic territory. Between 1990-2000 and 2001-2012, this culture was not produced in just 17 and 18 micro-regions respectively. Note also that in the majority of micro-regions, in both periods, annual productivity growth is in the range between 1 and 1.01. This means that between 1990-2000, 257 micro-regions increased their annual productivity by up to 1% and between 2001-2012, in 286 micro-regions this result was obtained.
According to Valle e Lorenzi (2014), Brazil produces cassava in most of its territorial area of by the various productive systems. The varieties of this well has strong local adaptation, but with reduced productivity. This results in a low national production.
The authors also ranked Brazilian regions according to the production of cassava in 2010 and the result was: i) Northeast, with more than 8 million tons produced; ii) North with over 6 million tons produced; iii) South with more than 5 million tons produced; iii) Southeast with over than two million tons produced; and iv) Midwest with production above 1 million tons.

Discussion Paper
2 0 8
35
Agriculture Productivity Growth In Brazilian Micro-Regions
Although the Northeast region has presented the highest production in tons in 2010, the same does not occur with its growth rate of productivity. The above maps show that in the larger interval of the study the productivity growth is above 3% per year. In the first period 17 micros obtained this index, and in the second period this rate was reached by 34 micro-regions. This increase of 100% in the number of micro--regions with annual yield growth above 3% between the two periods was mainly due productivity increases in the North and Southeast regions of the country.
Another factor that positively account for the cassava market is the decreasing number of micro-regions that had negative productivity between the periods. Between 1990-2000, there were 180 micros in the first two intervals of the maps (with decreasing rate of annual productivity between 1% and 2%). Between 2001-2012 this quantity declined more than 47%, going to 95 micro-regions.
Finally, despite the annual productivity growth is positive in most micro-regions, this index increased at lower rates than other cultures studied previously. Currently, in the North and Northeast regions, cassava is an important food supply to the population and its production occurs through small local producers to supply these regions. In the Midwest, South and Southeast, the productive systems have been restructured over the past 40 years to make this market competitive. Therefore, the production of cassava market still has little visibility and is far from reach the greatness of other cultures discussed above, even with positive rates of productivity.
6.6 Herbaceous cotton crop
The last studied culture is the herbaceous cotton. Currently, cotton production is divided into herbaceous cotton and cotton tree, with 90% of world production originated from the herbaceous cotton. In Brazil, on the average between 2010 and 2012, 3.5% of all agricultural production was a result of herbaceous cotton production, and according Americo et al. (2013) Brazil is the sixth largest producer of that good.
This study also showed that until the 80s Brazil was one of the largest producers and exporters of cotton in the world. However, the proliferation of the pest of cotton boll weevil (Anthonomus grandis, Boheman) wiped out the cotton plantations in northeastern. In addition to this plague, the internal migration of production to the central region of the country drove the decline of cotton production in the Northeast region.
36
B r a s í l i a , F e b r u a r y 2 0 1 6
In Brazil, cotton production is concentrated mainly in the Northeast and Mid-South. According to Oliveira et al. (2010), the environment is a key factor in the production of cotton. As a result of climate differences in these regions, the Northeast cultivates the cotton tree, while in Mid-South is used herbaceous cotton. As a result, Brazil is one of the only countries that have two cotton crops annually.
Also noteworthy is the cotton production in the Midwest, since this crop is being cultivated in alternation with the planting of soybeans. Thus, from the 90s, there was a geographical shift in cotton production from traditional areas to the central region of Brazil. In 2009, the central region already accounted 84% of the country’s cotton production, highlighting the state of Mato Grosso.
Besides the interest of producers of the Midwest in producing cotton, other factors also stimulate the production in the area. The weather and the flat lands enable greater mechanization of farming that ends up boosting investments in the sector, in addition to incentive programs established by public power. These externalities are making cotton plantation in vegetation of the Brazilian interior (called cerrado) one of the most productive of Brazil and even worldwide.
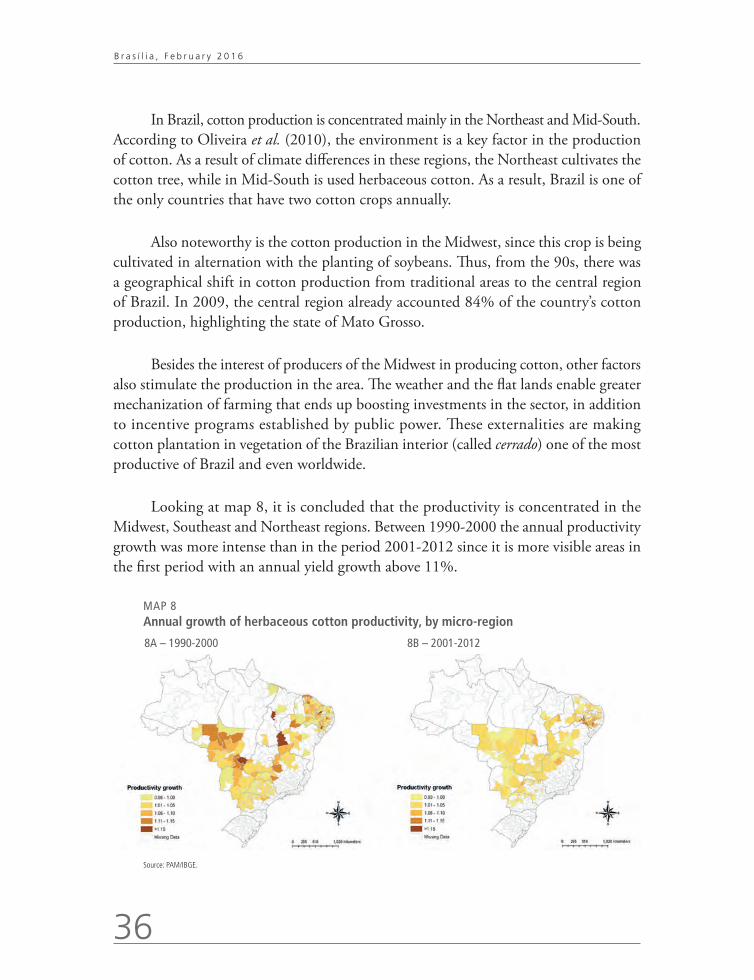
Looking at map 8, it is concluded that the productivity is concentrated in the Midwest, Southeast and Northeast regions. Between 1990-2000 the annual productivity growth was more intense than in the period 2001-2012 since it is more visible areas in the first period with an annual yield growth above 11%.
MAP 8Annual growth of herbaceous cotton productivity, by micro-region
8A – 1990-2000 8B – 2001-2012
Source: PAM/IBGE.
Discussion Paper
2 0 8
37
Agriculture Productivity Growth In Brazilian Micro-Regions
Corroborating this concentration, Assad et al. (2010) shows that in 2005, cotton production was concentrated in three major regions: i) the North-Northeast, composed by the states of Tocantins, Maranhão, Piauí, Ceará, Rio Grande do Norte, Paraíba, Pernambuco, Alagoas and Bahia; ii) the Midwest Region, with states of Mato Grosso, Mato Grosso do Sul and Goias; and iii) the South-Southeast region with the states of São Paulo, Paraná and Minas Gerais.
It is noted that compared with other cultures studied, herbaceous cotton draws attention to two points: the production is concentrated in a few regions of the country and the annual productivity growth is much greater than in other cultures, with micro-regions with annual growth of productivity above 15%. Between 1990-2000 and 2001-2012, 233 and 153 micros, respectively, showed herbaceous cotton productivity in a total of 558 micro-regions.
As for the growth of annual productivity, between 1990-2000, 19 micro-regions obtained percentage above 11%, while between 2001 to 2012 this percentage was obtained by only 4 micro-regions. Adding to this, in the first period, 69 micro-regions showed negative growth of annual productivity up to 4% and in the second period, this percentage occurred in 59 micro-regions.
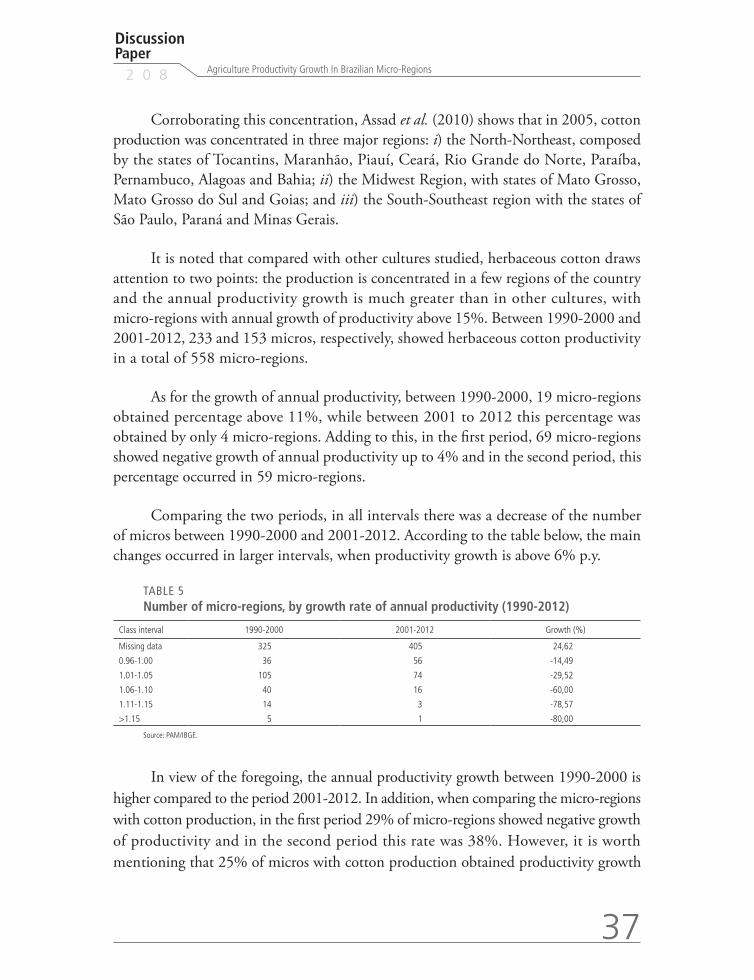
Comparing the two periods, in all intervals there was a decrease of the number of micros between 1990-2000 and 2001-2012. According to the table below, the main changes occurred in larger intervals, when productivity growth is above 6% p.y.
TABLE 5 Number of micro-regions, by growth rate of annual productivity (1990-2012)
Class interval 1990-2000 2001-2012 Growth (%)
Missing data 325 405 24,62
0.96-1.00 36 56 -14,49
1.01-1.05 105 74 -29,52
1.06-1.10 40 16 -60,00
1.11-1.15 14 3 -78,57
>1.15 5 1 -80,00
Source: PAM/IBGE.
In view of the foregoing, the annual productivity growth between 1990-2000 is higher compared to the period 2001-2012. In addition, when comparing the micro-regions with cotton production, in the first period 29% of micro-regions showed negative growth of productivity and in the second period this rate was 38%. However, it is worth mentioning that 25% of micros with cotton production obtained productivity growth
38
B r a s í l i a , F e b r u a r y 2 0 1 6
above 6% per year in the first period and more than 13% of the producing micro showed that percentage in the second period.
6.7 Rice crop
The seventh culture with higher value of domestic production is rice, which between 2010 and 2012 represented 3.3% of Brazilian production. Brazil is the second largest rice producer behind only the Chinese market. As for consumption, Brazil is the 10th largest global consumer (da Silva e Souza et al., 2010).
According Sosbai (2010), in 2009/10, the national average consumption was 45 kg per capita per year, below the average world consumption which was close to 60 kg per capita per year. The largest producer was China with 90% of the world’s production and also the largest consumer with consumption between 100 and 150 kg per inhabitant per year. In Latin America, the average consumption reached 30 kg per capita per year.
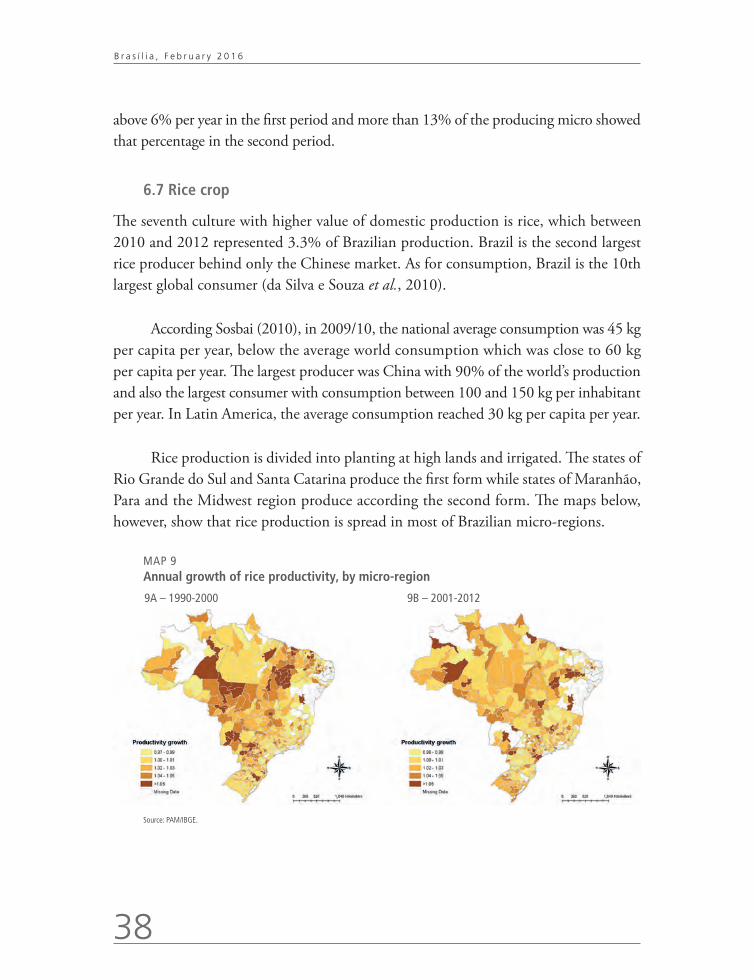
Rice production is divided into planting at high lands and irrigated. The states of Rio Grande do Sul and Santa Catarina produce the first form while states of Maranhão, Para and the Midwest region produce according the second form. The maps below, however, show that rice production is spread in most of Brazilian micro-regions.
MAP 9Annual growth of rice productivity, by micro-region
9A – 1990-2000 9B – 2001-2012
Source: PAM/IBGE.
Discussion Paper
2 0 8
39
Agriculture Productivity Growth In Brazilian Micro-Regions
Also according to Sosbai (2010), the state of Rio Grande do Sul accounted for 61% of the national rice production in 2009/2010. It is the largest producing state of the asset, which is divided between 133 municipalities. The state of Santa Catarina contributed with 8% of national production, spread over 142 municipalities, but concentrated in the coastal region and lower and middle region of the Itajai Valley.
Between 1990 and 2000, the state of Rio Grande do Sul presents, in most of the micro-regions, declining productivity growth in the order of up to 3% per year. Between 2001 and 2012, the same state presented, in large part of their micro-regions, annual productivity increase above 2%, and in six micro-regions that annual growth was 4% to 5%.
Overall, productivity in both studied periods showed areas with positive annual growth of productivity and areas with negative index. In the period 1990-2000, 70 micro-regions showed negative growth of annual productivity, while among 2001/2012 there were 80 micro-regions with these results, an increase of 14%. With the constant or positive annual productivity growth in the first period there were 402 micro and 350 in the second period, a decrease of 13%.
Finally, the three largest categories had reduced the number of micro’s between the studied periods. In the growth range above 5%, the reduction was 46%, down from 46 to 25 micro-regions.
According to Steinmetz et al. (2013), one of the factors that influence rice productivity is weather conditions. The levels of solar radiation and temperature changes greatly impact the productivity of land.
Bassani and Breda (2012) suggests that Brazil is not a reference in the production of rice, but has increased its planted area, improving the means of production and investing more in more productive and resistant seeds.
We conclude that although most of the micro-regions of the state of Rio Grande do Sul present productivity gains between periods, many micro decreased the growth of productivity or even stopped producing those goods, given that in 1990/2000 only 86 micro did not produce rice and 2001/2012 were 128 micro-regions, increase of 49%.
40
B r a s í l i a , F e b r u a r y 2 0 1 6
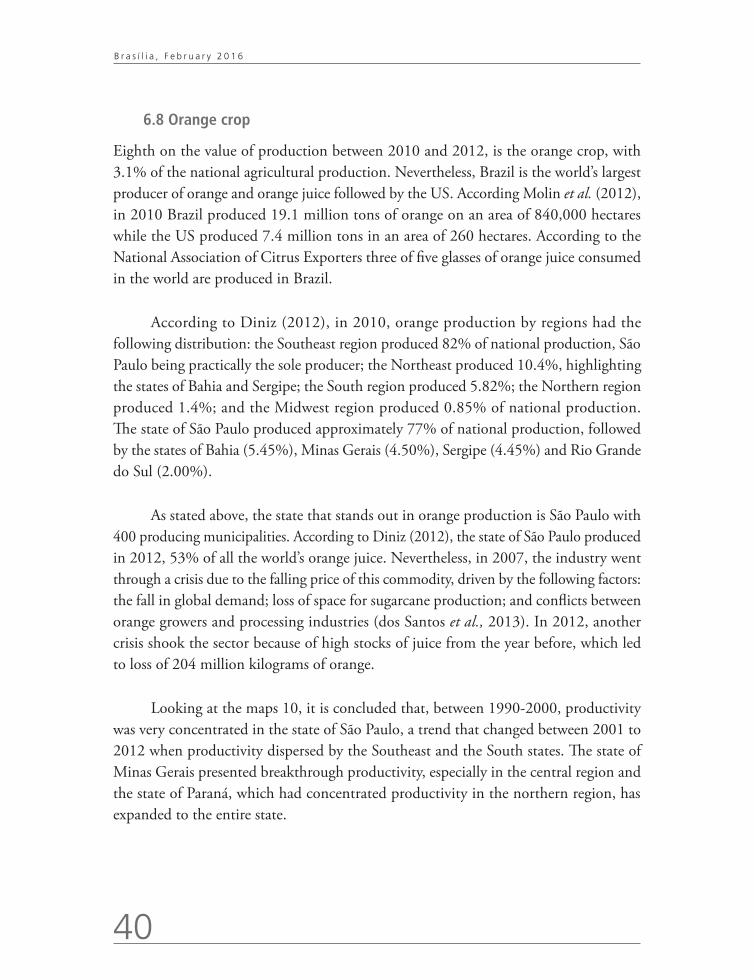
6.8 Orange crop
Eighth on the value of production between 2010 and 2012, is the orange crop, with 3.1% of the national agricultural production. Nevertheless, Brazil is the world’s largest producer of orange and orange juice followed by the US. According Molin et al. (2012), in 2010 Brazil produced 19.1 million tons of orange on an area of 840,000 hectares while the US produced 7.4 million tons in an area of 260 hectares. According to the National Association of Citrus Exporters three of five glasses of orange juice consumed in the world are produced in Brazil.
According to Diniz (2012), in 2010, orange production by regions had the following distribution: the Southeast region produced 82% of national production, São Paulo being practically the sole producer; the Northeast produced 10.4%, highlighting the states of Bahia and Sergipe; the South region produced 5.82%; the Northern region produced 1.4%; and the Midwest region produced 0.85% of national production. The state of São Paulo produced approximately 77% of national production, followed by the states of Bahia (5.45%), Minas Gerais (4.50%), Sergipe (4.45%) and Rio Grande do Sul (2.00%).
As stated above, the state that stands out in orange production is São Paulo with 400 producing municipalities. According to Diniz (2012), the state of São Paulo produced in 2012, 53% of all the world’s orange juice. Nevertheless, in 2007, the industry went through a crisis due to the falling price of this commodity, driven by the following factors: the fall in global demand; loss of space for sugarcane production; and conflicts between orange growers and processing industries (dos Santos et al., 2013). In 2012, another crisis shook the sector because of high stocks of juice from the year before, which led to loss of 204 million kilograms of orange.
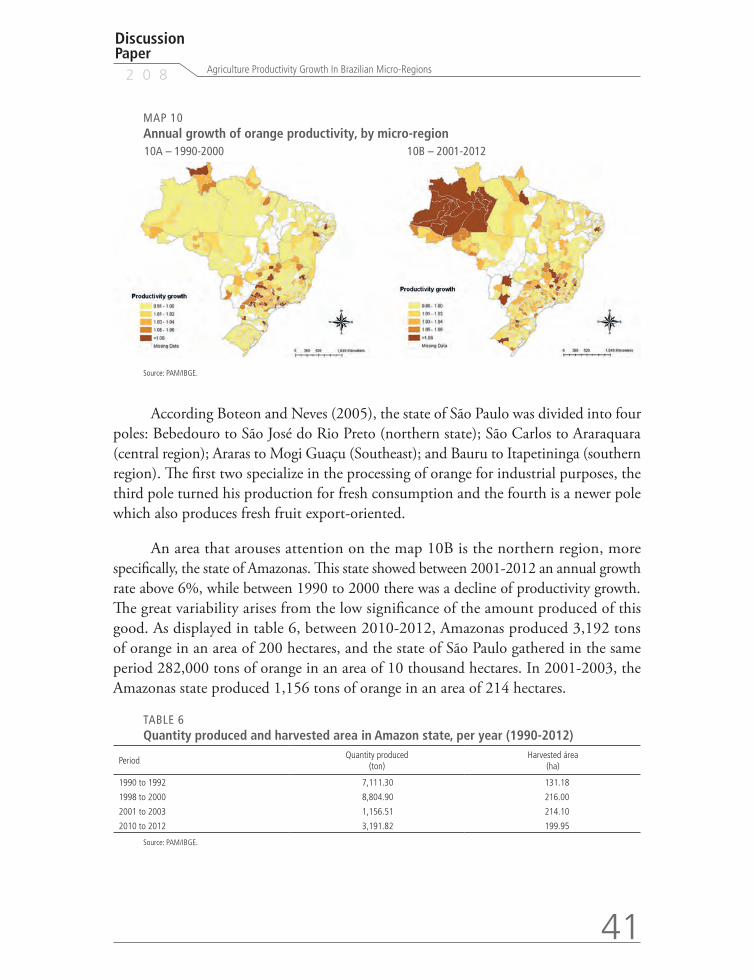
Looking at the maps 10, it is concluded that, between 1990-2000, productivity was very concentrated in the state of São Paulo, a trend that changed between 2001 to 2012 when productivity dispersed by the Southeast and the South states. The state of Minas Gerais presented breakthrough productivity, especially in the central region and the state of Paraná, which had concentrated productivity in the northern region, has expanded to the entire state.
Discussion Paper
2 0 8
41
Agriculture Productivity Growth In Brazilian Micro-Regions
MAP 10Annual growth of orange productivity, by micro-region10A – 1990-2000 10B – 2001-2012
Source: PAM/IBGE.
According Boteon and Neves (2005), the state of São Paulo was divided into four poles: Bebedouro to São José do Rio Preto (northern state); São Carlos to Araraquara (central region); Araras to Mogi Guaçu (Southeast); and Bauru to Itapetininga (southern region). The first two specialize in the processing of orange for industrial purposes, the third pole turned his production for fresh consumption and the fourth is a newer pole which also produces fresh fruit export-oriented.
An area that arouses attention on the map 10B is the northern region, more specifically, the state of Amazonas. This state showed between 2001-2012 an annual growth rate above 6%, while between 1990 to 2000 there was a decline of productivity growth. The great variability arises from the low significance of the amount produced of this good. As displayed in table 6, between 2010-2012, Amazonas produced 3,192 tons of orange in an area of 200 hectares, and the state of São Paulo gathered in the same period 282,000 tons of orange in an area of 10 thousand hectares. In 2001-2003, the Amazonas state produced 1,156 tons of orange in an area of 214 hectares.
TABLE 6 Quantity produced and harvested area in Amazon state, per year (1990-2012)
PeriodQuantity produced
(ton)Harvested área
(ha)
1990 to 1992 7,111.30 131.18
1998 to 2000 8,804.90 216.00
2001 to 2003 1,156.51 214.10
2010 to 2012 3,191.82 199.95
Source: PAM/IBGE.
42
B r a s í l i a , F e b r u a r y 2 0 1 6
Table 6 shows that since 2000 there was a significant drop in the amount produced with a small improvement from 2010 to 2012. The climate of the Amazonas state contributes to the planting of orange, but the lack of technology combined with the high temperatures of this region, which stimulate the spread of pests, prevents large-scale production. Thus, these productivity gains result from seasonal factors and not from better land use.
Finally, between 1990-2000 and 2001-2012 there was an increase of 85 micro-regions that showed positive annual growth in productivity, while 95 micro came out of negative annual growth range (0.91-1.00). As for higher growth intervals, above 5%, the number of micro-regions remained constant between the periods, but with changes in the productivity of municipalities.
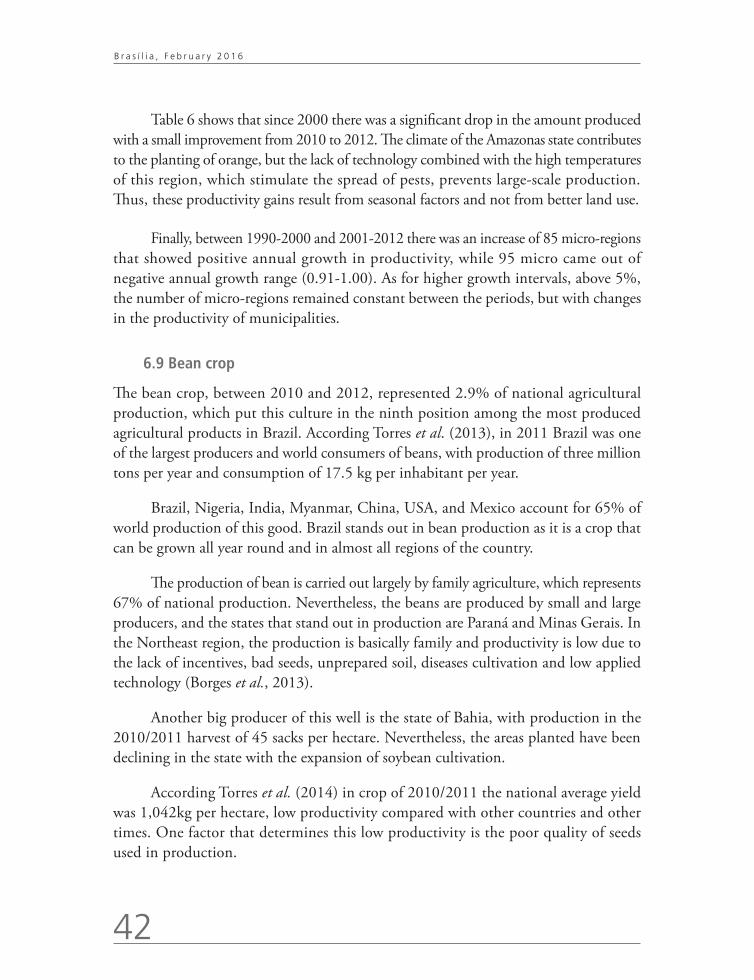
6.9 Bean crop
The bean crop, between 2010 and 2012, represented 2.9% of national agricultural production, which put this culture in the ninth position among the most produced agricultural products in Brazil. According Torres et al. (2013), in 2011 Brazil was one of the largest producers and world consumers of beans, with production of three million tons per year and consumption of 17.5 kg per inhabitant per year.
Brazil, Nigeria, India, Myanmar, China, USA, and Mexico account for 65% of world production of this good. Brazil stands out in bean production as it is a crop that can be grown all year round and in almost all regions of the country.
The production of bean is carried out largely by family agriculture, which represents 67% of national production. Nevertheless, the beans are produced by small and large producers, and the states that stand out in production are Paraná and Minas Gerais. In the Northeast region, the production is basically family and productivity is low due to the lack of incentives, bad seeds, unprepared soil, diseases cultivation and low applied technology (Borges et al., 2013).
Another big producer of this well is the state of Bahia, with production in the 2010/2011 harvest of 45 sacks per hectare. Nevertheless, the areas planted have been declining in the state with the expansion of soybean cultivation.
According Torres et al. (2014) in crop of 2010/2011 the national average yield was 1,042kg per hectare, low productivity compared with other countries and other times. One factor that determines this low productivity is the poor quality of seeds used in production.
Discussion Paper
2 0 8
43
Agriculture Productivity Growth In Brazilian Micro-Regions
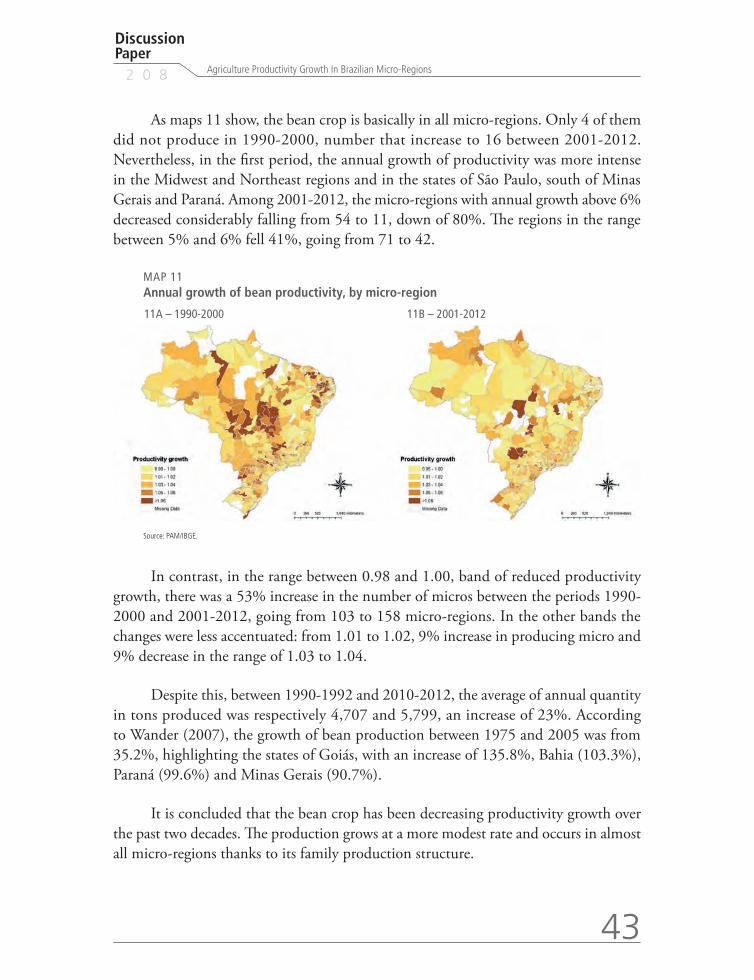
As maps 11 show, the bean crop is basically in all micro-regions. Only 4 of them did not produce in 1990-2000, number that increase to 16 between 2001-2012. Nevertheless, in the first period, the annual growth of productivity was more intense in the Midwest and Northeast regions and in the states of São Paulo, south of Minas Gerais and Paraná. Among 2001-2012, the micro-regions with annual growth above 6% decreased considerably falling from 54 to 11, down of 80%. The regions in the range between 5% and 6% fell 41%, going from 71 to 42.
MAP 11Annual growth of bean productivity, by micro-region
11A – 1990-2000 11B – 2001-2012
Source: PAM/IBGE.
In contrast, in the range between 0.98 and 1.00, band of reduced productivity growth, there was a 53% increase in the number of micros between the periods 1990-2000 and 2001-2012, going from 103 to 158 micro-regions. In the other bands the changes were less accentuated: from 1.01 to 1.02, 9% increase in producing micro and 9% decrease in the range of 1.03 to 1.04.
Despite this, between 1990-1992 and 2010-2012, the average of annual quantity in tons produced was respectively 4,707 and 5,799, an increase of 23%. According to Wander (2007), the growth of bean production between 1975 and 2005 was from 35.2%, highlighting the states of Goiás, with an increase of 135.8%, Bahia (103.3%), Paraná (99.6%) and Minas Gerais (90.7%).
It is concluded that the bean crop has been decreasing productivity growth over the past two decades. The production grows at a more modest rate and occurs in almost all micro-regions thanks to its family production structure.
44
B r a s í l i a , F e b r u a r y 2 0 1 6
6.10 Tobacco leaf crop
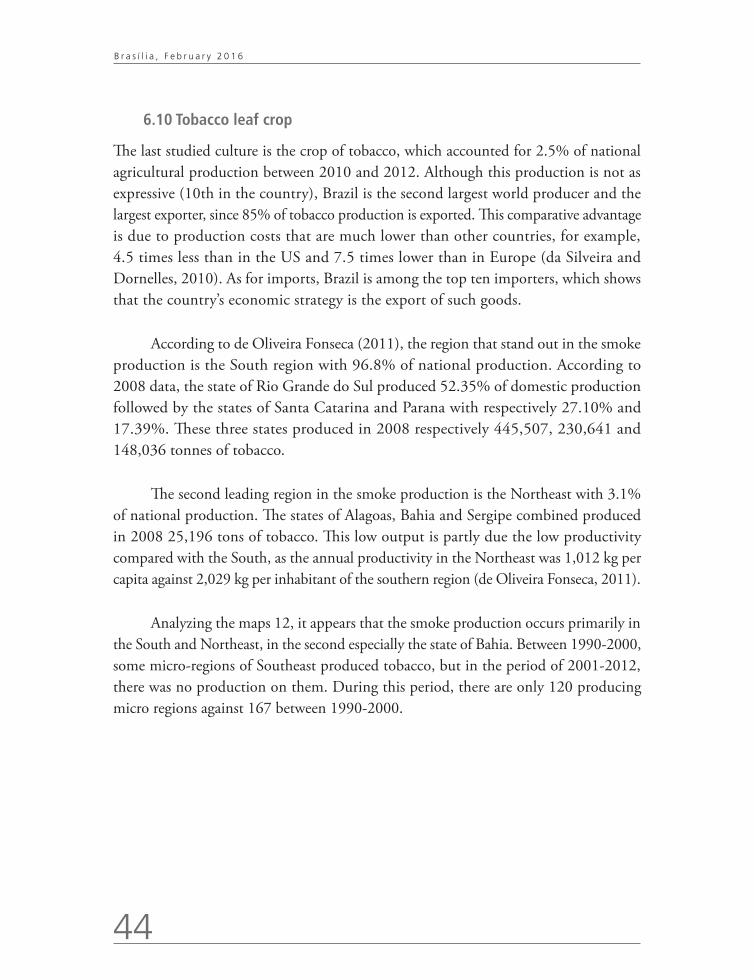
The last studied culture is the crop of tobacco, which accounted for 2.5% of national agricultural production between 2010 and 2012. Although this production is not as expressive (10th in the country), Brazil is the second largest world producer and the largest exporter, since 85% of tobacco production is exported. This comparative advantage is due to production costs that are much lower than other countries, for example, 4.5 times less than in the US and 7.5 times lower than in Europe (da Silveira and Dornelles, 2010). As for imports, Brazil is among the top ten importers, which shows that the country’s economic strategy is the export of such goods.
According to de Oliveira Fonseca (2011), the region that stand out in the smoke production is the South region with 96.8% of national production. According to 2008 data, the state of Rio Grande do Sul produced 52.35% of domestic production followed by the states of Santa Catarina and Parana with respectively 27.10% and 17.39%. These three states produced in 2008 respectively 445,507, 230,641 and 148,036 tonnes of tobacco.
The second leading region in the smoke production is the Northeast with 3.1% of national production. The states of Alagoas, Bahia and Sergipe combined produced in 2008 25,196 tons of tobacco. This low output is partly due the low productivity compared with the South, as the annual productivity in the Northeast was 1,012 kg per capita against 2,029 kg per inhabitant of the southern region (de Oliveira Fonseca, 2011).
Analyzing the maps 12, it appears that the smoke production occurs primarily in the South and Northeast, in the second especially the state of Bahia. Between 1990-2000, some micro-regions of Southeast produced tobacco, but in the period of 2001-2012, there was no production on them. During this period, there are only 120 producing micro regions against 167 between 1990-2000.
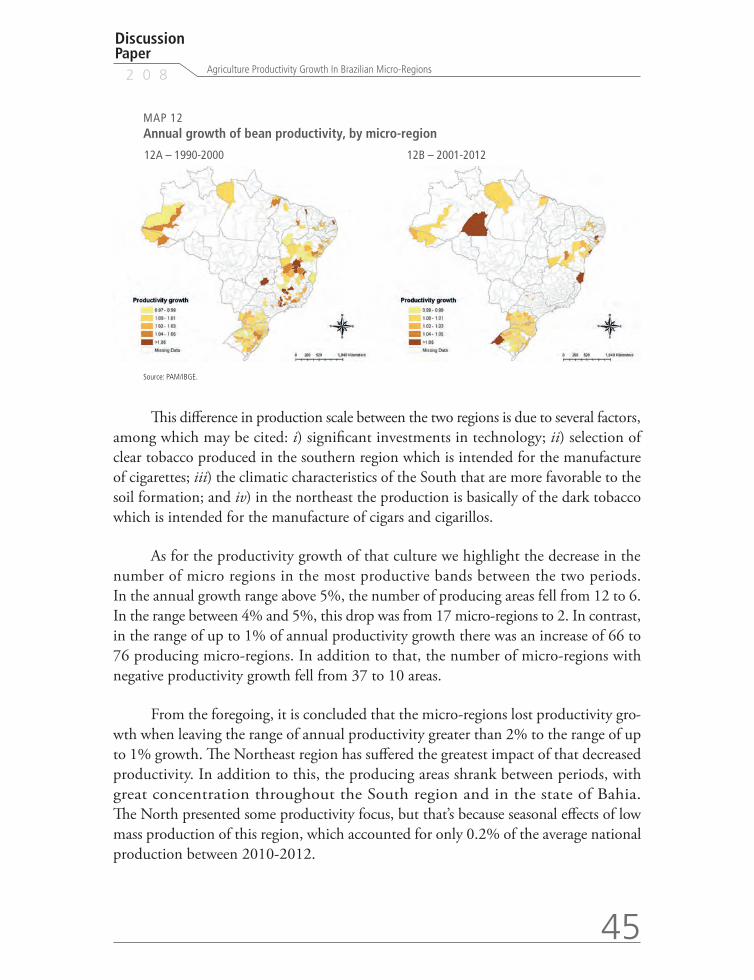
Discussion Paper
2 0 8
45
Agriculture Productivity Growth In Brazilian Micro-Regions
MAP 12Annual growth of bean productivity, by micro-region
12A – 1990-2000 12B – 2001-2012
Source: PAM/IBGE.
This difference in production scale between the two regions is due to several factors, among which may be cited: i) significant investments in technology; ii) selection of clear tobacco produced in the southern region which is intended for the manufacture of cigarettes; iii) the climatic characteristics of the South that are more favorable to the soil formation; and iv) in the northeast the production is basically of the dark tobacco which is intended for the manufacture of cigars and cigarillos.
As for the productivity growth of that culture we highlight the decrease in the number of micro regions in the most productive bands between the two periods. In the annual growth range above 5%, the number of producing areas fell from 12 to 6. In the range between 4% and 5%, this drop was from 17 micro-regions to 2. In contrast, in the range of up to 1% of annual productivity growth there was an increase of 66 to 76 producing micro-regions. In addition to that, the number of micro-regions with negative productivity growth fell from 37 to 10 areas.
From the foregoing, it is concluded that the micro-regions lost productivity gro-wth when leaving the range of annual productivity greater than 2% to the range of up to 1% growth. The Northeast region has suffered the greatest impact of that decreased productivity. In addition to this, the producing areas shrank between periods, with great concentration throughout the South region and in the state of Bahia. The North presented some productivity focus, but that’s because seasonal effects of low mass production of this region, which accounted for only 0.2% of the average national production between 2010-2012.
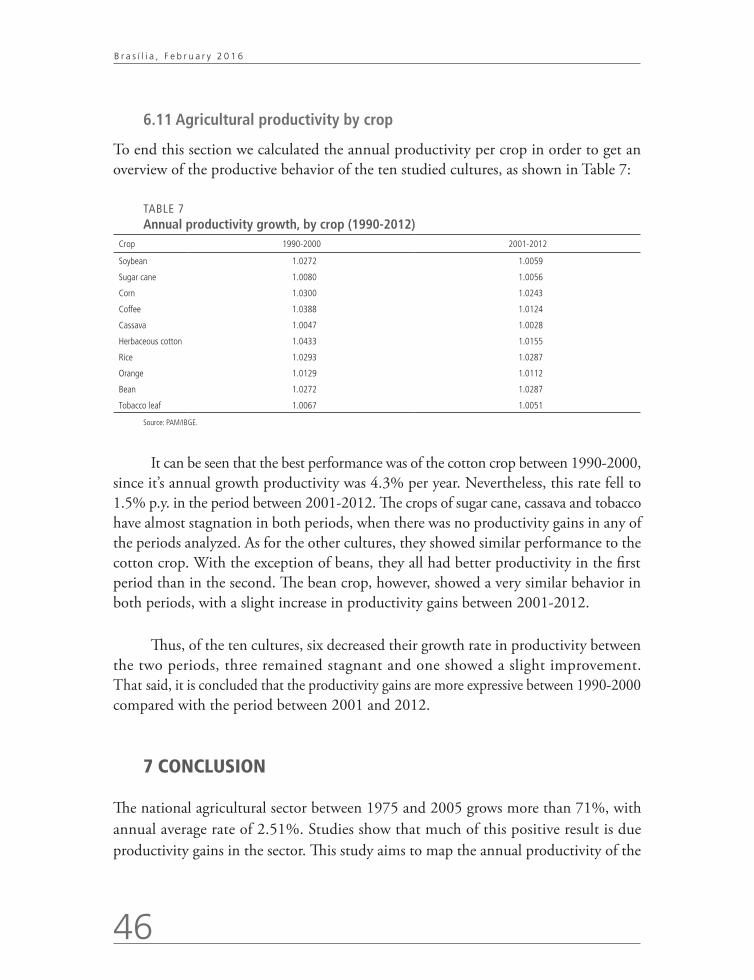
46
B r a s í l i a , F e b r u a r y 2 0 1 6
6.11 Agricultural productivity by crop
To end this section we calculated the annual productivity per crop in order to get an overview of the productive behavior of the ten studied cultures, as shown in Table 7:
TABLE 7 Annual productivity growth, by crop (1990-2012)
Crop 1990-2000 2001-2012
Soybean 1.0272 1.0059
Sugar cane 1.0080 1.0056
Corn 1.0300 1.0243
Coffee 1.0388 1.0124
Cassava 1.0047 1.0028
Herbaceous cotton 1.0433 1.0155
Rice 1.0293 1.0287
Orange 1.0129 1.0112
Bean 1.0272 1.0287
Tobacco leaf 1.0067 1.0051
Source: PAM/IBGE.
It can be seen that the best performance was of the cotton crop between 1990-2000, since it’s annual growth productivity was 4.3% per year. Nevertheless, this rate fell to 1.5% p.y. in the period between 2001-2012. The crops of sugar cane, cassava and tobacco have almost stagnation in both periods, when there was no productivity gains in any of the periods analyzed. As for the other cultures, they showed similar performance to the cotton crop. With the exception of beans, they all had better productivity in the first period than in the second. The bean crop, however, showed a very similar behavior in both periods, with a slight increase in productivity gains between 2001-2012.
Thus, of the ten cultures, six decreased their growth rate in productivity between the two periods, three remained stagnant and one showed a slight improvement. That said, it is concluded that the productivity gains are more expressive between 1990-2000 compared with the period between 2001 and 2012.
7 CONCLUSION
The national agricultural sector between 1975 and 2005 grows more than 71%, with annual average rate of 2.51%. Studies show that much of this positive result is due productivity gains in the sector. This study aims to map the annual productivity of the
Discussion Paper
2 0 8
47
Agriculture Productivity Growth In Brazilian Micro-Regions
agricultural sector by micro-region focusing on ten major crops in value of production between the years 2010 and 2012.
The empirical analysis was based on the Municipal Agriculture Production Research (PAM), released by IBGE, between the years 1990 to 2012. Production data are the aggregation of information from temporary and permanent crops and to define the ten most important cultures between 2010 and 2012, we used the value of production in reais.
The productivity was calculated by the total factor productivity model (TFP) by Tornqvist index, as Equation 4. In our study is used an input (harvested area per hectare) and a product (quantity produced in tonnes), both by micro-regions.
It is worth mentioning that, as expressed in Christensen (1975), the use of partial productivity models are not as accurate as the TFP models. The TFP models seek to determine productivity from a combination of inputs, avoiding not accounting an input that can be decisive in the productive growth of the studied sector/good.
Nevertheless, the focus of this study is to map the productivity of the agricultural sector by micro-region and not discover all the determinants of productivity. That said, it was decided to use a streamlined version of the productivity model to not disperse the scope of this work. In a later study may be proposed a mapping using a model with multiple inputs and outputs.
The productivity of the domestic agricultural sector in 1990 jumped from 9.25 ton/ha to 14.32 ton/ha in 2012, an increase of approximately 55%. However, the annual increase of productivity had a slightly elastic behavior, ranging up to 20%. The period that presented the best annual rate of productivity growth was between 2001 and 2007, when the rate went from 10% to negative 10% positive, and the worst year was 2001. Between 1994 and 1996, the annual growth rate also showed a strong upward trend. Economic stabilization built by the Real Plan, the external crisis by the end of the 90s and subsequent recovery of the international market, especially the Chinese rise, contributed to this variability in the rate of productivity growth.
By mapping productivity by regions, it appears that currently the Southeast region is the one with the best values, with productivity 30.75 ton/ha. This value is almost four times higher than the next best large region, the Northeast (8.12ton/ha).
48
B r a s í l i a , F e b r u a r y 2 0 1 6
Then the mapping of productivity growth was done by micro-region for crops of soybeans, sugar cane, corn, coffee, cassava, herbaceous cotton, rice, orange, bean and tobacco leaf. In assessing the annual productivity between 1990-2000 and 2001-2012, most micro-regions showed positive rate of annual productivity growth, with the difference only in the intensity of that growth. Some producers micro-regions of soy, cane sugar, corn, coffee, cassava, cotton, rice, orange, bean and tobacco arrived to grow its annual productivity respectively by 10%, 3%, 9%, 7%, 3%, 15%, 5%, 6%, 6% and 5%. Never-theless, all studied crops obtained micro-regions with a negative growth of productivity. In herbaceous cotton crop, for example, between 2001-2012, there were micro-regions with annual productivity growth of -7%. Between 1990-2000, the cultures of coffee, sugar cane and cassava had micro-regions with annual growth of, respectively, -6%, -5% and -4%. In the orange crop, this result were even worst: a negative growth rate of 9%.
Despite the great variability between the two ranges, it can be concluded that analyzing the annual growth rate of agriculture productivity the crops of soybean, corn, coffee, cotton, rice and orange obtained better results during 1990-2000 compared with 2001-2012. On the other hand, cultures of sugarcane, cassava and tobacco showed stagnation in both periods. Finally, the bean crop presented a slightly better result between 2001-2012.
REFERENCES
ALSTON, J.; BABCOCK, B.; PARDEY, P. The shifting patterns of agricultural production and productivity worldwide. Ames: Matric/Iowa State University, 2010.
ALVES, A. Análise do desempenho de cadeias produtivas agroindustriais da mandioca: estudo de caso nas principais regiões de produção do Brasil. 2012. Thesis (Master) – Universidade Federal do Rio Grande do Sul, Rio Grande do Sul, 2012.
AMERICO, G.; AMERICO, J.; JUNIOR, E. Algodão orgânico: possibilidade sustentável no setor agrícola. Fórum Ambiental da Alta Paulista, São Paulo, v. 9, n. 1, 2013.
ANCELES, E. K. O segmento exportador da cadeia agroindustrial de cafés especiais: emergência de novos padrões de competitividade. 2013. Monograph (Graduate) – Faculdade de Ciências Econômicas, Universidade Federal do Rio Grande do Sul, Rio Grande do Sul, 2013.
ASSAD, F. T. et al. Processamento do algodão para a produção têxtil. In: ENCONTRO DE ENGENHARIA DE PRODUÇÃO AGROINDUSTRIAL, 4., 2010, Campo Mourão, Paraná. Annals... Paraná: Eepa, 2010.
Discussion Paper
2 0 8
49
Agriculture Productivity Growth In Brazilian Micro-Regions
BARROS, J. Política e desenvolvimento agrícola no Brasil. In: VEIGA, A. (Coord.). Ensaios sobre política agrícola. São Paulo: Secretaria da Agricultura, 1979. p. 9-35.
BASSANI, T.; BREDA, L. Análise dos custos de produção, da produtividade e da rentabilidade em relação a três tecnologias de cultivo de arroz irrigado na fazenda São Sebastião, Querência do Norte/PR. Custos e Agronegócio online, 2012.
BORGES, S.; FIGUEROA, J.; MERLO, T. Adoção de variedade de feijão biofortificado por produtores rurais em Girau do Ponciano, Alagoas. Revista GEINTEC, 2013.
BÖRNER, J. et al. Direct conservation payments in the Brazilian Amazon: scope and equity implications. Ecological Economics, v.69, p. 1272-1282, 2010.
BOTEON, M.; NEVES, E. Citricultura brasileira: aspectos econômicos. In: JUNIOR, D. et al. (Eds.). Citros. Campinas: Instituto Agronômico e Fundag, 2005, cap. 2, p. 19-36.
BRAGAGNOLO, C. Produtividade, crescimento e ciclos econômicos na agricultura brasileira. 2012. Thesis (Doctorate) – Universidade de São Paulo, São Paulo, 2012.
BRASIL. Ministério da Agricultura. Produtividade e fontes de crescimento da agricultura. Brasília: Mapa, 2009.
CALDARELLI, C.; BACCHI, M. Fatores de influência no preço do milho no Brasil. Nova Economia, Belo Horizonte, v. 22, n. 1, p. 141-164, 2012.
CHRISTENSEN, L. Concepts and measurement of agricultural productivity. American Journal Agricultural Economics, Lexington, v. 57, n. 5, Dec. 1975.
CHRISTENSEN, L.; JORGENSON, D. real product and real factor input, 1929-1967. Income and Wealth, v. 16, n. 1, p. 19-50, Mar. 1970.
DIEWERT, W. Exact and superlative index numbers. Journal of Econometrics, London, v. 4, p. 115-145, 1976.
DINIZ, S. S. Análise espacial da produtividade da laranja dos municípios do estado de São Paulo: 2002-2010, 2012.
FEARNSIDE, P. M. Desmatamento na Amazônia brasileira: história, índices e consequências. Megadiversidade, Belo Horizonte, v. 1, n. 1, p. 113-123, 2005.
FILHO, H. et al. Condicionantes da adoção de inovações tecnológicas na agricultura. Cader-nos de Ciência e Tecnologia, Brasília, v. 28, n. 1, p. 223-255, 2011.
FREITAS, R.; MENDONÇA, M.; LOPES, G. Expansão de área agrícola: perfil e desigualdades entre as mesorregiões brasileiras. Brasília: Ipea, 2014. (Discussion Paper, n. 1926).
FONSECA, J. A territorialidade da cultura do fumo em Cruz das Almas - BA: tradições e mudanças. 2011. Thesis (Master) – Universidade Católica de Salvador, Salvador, 2011.
50
B r a s í l i a , F e b r u a r y 2 0 1 6
GASQUES, J. G. et al. Produtividade total dos fatores e transformações da agricultura brasileira: análise dos dados dos censos agropecuários. In: CONGRESSO SOCIEDADE BRASILEIRA DE ECONOMIA, ADMINISTRAÇÃO E SOCIOLOGIA RURAL, 48., 2009, Campo Grande. Annals... Campo Grande: Sober, 2009.
______. Produtividade da agricultura brasileira e os efeitos de algumas políticas. Revista de Política Agrícola, Brasília, v. 21, n. 3, p. 83-92, jul./ago./set. 2012.
KOHLHEPP, G. Análise da situação da produção de etanol e biodiesel no Brasil. Estudos Avançados, São Paulo, v. 24, n. 68, 2010.
LEME, P. Os pilares da qualidade: o processo de implementação do Programa de Qualidade do Café (PQC) no mercado de café torrado e moído do Brasil. 2007. Thesis (Master) – Universidade Federal de Lavras, Lavras, 2007.
MORAES, M. Indicadores do mercado de trabalho do sistema agroindustrial da cana de açúcar do Brasil no período 1992-2005. Estudos Econômicos. v. 37, 2007.
MOLIN, J. et al. Yield mapping, soil fertility and tree gaps in an orange orchard. Revista Brasileira Fruticultura, 2012.
MORAES, M. Indicadores do mercado de trabalho do sistema agroindustrial da cana-de-açúcar do Brasil no período 1992-2005. Estudos Econômicos, São Paulo, v. 37, 2007.
OECD – ORGANIZAÇÃO PARA A COOPERAÇÃO E DESENVOLVIMENTO ECONÔMICO. Review of Agricultural Policies, Brazil. OECD, 2005.
______. Fostering productivity and competitiveness in agriculture. OECD, 2011.
OLIVEIRA, J.; ELIAS, T.; LESSA, M. B. Café especial: agregação de valor ao tradicional café. Revista Eletrônica de Comunicação, v. 3, n. 1, 2008.
OLIVEIRA, S. et al. Características tecnológicas da fibra do algodão herbáceo em resposta a irrigação. In: WORKSHOP INTERNACIONAL DE INOVAÇÕES TECNOLÓGICAS NA IRRIGAÇÃO, 3., 2010. Annals... Fortaleza: Sobral, 2010. p. 1070-1076.
OLIVEIRA, S. et al. Características tecnológicas da fibra do algodão herbáceo em resposta a irrigação. In: III WORKSHOP INTERNACIONAL DE INOVAÇÕES TECNOLÓGICAS NA IRRIGAÇÃO, 2010
PEREIRA, M. Globalização, especialização territorial e divisão do trabalho: patrocínio e o café do cerrado mineiro. Cuadernos de Geografia: Revista Colombiana de Geografia, Colômbia, v. 23, 2014. Ano 1.
PONCIANO, N.; SOUZA, P.; REZENDE, A. Entraves da comercialização à competitividade do milho brasileiro. Revista Paranaense de Desenvolvimento, Curitiba, n. 104, p. 23-40, 2003.

Discussion Paper
2 0 8
51
Agriculture Productivity Growth In Brazilian Micro-Regions
RIBEIRO, M. Desafio para o desenvolvimento e sustentabilidade da cafeicultura no Brasil face à competitividade. In: SIMPÓSIO DE GESTÃO DA INOVAÇÃO TECNOLÓGICA, 21., 2002. Annals... Salvador, 2002.
SAMBUISHI, R. H. Sustentabilidade ambiental na agropecuária brasileira: impactos, políticas públicas e desafios, Brasília: Ipea, 2012. (Discussion Paper).
SANTOS, R. et al. An overview on the Brazilian orange juice production chain. Revista Brasileira Fruticultura, 2013.
SILVA E SOUZA, G. et al. Evolução da produção e do comércio internacional do arroz e projeção de preços. Pesquisa Operacional para o Desenvolvimento, 2010.
SILVEIRA, R. L.; DORNELLES, M. Expansão da cultura do tabaco no sul do Brasil: características da produção e da organização do território nas áreas rurais produtoras. In: BIENAL DEL COLOQUIO DE TRANSFORMACIONES TERRITORIALES, 8., 2010.
SOSBAI. Arroz irrigado: recomendações técnicas da pesquisa pra o sul do Brasil. In: XXVIII REUNIÃO TÉCNICA DA CULTURA DO ARROZ IRRIGADO, 2010.
STEINMETZ, S.; DEIBLER, A.; SILVA, J. B. Estimativa da produtividade de arroz irrigado em função da radiação solar global e da temperatura mínima do ar. Ciência Rural, 2013.
THIRTLE, C.; BOTTOMLEY, P. Total factor productivity in UK agriculture 1967-1990. Journal of Agricultural Economics, São Paulo, v. 43, n. 3, p. 381-400, 1992.
TORRES, H. et al. Produtividade do feijão phaseolus vulgaris l. com aplicações crescentes de molibdênio associadas ao cobalto via foliar. Enciclopédia Biosfera, Goiânia, v. 10, n. 18; p. 2468, 2014. Available at: <http://goo.gl/D1xB5U>. Accessed: 24 jul. 2015.
TORRES, J. Produtividade de feijão sobre lâminas de irrigação e coberturas de solo. Bioscience Journal, 2013.
VALLE, T.; LORENZI, J. Variedades melhoradas de mandioca como instrumento de inovação, segurança alimentar, competitividade e sustentabilidade: contribuições do Instituto Agronômico de Campinas - IAC. Cadernos de Ciência e Tecnologia, Brasília, v. 31, p. 15-34, jan./abr. 2014.
WANDER, A. Produção e consumo de feijão no Brasil, 1975-2005. Informações Econômicas, São Paulo, v. 37, n. 2, fev. 2007. Available at: <http://goo.gl/2RlS4w>. Accessed: 27 out. 2009.
WINKLER, C.; SOUZA, J. Condições de apropriação de renda no sistema agroindustrial do café. Caderno de Administração, Maringá, v. 20, n. 1, p. 23-37, 2012.

52
B r a s í l i a , F e b r u a r y 2 0 1 6
APPENDIX A
TABLEA A.1Annual average growth rate, by state (1975-2005)(In %)
State Growth of agricultural product Variation in harvested area Variation in TFP
Rondônia 1.2 -1.9 6.7
Acre 3.8 0.7 6.5
Amazonas 6.0 3.1 9.1
Roraima 0.5 2.0 10.3
Pará 3.4 0.9 6.5
Amapá 2.2 3.4 9.6
Tocantins 5.7 1.2 4.4
Maranhão 1.7 -0.4 2.9
Piauí 1.8 0.5 2.1
Ceará 1.4 -1.2 -0.2
Rio Grande do Norte 2.3 -2.0 -0.9
Paraíba 0.2 -1.6 -0.1
Pernambuco 0.9 -0.8 1.1
Alagoas 0.7 -0.2 1.1
Sergipe 1.7 0.5 1.8
Bahia 3.1 1.4 5.4
Minas Gerais 3.2 0.0 2.5
Espírito Santo 3.3 0.0 4.3
Rio de Janeiro -0.7 -1.8 2.4
São Paulo 2.4 0.2 2.1
Paraná -0.4 0.0 2.6
Santa Catarina 2.4 -0.8 2.3
Rio Grande do Sul -1.3 -1.1 2.4
Mato Grosso do Sul 1.5 -0.3 4.2
Mato Grosso 6.4 3.4 9.8
Goiás 2.1 0.2 2.7
Mean 2.4 0.2 3.2
Source: Bragagnolo (2012).

Ipea – Institute for Applied Economic Research
PUBLISHING DEPARTMENT
CoordinationCláudio Passos de Oliveira
SupervisionEverson da Silva MouraReginaldo da Silva Domingos
TranslationBernardo Alves FurtadoPatrícia Alessandra Morita Sakowski
TypesettingBernar José VieiraCristiano Ferreira de AraújoDaniella Silva NogueiraDanilo Leite de Macedo TavaresDiego André Souza SantosJeovah Herculano Szervinsk JuniorLeonardo Hideki Higa
Cover designLuís Cláudio Cardoso da Silva
Graphic designRenato Rodrigues Buenos
Ipea Bookstore
SBS – Quadra 1 − Bloco J − Ed. BNDES, Térreo 70076-900 − Brasília – DFBrazilTel.: + 55 (61) 2026 5336E-mail: [email protected]
The manuscripts in languages other than Portuguese published herein have not been proofread.


Composed in Adobe Garamond 11/13.2 (text)Frutiger 47 (headings, graphs and tables)
Brasília – DF – Brazil

Ipea’s missionEnhance public policies that are essential to Brazilian development by producing and disseminating knowledge and by advising the state in its strategic decisions.