AFIRE INTERNATIONAL INVESTOR SURVEY
17
AFIRE INTERNATIONAL INVESTOR SURVEY UNDERWRITTEN BY HOLLAND PARTNER GROUP 2021
Transcript of AFIRE INTERNATIONAL INVESTOR SURVEY

AFIRE INTERNATIONAL INVESTOR SURVEYUNDERWRITTEN BY HOLLAND PARTNER GROUP2021

CONTENTS
02 NOTE FROM AFIRE AND HOLLAND PARTNER GROUP
03 EXECUTIVE SUMMARY
04 RESPONDENT PROFILE
05 INVESTMENT ACTIVITY/ PLANS AND ALLOCATIONS/ PROPERTY AND STRATEGY
07 FOCUS ON US CITIES
09 CROSS-BORDER CAPITAL
AFIRE is the association for international real estate investors focused on commercial property in the US.
AFIRE is an essential forum for real estate investment thought leadership – AFIRE members gather throughout the year to help each other become Better Investors, Better Leaders, and Better Global Citizens through conversations, research, and analysis of real estate capital markets, cross-border issues, policy, economics, technology, and management. Representing the “who’s who” in the global real estate investment industry, AFIRE membership is exclusive to principals and senior executives.
For thirty years, AFIRE has produced this annual international investor survey as a tool for investors, regulators, and the media to understand the goals, challenges, and impacts of international investments on US real estate opportunities.All information contained in this report is the intellectual property of AFIRE. No sale or sub-licensing of the data is permitted; nor shall any data be altered or overwritten in this report.
Reprints and/or redesigns are permitted, with the following source attribution in all instances: “Source: As of March 2021; 2021 AFIRE International Investor Survey, underwritten by Holland Partner Group; www.afire.org.”
Please contact Benjamin van Loon, Communications Director, [email protected], for hi-res graphics, data sets, reprints, and other uses.
Cover photo: Downtown Austin, Texas, by Mitchell Kmetz/ Unsplash.com
Design: Benjamin van Loon
This report is underwritten by Holland Partner Group.© 2021 AFIRE / www.afire.org
10 INVESTOR CONCERNS/ BUSINESS CLIMATE/ SOCIAL AND POLITICAL/ REAL ESTATE/ ESG
15 ACKNOWLEDGEMENTS/ABOUT

THE FUTURE OF OUR INDUSTRY
As investors, there are things we can control. We can develop our teams, our approaches to decision-making, and forge dynamic strategies. It is a given that we do our homework. Solid data and processes are the foundation of great outcomes.
However, there are also things we can’t control, as we learned with the COVID pandemic, geopolitical shifts, and changes in technology—forces that challenge even our most considered investment strategies.
Over the last year, what was unthinkable became normal. Social unrest, global recession, and political uncertainty kept all of us challenged and searching for information that will define our future.
Throughout my career, I’ve been fortunate to be challenged by smart and innovative colleagues around the world and enjoy relationships with people and communities that I trust. I believe our first step should be to ask questions, listen to each other, and be willing to change our minds when new or better information is provided. Accomplishing this enables us to productively harness the trends that will drive our future.
The process of bringing together our best thought leaders and challenging each other to chart the most productive path forward is embodied in our new report. Many thanks to our AFIRE staff, the AFIRE Research Committee and Future Trends Committee, and PwC Research team. Holland Partner Group is proud to sponsor this report as it represents the best of who we are together.
⁃ Clyde HollandChair, AFIRE Future Trends CommitteeCEO and Chairman, Holland Partner Group
After more than a year of COVID-19, as tired and worried as everyone is, there are reasons to be optimistic. Not just because of the near-miraculous vaccines and heroic efforts of medical professionals, but also the creative ways people around the world have found to continue their lives—even in the face of unimaginable loss and lack of resources. In the darkest of days, there is cause for optimism because people are built to figure it out, improvise, change, and thrive.
People are also built to connect. Even when gathering in person has been impossible, they found new ways to connect and gather. When people connect there’s always a way.
The AFIRE Research Committee (p. 15) had already planned a “rebooted” International Investor Survey long before anyone knew about the virus, but the committee and others connected virtually to make sure it happened.
Committee chair Will McIntosh had absolute certainty that we could make something better. Clyde Holland volunteered his financial support and his insight as a determined futurist. The rest of the committee—Peter Grey-Wolf, Zeb Bradford, and David Roll—worked through every step of the process as we evaluated potential research groups and developed questions. The committee ultimately decided to work with the outstanding PwC Research group, and Byron Carlock became part of the team as well.
As you can see by the report you hold in your hand (or see on your screen), colleagues connected, figured out what they could do, improvised from time-to-time, and then got it done.
As you’ll read, the more than 100 leading investors and institutions we surveyed found many reasons to be optimistic about the US real estate markets.
And as for me—I’m optimistic about all of you around the world, and our ability to stay connected.
⁃ Gunnar BransonCEO, AFIRE
02© 2021 AFIRE / www.afire.org

EXECUTIVE SUMMARYFor thirty years, the AFIRE International Investor Survey has gathered the opinions of AFIRE’s members—representing almost 200 organizations from 24 countries, with approximately US$3 trillion in assets under management (AUM)—to construct a useful tool for investors, regulators, and the media to understand the goals, challenges, and impacts of international investments on US real estate opportunities.
While the 2021 survey is similar to those conducted in previous years, through the insights of the AFIRE Research Committee (p. 15) and the diligent work of the PwC LLP research team, the survey was adapted to meet the needs of the “new normal” in real estate as the COVID-19 pandemic enters its later phases and the industry adapts to the constancies of uncertainty heightened by global disruption.
As a survey of institutional and investor sentiment, this adaptation makes the thoroughgoing message of investor optimism detailed in this report (p. 5) that much more meaningful for the outlook of international investment into US commercial real estate (CRE).
This optimism ultimately complements evolving investor views on everything from portfolio strategy (p. 6) and investment intentions (p. 10) to plans and long-term visions for US cities. For example, this year’s report identifies Austin, Boston, and Dallas, respectively, as the top three cities for planned investment (p. 7). This is the first time that gateway, secondary, and tertiary cities claim the top three spots in our survey ranking—and the first time ever that a tertiary market (Austin) has stood first in line.
Despite this general tone of optimism, the extrinsic events of the past year—including the pandemic, accelerations in social and political unrest, large-scale climate events and disasters, and rapid technological evolution—are having a measured impact on investor concerns and risk management strategies (p. 10–12), though institutional prioritization of environmental, social, and governance (ESG) principles continues to grow in kind (p. 13).
Collectively, these findings lay important groundwork for establishing a longer-term vision about the future of investment into US CRE, where macroeconomic trends, geopolitical stability, and asset-level performance rank as the key factors for mapping the next decade of investment strategy.
METHODOLOGYThe information contained in this report was collected in an online survey, comprised of quantitative and qualitative questionnaire, that took place over a three-week period, from March 1 to March 24, 2021. The survey gathered insights from 101 respondents across 19 countries and was administered by the research team at PwC LLP (p. 15), who managed data collection and aggregation of results, with support from AFIRE.
INVESTOR OUTLOOK IS POSITIVE
Three in four investors expect their volume of US real estate investment activity in 2021 to increase, with six in ten foreseeing revenue growth. (p. 5)
AUSTIN, BOSTON, AND DALLAS
Are the top three US cities for planned investment this year and for intended investment exposure increase in the next three to five years. (p. 7)
MULTIFAMILY AND INDUSTRIAL
Multifamily property remains most favored property type, with 86% intending to increase exposure in the next three to five years, followed by industrial at 79%. (p. 6)
ASIA-PAC, EUROPE, AND CANADA
Are the top three regions for increased capital flow into the US in the next three to five years, though most of the capital for US investment (35%) also originates in the US. (p. 09)
ECONOMICS AND CLIMATE CHANGE
Changes in tenant demand, economic inequality, climate change, and economic growth feature are among the key areas of concern impacting US real estate activity. (p. 12)
ESG URGENCY
Nine in ten investors view ESG as increasingly imperative over the next three to five years, and three in ten already require new investments to meet established criteria. (p. 13)
POPULATION AND INNOVATION
Innovation, demographic forecasting, economic and geopolitical stability, and supportive investment policies will be key for success in US real estate over the next decade. (MEMBERS ONLY)
03© 2021 AFIRE / www.afire.org

RESPONDENT PROFILEMembers of AFIRE represent around 200 organizations from 24 countries, with approximately US$3 trillion in assets under management (AUM).
This year’s survey collected more than a hundred responses within and beyond the AFIRE membership, and regional participation in the data collection was broadly in line with AFIRE’s overall membership profile, which includes institutional investors, fund and investment managers, family offices, publicly listed companies, and related services.*
US-BASED INVESTORS/INVESTMENT MANAGERS
INSTITUTIONAL/NON-US-BASED INVESTORS
ACCOUNTANTS, LAW FIRMS,BROKERAGES
64%25%
21%
11%
16%
11%
7%
4%
4%
$1 BILLION – $5 BILLION
$5 BILLION – $10 BILLION
$10 BILLION – $25 BILLION
$25 BILLION – $50 BILLION
$50 BILLION – $100 BILLION
$100 BILLION – $500 BILLION
$500 BILLION+
DO NOT KNOW ORCANNOT DISCLOSE
RESPONDENT COMPANIESPRIMARY ACTIVITIES + ASSETS UNDER MANAGEMENT
* Due to rounding and targeted survey design, some charts in this report may not total to 100%.
US43%
AMERICAS (OTHER)
11%
EUROPE31%
MIDDLEEAST4%
ASIA-PAC11%
04© 2021 AFIRE / www.afire.org
23%
13%

INVESTMENT ACTIVITY / PLANS AND ALLOCATIONS
1%
2%
2%
7%
4%
2%
25%
54%
62%
55%
75%
69%
74%
44%
36%
38%
20%
29%
◼ DECREASE◼ STAY THE SAME◼ INCREASE
UNITED STATES
EUROPE(EXC. UK)
ASIA-PAC(EXC. AUS/NZ)
UK
CANADA
AUSTRALIA/NEW ZEALAND
60%
17%
9%
7%
5%
3%
PLANNED INVESTMENTBY REGION IN 2021
EXPECTED CHANGEIN 3–5 YEARS
61%
61%
57%
36%
25%
14%
14%
7%
4%
4%
14%
QUALITY OF ASSETS
DIVERSIFICATION ABILITY
INCOME RETURN
EASE OF DOING BUSINESS
POLITICAL STABILITY
RANGE OF ASSETS
LEVELS OF TAXATION
LEVELS OF REGULATION
INFRASTRUCTURE
INCOME HEDGE
OTHER
58%
55%
53%38%
33%
18%
10%
7%
7%7%
2%
8%
DIVERSIFICATION ABILITY
QUALITY OF ASSETS
INCOME RETURN
RANGE OF ASSETS
EASE OF DOING BUSINESS
POLITICAL STABILITY
INFRASTRUCTURE
LEVELS OF TAXATION
LEVELS OF REGULATION
INCOME HEDGE
ECONOMIC STRENGTH
OTHER
FACTORS ENCOURAGINGINVESTMENT ALLOCATION
OUTSIDE THE US INTO THE US
(Includes currency, growth prospects, home country biases)
(Includes transparency, demographic trends,client preferences, returns, scale, etc.)
While the top three factors attracting investment into the US (quality of assets, portfolio diversification, and income return) are consistent with rationale for investing outside the US, the range of assets available in the US as well as ease of doing business are substantive motivating factors for US investments.
Three in four respondents plan to increase their US real estate investment in the next three to five years, with Europe, the UK and Asia-Pac also set for further investment.
Additionally, US investment allocation by non-US-based investors is forecast to increase 71% over the next three to five years, just behind US investors expected allocation of 79%.
05© 2021 AFIRE / www.afire.org

INVESTMENT ACTIVITY / PROPERTY AND STRATEGY
3%2%
4%
20%
20%
26%
22%
56%
53%
12%
16%
21%
18%
55%
65%
50%
46%
38%
37%
86%
82%
79%
79%
25%
16%
24%
32%
6%
10%
MULTIFAMILY
2020
INDUSTRIAL
2020
HOTEL
2020
OFFICE
2020
RETAIL
2020
◼ DECREASE◼ STAY THE SAME◼ INCREASE
EXPOSURE INTENT: 3–5 YEARS2021 / 2020 OUTLOOK COMPARISON
1%
1%
15%
2%
4%
40%
38%
56%
35%
51%
33%
10%
8%
6%
Core
Value-added
Opportunistic
CORE
◼ DECREASE SIGNIFICANTLY◼ DECREASE SOMEWHAT◼ STAY THE SAME
◼ INCREASE SOMEWHAT◼ INCREASE SIGNIFICANTLY
VALUE-ADD
OPPORTUNISTIC
US REAL ESTATEPORTFOLIO STRATEGY
CURRENT DISTRIBUTIONOF US PORTFOLIO
EXPECTED CHANGE:3–5 YEARS
15%
30%
51%
Value-add activity is set for greatest growth in the next few years (59% net increase), and core remains the prominent investment strategy, accounting for half of all portfolios. However, core investing has been steadily shrinking. In 2019, respondents described their portfolio as 60% core. In 2020, it was 56%, and this year, it is down to 51%. As 15% of respondents report an intention to decrease their core portfolio, it is likely that the trend will continue.
The enthusiasm for increased exposure in multifamily and industrial was already trending upwards in 2020 and continues apace for 2021, at 86% and 79%, respectively. Meanwhile, office and retail have continued to cool, based on social and technological trends accelerated by the pandemic, as investors broadcast intentions for decreased exposure.
Hotels and hospitality reflect the most dramatic year-to-year change for exposure intentions (25% planned increase as of March 2021, compared to 16% forecasted in 2020), perhaps reflecting investors' belief in the sector's recovery when leisure and business travel can resume.
06© 2021 AFIRE / www.afire.org

FOCUS ON US CITIESMore than six in ten respondents expect to increase their investment in tertiary cities in the next three to five years, rising to eight in ten for investment in secondary cities.
Non-US-based investors are more likely to foresee an increase in planned investment activity in primary cities in the next three to five years (39%), compared to US investors (30%). Additionally, US investors are more likely to expect greater investment in secondary cities (85%) and tertiary cities (79%), compared to non-US investors (75% and 57%, respectively).
Overall investor optimism is reflected by growing interest in secondary and tertiary US markets, though primary (gateway) markets still offer considerable stability.*
In thirty years of AFIRE surveys, no tertiary city has ever placed in the top three. Austin's ranking at the top of the list in 2021 therefore signals a significant shift in strategy towards secondary and tertiary markets.
30%
30%
29%
25%
21%
19%
19%
17%
12%
12%
12%
AUSTIN
BOSTON
DALLAS
ATLANTA
NEW YORK
LOS ANGELES
SEATTLE
SAN FRANCISCO
CHARLOTTE
DENVER
WASHINGTON, DC
TOP US CITIES FOR PLANNEDINVESTMENTS IN 2021
Austin, Boston, and Dallas—tertiary, primary, and secondary cities, respectively—are the top three US cities for planned investment in 2021. This is the first time a tertiary city has ever topped the AFIRE survey.
◼ PRIMARY◼ SECONDARY◼ TERTIARY
EXPOSURE IN US CITIES
INCREASE
AUSTIN 33% 23% --
BOSTON 24% 28% 13▲
DALLAS 24% 25% 12▲
LOS ANGELES 21% 29% 11▼
ATLANTA 20% 11% 12▲
SEATTLE 20% 26% 17▲
NEW YORK 53% 17% 11
CHICAGO 50% 25% 13▲
SAN FRANCISCO 36% 26% 15▲
WASHINGTON, DC 31% 17% 15▲
HOUSTON 11% 26% 17▲
LOS ANGELES 11% 28% 10▲
MIAMI 11% 26% 18▲
DECREASERANKED#1–#3
RANKED#1
2020RANKING
RANKED#1–#3
RANKED#1
2020RANKING
Around 90% of respondents intend to increase real estate exposure in US cities in the next three to five years (lower left), and 43% intend to decrease (lower right). Learn more on p. 10.
* AFIRE defines primary, secondary, and tertiary markets correspondent with general industry standards. Primary/gateway markets are large, dense, and long-established (pop. 5+ million). Secondary markets have less density and are slightly smaller (pop. 1–5 million), and tertiary markets are smaller (pop. ~1 million) but showcase steady job growth and are powered by traditional and alternative economic drivers.
07© 2021 AFIRE / www.afire.org

FOCUS ON US CITIES
EXPOSURE INTENTIONS IN US CITIES / FULL LIST
08© 2021 AFIRE / www.afire.org
1 1 1 NEW YORK3 2 2 CHICAGO2 3 3 SAN FRANCISCO4 3 4 WASHINGTON, DC6 5 5 HOUSTON5 6 5 LOS ANGELES
7 5 5 MIAMI— 8 6 BALTIMORE7 8 6 BOSTON— — 7 LAS VEGAS— — 7 PHILADELPHIA— 6 7 PORTLAND7 8 7 SEATTLE— — 7 ST. LOUIS
8 — 8 DALLAS— — 8 MINNEAPOLIS— — 8 ORLANDO— — 8 PHOENIX— — 8 RALEIGH— — 8 SACRAMENTO— — 8 SAN JOSE— — — OTHER
53%
50%
36%
31%
11%
11%
11%
8%
8%
6%
6%
6%
6%
6%
3%
3%
3%
3%
3%
3%
3%
6%
INCREASE
DECREASE
Respondents were asked to rank the cities/markets in which they plan to increase or decrease their real estate exposure. The rankings have remained generally consistent over the past three years, with a few exceptions, including Austin graduating from tenth place in 2020 to first in 2021.*
* Rankings from surveys in previous years asked respondents to rank global cities, while the 2021 survey focused only on US cities. For any US city that ranked in previous years, ordinal rankings have been updated to exclude non-US-city comparisons (for example, if New York, London, and Los Angeles were ranked 1-3, respectively, in a rank from 2019, New York and Los Angeles would be ranked 1 and 2, with London excluded.). Any US city without a ranking in a previous year means that the city did not register at the global scale.
8 10 1 AUSTIN2 2 2 BOSTON7 7 2 DALLAS4 1 3 LOS ANGELES5 7 4 ATLANTA2 4 4 SEATTLE
10 9 5 DENVER1 5 5 NEW YORK
10 9 6 PHOENIX10 11 7 CHARLOTTE3 3 8 SAN FRANCISCO6 6 9 WASHINGTON, DC— 11 10 NASHVILLE— 8 10 RALEIGH— 10 11 MIAMI— — 12 TAMPA
— — 13 CHICAGO— — 13 SAN JOSE— 12 14 HOUSTON9 12 14 SAN DIEGO— — 15 JACKSONVILLE— — 15 LAS VEGAS— 12 15 MINNEAPOLIS9 11 15 PORTLAND
— — 15 SAN ANTONIO
— OTHER
33%
24%
25%
21%
20%
20%
18%
18%
16%
15%
14%
13%
9%
9%
8%
6%
4%
4%
3%
3%
6%
2019 2020 2021 % RANK #1–#3
For OTHER, respondents indicated a variety of priorities, including those investors that track Open End Diversified Core Equity (ODCE) funds with exposure to coastal areas; investors that make decisions based on assets over geography; investors that focus on regions rather than cities; and other strategic approaches.
1%
1%
1%
1%
1%

CROSS-BORDER CAPITAL / INTENTIONS
5%
2%
3%
4%
1%
1%
4%
7%
2%
24%
29%
35%
38%
43%
49%
49%
52%
75%
51%
60%
50%
47%
43%
44%
42%
34%
21%
20%
9%
13%
11%
14%
7%
5%
7%
1%
ASIA-PAC (EXC. AUS/NZ)
EUROPE (EXC. UK)
CANADA
MIDDLE EAST
UNITED STATES
AUSTRALIA/NEW ZEALAND
LATIN AMERICA
UK
AFRICA
◼ DECREASE SIGNIFICANTLY◼ DECREASE SOMEWHAT◼ STAY THE SAME
◼ INCREASE SOMEWHAT◼ INCREASE SIGNIFICANTLY
FORECASTED CHANGE TO CAPITAL FLOWS INTO THE US / NEXT 3–5 YEARS NET
INCREASE
71%
69%
62%
57%
56%
50%
47%
41%
22%
79%
13%
7%
1%
76%
17%
6%
1%
◼ NET BUYER◼ NO CHANGE◼ NET SELLER
◼ OTHER
INTENTIONS FOR US REAL ESTATE INVESTMENT
5-10 YEARSCURRENT
Three in four respondents report intentions for a net inflow of capital for US real estate (lower left), with this positive trend set to continue over the next five to ten years (lower right).
Respondents were asked in what ways they expect capital flows to change over the next three to five years from key global regions.
Overall, investors foresee that the greatest increase of capital flows into the US over this period will come from Asia-Pac (71% net increase), Europe (69% net increase, excluding the UK), and Canada (62% net increase).
No significant decreases are expected, complementing optimism for continued investment into the US.
In 2020, 50% reported as net buyers, compared to 76% in 2021. Further, 88% of US-based investors cite net buyer, compared to 70% of non-US investors regarding current intentions.
09© 2021 AFIRE / www.afire.org

INVESTOR CONCERNS / BUSINESS CLIMATE
The 2020 AFIRE International Investor Survey collected responses from AFIRE members throughout December 2019 and was released in February 2020, just as the pandemic was entering its beginning stages.
This resulted in concerns that were ultimately and immediately out-of-date by the time they were released. While a year-to-year comparison of concerns from 2020 to 2021 isn’t quite straightforward as such, concerns about tax rates, economic growth, and interest rate fluctuations always top the list, regardless of the global business and health climate.
3%
8%
2%
6%
7%
10%
4%
5%
9%
9%
19%
32%
25%
35%
41%
41%
40%
32%
47%
50%
52%
44%
58%
46%
43%
41%
50%
57%
39%
38%
26%
17%
15%
14%
10%
9%
7%
6%
6%
3%
INCREASING TAX RATES
US ECONOMIC GROWTH
INTEREST RATE FLUCTUATION
CYBERSECURITY
SUDDEN CONSUMER DEMAND SHIFTS
COMPETITIVE TECHNOLGY ADVANTAGES
GLOBAL ECONOMIC GROWTH
INFLATION
CURRENCY VOLATILITY
DEGLOBALIZATION
◼ NOT AT ALL CONCERNED◼ NOT VERY CONCERNED◼ SOMEWHAT CONCERNED
◼ VERY CONCERNED
Beneath these top three concerns, however, an interesting story emerges consistent with other adjacent business concerns focused on cybersecurity (59% net concern), sudden shifts in consumer demand (53% net concern), and technological advantages leveraged by competitors in the same industry (50% net concern). Collectively, these concerns constitute elements of a larger technological shift already underway—and accelerated by the events of the past year.
HOW CONCERNED ARE YOU ABOUT THE IMPACT OF THE FOLLOWING FACTORS ON YOUR US REAL ESTATE ACTIVITY?
10© 2021 AFIRE / www.afire.org

INVESTOR CONCERNS / SOCIAL AND POLITICAL
1%
2%
5%
5%
4%
1%
6%
4%
7%
6%
5%
10%
8%
20%
22%
24%
26%
23%
28%
33%
25%
39%
35%
46%
45%
46%
57%
46%
52%
50%
55%
55%
48%
55%
40%
50%
44%
40%
42%
22%
31%
19%
20%
18%
16%
14%
16%
15%
10%
6%
6%
5%
EPIDEMICS/PANDEMICS
CLIMATE CHANGE
SUSTAINABILITY/NET ZERO
SOCIAL EQUITY/INEQUALITY
ECONOMIC INEQUALITY
HOUSING AFFORDABILITY
RACIAL EQUITY
GROWTH OF EXTREMISM
POLITICAL INSTABILITY (US)
POLITICAL INSTABILITY (INTERNATIONAL)
POTENTIAL THREAT OF TERRORISM
CONFLICTING STANDARDS*
ZONING
NET CONCERN
79%
76%
71%
69%
73%
71%
61%
71%
54%
59%
50%
46%
47%
PUBLIC HEALTH
ENVIRONMENT
SOCIETY
GEOPOLITICS
REGULATION
HOW CONCERNED ARE YOU ABOUT THE IMPACT OF THE FOLLOWING FACTORS ON YOUR US REAL ESTATE ACTIVITY IN 2021?
As expected, public health issues (79% net concern) top the list of investors’ social and political concerns for US real estate activity in 2021. Even as the vaccine is rolled out in the US, vaccine hesitancy alongside pandemic flare-ups in other countries and territories continue to impact travel and trade, and vaccine hesitancy remains an impediment to getting the pandemic fully under control.
◼ NOT AT ALL CONCERNED◼ NOT VERY CONCERNED◼ SOMEWHAT CONCERNED
◼ VERY CONCERNED
After public health, climate change is the most urgent issue (76% net concern) and is the highest ranked in terms of extreme concern (31%) by nearly ten percentage points. Sustainability and net zero imperatives, housing affordability, and the growth of extremism all share the third spot for net concern (71%), indicating that environmental, social, and political issues are top-of-mind.
11© 2021 AFIRE / www.afire.org
* e.g., ethical, financial, accounting, legal, regulatory, and other standards

3%
2%
6%
4%
4%
4%
10%
11%
21%
15%
2%
15%
9%
10%
14%
18%
41%
24%
31%
35%
43%
50%
50%
60%
20%
61%
49%
58%
53%
51%
47%
54%
50%
47%
37%
33%
27%
21%
59%
23%
35%
25%
30%
29%
7%
18%
16%
15%
11%
6%
3%
4%
19%
1%
8%
7%
DIMINISHING OFFICE DEMAND
CHANGES IN TENANT DEMAND
REVERSE URBANIZATION
CHANGES IN ASSET PRICING
AVAILABILITY OF SUITABLE ASSETS/LAND
ASSET OBSOLESCENCE
RENT COLLECTION
COMPETING RISK-ADJUSTED RETURNS OUTSIDE US
AVAILABILITY OF (RE)FINANCE
COVENANT AND LOAN SERVICING ISSUES
CONSTRUCTION COSTS
PAUSES IN NEW CONSTRUCTION
FIRPTA REGULATION
CFIUS REGULATION
INVESTOR CONCERNS / REAL ESTATE
83%
80%
53%
72%
65%
61%
48%
30%
25%
78%
24%
43%
32%
DEMOGRAPHICS
ASSETS
FINANCING
REGULATION
39%
CONSTRUCTION
NET CONCERN
◼ NOT AT ALL CONCERNED◼ NOT VERY CONCERNED◼ SOMEWHAT CONCERNED
◼ VERY CONCERNED
HOW CONCERNED ARE YOU ABOUT THE IMPACT OF THE FOLLOWING FACTORS ON YOUR US REAL ESTATE ACTIVITY IN 2021?
For understanding the future of real estate investment, the adage about location certainly matters, but demographics are destiny. Investor concerns specific to real estate rank demographic factors related to changes in office and tenant demand as the areas of most concern (83% and 80%, respectively).
Concerns about asset pricing (72% net concern) and construction costs (78% net concern) also rank high on the list. And despite some of the economic uncertainties that mounted as a result of the pandemic, financing concerns appear low among respondents, which implies that distress sales will remain minimal.
12© 2021 AFIRE / www.afire.org

27%
54%
9%
6%
4%
69%
24%
4%
1%
2%
VERY IMPORTANT
SOMEWHAT IMPORTANT
NEITHER/NOR
SOMEWHAT UNIMPORTANT
NOT AT ALL IMPORTANT
INVESTOR CONCERNS / ESG
31%
62%
7% NEW INVESTMENTS MUST EXPLICITLY MEET CERTAIN ESG REQUIREMENTS
ESG CRITERIA ARE IMPORTANT FACTORS, BUT NOT REQUIRED FOR NEW INVESTMENTS
ESG CRITERIA ARE NOT IMPORTANT FACTORS FOR NEW INVESTMENTS
ESG POLICY RELATED TO INVESTMENT CRITERIA
IMPORTANCE OFESG CRITERIA
44%
37%
24%
24%
17%
3%
1%
22%
17%
14%
14%
38%
16%
6%
3%
5%
GREEN BUILDING CERTIFICATION
SUSTAINABLE CONSTRUCTION & OPERATIONS
NET ZERO
SUSCEPTIBILITY TO EXTREME WEATHER EVENTS
RISING SEA/WATER LEVELS
WATER SHORTAGE/DROUGHT
WASTE MANAGEMENT
FUTURE OF WORK/JOB LOCATION SHIFTS
LOCAL ECONOMIC AND SOCIAL IMPACT
HEALTH AND SAFETY
LOCAL COMMUNITY ENGAGEMENT
COMPLIANCE WITH ESG REGULATION
LONG-TERM INSURABILITY
FISCAL CAPACITY OF PROPERTY JURISDICTION
OTHER
NONE OF THE ABOVE
RANKED IMPORTANCEOF ESG CRITERIA
ENVIRONMENT
SOCIAL
GOVERNANCE
(Includes GRESB, Green Star Status, etc.)
16% NET ZERO
15% GREEN BUILDINGCERTIFICATION
14% SUSTAINABLECONSTRUCTION
14% COMPLIANCEW/ ESG REGULATION
RANKED #1–#3 % RANK #1
In 2020, nearly nine out of ten investors included ESG criteria for investment decisions, and 90% of respondents received the same or higher returns when accounting for ESG criteria. The data for 2021 suggest that ESG policies are more important than ever, with nearly a third of respondents (31%) indicating that new investments must explicitly meet certain ESG criteria.
Of these criteria, net zero (16%), green building certification (15%), sustainable construction (14%), and regulatory compliance (14%) rank as the most important ESG factors. Further, the overall importance of ESG criteria is forecasted to grow exponentially over the next three to five years, with 93% forecasting a growth in overall importance.
◼ CURRENTLY◼ 3–5 YEARS
13© 2021 AFIRE / www.afire.org
INVESTOR CONCERNS / ESG
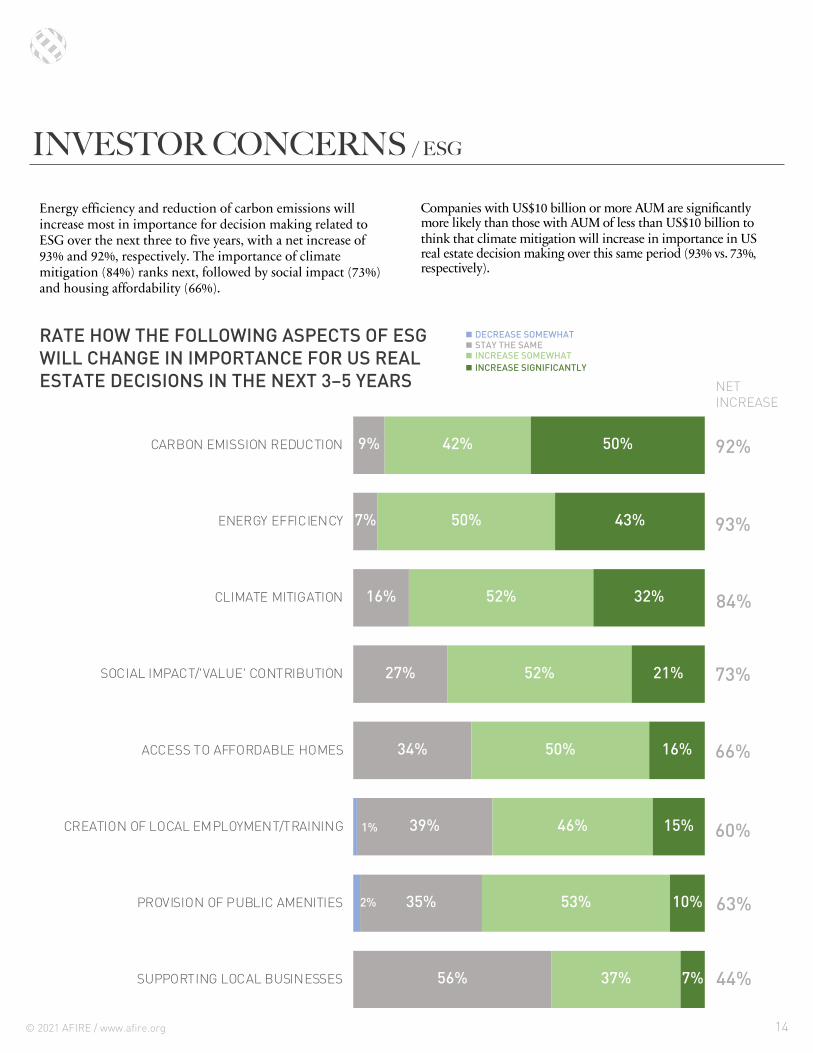
Energy efficiency and reduction of carbon emissions will increase most in importance for decision making related to ESG over the next three to five years, with a net increase of 93% and 92%, respectively. The importance of climate mitigation (84%) ranks next, followed by social impact (73%) and housing affordability (66%).
1%
2%
9%
7%
16%
27%
34%
39%
35%
56%
42%
50%
52%
52%
50%
46%
53%
37%
50%
43%
32%
21%
16%
15%
10%
7%
CARBON EMISSION REDUCTION
ENERGY EFFICIENCY
CLIMATE MITIGATION
SOCIAL IMPACT/'VALUE' CONTRIBUTION
ACCESS TO AFFORDABLE HOMES
CREATION OF LOCAL EMPLOYMENT/TRAINING
PROVISION OF PUBLIC AMENITIES
SUPPORTING LOCAL BUSINESSES
92%
93%
84%
73%
66%
60%
63%
44%
◼ DECREASE SOMEWHAT◼ STAY THE SAME◼ INCREASE SOMEWHAT
◼ INCREASE SIGNIFICANTLY
NET INCREASE
RATE HOW THE FOLLOWING ASPECTS OF ESG WILL CHANGE IN IMPORTANCE FOR US REAL ESTATE DECISIONS IN THE NEXT 3–5 YEARS
Companies with US$10 billion or more AUM are significantly more likely than those with AUM of less than US$10 billion to think that climate mitigation will increase in importance in US real estate decision making over this same period (93% vs. 73%, respectively).
14© 2021 AFIRE / www.afire.org

ABOUT OUR UNDERWRITERFounded in 2000, Holland Partner Group (HPG) based in Vancouver, Washington, is a fully integrated real estate investment company. HPG principals’ development and acquisition volume exceeds US$15 billion, representing 50,000 apartment homes located in the Western United States’ most sought after markets.
Our company accomplishes our investment objectives in strategic alignment with our capital partners through our five integrated operating companies, including development, construction, acquisition, redevelopment, and property management.
Our vertically integrated focus has developed the real estate industry’s most consistent and reliable delivery platforms. Our combined business volume is expected to exceed US$2 billion annually through our 750-member team..
To learn more, visit hollandpartnergroup.com.
ACKNOWLEDGEMENTS
15
This report was made possible by the hard work of the AFIRE Research Committee, AFIRE Future Committee, and AFIRE staff, including Lexie Miller, COO; Asmait Tewelde, Meeting Director; and Benjamin van Loon, Communications Director.AFIRE offers an extended thank-you to the research team at PwC LLP—Amanda O’Hara, Gillian Kane, Jenny O'Hara, Paul Irwin, Jie Jiang, and Matt Eastgate—for data collection and exploration.
© 2021 AFIRE / www.afire.org
AFIRE RESEARCH COMMITTEE
Will McIntosh, PhDAFIRE Executive CommitteeChair, AFIRE Research CommitteeGlobal Head of Research, USAA Real Estate
Zeb BradfordChief Investment Officer, Metzler Real Estate
R. Byron Carlock, Jr.AFIRE Executive CommitteeUS Real Estate Practice Leader, PwC
Peter Grey-WolfAFIRE Board of DirectorsVice President, Wealthcap Management
Clyde HollandChair, AFIRE Future Trends CommitteeCEO and Chairman, Holland Partner Group
David RollAFIRE Board of DirectorsPortfolio Manager, Norges Bank Investment Management

ABOUT AFIREAFIRE is the association for international real estate investors focused on commercial property in the United States.
Headquartered in Washington, DC, and established in 1988 as an essential forum for real estate investment thought leadership, AFIRE members gather throughout the year to help each other become Better Investors, Better Leaders, and Better Global Citizens through conversations, research, and analysis of real estate capital markets, cross-border issues, policy, economics, technology, and management.
Dialogue fostered by AFIRE is designed to help members gain insights through strategic and operational thought leadership, and to help improve the global real estate investment industry.
To learn more, visit afire.org.
Ronald Reagan Building1300 Pennsylvania Ave NW#190-630Washington, DC 20004
MEMBERSHIPLexie Miller, [email protected] | +1 202 312 1403
EVENTS AND SPONSORSHIPSAsmait Tewelde, Meeting [email protected] | +1 202 312 1404
MARKETING AND COMMUNICATIONSBen van Loon, Communications [email protected] | +1 202 312 1404
/COMPANY/AFIRE
@AFIREGLOBAL
/AFIREGLOBAL
16© 2021 AFIRE / www.afire.org