Retail Investor Survey 2005
27
Retail Investor Survey 2005 Hong Kong March 2006
Transcript of Retail Investor Survey 2005

Retail Investor Survey 2005
Hong Kong March 2006
C O N T E N T S
1. Executive Summary 1
2. Retail Participation in Different Investment Products 5
3. Demographic Profile of Retail, Potential and Non-Investors 6
4. Investment Behaviour of Stock Investors 8 Dealing Channels 8 Types of Stock Accounts 8 On-line Trading 10 IPO Investing 11
5. Engagement of Investment Advisers (IAs) 12 Demographic Profile of Users of Investment Advisory Services 12 Types of Investment Advisers Used 12
6. Financial Understanding of Retail Investors 14 Overall Analysis 14 Analysis by Demographic Variables 16 Analysis by Products Invested 17 Analysis by Awareness of the SFC’s Educator Role 19
7. Views on the SFC’s Investor Education Work 20 Awareness of the SFC’s Educator Role 20 Awareness and Usefulness of the SFC’s Investor Education Work 20 Investor Education by the Securities Industry 21 Preferred Investor Education Activities 21
8. Worries of Non-investors and Potential Investors 23
Annex Survey Design 25
1
1. Executive Summary In September to November 2005, the Securities and Futures Commission (SFC) engaged the Centre for Corporate Governance and Financial Policy of the Hong Kong Baptist University to estimate the retail participation in different investment products 1 and explore the investment behavior of retail investors2 in Hong Kong, particularly that of stock investors. The study also attempted to find out what deterred non-investors3 from investing and factors that might prompt some of them (potential investors4) to invest in the coming six months, ascertain the level of financial understanding of retail investors, and gauge retail and potential investors’ views of the SFC’s investor education work. Retail participation in different investment products • Over the past two years, 36.8% of Hong Kong adults traded investment products. The
most popular investments were Hong Kong stocks (28.3%), followed by managed funds (excluding Mandatory Provident Funds (“MPF”) investments) (18.1%), plain vanilla bonds (4.9%), warrants traded on the Stock Exchange of Hong Kong (“SEHK”) (4.7%), stocks traded in Mainland or foreign markets (4.1%), structured products (e.g. equity/credit-linked notes) (2.8%), other derivatives traded on the SEHK or the Hong Kong Futures Exchange (1.5%) and leveraged foreign exchange contracts (excluding foreign currency deposits) (1.2%).
Demographic profile of retail, potential and non-investors • In the sample, 56.5% of retail investors were female; 58.3% were aged 30-49; 34.3%
were degree holders or above and 30.3% were upper secondary school graduates. • Of the potential investors identified, there was an almost even split between the two
gender (51.1% female). 68.9% of them were aged 18-39 and 49.3% were degree holders or above.
1 Investment products include stocks, warrants and options traded on the Stock Exchange of Hong Kong, stocks
traded in Mainland or other foreign markets, managed funds (excluding MPF investments), plain vanilla bonds, structured products (e.g. equity/credit-linked notes), options and futures traded on the Hong Kong Futures Exchange and leveraged foreign exchange contracts (excluding foreign currency deposits).
2 Retail investors are defined as adults aged 18 or above who had traded one or more investment products in the
previous two years. 3 Non-investors are defined as adults aged 18 or above who had not traded any investment products in the
previous two years. 4 Potential investors refer to adults aged 18 or above who had not traded any investment products but indicated
that they would trade one or more investment products in the coming six months.
2
• Of the non-investors interviewed, 59.4% were female, 31.2% and 22.7% were aged 18-29 and 40-49 respectively. 30.1% of them were upper secondary school graduates (30.1%).
Investment behavior of stock investors5 • The majority of stock investors traded Hong Kong stocks only (86%). Only a very few
of them invested in Mainland or foreign stocks (2.4%). 11.6% of stock investors traded Hong Kong and other stocks.
• 59.4% of stock investors had traded through banks only, 27.2% used brokerages only, and
13.4% used both. • 93.5% of stock investors used cash accounts only, 1.6% used margin accounts only, and
4.9% used both cash and margin accounts6. • 28.3% of stock investors had traded stocks on-line in the past two years. Male or
younger or more educated investors were more likely to conduct on-line trading. • 71.7% of stock investors had subscribed for shares in initial public offerings (IPOs).
Among them, only 7.8 % had subscribed for IPO shares on margin. Engagement of investment advisers (IAs) • 7.0% of Hong Kong adults or 19.2% of retail investors had used the services of
investment advisers7 during the last two years. Middle-aged (aged 30-49) or more educated retail investors had a higher propensity to use IA services.
• Personal financial consultants (advisers/planners) from banks (60.5% of IA users) were
the most popular type of IAs used by retail investors, followed by representatives of SFC-licensed investment advisory firms or financial planning firms (15.8%).
5 Stock investors refer to retail investors who had invested in Hong Kong, Mainland or foreign stocks in the
previous two years. 6 Cash accounts refer to those accounts which require holders to settle transaction on a cash basis on a specified
date. Margin accounts allow holders to borrow money from an intermediary to buy securities. 7 Investment advisers (IAs) refer to those who sell or provide advice on investment products (such as managed
funds, structured products and investment-linked assurance schemes but excluding general life insurance policies, term and foreign currency deposits, mortgages and personal loans). However, stockbrokers and those who merely distribute product leaflets for client information at banks are not considered as IAs in this survey.
3
Financial understanding of retail investors • Seven multiple-choice questions relating to awareness of investors’ rights to vote when
the shares are not registered in their names; understanding of their entitlement to stock dividends; factors affecting the prices of warrants and bonds; how to enjoy the capital guarantee of a guaranteed fund; and possible returns from holding an equity-linked deposit (ELD) were used to measure retail investors’ financial understanding. Only 3.8% of retail investors could answer all the seven questions correctly. On average, the score was 3.39 out of 7. The correct rate per question ranged from 40.4% in the question about ELD to 53.2% in the question about voting rights.
• Male or younger respondents scored better. Respondents performed better in the
questions related to an investment product that they had invested in before. Besides, those who were aware of the SFC’s educator role could give a larger number of correct answers.
Views on the SFC’s investor education work • 42.1% of retail and potential investors were aware of the SFC’s educator role. • The Alert List and press releases to remind investors to watch out for scams (46%),
television programmes (42.8%) and newspaper columns (35.3%) were the top three most remembered SFC’s investor education work by retail and potential investors. In terms of usefulness, the Alert List and press releases on scams (86.3%) got the highest rating, followed by the InvestEd website8 (73%) and radio segments (72.9%).
• 91.9% of retail and potential investors strongly agreed or agreed that the securities
industry should be doing more to educate the public about how to make informed investment decisions.
• Retail and potential investors liked television programmes (73.6%), investor
stories/articles/Q&As in newspapers (46.6%), radio segments (45.1%) most as the means to receive investor education messages.
8 The InvestEd website, the investor education portal operated by the SFC, was known as the Electronic
Investor Resources Centre (eIRC) when the survey was carried out.

4
Worries of non-investors and potential investors • 36.8% of non-investors had not invested in the last two years because they had no
investment knowledge even if they had money. 4.1% of them (potential investors) would invest in the coming six months, particularly in Hong Kong stocks (52.6%), managed funds (excluding MPF investments) (36.3%) and plain vanilla bonds (11.1%). They planned to start investment mainly because they had more money for investment (33.3%) and were aware of the importance of financial planning (28.9%).
5
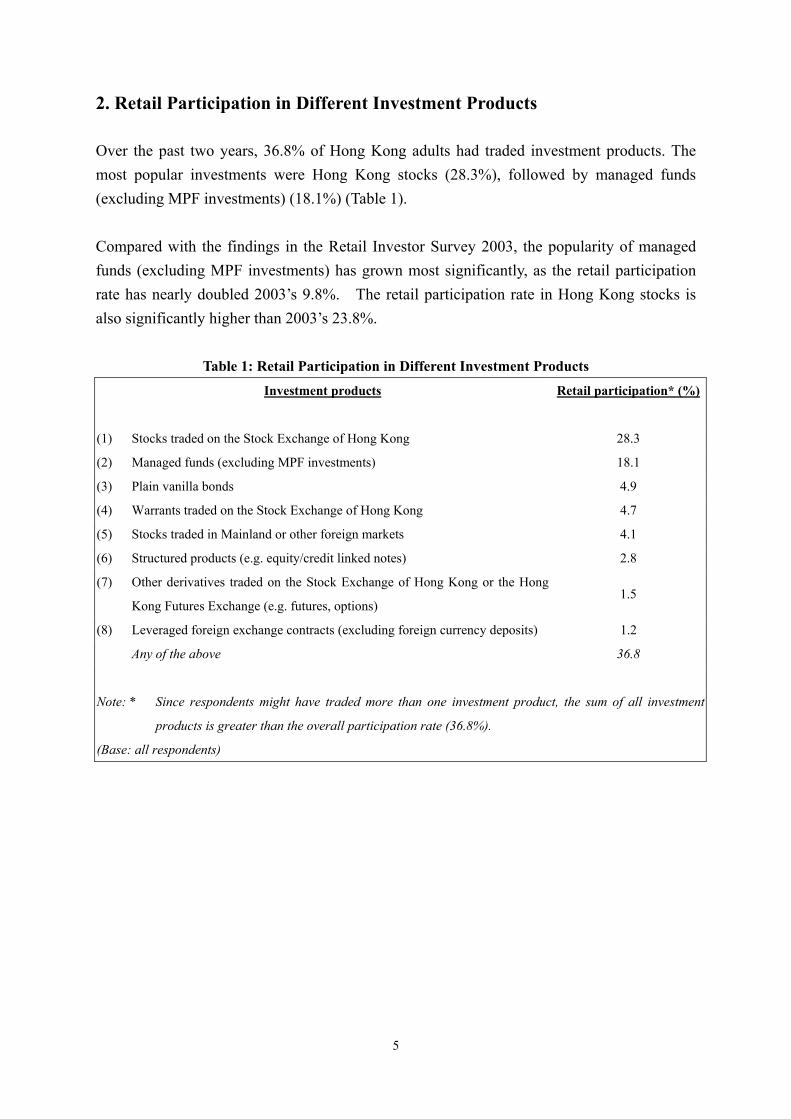
2. Retail Participation in Different Investment Products Over the past two years, 36.8% of Hong Kong adults had traded investment products. The most popular investments were Hong Kong stocks (28.3%), followed by managed funds (excluding MPF investments) (18.1%) (Table 1). Compared with the findings in the Retail Investor Survey 2003, the popularity of managed funds (excluding MPF investments) has grown most significantly, as the retail participation rate has nearly doubled 2003’s 9.8%. The retail participation rate in Hong Kong stocks is also significantly higher than 2003’s 23.8%.
Table 1: Retail Participation in Different Investment Products
Investment products Retail participation* (%)
(1) Stocks traded on the Stock Exchange of Hong Kong 28.3
(2) Managed funds (excluding MPF investments) 18.1
(3) Plain vanilla bonds 4.9
(4) Warrants traded on the Stock Exchange of Hong Kong 4.7
(5) Stocks traded in Mainland or other foreign markets 4.1
(6) Structured products (e.g. equity/credit linked notes) 2.8
(7) Other derivatives traded on the Stock Exchange of Hong Kong or the Hong
Kong Futures Exchange (e.g. futures, options) 1.5
(8) Leveraged foreign exchange contracts (excluding foreign currency deposits) 1.2
Any of the above 36.8
Note: * Since respondents might have traded more than one investment product, the sum of all investment
products is greater than the overall participation rate (36.8%).
(Base: all respondents)
6
3. Demographic Profile of Retail, Potential and Non-Investors Retail Investors Of the retail investors interviewed, 56.5% were female. 58.3% of them were aged 30-49. 34.3% were degree holders or above and 30.3% were upper secondary school graduates. Further analyses were conducted to identify demographic differences in the retail investors who had invested in different investment products in the past two years: • Significantly more male investors participated in trading leveraged foreign exchange
contracts (62.5%), derivatives (70.1%) and warrants (56.9%). • A higher proportion of retail investors who had invested in Mainland or foreign stocks
(50%), structured products (43.8%) and leveraged foreign exchange contracts (54.7%) were degree holders or above.
Potential Investors In the sample of potential investors, 51.1% were female; 68.9% were aged 18-39; 49.3% were degree holders or above. Non-Investors In the sample of non-investors, 59.4% were female. 31.2% and 22.7% were aged 18-29 and 40-49 respectively. 30.1% were upper secondary school graduates.
7
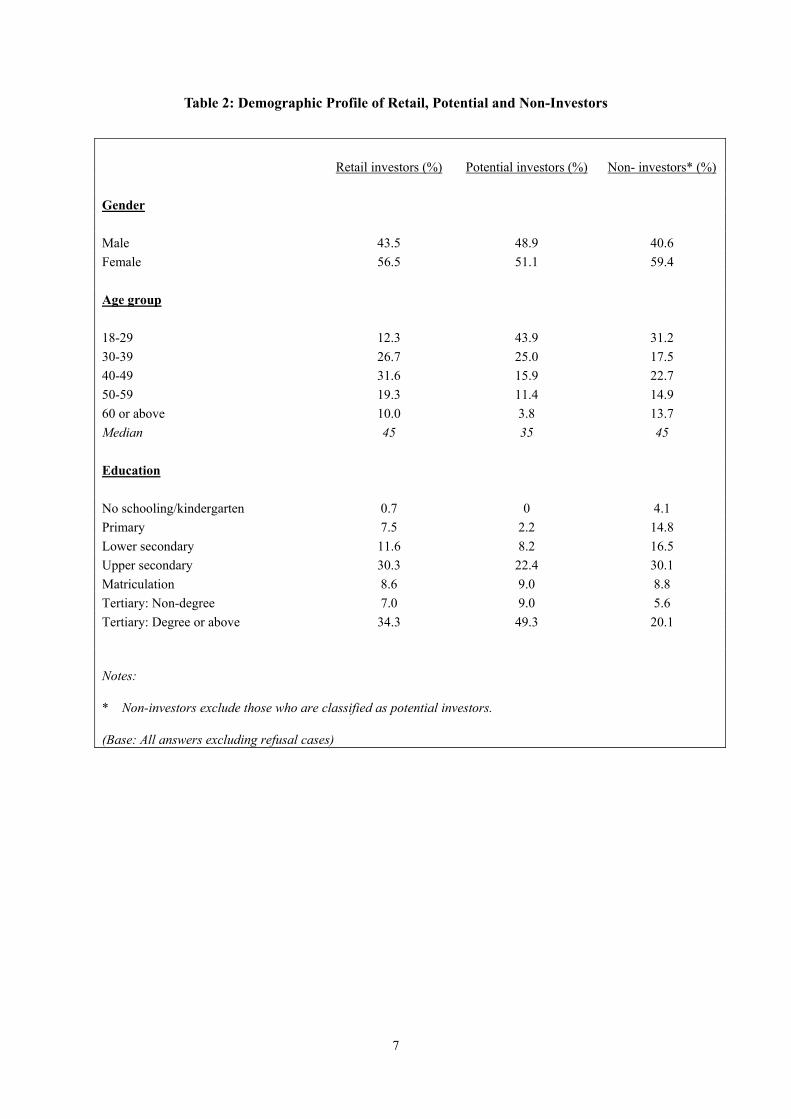
Table 2: Demographic Profile of Retail, Potential and Non-Investors
Retail investors (%) Potential investors (%) Non- investors* (%) Gender Male 43.5 48.9 40.6 Female 56.5 51.1 59.4 Age group 18-29 12.3 43.9 31.2 30-39 26.7 25.0 17.5 40-49 31.6 15.9 22.7 50-59 19.3 11.4 14.9 60 or above 10.0 3.8 13.7 Median 45 35 45 Education No schooling/kindergarten 0.7 0 4.1 Primary 7.5 2.2 14.8 Lower secondary 11.6 8.2 16.5 Upper secondary 30.3 22.4 30.1 Matriculation 8.6 9.0 8.8 Tertiary: Non-degree 7.0 9.0 5.6 Tertiary: Degree or above 34.3 49.3 20.1 Notes: * Non-investors exclude those who are classified as potential investors. (Base: All answers excluding refusal cases)

8
4. Investment Behaviour of Stock Investors Stock investors mainly invested in Hong Kong stocks. 86% of them only had Hong Kong stocks in their stock portfolios while 2.4% only owned stocks traded in Mainland or other foreign markets. 11.6% of stock investors invested in Hong Kong and other stocks. Dealing Channels 59.4% of stock investors had traded through banks only, 27.2% through brokerages only, and the remaining 13.4% used both brokerages and banks (Figure 1).
Figure 1: Types of Intermediaries Used by Stock Investors to Trade Stocks
Both brokeragesand banks
13.4%
Banks only59.4%
Brokerages only27.2%
(Base: all stock investors)
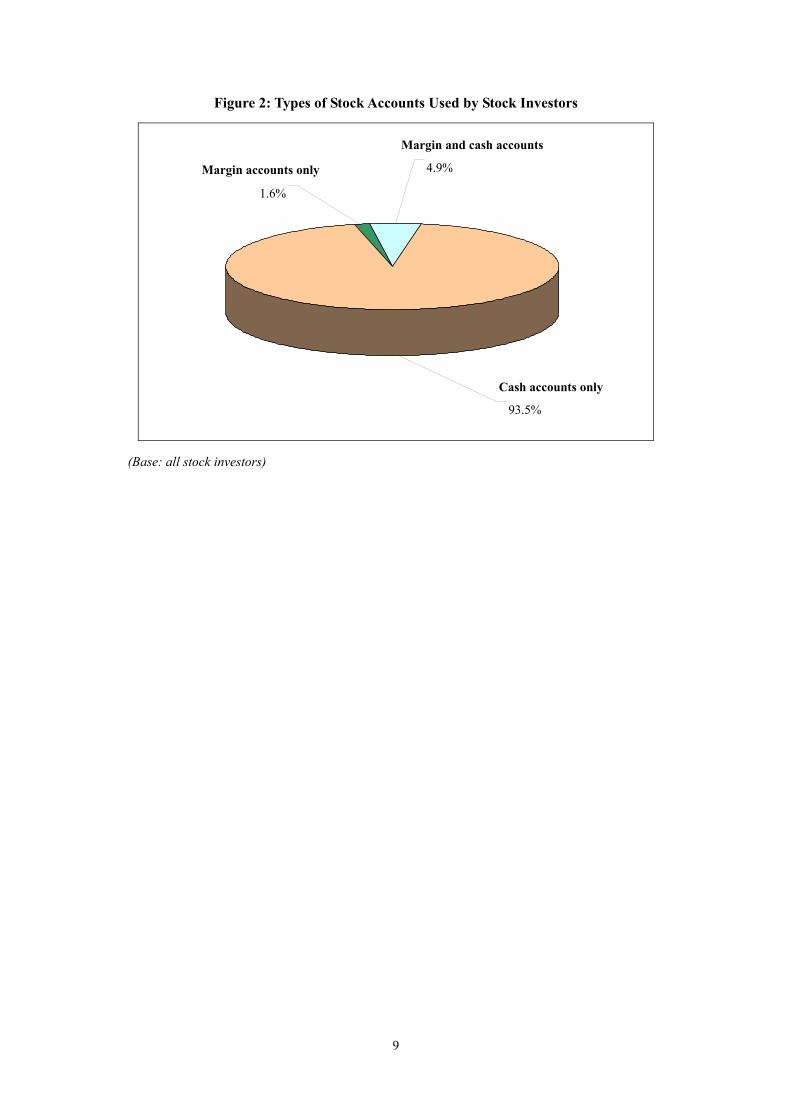
Types of Stock Accounts 93.5% of stock investors had cash accounts only, 1.6% used margin accounts only, and 4.9% used both cash and margin accounts (Figure 2). When compared with those using cash accounts only, a higher proportion of stock investors using both cash and margin accounts were male (60.8% vs. Cash accounts only: 43.7%) and degree holders or above (56.2% vs. Cash accounts only: 33.2%).
9
Figure 2: Types of Stock Accounts Used by Stock Investors
93.5%
1.6%
4.9%Margin accounts only
Cash accounts only
Margin and cash accounts
(Base: all stock investors)
10
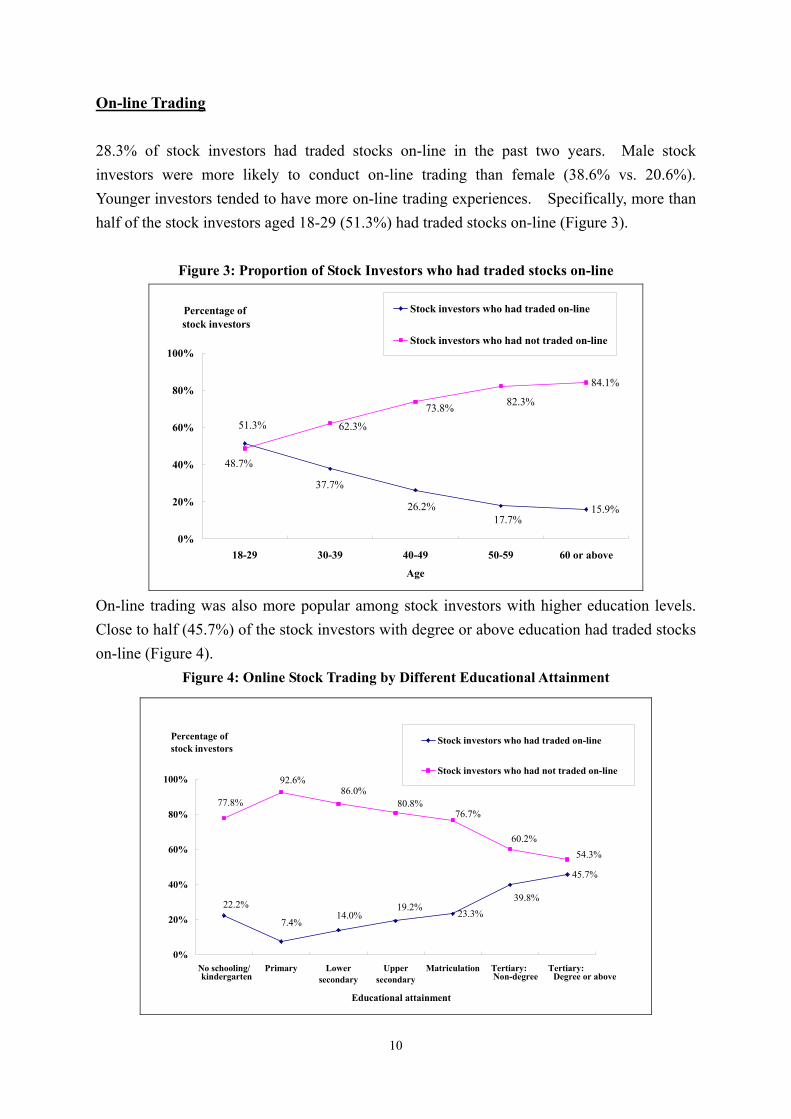
On-line Trading 28.3% of stock investors had traded stocks on-line in the past two years. Male stock investors were more likely to conduct on-line trading than female (38.6% vs. 20.6%). Younger investors tended to have more on-line trading experiences. Specifically, more than half of the stock investors aged 18-29 (51.3%) had traded stocks on-line (Figure 3).
Figure 3: Proportion of Stock Investors who had traded stocks on-line
15.9%
84.1%
51.3%
37.7%
26.2%17.7%
82.3%73.8%
62.3%
48.7%
0%
20%
40%
60%
80%
100%
18-29 30-39 40-49 50-59 60 or above
Age
Percentage of stock investors
Stock investors who had traded on-line
Stock investors who had not traded on-line
On-line trading was also more popular among stock investors with higher education levels. Close to half (45.7%) of the stock investors with degree or above education had traded stocks on-line (Figure 4).
Figure 4: Online Stock Trading by Different Educational Attainment
23.3%
45.7%
22.2%
7.4%14.0%
19.2%39.8%
54.3%
77.8%
92.6%86.0%
80.8%76.7%
60.2%
0%
20%
40%
60%
80%
100%
No schooling/ Primary Lowersecondary
Uppersecondary
Matriculation Tertiary: Tertiary:
Educational attainment
Percentage of stock investors
Stock investors who had traded on-line
Stock investors who had not traded on-line
Non-degree Degree or abovekindergarten
11
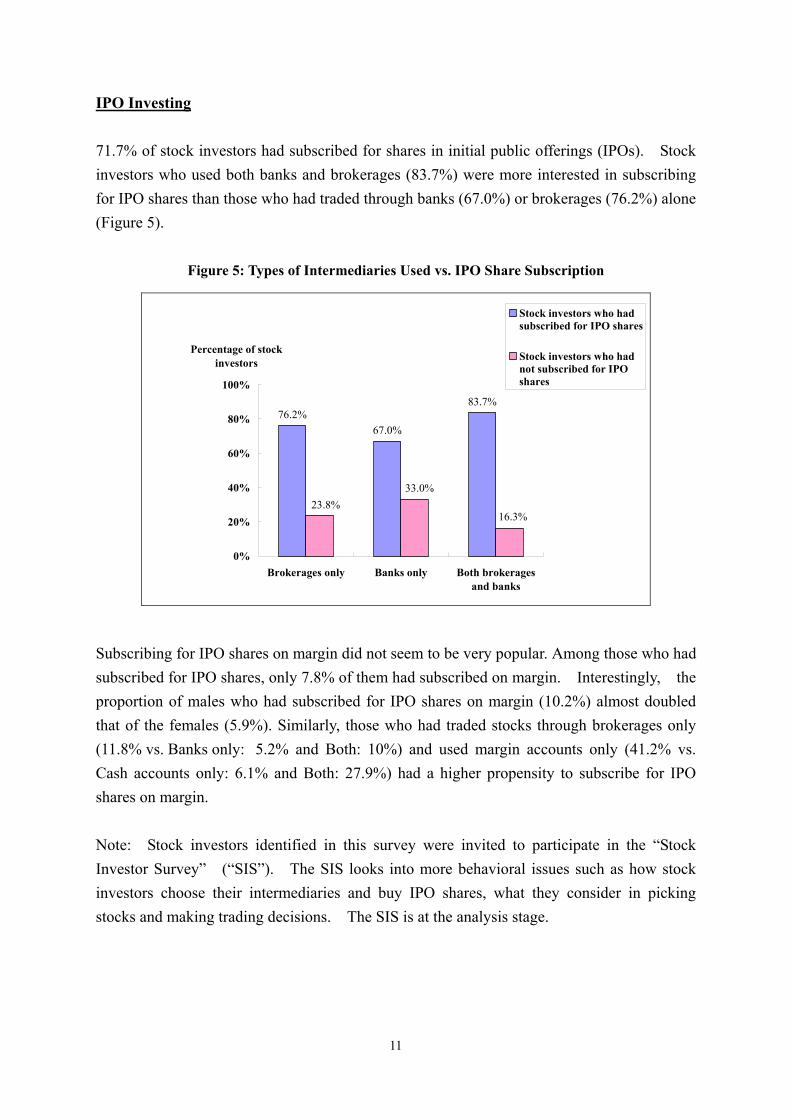
IPO Investing 71.7% of stock investors had subscribed for shares in initial public offerings (IPOs). Stock investors who used both banks and brokerages (83.7%) were more interested in subscribing for IPO shares than those who had traded through banks (67.0%) or brokerages (76.2%) alone (Figure 5).
Figure 5: Types of Intermediaries Used vs. IPO Share Subscription
76.2%67.0%
83.7%
16.3%
33.0%23.8%
0%
20%
40%
60%
80%
100%
Brokerages only Banks only Both brokeragesand banks
Percentage of stockinvestors
Stock investors who hadsubscribed for IPO shares
Stock investors who hadnot subscribed for IPOshares
Subscribing for IPO shares on margin did not seem to be very popular. Among those who had subscribed for IPO shares, only 7.8% of them had subscribed on margin. Interestingly, the proportion of males who had subscribed for IPO shares on margin (10.2%) almost doubled that of the females (5.9%). Similarly, those who had traded stocks through brokerages only (11.8% vs. Banks only: 5.2% and Both: 10%) and used margin accounts only (41.2% vs. Cash accounts only: 6.1% and Both: 27.9%) had a higher propensity to subscribe for IPO shares on margin.
Note: Stock investors identified in this survey were invited to participate in the “Stock Investor Survey” (“SIS”). The SIS looks into more behavioral issues such as how stock investors choose their intermediaries and buy IPO shares, what they consider in picking stocks and making trading decisions. The SIS is at the analysis stage.
12
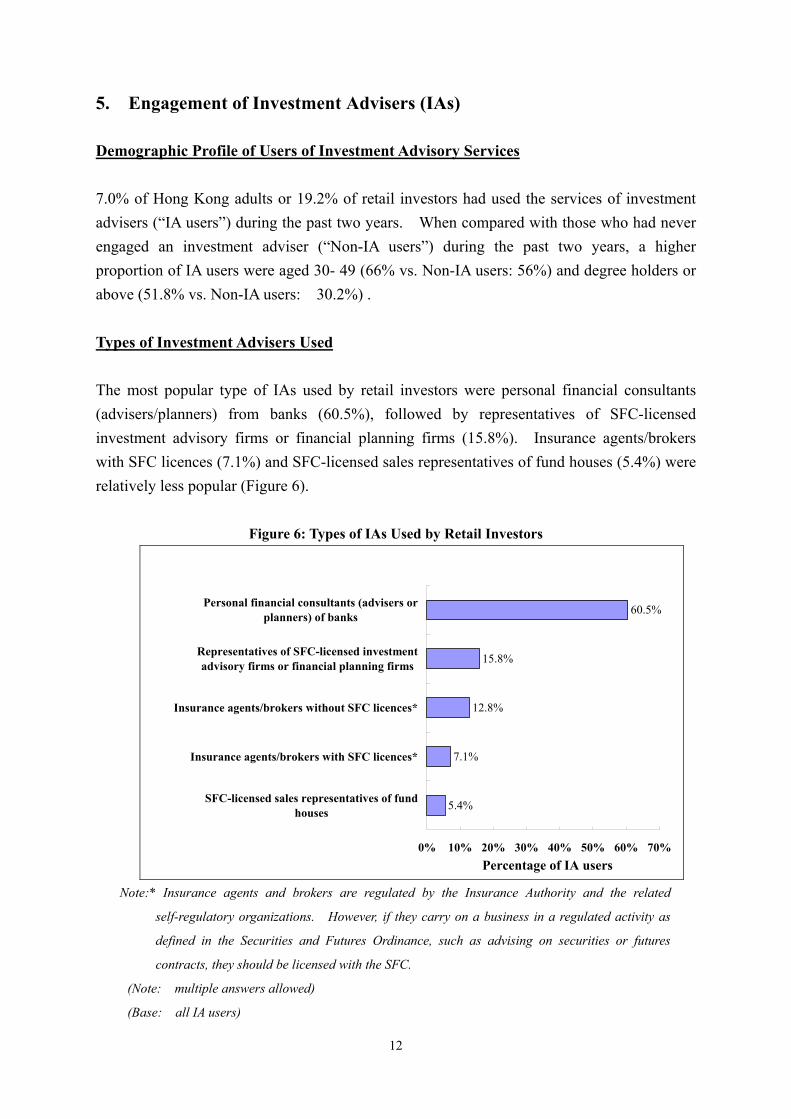
5. Engagement of Investment Advisers (IAs) Demographic Profile of Users of Investment Advisory Services 7.0% of Hong Kong adults or 19.2% of retail investors had used the services of investment advisers (“IA users”) during the past two years. When compared with those who had never engaged an investment adviser (“Non-IA users”) during the past two years, a higher proportion of IA users were aged 30- 49 (66% vs. Non-IA users: 56%) and degree holders or above (51.8% vs. Non-IA users: 30.2%) . Types of Investment Advisers Used The most popular type of IAs used by retail investors were personal financial consultants (advisers/planners) from banks (60.5%), followed by representatives of SFC-licensed investment advisory firms or financial planning firms (15.8%). Insurance agents/brokers with SFC licences (7.1%) and SFC-licensed sales representatives of fund houses (5.4%) were relatively less popular (Figure 6).
Figure 6: Types of IAs Used by Retail Investors
5.4%
7.1%
12.8%
15.8%
60.5%
0% 10% 20% 30% 40% 50% 60% 70%
SFC-licensed sales representatives of fundhouses
Insurance agents/brokers with SFC licences*
Insurance agents/brokers without SFC licences*
Representatives of SFC-licensed investmentadvisory firms or financial planning firms
Personal financial consultants (advisers orplanners) of banks
Percentage of IA users
Note:* Insurance agents and brokers are regulated by the Insurance Authority and the related
self-regulatory organizations. However, if they carry on a business in a regulated activity as
defined in the Securities and Futures Ordinance, such as advising on securities or futures
contracts, they should be licensed with the SFC.
(Note: multiple answers allowed)
(Base: all IA users)

13
Note: IA users identified in this survey were invited to participate in the “Survey on Engagement of Investment Advisers” (“SEIA”). Through face-to-face interviews, the SEIA aims to explore investors’ considerations in choosing IAs and their senses of consumer responsibilities, information investors relied on to make investment decisions and their product choices, whether the IAs fulfilled their obligations during the advising process and quality of post-sale services. Its fieldwork is in progress.
14
6. Financial Understanding of Retail Investors
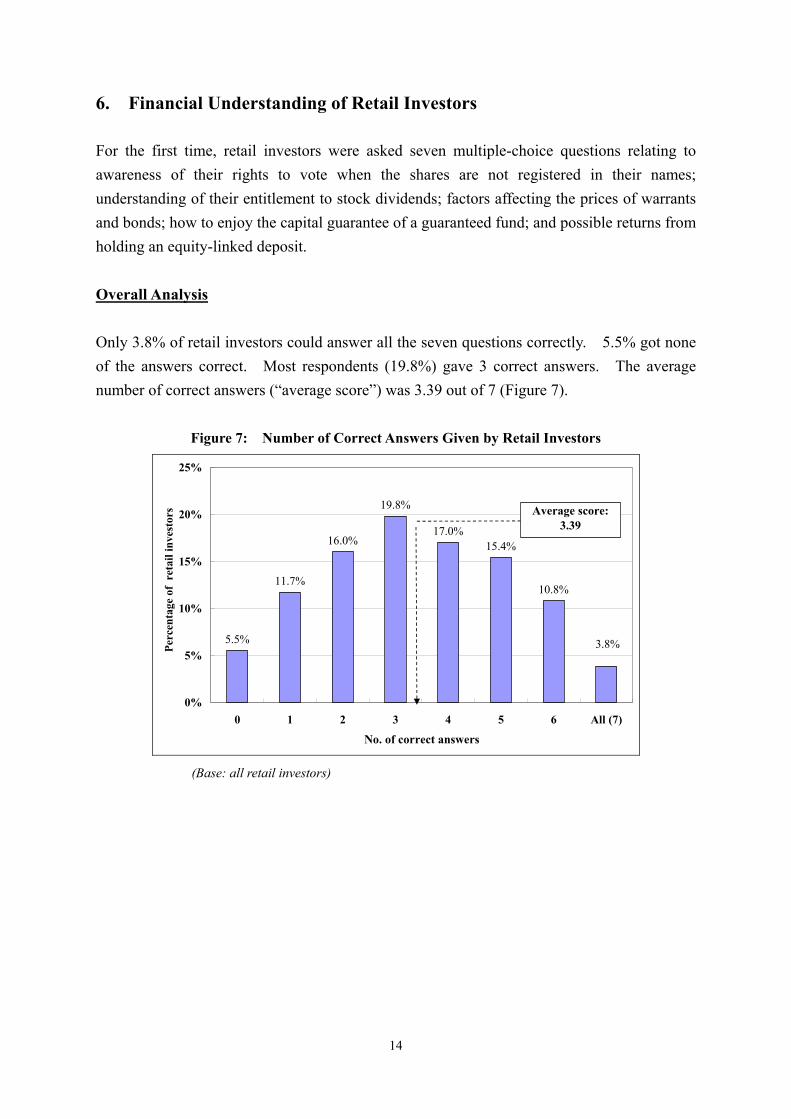
For the first time, retail investors were asked seven multiple-choice questions relating to awareness of their rights to vote when the shares are not registered in their names; understanding of their entitlement to stock dividends; factors affecting the prices of warrants and bonds; how to enjoy the capital guarantee of a guaranteed fund; and possible returns from holding an equity-linked deposit. Overall Analysis Only 3.8% of retail investors could answer all the seven questions correctly. 5.5% got none of the answers correct. Most respondents (19.8%) gave 3 correct answers. The average number of correct answers (“average score”) was 3.39 out of 7 (Figure 7).
Figure 7: Number of Correct Answers Given by Retail Investors
5.5%
11.7%
16.0%
19.8%
17.0%15.4%
10.8%
3.8%
0%
5%
10%
15%
20%
25%
0 1 2 3 4 5 6 All (7)
No. of correct answers
Perc
enta
ge o
f re
tail
inve
stor
s Average score:3.39
(Base: all retail investors)
15
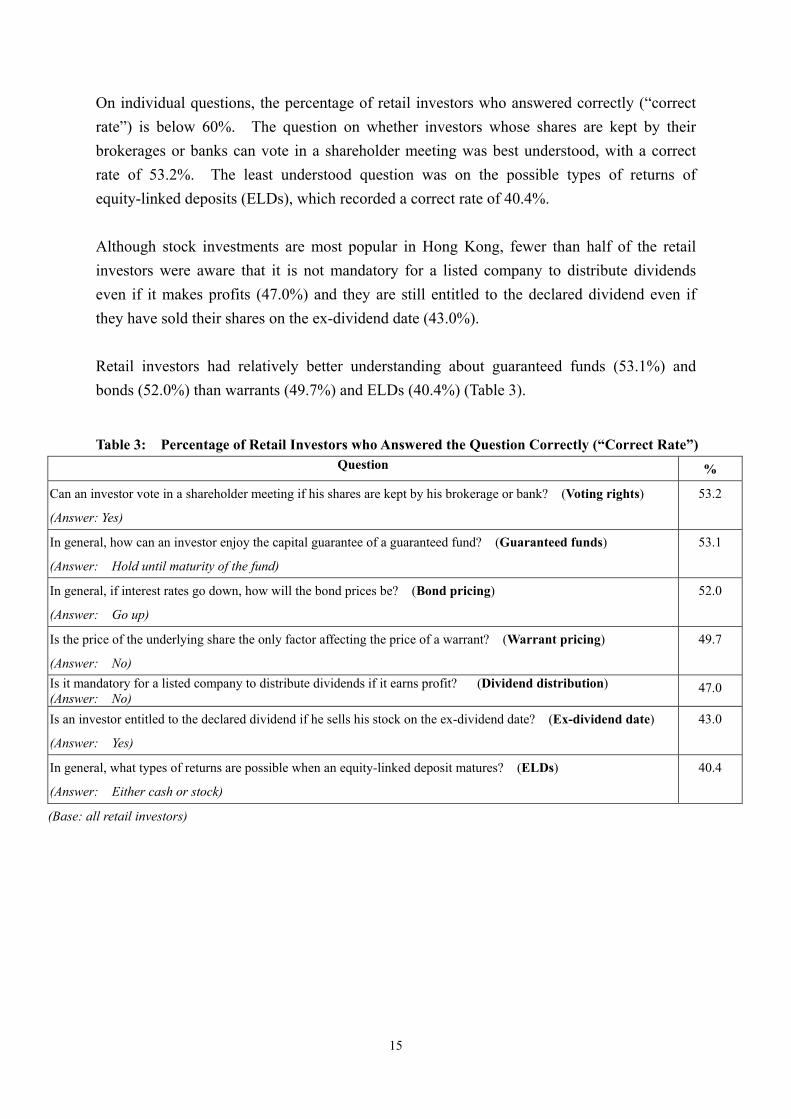
On individual questions, the percentage of retail investors who answered correctly (“correct rate”) is below 60%. The question on whether investors whose shares are kept by their brokerages or banks can vote in a shareholder meeting was best understood, with a correct rate of 53.2%. The least understood question was on the possible types of returns of equity-linked deposits (ELDs), which recorded a correct rate of 40.4%. Although stock investments are most popular in Hong Kong, fewer than half of the retail investors were aware that it is not mandatory for a listed company to distribute dividends even if it makes profits (47.0%) and they are still entitled to the declared dividend even if they have sold their shares on the ex-dividend date (43.0%). Retail investors had relatively better understanding about guaranteed funds (53.1%) and bonds (52.0%) than warrants (49.7%) and ELDs (40.4%) (Table 3). Table 3: Percentage of Retail Investors who Answered the Question Correctly (“Correct Rate”)
Question %
Can an investor vote in a shareholder meeting if his shares are kept by his brokerage or bank? (Voting rights)
(Answer: Yes)
53.2
In general, how can an investor enjoy the capital guarantee of a guaranteed fund? (Guaranteed funds)
(Answer: Hold until maturity of the fund)
53.1
In general, if interest rates go down, how will the bond prices be? (Bond pricing)
(Answer: Go up)
52.0
Is the price of the underlying share the only factor affecting the price of a warrant? (Warrant pricing)
(Answer: No)
49.7
Is it mandatory for a listed company to distribute dividends if it earns profit? (Dividend distribution) (Answer: No)
47.0
Is an investor entitled to the declared dividend if he sells his stock on the ex-dividend date? (Ex-dividend date)
(Answer: Yes)
43.0
In general, what types of returns are possible when an equity-linked deposit matures? (ELDs)
(Answer: Either cash or stock)
40.4
(Base: all retail investors)
16
Analysis by Demographic Variables
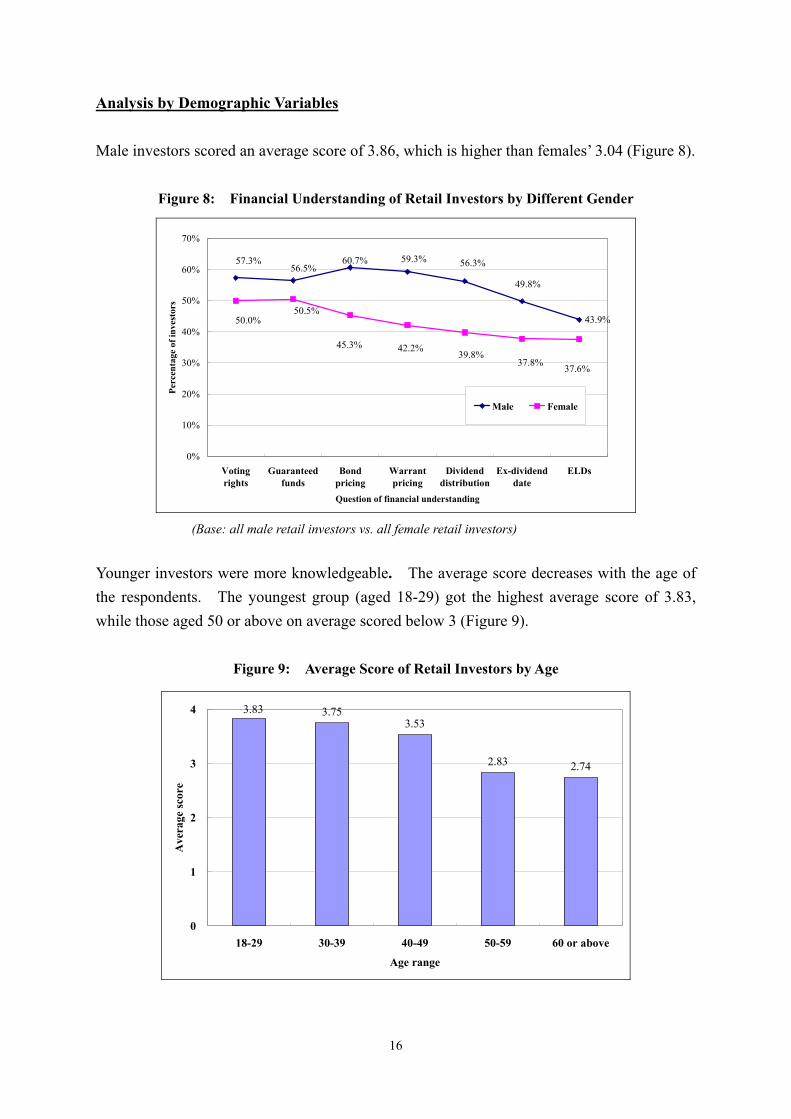
Male investors scored an average score of 3.86, which is higher than females’ 3.04 (Figure 8).
Figure 8: Financial Understanding of Retail Investors by Different Gender
43.9%
60.7%56.5%
57.3% 59.3% 56.3%
49.8%
45.3%
50.5%50.0%
42.2%39.8%
37.8% 37.6%
0%
10%
20%
30%
40%
50%
60%
70%
Votingrights
Guaranteedfunds
Bondpricing
Warrantpricing
Dividenddistribution
Ex-dividenddate
ELDs
Question of financial understanding
Perc
enta
ge o
f inv
esto
rs
Male Female
(Base: all male retail investors vs. all female retail investors)
Younger investors were more knowledgeable. The average score decreases with the age of the respondents. The youngest group (aged 18-29) got the highest average score of 3.83, while those aged 50 or above on average scored below 3 (Figure 9).
Figure 9: Average Score of Retail Investors by Age
3.753.53
2.83 2.74
3.83
0
1
2
3
4
18-29 30-39 40-49 50-59 60 or above
Age range
Ave
rage
scor
e
17
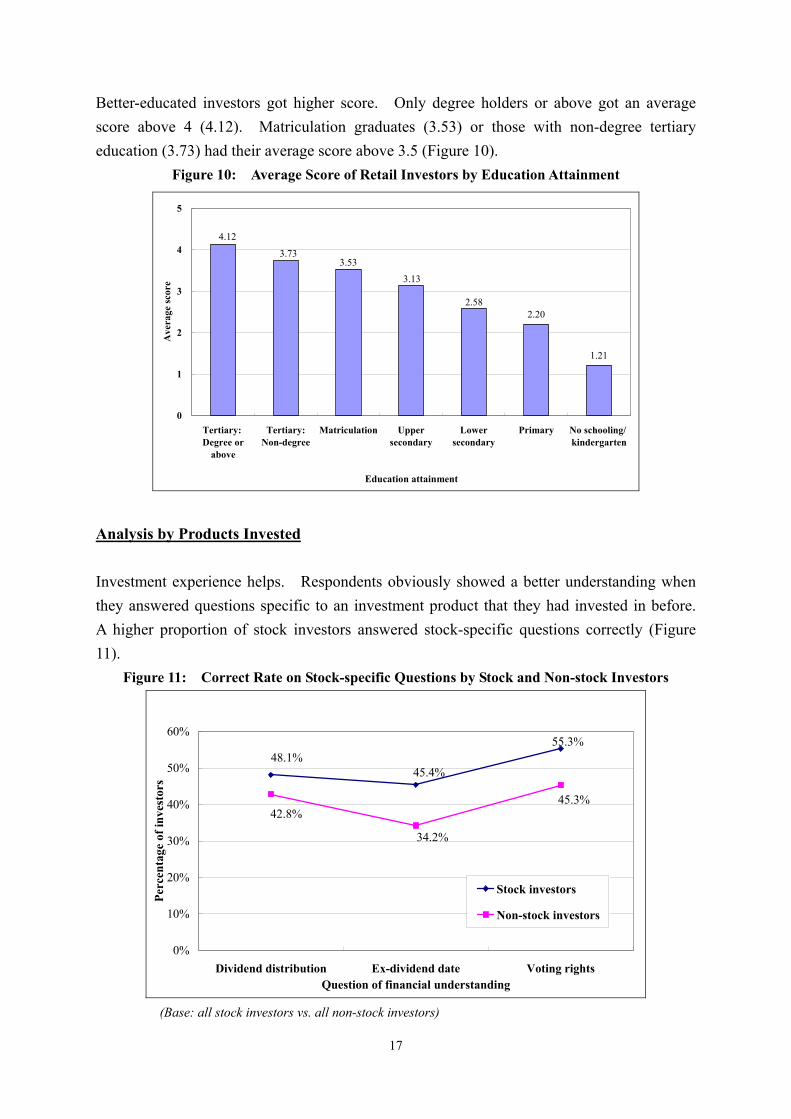
Better-educated investors got higher score. Only degree holders or above got an average score above 4 (4.12). Matriculation graduates (3.53) or those with non-degree tertiary education (3.73) had their average score above 3.5 (Figure 10).
Figure 10: Average Score of Retail Investors by Education Attainment
2.20
1.21
2.58
3.13
3.533.73
4.12
0
1
2
3
4
5
Tertiary: Degree or
above
Tertiary:Non-degree
Matriculation Uppersecondary
Lowersecondary
Primary No schooling/ kindergarten
Education attainment
Ave
rage
scor
e
Analysis by Products Invested Investment experience helps. Respondents obviously showed a better understanding when they answered questions specific to an investment product that they had invested in before. A higher proportion of stock investors answered stock-specific questions correctly (Figure 11).
Figure 11: Correct Rate on Stock-specific Questions by Stock and Non-stock Investors
55.3%
45.4%48.1%
45.3%
34.2%
42.8%
0%
10%
20%
30%
40%
50%
60%
Dividend distribution Ex-dividend date Voting rightsQuestion of financial understanding
Perc
enta
ge o
f inv
esto
rs
Stock investors
Non-stock investors
(Base: all stock investors vs. all non-stock investors)
18
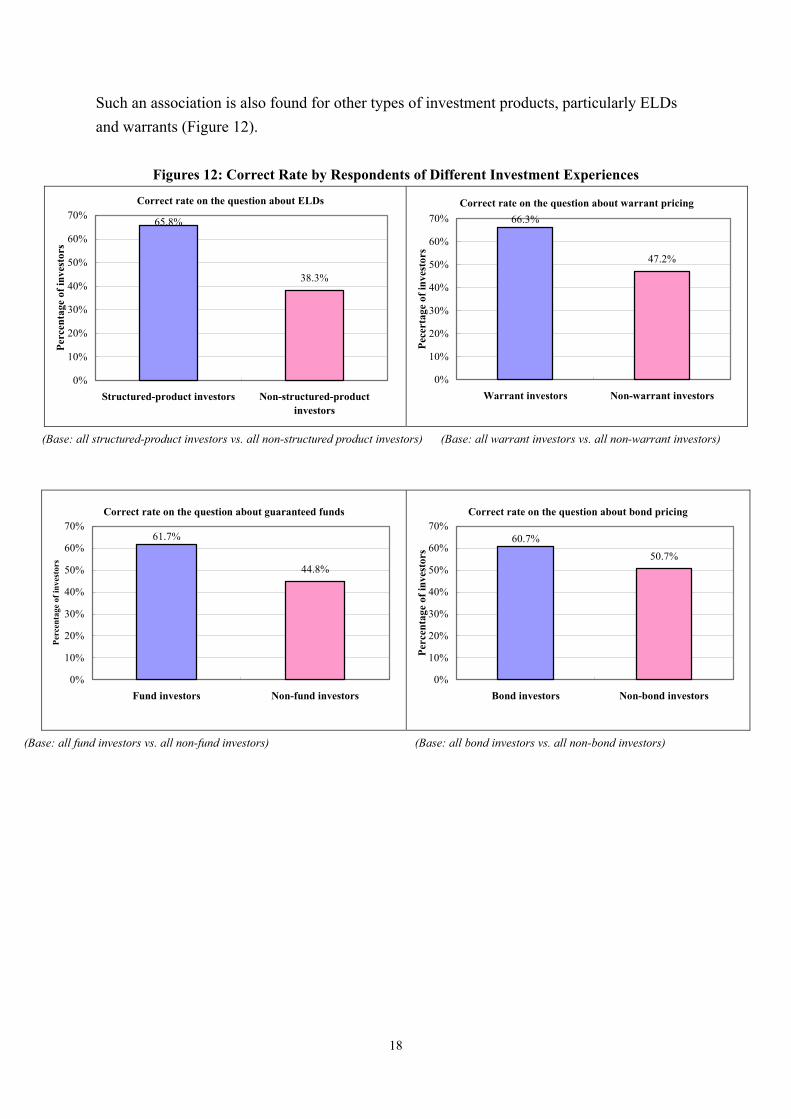
Such an association is also found for other types of investment products, particularly ELDs and warrants (Figure 12).
Figures 12: Correct Rate by Respondents of Different Investment Experiences
38.3%
65.8%
0%
10%
20%
30%
40%
50%
60%
70%
Structured-product investors Non-structured-productinvestors
Perc
enta
ge o
f inv
esto
rs
Correct rate on the question about ELDs
47.2%
66.3%
0%
10%
20%
30%
40%
50%
60%
70%
Warrant investors Non-warrant investors
Pece
rtag
e of
inve
stor
s
Correct rate on the question about warrant pricing
(Base: all structured-product investors vs. all non-structured product investors) (Base: all warrant investors vs. all non-warrant investors)
44.8%
61.7%
0%
10%
20%
30%
40%
50%
60%
70%
Fund investors Non-fund investors
Perc
enta
ge o
f inv
esto
rs
Correct rate on the question about guaranteed funds
50.7%
60.7%
0%
10%
20%
30%
40%
50%
60%
70%
Bond investors Non-bond investors
Perc
enta
ge o
f inv
esto
rs
Correct rate on the question about bond pricing
(Base: all fund investors vs. all non-fund investors) (Base: all bond investors vs. all non-bond investors)
19
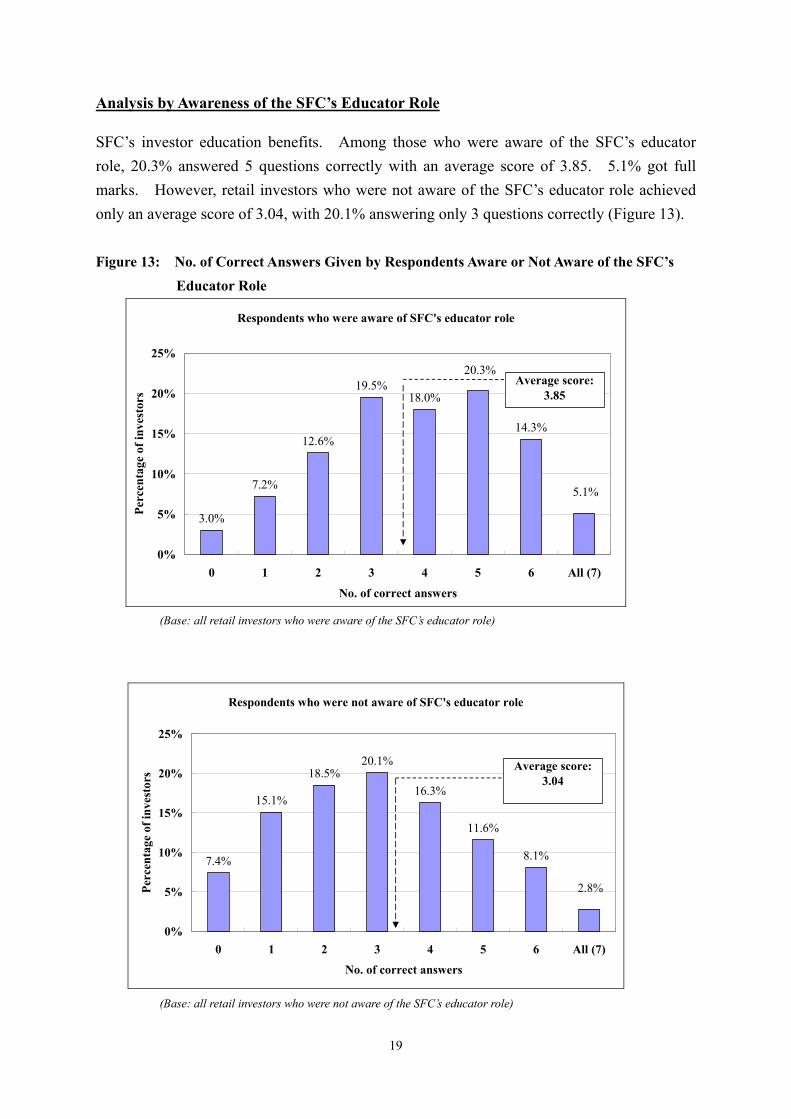
Analysis by Awareness of the SFC’s Educator Role SFC’s investor education benefits. Among those who were aware of the SFC’s educator role, 20.3% answered 5 questions correctly with an average score of 3.85. 5.1% got full marks. However, retail investors who were not aware of the SFC’s educator role achieved only an average score of 3.04, with 20.1% answering only 3 questions correctly (Figure 13). Figure 13: No. of Correct Answers Given by Respondents Aware or Not Aware of the SFC’s Educator Role
Respondents who were aware of SFC's educator role
3.0%
7.2%
12.6%
19.5%18.0%
14.3%
20.3%
5.1%
0%
5%
10%
15%
20%
25%
0 1 2 3 4 5 6 All (7)
No. of correct answers
Perc
enta
ge o
f inv
esto
rs
Average score:3.85
(Base: all retail investors who were aware of the SFC’s educator role)
Respondents who were not aware of SFC's educator role
7.4%
15.1%
18.5%20.1%
16.3%
11.6%
8.1%
2.8%
0%
5%
10%
15%
20%
25%
0 1 2 3 4 5 6 All (7)
No. of correct answers
Perc
enta
ge o
f inv
esto
rs
Average score:3.04
(Base: all retail investors who were not aware of the SFC’s educator role)
20
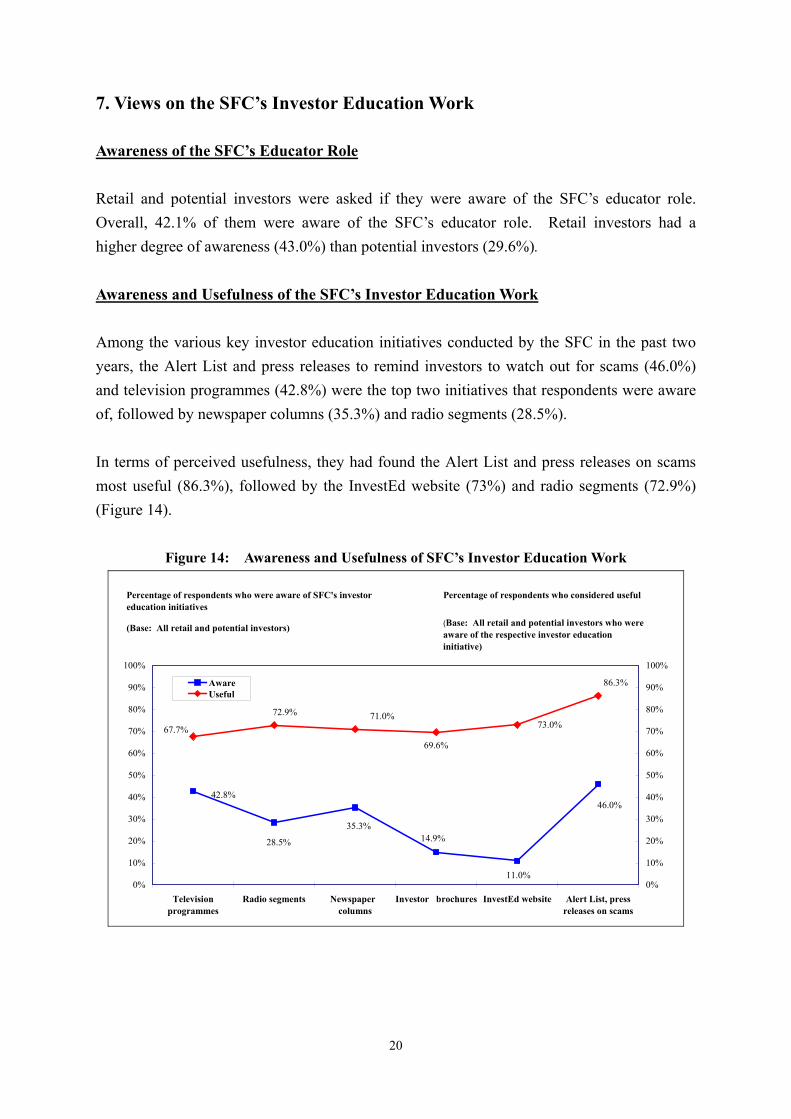
7. Views on the SFC’s Investor Education Work Awareness of the SFC’s Educator Role Retail and potential investors were asked if they were aware of the SFC’s educator role. Overall, 42.1% of them were aware of the SFC’s educator role. Retail investors had a higher degree of awareness (43.0%) than potential investors (29.6%). Awareness and Usefulness of the SFC’s Investor Education Work Among the various key investor education initiatives conducted by the SFC in the past two years, the Alert List and press releases to remind investors to watch out for scams (46.0%) and television programmes (42.8%) were the top two initiatives that respondents were aware of, followed by newspaper columns (35.3%) and radio segments (28.5%). In terms of perceived usefulness, they had found the Alert List and press releases on scams most useful (86.3%), followed by the InvestEd website (73%) and radio segments (72.9%) (Figure 14).
Figure 14: Awareness and Usefulness of SFC’s Investor Education Work
46.0%
11.0%
14.9%35.3%
28.5%
42.8%
72.9%
67.7%71.0%
69.6%
73.0%
86.3%
0%
10%
20%
30%
40%
50%
60%
70%
80%
90%
100%
Televisionprogrammes
Radio segments Newspaper columns
Investor brochures InvestEd website Alert List, pressreleases on scams
0%
10%
20%
30%
40%
50%
60%
70%
80%
90%
100%
AwareUseful
(Base: All retail and potential investors) (Base: All retail and potential investors who wereaware of the respective investor educationinitiative)
Percentage of respondents who considered usefulPercentage of respondents who were aware of SFC's investoreducation initiatives

21
Investor Education by the Securities Industry 91.9% of retail and potential investors strongly agreed or agreed that the securities industry should be doing more to educate the public about how to make informed investment decisions (Figure 15).
Figure 15: Views on the Need for More Investor Education Conducted by the Securities Industry
Agree37.4%
Strongly agree54.5%
Don't know2.6%
Disagree4.8%
Strongly disagree0.6%
(Base: all retail and potential investors)
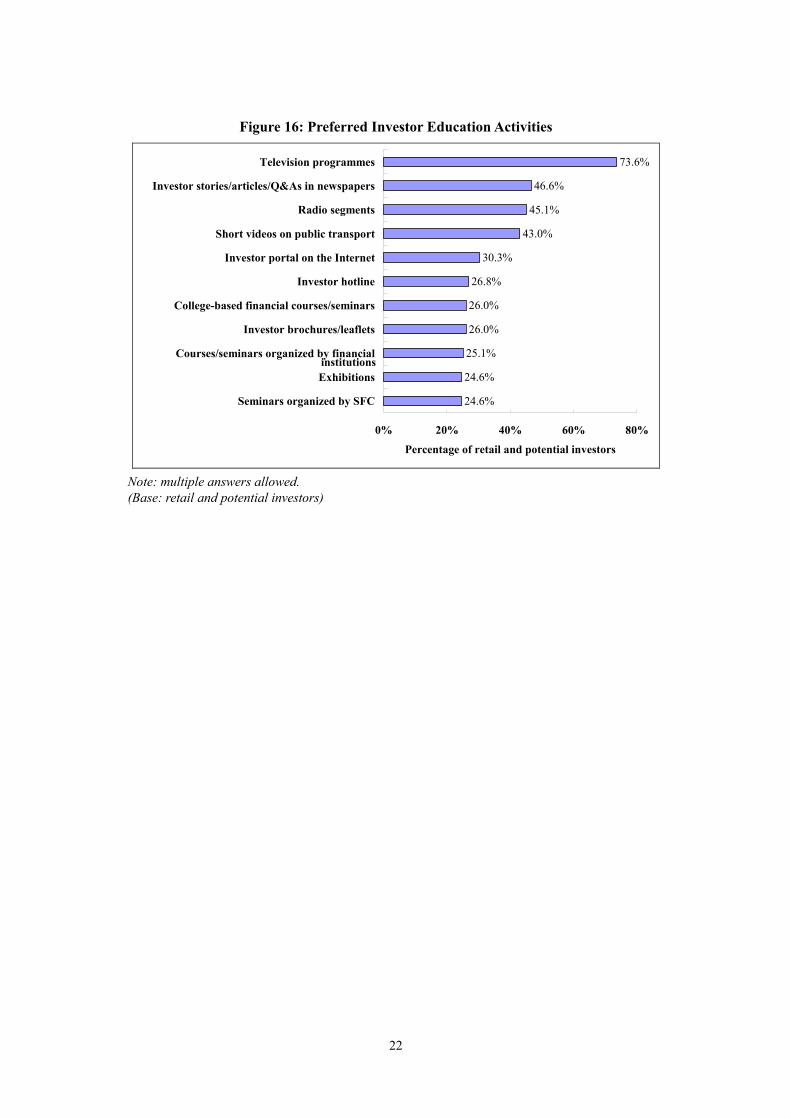
Preferred Investor Education Activities 73.6% of retail and potential investors preferred television programmes to help them enhance their understanding of financial and investor protection issues, followed by investor stories/articles/Q&As in newspapers (46.6%), radio segments (45.1%), and short videos on public transport (43%) (Figure 16).
22
Figure 16: Preferred Investor Education Activities
24.6%
24.6%
25.1%
26.0%
26.0%
26.8%
30.3%
43.0%
45.1%
46.6%
73.6%
0% 20% 40% 60% 80%
Seminars organized by SFC
Exhibitions
Courses/seminars organized by financial
Investor brochures/leaflets
College-based financial courses/seminars
Investor hotline
Investor portal on the Internet
Short videos on public transport
Radio segments
Investor stories/articles/Q&As in newspapers
Television programmes
Percentage of retail and potential investors
institutions
Note: multiple answers allowed. (Base: retail and potential investors)
23
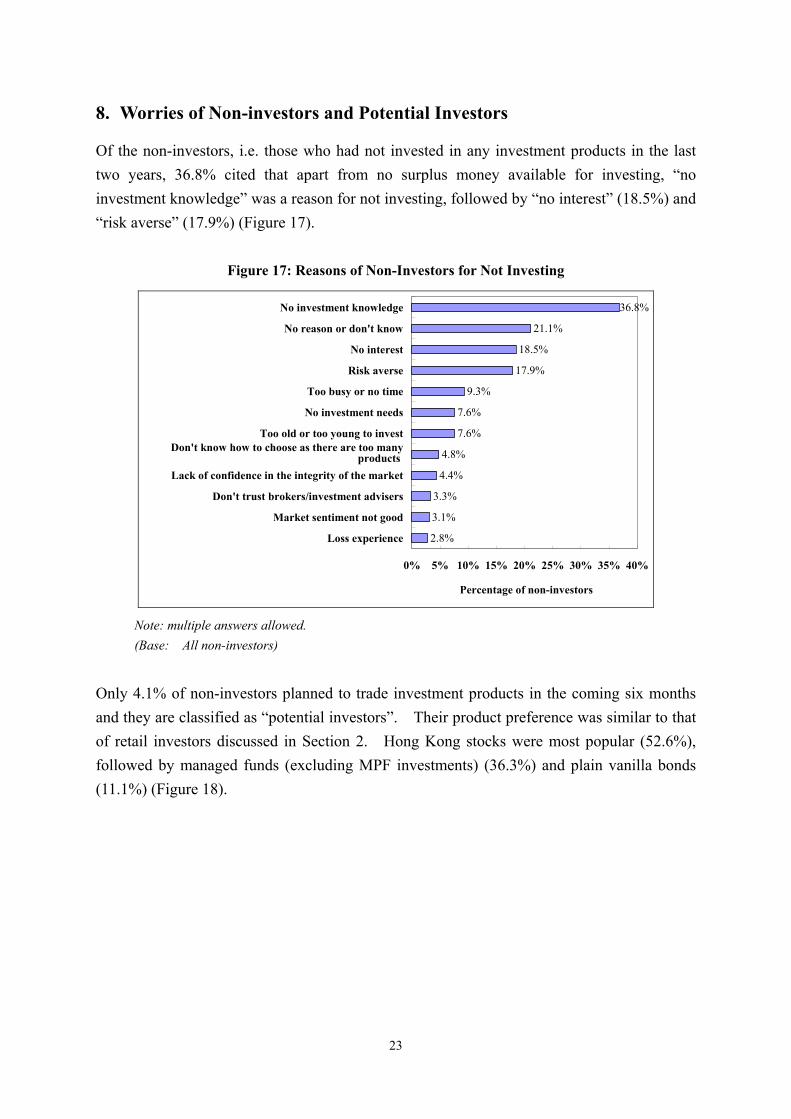
8. Worries of Non-investors and Potential Investors Of the non-investors, i.e. those who had not invested in any investment products in the last two years, 36.8% cited that apart from no surplus money available for investing, “no investment knowledge” was a reason for not investing, followed by “no interest” (18.5%) and “risk averse” (17.9%) (Figure 17).
Figure 17: Reasons of Non-Investors for Not Investing
2.8%
3.1%
3.3%
4.4%
4.8%
7.6%
7.6%
9.3%
17.9%
18.5%
21.1%
36.8%
0% 5% 10% 15% 20% 25% 30% 35% 40%
Loss experience
Market sentiment not good
Don't trust brokers/investment advisers
Lack of confidence in the integrity of the market
Don't know how to choose as there are too manyproducts
Too old or too young to invest
No investment needs
Too busy or no time
Risk averse
No interest
No reason or don't know
No investment knowledge
Percentage of non-investors
products
Note: multiple answers allowed.
(Base: All non-investors)
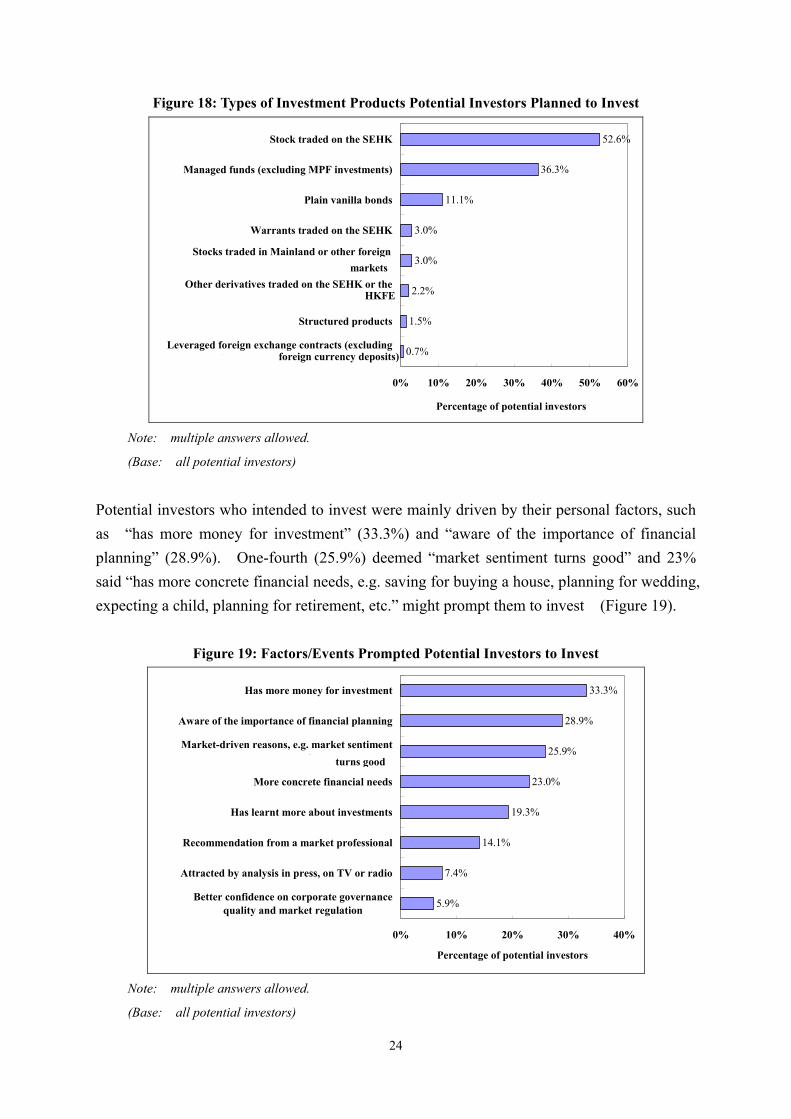
Only 4.1% of non-investors planned to trade investment products in the coming six months and they are classified as “potential investors”. Their product preference was similar to that of retail investors discussed in Section 2. Hong Kong stocks were most popular (52.6%), followed by managed funds (excluding MPF investments) (36.3%) and plain vanilla bonds (11.1%) (Figure 18).
24
Figure 18: Types of Investment Products Potential Investors Planned to Invest
0.7%
1.5%
2.2%
3.0%
3.0%
11.1%
36.3%
52.6%
0% 10% 20% 30% 40% 50% 60%
Leveraged foreign exchange contracts (excludingforeign currency deposits)
Structured products
Other derivatives traded on the SEHK or theHKFE
Stocks traded in Mainland or other foreignmarkets
Warrants traded on the SEHK
Plain vanilla bonds
Managed funds (excluding MPF investments)
Stock traded on the SEHK
Percentage of potential investors
HKFE
foreign currency deposits)
Stocks traded in Mainland or other foreignmarkets
Note: multiple answers allowed.
(Base: all potential investors)
Potential investors who intended to invest were mainly driven by their personal factors, such as “has more money for investment” (33.3%) and “aware of the importance of financial planning” (28.9%). One-fourth (25.9%) deemed “market sentiment turns good” and 23% said “has more concrete financial needs, e.g. saving for buying a house, planning for wedding, expecting a child, planning for retirement, etc.” might prompt them to invest (Figure 19).
Figure 19: Factors/Events Prompted Potential Investors to Invest
5.9%
7.4%
14.1%
19.3%
23.0%
25.9%
28.9%
33.3%
0% 10% 20% 30% 40%
Better confidence on corporate governancequality and market regulation
Attracted by analysis in press, on TV or radio
Recommendation from a market professional
Has learnt more about investments
More concrete financial needs
Market-driven reasons, e.g. market sentimentturns good
Aware of the importance of financial planning
Has more money for investment
Percentage of potential investors
turns good
Note: multiple answers allowed.
(Base: all potential investors)
25
Annex Survey Design Target Respondents Definitions of the target respondents in this survey are as below:
• Respondents: Hong Kong adults aged 18 or above. • Retail investors: respondents who had traded one or more investment products in the
past two years. • Stock investors: retail investors who had traded Hong Kong, Mainland or foreign
stocks in the past two years. • Non-investors: respondents who had not traded any investment products in the past
two years. • Potential investors: respondents who had not traded any investment products in the
past two years but indicated that they would trade one or more investment products in the coming six months.
Data Collection Method The survey data were collected through telephone interviews from 10 September to 17 November 2005. A structured questionnaire was used to collect information from the target respondents. Sampling Method A sample of 34,999 residential telephone numbers was randomly selected and 5,210 respondents aged 18 or above were successfully contacted and interviewed. Of these respondents, 1,915 were retail investors, 3,295 were non-investors of which 135 were potential investors. Of the retail investors, 1,511 were stock investors.