Aeration Efficiency in Differnet Tanks Shaps
15
Water Qual. Res. J. Canada, 2007 Volume 42, No. 1, · Copyright © 2007, CAWQ 26 Relative Performance of Different Shaped Surface Aeration Tanks Achanta Ramakrishna Rao,* Bimlesh Kumar and Ajey Kumar Patel Civil Engineering Department, Indian Institute of Science, Bangalore, 560012 India Aeration is one of the important processes employed in water and wastewater treatment to reduce biochemical oxygen demand. The basic phenomenon behind the process of aeration is gas transfer, in which gas molecules are exchanged between the liquid and the gas at the gas-liquid interface (Fair et al. 1971). Aeration processes are also used to remove volatile substances present in water and wastewater and improve the dissolved oxygen content. Many types of aerators are used in practice, such as cascade aerators, spray nozzles, diffused or bubble aerators, and surface aerators. Among them, surface aerators are popular because of their comparable efficiency and ease of operation. A typical surface aerator with six flat blades, used in this study, is shown in Fig. 1. The main component of these surface aerators is an impeller or rotor, to which the six flat blades are fitted. The rotor is rotated to create turbulence in the water body so that aeration takes place through the interface of atmospheric oxygen and the water surface. The rate of oxygen transfer depends on a number of factors—such as intensity of turbulence—which, in turn, depends on the speed of rotation, size, shape and number of blades, diameter and immersion depth of the rotor and size and shape of aeration tank, as well as on the physical, chemical and biological characteristics of water (Rao 1999). The performance of surface aeration systems is measured in terms of their oxygen transfer rate; hence, the choice of a particular surface aeration system depends on its performance and the efficiency of its oxygen transfer rates. Therefore, there appears to be a need to study and analyze the relative performance of these aerators. As the concept of Surface aeration experiments were conducted in tanks of length to width ratio (L/W) 1.0, 1.5 and 2 as well as circular tanks to study their relative performance on oxygen transfer and energy consumption while re-aerating deoxygenated water. An identical geometric similarity of various linear dimensions of aerators, rotor blades and rotor diameter was maintained for all sizes and shapes of aeration tanks tested. The power consumed per unit volume concept to simulate the oxygen transfer coefficient was found to be valid for all three shapes of aerators. Simulation equations to predict the oxygen transfer coefficient for any given dynamic parameter governing the theoretical power per unit volume, , were developed for rectangular tanks of L/W ratios equal to 1.5 and 2. Results were compared with simulation equations (correlating and ) for square and circular tanks. A simulation criterion correlating the oxygen transfer coefficient with actual and effective power consumption per unit volume for three shapes of tanks was developed. Energy consumption per unit volume of water was also analyzed. Examples illustrating the application of results are presented. It has been found that the circular tanks are the most energy efficient, i.e., they produce maximum for a given effective/actual input energy, followed by square tanks, rectangular tanks of L/W = 1.5 and rectangular tanks of L/W = 2. This suggests that the circular tank performs better as far as power requirements are concerned and hence provide better economy. aeration, aerators, oxygen transfer, power, wastewater treatment k k X k X k k Key words: Introduction *Corresponding author; [email protected] Fig. 1. Schematic diagram of a surface aeration tank. power per unit volume is an established criterion to simulate the oxygen transfer coefficient (Rao 1999 and Rao et al. 2004), while studying such a relative performance, one may consider the relationship of oxygen transfer rates in terms of the theoretical power per unit volume: where is the rotational speed of the rotor, is the diameter of the rotor, is the kinematic viscosity of the water and is the actual and effective power per unit volume. Rao (1999) and Rao et al. (2004) developed the simulation criteria for unbaffled square and circular surface aeration tanks, correlating the N D (P/V) (1) 3 1 3 4 2 3 n =
-
Upload
asmaronline -
Category
Documents
-
view
216 -
download
0
description
best configuration of aeration tank
Transcript of Aeration Efficiency in Differnet Tanks Shaps

Water Qual. Res. J. Canada, 2007 Volume 42, No. 1,�
Copyright © 2007, CAWQ
26
Relative Performance of Different Shaped Surface Aeration Tanks
Achanta Ramakrishna Rao,* Bimlesh Kumar and Ajey Kumar Patel
Civil Engineering Department, Indian Institute of Science, Bangalore, 560012 India
Aeration is one of the important processes employed in waterand wastewater treatment to reduce biochemical oxygendemand. The basic phenomenon behind the process ofaeration is gas transfer, in which gas molecules are exchangedbetween the liquid and the gas at the gas-liquid interface (Fairet al. 1971). Aeration processes are also used to removevolatile substances present in water and wastewater andimprove the dissolved oxygen content.
Many types of aerators are used in practice, such ascascade aerators, spray nozzles, diffused or bubble aerators,and surface aerators. Among them, surface aerators arepopular because of their comparable efficiency and ease ofoperation.
A typical surface aerator with six flat blades, used in thisstudy, is shown in Fig. 1. The main component of thesesurface aerators is an impeller or rotor, to which the six flatblades are fitted. The rotor is rotated to create turbulence inthe water body so that aeration takes place through theinterface of atmospheric oxygen and the water surface. Therate of oxygen transfer depends on a number of factors—suchas intensity of turbulence—which, in turn, depends on thespeed of rotation, size, shape and number of blades, diameterand immersion depth of the rotor and size and shape ofaeration tank, as well as on the physical, chemical andbiological characteristics of water (Rao 1999).
The performance of surface aeration systems ismeasured in terms of their oxygen transfer rate; hence, thechoice of a particular surface aeration system depends on itsperformance and the efficiency of its oxygen transfer rates.Therefore, there appears to be a need to study and analyze therelative performance of these aerators. As the concept of
Surface aeration experiments were conducted in tanks of length to width ratio (L/W) 1.0, 1.5 and 2 as well as circular tanksto study their relative performance on oxygen transfer and energy consumption while re-aerating deoxygenated water. Anidentical geometric similarity of various linear dimensions of aerators, rotor blades and rotor diameter was maintained forall sizes and shapes of aeration tanks tested. The power consumed per unit volume concept to simulate the oxygen transfercoefficient was found to be valid for all three shapes of aerators. Simulation equations to predict the oxygen transfercoefficient for any given dynamic parameter governing the theoretical power per unit volume, , were developed forrectangular tanks of L/W ratios equal to 1.5 and 2. Results were compared with simulation equations (correlating and )for square and circular tanks. A simulation criterion correlating the oxygen transfer coefficient with actual and effectivepower consumption per unit volume for three shapes of tanks was developed. Energy consumption per unit volume of waterwas also analyzed. Examples illustrating the application of results are presented. It has been found that the circular tanks arethe most energy efficient, i.e., they produce maximum for a given effective/actual input energy, followed by square tanks,rectangular tanks of L/W = 1.5 and rectangular tanks of L/W = 2. This suggests that the circular tank performs better as faras power requirements are concerned and hence provide better economy.
aeration, aerators, oxygen transfer, power, wastewater treatment
kk X
k Xk
k
Key words:
Introduction
*Corresponding author; [email protected] Fig. 1. Schematic diagram of a surface aeration tank.
power per unit volume is an established criterion to simulatethe oxygen transfer coefficient (Rao 1999 and Rao et al.2004), while studying such a relative performance, one mayconsider the relationship of oxygen transfer rates in terms ofthe theoretical power per unit volume:
where is the rotational speed of the rotor, is the diameter ofthe rotor, is the kinematic viscosity of the water and is theactual and effective power per unit volume. Rao (1999) andRao et al. (2004) developed the simulation criteria for unbaffledsquare and circular surface aeration tanks, correlating the
N D(P/V)
(1)3
13
4
23
��

oxygen transfer rates with the theoretical power per unitvolume . Kozinski and King (1966) summarized twelvestudies on cylindrical baffled tanks and reported that theoverall oxygen transfer coefficient at 20°C ( ) is the
function of the power input per unit volume as = ,
where is a constant parameter ranging from 0.2 to 0.4.Hwang (1983) developed a scale-up equation which indicatesthat volumetric mass transfer coefficient in cylindrical baffledtanks can be related to the power input per unit volume as
= 0.332 . Hsieh (1991) has developed a
relationship between mass transfer rates and effective powerper unit volume as = 0.167 for cylindrical
baffled tanks. Forrester et al (1998) has predicted therelationship between the mass transfer rates and effectivepower per unit volume as = (76 21)10 .
Generally, unbaffled tanks are being employed for surfaceaeration, because these give a higher fluid-particle masstransfer rate for a given power consumption (Johnson andHuang 1956; Grisafi et al. 1994; Rao and Jyothish 1997),which is of paramount importance in designing an aerationsystem.
The objective of this research is to compare oxygentransfer rates and the theoretical power per unit volumefor the three shapes of aeration tanks.An additional aim is tocompare their relative performance using a simulationsequation (Rao 1999 and Rao et al. 2004). Lastly, this studyaims to develop a relationship between oxygen transfer rateswith the actual power per unit volume for three shapesof unbaffled surface aeration tanks.
While more advanced oxygen transfer models have beendeveloped in the recent past (McWhirter et al. 1995,Mahendraker et al. 2005), the two film-theory developed byLewis and Whitman (1924) seems to be satisfactory for cleanwater, and such a model is used in the present study.
According to this theory, the oxygen transfer coefficientatT°C, may be expressed as follows:
X
K a
K a (P/V)
a
K a (P/V)
K a (P/V)
K a (P/V)
(X)
(P/V)
K a
L 20
L 20
L 20
L 20
L 20
L T
a
0.97
0.483
-6 0.80 0.06�
�
Theory and Background Information
Oxygen Transfer Coefficient
� � � �tssTL
���� 0 (2)
where ln represents a natural logarithm and and are
dissolved oxygen (DO) concentrations in parts per million(ppm), such that = the saturation DO concentration which
can tend towards very large values, is at t = 0 and is at
time t = t. The value of can be obtained as slope of the
linear plot between ln and time . The value of
can be corrected for a temperature other than the standardtemperature of 20 C as , using the van't Hoff-Arrhenius
equation (WEF andASCE 1988):
C C C
C
C C
K a
(C - C ) t K a
K a
s, 0 t
s
0 t
s t
L 20
L T
L T
o
� �2020
�� TLTL �
where is the temperature coefficient 1.024 for tap water.�
(3)
Dimensional Analysis
Many investigators including Schmidtke et al. (1977), Udayaet al. (1991) and Rao (1999) have successfully used the theoryof dimensional analysis to describe the surface aerationprocess, which depends on geometric, physical and dynamicvariables as explained below:
The geometric variables include cross-sectional area of the tank , depth of water in the tank ,diameter of the rotor , length of the blades , width of theblades , distance between the top of the blades and thehorizontal floor of the tank and the number of bladesas shown in Fig.1.
The physical variables include density of
air , density of water , and the kinematic viscosity of
water .
The rotational speed of the rotor is thedynamic variable associated with the surface aeration process.
Variables influencing the oxygen transfer coefficient at20°C (i.e., ) for a given shape of an aeration tank are
therefore given by:
Geometric variables.
Physical variables.
Dynamic variables.
(A) (H)(D) (l)
(b)(h) (n)
( ) ( )
( )
(N)
K a
�
�a w
L 20
�
Equation 4 may be expressed in terms of non-dimensionalparameters as follows:
k = f (�A/D, H/D, l/D, b/D, h/D, n, �a/�w, R, F)
where:
� �gaKk L ��is the non-dimensional oxygentransfer parameter;
�ND2� is the Reynolds number; and
DNF 2� is the Froude number.
Alternately it can be expressed as (Rao 1999 and Rao 2004):
k = f (�A/D, H/D, l/D, b/D, h/D, n, �a/�w, X)
(4)
(5)
(6)
31
34
RFX �where is the parameter governing the power perunit volume. The first six non-dimensional parametersrepresent the“geometric-similarity”of the system and the lastparameter represents the“dynamic-similarity.”
The experiments in the present study have beenconducted by using six flat blades ( = 6) fitted to a rotor in asymmetrical manner as several investigators have followedthe same number of flat blades (Schmidtke et al. 1977; Udayaet al.1991; Rao 1999).
Therefore, the number of blades, is constant in thepresent experiments, also the parameter / is considered as
invariant. Thus, these two parameters are omitted in the
n
n
a w� �
KLa20 = f (A, H, D, l, b, h, n, N, g, �a, �w, �)
Relative Performance of Surface Aeration Tanks
27
analysis. Therefore, the functional relationship of equation 6can now be expressed as:
k = f (�A/D, H/D, l/D, b/D, h/D, X) (7)
Geometric Similarity
Equation 7 suggests that if geometric-similarity of the firstfive variables on the right-hand side is maintained for anygiven shape of aeration tank, then depends only on .k X
k = f (X)
An optimal solution to geometrical similarity has beeninvestigated by Udaya et al. (1991) for a square tank byconducting a series of experiments in different sized tanksand by varying /D, /D, / , / and / to a great extent.They suggested the following values to obtain a maximum
, for any rotational speed of the rotor fitted with six
flat blades:
A H l D b D h D
K a NL 20
�
�A/D = 2.88; H/D = 1.0; l/D = 0.3;b/D = 0.24; and h/H = 0.94
(8)
(9)
The quantities listed above represent optimal geometric-similarity conditions for square tanks. To compare theperformance of aerators with different shapes with squaretanks, the same geometric dimensions have been maintainedfor all tanks in the present experiments.
When geometric-similarity conditions are maintained, thefunctional relationship represented by equation 7 is reducedto a function of dynamic similarity (Rao 1999) for any shapeof aeration tank (equation 8). However, the functionalrelationship may be different for different shapes.
The intensity of turbulence and wave action of water aremajor factors associated with surface aeration. Turbulenceand viscous effects can be described by the Reynolds number
and surface wave action can be described by the Froudenumber . Hence, both and are important to surfaceaeration. It may be noted here that both and are implicitlyexpressed in in equation 8 as = , where = ,
and such that can be considered as a governingparameter to simulate (Rao 1999). Hence can be uniquelyrelated to as previously reported (Rao 1999, Rao et al.2004).
Several investigators Horvath (1984), Udaya (1991) andRao (1999) stated that if power demand per unit volume
remains constant then there would be a similarity inoxygen transfer between geometrically similar systems inclean water systems. It is also suggested that when powerdemand per unit volume remains the same in geometricallysimilar tanks of different sizes, the oxygen transfer coefficient
remains the same in all tanks. According to Oldshue
(1985) the power per unit volume can be used as a scale-upcriterion for homogenous chemical reactions.
In equation 8, the parameter governs the theoreticalpower per unit volume and it can be defined from hydraulicsprinciples based on the concept that the power is related to
Dynamic Similarity: Power Per Unit Volume Concept
(R)(F) R F
F RX X F R F N D/g
R = ND / Xk k
X
(P)(V)
K a
X
4/3 1/3 2
2
L 20
�
the product of the flow discharge and head loss (Rao 1999).Therefore, one may expect a correlation between the effective(actual or measured) power per unit volume and .Furthermore, the oxygen transfer coefficient ( ) is a functionof because and and are directly related. Inthis functional relationship, can be expressed as the non-dimensional form . Hence the relationship between and
can be expressed as:
(P/V) Xk
P/V k = f(X) P/V XP/V
P k
P/VV
k = f (P )
where is the non-dimensional form of:PV
(10)
� � 31
�� gV
P
V
P� (11)
The goal is to solve equations 8 and 10 for three shapes oftanks by conducting laboratory experiments.
Experiments were carried out with the objective of findingthe effect of tank shape on the oxygen transfer coefficientunder a wide range of values (dynamic conditions) andpower requirements per unit volume for three shapes oftanks.
The ranges of experimental variables are listed in Table 1.Two sizes of rectangular tanks of L:W ratio 1.5 and 2 andthree sizes of each square and circular tank were tested underlaboratory conditions. The geometrical similarity expressedin equation 9 was maintained in all tanks.
Standard oxygen transfer tests were conducted with tapwater under laboratory conditions. At first, water in the tankwas deoxygenated by adding the required amount ofcobaltous chloride (CoCl ) and sodium sulfite (Na SO )
(Metcalf & Eddy Inc. 2004) and thoroughly mixing thewater. The deoxygenated water was re-aerated by rotatingthe rotor at desired speeds and maintaining the variables asper the data presented in Table 1. When the DOconcentration began to rise, readings were taken at regularintervals until DO increased up to about 80% of the DOsaturation value.A Lutron Dissolved Oxygen Meter was usedto measure the DO concentration in water. The DO meterwas calibrated with the modified Winkler's method (APHA1985).
Using the known values of measurements in termsof at regular intervals of time t (including the known value
of at = 0), a line was fitted by linear regression analysis of
equation 2, between the logarithm of ( ) and , by
assuming different but appropriate values of such that the
regression that gives the minimum “standard error ofestimate” was taken. Thus the values of and were
obtained simultaneously. The values of were computed
using equation 3 with = 1.024 as per the standards for clean
Materials and Methods
(k)X
DOC
C t
C - C t
C
K a C
K a
Experimental Setup
Determination of KL 20a
2 2 3
t
0
s t
s
L T s
L 20
�
Rao et al.
28

TA
BL
E1
.a,b
Sl.
No.
Tank
Shape
C/S
are
aA
(m2)
Len
gth
(L)
or
dia
met
er(d
)L
(mm
)d
(mm
)
Roto
rdia
met
erW
ate
rdep
thIm
mer
sion
hei
ght
D(m
m)
H(m
m)
H(m
m)
Bla
de
dim
ensi
ons
Roto
rsp
eed
L(m
m)
b(m
m)
Min
.(r
pm
)M
ax.
(rpm
)
a b-6
-62
Relative Performance of Surface Aeration Tanks
29
water (WEF and ASCE 1988). Thus the values of were
determined for different rotational rotor speeds in all of thegeometrically similar tanks.
The current (I) and voltage (V) of the power supply given tothe DC motor of the aerator were measured by a digitalmultimeter. The rotational speed of the rotor was measuredby using a digital speed indicator. The power available at theshaft was calculated by measuring input power anddeducting the losses occurring in the DC motor. Sincerotational speed of the shaft was low (70 to 120 rpm)compared to the rated speed (1400 rpm) of the DC motor,only important losses (such as copper and iron losses) wereconsidered for determining the power available at the shaft.To determine these losses, current and voltage at no load (freerotation of rotor without load) and loaded (rotation withwater) conditions were measured during the experiment.Thepower available at the shaft was then calculated according tothe method given by Cook and Carr (1947).
From the measurement of no load current (I ) and
voltage (V ), the iron loss was calculated by:
K a
NL 20
Measurement of Power Available at the Shaft
1
1
a
2
111LRI-VII � (12)
a
2
1 RIwhere R is the armature resistance of the DC motor and
is the no load copper loss. From the measured loadedcondition for current (I ), and voltage (V ), the copper loss
was calculated by:
a
2 2
a
2
2L RIC � (13)
Total loss occurring in DC motor:
LLL CIT �
Incoming power to DC Motor:
22i VIP �
Power available at the shaft:
� �2
1
2
2a1122Li IIRVIVITP ������P
(14)
(15)
(16)
Results and Discussion
Experimental data were analyzed with an objective ofcomputing three major variables , and and their inter-relationships, leading to an understanding of relativeperformanceof three shapesof tanks.
Oxygen transfer coefficient in surface aeration tanks wasinvestigated as a function of dynamic variable to verifyequation 8. The experimental data expressed in terms of
k X P
(X)
V
Simulation of Oxygen Transfer Coefficient, , withTheoretical Power Per Unit Volume,
k
X
X N D /(g ) k = K a ( /g )= (equation 1) and are plottedin Fig.2.
3 2 4/3 1/3 2 1/3� �L 20
It is interesting to note that each set of data pointspertaining to the given shape of the tank fall very closely on aunique curve, suggesting the validity of equation 8; however,the functional relationships are different for different shapesas the data fall uniquely on different curves. The simulationequation for square and circular tanks between and hasbeen established by Rao (1999) and Rao et al. (2004) and thesame is plotted in Fig. 2 along with the data from the presentexperiments to verify the validity of such a simulationequation.
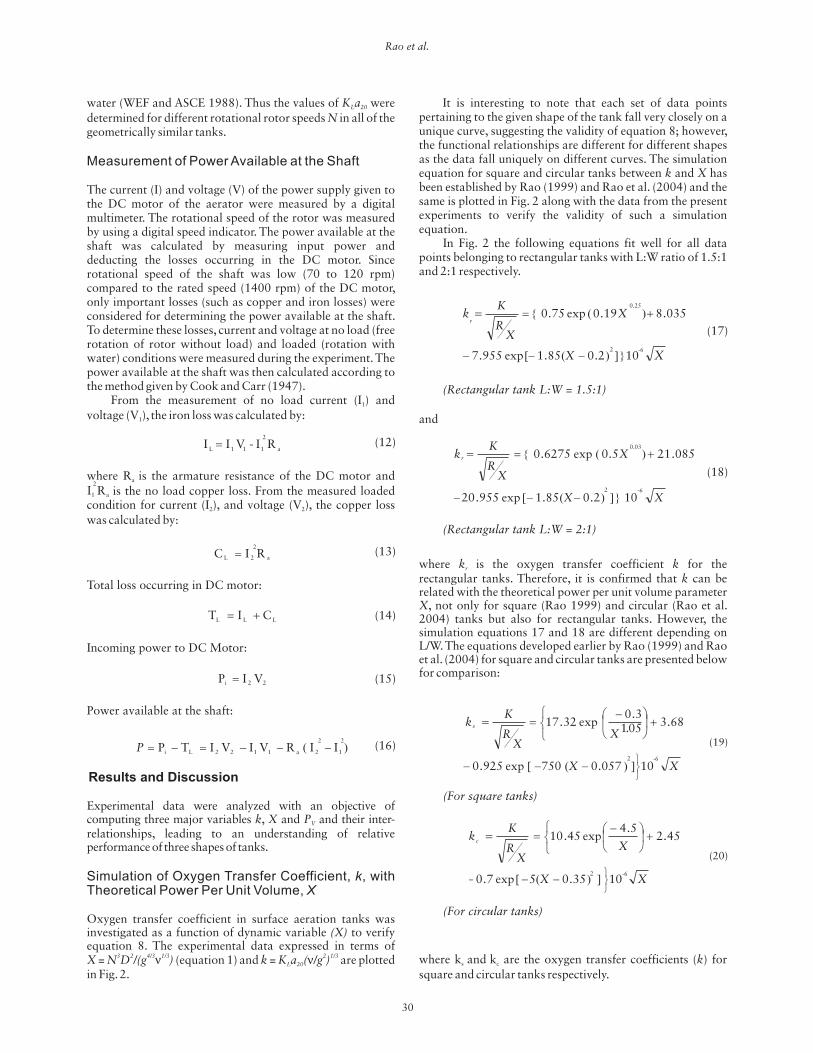
In Fig. 2 the following equations fit well for all datapoints belonging to rectangular tanks with L:W ratio of 1.5:1and 2:1 respectively.
k X
� � X
XR
Kk
r
0.25
035.819.0exp75.0
� �� � XX-62
102.085.1exp955.7 ���
��
(Rectangular tank L:W = 1.5:1)
� �� � XX-62
102.085.1exp955.20 ���
� � X
XR
Kkr
0.03
085.215.0exp6275.0 ��
(Rectangular tank L:W = 2:1)
(17)
(18)
where is the oxygen transfer coefficient for therectangular tanks. Therefore, it is confirmed that can berelated with the theoretical power per unit volume parameter
, not only for square (Rao 1999) and circular (Rao et al.2004) tanks but also for rectangular tanks. However, thesimulation equations 17 and 18 are different depending onL/W.The equations developed earlier by Rao (1999) and Raoet al. (2004) for square and circular tanks are presented belowfor comparison:
k kk
X
r
� �� � XX-62
10057.0750exp925.0���
���
XX
R
Kks 05.1
68.3exp32.17���
��
���
� 3.0���
(For square tanks)
(19)
� �� � XX-62
1035.05exp7.0���
���
XX
R
Kkc 45.2
5.4exp45.10
���
��
���
� ���
(20)
(For circular tanks)
where k and k are the oxygen transfer coefficients ( ) for
square and circular tanks respectively.s c k
Rao et al.
30
and

Fig. 2. Simulation of oxygen transfer rate with theoretical power per unit volume.
Relative Performance of Surface Aeration Tanks
31

Relative Performance of Surface Aeration Tankswith andk X
It is clear from Fig. 2 that for values of 0.5, square tanksoffer a higher oxygen transfer coefficient , followed byrectangular tanks and circular tanks.But at higher values of X
(say 4) rectangular tanks with L/W = 2 give marginallyhigher values of than the square tanks do, followed by therectangular tank of L/W =1.5, and with the lowest values inthe circular tanks. Thus, while there seems to be no fixedtrend of for all values, there seems to be an order for agiven pair of shapes: square tanks always produce a higherfor a given when compared to circular tanks (Rao et al.2004) whereas rectangular tanks of L/W = 2 produce a higher
than the other rectangular tanks of L/W = 1.5.The relative performance of circular and rectangular
tanks of L/W = 1.5 and 2 with respect to square tanks in termsof the dimensionless oxygen transfer parameter, , for a
given is shown in Fig. 3. It is clear from Fig. 3 that for anygiven , the ratio of for values of a rectangular tank of
L/W = 2 and rectangular tank of L/W = 1.5
Xk
Xk
k Xk
X
k
k/k
XX k/k
≈
≈
s
s
)5.1()2( rrkk
is always greater than one. This means that the performanceof a rectangular tank of L/W = 2 is better than a rectangulartank of L/W = 1.5 as far as and are concerned. But athigher values of ( > 0.5), the performance of therectangular tank of L/W = 2 is marginally better than thesquare tank. It is also observed from Fig. 3 that, for any given
, circular tanks produce lower values of the oxygen transfercoefficient than square tanks. At lower values of , theperformance of circular tanks is less than that of rectangulartanks; however, circular tanks produce better oxygen transferrates than rectangular tanks of L/W = 1.5 at high values(high speed). Non-uniform variation of the oxygen transfercoefficient, as shown in Fig. 2, may be attributed to variousparameters such as turbulence intensity, input power per unitvolume,non-uniform spacing around the impeller, etc.,whichneeds further investigation.
k XX X
Xk X
X
Simulation of Oxygen Transfer on the Basis ofEffective (Actual) Power per Unit Volume
As reported in the literature (Kozinski and King 1966;Hwang 1983; Hsieh 1991), the rates of oxygen transfer canbe correlated with effective power consumption per unitvolume. Figure 4 shows the behaviour of the oxygen transfercoefficient with input power per unit volume for square,circular and rectangular tanks. It is interesting to observe thatdata for an individual shape of an aerator fall on a uniquecurve, suggesting that the oxygen transfer rates can besimulated with the actual and effective power per unitvolume. After conducting statistical analysis of the data foran individual shape, the associated relationships have beenpresented in equations 21 to 24.
(21)� �� �0.55
185.064.410 ���
����
��
�
(For circular tanks)
(For square tanks)
(22)
(For rectangular tanks where L/W = 1.5)
(23)
(24)
(For rectangular tanks where L/W = 2)
Relative Performance of Surface Aeration Tankswith andk P
V
From Fig. 4 it is evident that for a given effective power perunit volume, circular tanks produce higher oxygen transfercoefficient than square and rectangular tanks. As far asrectangular tanks are concerned, values decrease as L/Wvalues increase.The reason for such behaviour in rectangulartanks may be due to the liquid tending to move along circulartrajectories, resulting in decreased relative velocities betweenimpeller and fluid, and weak radial flows directed towardsthe tank walls. The presence of sharp corners (in square andrectangular tanks) interrupts circular liquid patterns, andsuppresses the free surface vortex, which increases inputpower and small-scale mixing (because of stronger axialflow). This implies that flow energy decreases with an
(k)k
increasing aspect ratio. In addition, for the same value of theoxygen transfer coefficient, , square tanks require less powerper unit volume of water than rectangular tanks of L/W ratio1.5, and even less than rectangular tanks of L/W ratio 2 asshown in Fig. 4. Overall, circular tanks gave better re-aeration rates than all other tanks in terms of the input powerper unit volume of water. It is clear from Fig.4 that to achieve
k
Fig. 3. Relative performance of (b) rectangular tanks (2:1), (c)rectangular tanks (1.5:1) and (d) circular tanks on oxygentransfer rate, for any given X,compared to (a) square tanks.
� �� �33.0384.710 ���
����
��
� 0.55
� �� �13.064.410 ���
����
��
�0.55
� �� �1045.077.410 ���
����
��
�0.55
Rao et al.
32

Fig. 4. Simulation of oxygen transfer rate with actual power per unit volume,P .
Relative Performance of Surface Aeration Tanks
33
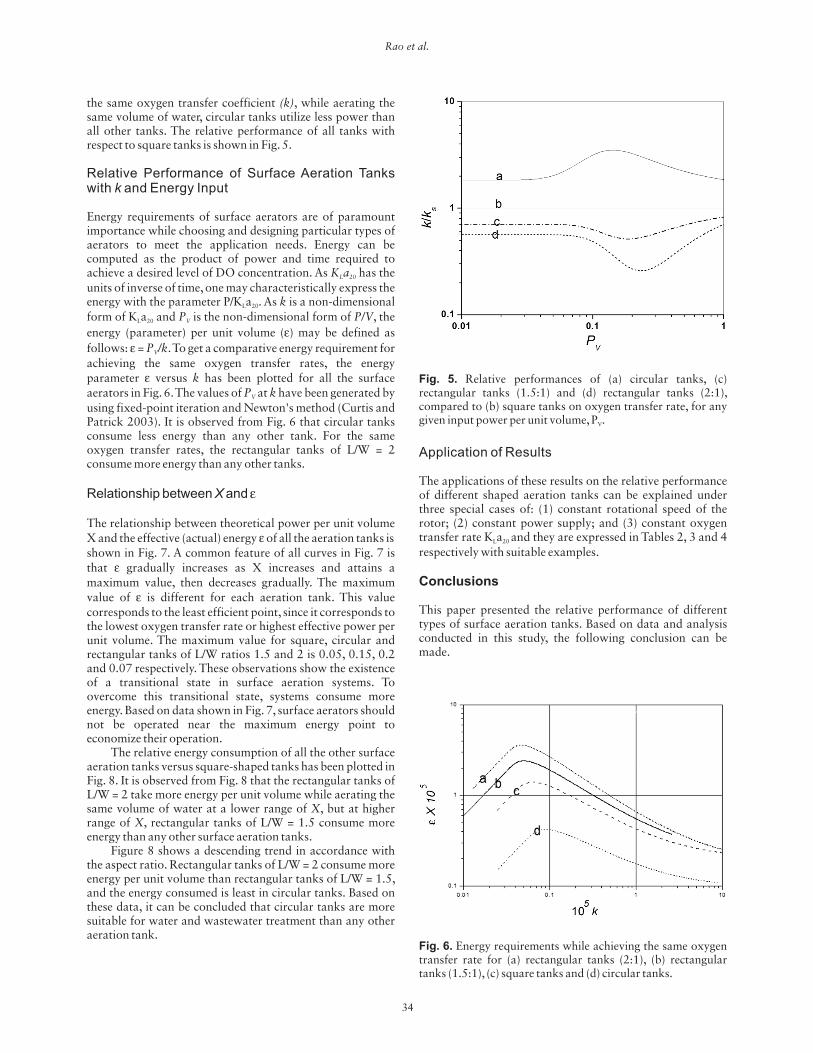
Fig. 5. Relative performances of (a) circular tanks, (c)rectangular tanks (1.5:1) and (d) rectangular tanks (2:1),compared to (b) square tanks on oxygen transfer rate, for anygiven input power per unit volume,P .
Fig. 6. Energy requirements while achieving the same oxygentransfer rate for (a) rectangular tanks (2:1), (b) rectangulartanks (1.5:1), (c) square tanks and (d) circular tanks.
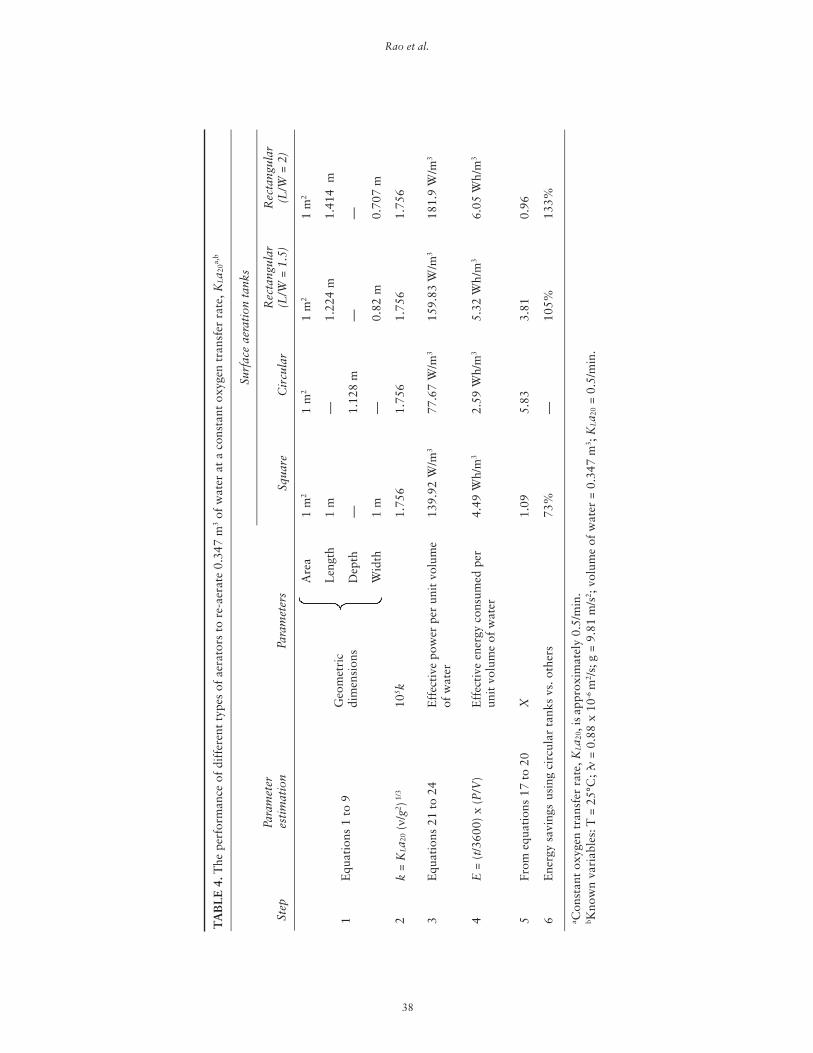
Application of Results
The applications of these results on the relative performanceof different shaped aeration tanks can be explained underthree special cases of: (1) constant rotational speed of therotor; (2) constant power supply; and (3) constant oxygentransfer rate K a and they are expressed in Tables 2, 3 and 4
respectively with suitable examples.
This paper presented the relative performance of differenttypes of surface aeration tanks. Based on data and analysisconducted in this study, the following conclusion can bemade.
L 20
Conclusions
the same oxygen transfer coefficient , while aerating thesame volume of water, circular tanks utilize less power thanall other tanks. The relative performance of all tanks withrespect to square tanks is shown in Fig.5.
Energy requirements of surface aerators are of paramountimportance while choosing and designing particular types ofaerators to meet the application needs. Energy can becomputed as the product of power and time required toachieve a desired level of DO concentration. As has the
units of inverse of time,one may characteristically express theenergy with the parameter P/K a . As is a non-dimensional
form of K a and is the non-dimensional form of , the
energy (parameter) per unit volume ( ) may be defined as
follows: = .To get a comparative energy requirement for
achieving the same oxygen transfer rates, the energyparameter versus has been plotted for all the surfaceaerators in Fig. 6.The values of at have been generated by
using fixed-point iteration and Newton's method (Curtis andPatrick 2003). It is observed from Fig. 6 that circular tanksconsume less energy than any other tank. For the sameoxygen transfer rates, the rectangular tanks of L/W = 2consume more energy than any other tanks.
The relationship between theoretical power per unit volumeX and the effective (actual) energy of all the aeration tanks isshown in Fig. 7. A common feature of all curves in Fig. 7 isthat gradually increases as X increases and attains amaximum value, then decreases gradually. The maximumvalue of is different for each aeration tank. This valuecorresponds to the least efficient point, since it corresponds tothe lowest oxygen transfer rate or highest effective power perunit volume. The maximum value for square, circular andrectangular tanks of L/W ratios 1.5 and 2 is 0.05, 0.15, 0.2and 0.07 respectively. These observations show the existenceof a transitional state in surface aeration systems. Toovercome this transitional state, systems consume moreenergy. Based on data shown in Fig. 7, surface aerators shouldnot be operated near the maximum energy point toeconomize their operation.
The relative energy consumption of all the other surfaceaeration tanks versus square-shaped tanks has been plotted inFig. 8. It is observed from Fig. 8 that the rectangular tanks ofL/W = 2 take more energy per unit volume while aerating thesame volume of water at a lower range of , but at higherrange of , rectangular tanks of L/W = 1.5 consume moreenergy than any other surface aeration tanks.
Figure 8 shows a descending trend in accordance withthe aspect ratio. Rectangular tanks of L/W = 2 consume moreenergy per unit volume than rectangular tanks of L/W = 1.5,and the energy consumed is least in circular tanks. Based onthese data, it can be concluded that circular tanks are moresuitable for water and wastewater treatment than any otheraeration tank.
(k)
K a
k
P P/V
P /k
kP k
XX
Relative Performance of Surface Aeration Tankswith and Energy Input
Relationship between and
k
X
L 20
V
V
V
L 20
L 20
�
�
�
�
�
�
�
Rao et al.
34

• The oxygen transfer coefficient is related to thetheoretical power per unit volume for rectangulartanks of L/W ratio 1.5 and 2 as expressed in equations 17and 18. Such equations developed earlier for square(equation 19) and circular (equation 20) tanks were alsoverified through further experiments.
• For a given , the oxygen transfer coefficient insquare tanks is always higher than that of circular tanks,whereas the rectangular tanks of L/W = 2 alwaysperformed better than the rectangular tanks of L/W =1.5. An interesting feature of rectangular tanks of L/W =2 is that they perform slightly better than the square
tanks beyond a value of 0.8 as reflected in Fig. 2and 3.
the effective (actual) power per unit volume for a
given shape of the tank. Simulation equations governingand were developed for all the three shapes of
surface aeration tanks as given in equations 21 to 24. It isestablished that for a given value of , the oxygen
transfer coefficient is the highest in circular tanksfollowed by square tanks (L/W = 1), rectangular tanks ofL/W = 1.5 and rectangular tanks of L/W = 2 as shown inFig.4 and 5.
• Among all the shapes, circular tanks were the mostenergy efficient as shown in Fig. 6. The next efficientshape was square followed by the rectangular tanks ofL/W = 1.5 and the least efficient were the rectangulartanks of L/W = 2.
• Although the square tanks were the best for quickaeration, they consumed more energy than the circulartanks, whereas circular tanks were the most energyefficient but required more time than the square tanks.
k(X)
X (k)
X
(P )
k P
P
(k)
≈
• It has been established that can also be simulated withk
V
V
V
Fig. 8. Energy characteristics of (a) rectangular tanks (2:1), (b)rectangular tanks (1.5:1) and (d) circular tanks, compared to(c) square tanks.
Relative Performance of Surface Aeration Tanks
35
Fig. 7. Energy characteristics of surface aeration tanks

TABLE 2. The performance of different types of aerators to re-aerate 0.347 m of water at a constant rotationalspeed of the rotor, N
Surface aeration tanks
StepParameterestimation Parameters Square Circular
Rectangular(L/W = 1.5)
Rectangular(L/W = 2)
Area 1 m 1 m 1 m 1 m
Length 1 m — 1.224 m 1.414 m
Depth — 1.128 m — —1 Equations 1 to 9
Geometricdimensions
Width 1 m — 0.82 m 0.707 m
2 Equations 17 to20
10 k 2.12 0.344 1.042 2.55
3 KLa (�/g ) 0.569/min 0.118/min 0.28/min 0.68/min
4 KLa KLaT 0.641/min 0.133/min 0.316/min 0.774/min
5 KLaT Time t required to reach80% saturation value
150.5 s 723.32 s 305.52 s 124.84 s
6 Equations 21 to24
Effective power per unitvolume of water
154 W/m 28 W/m 120 W/m 221 W/m
7 E = (t/3600) x(P/V)
Effective energy consumedper unit volume of water
6.44Wh/m
5.62Wh/m
10.2 Wh/m 6.44 Wh/m
8 Energy savings using circular tanks vs.others 14% — 81% 36%
Constant rotor speed, N = 80 rpm.The rotor is rotated at a constant speed until DO concentration, Ct, attains 80% of the saturation value. Assume
the initial DO concentration C = 0 at water temperature T = 25°C.
Known variables: T = 25°C; � = 0.88 x 10 m /s; g = 9.81 m/s ; volume of water = 0.347 m ; X = N3D2/g4/3�1/3 = 1.42
20KLaK=
Rao et al.
36

TA
BL
E3
.3
a,b
,c
Su
rface
aer
ati
on
tan
ks
Ste
pPara
met
eres
tim
ati
on
Para
met
ers
Sq
uare
Cir
cula
rR
ecta
ngu
lar
(L/W
=1
.5)
Rec
tan
gu
lar
(L/W
=2
)
22
22
5k
Ka
20
�g
21/3
Ka
20
Ka
20
Ka
Ka
t
Et
P/V
33
33
aP
/V3
bC
C0
c�
-62
23
Relative Performance of Surface Aeration Tanks
37
TA
BL
E4
.T
he
per
form
an
ceo
fd
iffe
ren
tty
pes
of
aer
ato
rsto
re-a
erate
0.3
47
m3
of
wate
rat
aco
nst
an
to
xygen
tran
sfer
rate
,L
20a,b
Are
a1
m2
1m
21
m2
1m
2
Len
gth
1m
—1
.22
4m
1.4
14
m
Dep
th—
1.1
28
m—
—1
Eq
uati
on
s1
to9
Geo
met
ric
dim
ensi
on
s
Wid
th1
m—
0.8
2m
0.7
07
m
2=
L2
0(�
/2)
1/3
10
51
.75
61
.75
61
.75
61
.75
6
3E
qu
ati
on
s2
1to
24
Eff
ecti
ve
po
wer
per
un
itvo
lum
eo
fw
ate
r1
39
.92
W/m
37
7.6
7W
/m3
15
9.8
3W
/m3
18
1.9
W/m
3
4=
(/3
60
0)
x(
)E
ffec
tive
ener
gy
con
sum
edp
eru
nit
vo
lum
eo
fw
ate
r4
.49
Wh/m
32
.59
Wh/m
35
.32
Wh
/m3
6.0
5W
h/m
3
5F
rom
equ
ati
on
s1
7to
20
1.0
95
.83
3.8
10
.96
6E
ner
gy
savin
gs
usi
ng
circ
ula
rta
nk
svs.
oth
ers
73
%—
10
5%
13
3%
aC
onst
ant
oxygen
transf
erra
te,
L2
0,is
ap
pro
xim
ate
ly0
.5/m
in.
bK
no
wn
vari
ab
les:
T=
25
°C;
?�=
0.8
8x
10
-6m
2/s
;g
=9
.81
m/s
2;
vo
lum
eo
fw
ate
r=
0.3
47
m3;
L2
0=
0.5
/min
.
Rao et al.
38
References
APHA, AWWA, WPCF.
Cook AL, Carr CC.
Curtis GF, Patrick WO.
Fair GM, Gayer JC, Okum DA.
Forrester SE, Rielly CD, Carpenter KJ.
53:Grisafi F, Brucato A, Rizzuti L.
136:Horvath I.
Hsieh C-C.
Hwang HJ.
Johnson AI, Huang C-J.2:
Kozinski AA, King CJ.
12:Lewis WK, Whitman WG.
16(12):Mahendraker V, Rabinowitz B, Mavinic DS.
40(2):McWhirter JR, Chern J, Hutter JC.
34:Metcalf & Eddy, Inc.
Oldshue JY.
Rao ARK125(3):
Rao ARK, Bharathi Laxmi BV, Subba Narasiah K.
39(3):Rao ARK, Jyothish S.
Schmidtke NW, Horvath I.
1985. Standard methods for theexamination of water and wastewater. 16 ed.AmericanPublic HealthAssociation,Washington,DC.
1947. Elements of electrical engineering.5 ed.Wiley,NY.
2003. Applied numerical analysis. 6ed.Pearson Education,Delhi, India.
1971. Elements of watersupply and waste water disposal. John Wiley and Sons,NewYork.
1998. Gas-inducingimpeller design and performance characteristics. Chem.Eng.Sci. 603–615.
1994. Solid liquid masstransfer coefficients in mixing tanks: influence of sidewall roughness. Inst. Chem. Eng. Symp. Ser.
571–578.1984. Modelling in the technology of wastewater
treatment.PergamonTarrytown,NewYork.1991. Estimating volatilization rates and
gas/liquid mass transfer coefficients in aeration systems.Ph.D. thesis. University of California, Los Angeles,Calif.,U.S.A.
1983. Comprehensive studies of oxygen transferunder nonideal conditions. Ph.D. thesis. University ofCalifornia,LosAngeles,Calif.,U.S.A.
1956. Mass transfer studies in anagitated vessel.AIChE J. 412–419.
1966. The influence of diffusivity onliquid phase mass transfer to the free surface in a stirredvessel.AIChE J. 109–116.
1924. Principles of GasAbsorption. Ind.Eng.Chem. 1215–1220.
2005.Comparison of Oxygen Transfer Parameters from FourTesting Methods in Three Activated Sludge Processes.Water Qual.Res. J.Canada 164–176.
1995. Oxygen MassTransfer Fundamentals of Surface Aerators. Ind. Eng.Chem.Res. 2644–2654.
2004. Wastewater engineering:treatment disposal and reuse. Tat McGraw-Hill, NewDelhi, India.
1985. Current trends in mixer scale-uptechniques, p. 309–340. Ulbrecht JJ and Patterson GK(ed.), Mixing of liquids by mechanical agitation. Gordonand Breach Science Publishers,NewYork.
1999. Prediction of reaeration rates in square,stirred tanks. J.Environ.Eng.-ASCE 215–233.
2004.Simulation of Oxygen Transfer Rates in Circularaeration Tanks. Water Qual. Res. J. Canada
237–244.1997. Oxygen transfer in circular
surface aeration tanks with and without baffles.Presented at the International Conference on IndustrialPollution and Control Technologies, Jawaharlal NehruTechnological University (JNTU), Hyderabad, India, 17to 19 November 1997.
1977. Scale-up methodology for
th
th
th
In
surface aerated reactors. Prog. Water Technol.477–493.
1991. Effect ofgeometrical parameters for overall oxygen transfercoefficient, p. 1577–1581. Proceedings of theSymposium on Environmental Hydraulics, University ofHong Kong,Hong Kong.
1988. Aeration and water treatment process.Manual of practice for water pollution control. WaterEnvironment Federation and American Society of CivilEngineers,Alexandria,Va.,U.S.A.
cross-sectional area of an aeration tank (L )width of the blade (L)initial concentration of dissolved oxygen at time
= 0 (ppm)
concentration of dissolved oxygen in the liquid
bulk phase (ppm)C copper losses
saturation value of dissolved oxygen at test
conditions (ppm)concentration of dissolved oxygen at any time
(ppm)diameter of the rotor (L)
, Froude number9.81 m/s acceleration due to gravity (L/T )depth of water in an aeration tank (L)distance between the top of the blades and thehorizontal floor of the tank (L)head loss due to rotational movement of the
water in an aeration tank (L)I , I input current at no load and loading
conditions respectivelyI iron losses
= =non-dimensional oxygen
transfer coefficientnon-dimensional oxygen transfer coefficient for
rectangular tanksnon-dimensional oxygen transfer coefficient for
circular tanksnon-dimensional oxygen transfer coefficient for
square tanksoverall oxygen transfer coefficient at room
temperature T°C of wateroverall oxygen transfer coefficient at 20°C
size of rectangular tank (L)length of the blade (L)rotational speed of the rotor with blades (1/T)number of rotor blades = 6power available to the rotor shaft (ML /T )Power per unit volume (M/LT )= ( )] = Non-dimensional power per
unit volumedischarge of water being pumped by rotorrotation (L /T)
/ , Reynolds number
volume of water in an aeration tank (m )
9:Udaya Simha L, Shrma KVNS, Rao ARK.
WEF, ASCE.
In
In
The following symbols are used in this paper:AbC
t
C
C
C
tDF N D/ggHh
h
k K a ( /g )
k
k
k
K a
K a
LlNnPP/VP P/[V g
Q
R ND
V
Notations
2
2 2
2 2
2
1/3
3
2
3
0
l
s
t
f
L
r
c
s
L T
L 20
V
L
1 2
L
20
2
2 1/3�
� �
�
Relative Performance of Surface Aeration Tanks
39

W width or breadth of the surface aeration tanksR armature resistance of DC motor
V , V input voltage at no load and loading
conditions respectively= /(g ) = = theoretical power perunit volume parameter1.024; constant for pure water used in equation 3
kinematic viscosity of water (M /T)
mass density of air (M/L )
mass density of water (M/L )
energy consumption per unit volume
a
1 2
a
w
X N D F R3 2 4/3 1/3 4/3 1/3
2
3
3
�
�
�
�
�
�
Recieved: May 25, 2005; accepted: February 1, 2007.
Rao et al.
40