Aeration Efficiency and Optimization - Environmental … in the aeration basins. Oxygen required is...
75
Make the most of your energy SM Aeration Efficiency and Optimization Lee E. Ferrell, P.E., BCEE, CEM, LEED Green Assoc. Tennessee Water Wastewater Utility Partnership
Transcript of Aeration Efficiency and Optimization - Environmental … in the aeration basins. Oxygen required is...

Make the most of
your energySM
Aeration Efficiency
and Optimization Lee E. Ferrell, P.E., BCEE, CEM,
LEED Green Assoc.
Tennessee Water Wastewater Utility
Partnership

2
Aeration in Water Wastewater
3
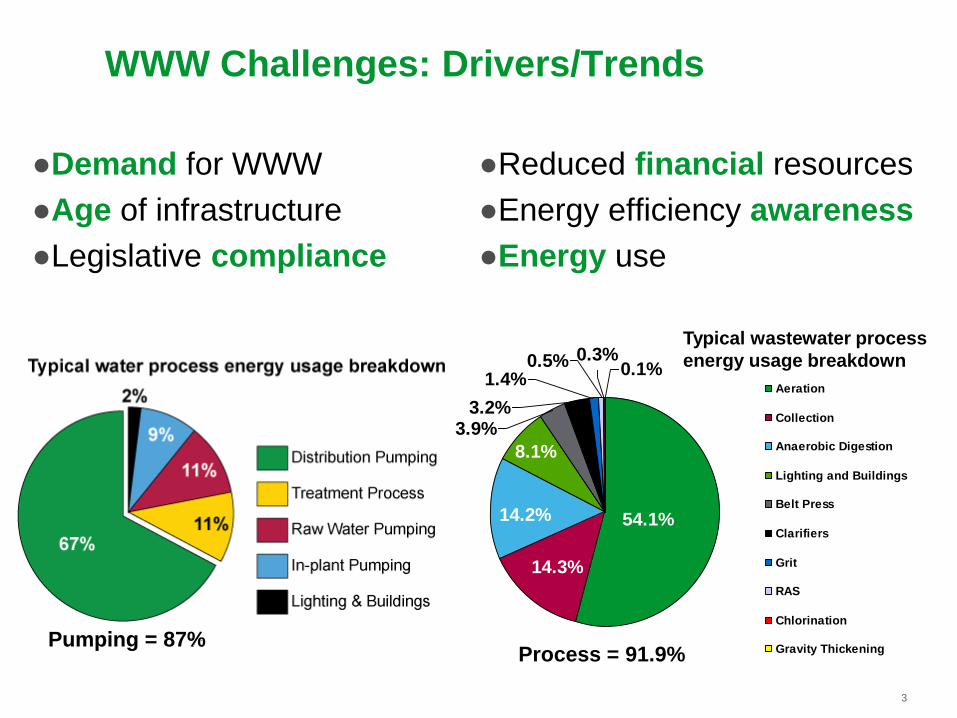
WWW Challenges: Drivers/Trends
●Demand for WWW
●Age of infrastructure
●Legislative compliance
●Reduced financial resources
●Energy efficiency awareness
●Energy use
Pumping = 87%
54.1%
14.3%
14.2%
8.1%
3.9%3.2%
0.1%0.3%
1.4%0.5%
Aeration
Collection
Anaerobic Digestion
Lighting and Buildings
Belt Press
Clarifiers
Grit
RAS
Chlorination
Gravity Thickening
Typical wastewater process
energy usage breakdown
Process = 91.9%

Water energy use
Wastewater energy use
71% of consumed electricity is used to
turn motors
65% of this energy is used for fluid
applications

5
Aeration System Overview and
Fundamentals

6
Overview
● The blower system:
Components End-use
– Water treatment
– Wastewater treatment
– Water distribution
– Power generation
– Irrigation
– Blower
– Motors, engines
– Piping
– Valves and fittings
– Controls and
instruments
– Heat exchangers
– Tanks
– Others
7
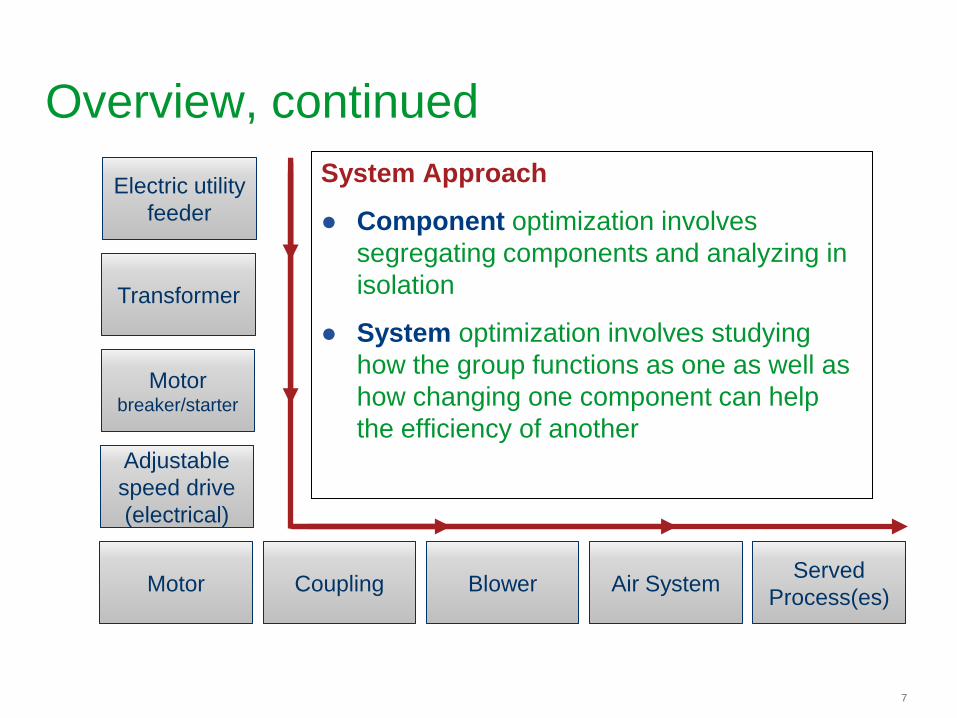
Overview, continued
Electric utility
feeder
Transformer
Motor breaker/starter
Adjustable
speed drive
(electrical)
Motor Coupling Blower Air System Served
Process(es)
System Approach
● Component optimization involves
segregating components and analyzing in
isolation
● System optimization involves studying
how the group functions as one as well as
how changing one component can help
the efficiency of another

8
Control Systems for Total Value Dissolved Oxygen (DO) Control to Minimize Air Flow Blower Control to Optimize Efficiency Direct Flow Control and Most Open Valve Control
to Minimize Pressure Blower Protection to Maintain Your Investment
Dresser Roots Wastewater Aeration Controls

9
It’s all about the bubbles!
DO Control Fundamentals

10
●Mechanical Aerators
●VFD Reduces Energy
●Challenge:
● Limit due to suspension
of solids
● Install submersed mixers
● Low Aerator speed
saves energy
● Mixer energy may be
less than savings
● Not needed at high
aeration
Aeration Energy

11
Jet or Diffused
Air ●Energy reduction via:
● Basin/Zone air control
● Blower control
●Challenge
● Air used to mix water
●Blower efficiency only as
good as air distribution

12
DO Control Fundamentals
Air is supplied to aeration basins in suspended growth diffused
air processes to provided oxygen needed to maintain biological
activity in the aeration basins.
Oxygen required is basically proportional to organic loading –
both BOD5 reduction and Nitrification
Air also provides mixing to keep the bacteria suspended and
aids in flocculation

13
DO Control Fundamentals
Aeration Control System Objectives:
Satisfy the Oxygen Demand of the Treatment Process
Achieve Process Requirements at the lowest
possible cost
14
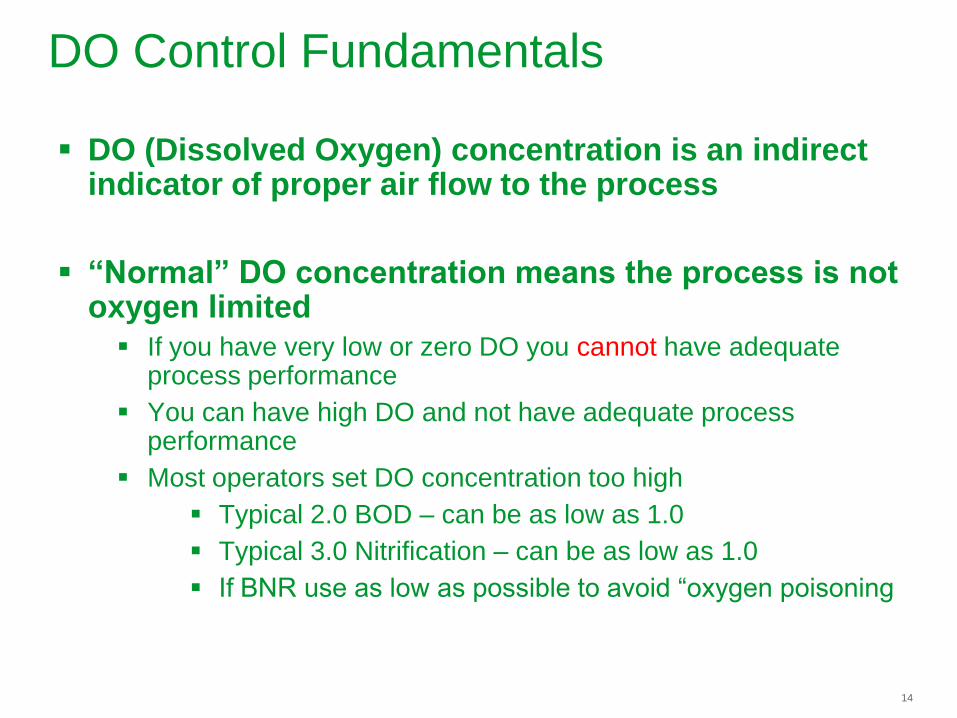
DO Control Fundamentals
DO (Dissolved Oxygen) concentration is an indirect indicator of proper air flow to the process
“Normal” DO concentration means the process is not oxygen limited
If you have very low or zero DO you cannot have adequate process performance
You can have high DO and not have adequate process performance
Most operators set DO concentration too high
Typical 2.0 BOD – can be as low as 1.0
Typical 3.0 Nitrification – can be as low as 1.0
If BNR use as low as possible to avoid “oxygen poisoning
15
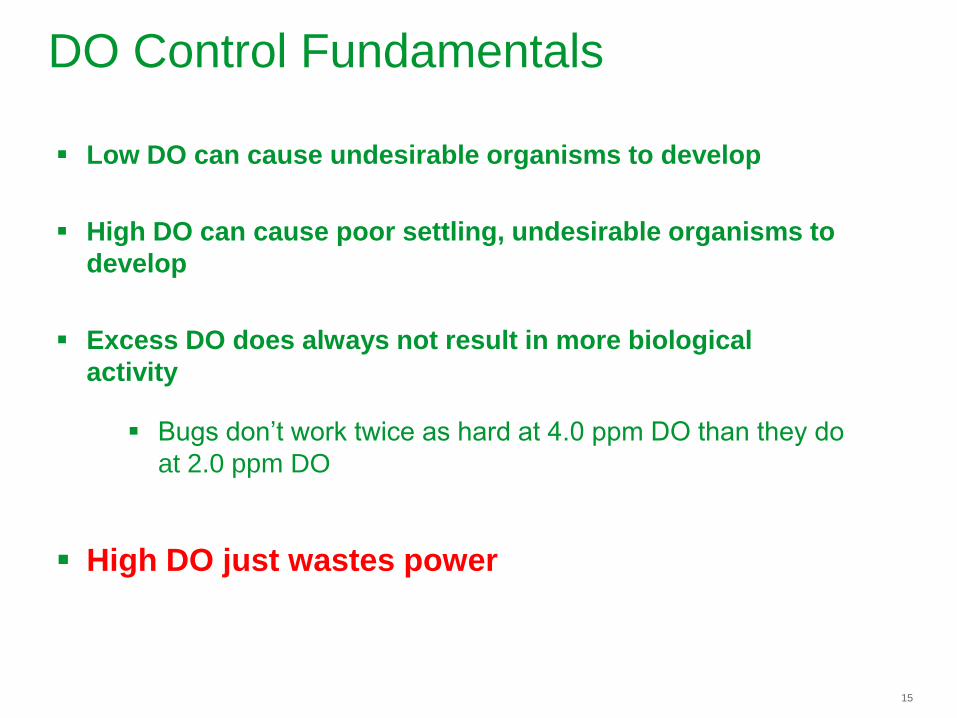
DO Control Fundamentals
Low DO can cause undesirable organisms to develop
High DO can cause poor settling, undesirable organisms to
develop
Excess DO does always not result in more biological
activity
Bugs don’t work twice as hard at 4.0 ppm DO than they do
at 2.0 ppm DO
High DO just wastes power

16
DO Control Fundamentals

17
DO Control Fundamentals
● O2 for Nitrification (NH3 to NO3):
● O2 for BOD5 Reduction:
RequiredO2_f or_BOD 1.1LbO 2
LbBOD
=
RequiredO2_for_Nitrifi cation 4.6LbO 2
LbNH3
=
In BNR systems denitrification typically recovers 25% of O2 used for
nitrification

18
DO Control Fundamentals
Total Air Flow Required:
SCFM0.335 mgd
OTEppmBODremoved1.1 ppmNH3converted4.6=
● OTE = Actual Oxygen Transfer Efficiency, Site Conditions
OTE is not a constant!
● mgd = Wastewater flow rate, million gallons per day
● SCFM = Air Flow Rate, Standard Cubic Feet per Minute (68°F, 14.7 psia, 36% RH)

19
DO Control Fundamentals
Oxygen Demand Varies in Time from Diurnal
Variations
12:00 AM
04:00 AM
08:00 AM
12:00 PM
04:00 PM
08:00 PM
12:00 AM
Time of Day
0
20
40
60
80
100
120
140
Flow
, % A
DF
Typical Diurnal Flow Variation
Ratio of Peak to Minimum Flow is Typically 2:1

20
OTE and DO Control
When load increases at a constant air flow DO
concentration drops
Concentration does not drop to zero because OTE
changes and may compensate for increased loading
OTE is NOT a constant!

21
OTE and DO Control
OTE Varies with Air Flow per Diffuser
OTE Variation with FlowDO ppm
4.0%
6.0%
8.0%
10.0%
12.0%
14.0%
0.00 1.00 2.00 3.00 4.00 5.00
SCFM per Diffuser
Ox
yg
en
Tra
ns
fer
Eff
icie
nc
y (
OT
E)
0.50 1.00 1.50 2.00 2.50 3.00 3.50

22
OTE and DO Control
OTE Varies with DO Concentration: OTE Variation with DO
SCFM per Diffuser
4.0%
6.0%
8.0%
10.0%
12.0%
14.0%
0.00 1.00 2.00 3.00 4.00
DO Concentration, ppm
Ox
yg
en
Tra
ns
fer
Eff
icie
nc
y (
OT
E)
1.00 2.00 3.00 4.00

23
OTE and DO Control
At steady state the Oxygen Transfer Rate (OTR)
demanded by the process is equal to the OTR provided
by the aeration system. When this is not true, the
process is not steady state and the DO concentration
changes until a new equilibrium is established at new
steady state conditions.
OTE SCFM air %O2 OTR OUR TankVolume

24
OTE and DO Control Response of DO to 20% Load Increase
Starting at 3.0 ppm DO
0.00
1.00
2.00
3.00
4.00
5.00
6.00
20.0 40.0 60.0 80.0 100.0 120.0
Oxygen Transfer Rate (OTR), kg/hr
DO
, p
pm
Oxygen Transfer Rate Variation with Air Flow
SCFM/diffuser1.0 2.0 3.0 4.0 5.0
Response to 20% Organic Load Increase
1) Initial operation at 50 kg/hr OTR, 2 SCFM per diffuser, 3.0 ppm DO
1
2
3
2) 20% load increase to 60 kg/hr OTR, 2 SCFM per diffuser, DO drops to 1.3 ppm3) Operation at 60 kg/hr OTR, air flow increases to 2.5 SCFM per diffuser,
restore 3.0 ppm DO
25% flow change required to
correct 20% load change!

25
DO Control
DO Control Operation:
Establish Targets (Setpoints)
Response to Deviations from Targets:
If DO > Setpoint reduce oxygen supply
If DO < Setpoint increase oxygen supply
Control basin and blower air flow

26
DO Control
● Automatic DO Control will save 25% to 40% of Aeration System Energy Compared to Manual Control

27
DO Control Savings Proportional to Driving Force of O2
Group Basin DO Control
Individual Basin DO and Air Flow Control with Most-Open-Valve
(MOV)
Individual Zone DO and Flow Control for Each Basin
Increased System Complexity Must Be Justified by
Increased Savings
28
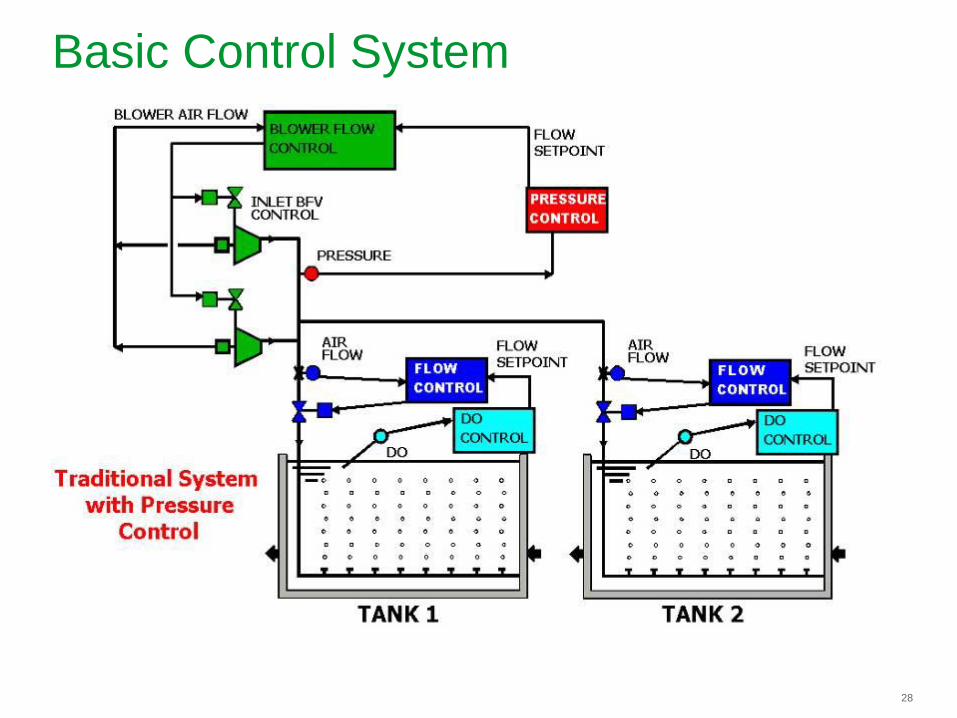
Basic Control System

29
Blower Control Concepts
The Purpose of Blower Control is to Provide the
Correct Air Flow
Process Requires Controlled Mass Flow Rate
Control Technique Varies With Type of Blower
Once the Optimum Aeration System Air Flow Has Been
Determined It Is Necessary to Provide the Correct Flow
From the Blowers
30
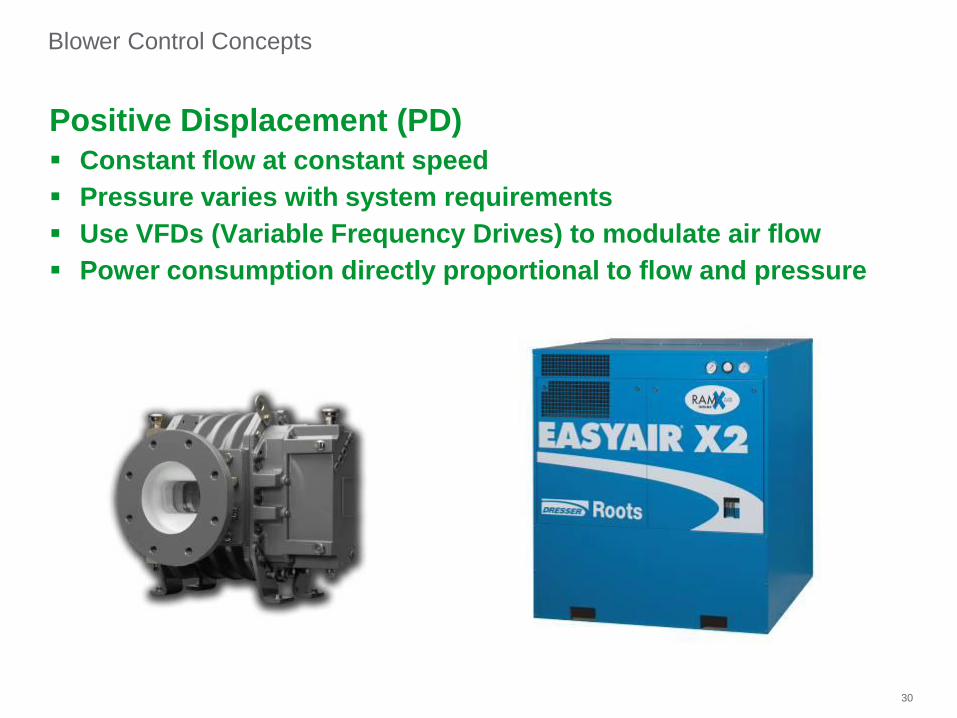
Positive Displacement (PD)
Constant flow at constant speed
Pressure varies with system requirements
Use VFDs (Variable Frequency Drives) to modulate air flow
Power consumption directly proportional to flow and pressure
Blower Control Concepts

31
Blower Control Concepts
12
212
412
612
812
1012
1212
1000 2000 3000 4000 5000
BLOWER SPEED (RPM)
ICF
M Performance
Design
12
17
22
27
32
37
42
47
52
57
1000 2000 3000 4000 5000
BLOWER SPEED (RPM)
BH
P @
Co
nsta
tnt
Pre
ssu
re
Performance
Design

32
Multistage Centrifugal
Variable flow at Approximately Constant Pressure
Usually controlled by inlet throttling to modulate flow
VFDs to modulate air flow will improve efficiency and
turndown (with appropriate curves)
Blower Control Concepts

33
Blower Control Concepts
100 20 30 40 50 60 70 80 90 100 110% MASS FLOW RATE
60
50
70
80
90
100
110
120
% G
AU
GE
PR
ES
SU
RE
100 20 30 40 50 60 70 80 90 100 110% MASS FLOW RATE
60
50
70
80
90
100
110
120
% G
AU
GE
PR
ES
SU
RE
100 20 30 40 50 60 70 80 90 100 110% MASS FLOW RATE
% P
OW
ER
60
50
70
80
90
100
110
40
AVERAGE TEMP
SYSTEM CURVE
NO CONTROLHIGH TEMP 100 F
NO CONTROLHIGH TEMP 100 F
NO CONTROL
AVERAGE TEMPINLET THROTTLED
AVERAGE TEMP 61 FINLET THROTTLED
NO CONTROL
AVERAGE TEMP 61 F
AVERAGE TEMPREDUCED SPEED 57.3 Hz
AVERAGE TEMPREDUCED SPEED 57.3 Hz

34
Single Stage Centrifugal
Variable flow
Pressure varies with load
High efficiency
Most common > 500 hp
Inlet Guide Vanes and/or Variable Discharge Diffusers to
modulate flow and improve turndown
Blower Control Concepts

35
Blower Control Concepts - IGV
100 20 30 40 50 60 70 80 90 100 110% MASS FLOW RATE
60
50
70
80
90
100
110
120
% G
AU
GE
PR
ES
SU
RE
100 20 30 40 50 60 70 80 90 100 110% MASS FLOW RATE
60
50
70
80
90
100
110
120
% G
AU
GE
PR
ES
SU
RE
100 20 30 40 50 60 70 80 90 100 110% MASS FLOW RATE
% P
OW
ER
60
50
70
80
90
100
110
40
STATIC PRESSURE
FRICTION LOSSES
MAX IGV OPENING
MAX IGV OPENING
REDUCED IGV OPENING
REDUCED IGV OPENING

36
Blower Control Concepts – Variable
DDV
100 20 30 40 50 60 70 80 90 100 110% MASS FLOW RATE
60
50
70
80
90
100
110
120
% G
AU
GE
PR
ES
SU
RE
100 20 30 40 50 60 70 80 90 100 110% MASS FLOW RATE
60
50
70
80
90
100
110
120
% G
AU
GE
PR
ES
SU
RE
100 20 30 40 50 60 70 80 90 100 110% MASS FLOW RATE
% P
OW
ER
60
50
70
80
90
100
110
40
STATIC PRESSURE
FRICTION LOSSES
MAX DDV OPENINGMIN DDV OPENING
MIN DDV OPENING
MAX DDV OPENING

37
Blower Control Concepts
100 20 30 40 50 60 70 80 90 100 110% MASS FLOW RATE
60
50
70
80
90
100
110
120%
GA
UG
E P
RE
SS
UR
E
100 20 30 40 50 60 70 80 90 100 110% MASS FLOW RATE
60
50
70
80
90
100
110
120%
GA
UG
E P
RE
SS
UR
E
MIN IGV at MAX DDV OPENING
MAX IGV and DDV OPENING
BEP
MIN IGV and DDV POSITION
X
Dual Vane Operation Maintains Efficiency
38
Blower Control Concepts
Evaluate Total Blower Performance
Equipment Cost
Installation Cost
Maintenance Cost
ENERGY COST

39
Blower Energy Evaluation Use realistic inlet conditions
Average temperature and pressure
Include inlet losses
Use expected range of operating air flow
The Blower With the Highest Design Point Efficiency May Not
Provide Lowest Power Consumption
Include control system characteristics in evaluation
Determine if energy payback justifies higher initial investment

40
[
[
[
Aeration
Basin
Aeration
Basin
Manual Diffused Air Control Scheme
Aeration
Basin
Blower
Blower
Blower
DO DO
DO
●Advantages
● Economical Construction
●Disadvantages
● Energy Intensive
● Efficiency = Continual adjustment
●Solution
● Motor Starters/RVSS
41
[
M
[
M
[
M
Aeration
Basin
Aeration
Basin
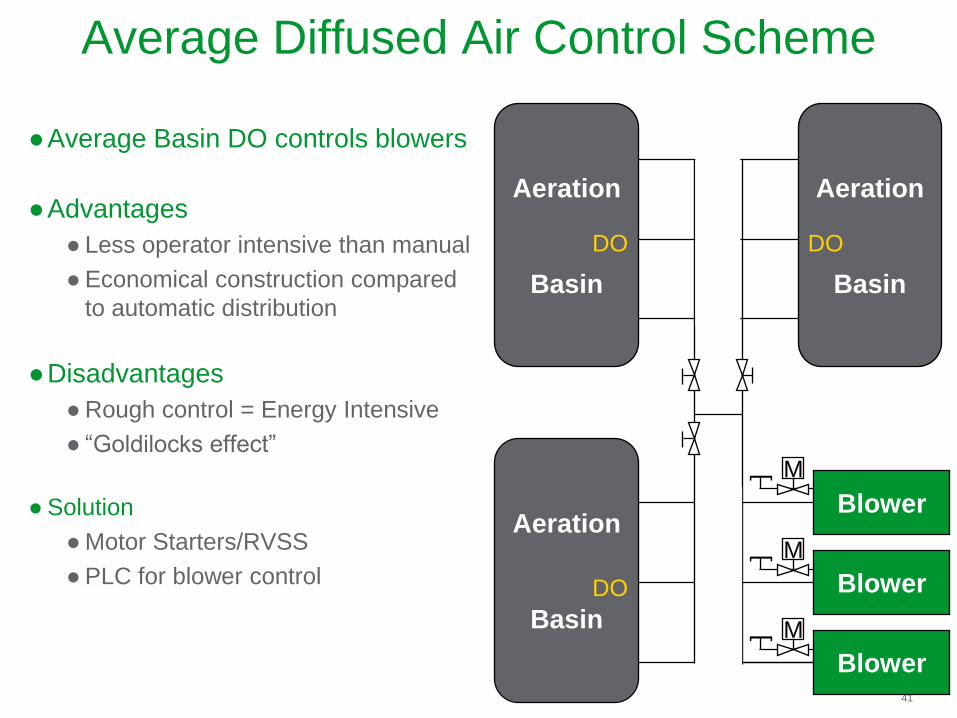
Average Diffused Air Control Scheme
Aeration
Basin
Blower
Blower
Blower
DO DO
DO
●Average Basin DO controls blowers
●Advantages
● Less operator intensive than manual
● Economical construction compared
to automatic distribution
●Disadvantages
● Rough control = Energy Intensive
● “Goldilocks effect”
● Solution
● Motor Starters/RVSS
● PLC for blower control

42
Aeration
Basin
Aeration
Basin
Basin Control Schemes
) (
) (
Aeration
Basin
M
DO DO
DO
M
) (
●Each Basin Controls DO
● Flow to each basin measured
● Blowers adjusted to meet total
demand
●Advantages
● More accurate control
● Manual observation eliminated
●Disadvantages
● Inter-basin DO variation
●Solution
● Motor Starters / RVSS
● PLC for Basin and Blower Control
M
[
M
[
M
[
M
Blower
Blower
Blower

43
Aeration
Basin
Aeration
Basin
Multi Zone Control Scheme
M
M
M
M
M
M
) (
Aeration
Basin
M
M
M
) (
)
(
) (
)
(
) (
) (
)
(
) (
DO
DO
DO
DO
DO
DO
DO
DO
DO
●Each zone controls its DO
●Advantages
● Greatest energy savings
● No/Low operator intervention
● Minimize inter-basin DO variation
●Disadvantages
● Most expensive to construct
● Energy Savings / Process Stability Tradeoff
●Solution
● Motor starters/RVSS
● PLC
●Basin valve control
●Blower inlet valve control
[
M
[
M
[
M
Blower
Blower
Blower

44
● Inlet Throttling
● Traditional method
● Inlet Valve controls air volume
● Fixed speed
●Fixed curve
●Surge is at fixed
power/amperage
● Surge done through:
●Current meter
●Power meter

45
VFD Based Blower Control
●Better energy savings then inlet throttling valve
●But with limits
●Must design differently

46
P.D.
Blowers
under
different
rules

47
● Curve sized for 60 Hertz
● Throttled to meet
demand
● Surge Control via power
or current meters
●Curve sized for 80%
operating time
●Full Speed
● ~ 10% of the time
● Accept Power &
Pressure rise
●Surge control
algorithm with flow
Inlet Throttling
VFD

48
Blower Energy Evaluation
12:00 AM 04:00 AM 08:00 AM 12:00 PM 04:00 PM 08:00 PM 12:00 AM
Time of Day
0%
50%
100%
150%
0%
% o
f A
ve
rag
e
Air Estimated Air Typical Diurnal Flow Variation

49
Flow Control Basics
DO concentration depends on air flow, NOT on
Pressure
Blowers create air flow, not pressure
The system creates pressure through resistance to air
flow

50
Flow Control Basics
What is operating point?

51
Flow Control Basics The System Curve identifies the relationship between flow
and back pressure (resistance to flow)

52
Flow Control Basics Combining the System Curve and the Blower Curve
defines the actual operating air flow

53
Pressure Control Basics
DO is not a function of system pressure. DO control
requires control of air flow only.
Blower control means modulating air flow rates.
Pressure control is designed to minimize interference
between basins and to coordinate blower output and
basin air flow demand.
Use of direct flow control and MOV logic to reduce
pressure and power

54
Excess Pressure Simply Wastes Power
Pressure Control

55
Pressure Control
Pressure control has a number of problems:
Problems with Pressure Control:
Instability
Basin and blower control loops “fight” each other
Difficulties operating at extremes of blower capacity
Interactions with multiple basins
Tuning difficulties and re-tuning requirements
Inherent PID tuning complications
One blower vs. two blowers running
Night vs. day operation
Wasted power – 10% or more

56
Direct Flow Control

57
Direct Flow Control
Basin Air Flow Control Saves Power Because “Identical”
Basins Don’t Perform Identically
Variations Due to Influent Channels
Variations Due to RAS
Variations Due to Air Piping and Manual Valve Adjustments
Direct Flow Control Approach
Summation of basin flow requirements = total blower flow
Δ flow, not absolute setpoint
Modulate blowers into safe operating range

58
Eliminates need for pressure control to save power and energy
cost
Totalize changes in air flow for tanks and modulate blowers air
flow accordingly
Integrate air flow control at BOTH ends of air piping
Direct Flow Control

59
Most-Open-Valve Control Concepts
Excess blower discharge pressure wastes power
Operators tend to set pressure setpoint too high –
often 1 to 1.5 psig above requirement
Optimum energy use is achieved when the pressure in the
header is just enough to overcome static pressure plus friction
loss through the worst case diffuser
header
Most-Open-Valve Control is a technique for power minimization,
not a blower control or DO control technique

60
Most-Open-Valve Control Concepts
Impact of excess pressure on blower power:
PD blowers: very significant
Inlet throttled multi-stage centrifugals: minor
Inlet guide vane controlled single-stage or multi-stage centrifugals: significant
VFD controlled multi-stage centrifugals: very significant

61
Most-Open-Valve Control Concepts
Most-Open-Valve (MOV) implies that one basin air flow control
valve is at maximum position to minimize system pressure
MOV logic is independent of blower control logic
Older style pressure control based systems typically use a
changing pressure setpoint based on valve positions

62
Energy Efficiency in Pumps and Blowers • Load Characteristics
Water Wastewater Load Characteristics
Variable
Torque
Constant
Torque
Constant
Power
Typical
Applications
Centrifugal Pumps
and Blowers
Positive
Displacement
Pumps, Blowers,
Mixers, and
Chemical Feed
Pumps
No applications
Energy
Savings
Potential
Substantial
Potential – Largest
of all VFD
applications
Lowest Potential No Potential
The Main
Target ( first
priority) The Next
Step ( second
priority)
63
VFD Benefits with Blowers

64
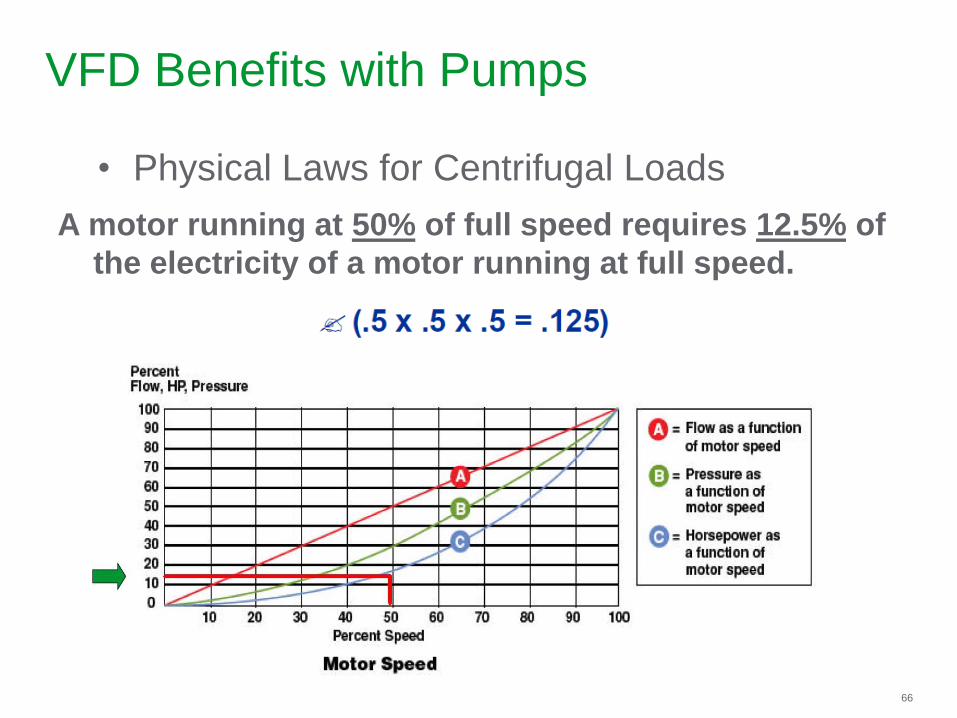
VFD Benefits with Pumps
• Physical Laws for Centrifugal Loads
Its Pure Physics: Due to the laws that govern centrifugal pumps,
the flow of water decreases directly with pump speed
Affinity laws of centrifugal loads :
Flow = f (motor speed)
Pressure = f (motor speed)2
Power = f (motor speed)3

65
VFD Benefits with Pumps
• Physical Laws for Centrifugal Loads
A motor running at 80% of full speed requires 51% of
the electricity of a motor running at full speed.
66
• Physical Laws for Centrifugal Loads
A motor running at 50% of full speed requires 12.5% of
the electricity of a motor running at full speed.
VFD Benefits with Pumps

67
Aeration Efficiency and Optimization

68
Efficiency of Blower Systems
psiapressure,inlet Blower p
psiapressure, dischargeBlower p
1X
factor adiabaticBlower X
efficiencyη
psiapressure,inlet Blower p
ICFM flowrate, metricinlet voluBlower Q
i
d
283.0
i
i
d
p
p
• Equations for efficiency
)**(
)**(*011503.0
geEnergy UsaBlower
DriveBlowerMotor
i XpQkW
Q
kW
MGD
kW
tMeasuremen EfficiencyBlower
)*011503.0(
)**(
)*011503.0(
)**(**
air toWirekW
XpQ
kW
XpQ
i
iDriveBlowerMotor

69
Blower Energy Optimization is Complex
• Simple Guidelines for reducing
energy usage
Match blower airflow to the process
requirements
Minimize system discharge pressure and
inlet losses
Provide flexibility and adequate turndown
for loading variations

70
VFD Benefits with Blowers
• Other Benefits
In addition to Energy Saving, using a VFD has many other
advantages:
• Less mechanical stress on motor and system
• Less mechanical devices - Less Maintenance
• Process regulation with PID regulators, load management
functions
• Reduce noise, resonance avoidance
• Performance and flexibility, range settings, above base
operations
• Easier installation and settings, drive mechanics
• Can be controlled with Automation, Communication networks

71
Process Energy Optimization
Automation is the Key
• Develop consistent and appropriate milestone and deliverable expectations
• Standardize program schedule tracking requirements
• Establish key energy management performance metrics
• Produce meaningful reports that allow for clear and concise decision-making
• Install additional monitoring equipment as needed
72
Benchmarking and Key
Performance Indicators

73
Possible Benchmarking KPIs
• kWh/MG
• kWh/OTR
• kWh/lb BOD Removed
• kWh/TSS Removed

74
Thank you for your time
Lee E Ferrell, P.E., BCEE
Schneider Electric Water Wastewater Competency Center
864-784-1002
http://www.schneider-electric.us/solutions/water-wastewater/

75
Appendix