Advances in Engineering...
38
WINTER 2013 1 WINTER 2013 Advances in Engineering Education A Tutorial Design Process Applied to an Introductory Materials Engineering Course REBECCA ROSENBLATT Illinois State University Normal, IL ANDREW F. HECKLER The Ohio State University Columbus, OH AND KATHARINE FLORES Washington University St. Louis, MO ABSTRACT We apply a “tutorial design process”, which has proven to be successful for a number of physics topics, to design curricular materials or “tutorials” aimed at improving student understanding of important concepts in a university-level introductory materials science and engineering course. The process involves the identification of instructional goals, the identification of specific student dif- ficulties, the iterative design of interactive tutorials, the implementation of interactive group-work recitations, and assessment. The project, which involved over 1000 students, included extensive interviewing, testing, and iterative classroom implementation over a period of three years. Here we report on some of the identified student difficulties, several of the tutorials designed to address the difficulties, and the results of the implementation. The project has yielded 9 field-tested 48 minute tutorials in which students work together in small groups on the tutorials in the presence of teaching assistants who assess and facilitate student progress. To determine the learning outcome, we ana- lyzed final exam scores and found that, even accounting for the fact that slightly “better” students tended to attend recitations more often, there was a significant valued-added effect of the recita- tions on final exam performance. These results suggest that these recitation methods and materials are effective in teaching students the difficult and important conceptual materials which they were designed to address. Furthermore, since this process was initially designed for physics courses yet is also successful for an engineering course, this implies that this process may be successful for a wide range of STEM courses.
Transcript of Advances in Engineering...

WINTER 2013 1
WINTER 2013
Advances in Engineering Education
A Tutorial Design Process Applied to an Introductory Materials Engineering Course
REBECCA ROSENBLATT
Illinois State University
Normal, IL
ANDREW F. HECKLER
The Ohio State University
Columbus, OH
AND
KATHARINE FLORES
Washington University
St. Louis, MO
ABSTRACT
We apply a “tutorial design process”, which has proven to be successful for a number of physics
topics, to design curricular materials or “tutorials” aimed at improving student understanding of
important concepts in a university-level introductory materials science and engineering course. The
process involves the identifi cation of instructional goals, the identifi cation of specifi c student dif-
fi culties, the iterative design of interactive tutorials, the implementation of interactive group-work
recitations, and assessment. The project, which involved over 1000 students, included extensive
interviewing, testing, and iterative classroom implementation over a period of three years. Here we
report on some of the identifi ed student diffi culties, several of the tutorials designed to address the
diffi culties, and the results of the implementation. The project has yielded 9 fi eld-tested 48 minute
tutorials in which students work together in small groups on the tutorials in the presence of teaching
assistants who assess and facilitate student progress. To determine the learning outcome, we ana-
lyzed fi nal exam scores and found that, even accounting for the fact that slightly “better” students
tended to attend recitations more often, there was a signifi cant valued-added effect of the recita-
tions on fi nal exam performance. These results suggest that these recitation methods and materials
are effective in teaching students the diffi cult and important conceptual materials which they were
designed to address. Furthermore, since this process was initially designed for physics courses yet
is also successful for an engineering course, this implies that this process may be successful for a
wide range of STEM courses.

2 WINTER 2013
ADVANCES IN ENGINEERING EDUCATION
A Tutorial Design Process Applied to an Introductory
Materials Engineering Course
Key Words: Conceptual diffi culties, Graphs and diagrams, Group-work, Materials Science, Tutorials
INTRODUCTION
In the area of physics education, an iterative process of design and implementation of instructional
units called “tutorials” has been shown to be very effective in improving student understanding of
a wide variety of physics topics. In this paper, we describe the application of a version of this highly
successful process to a university-level introductory materials science and engineering course. We
begin with a brief general description of the tutorial design process. Following this, the remainder
of the paper consists of a description of our application of this process in a multi-year project to
design, implement and assess of the effectiveness of tutorials for an introductory course in materi-
als science and engineering.
TUTORIALS AND THE TUTORIAL DESIGN PROCESS
The process of curricular and instructional development which we will refer to as the tutorial design
process was fi rst developed and implemented over 20 years ago by the University of Washington’s
Physics Education Research group, led by Lillian McDermott (McDermott et al., 2002; McDermott
1991; Shaffer & McDermott, 1992). It has been applied to numerous topics in Physics including elec-
tric circuits (Shaffer & McDermott, 1992), force and motion (e.g., McDermott, Shaffer, & Somers,
1994; Shaffer & McDermott, 2005; Heron et al., 2003), intermediate mechanics, (Ambrose, 2004),
geometric optics, (Wosilait et al., 1998), interference and diffraction of light, (Wosilait et al., 1999),
pressure, (Loverude, Heron & Kautz, 2010), sound (Wittmann, Steinberg & Redish, 2003), quantum
mechanics (Singh, 2008; Wittmann, Morgan & Bao, 2005; Bao & Redish, 2002), and special relativity
(Scherr, Shaffer & Vokos, 2002). These studies have also demonstrated that the implementation in
the classroom has resulted in signifi cant, consistent gains in conceptual understanding, reasoning
and simple problem solving. Based on much of this research, several groups have published tutorial
workbooks for introductory physics (McDermott et al., 2002; Wittmann, Steinberg & Redish, 2005).
A large and comprehensive study has demonstrated that application of the tutorial method in intro-
ductory mechanics (using the workbook of McDermott et al., 2002) results in consistent gains for
instructors with a variety of backgrounds and experience (Pollock & Finkelstein, 2008). Finkelstein
and Pollock (2005) have also identifi ed and investigated key conditions of implementation.

WINTER 2013 3
ADVANCES IN ENGINEERING EDUCATION
A Tutorial Design Process Applied to an Introductory
Materials Engineering Course
Development of Tutorial Materials and Methods
The development of tutorial materials and methods is an iterative and often parallel rather than
serial process consisting of four tasks, outlined in Table 1. The outline of the development of tutorial
materials and methods is simple and straightforward, however, several of the tasks often require
signifi cant time and effort, and there is signifi cant overlap among tasks. The outline describes key
features of the tutorial design process and is based on the work mentioned above and summarized
in articles such as McDermott (1991) and McDermott (2001).
The fi rst task is to identify a target content topic and instructional goals. Prevalent and widely
accepted goals for standard introductory courses can be identifi ed, for example, via interviews of
course instructors and analysis of the syllabus and textbooks. It should be noted that tutorials usually
focus on conceptual understanding and scientifi c reasoning rather than, for example quantitative
problem solving or memorization.
The second task is to identify and characterize specifi c student diffi culties with the target topic.
This task is considered a fundamental component of the tutorial design process, and typically
involves student interviews and testing over a period of a year or more. This task is critical for
providing specifi c and useful information for the iterative development of materials, methods and
assessments. Furthermore, the careful identifi cation of specifi c student diffi culties often results in
a modifi cation of instructional goals.
The third task is to construct specifi c material and methods aimed at addressing student diffi cul-
ties. The typical strategy is to present questions that will reliably elicit specifi c student diffi culties,
engage the students in confronting the diffi culty, and providing activities and exercises that help
them to resolve the diffi culty. It is common to use multiple representations including graphs, dia-
grams, equations, and an emphasis on clear, logical explanations. The exercises often stem from the
interview questions posed to students in the previous task to discover student diffi culties.
The fourth task is fi eld testing and assessment of effectiveness. Field testing typically requires
several iterations of material and methods revisions over several semesters. Assessment of the
Table 1. Outline of the iterative development of tutorial materials and methods.
Task Resources
1. Identifi cation of target content topic and instruc-tional goals
2. Identifi cation and characterization of student diffi -culties with target topic.
3. Construction of interactive small-group tasks aimed at the instructional goals and addressing specifi c student diffi culties.
4. Field-testing and assessment of effectiveness.
Instructor interviews, syllabus, and textbook.
Student interviews, instructor interviews, test performance, exist-ing Education Research. Findings from Task 2, fi ndings from education research, existing materials from instructors, textbooks.Test and homework performance, in-class interaction, feedback from TA’s and course instructors

4 WINTER 2013
ADVANCES IN ENGINEERING EDUCATION
A Tutorial Design Process Applied to an Introductory
Materials Engineering Course
effectiveness typically emerges as part of the process of instructor/teaching assistant (TA) feedback
and construction of key questions and problems that diagnose student understanding. A
distinct advantage of this process is that the materials are empirically tested in classrooms so
they are known to function in a real classroom environment.
Implementation of Tutorials
The development and the implementation of tutorials are closely related, since the development
includes several iterations of implementation. However, there are a number of important issues and
factors in implementation that are separate from development of materials and methods. Finkelstein
and Pollock (2005) discuss critical features of implementation at several levels, including at the level
of the task, the classroom environment, the course structure and the support at the departmental
and university level. Here we will briefl y describe some of the key conditions of implementation, as
outlined in Table 2. The extent to which each condition alone is important has not been rigorously
investigated. However, the conditions described here are common to most tutorial implementations
that have demonstrated success in student learning. The fi rst condition is the use of well-developed
tutorial materials, using the tutorial design process described above.
The second and third conditions describe the format of the tutorial class activity. Students are
placed in groups of 3 or 4, and they actively participate in the tutorial activity. The TA’s facilitate
student participation and elicit more complete and correct student explanations by asking the stu-
dents well-posed questions that respond to the immediate student diffi culties. The role of the TA
is not to provide explanations, but to have students provide explanations.
The fourth condition is TA preparation. There are two components to this. First, the TA’s must learn
the skills of facilitating student explanations and handling the group-work environment. Second,
the TAs must be fully prepared for the specifi c issues of each week’s tutorial. Particularly, the TAs
must be aware of common, specifi c student diffi culties that will arise that week and be prepared
with key questions that can help students to progress.
1. Well-developed tutorial tasks which challenge students, illicit diffi culties, and provide pathways for resolution.2. Class is structured in group-work, active participation format.3. TA’s continually emphasize and facilitate complete explanations from students. TA’s do not simply give explana-
tions and answers. 4. TA’s are prepared weekly for specifi c student diffi culties that go with each tutorial and general skills in group
facilitation. 5. Tutorial material is explicitly tested on course exams.
Table 2. Critical conditions for tutorial implementation.

WINTER 2013 5
ADVANCES IN ENGINEERING EDUCATION
A Tutorial Design Process Applied to an Introductory
Materials Engineering Course
Finally the fi fth condition is to support the importance of the tutorial material by placing ques-
tions on exams that are explicitly based on tutorial materials.
Relevant previous work in material science engineering
Several previous studies have identifi ed and described a number of student diffi culties with con-
cepts in introductory materials science (Krause, Decker & Griffi n, 2003; Krause, Tasooji & Griffi n, 2004;
Kitto 2008; Krause et al, 2010). In addition, a “Materials Concept Inventory” has been developed to
assess a very basic conceptual understanding for some of the topics in materials science (Krause,
Decker & Griffi n, 2003; Krause et al., 2010a). Krause and collaborators (Krause et al., 2010b) have
also categorized some materials science “misconceptions” and investigated how different meth-
ods of instruction affect these categories of misconceptions. They found that interactive concept
sketching activities were the most effective at raising scores on the Materials Concept Inventory,
followed by interactive concept card sorting activities, interactive discussions and passive lecture
(in order of decreasing effectiveness).
In this study, we have used some of the these previous fi ndings on student diffi culties as a start-
ing point to characterize and investigate in more detail identifi ed diffi culties as well as investigate a
wide range of additional student diffi culties with basic materials science concepts. Therefore some
of the information from previous studies about student diffi culties has in a sense become a part of
the tutorial design process.
In this paper we use the term student diffi culty instead of the term misconception. This is done
because much of the literature uses the term misconception to mean an elaborate and coherent
student belief. Here we are usually measuring and defi ning an area of diffi culty as diffi culty cor-
rectly answering test like conceptual questions. We therefore have made an effort to avoid the term
misconception. Some of the student diffi culties we report are most likely misconceptions and some
are most likely not.
APPLICATION TO AN INTRODUCTORY MATERIALS SCIENCE COURSE
In the remainder of this paper we will describe the application of the tutorial design process to
an introductory materials science and engineering course. This includes iterative designing and
fi eld-testing tutorial materials and methods, implementing tutorials in the classroom, and assessing
the effectiveness. We begin with a description of the identifi cation of the instructional goals of the
course, and we also present important information regarding the general aspects of the design and
implementation of the tutorials as well as data accumulation methods.

6 WINTER 2013
ADVANCES IN ENGINEERING EDUCATION
A Tutorial Design Process Applied to an Introductory
Materials Engineering Course
Initial Exploration of Course Goals
The course is a standard course in introductory materials science and engineering at the col-
lege level. The course is required by many engineering majors at Ohio State University. The topics
covered are well-represented by the textbook of the course, which is the common textbook by
Callister (2007).
At the beginning of the project, we interviewed 5 faculty who had recently taught the course
and asked them what they saw as the goals of instruction of the course. Perhaps as to be expected,
there were common themes to the responses. First, specifi c topics were mentioned, such as material
properties, diffusion, defects, fatigue etc. – topics that were usually chapters in the text. Second, the
instructors also described more general goals, and we found fi ve general goals commonly stated.
The goals are listed in Table 3.
The overwhelming message from the instructors was that basic conceptual understanding of basic
materials science ideas was the most important goal. This goal lends itself well to the tutorial design
process, which is typically aimed at conceptual understanding and basic reasoning. Therefore the con-
tent topics chosen for the tutorials were closely aligned with lecture topics and chapters in the textbook
and we focused on conceptual understanding, keeping in mind the general goals in Table 3.
Recitation Format
The course consisted of three lecture and one recitation class per week. Recitations were 48
minutes in duration, and recitation attendance was voluntary. The number of the students per class
varied but was on average 20 to 25 students. A senior experienced instructor, usually a faculty
member, and two teaching assistants, typically graduate or undergraduate students, were present
for each recitation. Students worked in groups of 3 or 4 to complete the tutorials and instruc-
tors circulated to answer questions, ask questions of the groups, and in general facilitate the ac-
tivities. About 37% percent of students typically attended recitations, or every student attends on
Table 3. General goals of the introductory materials science course identifi ed by
instructors
1. Understanding of basic defi nitions, e.g., yield strength.2. Basic understanding of major concepts, e.g., fatigue, diffusion.3. Basic understanding of the relation between structure, processing, and properties.4. Conceptual intuition for basic properties of common materials and material classes.5. Basic conceptual understanding of material selection, e.g. necessity of tradeoffs.6.* Ability to interpret and use basic materials science graphs and diagrams
Note. The sixth goal was identified in the course of this study, as a result of discovering pervasive student difficulties with graphs and diagrams.

WINTER 2013 7
ADVANCES IN ENGINEERING EDUCATION
A Tutorial Design Process Applied to an Introductory
Materials Engineering Course
average 3.4 recitations out of nine total. This attendance rate is similar to the attendance rate of
the traditional recitations used before the tutorials, which typically consisted of mini-lectures and
discussion of solutions to homework problems. Therefore the tutorials themselves did not appear
to signifi cantly affect attendance. Data from the most recent quarter of tutorial implementation had
an attendance of 62% or about every student going to 5 recitations out of the eight available that
quarter. This suggests that the tutorials might have a small, positive effect on attendance. However,
other factors such as instructor encouragement, student population, etc. might have contributed
to and/or be the cause for this increase.
The Importance of TAs to Facilitate the Tutorials
Instructor preparation for the tutorials is a critical component of the implementation. While the
tutorials consist of carefully constructed questions, they are designed to be complemented by ques-
tions and dialog between the students and the teaching assistants (TAs). Every week the TAs have
an hour long training session in which they discuss the correct answers to the tutorials, diffi culties
they can expect students to have, how to assess what diffi culties the students are having, and how to
guide students to overcome their diffi culties by asking thoughtful and responsive questions instead
of simply telling the student the correct answer. As a result of TA training, the TAs are prepared for
potential issue and have prepared ways to help students. Effective dialog between the students
and TAs is critical for the tutorials to be successful and preparation of methods to overcome known
common diffi culties is an important part of effective dialog.
Participants and Data Collection Methods
Data was collected in this study in order to (a) identify and characterize specifi c student diffi cul-
ties and (b) implement tutorials and assess student learning from the tutorials. In this section we
describe details of the participants and how the data was collected.
The participants in this study were enrolled in the introductory materials science course for en-
gineers, which is a required core course for many of the engineering major programs at The Ohio
State University, a large public research university. The students ranged from 1st to 5th-year engineer-
ing students. About 10-15% of the students intended on becoming materials science engineering
majors, and about 35% of the students were mechanical engineering majors, the most common
major in the course.
Data was collected over a period of 7 quarters, for a total of approximately 1000 participants.
The data was collected in fi ve ways. First, we conducted individual or group interviews on over 200
students. These interviews consisted of asking a wide range of open ended and multiple choice
questions, such as those presented in this paper. Several dozen interviews were videotaped, and the

8 WINTER 2013
ADVANCES IN ENGINEERING EDUCATION
A Tutorial Design Process Applied to an Introductory
Materials Engineering Course
rest were recorded via interview notes. The interviews were used to fi rst explore areas of diffi culty,
then to focus on specifi c diffi culties identifi ed in the initial interviews and free response tests. Most
interviews were conducted individually, but some were given in groups of 3 or 4.
The second method of data collection was via free response and multiple choice tests. In ad-
dition to the standard homework, students were given a “fl exible homework” assignment with
credit for participation as part of the course grade. The fl exible homework assignment consisted
of participation in a one-hour session where students completed some combination of testing and
interviewing. Throughout the quarter, students were randomly selected to participate in the fl ex-
ible homework. Typically, about 95% of students participated in the fl exible homework. The tests
items were in either multiple-choice, free-response, or a multiple-choice-with-explanation format.
Students completed the material at their own pace at individual stations in a quiet room. Afterwards
we would informally ask students whether they had any questions and/or to explain their answers.
We observed during these sessions that students made a good faith effort to answer the questions
to the best of their ability.
The third method for collecting data was again via fl exible homework. However, the sessions
were conducted in a more regular classroom environment during the 7, 8 or 9th week of the quarter
only. Students were given 30 to 35 minutes to complete a set of about 30 multiple choice items.
(Students were aware that their score on the “quiz” would not affect their course grade, but again
we observed the majority of students making a good faith effort to answer the questions.) Students
were then asked to spend approximately 10 minutes discussing the correct answers to the items in
small groups with TA assistance which allowed for some informal interview data on the validity of
the multiple choice items.
The fourth method for collecting data was via observations of small group work and collected
tutorial responses in recitations. The authors participated in some of the recitations which were
conducted in small group format. This method was used to further verify and/or clarify student dif-
fi culties found via interviews and tests, to evaluate student understanding and interaction with the
tutorial questions, and to assess student ability to correctly complete the tutorial questions.
Finally, the fi fth method for collecting data was via the offi cial exams administered as part of
the course. The exams were in multiple choice format, and some of the items (about 10-20%) were
designed by us in collaboration with the instructor. This method helped to assure that student an-
swering was not simply an artifact of the testing context, i.e., whether performance would dramati-
cally improve for high–stakes testing contexts.
Most tests and interviews were at least one week after the relevant instruction, however some
were administered before relevant instruction. The data reported here is all post instruction.
WINTER 2013 9
ADVANCES IN ENGINEERING EDUCATION
A Tutorial Design Process Applied to an Introductory
Materials Engineering Course
Most of the diffi culties reported here were fi rst found in interviews. We subsequently devised
questions to demonstrate the relative frequency of these diffi culties in the student population. Thus
incorrect answers to the questions should not be viewed as uninteresting artifacts of the particular
questions, but rather indicative of student diffi culties with understanding the materials science
concepts underlying the questions, or possibly, as in the case with questions in graph or diagram
format, some of the diffi culty arises from the format itself.
Iterative Construction of the Tutorial Materials
The writing of tutorial materials began after the initial identifi cation of course goals and student
diffi culties with specifi c topics. In collaboration with the instructor, high-priority student diffi culties
were chosen for the tutorials among the many student diffi culties discovered in the initial interviews
and testing. An initial version of the tutorials was drafted based on interview and test questions used
in the initial diffi culty-identifi cation stage. One quarter (i.e. course term) of small mock recitation
sections (with students attending as part of a homework assignment) was used to fi eld-test the fi rst
version of the tutorials. Feedback from the written material produced by the students and comments
from the instructors implementing the sections was used to improve on the materials. After this, the
tutorials were implemented in the regular recitation sections for three quarters. For each quarter, were
redesigned based on in-class observations, assessments of submitted group responses to the activi-
ties, instructor feedback, and assessments of the tutorial’s effectiveness based on exam scores.
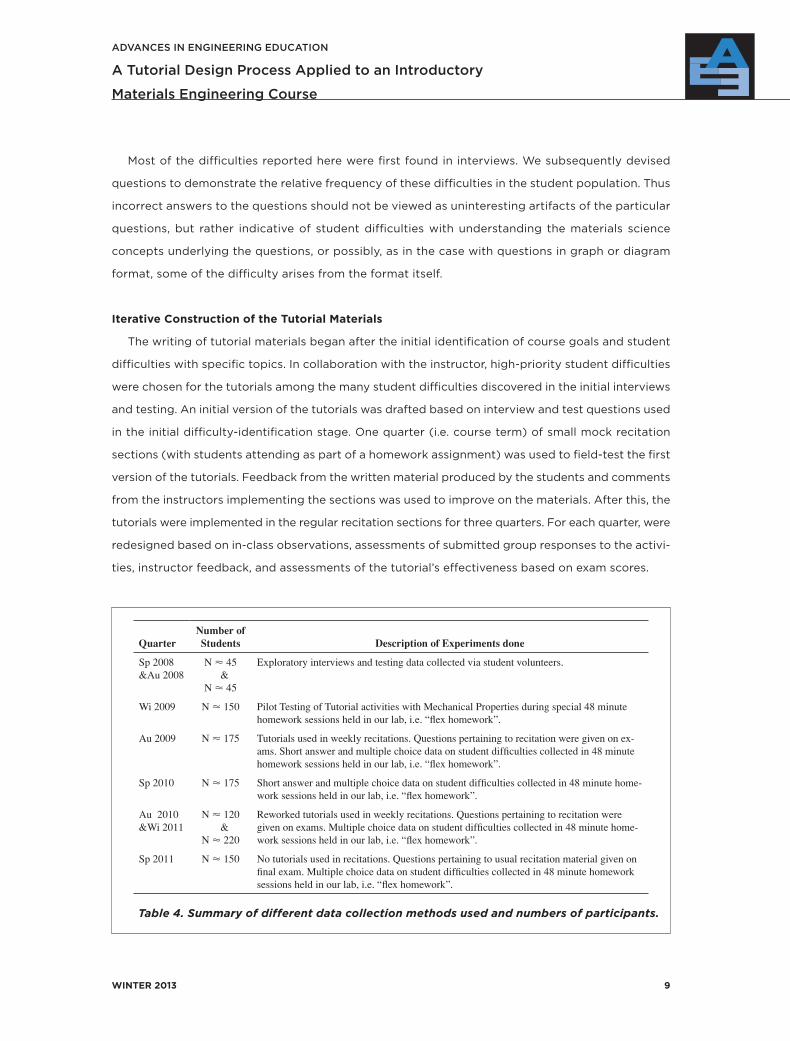
Table 4. Summary of different data collection methods used and numbers of participants.
Quarter
Number of
Students Description of Experiments done
Sp 2008 &Au 2008
N � 45 &
N � 45
Exploratory interviews and testing data collected via student volunteers.
Wi 2009 N � 150 Pilot Testing of Tutorial activities with Mechanical Properties during special 48 minute homework sessions held in our lab, i.e. “fl ex homework”.
Au 2009 N � 175 Tutorials used in weekly recitations. Questions pertaining to recitation were given on ex-ams. Short answer and multiple choice data on student diffi culties collected in 48 minute homework sessions held in our lab, i.e. “fl ex homework”.
Sp 2010 N � 175 Short answer and multiple choice data on student diffi culties collected in 48 minute home-work sessions held in our lab, i.e. “fl ex homework”.
Au 2010 &Wi 2011
N � 120 &
N � 220
Reworked tutorials used in weekly recitations. Questions pertaining to recitation were given on exams. Multiple choice data on student diffi culties collected in 48 minute home-work sessions held in our lab, i.e. “fl ex homework”.
Sp 2011 N � 150 No tutorials used in recitations. Questions pertaining to usual recitation material given on fi nal exam. Multiple choice data on student diffi culties collected in 48 minute homework sessions held in our lab, i.e. “fl ex homework”.

10 WINTER 2013
ADVANCES IN ENGINEERING EDUCATION
A Tutorial Design Process Applied to an Introductory
Materials Engineering Course
The following sections will describe the important student diffi culties identifi ed in this study and
the tutorials used to address these diffi culties for four example topics.
STUDENT DIFFICULTIES AND TUTORIAL MATERIALS: 4 EXAMPLE TOPICS
While tutorial topics covered included include the nature of atomic bonds, crystal structure, diffu-
sion, the mechanical properties of metals, stress-strain curves, the effects of processing on proper-
ties, failure, phase diagrams, phase transitions, TTT plots, properties of ceramics, and properties of
polymers, we will only be showing examples from the four tutorials addressing the bolded topics.
Mechanical Properties
Student diffi culties with mechanical properties. We have identifi ed two general and inter-related
kinds of student diffi culties with mechanical properties, which we discuss in this section and the
next section (see also Kitto, 2008; Krause et al., 2010; Rosenblatt & Heckler, 2010; Heckler & Rosen-
blatt, 2011). First, we found that even after instruction students often equated mechanical proper-
ties concepts and terms, used them interchangeably, or at very least thought the properties were
necessarily correlated or anti-correlated. Perhaps the most prevalent and fundamentally important
confusion was between the concepts of material strength and elasticity. Even if some of the stu-
dents did understand the difference in the defi nitions, they often believed that the two properties
must be correlated. That is, they believed a stiff material must also be strong and vice versa. This
is highlighted by the questions in Figure 1 and 2. The fi rst question concerns a conceptual defi ni-
tion of modulus of elasticity. Only one-third of the students answered correctly, with most students
confusing the concept of yield strength with elasticity. This question requires a careful reading of
the answer choices and is somewhat subtle, yet interviews revealed that student understood the
options and chose purposefully.
The next question (Figure 2) is somewhat more straightforward, yet only 13% of the students
answered correctly. Approximately 40% of students believed that the material with a higher yield
strength will also have a higher tensile strength, which is not unreasonable, and over 40% (the ma-
jority) of students answered that the material with a higher yield strength, also has a higher tensile
strength and higher modulus of elasticity.
It was also somewhat common for students to believe that there is a strict anti-correlation be-
tween yield strength and ductility, namely that a highly ductile material has low strength, as shown
in Figure 3.

WINTER 2013 11
ADVANCES IN ENGINEERING EDUCATION
A Tutorial Design Process Applied to an Introductory
Materials Engineering Course
In addition to diffi culties with confusion of mechanical properties, we found that students had
diffi culty with understanding and applying the basic concepts and quantities necessary for defi n-
ing mechanical properties. One place where this is manifest is in the common incorrect reasoning
What is the Young’s modulus of elasticity or ‘stiffness’ of a material?
(33%) a. A measure of a material’s resistance to elastic strain when under stress.
(19%) b. A measure of a material’s ability to return to its original shape after a load is applied.
(11%) c. A measure of a material’s ability to stretch or deform without breaking.
(37%) d. A measure of a material’s ability to withstand an applied stress without permanently deforming.
Figure 1. Example question demonstrating student diffi culty with the concept of elasticity.
Student response percentages in parentheses, and correct answer in bold. (N = 62, SE = 6%)
Which of the following is the best statement describing the relationship between ductility and yield strength?
(10%) a. A metal with greater yield strength is more ductile
(29%) b. A metal with a greater yield strength is less ductile
(10%) c. A metal with greater yield strength tends to be more ductile
(40%) d. A metal with greater yield strength tends to be less ductile
(10%) e. Ductility has no relation to yield strength
Figure 3. Example question demonstrating student confusion of the concepts of yield
strength and ductility. Student response percentages in parentheses, and correct answer in
bold. (N = 67, SE = 6%.)
Two pieces of metal, A and B, are the same size and shape but Metal A has a greater yield strength than Metal B. Which of the following statements is true?
(13%) a. Metal A will permanently deform at a greater stress than Metal B(2%) b. Metal A will have a greater tensile strength than Metal B(2%) c. Metal A will have a greater young’s modulus of elasticity than Metal B
(40%) d. Both a & b(44%) e. a, b, & c are all true
Figure 2. Example question demonstrating student confusion of the concepts of yield
strength, tensile strength and elasticity. Student response percentages in parentheses, and
correct answer in bold. (N = 67, SE = 6%.)

12 WINTER 2013
ADVANCES IN ENGINEERING EDUCATION
A Tutorial Design Process Applied to an Introductory
Materials Engineering Course
with questions involving yield strength, force and stress. In particular, students usually associate
yield strength with force rather than stress. A dramatic example of this is demonstrated by student
post instruction responses to the question in Figure 4. In this simple question, it seems that the
majority of students believed that yield strength depended on cross sectional area, or put another
way, that yield strength was defi ned in terms of force rather than force per unit area. In interviews,
student responses were consistent with this: we found most incorrect students had considered
only that the larger piece could withstand a greater force (rather than stress) without deforming.
Furthermore, interviews and classroom observations revealed that many students used the terms
force and stress interchangeably. When questioned further, most students did recognize the formal
difference between the concepts stress and force. Nonetheless, they often failed to recognize that
the two terms must be used carefully.
Diffi culties relating stress-strain graphs and mechanical properties. The second kind of student
diffi culty with mechanical properties was in relating mechanical properties to a stress-strain plot.
For example, Figure 5 presents results from a simple question comparing modulus of elasticity of
two materials represented in two stress-strain curves. Over half of the students chose the curve
that had the higher maximum value, rather than the curve with the steepest linear slope. This ex-
planation that “higher position on graphs means more” was commonly found in interviews, and is
similar to fi ndings for kinematic graphs in physics courses (McDermott, Rosenquist & van Zee, 1987).
Interestingly, some students thought that since the higher curve also had higher elongation until
breaking, this was seen as additional evidence of higher elasticity. This example highlights the fact,
as discussed earlier, that many students confl ate concepts such as ductility, strength and elasticity,
and this diffi cultly is manifest in (and confounded by) the reading of graphs.
Tutorials for mechanical properties. A portion of the tutorial designed to address diffi culties with
material properties is shown in Appendix A. The tutorial provides various ways in which to apply
and practice defi nitions and explanations of elastic deformation, Young’s modulus, yield strength,
and tensile strength. Special attention is given to terms students frequently confuse such as stiff-
ness and strength or yield and tensile strength, and students were asked to explain the differences
The following metal pieces are cut from the same plate. Compare the yield strength of the pieces.
(60%) a. A has a higher yield strength than B(8%) b. B has a higher yield strength than A
(32%) c. A and B have the same yield strengthA
(A and B have equal heights)B
Figure 4. Example question demonstrating diffi culty with the defi nition of yield strength.
Student response percentages in parentheses, and correct answer in bold. (N = 114, SE = 4%.)

WINTER 2013 13
ADVANCES IN ENGINEERING EDUCATION
A Tutorial Design Process Applied to an Introductory
Materials Engineering Course
between these terms. Following a technique used in other tutorials (McDermott et al., 2002), The
tutorial also provides a set of quotes commonly made by students during interviews. Students are
asked to comment on the correctness of the quotes. These “student dialog” questions are designed
to demonstrate the necessity of precision in language and raise student awareness of common in-
correctly stated defi nitions or generalizations, such as, “A tougher material is stronger,” or, “A stiffer
material is harder to break.”
The mechanical properties tutorial also asks students to apply their mechanical properties defi -
nitions to stress-strain plots. This serves several purposes. It gives students experience deriving
information from, and plotting information on, graphs which is itself a goal of instruction. It also
provides a second way to think about the defi nitions and thus acts as both a check to students
understanding and an additional way for students to distinguish exactly what
parts of their written defi nitions were of importance. The easily separable dimensions of the
graph (i.e. slope, height, peak, and line length) provide a clear visual aid for discussion, as a group
or with a TA, of the exact differences in the properties and how one property does not necessarily
affect another property.
Diffusion
Student diffi culties with diffusion. We have found that from the perspective of introductory
materials science, virtually every aspect of diffusion is diffi cult for students to understand. It has
been recognized that the process of diffusion is diffi cult to understand by a number of researchers
(Streveler et al., 2008; Chi, 2005). Chi, for example has discussed this diffi culty in term of the per-
spective that diffusion is an emergent process, and the cause of diffusion is often confused. In our
studies, we also found these issues. However, we also found other signifi cant post-instruction student
Consider the stress-strain curves of two metals above. Which metal has a higher modulus of elasticity?
(46%) a. A has a higher modulus(54%) b. B has a higher modulus(0%) c. The modulus of A is equal to that of B
Figure 5. Example question demonstrating diffi culty with interpreting stress strain plots.
Student response percentages in parentheses, and correct answer in bold. (N = 116, SE = 6%.)

14 WINTER 2013
ADVANCES IN ENGINEERING EDUCATION
A Tutorial Design Process Applied to an Introductory
Materials Engineering Course
diffi culties with diffusion that are important to materials science, including a lack of understanding
of the terminology, mathematical equations, and graphs characterizing diffusion and a lack of a
consistent microscopic model and physical intuition of the process of diffusion in solids.
For example, students have diffi culty with the concepts underlying Fick’s fi rst law, which states
that the diffusion fl ux is proportional to the (negative of the) concentration gradient. Specifi cally,
students often confuse higher concentration with higher diffusion fl ux rather than higher concentra-
tion gradient, and they do not have a physical understanding why a gradient is necessary to obtain
a non-zero net diffusion fl ux. Furthermore, they have diffi culty in understanding the meaning of
concentration versus position graphs and making meaningful inferences about diffusion from such
graphs. Figure 6 provides an example of these diffi culties, with about 30% of students considering
the height rather than slope, and more importantly, only
36% are able to determine the direction of the net diffusion fl ux from the graph. This indicates
that either students do not have any understanding of the relation between diffusion and concen-
tration gradient or that they have a signifi cant lack of understanding of the meaning of the position
versus concentration graphs. Further interviews indicate that some students do have some physical
understanding of the relation between concentration gradient and diffusion fl ux, but they are unable
to connect this understanding with the graphic representation of position versus concentration.
Another example of student diffi culty with diffusion is with Fick’s second law, which relates the
rate of change in concentration with the second derivative of concentration with respect to position.
The figure to the right shows the concentration of Aluminum as a function of position. How does the diffusion flux of Aluminum at point A compare to that at point B?
In the figure to the left, in which direction is there a net diffusion of Hydrogen at point A?
(8%) a. A > B (51%) a. To the right ( + x direction)
(29%) b. A < B (36%) b. To the left ( - x direction)
(63%) c. A = B (7%) c. The concentration profile is in steady state, so the net diffusion is zero.
(7%) d. There is no direction to the diffusion.
Figure 6. Example questions demonstrating student diffi culty with diffusion and
concentration vs. position graphs. Student response percentages in parentheses, and correct
answer in bold.
(N = 62, SE = 6%.) Note: To save space the graph which is common to the two questions
is shown only once and placed between the two questions. This was not the case when
students saw the questions.

WINTER 2013 15
ADVANCES IN ENGINEERING EDUCATION
A Tutorial Design Process Applied to an Introductory
Materials Engineering Course
For Fick’s second law, the scope of students’ diffi culties becomes more pronounced. For example,
as shown in Figure 7, only about 25% of students recognized that the
physical understanding of the relation between concentration gradient and diffusion fl ux, concen-
tration would increase with time at a local minimum in concentration, and only about 15% recognized
that concentration would change the fastest at points of “high curvature” in concentration. Instead,
when asked about the graph in Figure 7, most students chose according to the slope, presumably
since we are asking how concentration is changing with time, and rates of change are often associ-
ated with slope. Unlike with questions regarding Fick’s fi rst law, students did not do better on these
questions when pressed in interviews. This suggests a more serious lack of understanding of the
graphs and the physical processes underlying Fick’s second law.
For a fi nal example, we consider student responses to a question that probes student under-
standing of the nature of diffusion in metal on an atomic level, shown in Figure 8. Only 36% of stu-
dents correctly responded that a copper atom will diffuse through a sample of copper. From these
responses and from interviews, it was clear that students do not have strong consistent models for
diffusion in metals on an atomic level.
Tutorials for diffusion. A portion of the tutorial designed to address these diffi culties is shown in
Appendix B. The tutorial starts by providing students with a series of conceptual questions about
diffusion, such as questions concerning diffusion fl ux, concentration, and steady state diffusion.
These questions highlight not only basic defi nitions and units of critical terms, but also how and
why these terms are interrelated. Students then work through a series of questions related to Fick’s
equations, physical descriptions of diffusion, and the drawing of concentration vs. position graphs
The figure below shows the concentration of Copper as a function of position in a sample at 2000C. At point A, how is the concentration of Copper changing with time?
The figure below shows the concentration of Copper as a function of position. At which point is the concentration of Copper changing the fastest with time?
(24%) a. It is increasing with time. (1%) a. A
(4%)b. It is decreasing with time. (16%) b. B
(45%) c. It remains constant with time. (67%) c. C
(27%) d. It could be increasing or decreasing with time.
(16%) d. D
Figure 7. Example questions demonstrating student diffi culty diffusion and concentration as
a function of time. Student response percentages in parentheses, and correct answer in bold.
(N = 376, SE= 3%.) Note: To save space the graph which is common to the two questions
is shown only once and placed between the two questions. This was not the case when
students saw the questions.

16 WINTER 2013
ADVANCES IN ENGINEERING EDUCATION
A Tutorial Design Process Applied to an Introductory
Materials Engineering Course
for the special case of steady state diffusion. These activities are designed to help students con-
nect the concepts of the mathematical equations of Fick’s laws with that of graphical concentra-
tion information. In addition, students work through an activity designed to help them connect the
macroscopic properties of concentration and diffusion fl ux with what is happening at the atomic
level through drawing of a very simplifi ed atoms-in-a-bin picture of concentration and connecting
this with a concentration vs. position graph and a diffusion fl ux graph (see Appendix B).
As a fi nal activity, (not shown in Appendix B.) the tutorial guides students through a non-steady
state concentration graph very much like the one in Figure 7. Students are asked several questions
like, “Where is the diffusion fl ux greatest, where is the concentration greatest, …” These questions
are designed to help students evaluate their understanding and catch students who fall back on
naive responses to give them a last chance to correct their reasoning.
Phase Diagrams
Student diffi culties with phase diagrams. Perhaps not unexpectedly, students have a number of
diffi culties with phase diagrams. These diffi culties appear to arise from both an inability to under-
stand the nature of the diagrammatic representation of phases and a lack of understanding of the
nature of phases and concepts relating to phases such as the difference between composition of a
phase and the phase fraction of an alloy.
In general, many students have signifi cant diffi culty extracting relevant information from phase
diagrams, and performance decreases rapidly with increasing complexity of the diagram. For example,
as shown in Figure 9, post instruction, over 75% of students can typically answer simple questions
about binary phase diagrams involving solid solutions, i.e. only one solid phase. However, as shown in
Figure 10, student performance dramatically decreases for questions about binary eutectic diagrams.
Consider a single particular Copper atom in a sample that is 100% Copper at 3000C. Which of the following is correct?
(17%) a. The Copper atom will not diffuse through the sample because the atoms are fixed in a crystal lattice.
(43%) b. The Copper atom will not diffuse through the sample because the sample is 100% Cu and therefore movement of atoms is not energetically preferred.
(4%) c. The Copper atom will diffuse through the sample because Copper atoms are not in a crystal lattice.
(36%) d. The Copper atom will diffuse through the sample because of thermal energy.
Figure 8. Example question demonstrating student diffi culty the concept of atomic
diffusion in a metal. Student response percentages in parentheses, and correct answer in
bold. (N = 376, SE = 3%.)

WINTER 2013 17
ADVANCES IN ENGINEERING EDUCATION
A Tutorial Design Process Applied to an Introductory
Materials Engineering Course
Only 38% of students correctly picked fraction of � with almost as many choosing the composition
of the �. The rest of the students were divided between the composition amounts for the solution
as a whole. In interviews and classroom discussions with students it was clear that much of the dif-
fi culty with this question arises from the complex nature of the graph itself and thus from students
not knowing what to attend to. However, there are also a signifi cant number of students who have
diffi culty either understanding the differences between the concepts of fraction and composition
as well as the meaning of phase.
Student diffi culties with understanding the meaning of phase is also demonstrated in the ques-
tion in Figure 11, in which most student identifi ed the phase as being comprised solely of one of the
two elements in the alloy. Interestingly, many students who incorrectly believed in “pure phases”
still successfully performed lever rule calculations, which inherently assume that the composition
Consider the Copper –Nickel phase diagram to the right. Which of the following is true about the composition of the solid alpha phase at point B in the graph?
( 0%) a. 0 % wt Ni
( 7%) b. Less than 50% wt Ni but greater than 0%
(15%) c. 50% wt Ni
(75%) d. Greater than 50% wt Ni but less than 100 %
(3%) e. 100% wt Ni
Figure 9. Example question demonstrating student diffi culty with phase diagrams for a single solid
phase. Student response percentages in parentheses, and correct answer in bold. (N = 64, SE = 6%.)
Consider the Copper – Silver phase diagram to the right. At point P what is the fraction ofthe alloy that is α?
(34%) a. 6%
(38%) b. 26%
(10%) c. 28%
(15%) d. 72%
( 0%) e. 94%
Figure 10. Example question demonstrating student diffi culty interpreting phase
diagrams. Student response percentages in parentheses, and correct answer in bold. (N =
212, SE = 3%.)

18 WINTER 2013
ADVANCES IN ENGINEERING EDUCATION
A Tutorial Design Process Applied to an Introductory
Materials Engineering Course
of phases is mixed. (This is consistent with previous fi nding by Demetry (2006).) Thus, it becomes
clearer that part of the diffi culty students have with phase fraction and phase compositions termi-
nology is that they do not have a correct understanding of the nature of the � and � phases and
thus what the graph itself is representing.
Tutorials for phase diagrams. The tutorial on phase diagrams is aimed at addressing student dif-
fi culties with the diagrams, including those described above, by guiding the students through a series
of general questions about the nature of phases, the meaning of solubility for metallic alloys, and the
meaning of the regions of the phase diagram. The tutorial also guides the students to describe the
phases on both an atomic and macroscopic level at various temperatures and compositions as well
as transformations that occur as an alloy of a given composition changes temperature. Exercises
include drawing pictures of microstructure and calculations of composition and fraction. A sample
of the tutorial’s questions is shown in Appendix C.
Atomic Bonding
Student diffi culties with atomic bonding. We found a number of deep and fundamental student
misunderstandings of very basic concepts of atomic bonding. We found that such basic misunder-
standings were not addressed in the text or in the course curriculum, yet these misunderstandings
may signifi cantly contribute to barriers in understanding materials at an atomic level, and how the
atomic level physics effects macroscopic properties. We will discuss four major diffi culties of basic
concepts.
First, we found that students often believe that atomic bonds can be modifi ed, such as becoming
permanently stretched, much like the phenomenon of a permanently stretched spring. Evidence of
the stretched-bond model is shown in Figure 12, and was verifi ed in numerous interviews. Students
were asked post instruction to compare the atomic separation in a metal before and after plastic
In the phase diagram above, what is the α phase?
(51%) a. It is only Copper Atoms.
( 7%) b. It is only Silver Atoms.
(10%) c. It is a mixture of Copper and Silver atoms with a specific fixed wt.% of each.
(32%) d. It is a mixture of Copper and Silver atoms with a wt.% of each that depends on temperature.
Figure 11. Example question demonstrating student diffi culty with the nature of a phase in
binary phase diagrams. Student response percentages in parentheses, and correct answer in
bold. (N= 155, SE = 4%.)
WINTER 2013 19
ADVANCES IN ENGINEERING EDUCATION
A Tutorial Design Process Applied to an Introductory
Materials Engineering Course
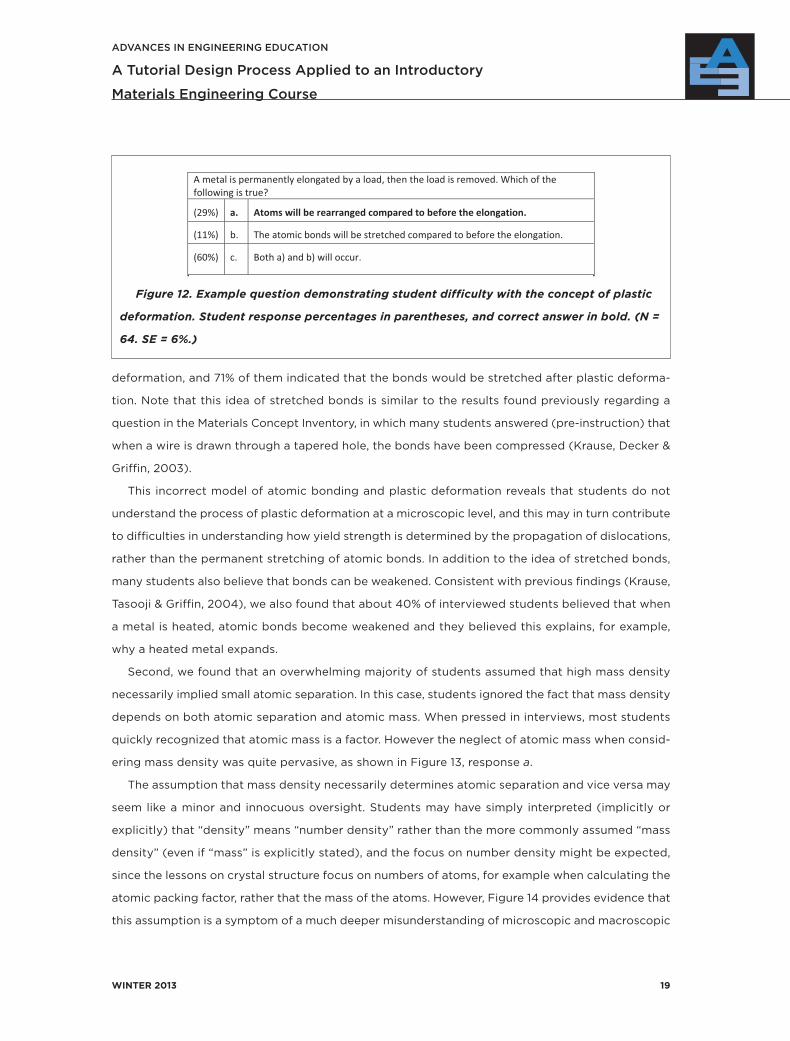
deformation, and 71% of them indicated that the bonds would be stretched after plastic deforma-
tion. Note that this idea of stretched bonds is similar to the results found previously regarding a
question in the Materials Concept Inventory, in which many students answered (pre-instruction) that
when a wire is drawn through a tapered hole, the bonds have been compressed (Krause, Decker &
Griffi n, 2003).
This incorrect model of atomic bonding and plastic deformation reveals that students do not
understand the process of plastic deformation at a microscopic level, and this may in turn contribute
to diffi culties in understanding how yield strength is determined by the propagation of dislocations,
rather than the permanent stretching of atomic bonds. In addition to the idea of stretched bonds,
many students also believe that bonds can be weakened. Consistent with previous fi ndings (Krause,
Tasooji & Griffi n, 2004), we also found that about 40% of interviewed students believed that when
a metal is heated, atomic bonds become weakened and they believed this explains, for example,
why a heated metal expands.
Second, we found that an overwhelming majority of students assumed that high mass density
necessarily implied small atomic separation. In this case, students ignored the fact that mass density
depends on both atomic separation and atomic mass. When pressed in interviews, most students
quickly recognized that atomic mass is a factor. However the neglect of atomic mass when consid-
ering mass density was quite pervasive, as shown in Figure 13, response a.
The assumption that mass density necessarily determines atomic separation and vice versa may
seem like a minor and innocuous oversight. Students may have simply interpreted (implicitly or
explicitly) that “density” means “number density” rather than the more commonly assumed “mass
density” (even if “mass” is explicitly stated), and the focus on number density might be expected,
since the lessons on crystal structure focus on numbers of atoms, for example when calculating the
atomic packing factor, rather that the mass of the atoms. However, Figure 14 provides evidence that
this assumption is a symptom of a much deeper misunderstanding of microscopic and macroscopic
A metal is permanently elongated by a load, then the load is removed. Which of the following is true?
(29%) a. Atoms will be rearranged compared to before the elongation.
(11%) b. The atomic bonds will be stretched compared to before the elongation.
(60%) c. Both a) and b) will occur.
Figure 12. Example question demonstrating student diffi culty with the concept of plastic
deformation. Student response percentages in parentheses, and correct answer in bold. (N =
64. SE = 6%.)

20 WINTER 2013
ADVANCES IN ENGINEERING EDUCATION
A Tutorial Design Process Applied to an Introductory
Materials Engineering Course
properties which may lead to common errors in multi-step reasoning involving density. Responses
to the question in Figure 13 and interview responses reveal that many students use a train of incor-
rect steps to argue that density predicts strength and melting temperature. First, most students
assume that relatively high mass density implies relatively small average atomic separation. Sec-
ond, most students also believe that relatively small average atomic separation necessarily implies
relatively large atomic bond strength. Finally, most students believe (correctly)1 that high atomic
bond strength necessarily implies high melting temperature and (incorrectly) that high atomic bond
strength necessarily implies high yield strength. Therefore, the idea that high density implies high
melting temperature and high yield strength is compelling to students because there is a natural
and plausible (yet incorrect) mechanism: stronger atomic bonding due to smaller atomic separa-
tion. This is the common student reasoning for equating the properties of mass density with the
macroscopic properties of melting temperature and yield strength. (See Figure 14 for a summary
of this reasoning pattern.)
1 This is marked as correct but again many students do not distinguish between force of the bond and energy of the
bond. High bond strength correctly implies high melting temperature only if energy is being considered which, when a student is
discussing their reasoning, is often not true.
Material A has a greater (average) atomic separation than Material B. Which of the following must also be true given this information? (You may choose more than one.)
(72%) a. Material B has a greater mass density.
(75%) b. Material B has a great atomic bond strength
(44%) c. Material B has a greater yield strength
(40%) d. Material B has a greater melting temperature.
Figure 13. Example question demonstrating student diffi culty with the concept of plastic
deformation. Student response percentages in parentheses, and correct answer in bold.
Question regarding atomic separation and material properties. (N= 67, SE = 6%.)
High mass density
Small atomic separation
High atomic bond strength
High melting temperature
High yield strength
Figure 14. Common incorrect line of reasoning about the relation between density,
melting temperature, and yield strength. Note that all but one of the steps is incorrect.

WINTER 2013 21
ADVANCES IN ENGINEERING EDUCATION
A Tutorial Design Process Applied to an Introductory
Materials Engineering Course
The third basic student diffi culty with understanding atomic bonding is that students often
confuse the concepts of force and energy when referring to the strength of atomic bonds and use
the two terms interchangeably in their explanations (see also Heckler & Rosenblatt, 2010). Atomic
bonds are often described by instructors as being either “strong” or “weak”. Unfortunately this can
be misleading or confusing to the students because sometimes the word “strong” refers to the force
of the bond and sometimes it refers to the bond energy. Like many misconceptions, the use of a
common word can lead to diffi culties in understanding the proper scientifi c concept. In everyday
usage, “strength” usually refers to force, whereas normally when an expert speaks of a strong atomic
bond, it is meant in terms of a large binding energy. In general we observed that it was common for
students to use the terms force or energy when discussing the origins of macroscopic properties
such as elasticity, strength and melting temperature, with little regard for the scientifi c accuracy of
their own usage of the words. The failure to distinguish between energy and force in atomic bonds
may be contributing to student diffi culty in understanding how the properties of atomic bonds are
related to macroscopic properties such as strength and elasticity.
Finally, we found that students have considerable diffi culties using a (Lennard-Jones) bonding
potential energy graph to answer common questions about melting temperature, Young’s modu-
lus, and atomic separations. Comparing student’s responses for the two questions shown in Figure
15; it is evident, from the almost identical responses for the two separate questions, that students
do not understand what parts of the graph are related to the requested properties of the bond. In
Shown below are the Potential Energy curves for three different materials. Circle the answer with the correct rankings of the three materials’ melting temperatures.
Shown below are the Potential Energy curves for three different materials. Circle the answer with the correct rankings of the three materials’ stiffness (i.e. their Young’s moduli, E).
(13%) A > B > C (18%) A > B > C
(33%) C > B = A (30%) C > B = A
(11%) C < B = A (11%) C < B = A
(42%) C > B > A (41%) C > B > A
Figure 15: Example questions demonstrating student diffi culties interpreting a graphs
of the Lenard-Jones potential. Student response percentages in parentheses, and correct
answer in bold. (N = 61, SE = 6%.) Note: To save space the graph which is common to the
two questions is shown only once and placed between the two questions. This was not the
case when students saw the questions.

22 WINTER 2013
ADVANCES IN ENGINEERING EDUCATION
A Tutorial Design Process Applied to an Introductory
Materials Engineering Course
addition, students’ responses to the even simpler question in Figure 16 illustrates that many students
do not have even a basic understanding of the meaning of the graph.
Tutorials for atomic bonding concepts. Student diffi culties with understanding atomic bond-
ing are addressed in a number of the tutorials to some extent, since the concepts are so basic and
pervasive. Nonetheless, we developed a specifi c tutorial, some of which is presented in Appendix
D, which focuses on the Lennard-Jones potential energy of two metal atoms as a function of sepa-
ration. First the tutorial provides a brief explanation of two common models for atomic bonding
– the Lennard-Jones model and the spring model. Then students are prompted to compare the two
models. This includes describing and comparing the motion of the atoms in the two cases, and how
the average separation between the atoms changes when the average energy increases. We found
that even though these concepts were mentioned in the textbook and in lecture, most students
were not at all familiar with the Lennard-Jones potential or how it is related to the behavior of the
atoms. Thus such simple questions were useful to familiarize students with the two models and their
graphs. There are also a number of questions prompting students to use the potentials to address
macroscopic properties of materials such as its melting temperature, Young’s modulus, coeffi cient
of thermal expansion, and the energy necessary to break bonds as a function of temperature.
We chose this tutorial activity for several reasons. First, a basic (and we stress basic) conceptual
understanding of the major features of the potential is fundamental to understanding the nature
of atomic bonds, and this understanding can be used throughout the course to help students think
about the microscopic structure of a material. (This is discussed further in the section “Addressing
the Relation between Structure, Processing, Properties.”) Second, students diffi culties using the
Lennard-Jones potential to answer simple questions, which was already, pre-tutorial, a part of the
expected atomic bonding curricula for the course, would have suggested some instruction with
the Lennard-Jones potential anyway. Third, the graph, is a convenient visual representation that
If the total energy of the system is EN, what is the smallest possible separation between the two atoms?
(3%) a. The smallest separation is zero.
(26%) b. The smallest separation is very small but must be greater than zero.
(54%) c. The smallest separation is r1.
(16%) d. The smallest separation is ro.
Figure 16: Example questions demonstrating student diffi culties interpreting a graphs
of the Lenard-Jones potential. Student response percentages in parentheses, and correct
answer in bold. (N= 61, std error = 6%)

WINTER 2013 23
ADVANCES IN ENGINEERING EDUCATION
A Tutorial Design Process Applied to an Introductory
Materials Engineering Course
facilitates understanding of the independence of the fundamental dimensions of bond energy, av-
erage separation, and curvature that can be conceptually linked to the independent macroscopic
properties of melting temperature, number density, and Young’s modulus. This can help students
to more clearly distinguish between, and understand the independence of, atomic separation, bond
energy, yield strength (related in part to depth of well), and elasticity (related to curvature of well).
Finally, comparisons of the two models can assist in illustrating for the students when a spring model
is not a good model to use for bonding, for example that it does not explain thermal expansion,
which can be built upon later when students are learning plastic deformation.
THE TUTORIALS AND GENERAL INSTRUCTIONAL GOALS
So far, we discussed how the tutorials address specifi c content topics, such as mechanical properties
or phase diagrams. However, there are also several general themes that run through the tutorials; these
themes are aimed at goals the faculty and instructors identifi ed for the course as a whole, as outlined
in Table 4. In this section, we describe how the tutorials address these general course goals.
Addressing General Concepts, Basic Defi nitions, and Terminology
The main diffi culty that students have in this area is that they commonly confl ated similar terms
and concepts. Examples discussed in the previous sections include confusion between force and
energy of a bond, strength and elasticity of a material, and phase composition and phase fraction.
Interestingly, after fi nding initial evidence of confusion between two given concepts or terms such
as force and stress, we found that following further conversation many students could distinguish
between the two concepts in question. Therefore in some cases, rather than fi nding that students
could not make the distinction between the concepts in question, we found instead that students
often simply did not distinguish between them. For example, after brief conversation, students would
often easily grasp (or recall) the distinction between stress and force. While these are precise terms
in the domain of engineering, students nonetheless often appeared to equate the concepts, or they
often used the terms interchangeably.
Furthermore, in some cases it appeared that the confusion of terms was partially due to common
language usage. For example, when referring to a property of a material in everyday language, stiff
is often synonymous with strong or tough. However, these terms are not synonymous in materials
science and have precise and critically different meanings.
Therefore, there appears to be two issues associated with student incorrect usage or application
(interpreted as confusion) of similar terms and concepts. First, the students must learn the distinction

24 WINTER 2013
ADVANCES IN ENGINEERING EDUCATION
A Tutorial Design Process Applied to an Introductory
Materials Engineering Course
between the concepts in question. This may or may not be diffi cult depending on for example
whether the differences are subtle or whether both concepts are complicated. Second, it may be
the case that in everyday experience the two concepts or terms in question are habitually used
interchangeably, and even if a distinction is understood by the students, they may not recognize
the need to distinguish between the concepts or terms. This second issue then involves the student
learning that the distinction is important in some circumstances, especially in matters concerning
material science.
The tutorials were designed to address these issues in a number of ways. Some tutorials explicitly
ask students to provide a defi nition of a term in non-technical words. For example, the phase diagram
tutorial starts with the question, “What is a phase?” For some students, this is a challenging ques-
tion because they often use the everyday meaning of the word. In addition, commonly confounded
terms were often directly confronted by asking students to describe the difference between, for
example, stiffness and strength or stress and force. Another methods used was to provide quotes
from students that used terms incorrectly (such as the student quote in exercise 10 in the mechani-
cal properties tutorial examples in Appendix A), and student were asked to discuss the validity of
the quote. Finally, many terms, such as strength, were often used over multiple tutorials. As part of
the intervention, TAs were instructed to be aware these oft-confused terms, and assist students in
recalling and defi ning these terms when students were stuck on a question. For example, a student
might say, “We are stuck on #4, how does cold working strengthen a material?” The TA might re-
spond by asking the student, “Last week we talked about tensile strength. What is tensile strength?
Can you recall how it differed from yield strength?”
Addressing the Relation between Structure, Processing, Properties
Achieving the understanding of the relation between structure processing and properties even
at a basic level is complicated because it relies on multiple areas of student knowledge and the
knowledge that bridges these different areas. While more tutorial development is needed on this
topic, the tutorials in their current form do address important aspects. We found that many student
diffi culties in this area are rooted in either a lack of a conceptual (or visual) model or an incorrect
model of the structure of materials on sub-macroscopic scales. This is true even after they fi nish the
course. For example, as mentioned earlier, students often believe that bonds can be permanently
stretched, and this interferes with learning of the proper description of plastic deformation (and
yield strength).
In addition, students have diffi culty producing visual models of the crystal structure nature of met-
als, the grains and dislocations (and how these differ), and the phases of metals at the microscopic
level. This lack of correct visual models of materials on smaller scales hinders students’ abilities to

WINTER 2013 25
ADVANCES IN ENGINEERING EDUCATION
A Tutorial Design Process Applied to an Introductory
Materials Engineering Course
understand how processing, such as drawing a wire through an aperture, changes microstructure
and thus effects material properties.
To help address these diffi culties, most tutorials include a section which requires students to
draw pictures representing important atomic or microstructure-sized features and often has ques-
tions requiring students to analyze or use their picture. Examples of this can be seen in each of
the tutorial exercises presented in previous sections. For example, in the mechanical properties
tutorial students are asked to sketch what the atoms are doing before, during, and after elastic
and plastic deformation. Then they are asked to use their picture to infer how density or atomic
separation changes. Another example of this can be seen in the tutorial aimed at diffi culties with
crystal structure and defects where students are required to both draw a dislocation and give a
written description for it, or in the failure tutorial where students are required to identify the types
of failure seen in magnifi ed fracture surfaces and then to describe the identifying features of the
failure. This kind of exercise is consistent with work by Krause et al., which indicates that drawing
exercises may generally be an effective teaching tool for addressing conceptual diffi culties with
materials science (Krause et al., 2010).
Addressing the Interpretation and Use of Graphs and Diagrams
A wide variety of graphs and diagrams are used in the many topics covered in introductory
materials science, and we have found that there are significant student difficulties with all of
them. This includes stress-strain plots, concentration versus position plots used to describe dif-
fusion, the Lennard-Jones potential graph and phase diagrams discussed in previous sections.
Difficulty with at least some of these diagrams, such as phase diagrams and TTT plots is to be
expected, since most students are not familiar with the “rules” of these unique diagrams, in
addition to struggling with the underlying concepts represented by TTT plots. Nonetheless, the
graphic representations are critical to materials science, and understanding them is an important
goal.
Therefore, to address these issues with graphs and plots, each tutorial includes at least one
activity in which students derive information from or plot information on a graph or diagram.
These activities often include a series of questions regarding the chart or graph which address
common specifi c diffi culties with a particular diagram. Often the task is designed to elicit and
resolve a specifi c diffi culty. The TA’s are instructed on assist students with such diffi culties. Ques-
tions #2 and 3 in the atomic bonding tutorial or #11 and 12 on the mechanical properties tutorial
are examples.

26 WINTER 2013
ADVANCES IN ENGINEERING EDUCATION
A Tutorial Design Process Applied to an Introductory
Materials Engineering Course
RESULTS OF IMPLEMENTATION
Nine tutorial worksheets were implemented in weekly recitations (as outlined earlier) in three
separate lecture sections in three separate quarters. Two of the sections (Autumn 2010 and 2011) were
taught by an experienced materials Science Engineering faculty member who taught the course for
a number of years, and one of the sections was taught by a faculty member who taught the course
for the fi rst time. All lectures were mainly traditional format, with the exception that electronic vot-
ing machine questions were presented and discussed for a portion of most of the lectures.
Regarding assessment, as mentioned earlier, a Materials Concept Inventory is available (Krause et
al., 2010b), but we found that this instrument was not adequate for the purposes of our study because,
for example, the instrument has several items assessing topics that were not covered in the course.
Therefore, we evaluated the effectiveness of the tutorials by analyzing fi nal exam scores. The fi nal
exams were constructed in multiple choice format by the instructors and were similar in nature in
all three sections, yet each exam was different. The metrics of the exams were within a reasonable
range, for example the Cronbach’s alpha measures were in the range of 0.7-0.75 and average scores
in the 70-75% range.
While the use of fi nal exam scores does not allow for a comparison between lecture sections, for
example between a section using tutorials vs. a section that employs traditional recitation lecture and
homework reviews, one still may make informative comparisons of exam performance within lecture
sections. Specifi cally, as noted earlier, students attended on average only about 37% of the recitations.
This variability in attendance allowed for a comparison of fi nal exam scores of students who attended
the voluntary recitations to scores of students who did not attend recitation. Figure 18 reveals a clear
linear, increasing relation between the number of recitations attended and the fi nal exam score. Stu-
dents gained about 0.10 ± 0.02 standard deviations on the fi nal exam score for every recitation they
attended. (See Figure 18 which shows similar trends in all three quarters.)
However, this increase performance with increased tutorial participation is necessary but not suf-
fi cient evidence for the added benefi t of tutorials. Because the recitations were voluntary, it might
be argued that the gain in score could be due to the fact that better students may have more often
attended recitation. While this is a plausible contributing factor to the score-attendance relation
measured, we argue that there is evidence of additional learning due to recitation participation.
In particular, we made a within student comparison of performance on exam questions that were
related to the recitation material vs. exam questions that were not related to recitation material. If
one interprets the score on the non-recitation related questions as a measure of the mastery level of
the student, then one can use this information to factor out the quality of the student and determine
if there is any residual effect of recitation attendance alone.

WINTER 2013 27
ADVANCES IN ENGINEERING EDUCATION
A Tutorial Design Process Applied to an Introductory
Materials Engineering Course
In order to formally analyze this possibility, we performed a 2 x 2 repeated measures analysis
of variance, with high/low attendance (greater or less than average attendance) as the between
student factor, and question type (recitation related vs. not recitation related question) as the re-
peated (within student) factor. Figure 19 presents the data separated into these factors. Perhaps
unsurprisingly, there was a main effect of attendance, with high attenders outscoring low attenders
by 0.36 standard deviations on all questions on average (F(1, 553) = 20.06, p < 0.001). There was no
main effect of question type, thus students performed on average equally well on recitation vs. non-
recitation related questions, 74% vs. 73% (F(1, 553) = 3.76, p = 0.053). Most interestingly, as seen in
Figure 19 there was a signifi cant interaction between attendance and question type (F(1, 553) = 19.55,
p < 0.001), with a clear value added on recitation related questions for those attending recitation.
Thus, even accounting for the fact that slightly “better” students attended the recitations there was
a valued-added effect of the recitations that improved relative student performance on recitation
related questions by 0.35 standard deviations. This effect size is fairly impressive considering that
difference in attendance between high and low attenders is about 4 recitations, which is less than
3.5 hours of tutorial participation.
Figure 18. Final exam score vs. recitation attendance for three separate quarters.
The slope for each quarter is also provided. The recitations are binned by two to reduce
fl uctuations from topic diffi culty, tutorial strength, and the number of fi nal exam questions
on each topic. (*Wi 2011 had only 8 recitations)
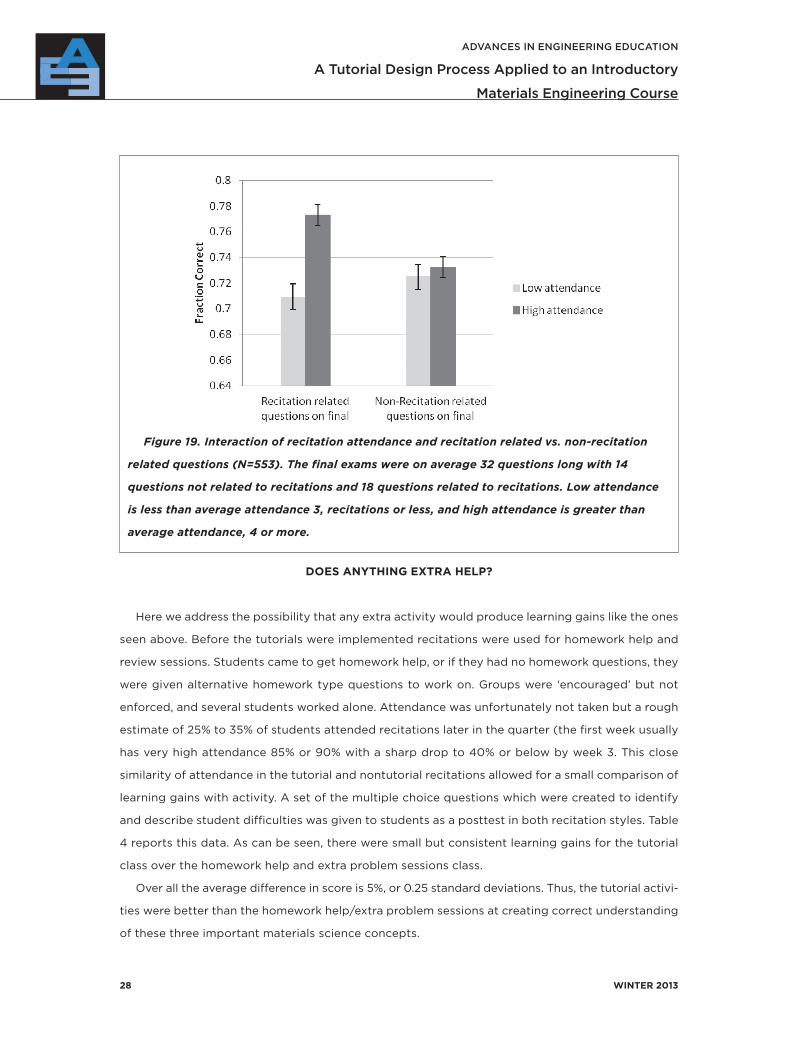
28 WINTER 2013
ADVANCES IN ENGINEERING EDUCATION
A Tutorial Design Process Applied to an Introductory
Materials Engineering Course
DOES ANYTHING EXTRA HELP?
Here we address the possibility that any extra activity would produce learning gains like the ones
seen above. Before the tutorials were implemented recitations were used for homework help and
review sessions. Students came to get homework help, or if they had no homework questions, they
were given alternative homework type questions to work on. Groups were ‘encouraged’ but not
enforced, and several students worked alone. Attendance was unfortunately not taken but a rough
estimate of 25% to 35% of students attended recitations later in the quarter (the fi rst week usually
has very high attendance 85% or 90% with a sharp drop to 40% or below by week 3. This close
similarity of attendance in the tutorial and nontutorial recitations allowed for a small comparison of
learning gains with activity. A set of the multiple choice questions which were created to identify
and describe student diffi culties was given to students as a posttest in both recitation styles. Table
4 reports this data. As can be seen, there were small but consistent learning gains for the tutorial
class over the homework help and extra problem sessions class.
Over all the average difference in score is 5%, or 0.25 standard deviations. Thus, the tutorial activi-
ties were better than the homework help/extra problem sessions at creating correct understanding
of these three important materials science concepts.
Figure 19. Interaction of recitation attendance and recitation related vs. non-recitation
related questions (N=553). The fi nal exams were on average 32 questions long with 14
questions not related to recitations and 18 questions related to recitations. Low attendance
is less than average attendance 3, recitations or less, and high attendance is greater than
average attendance, 4 or more.
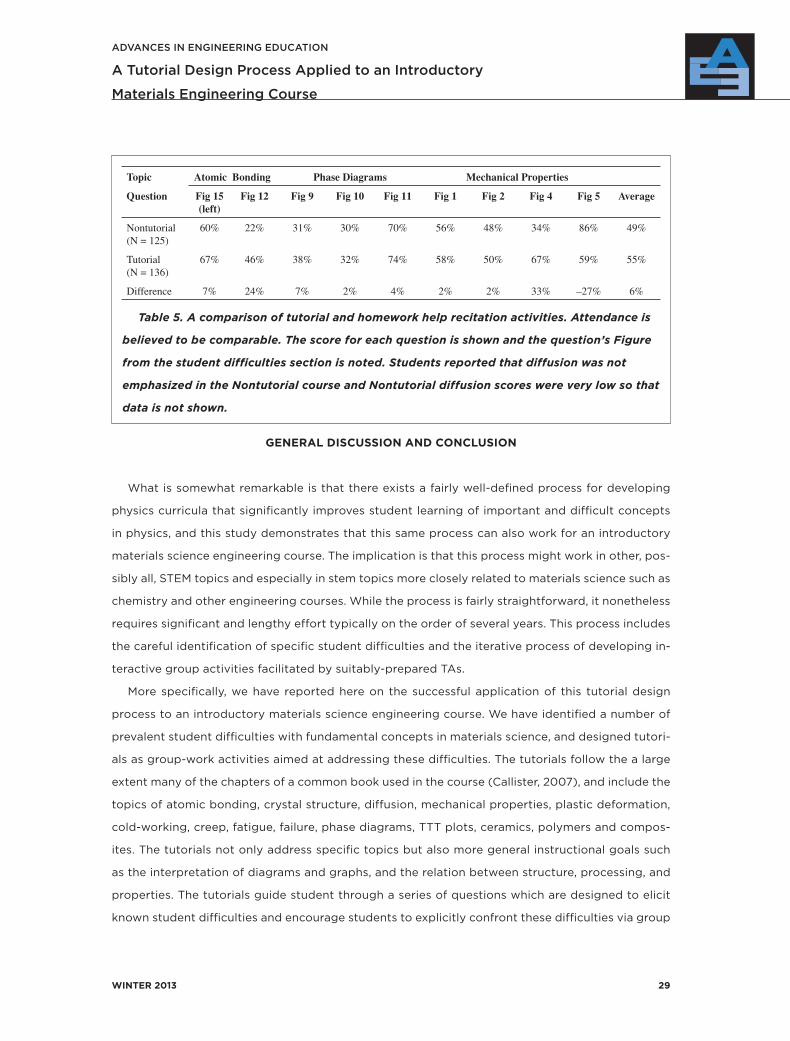
WINTER 2013 29
ADVANCES IN ENGINEERING EDUCATION
A Tutorial Design Process Applied to an Introductory
Materials Engineering Course
GENERAL DISCUSSION AND CONCLUSION
What is somewhat remarkable is that there exists a fairly well-defi ned process for developing
physics curricula that signifi cantly improves student learning of important and diffi cult concepts
in physics, and this study demonstrates that this same process can also work for an introductory
materials science engineering course. The implication is that this process might work in other, pos-
sibly all, STEM topics and especially in stem topics more closely related to materials science such as
chemistry and other engineering courses. While the process is fairly straightforward, it nonetheless
requires signifi cant and lengthy effort typically on the order of several years. This process includes
the careful identifi cation of specifi c student diffi culties and the iterative process of developing in-
teractive group activities facilitated by suitably-prepared TAs.
More specifi cally, we have reported here on the successful application of this tutorial design
process to an introductory materials science engineering course. We have identifi ed a number of
prevalent student diffi culties with fundamental concepts in materials science, and designed tutori-
als as group-work activities aimed at addressing these diffi culties. The tutorials follow the a large
extent many of the chapters of a common book used in the course (Callister, 2007), and include the
topics of atomic bonding, crystal structure, diffusion, mechanical properties, plastic deformation,
cold-working, creep, fatigue, failure, phase diagrams, TTT plots, ceramics, polymers and compos-
ites. The tutorials not only address specifi c topics but also more general instructional goals such
as the interpretation of diagrams and graphs, and the relation between structure, processing, and
properties. The tutorials guide student through a series of questions which are designed to elicit
known student diffi culties and encourage students to explicitly confront these diffi culties via group
Table 5. A comparison of tutorial and homework help recitation activities. Attendance is
believed to be comparable. The score for each question is shown and the question’s Figure
from the student diffi culties section is noted. Students reported that diffusion was not
emphasized in the Nontutorial course and Nontutorial diffusion scores were very low so that
data is not shown.
Topic Atomic Bonding Phase Diagrams Mechanical Properties
Question Fig 15
(left)
Fig 12 Fig 9 Fig 10 Fig 11 Fig 1 Fig 2 Fig 4 Fig 5 Average
Nontutorial(N = 125)
60% 22% 31% 30% 70% 56% 48% 34% 86% 49%
Tutorial (N = 136)
67% 46% 38% 32% 74% 58% 50% 67% 59% 55%
Difference 7% 24% 7% 2% 4% 2% 2% 33% –27% 6%

30 WINTER 2013
ADVANCES IN ENGINEERING EDUCATION
A Tutorial Design Process Applied to an Introductory
Materials Engineering Course
discussions of posed questions and/or dialog with a TA. In addition, the tutorials address larger
course goals - including understanding basic materials science terms, visualizing the microstructure
of materials, and expertise with graphs and diagrams - through incorporating these skills in each of
the tutorials. Analysis of fi nal exam performance suggests that participation in the tutorial based
recitations signifi cantly improves student understanding. In all, these results suggest that these
methods and materials are effective in teaching students the diffi cult and important conceptual
materials which they were designed to address.
ACKNOWLEDGEMENTS
This work has been supported in part by the Center for Emergent Materials at the Ohio State
University, an NSF MRSEC (Award Number DMR-0820414).
REFERENCES
Ambrose, B. S. (2004). Investigating student understanding in intermediate mechanics: Identifying the need for a
tutorial approach to instruction. American Journal of Physics, 72, 453–459.
Bao, L. & Redish, E. F. (2002). Understanding probabilistic interpretations of physical systems: A prerequisite to learn-
ing quantum physics. American Journal of Physics, 70, 210–217.
Callister, W. D. (2007). Materials Science and Engineering: an Introduction. New York: Wiley.
Chi, M. T. H., Bassok, M., Lewis, M. W., Reimann, P., & Glaser, R. (1989). Self-Explanations: How Students Study and Use
Examples in Learning to Solve Problems. Cognitive Science, 13, 145–182.
Chi, M. T. H., De Leeuw, N., Chiu, M., & LaVancher, C. (1994). Eliciting Self-Explanations Improves Understanding.
Cognitive Science, 18, 439–477.
Chi, M. T. H. (2005). Commonsense conceptions of emergent processes: Why some misconceptions are robust. Journal
of the Learning Sciences, 14(2), 161–199.
Demetry, C. (2006). Use of Formative Assessment to Probe Student Conceptions of the Lever Rule. Proceedings of
the American Society of Engineering Education Annual Conference & Exposition.
Felder, R. (1995). A longitudinal study of engineering student performance and retention, IV. Instructional methods
and student responses to them. Journal of Engineering Education, 84(4), 361–367.
Finkelstein, N. D. & Pollock, S. J. (2005). Replicating and understanding successful innovations: Implementing tutorials
in introductory physics. Physics Review Special Topics - Physics Education Research, 1, 010101.
Hake, R. R. (1998). Interactive-engagement vs. traditional methods: A six thousand-student survey of mechanics test
data for introductory physics courses. American Journal of Physics, 66, 64–74.
Heckler, A. F. & Rosenblatt, R. (2010). Student understanding of atomic bonds and their relation to mechanical properties
of metals in an introductory materials science engineering course. Proceedings of the American Society of Engineering
Education Annual Conference & Exposition.

WINTER 2013 31
ADVANCES IN ENGINEERING EDUCATION
A Tutorial Design Process Applied to an Introductory
Materials Engineering Course
Heckler, A. F. & Rosenblatt, R. (2011). Student diffi culties with basic concepts in Introductory Materials Science. Pro-
ceedings of the Annual ASEE/IEEE Frontiers in Education Conference.
Heron, P. R. L., Loverude, M. E., Shaffer, P. S., & McDermott, L. C. (2003). Helping students develop an understanding
of Archimedes’ principle. II. Development of research-based instructional materials. American Journal of Physics, 71,
1188–1195.
Kitto, K.L. (2007). Analyzing What Students Write about Materials - Another Strategy for Developing Conceptual Knowl-
edge in a Materials Engineering Course. Proceedings of the Annual ASEE/IEEE Frontiers in Education Conference.
Kitto, K. L. (2008). Developing and Assessing Conceptual Understanding in Materials Engineering Using Written Re-
search Papers and Oral Poster Presentations. Proceedings of the Annual ASEE/IEEE Frontiers in Education Conference.
Krause, S., Decker, J. C., Niska, J., & Alford, T. (2002). A Materials Concept Inventory for introductory materials engi-
neering courses, National Educators Workshop Update 2002, 17, 1–8.
Krause, S. J., Decker, J. C., & Griffi n, R. (2003). Using a Materials Concept Inventory to assess conceptual gain in intro-
ductory materials science courses. Proceedings of the Annual ASEE/IEEE Frontiers in Education Conference.
Krause, S. J., Tasooji, A., & Griffi n, R. (2004). Origins of Misconceptions in a Materials Concept Inventory From Student
Focus Groups. Proceedings of the American Society of Engineering Education Annual Conference & Exposition.
Krause, S., Kelly, J., Tasooji, A., Corkins, J., Baker, D., & Purzer, S. (2010a). Effect of Pedagogy on Conceptual Change
in an Introductory Materials Science Course. International Journal of Engineering Education. 20, 868-879.
Krause, S., Kelly, J., Triplett, J., Eller, A. & Baker D. (2010b) Uncovering and addressing some common types of miscon-
ceptions in introductory materials science and engineering courses. Journal of Materials Education, 32, 255-272.
Loverude M. E., Heron, P. R. L., & Kautz, C. H. (2010). Identifying and addressing student diffi culties with hydrostatic
pressure. American Journal of Physics, 78, 75–85.
McDermott, L. C., Rosenquist, M. L., & van Zee, E. H. (1987). Student diffi culties in connecting graphs and physics:
Examples from kinematics. American Journal of Physics, 55, 503–513.
McDermott, L. C. (1991). Millikan Lecture 1990: What we teach and what is learned – Closing the gap. American Journal
of Physics,59, 301–315.
McDermott, L.C. (2001). Physics Education Research—The Key to Student Learning. American Journal of Physics, 69,
1127-1137.
McDermott, L. C., Shaffer, P. S., & the Physics Education Group at the U. of Washington. (2002). Tutorials in Introduc-
tory Physics, Upper Saddle River, NJ: Prentice Hall.
McDermott, L. C., Shaffer, P. S., and Somers, M. D. (2004). Research as a guide for teaching introductory mechanics:
An illustration in the context of the Atwood’s machine. American Journal of Physics, 62, 46–55.
Pollock, S. J. & Finkelstein, N. D. (2008). Sustaining education reforms in introductory physics. Physics Review Special
Topics - Physics Education Research, 4, 010110.
Rosenblatt, R. & Heckler, A. F. (2010). Student understanding of the mechanical properties of metals in an introduc-
tory materials science engineering course. Proceedings of the Annual Conference of the American Society of Engineering
Education.
Rosenblatt, R., Heckler, A. F., & Flores, K. (2011). Tutorials for an Introductory Materials Engineering Course. Proceed-
ings of the Annual ASEE/IEEE Frontiers in Education Conference.
Scherr, R. E., Shaffer, P. S., & Vokos, S. (2002). The challenge of changing deeply held student beliefs about the relativ-
ity of simultaneity. American Journal of Physics. 70, 1238–1248.
Shaffer, P. S. & McDermott, L. C. (1992). Research as guide for curriculum development: an example from electricity,
Part II: Design of instructional strategies. American Journal of Physics. 60, 1003–1013.

32 WINTER 2013
ADVANCES IN ENGINEERING EDUCATION
A Tutorial Design Process Applied to an Introductory
Materials Engineering Course
Shaffer, P. S. & McDermott, L. C. (2005). A research-based approach to improving student understanding of the vector
nature of kinematical concepts. American Journal of Physics. 73, 921–931.
Singh, C. (2008). Interactive learning tutorials on quantum mechanics. American Journal of Physics. 76, 400–405.
Streveler, R. A., Litzinger, T. A., Miller, R. L., & Steif, P. S. (2008). Learning Conceptual Knowledge in the Engineering
Sciences: Overview and Future Research Directions. Journal of Engineering Education, 97(3), 279–294.
Wittmann, M. C., Steinberg, R. N., & Redish, E. F. (2005) Activity-Based Tutorials. New York: Wiley.
Wittmann, M. C., Morgan, J. T., & Bao, L. (2005). Addressing student models of energy loss in quantum tunneling.
European Journal of Physics, 26, 939–950.
Wosilait, K., Heron, P. R. L., Shaffer, P. S., & McDermott, L. C. (1998). Development and assessment of a research-based
tutorial on light and shadow. American Journal of Physics, 66, 906–913.
Wosilait, K., Heron, P. R. L., Shaffer, P. S., & McDermott, L. C. (1998). Addressing student diffi culties in applying a wave
model to the interference and diffraction of light. American Journal of Physics, 67, S5–S15.
AUTHORS
Rebecca Rosenblatt is a recent graduate with a PhD in physics from
The Ohio State University. She is currently a faculty member at Illinois State
University in the department of physics. Her research interests are in the
area of physics education research and more broadly in stem education
research. Her research activities include: Identifi cation, and detailed de-
scriptions of, student diffi culties within the topics of physics and materials
science; understanding the fundamental origins of these diffi culties; the
development of course materials to address such student diffi culties and
aid in more complete knowledge development and knowledge transfer; and the development of assess-
ment instruments to evaluate student diffi culties, understanding, and transfer in these areas.
Andrew F. Heckler is an Associate Professor of Physics at Ohio
State University. His original area of research was in Cosmology
and Astrophysics. In the past nine years, he has focused on Phys-
ics Education Research, studying fundamental learning mecha-
nisms involved in learning physics, the effects of representation
on learning and problem solving, and the evolution of physics
understanding during and after a physics course. In addition, he
is also leading a project to identify and address student diffi culties in learning materials science.
This effort is part of the education component of the OSU Center for Emergent Materials, an NSF
MRSEC center.

WINTER 2013 33
ADVANCES IN ENGINEERING EDUCATION
A Tutorial Design Process Applied to an Introductory
Materials Engineering Course
Katharine Flores is Associate Chair for Materials Science in
the Department of Mechanical Engineering & Materials Science
and Associate Director of the Institute of Materials Science
and Engineering at Washington University in St. Louis, Mis-
souri. Prof. Flores received her Ph.D. in Materials Science and
Engineering from Stanford. She joined the Materials Science
and Engineering faculty at the Ohio State University in 2002,
and moved to her current position at Washington University
in July 2012. Her primary research interest is the mechanical behavior of structural materials, with
particular emphasis on understanding structure-processing-property relationships in bulk metallic
glasses and their composites, an area in which she has worked for almost 15 years. In addition to
her research, Dr. Flores was the Director of Education and Outreach for the Center for Emergent
Materials, the NSF Materials Research Science and Engineering Center at OSU from 2008-2012. In
2011, she was a co-recipient of an Ohio Faculty Innovator Award for her efforts to improve under-
graduate instruction in materials science and engineering.

34 WINTER 2013
ADVANCES IN ENGINEERING EDUCATION
A Tutorial Design Process Applied to an Introductory
Materials Engineering Course
APPENDIX A
Mechanical Properties Tutorial (excerpt)
1. What is the difference between a material’s strength and a material’s stiffness?
2. What is elastic deformation? (Please give a description that a 2nd year engineering student
who has not taken this class yet would understand.)
3. How is elastic deformation related to Young’s modulus, E?
4. A tensile stress is applied to a metal bar such that is deforms elastically. Draw a sample of
atoms in the bar.
a) Before deformation
b) During deformation while under stress
c) After the stress is released
5. While the bar is under stress, is its volume different than before being deformed? Explain.
6. A tensile stress is applied to a metal bar such that is deforms plastically. Draw a sample of
atoms in the bar.
a) Before deformation
b) During deformation while under stress
c) After the stress is released
7. Does the density increase, decrease, or remain the same after plastic deformation? Explain.
8. How is the strength of a metal defi ned? (Please give description that a 2nd year engineering
student who has not taken this class yet would understand.)
9. What is the difference between yield strength and tensile strength?
10. Student C says: “Steel has a yield strength of 180 MPa and Nickel only has a yield strength
of 130 MPa. Steel is therefore stronger and more force is needed to break it.” This student is:
Correct, Partially Correct, Incorrect. Explain.
1 1. Indicate the features which would characterize the Young’s modulus, yield strength, tensile
strength, ductility, and toughness. [Stress strain plot given]
12. Rank the two curves:
Modulus,E: A ( > , < , = ) B
Yield strength: A ( > , < , = ) B
Tensile strength: A ( > , < , = ) B
Ductility: A ( > , < , = ) B

WINTER 2013 35
ADVANCES IN ENGINEERING EDUCATION
A Tutorial Design Process Applied to an Introductory
Materials Engineering Course
APPENDIX B
Diffusion Tutorial (excerpt)
1. In Fick’s First Law, why is J, the diffusion fl ux, proportional to the concentration gradient,
rather than being proportional to the concentration, C?
2. What does the minus sign in Fick’s First Law mean physically? What would happen if the
minus were to become a plus sign?
3. In steady state diffusion, what quantity is “steady”? Is it “steady” with respect to position,
time, or both?
4. Are atoms moving in steady state diffusion?
5. Is there anything that is changing in steady state diffusion?
6. How does the concentration of material change with position when diffusion is in steady
state?
7. How does the diffusion fl ux, J, change with position when diffusion is in steady state?
8. Rewrite Fick’s First and Second Laws for steady state diffusion.
9. A Slab of Ni atoms (gray) are perfectly sandwiched between two slabs of Cu atoms (white),
as shown on the fi rst graph marked “t = 0 seconds“. Draw graphs for the Cu concentration
and the magnitude of the Cu diffusion fl ux as a function of position at t = 0 seconds. Then,
for t = a few hours later (non-steady state) and t = long time after (equilibrium), show how
the atoms would be distributed (i.e. color in Ni atoms) and draw the graphs for the Cu
concentration and the magnitude of the Cu diffusion fl ux as a function of position.

36 WINTER 2013
ADVANCES IN ENGINEERING EDUCATION
A Tutorial Design Process Applied to an Introductory
Materials Engineering Course
APPENDIX C
Phase Diagrams Tutorial (excerpt)
1. What is a phase? Write a defi nition that a 2nd year engineering student who has not taken this
class yet would understand. Give 3 or 4 examples.
2. Some binary alloys (alloys with two species) have only one solid phase such as a Copper and
Nickel system. Others have two solid phases such as a Lead and Tin system.
a. Why is this?
b. Under what conditions will a Lead Tin alloy have only one phase?
3. Draw pictures of the microstructure of this
Copper-Silver alloy as you slowly cool the
solution
At 24% Ag: a1, b1, c1
At 72% Ag: a2, b2, c2
At 94% Ag: a3, b3, c3
4. At point b1 in the diagram, estimate the composition of the �?
5. At point b1 in the diagram, estimate the composition of the Liquid?
6. At point b1 in the above diagram, use your estimates above to calculate the fraction of the
microstructure that is �?
7. In the eutectic phase diagram, what is alpha? Draw a picture of alpha at the atomic level.
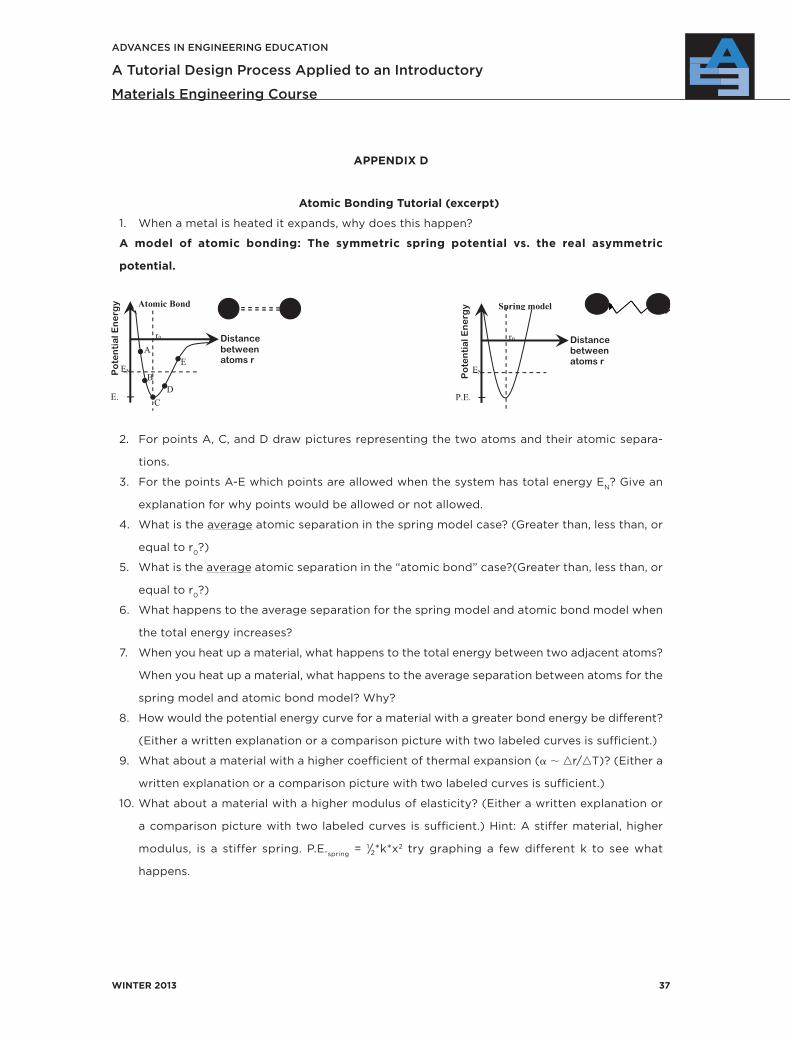
WINTER 2013 37
ADVANCES IN ENGINEERING EDUCATION
A Tutorial Design Process Applied to an Introductory
Materials Engineering Course
APPENDIX D
Atomic Bonding Tutorial (excerpt)
1. When a metal is heated it expands, why does this happen?
A model of atomic bonding: The symmetric spring potential vs. the real asymmetric
potential.
2. For points A, C, and D draw pictures representing the two atoms and their atomic separa-
tions.
3. For the points A-E which points are allowed when the system has total energy EN? Give an
explanation for why points would be allowed or not allowed.
4. What is the average atomic separation in the spring model case? (Greater than, less than, or
equal to r0?)
5. What is the average atomic separation in the “atomic bond” case?(Greater than, less than, or
equal to r0? )
6. What happens to the average separation for the spring model and atomic bond model when
the total energy increases?
7. When you heat up a material, what happens to the total energy between two adjacent atoms?
When you heat up a material, what happens to the average separation between atoms for the
spring model and atomic bond model? Why?
8. How would the potential energy curve for a material with a greater bond energy be different?
(Either a written explanation or a comparison picture with two labeled curves is suffi cient.)
9. What about a material with a higher coeffi cient of thermal expansion (� � �r/�T)? (Either a
written explanation or a comparison picture with two labeled curves is suffi cient.)
10. What about a material with a higher modulus of elasticity? (Either a written explanation or
a comparison picture with two labeled curves is suffi cient.) Hint: A stiffer material, higher
modulus, is a stiffer spring. P.E.spring
= 1/2*k*x2 try graphing a few different k to see what
happens.
P.E.
r0
EN
Distance between atoms r
Po
ten
tia
l En
erg
y Spring model
r0
EN
Distance between atoms r
E.
Atomic Bond
A
B
CD
E
Po
ten
tia
l En
erg
y

38 WINTER 2013
ADVANCES IN ENGINEERING EDUCATION
A Tutorial Design Process Applied to an Introductory
Materials Engineering Course
1 1. Concept check: For each situation rank (<, >, or =) the two curves A & B by the requested
properties.
12. Material A is denser than Material B. How does Material A’s melting temperature compare to
material B’s? Explain.
B.E.: B.E:
Modulus: Modulus:
α: αB
ABA