Embedding collaborative and mobile technologies - Jisc Digital Festival 2015
Advanced Display Technologies
Paul Anderson
This report was peer reviewed by: Dr. Wayne Cranton, Reader in Visual Technology, Nottingham Trent University. Mark Fihn, Publisher, Veritas et Visus. Chris Williams, Logystyx UK Limited.
JISC Technology & Standards Watch Advanced Display Technologies
TABLE OF CONTENTS Page 1. Executive Summary 3 2. Introduction 4 3. Why is this relevant to education? 4 4. Conveying information: the human eye and factors in display systems
5
4.1 Brightness and contrast 5 4.2 Visual acuity, information content and resolution 6 4.3 Field of view and angle of viewing 6 4.4 Perception of colour 7 4.5 Colour gamut (Chromatic range) 7 4.6 Perception of motion, refresh rate and CFF 9 4.7 HVS variations and accessibility 10
5. Display Technologies: the state of the art 10 5.1 Discussion of the strengths and weaknesses of current technologies 11 5.1.1 Discussion of display characteristics relating to HVS 12 5.1.2 Discussion of non-HVS related display characteristics 18 5.2 Projection – an alternative for multi-viewer scenerios 19 5.3 CRT – getting thinner and still in the market 19
6. The future of display technologies – the next ten years 21 6.1 Specific Trends: FPDs - Flattening of the screen 21 6.1.1 Field Emission Displays (FED): carbon nanotubes 22 6.1.2 Organic light emitting diodes – OLEDs 22 6.1.3 Polymer light emitting diodes – PLEDs 23 6.1.4 Surface-conduction electron-emitter display – SEDs 24 6.1.5 Some final thoughts on FPDs 24 6.2 Specific Trends: Flexible displays and e-paper 26 6.3 Specific Trends: High Definition TV (HDTV) and video 27 6.4 Specific Trends: 3D systems 28 6.4.1 How we perceive 3D 29 6.4.2 Stereo Pair systems 29 6.4.2.1 Glasses: Liquid Crystal shutters 29 6.4.2.2 Without glasses: Autostereoscopic 3D 29 6.4.2.2.1 Parallax Barrier 30 6.4.2.2.2 Lenticular systems 30 6.4.2.2.3 Observer or head tracking systems 30 6.4.3 Volumetric 3D systems 31 6.4.4 Holography 32 6.5 Specific Trends: Higher resolution and visualisation technologies 33 6.5.1 Scalable display walls and Power walls 33 6.5.2 The future of visualisation 34 6.6 Specific Trends: Personal and near-to-eye displays 35 6.6.1 Scanned beam 35
7. The longer term: the future of display technology 36 8. Conclusion and recommendations 37 9. References 39 Appendix A: Review of the technology of existing solutions 49 Appendix B: Further notes on projection systems 51 About the author and reviewers 53
Page 2 of 53
JISC Technology & Standards Watch Advanced Display Technologies
1. Executive Summary In common with the rest of society, increasing amounts of time in education are spent interacting with display screens. Through computer displays, by watching projections or viewing TV we handle day-to-day office information, process research, view e-learning content and engage with multimedia materials. Display technologies are in a period of flux, driven by the recent introduction of flat panel display (FPD) technologies, LCD and Plasma, which are rapidly replacing the traditional cathode ray tube (CRT). This report reviews this flux in the context of the human visual system and discusses a range of novel forthcoming technologies that will take the process further. The human visual system (HVS) is a complex and highly evolved system and, to date, no display technology has been able to match its capacity. There is a range of defining characteristics of the HVS that the system employs to resolve and make sense of an image and the report outlines these with particular reference to their impact on the design of display technology. Having established this context the report outlines the current state of the art, focusing in particular, on the current rapid uptake of LCD and, to a lesser extent, Plasma screens. The three technologies, CRT, LCD and Plasma are compared with particular reference to how they handle aspects of the HVS. In this respect, CRT has tremendous benefits, particularly when the cost is factored in, but its bulk, size and weight are rapidly consigning it to history. Despite possessing some drawbacks, such as its relatively limited viewing angle, LCD has the biggest commercial momentum and in 2004 replaced CRT as the technology of choice for computer displays. Despite this momentum, new technologies in development are aimed at replacing the LCD, continuing the trend to flatter, more powerful displays. The report reviews these forthcoming developments and discusses their implications, again in the context of the factors of the human visual system. These developments include nanotube-based field emission displays and Organic and Polymer LEDs. Large numbers of researchers and technology companies are competing to take these developments out of the prototype stage and into commercial products in the next five years. All of these technologies promise greatly improved capabilities with regard to HVS factors such as resolution and brightness. Whether they will be able to compete with the momentum already built up in the manufacturing and supply chain for LCD is a moot point. Most manufacturers are hedging their bets and awaiting developments in the market place. We then scan the horizon a little further, looking at the development and implications of more novel technologies such as 3D displays, near-to-eye systems, electronic paper, rollable/flexible screens and increased immersion through room-sized display walls. Although these developments are at least several years away from general uptake within the education market, some of them may have profound implications for the content and setting in which education is delivered and the context and process in which research is undertaken. They can be seen in the context of new developments in classroom and laboratory design and part of a wider story of a move to mobile and blended learning and new forms of collaborative, remote and multi-site research visualization. All these developments will offer new opportunities for the development of content for display. In fact it is likely that the generation of new content, for example High Definition TV and video, will be the key driver to the adoption of new display screens. This will be a key challenge for education, as young people in particular will become used to being engaged with high-end multimedia, high definition and, perhaps even, 3D content.
Page 3 of 53
JISC Technology & Standards Watch Advanced Display Technologies
2. Introduction Despite periods of huge technological change in the computing industry we remain wedded to the electronic display screen as the principal channel for the transfer of information from machine to person (Wisnieff and Ritsko, 2000). In the modern educational setting considerable amounts of time in learning, research and administration is 'screen' time, devoted to absorbing and manipulating display-mediated information. For this reason the functionality, design and technology of display systems profoundly affects our everyday working lives. With this in mind, this report will review the current state of the art with regard to displays and look at some of the forthcoming developments and trends. Until relatively recently the TV and computer display have been largely static technologies based on the cathode ray tube, an underlying platform technology almost unchanged since the 1920s. However, in the last decade, we have witnessed a dramatic change as we have moved to flat screens, based on new Liquid Crystal Display (LCD) and Plasma technologies. This report will show that this trend will continue and, in fact, we are only at the beginning of a period of huge flux in display technologies, and that these developments are likely to have a profound effect on education. As designers and engineers continue to strive to match their technologies' capabilities to those of the human visual system, they will introduce a range of new platforms and novel materials. We will see flatter, lighter displays with much higher resolutions. We will see new, flexible materials being employed to allow for larger screens which will be incorporated into novel display interfaces and surfaces. We'll see a move into 3D content and we may also see displays disappear altogether with the introduction of near-to-eye technologies that scan light directly into our retinas. It may read like science fiction, but within a few years we could be seeing the disappearance of the computer display monitor altogether. 3. Why is this relevant to education? In common with the rest of society, increasing amounts of time in education are spent interacting with day-to-day office information, e-learning content and multimedia materials through either computer displays, by watching projections or viewing TV. In learning and teaching this has been fortified by the trend towards 'blended learning' incorporating a rich mixture of paper-based, lecture, online material and interactive multimedia (Newby, 2004). These developments mean that within education we are becoming much more aware of the quality of the screens we are viewing and how that affects the work we undertake. There are also some special drivers in education and research at the moment with respect to displays:
E-science dataset visualisation: the ever larger datasets created by scientific discovery are presenting new problems in visualisation and are pushing the requirements for displays' size and resolution (see section 6.5) (White Rose Grid, 2003).
Collaborative work: increasingly, groups of researchers are required to work on such datasets simultaneously (Cameron, 2005)
Training: some professions will need to increasingly incorporate training techniques using advanced displays such as simulators, VR and augmented reality. For example, medical training for remote surgery (Brodlie, 2004)
Mobile learning and research: developments in handheld devices, smartphones and electronic books will all make use of advanced display technologies such as electronic paper and near-to-eye systems (National Research Council, 2002; Wagner, 2005)
Engagement: expectations over the quality and perceptual experience gained from viewing educational materials through displays will be partly driven, particularly amongst younger students, by the increasingly high quality of visual experience obtained through home TV and video gaming.
Classroom design: new types of display surfaces will be a significant feature in restructured classroom and learning spaces that emphasise flexibility, collaboration and multi-site working (Long and Ehrmann, 2005)
Page 4 of 53
JISC Technology & Standards Watch Advanced Display Technologies
4. Conveying information: The human eye and factors in display systems
‘The human visual system evolved over millions of years. The disparity between the natural world 'display' and that 'sampled' by year 2000 technology is more than a factor of one million. The grand challenge for display technology is to close this fantastic 106 gap between devices and the human visual system.’
(Hopper, 1999) We are a particularly visually-oriented species and have evolved a highly complex human visual system (HVS) based on over 100 million light-detecting photoreceptors (IST, 2004). What we 'see' when we view a display, or anything else, is the response of the eye (by the photoreceptors) to the detection of electromagnetic radiation in the form of small packets of energy (photons) from the visible part of the electromagnetic spectrum1. In a sense, the eye is a radiant energy detector. This is the medium through which display devices must convey information, and aspects of the HVS and its operation have profound implications for the methods used by displays and their operational features (such as resolution, contrast, brightness etc.). The context and environment in which the HVS and display device are operating is also important, for example, the level of ambient light available. The human visual system is highly evolved, complex, able to function across a wide range of environments, and offers superior capabilities compared to existing forms of information display technology. The grand goal of displays research and development is therefore to try to match the information output of the display to the input and processing capacity of the human visual system (Wisnieff and Ritsko, 2003), allowing, for example, the ease of readability afforded by paper (Dillon, 2004). Therefore, before we embark on a discussion of new display technology developments and trends it is important to place the key factors at work in the context of the human visual system and, in the following sections, we outline these factors and their interplay with display systems. 4.1 Brightness and contrast The brightness of a viewed object is defined in a psychological sense as the level of light intensity perceived by the viewer. This is directly related to both the physical quantity or intensity of the light involved (either emitted or reflected) and the section of the dynamic range the absolute ambient brightness falls into. There are various related photometric2
measurements for such brightness, but the key physical measure of brightness is luminance or luminosity, the amount of light emitted, or reflected, from a source in a given direction, measured in candela per square metre (cd/m2). As an indication of the range of HVS perception, moonlight exhibits around 0.1 cd/m2, indoor lighting is around 100 cd/m2, and sunlight is around 10,000 cd/m2. In terms of displays, brightness is formally defined as the luminance of white colour in the centre of the screen and is measured in candela per square metre (cd/m2) or 'nits'. For display technologies the other important consideration is the dynamic range, that is, the ratio between the maximum and minimum intensities that can be generated. In order to make 'sense' of an image, the HVS uses patterns presented through the comparative, differing luminance levels within an image (the contrast). The information that can be conveyed to a user through a display technology is fundamentally limited by the human ability to discern such contrast, and the ability to display contrast is therefore a key factor in the design of display technologies. The eye's ability to discern contrast is known as 'contrast sensitivity' and is a measure of how faded or 'greyed-out' an image can be before it becomes indistinguishable from a uniform background. Higher contrast is required to detect or
1 Technically, visible light consists of the spectrum with wavelengths from 380nm (blue light) and 730nm (red light). 2 Photometry is the measurement and specification of light relating specifically to its effect on human vision
Page 5 of 53
JISC Technology & Standards Watch Advanced Display Technologies
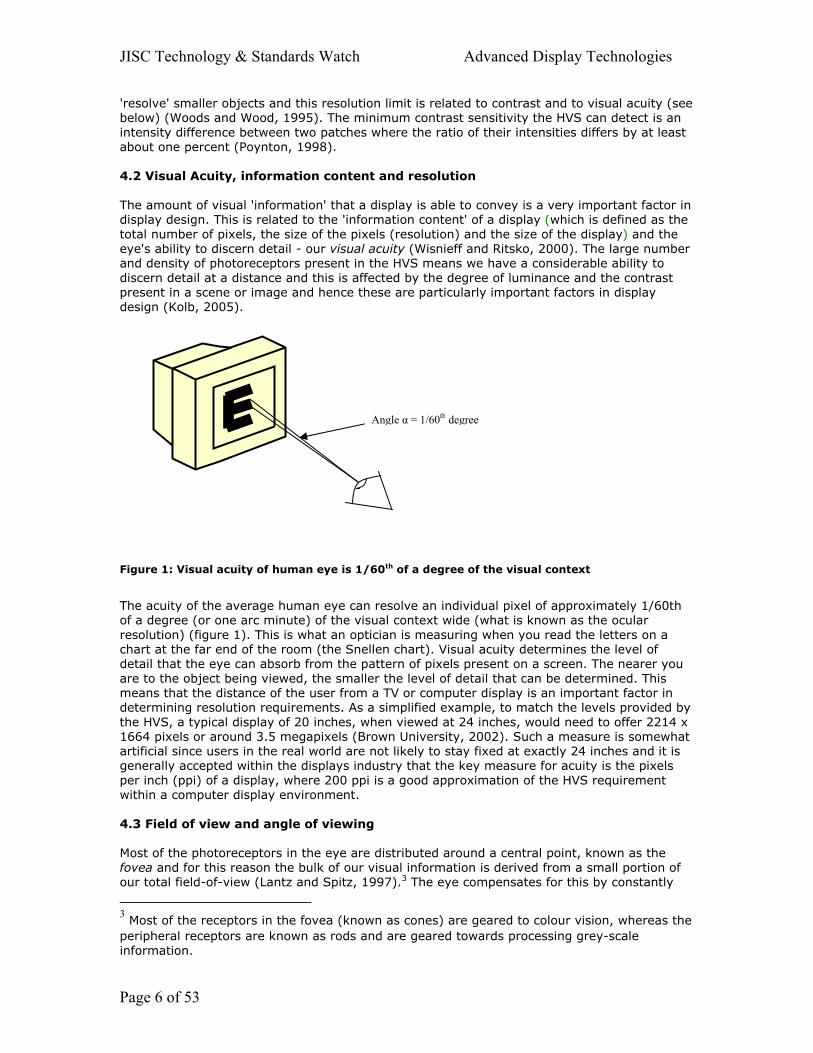
'resolve' smaller objects and this resolution limit is related to contrast and to visual acuity (see below) (Woods and Wood, 1995). The minimum contrast sensitivity the HVS can detect is an intensity difference between two patches where the ratio of their intensities differs by at least about one percent (Poynton, 1998). 4.2 Visual Acuity, information content and resolution The amount of visual 'information' that a display is able to convey is a very important factor in display design. This is related to the 'information content' of a display (which is defined as the total number of pixels, the size of the pixels (resolution) and the size of the display) and the eye's ability to discern detail - our visual acuity (Wisnieff and Ritsko, 2000). The large number and density of photoreceptors present in the HVS means we have a considerable ability to discern detail at a distance and this is affected by the degree of luminance and the contrast present in a scene or image and hence these are particularly important factors in display design (Kolb, 2005).
Angle α = 1/60th degree
Figure 1: Visual acuity of human eye is 1/60th of a degree of the visual context
The acuity of the average human eye can resolve an individual pixel of approximately 1/60th of a degree (or one arc minute) of the visual context wide (what is known as the ocular resolution) (figure 1). This is what an optician is measuring when you read the letters on a chart at the far end of the room (the Snellen chart). Visual acuity determines the level of detail that the eye can absorb from the pattern of pixels present on a screen. The nearer you are to the object being viewed, the smaller the level of detail that can be determined. This means that the distance of the user from a TV or computer display is an important factor in determining resolution requirements. As a simplified example, to match the levels provided by the HVS, a typical display of 20 inches, when viewed at 24 inches, would need to offer 2214 x 1664 pixels or around 3.5 megapixels (Brown University, 2002). Such a measure is somewhat artificial since users in the real world are not likely to stay fixed at exactly 24 inches and it is generally accepted within the displays industry that the key measure for acuity is the pixels per inch (ppi) of a display, where 200 ppi is a good approximation of the HVS requirement within a computer display environment. 4.3 Field of view and angle of viewing Most of the photoreceptors in the eye are distributed around a central point, known as the fovea and for this reason the bulk of our visual information is derived from a small portion of our total field-of-view (Lantz and Spitz, 1997).3 The eye compensates for this by constantly
3 Most of the receptors in the fovea (known as cones) are geared to colour vision, whereas the peripheral receptors are known as rods and are geared towards processing grey-scale information.
Page 6 of 53
JISC Technology & Standards Watch Advanced Display Technologies
darting around to bring objects of interest into the foveal area. In fact a human can typically see 155 degrees vertically and 185 horizontally (Rheingold, 1991). In display technologies this is a consideration for the position of the viewer and the angle of viewing. In general, a viewer should be positioned so that the display is placed centrally, in front of the eyes. However, this is not always possible, for example, in a tutorial group with a number of people viewing a single screen. In these cases, the display's capacity to offer a wider 'angle of view' with similar levels of resolution, brightness and contrast becomes important. The angle of view is formally defined as the angle at which the viewer must be positioned in relation to the screen in order to clearly see the image on a display (zero degrees being directly in front, 180 degrees directly to the left or right hand side). The LCD industry takes this one step further by saying that it is also the point at which the brightness is halved for the viewer. It is worth noting that some display technologies may offer a theoretical viewing angle of 180 degrees but in actual fact this would involve viewing the screen tangentially across the surface of the display, which is not physically possible. 4.4 Perception of colour The science of colour and its perception by the HVS is complex and draws on many disciplines such as physics, colorimetry, physiology and psychology (Foley, 1990). In physical terms the colour of an object is complex, but in the main it is a function of the different wavelengths of light that an object emits or reflects. A colour can be fully specified in terms of three perceptual properties: hue, brightness/lightness and saturation, which in turn are related to underlying physical, colorimetric properties such as the dominant wavelength as below:
• Hue: related to dominant wavelength of the light • Brightness/lightness: related to the brightness (i.e. perceived intensity), which is
related to the luminosity of the colour. If an object is reflecting light then we use the term lightness, but if an object is emitting light (as is the case with a CRT display) then we call it brightness
• Saturation (or 'chroma'): related to the relative strength or paleness of a colour. This is related to the spread of the wavelengths involved or, in simpler terms, the amount of mixing of white light with the hue (also known as the excitation purity). A highly saturated colour will consist of a very narrow range of wavelengths centred around its hue.
The average human can perceive hundreds of thousands of different colours and can perceive 128 fully saturated colour hues (Foley, 1990). Humans perceive different wavelengths of light as different colours, being able to differentiate wavelengths of around 3nm, although there are complex physiological and psychological processes at play so that one person's experience of a shade of blue may not actually be the same as another person's. The HVS is able to perceive this through the use of a type of photoreceptor known as a 'cone'. In simplified terms, the HVS uses a trichromatic process in which there are three types of cone (blue, green, red), each of which detects a different range of wavelengths of light4. The red cone detects light around 564nm, green at 533nm and blue at 437nm. 4.5 Colour gamut (chromatic range) Colour can help convey a tremendous amount of information in an image so a display's capacity to generate colour is important. Colour monitors emit or reflect light of varying strength for each of three primary colours – red, green and blue – and then mix them to generate a colour image. Colour gamut is the measure of a monitor's ability to generate and display such a range of colours. The gamut possible from a particular display is dependent on the mechanism used to generate colour and is bounded by the degree of saturation possible for each of the three primary colours (Wisnieff and Ritsko, 2000).
4 See: http://webvision.med.utah.edu/kallcolor.html for a fuller discussion of the models used for HVS colour vision.
Page 7 of 53
JISC Technology & Standards Watch Advanced Display Technologies
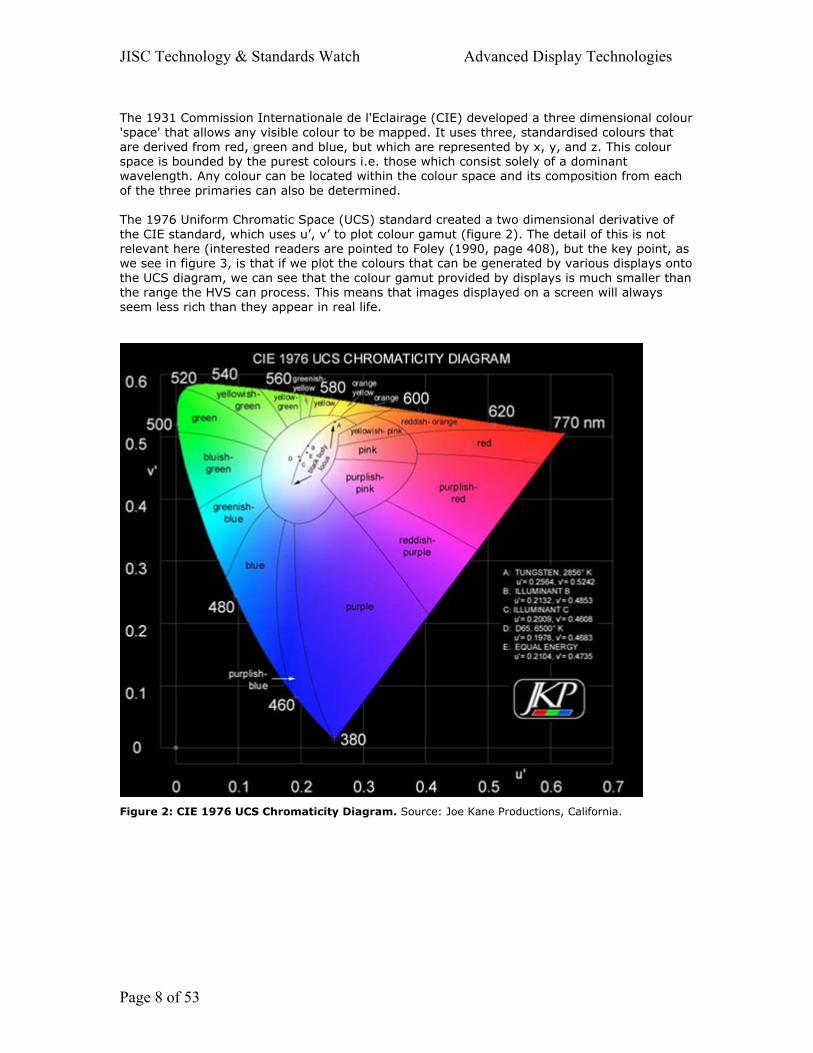
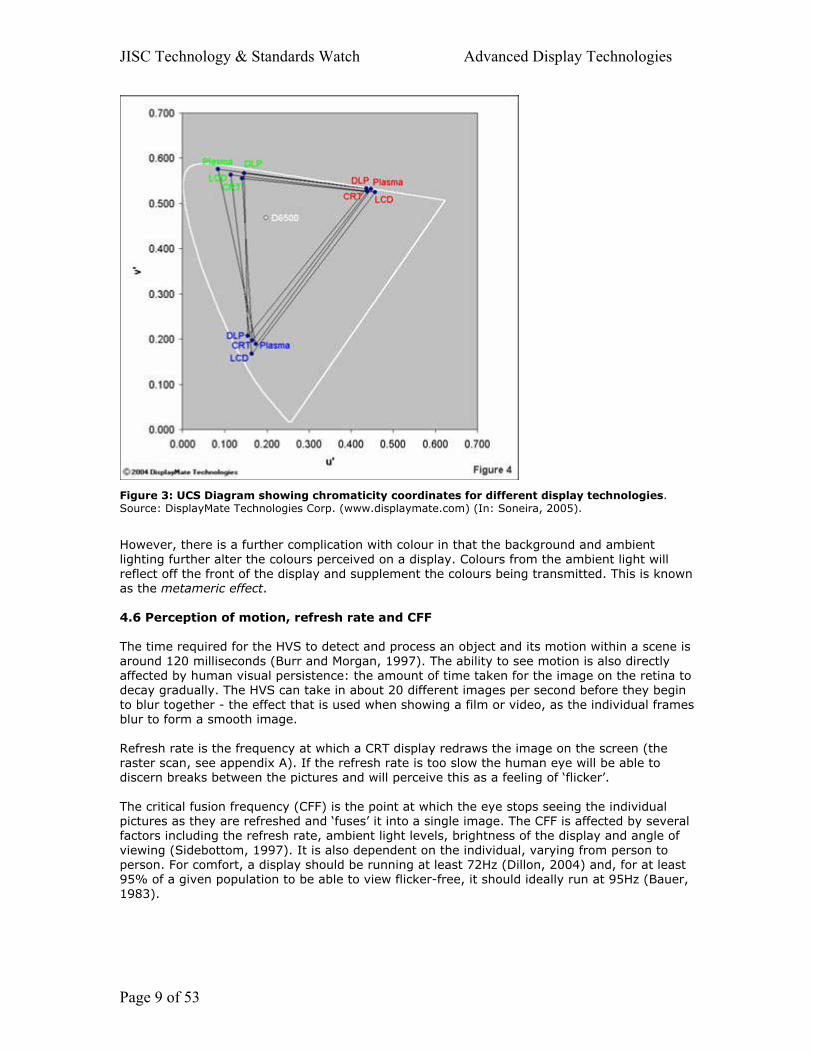
The 1931 Commission Internationale de l'Eclairage (CIE) developed a three dimensional colour 'space' that allows any visible colour to be mapped. It uses three, standardised colours that are derived from red, green and blue, but which are represented by x, y, and z. This colour space is bounded by the purest colours i.e. those which consist solely of a dominant wavelength. Any colour can be located within the colour space and its composition from each of the three primaries can also be determined. The 1976 Uniform Chromatic Space (UCS) standard created a two dimensional derivative of the CIE standard, which uses u’, v’ to plot colour gamut (figure 2). The detail of this is not relevant here (interested readers are pointed to Foley (1990, page 408), but the key point, as we see in figure 3, is that if we plot the colours that can be generated by various displays onto the UCS diagram, we can see that the colour gamut provided by displays is much smaller than the range the HVS can process. This means that images displayed on a screen will always seem less rich than they appear in real life.
Figure 2: CIE 1976 UCS Chromaticity Diagram. Source: Joe Kane Productions, California.
Page 8 of 53
JISC Technology & Standards Watch Advanced Display Technologies
Figure 3: UCS Diagram showing chromaticity coordinates for different display technologies. Source: DisplayMate Technologies Corp. (www.displaymate.com) (In: Soneira, 2005).
However, there is a further complication with colour in that the background and ambient lighting further alter the colours perceived on a display. Colours from the ambient light will reflect off the front of the display and supplement the colours being transmitted. This is known as the metameric effect. 4.6 Perception of motion, refresh rate and CFF The time required for the HVS to detect and process an object and its motion within a scene is around 120 milliseconds (Burr and Morgan, 1997). The ability to see motion is also directly affected by human visual persistence: the amount of time taken for the image on the retina to decay gradually. The HVS can take in about 20 different images per second before they begin to blur together - the effect that is used when showing a film or video, as the individual frames blur to form a smooth image. Refresh rate is the frequency at which a CRT display redraws the image on the screen (the raster scan, see appendix A). If the refresh rate is too slow the human eye will be able to discern breaks between the pictures and will perceive this as a feeling of ‘flicker’. The critical fusion frequency (CFF) is the point at which the eye stops seeing the individual pictures as they are refreshed and ‘fuses’ it into a single image. The CFF is affected by several factors including the refresh rate, ambient light levels, brightness of the display and angle of viewing (Sidebottom, 1997). It is also dependent on the individual, varying from person to person. For comfort, a display should be running at least 72Hz (Dillon, 2004) and, for at least 95% of a given population to be able to view flicker-free, it should ideally run at 95Hz (Bauer, 1983).
Page 9 of 53
JISC Technology & Standards Watch Advanced Display Technologies
4.7 HVS Variations and accessibility Obviously, as with all human systems, the HVS has many variations and there are many issues around accessibility for people with different visual levels and problems. Visual acuity, for example, is one of the factors that varies widely (even between an individual's two eyes) and can be severely affected in people with visual problems. Colour vision is another major variable, with, for example, 10% of the male population being colour deficient. The display technology used can also have an impact on people with specific visual impairments or medical problems, for example, CRTs can be a problem for those with visual sensitivities such as epilepsy because of their propensity to flicker (JISC TechDis, 2005). For those who rely on screen magnification to improve their visual abilities the increasing availability of cost-effective, larger displays can increase their ability to work and study with screen-based information (Neumann, 2004). 5. Display Technologies: the state of the art We have seen that several key factors in a display technology are determined by the need to match the technology to the information capacity of the human visual system (HVS) and that these factors include brightness, contrast, resolution and colour gamut. In general, the development of display technologies is characterised by continued attempts to match the capabilities of the HVS and one would expect the state of the art to reflect this. However, as with any product, cost and the general 'look' and design are important factors, and it is the latter that has had by far the most bearing on the recent history of displays due to the desire for flatter, thinner displays. The current state of the art is thus characterised by the recent and continuing rapid evolution from bulky cathode ray tube (CRT) displays to flatter screens known as Flat Panel Displays (FPD) based around two newer technologies: Liquid Crystal Display (LCD) and Plasma. The key to understanding the development of the market to date is to appreciate the different drivers operating in the two key market segments: computer displays and TVs. In the former, a key determinant was the requirement for space-saving, lower power usage and portability. In the latter, the desire for space-saving and general attractiveness, and the need for larger, brighter screens capable of handling new, higher definition content, were important. The CRT is inherently bulky as its operation requires a relatively large space for the vacuum tube, and FPDs have challenged CRT displays in both market segments by exploiting this key weakness. Initially, LCD, which is not only thin but also lightweight, was seen as the only viable technology for mobile computing platforms such as the laptop and mobile phone. Simple LCD displays have been available since the 1970s, but with the introduction in the Sharp PC-7000 in 1985, LCD has made steady and increasing in-roads into the general computer display market. In 2004, for the first time, the number of LCD sales was higher than equivalent CRT displays for computer monitors (Cranton, 2005). Plasma has taken a rockier road since it was first invented in 1964 at the University of Illinois, USA. Its original inventors were driven by the desire to develop a better display screen for educational use, which could present high quality graphics and media (although Hutchinson (2003) shows that initially, the main driver during the late 1960s/70s was from the Japanese who needed to develop an alternative display to CRT that could reliably reproduce kanji script). The large investment required for the mass-production of Plasma proved a difficulty and increasing competition from LCD meant that most of this work had been abandoned by the end of the 1980s, although there was still interest for military applications. However, the forthcoming introduction of High Definition TV (HDTV) was the driver to start the commercial redevelopment of Plasma in the 1990s, since the clarity of HDTV can not be fully appreciated on CRT TVs and, at that time, LCD could not be manufactured with a large enough screen size. Since then, developments in the manufacturing of LCD have allowed larger size TVs to be manufactured and this has led to increasing competition between the two FPD technologies in the TV market, particularly in the size range of 32 to 42 inches (Putman, 2005).
Page 10 of 53
JISC Technology & Standards Watch Advanced Display Technologies
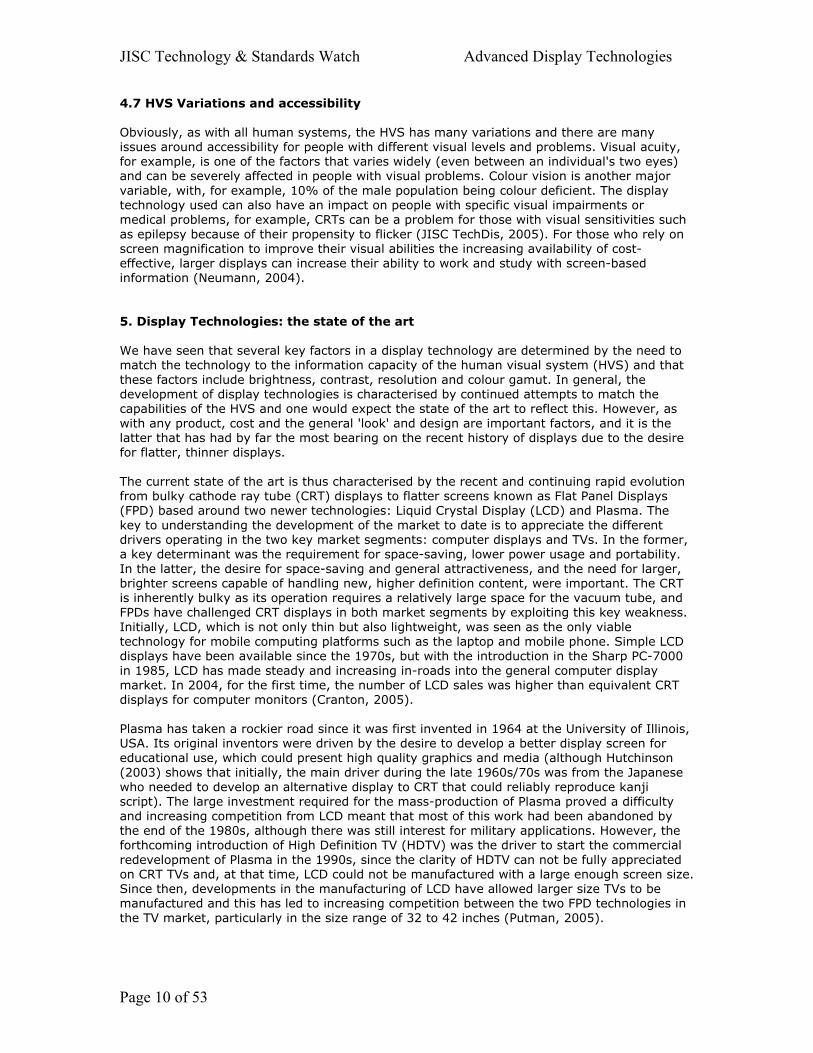
Before we discuss the various pros and cons of these technologies, it is worth reviewing briefly the technologies involved in current displays. Appendix A contains a more detailed outline of each of the three, but the following table (table 1) summarises:
Table 1: Summary of the three current display technologies
Display Type Main Uses Mechanism Notes
LCD Passive:
Transmissive
or
Passive: Reflective or Passive: Transflective
Mobile phone Laptop screens Computer displays TVs up to 42"
Digital watches and calculators
Mobile/laptops
Liquid crystal light gates control transmission of a backlight through polarised light filters
Liquid crystal light gates control reflection of ambient light through polarised light filters
A mixture of both
Plasma Emissive Large TVs Public information displays
Cells of neon gas are ionised by high voltage to release UV photons which hit a phosphor screen
Can only be manufactured in large sizes.
CRT Emissive Traditional TV Traditional computer monitor
Electrons generated by thermionic emission by high voltage at a cathode are swept by magnets into a focused beam which strikes a phosphor screen
Sweeps in a raster pattern, right to left and up to down across screen – has implications for flicker.
Passive versus emissive displays The above table categorises displays as emissive or passive. An emissive display is one that produces its own light; a passive display modulates light that passes through it. LCDs are passive and can be further categorised into transmissive (allows the passage of photons from a backlight), reflective (simply reflects external, ambient light) or transflective (a mixture of both). The standard LCD thin film transistor (TFT) display on a laptop computer is transmissive, whereas a calculator would use a reflective liquid crystal. Advantages and disadvantages are argued for these two key properties. For example, it is argued by some that emissive displays are not as easy to read in direct daylight, as for example, the transmissive LCD TFT display on a laptop. As mentioned in section 4 the context and environment in which a display is to be used is important: see for example, a discussion on the use of displays in mobile phone technology (Kimmel, 2002) and for one manufacturer's viewpoint on the benefits of reflective and emissive displays, see Eink (2005). 5.1 Discussion of strengths and weaknesses of current technologies Before moving on to a discussion of the future trends in display technologies it is useful to review the situation with regard to the strengths and weaknesses of the classes of product in the current market place, particularly in the context of our previous discussion of the HVS. Table 2, at the end of the discussion, outlines a series of characteristics of the HVS and identifies the display technology factors that are of relevance. For each characteristic the table outlines the relative position and strengths/weaknesses of each class of product.
Page 11 of 53
JISC Technology & Standards Watch Advanced Display Technologies
5.1.1 Discussion of display characteristics relating to HVS Brightness In display terms, brightness is formally defined as the luminosity or luminance of white colour in the centre of the screen and is measured in candela per square metre (cd/m2) or 'nits' (Da-Lite, 1995). The brightest, commercially available, “off the shelf”5, displays are Plasma-based, which offer outstanding luminance in the range 500 to 1,200 cd/m2. In comparison, CRTs typically offer an operational brightness of around 90 to 150 cd/m2. Commercial LCDs offer a mid-range, with typical values of 400 to 500 cd/m2 being recently quoted by commentators (What Plasma, 2005). Generally, brightness levels of 150-250 cd/m2 are considered suitable for typical office work (Wisnieff and Ritsko, 2000) whilst public displays and TVs benefit from higher levels. CRT’s inability to deliver high levels of brightness is particularly an issue when strong ambient light is present (for example, in the case of a screen used at a bank's outdoor cash point machine) (Hopper, 1999). Dynamic Range and Contrast Dynamic range is the luminance ratio of pure white to pure black, again as measured in the centre of the screen, but not in same image (Foley, 1990). The ratio is driven by the maximum luminance intensity levels (white brightness) that can be generated and by the ability to deliver a 'pure' black. Contrast (or contrast ratio) is very closely related to dynamic range, being the maximum ratio of white to black luminance that can be generated in the same image. These two figures differ because when measured in the same image there may be internal reflection from the light areas of the picture across to the dark areas caused by the glass of the screen. It is not always clear which type of figure a manufacturer is quoting and it is worth bearing in mind that such formal measurements bear little relation to the contrast levels available from a display in a real office environment where ambient light and reflection from the screen will significantly affect the values. A display may not be able to deliver a pure black because the technology leaks reflected light (in the case of LCD) or reflects ambient light. A poor ability to generate black will also have a knock-on effect throughout the colour range in the darker colours. As an example of the different levels, when displaying black a typical CRT still emits light of luminance of 0.01 cd/m2, LCD of 0.72 cd/m2 and Plasma of 0.42 cd/m2 (Soneira, 2005). A good CRT monitor will offer a contrast that exceeds 1000:1, and will be close to displaying a pure black (i.e. the best dynamic range). However, despite not being able to display the purest black, Plasma displays exhibit the best contrast, offering a 1000-3000:1 ratio, due to their high brightness capabilities. N.B. The importance of dynamic range is also partly governed by the type of content a display is designed for (for example, movie makers prefer a lower dynamic range with blacker blacks and more grey shades). Compared to the other technologies, LCD suffers from contrast problems, although as a comparator this is somewhat mitigated by the general loss of contrast all displays types suffer in ambient light situations. The pixels of an LCD display operate like light 'gates' and these gates are not perfect when turning the light on and off, and LCD monitors currently on the market typically have a ratio of only 400–600:1. To counter this, LCDs are being produced with additional white sub-pixels which increase the luminance that can be delivered (see Colour Gamut section, below). By way of a comparison, the contrast ratio of a photograph is 100:1 and a photographic slide is 1000:1. Foveal field of view (Viewing angle) This is the angle at which the viewer must be positioned in relation to the screen, in order to clearly see the image on a display (where zero degrees is directly in front and 180 degrees is
5 Limited edition LCD display units for public, outdoor display can reach 6,000+ cd/m2
Page 12 of 53
JISC Technology & Standards Watch Advanced Display Technologies
directly to the left or right hand side). In the LCD display industry this angle is more precisely defined as the angle at which the brightness is halved for the viewer. In general, LCD screens suffer from a relatively small viewing angle compared to other technologies, as the light must pass through a series of materials before reaching the viewer (NEC, 2005). This means that if the viewer is situated to one side of a display he/she will experience a loss of brightness, contrast and colour (particularly with respect to the vertical aspect). Since first introducing the technology, LCD manufacturers have put considerable engineering effort into finding solutions to this problem, adding, for example, light dispersion films to the front of a display (Funada and Hijikigawa, 1997). Manufacturers now claim LCD viewing angles of 150 degrees in the horizontal (and even 170 degrees for more expensive proprietary technologies), but some industry commentators remain unconvinced, with, for example, What Plasma & LCD TV magazine (2005b) recently maintaining that on viewing angle, "Our experience suggests that these figures are very optimistic." In a recent Which? report (2005) several leading LCD computer displays were reported to have achieved a horizontal angle of only 140 degrees. In educational settings this restriction is most likely to matter when multi-person viewing is taking place in, say, a small tutorial group or a lecture theatre. Plasma and CRT displays do not suffer from this restriction, with the former allowing angles up to 160 degrees and the latter up to 180 degrees. However, to a certain extent these maximum figures are not particularly helpful in real life (nobody can actually see a screen set at 180 degrees to their eyes) and what is important for educational use is what level of distortion of text and graphics there is at a particular angle and how this would affect a viewing audience. Colour Gamut As we have seen in the previous section on the HVS, the ability to display a range of colours is known as the colour gamut. Figure 3 illustrated the different technologies and their range in relation to the colour space which the HVS can perceive. No display technology can, to date, render the entire range of colours that the HVS can perceive. The degree of saturation (or strength) of each of the primary colours is determined by the type of technology used in the display and to a certain extent the quality (and cost) of materials involved. The actual number of colours that can be displayed is driven by the number of different luminance levels (or 'grey-scale'6) a device can generate. A typical LCD computer monitor can generate an eight-bit luminance level, providing 256 different levels. Conventional LCDs have sub-pixels for the three primary colours – red, green and blue (RGB), but some manufacturers are now adding a fourth primary - a white sub-pixel. This increases brightness and facilitates an enhanced display of non-saturated colours since a white pixel is essentially a completely transparent filter which allows the backlight’s light to pass through unhindered (Mokhoff, 2003). It is worth noting that, for historical reasons, many display manufacturers give figures for their displays based on the percentage of colours used by the US National TV Standards Committee's (NTSC) colour space within the standard CIE. For example, a CRT display can deliver perhaps 65-75% of the NTSC standard (Goodart, 2003). However, it should be noted that colour gamut is quite a complex area, with a number of standards in existence (for example, ICM, ICC, sRGB). See Stone (2001) for more information. In general, Plasma offers the widest gamut and CRTs are able to provide a wider colour gamut than LCD. Plasma and CRT also offer a more consistent illumination level across the screen, which helps when colour calibration is undertaken.
6 The grey-scale is a logarithmic scale of the luminance a display can deliver for a given input signal e.g. for an 8-bit scale, 0 is black and 255 is white, giving 256 points in the scale (Foley, 1990). The eye is sensitive to ratios of intensity levels and so the scale is spaced logarithmically rather than linearly to achieve perceived equal steps in brightness. The scale is stepped based on a power-law function, with an exponent of gamma. Standard gamma for a CRT is 2.5
Page 13 of 53
JISC Technology & Standards Watch Advanced Display Technologies
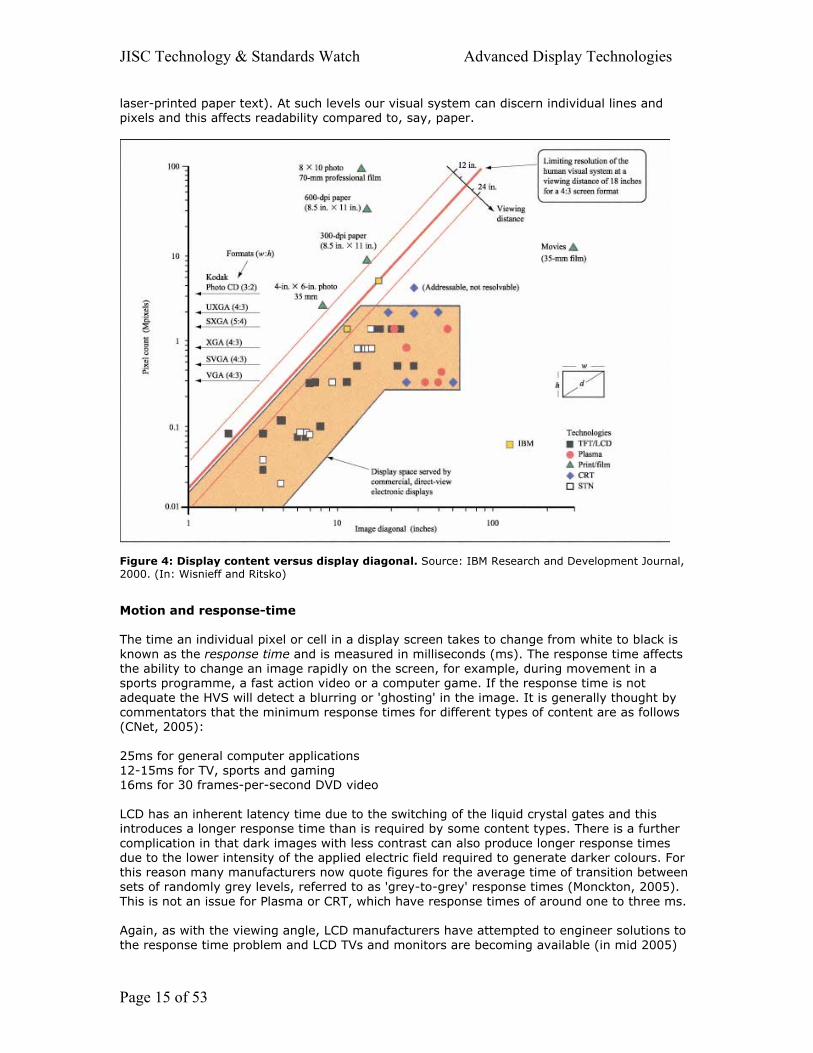
Visual acuity (resolution) A screen's resolution determines the amount of visual detail that can be displayed and can be expressed using a number of factors. Commonly, the resolution is expressed as the number of pixels in the horizontal and vertical planes (or in the case of a CRT the number of lines). The upper limit on the resolution of a given display is obviously determined by the size of the screen and the number of pixels that are displayed in a given area – the pixel density – which is measured in pixels per inch (ppi)). Clearly the pixel density is also related to "dot pitch" or "pixel pitch", which is the size, expressed in millimetres, of each individual screen pixel. Different technologies offer different physical pixel sizes and therefore offer a range of resolutions at a range of screen sizes. A 42-inch Plasma TV might offer the same maximum resolution (HDTV) as a 17-inch LCD TV, but will have a larger pixel pitch. As an indication, for computer displays, a typical 15-inch extended graphics array (XGA) display of 1024 ×768 pixels has a pixel density of 85 ppi, and a UXGA of 1600 x 1200 has a density of 133 ppi. The pixel density factor is particularly important in small displays for phones and handhelds as they have a limited diagonal screen size and are viewed at short distances. In these use cases pixel pitches of 300 ppi are becoming available. In general terms, the smaller this pitch, the sharper the image displayed (NEC, 2005). See (Dell, 2003) for a table of typical sizes of pixel pitch from a leading computer manufacturer. LCD and Plasma displays have a fixed, maximum number of pixels that they can display (since there is a fixed number of cells of plasma or liquid crystal light gates) and this is known as the native or natural level of resolution. Such displays are best operated at this natural resolution, otherwise an image must be scaled up using interpolation algorithms (NEC, 1999) and such scaling can degrade the quality of the image. As a general point, many LCDs in common office and educational usage have not been configured correctly and are being used at their non-native resolution. A CRT's resolution is a bit more complex, involving a number of factors such as the dot pitch of the phosphor, focus of the electron beam and the scanning frequency rate. A CRT has a preferred resolution, rather than a native one, and can scale up to a maximum resolution which is typically, for a computer monitor, 1280 by 1024 or higher. It can be argued that CRT displays therefore offer more flexibility over display resolution rates (Goodart, 2003). However, although there are no fixed physical pixels or sub-cells, it is unusual for a CRT to have a phosphor of dot pitch less than 0.25 mm which equates to around 100 ppi, and this relatively low and bounded level of resolution is one of the limitations of a CRT (a typical LCD laptop will have, say, 142 ppi). How do these resolution rates compare with the HVS, or for that matter with film and photography? In typical computer display work the viewer is normally around 12 to 24 inches or so in front of the screen. The following diagram (figure 4), courtesy of IBM, maps various display systems based on their pixel count and their image size (diagonal size of the screen) and compares these systems with the limits of the human visual system (Alt and Noda, 1998). The area that is shaded represents that served by conventional display technologies such as CRT, Plasma and LCD screens (these are shown as blue diamonds, red circles, and black squares respectively). The chart also shows alternative conventional systems such as photographs, professional 35mm film etc. for comparison (green triangles). The red lines show the limiting resolution of the HVS at viewing distances of 12, 18 and 24 inches based on ocular resolution. Anything above the red line provides more information than the HVS can absorb through visual acuity. The key point of this diagram is that conventional display systems lie below the red line and are therefore a) not providing as much detail as the HVS could cope with and are therefore conveying less information than they could, and b) create a display in which people can actually perceive the individual pixels. This diagram shows that with conventional technology the vast majority of display systems are operating below the capacity level of human visual system (as opposed to conventional film or
Page 14 of 53
JISC Technology & Standards Watch Advanced Display Technologies
laser-printed paper text). At such levels our visual system can discern individual lines and pixels and this affects readability compared to, say, paper.
Figure 4: Display content versus display diagonal. Source: IBM Research and Development Journal, 2000. (In: Wisnieff and Ritsko)
Motion and response-time The time an individual pixel or cell in a display screen takes to change from white to black is known as the response time and is measured in milliseconds (ms). The response time affects the ability to change an image rapidly on the screen, for example, during movement in a sports programme, a fast action video or a computer game. If the response time is not adequate the HVS will detect a blurring or 'ghosting' in the image. It is generally thought by commentators that the minimum response times for different types of content are as follows (CNet, 2005): 25ms for general computer applications 12-15ms for TV, sports and gaming 16ms for 30 frames-per-second DVD video LCD has an inherent latency time due to the switching of the liquid crystal gates and this introduces a longer response time than is required by some content types. There is a further complication in that dark images with less contrast can also produce longer response times due to the lower intensity of the applied electric field required to generate darker colours. For this reason many manufacturers now quote figures for the average time of transition between sets of randomly grey levels, referred to as 'grey-to-grey' response times (Monckton, 2005). This is not an issue for Plasma or CRT, which have response times of around one to three ms. Again, as with the viewing angle, LCD manufacturers have attempted to engineer solutions to the response time problem and LCD TVs and monitors are becoming available (in mid 2005)
Page 15 of 53
JISC Technology & Standards Watch Advanced Display Technologies
with typical response times of 16ms, with some offering times as low as 5ms (What Plasma, 2005c). A recent Which? (2005) computer report stated: "Today, LCD response times are so fast that you won't notice much difference [compared to CRT] unless you play high-resolution games or watch action packed DVDs onscreen." In their own tests (as opposed to manufacturer's figures) Which? found that the longest response time of a standard LCD monitor was 17ms, whilst some were as low as 7ms. LCDs have another issue with regard to the display of motion. Not only do the individual pixels have a response time, but they can also exhibit ‘sample and hold’ when displaying motion. This occurs because each horizontal line of pixels in the display is set, in turn, to the image and then held whilst the display sets the other lines. Only once all the lines of pixels have been set can the process start again, with the next frame of the image. This means the next frame’s worth of information cannot start to be displayed until all the pixels have been set. Unfortunately, if motion has been present in the image being displayed then the eye will be expecting a certain ‘flow’ of such movement and will already have started some pre-processing in anticipation. When the next frame is drawn the movement shown may not concur with the expectation of the eye and will present visual affects known as artefacts. Some, but not all, people can detect such artefacts on the screen. In order to avoid this problem entirely an LCD would need to run at around 400Hz – at least four times the typical current rates. Refresh rate, response time and CFF Flicker is only considered a serious problem with CRT displays and is a consequence of the need to repeatedly refresh the phosphor dots on the screen (as their light decays rapidly). This refresh rate is typically 75 Hz or 85 Hz, slightly less than that what is really needed to ensure that the vast majority of people do not see flicker (see section 4.6). It is less of an issue with LCD-based displays as they do not have such a cyclical refresh process, but flicker can be a problem if the rate at which the image itself is changing (the frame rate) happens to match the LCD backlight’s drive frequency. PDP displays are able to use a different scanning refresh process (as the phosphors do not fade as quickly), and therefore they have little issue with flicker.
Page 16 of 53
JISC Technology & Standards Watch Advanced Display Technologies
Page 17 of 53
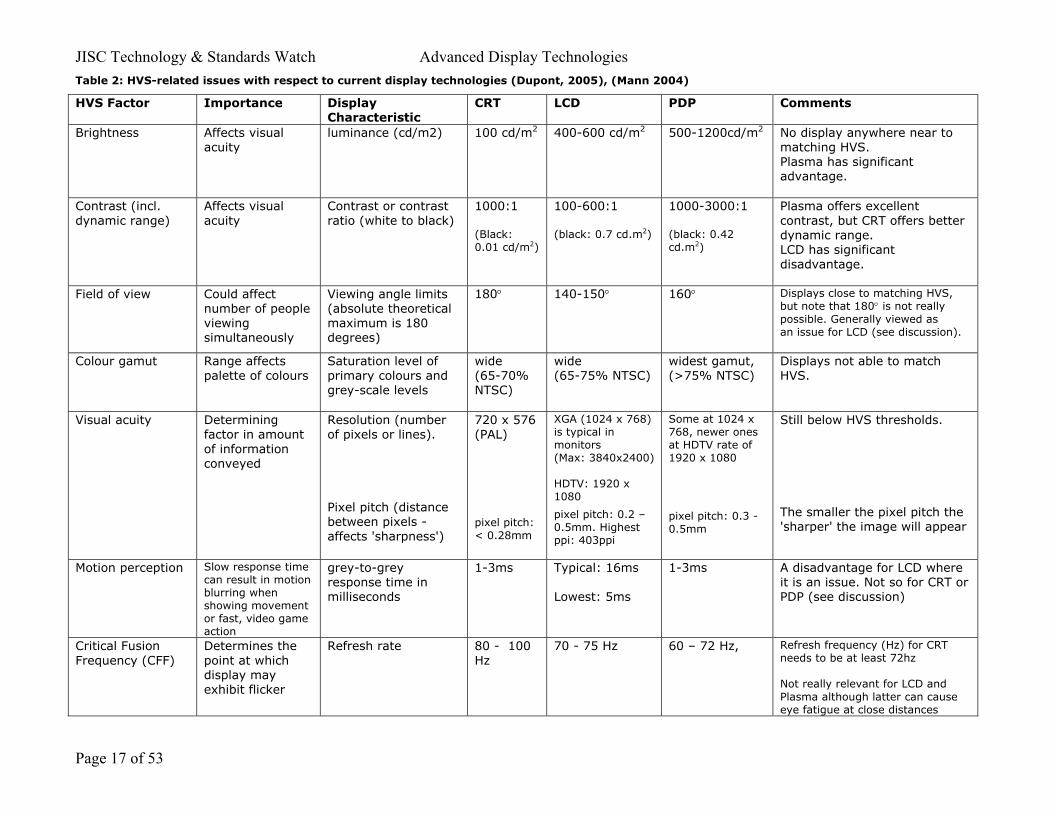
Table 2: HVS-related issues with respect to current display technologies (Dupont, 2005), (Mann 2004)
HVS Factor Importance Display Characteristic
CRT LCD PDP Comments
Brightness Affects visualacuity
luminance (cd/m2) 100 cd/m2 400-600 cd/m2 500-1200cd/m2 No display anywhere near to matching HVS. Plasma has significant advantage.
Contrast (incl. dynamic range)
Affects visual acuity
Contrast or contrast ratio (white to black)
1000:1 (Black: 0.01 cd/m2)
100-600:1 (black: 0.7 cd.m2)
1000-3000:1 (black: 0.42 cd.m2)
Plasma offers excellent contrast, but CRT offers better dynamic range. LCD has significant disadvantage.
Field of view Could affect number of people viewing simultaneously
Viewing angle limits (absolute theoretical maximum is 180 degrees)
180° 140-150° 160° Displays close to matching HVS, but note that 180° is not really possible. Generally viewed as an issue for LCD (see discussion).
Colour gamut Range affects palette of colours
Saturation level of primary colours and grey-scale levels
wide (65-70% NTSC)
wide (65-75% NTSC)
widest gamut, (>75% NTSC)
Displays not able to match HVS.
Visual acuity Determining factor in amount of information conveyed
Resolution (number of pixels or lines). Pixel pitch (distance between pixels - affects 'sharpness')
720 x 576 (PAL)
pixel pitch: < 0.28mm
XGA (1024 x 768) is typical in monitors (Max: 3840x2400) HDTV: 1920 x 1080
pixel pitch: 0.2 – 0.5mm. Highest ppi: 403ppi
Some at 1024 x 768, newer ones at HDTV rate of 1920 x 1080
pixel pitch: 0.3 - 0.5mm
Still below HVS thresholds.
The smaller the pixel pitch the 'sharper' the image will appear
Motion perception Slow response time can result in motion blurring when showing movement or fast, video game action
grey-to-grey response time in milliseconds
1-3ms Typical: 16ms Lowest: 5ms
1-3ms A disadvantage for LCD where it is an issue. Not so for CRT or PDP (see discussion)
Critical Fusion Frequency (CFF)
Determines the point at which display may exhibit flicker
Refresh rate 80 - 100 Hz
70 - 75 Hz 60 – 72 Hz, Refresh frequency (Hz) for CRT needs to be at least 72hz Not really relevant for LCD and Plasma although latter can cause eye fatigue at close distances
JISC Technology & Standards Watch Advanced Display Technologies
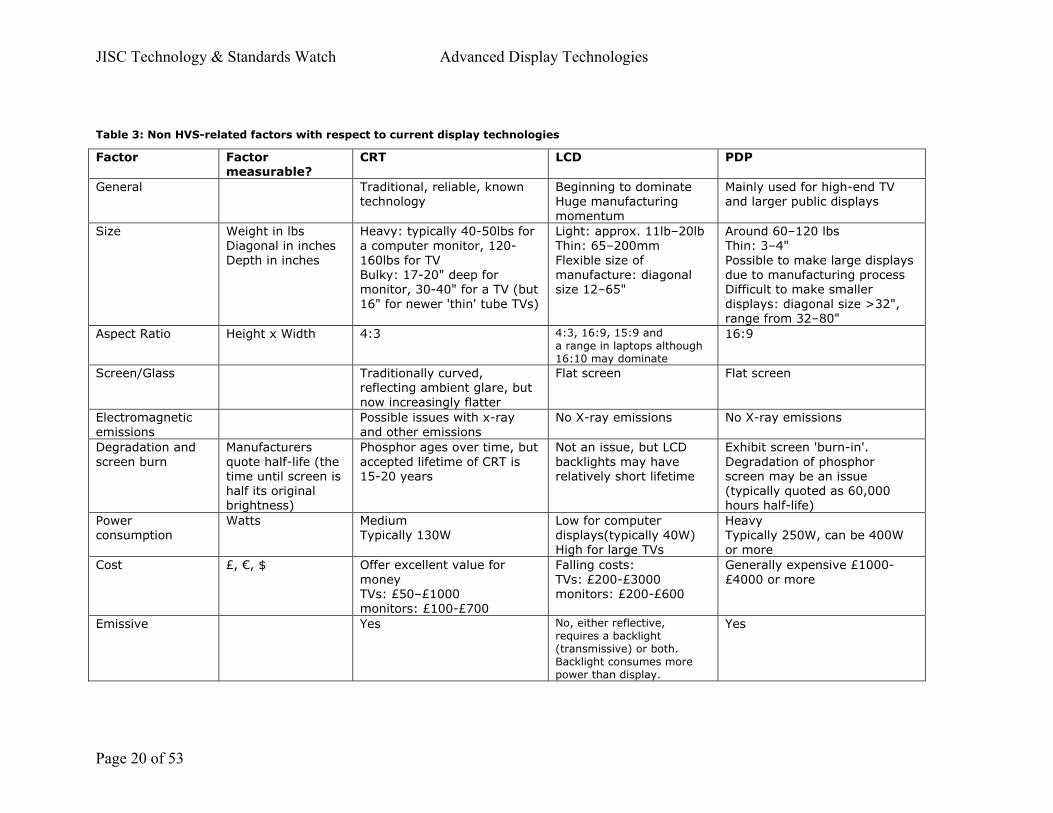
5.1.2 Discussion of non-HVS related display characteristics Table 3 outlines other characteristics of state of the art displays such as size and weight which are not related to the human visual system. Display Size The display size is the physical size of the screen or projected image, measured diagonally. Due to the size of an individual plasma cell in a Plasma Display Panel (PDP) – around 0.3 to 0.5mm - it has been difficult to manufacture smaller plasma displays and none have been commercially successful below 32 inches. Plasma displays are therefore mostly used in situations where the viewer is some distance from the screen, and they are not generally considered suitable for close-up computer work. For this reason, PDP manufacturers have focused on the large TV and public displays segment of the market with a plasma TV typically being at least 42 inches. Competition on size is intense, with, for example, Samsung announcing a world-beating 102-inch Plasma display at CeBIT in March 2005. Until recently it was difficult to make LCD panels at sizes greater than 17 inches, but new, so-called sixth and seventh generation manufacturing processes are rapidly leading to the production of 32-inch and larger LCD displays (Fihn, 2004). Sharp, for example, recently announced a 65-inch display (Associated Press, 2005) and Samsung announced an 81-inch LCD at SID, Boston, in June. The depth of the display has been the key issue with the changeover from CRT to flat screen technologies. A typical CRT has a depth of 17 inches or more, compared to a depth of two to four inches for LCD or PDP. Aspect Ratio Aspect ratio is the ratio of the width of screen to its height and is an important characteristic of a display. The choice of a display should be partly driven by the aspect ratio of the desired available content (TV, movies, video, multimedia etc.) likely to be viewed and this has had a long and chequered history (Display Search, 2003). The first CRTs had an aspect ratio of 5:4, but by the 1950s had started to be standardised on the National Television Standards Committee's (NTSC) 4:3 ratio. The Hollywood movie studios felt considerably threatened by TV in the 1950s and, as a defensive measure, adopted a range of wide-screen aspect ratios such as Cinemascope (2.55:1) and Panavision (2.39:1) which offered a higher entertainment value in which the viewer felt more immersed. More recently, High Definition Television (HDTV) has been defined as 16:9, a compromise ratio that was chosen because it could contain within it all the different movie studio formats, but despite this standardisation many TV manufacturers are producing displays that have a ratio of 15:9 (WXGA format of 1280 x 768 pixels) as this has less of a visual impact on current TV output of 4:3. Since early computer displays were CRTs and, in fact, were generally made on behalf of the computer companies by TV manufacturers, the dominant aspect ratio in CRT or LCD computer displays is 4:3. Computer manufacturers have also introduced models with wider screen ratios, the dominant form being 16:10, and these are expected to capture significant market share, especially amongst people who want to edit and play DVDs (Display Search, 2003). Electromagnetic emissions LCD and PDP emit fewer electromagnetic emissions at the range considered harmful, namely X-rays. Although to date, little, if any, measurable risk to human health has been identified from sitting in front of a CRT, this may be a factor in a purchasing decision (PC World, 2003).
Page 18 of 53
JISC Technology & Standards Watch Advanced Display Technologies
Degradation and screen burn-in The scintillators or phosphors present in PDP and CRT technologies age over time and this degrades the quality of the display. Also, when the same image is displayed on the same part of the screen for a long time, perhaps the logo of a cable channel, the ageing takes place at a faster rate and the screen exhibits 'burn-in'. This has been seen as a particular issue with Plasma displays rather than CRT (Fihn, 2004) although Plasma is being improved with the introduction of improved phosphor mixes. CRT displays have an expected operational lifetime of 15 to 20 years. Power and environmental considerations Power consumption is not only an issue of expense, but also, in a more energy conscious world, an issue for environmental sustainability. In addition, displays meant for portable, battery-operated devices such as laptops need to minimise power consumption. Generally, PDPs are power 'guzzlers' with a typical 42-inch (107 cm) Plasma display consuming perhaps 250W (joules/second), while a CRT display with the same diagonal measurement will consume only 150W. LCD computer displays have even lower power consumption rates, perhaps 40W for a 19-inch, compared to 130W for a similar sized CRT. However, larger sized LCD TVs currently have power consumption comparable to that of Plasma. As it currently stands displays built using LCDs are also expected to have a similar or longer lifespan than the average CRT (see above) and are easier to dispose of in an environmentally sustainable manner. However, there may be a lifetime issue with the backlights used in LCD displays which may need replacing after a few years. In general, it can be argued that the total cost of ownership of an LCD display is now significantly lower than the other display technologies (Fihn, 2002). This is an important counterweight to some of the concerns about LCD performance, such as viewing angle, as outlined in this section. 5.2 Projection – an alternative for multi-viewer scenarios The alternative to CRT and FPD displays, particularly in scenarios involving an audience, is to use some form of projection. There are two basic forms: rear and front systems. Both forms use projection systems based on either CRT or one of a range of the newer microdisplay technologies in which a specialist silicon chip is illuminated by a lamp to produce the image (Katzmaier, 2005). There are three main microdisplay systems: LCD, DLP (proprietary system belonging to Texas Instruments) and liquid crystal on silicon (LCoS). A detailed discussion of projection is beyond the scope of this report, but, appendix B gives some further technical details of the different technologies. The important point to bear in mind is that these projection systems are increasingly based on microdisplays and that this alternative technical solution will, as we shall see in section 6.6, have a role to play in future display systems. 5.3 CRT – getting thinner and still in the market Despite the rapid rise of display solutions based on various flat screen technologies, CRT displays are still in the market and new products are being launched. Arguably, CRT technology continues to offer a superior quality of picture and higher contrast ratios than FPDs and at highly competitive costs (although see the discussion of total cost of ownership when power consumption is considered) and it is likely that CRT will continue to dominate the very low end of the TV market for some time. They are also challenging the 'thinness' issue. Samsung recently announced plans to produce a CRT 32-inch TV display with a depth that is half that of existing solutions (Mann, 2004) based on its "vixlim" tube technology (www.vixlim.com) and the trademark registration indicates potential plans for computer monitors (Patent Office, 2004).
Page 19 of 53
JISC Technology & Standards Watch Advanced Display Technologies
Table 3: Non HVS-related factors with respect to current display technologies
Factor Factormeasurable?
CRT LCD PDP
General Traditional, reliable, known technology
Beginning to dominate Huge manufacturing momentum
Mainly used for high-end TV and larger public displays
Size Weight in lbsDiagonal in inches Depth in inches
Heavy: typically 40-50lbs for a computer monitor, 120-160lbs for TV Bulky: 17-20" deep for monitor, 30-40" for a TV (but 16" for newer 'thin' tube TVs)
Light: approx. 11lb–20lb Thin: 65–200mm Flexible size of manufacture: diagonal size 12–65"
Around 60–120 lbs Thin: 3–4" Possible to make large displays due to manufacturing process Difficult to make smaller displays: diagonal size >32", range from 32–80"
Aspect Ratio Height x Width 4:3 4:3, 16:9, 15:9 and a range in laptops although 16:10 may dominate
16:9
Screen/Glass Traditionally curved,reflecting ambient glare, but now increasingly flatter
Flat screen Flat screen
Electromagnetic emissions
Possible issues with x-ray and other emissions
No X-ray emissions No X-ray emissions
Degradation and screen burn
Manufacturers quote half-life (the time until screen is half its original brightness)
Phosphor ages over time, but accepted lifetime of CRT is 15-20 years
Not an issue, but LCD backlights may have relatively short lifetime
Exhibit screen 'burn-in'. Degradation of phosphor screen may be an issue (typically quoted as 60,000 hours half-life)
Power consumption
Watts MediumTypically 130W
Low for computer displays(typically 40W) High for large TVs
Heavy Typically 250W, can be 400W or more
Cost £, €, $ Offer excellent value for money TVs: £50–£1000 monitors: £100-£700
Falling costs: TVs: £200-£3000 monitors: £200-£600
Generally expensive £1000-£4000 or more
Emissive Yes No, either reflective, requires a backlight (transmissive) or both. Backlight consumes more power than display.
Yes
Page 20 of 53
JISC Technology & Standards Watch Advanced Display Technologies
6. The future of display technologies – the next 10 years In the previous sections we have seen how the human visual system (HVS) interacts with display technologies, looked at some of the current trends in the state of the art, and reviewed efforts by display manufacturers to match the capacity of the HVS. The older, bulky CRT technologies are being replaced by flat screen solutions and although some engineering effort has gone into developing displays that provide more of a match to the HVS, the key driver has been the development of thinner display devices. In the following section we review trends in the future development of display technologies. As we shall see, the drive to develop thinner displays that offer more of a match to the HVS will continue, with new developments in materials and display technologies. Often the uptake of these will be driven by the availability of new types of content, but, a little further down the track, we will also see some completely different approaches to the nature of display. Key trend: Content as a driver for display choices A key trend in the development of displays is that, in general, we are moving to a more multimedia-driven culture and that content itself is evolving. We are witnessing a convergence of TV, computers and developments in bandwidth, and these are paving the way for the introduction of High Definition content (HD video and HDTV) accessed via the Web, satellite, cable and DVD discs (see section 5.3). For more information on the use of digital video in teaching and learning, see BECTA's (2003) report What the research says about digital video in teaching and learning. These developments will tend to drive people's awareness of the display technology they are using. In particular, the move to HDTV is driving development of large, flat screen display technologies in those markets (USA, Japan) where this format is becoming widespread. This means that the 1920 x 1080 resolution will become the base standard for display devices. The same will apply to the forthcoming introduction of 3-D: educational content that becomes available, through, for example, games and 3-D virtual models of museum exhibitions and buildings, will build awareness of what these new technologies are capable of and drive expectations about what can be delivered. In this context it is worth noting that often the software and the content last a lot longer than the display hardware (Brodlie, 2004). 6.1 Specific Trends: FPDs - Flattening of the screen Trend summary: LCD versus the rest - thinner, lower power consumption, better images As we have seen in previous sections, recent years have witnessed a move from bulky CRT displays towards thinner, lighter Flat Panel Displays (FPDs). In 2004, for the first time, sales of LCD-based computer screens were higher than those for the more traditional CRT-based displays. At the same time, in the consumer market, home owners are increasingly opting for the enhanced design looks and space-saving potential offered by flatter Plasma and LCD TVs and displays. The overall goal is to develop cost effective flat panel displays that offer a picture quality comparable to today's CRT, and, in the longer run, increasingly match the human visual system parameters discussed in section four. At the moment the momentum is behind LCD which has a large market share, the ability to deliver display solutions for both small and large devices and which is being manufactured on a large scale. Although LCD has some issues, such as motion blur, engineering effort has gone into tackling these problems through, for example, improvements in backlighting (Cranton, 2005) and the introduction of additional sub-pixels to improve luminosity. As the dominant technology, LCD will undergo further improvements, e.g. the introduction of new sub-pixel layouts to enhance colour gamut (Brown Elliot, 2005) and the addition of extra primary sub-pixel colours. However, in the next few years a number of alternative FPD technologies will attempt to improve on LCD’s match of the HVS, by improving picture quality and lowering prices in an effort to gain some of LCD's market share. Technologies of particular interest are Field Emission Displays (FED), Organic LEDs (OLED), Polymer LEDs (PLED) and Surface-conduction Electron-emitter Displays (SED). The following sections provide further details of these technologies
Page 21 of 53
JISC Technology & Standards Watch Advanced Display Technologies
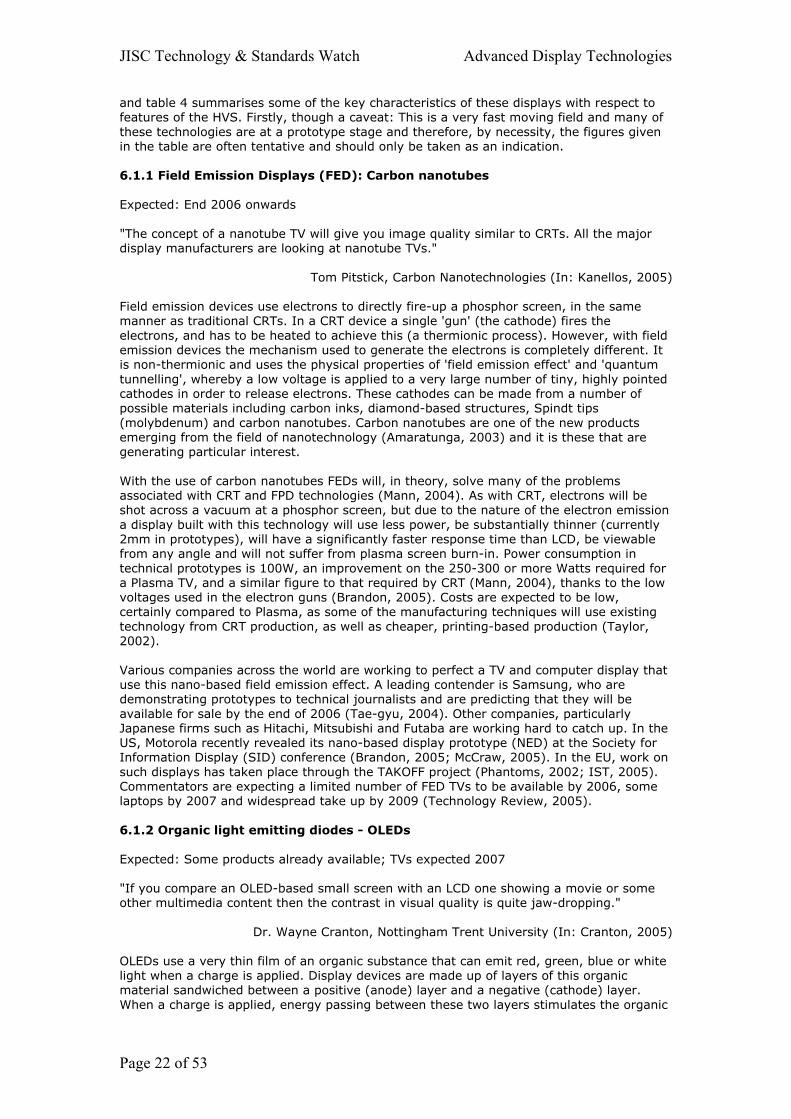
and table 4 summarises some of the key characteristics of these displays with respect to features of the HVS. Firstly, though a caveat: This is a very fast moving field and many of these technologies are at a prototype stage and therefore, by necessity, the figures given in the table are often tentative and should only be taken as an indication. 6.1.1 Field Emission Displays (FED): Carbon nanotubes Expected: End 2006 onwards "The concept of a nanotube TV will give you image quality similar to CRTs. All the major display manufacturers are looking at nanotube TVs."
Tom Pitstick, Carbon Nanotechnologies (In: Kanellos, 2005) Field emission devices use electrons to directly fire-up a phosphor screen, in the same manner as traditional CRTs. In a CRT device a single 'gun' (the cathode) fires the electrons, and has to be heated to achieve this (a thermionic process). However, with field emission devices the mechanism used to generate the electrons is completely different. It is non-thermionic and uses the physical properties of 'field emission effect' and 'quantum tunnelling', whereby a low voltage is applied to a very large number of tiny, highly pointed cathodes in order to release electrons. These cathodes can be made from a number of possible materials including carbon inks, diamond-based structures, Spindt tips (molybdenum) and carbon nanotubes. Carbon nanotubes are one of the new products emerging from the field of nanotechnology (Amaratunga, 2003) and it is these that are generating particular interest. With the use of carbon nanotubes FEDs will, in theory, solve many of the problems associated with CRT and FPD technologies (Mann, 2004). As with CRT, electrons will be shot across a vacuum at a phosphor screen, but due to the nature of the electron emission a display built with this technology will use less power, be substantially thinner (currently 2mm in prototypes), will have a significantly faster response time than LCD, be viewable from any angle and will not suffer from plasma screen burn-in. Power consumption in technical prototypes is 100W, an improvement on the 250-300 or more Watts required for a Plasma TV, and a similar figure to that required by CRT (Mann, 2004), thanks to the low voltages used in the electron guns (Brandon, 2005). Costs are expected to be low, certainly compared to Plasma, as some of the manufacturing techniques will use existing technology from CRT production, as well as cheaper, printing-based production (Taylor, 2002). Various companies across the world are working to perfect a TV and computer display that use this nano-based field emission effect. A leading contender is Samsung, who are demonstrating prototypes to technical journalists and are predicting that they will be available for sale by the end of 2006 (Tae-gyu, 2004). Other companies, particularly Japanese firms such as Hitachi, Mitsubishi and Futaba are working hard to catch up. In the US, Motorola recently revealed its nano-based display prototype (NED) at the Society for Information Display (SID) conference (Brandon, 2005; McCraw, 2005). In the EU, work on such displays has taken place through the TAKOFF project (Phantoms, 2002; IST, 2005). Commentators are expecting a limited number of FED TVs to be available by 2006, some laptops by 2007 and widespread take up by 2009 (Technology Review, 2005). 6.1.2 Organic light emitting diodes - OLEDs Expected: Some products already available; TVs expected 2007 "If you compare an OLED-based small screen with an LCD one showing a movie or some other multimedia content then the contrast in visual quality is quite jaw-dropping."
Dr. Wayne Cranton, Nottingham Trent University (In: Cranton, 2005) OLEDs use a very thin film of an organic substance that can emit red, green, blue or white light when a charge is applied. Display devices are made up of layers of this organic material sandwiched between a positive (anode) layer and a negative (cathode) layer. When a charge is applied, energy passing between these two layers stimulates the organic
Page 22 of 53
JISC Technology & Standards Watch Advanced Display Technologies
layer into emitting light (Kodak, 2005) in a process called electrophosphorescence. OLED technology has the potential for large-scale production using printing processes and it is believed it will overcome many of the limitations of LCD (Prophet, 2003; Cranton, 2005). Commentators and OLED device manufacturers claim that they produce images that can be seen from any angle, and that, compared to LCDs, are brighter, offer higher levels of contrast, and have extremely fast response times (measured in nano seconds) (Howard, 2004; Lieberman, 2003). Also, because they are able to operate in changing ambient light conditions they do not require a backlight and therefore also require less energy (Philips, 2004). In addition, the active OLED layers are very thin, in the order of 500 nanometres (Wave Report, 2005) and can be added onto a glass substrate or flexible, plastic substrates to form new types of thin display. These characteristics, particularly the low power consumption, make OLEDs particularly suitable for smaller display screens and they are already being used in products such as MP3 players and PDAs (Yeates, 2005). OLEDs are expected to capture 30% of the mobile phone display market by 2010 (Young, 2004). The largest OLED display currently on the market is Sony's 3.8", 480 x 320 display, as used in the PEG-VZ90 PDA (OLED Info, 2005). However, bigger screens are expected, with some commentators prepared to predict an OLED-based TV by 2007 (Bush, 2004). As an example, Samsung recently announced that they have developed a prototype 40-inch, active matrix OLED for emissive flat panel TV that claims to offer a contrast ratio of 5,000:1 and which is 30mm thick (Wilson, 2005). However, there are some problems to be solved in the development of these devices and a current research issue is the lifetime and durability of the display. The organic materials used for the blue coloured sub-pixel deteriorate faster than those used for the other colours, and the organic material involved also breaks down under exposure to air and water. This is not such a problem with a glass substrate (e.g. in a TV screen) but is a major factor with the very thin, flexible, plastic-based OLED display systems that have been promised (Forrest, 2000). The lifetime of the display is also affected by the brightness levels that are generated and there is a trade-off between longevity and brightness. 6.1.3 Polymer light emitting diodes - PLEDs Expected: Some products already available; TVs expected 2010 Polymer light emitting diodes were first discovered by Jeremy Burroughes at Cambridge University in 1989 (Friend, 1999; Friend, 2001), building on the Nobel Prize winning work of Heeger, MacDiarmid and Shirakawa into conducting polymers. Burroughes later founded Cambridge Display Technologies, now a leading company in the field of PLEDs (http://www.cdtltd.co.uk). In place of the organic layer sandwiched between the cathode and anode layers in an OLED, PLEDs use polymers such as polyphenylene vinylene (PPV) which exhibit the same electroluminescent effect. PLEDs share many of the properties of OLEDs that are claimed as an advantage over existing LCD technologies: lower power consumption, flexibility, thinness and fast response switch time. PLED displays can be manufactured by a high-resolution inkjet printing process that will allow very large screen displays to be produced (Philips, 2001) and a further interesting possibility is that such displays could be made virtually transparent, leading to displays that also function as windows. As is the case for OLEDs, there are some technical issues with respect to the lifetime of blue-coloured polymers and this is an on-going research area. The key issue with both OLED and PLED technology is their potential for thinness and flexibility:
'Although polymer OLED technology is a potential rival to LCD, its major impact is not likely to be in replacing existing displays but in whole new areas of application. Here, flexibility and thinness will be the keys and we're likely to see flexible and conformal polymer OLED displays moulded to the contours of our mobile phone or car dashboard, or as roll-up television screens.'
Dr Mark Overwijk, Programme Manager, Polymer OLED displays (In: Philips, 2004).
Page 23 of 53
JISC Technology & Standards Watch Advanced Display Technologies
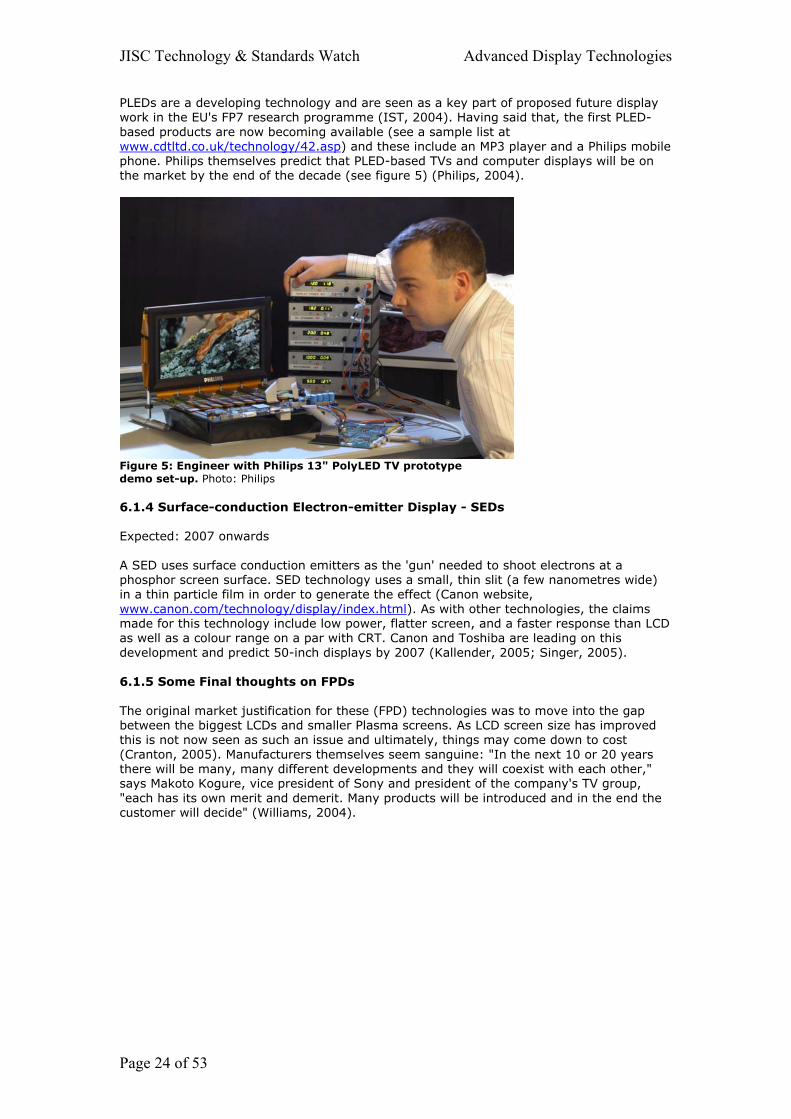
PLEDs are a developing technology and are seen as a key part of proposed future display work in the EU's FP7 research programme (IST, 2004). Having said that, the first PLED-based products are now becoming available (see a sample list at www.cdtltd.co.uk/technology/42.asp) and these include an MP3 player and a Philips mobile phone. Philips themselves predict that PLED-based TVs and computer displays will be on the market by the end of the decade (see figure 5) (Philips, 2004).
Figure 5: Engineer with Philips 13" PolyLED TV prototype demo set-up. Photo: Philips 6.1.4 Surface-conduction Electron-emitter Display - SEDs Expected: 2007 onwards A SED uses surface conduction emitters as the 'gun' needed to shoot electrons at a phosphor screen surface. SED technology uses a small, thin slit (a few nanometres wide) in a thin particle film in order to generate the effect (Canon website, www.canon.com/technology/display/index.html). As with other technologies, the claims made for this technology include low power, flatter screen, and a faster response than LCD as well as a colour range on a par with CRT. Canon and Toshiba are leading on this development and predict 50-inch displays by 2007 (Kallender, 2005; Singer, 2005). 6.1.5 Some Final thoughts on FPDs The original market justification for these (FPD) technologies was to move into the gap between the biggest LCDs and smaller Plasma screens. As LCD screen size has improved this is not now seen as such an issue and ultimately, things may come down to cost (Cranton, 2005). Manufacturers themselves seem sanguine: "In the next 10 or 20 years there will be many, many different developments and they will coexist with each other," says Makoto Kogure, vice president of Sony and president of the company's TV group, "each has its own merit and demerit. Many products will be introduced and in the end the customer will decide" (Williams, 2004).
Page 24 of 53
JISC Technology & Standards Watch Advanced Display Technologies
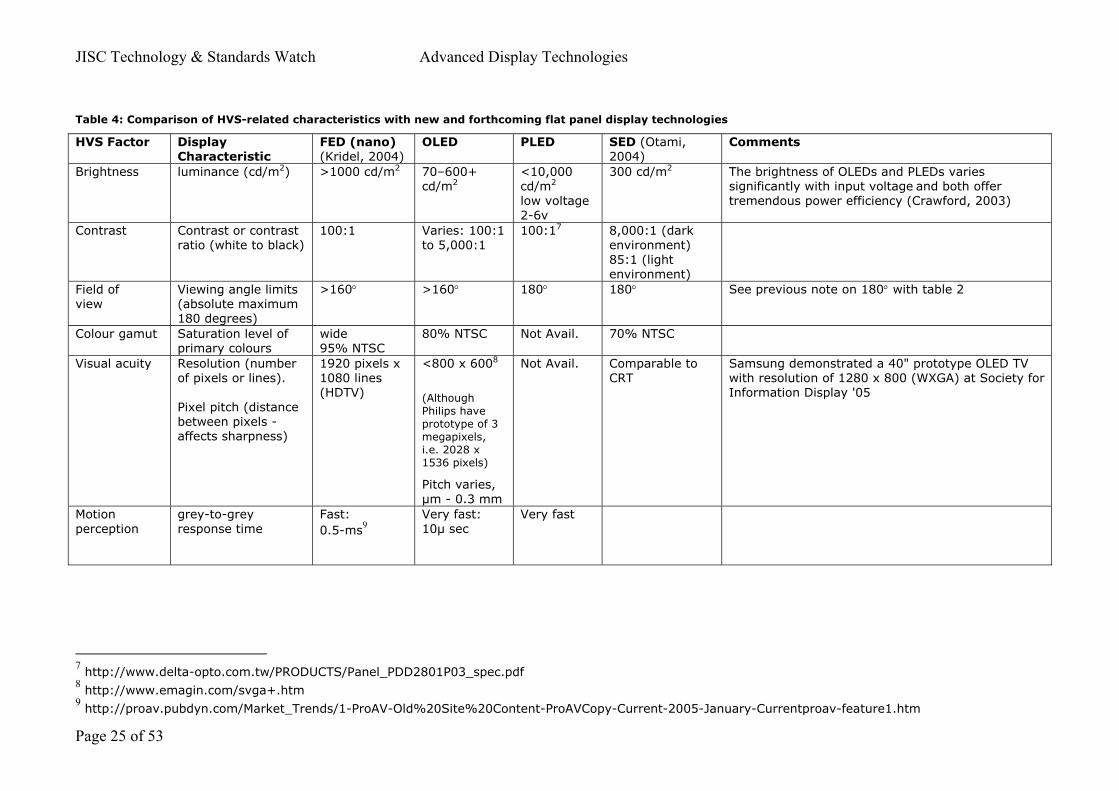
Table 4: Comparison of HVS-related characteristics with new and forthcoming flat panel display technologies
HVS Factor Display Characteristic
FED (nano) (Kridel, 2004)
OLED PLED SED (Otami, 2004)
Comments
Brightness luminance (cd/m2) >1000 cd/m2 70–600+cd/m2
<10,000 cd/m2 low voltage 2-6v
300 cd/m2 The brightness of OLEDs and PLEDs varies significantly with input voltage and both offer tremendous power efficiency (Crawford, 2003)
Contrast Contrast or contrast ratio (white to black)
100:1 Varies: 100:1to 5,000:1
100:17 8,000:1 (darkenvironment) 85:1 (light environment)
Field of view
Viewing angle limits (absolute maximum 180 degrees)
>160° >160° 180° 180° See previous note on 180° with table 2
Colour gamut Saturation level of primary colours
wide 95% NTSC
80% NTSC Not Avail. 70% NTSC
Visual acuity Resolution (number of pixels or lines). Pixel pitch (distance between pixels - affects sharpness)
1920 pixels x 1080 lines (HDTV)
<800 x 6008
(Although Philips have prototype of 3 megapixels, i.e. 2028 x 1536 pixels)
Pitch varies, µm - 0.3 mm
Not Avail. Comparable to CRT
Samsung demonstrated a 40" prototype OLED TV with resolution of 1280 x 800 (WXGA) at Society for Information Display '05
Motion perception
grey-to-grey response time
Fast: 0.5-ms9
Very fast: 10µ sec
Very fast
7 http://www.delta-opto.com.tw/PRODUCTS/Panel_PDD2801P03_spec.pdf 8 http://www.emagin.com/svga+.htm 9 http://proav.pubdyn.com/Market_Trends/1-ProAV-Old%20Site%20Content-ProAVCopy-Current-2005-January-Currentproav-feature1.htm
Page 25 of 53
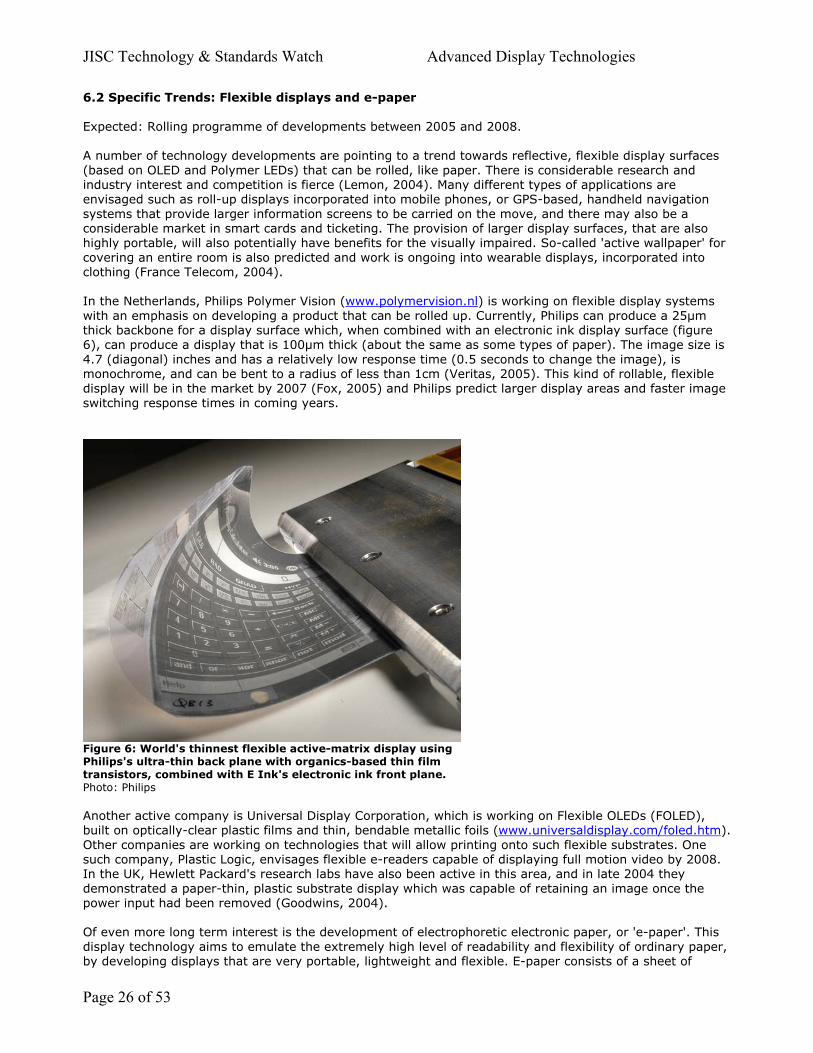
JISC Technology & Standards Watch Advanced Display Technologies 6.2 Specific Trends: Flexible displays and e-paper Expected: Rolling programme of developments between 2005 and 2008. A number of technology developments are pointing to a trend towards reflective, flexible display surfaces (based on OLED and Polymer LEDs) that can be rolled, like paper. There is considerable research and industry interest and competition is fierce (Lemon, 2004). Many different types of applications are envisaged such as roll-up displays incorporated into mobile phones, or GPS-based, handheld navigation systems that provide larger information screens to be carried on the move, and there may also be a considerable market in smart cards and ticketing. The provision of larger display surfaces, that are also highly portable, will also potentially have benefits for the visually impaired. So-called 'active wallpaper' for covering an entire room is also predicted and work is ongoing into wearable displays, incorporated into clothing (France Telecom, 2004). In the Netherlands, Philips Polymer Vision (www.polymervision.nl) is working on flexible display systems with an emphasis on developing a product that can be rolled up. Currently, Philips can produce a 25µm thick backbone for a display surface which, when combined with an electronic ink display surface (figure 6), can produce a display that is 100µm thick (about the same as some types of paper). The image size is 4.7 (diagonal) inches and has a relatively low response time (0.5 seconds to change the image), is monochrome, and can be bent to a radius of less than 1cm (Veritas, 2005). This kind of rollable, flexible display will be in the market by 2007 (Fox, 2005) and Philips predict larger display areas and faster image switching response times in coming years.
Figure 6: World's thinnest flexible active-matrix display using Philips's ultra-thin back plane with organics-based thin film transistors, combined with E Ink's electronic ink front plane. Photo: Philips Another active company is Universal Display Corporation, which is working on Flexible OLEDs (FOLED), built on optically-clear plastic films and thin, bendable metallic foils (www.universaldisplay.com/foled.htm). Other companies are working on technologies that will allow printing onto such flexible substrates. One such company, Plastic Logic, envisages flexible e-readers capable of displaying full motion video by 2008. In the UK, Hewlett Packard's research labs have also been active in this area, and in late 2004 they demonstrated a paper-thin, plastic substrate display which was capable of retaining an image once the power input had been removed (Goodwins, 2004). Of even more long term interest is the development of electrophoretic electronic paper, or 'e-paper'. This display technology aims to emulate the extremely high level of readability and flexibility of ordinary paper, by developing displays that are very portable, lightweight and flexible. E-paper consists of a sheet of
Page 26 of 53
JISC Technology & Standards Watch Advanced Display Technologies plastic made up of thousands of tiny bubbles, each of which contains 'ink' which is activated on application of an electric charge. Each bubble acts as a single pixel in the 'paper' display, being either black or white depending on the charge that is applied. Ideally, these systems should be bistable (the visible effect of which is that once the ink particles are in the required position they will stay there even after the charge is removed), providing very low power consumption and allowing the image to be ‘fixed’ like a paper image. Further details on e-ink can be found in a previous JISC TechWatch report on e-paper (Wilson, 2003). As an example, E-ink (a leading developer of this kind of system) has created displays in which each bubble contains negatively charged black particles and positively charged white particles suspended in a transparent liquid. If a negative charge is applied to the bottom of the bubble the black particles drop to the bottom and the white ones rise to the top – creating a white pixel. An alternative is the smart-paper being developed by Gyricon which uses tiny rotating beads that are coloured white on one side and black on the other. As the image is generated the beads rotate to display one of the two colours. So far, these systems have been fixed onto solid substrates and incorporated into signage and into Sony's e-book reader (BECTA, 2005). However, as we have seen above, it is expected that these types of electronic ink systems will be incorporated onto flexible substrates shortly, creating paper-like displays that can be rolled up (Economist, 2005). E-Ink claim laboratory versions of their ink system that are capable of handling 20 frames/second video, with colour expected in late 2005. 6.3 Specific trends: High Definition TV (HDTV) and Video displays Expected: 2006 onwards 'From the viewer’s perspective, high definition is coming. DVD will be high definition, consumer camcorders will be high definition – and HD DVD programming will appear in Blockbuster before long. When consumers look at their screens and compare this new HD material with the standard definition broadcast material they get now, they’ll think they’re getting a poor deal – so if we as broadcasters don’t adopt high definition TV, we’re going to look like AM radio in a digital world.'
John Varney, BBC Chief Technology Officer (In: Radlo, 2004). Standard UK television is broadcast (by both analogue and digital means) in what is known as standard definition (SD), with a resolution based on an interlaced image of 720 pixels on 576 vertical lines (PAL standard). Higher definition television (HDTV) provides much greater resolution (at least four times), increasing the amount of information in the picture, and is provided in wide-screen format (16:9) with 5:1 surround sound. HDTV is relatively widespread in the USA, Japan, and South Korea markets, whereas Europe is only just beginning the process of introduction (Radlo, 2004). Some HD broadcasts are already being made by satellite by the Belgian channel HD1. In the UK, Sky plans to launch HDTV next Spring (Informitv, 2005) and the 2006 World Cup is likely to be the focus for its initial launch. In the UK, the BBC is committed to moving all its studio production over to HD formats by 2010 but is more hesitant about when the corporation will actually be broadcasting in these formats. This is partly because the issue has become intertwined with the changeover from analogue SD broadcast to digital-only SD broadcast (planned for 2012) and the subsequent allocation of broadcast bandwidth (Johnson, 2005). HDTV requires more bandwidth than SD, causing difficulties for the terrestrial broadcasters. However, cable operators, and those planning to offer Internet-based TV delivery (IPTV), do not have the same bandwidth issues and will be able to offer HDTV sooner. With regard to HD standards, HD-mini or '720p' provides 1280 pixels on 720 lines (progressively scanned) and is being adopted widely in the EU. The 1080i standard is interlaced and provides 1920 pixels on 1080 lines, and is dominant in the US and is the standard used in professional DV production equipment. 1080p is a progressive version of the US standard and is starting to be adopted (Milbourn, 2005). For further information on HDTV, see the industry association, Digital TV Group's website: www.dtg.org.uk/ and DCMS's Digital TV portal at: www.digitaltelevision.gov.uk/ For a general discussion on digital TV and video see also The Register's "High Definition and the future of viewing" www.theregister.co.uk/2005/03/08/hd_and_hdtv_analysis/ HD content will also be made available via new formats in DVD-style discs. As things currently stand these discs will be distributed in two formats – HD-DVD and Blu-Ray. Players for the former will be available in the UK in late 2005, the latter in 2006. HD-DVD builds on the existing DVD standard and can store
Page 27 of 53
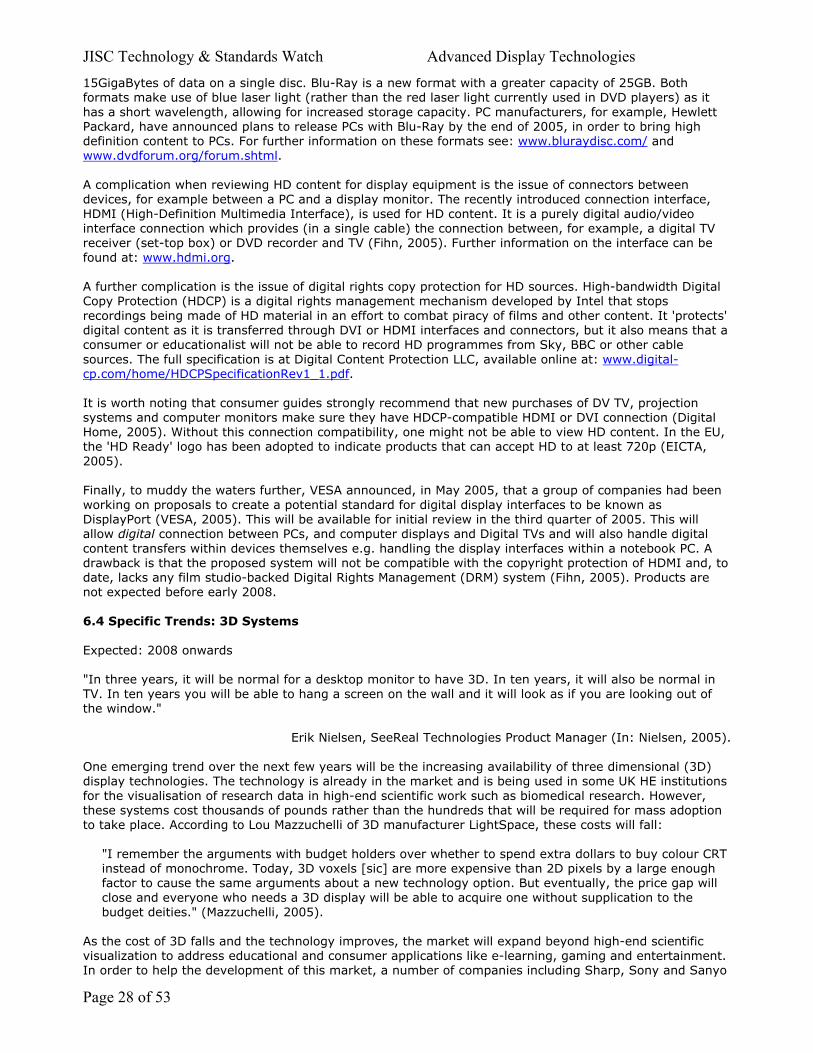
JISC Technology & Standards Watch Advanced Display Technologies 15GigaBytes of data on a single disc. Blu-Ray is a new format with a greater capacity of 25GB. Both formats make use of blue laser light (rather than the red laser light currently used in DVD players) as it has a short wavelength, allowing for increased storage capacity. PC manufacturers, for example, Hewlett Packard, have announced plans to release PCs with Blu-Ray by the end of 2005, in order to bring high definition content to PCs. For further information on these formats see: www.bluraydisc.com/ and www.dvdforum.org/forum.shtml. A complication when reviewing HD content for display equipment is the issue of connectors between devices, for example between a PC and a display monitor. The recently introduced connection interface, HDMI (High-Definition Multimedia Interface), is used for HD content. It is a purely digital audio/video interface connection which provides (in a single cable) the connection between, for example, a digital TV receiver (set-top box) or DVD recorder and TV (Fihn, 2005). Further information on the interface can be found at: www.hdmi.org. A further complication is the issue of digital rights copy protection for HD sources. High-bandwidth Digital Copy Protection (HDCP) is a digital rights management mechanism developed by Intel that stops recordings being made of HD material in an effort to combat piracy of films and other content. It 'protects' digital content as it is transferred through DVI or HDMI interfaces and connectors, but it also means that a consumer or educationalist will not be able to record HD programmes from Sky, BBC or other cable sources. The full specification is at Digital Content Protection LLC, available online at: www.digital-cp.com/home/HDCPSpecificationRev1_1.pdf. It is worth noting that consumer guides strongly recommend that new purchases of DV TV, projection systems and computer monitors make sure they have HDCP-compatible HDMI or DVI connection (Digital Home, 2005). Without this connection compatibility, one might not be able to view HD content. In the EU, the 'HD Ready' logo has been adopted to indicate products that can accept HD to at least 720p (EICTA, 2005). Finally, to muddy the waters further, VESA announced, in May 2005, that a group of companies had been working on proposals to create a potential standard for digital display interfaces to be known as DisplayPort (VESA, 2005). This will be available for initial review in the third quarter of 2005. This will allow digital connection between PCs, and computer displays and Digital TVs and will also handle digital content transfers within devices themselves e.g. handling the display interfaces within a notebook PC. A drawback is that the proposed system will not be compatible with the copyright protection of HDMI and, to date, lacks any film studio-backed Digital Rights Management (DRM) system (Fihn, 2005). Products are not expected before early 2008. 6.4 Specific Trends: 3D Systems Expected: 2008 onwards "In three years, it will be normal for a desktop monitor to have 3D. In ten years, it will also be normal in TV. In ten years you will be able to hang a screen on the wall and it will look as if you are looking out of the window."
Erik Nielsen, SeeReal Technologies Product Manager (In: Nielsen, 2005). One emerging trend over the next few years will be the increasing availability of three dimensional (3D) display technologies. The technology is already in the market and is being used in some UK HE institutions for the visualisation of research data in high-end scientific work such as biomedical research. However, these systems cost thousands of pounds rather than the hundreds that will be required for mass adoption to take place. According to Lou Mazzuchelli of 3D manufacturer LightSpace, these costs will fall:
"I remember the arguments with budget holders over whether to spend extra dollars to buy colour CRT instead of monochrome. Today, 3D voxels [sic] are more expensive than 2D pixels by a large enough factor to cause the same arguments about a new technology option. But eventually, the price gap will close and everyone who needs a 3D display will be able to acquire one without supplication to the budget deities." (Mazzuchelli, 2005).
As the cost of 3D falls and the technology improves, the market will expand beyond high-end scientific visualization to address educational and consumer applications like e-learning, gaming and entertainment. In order to help the development of this market, a number of companies including Sharp, Sony and Sanyo
Page 28 of 53
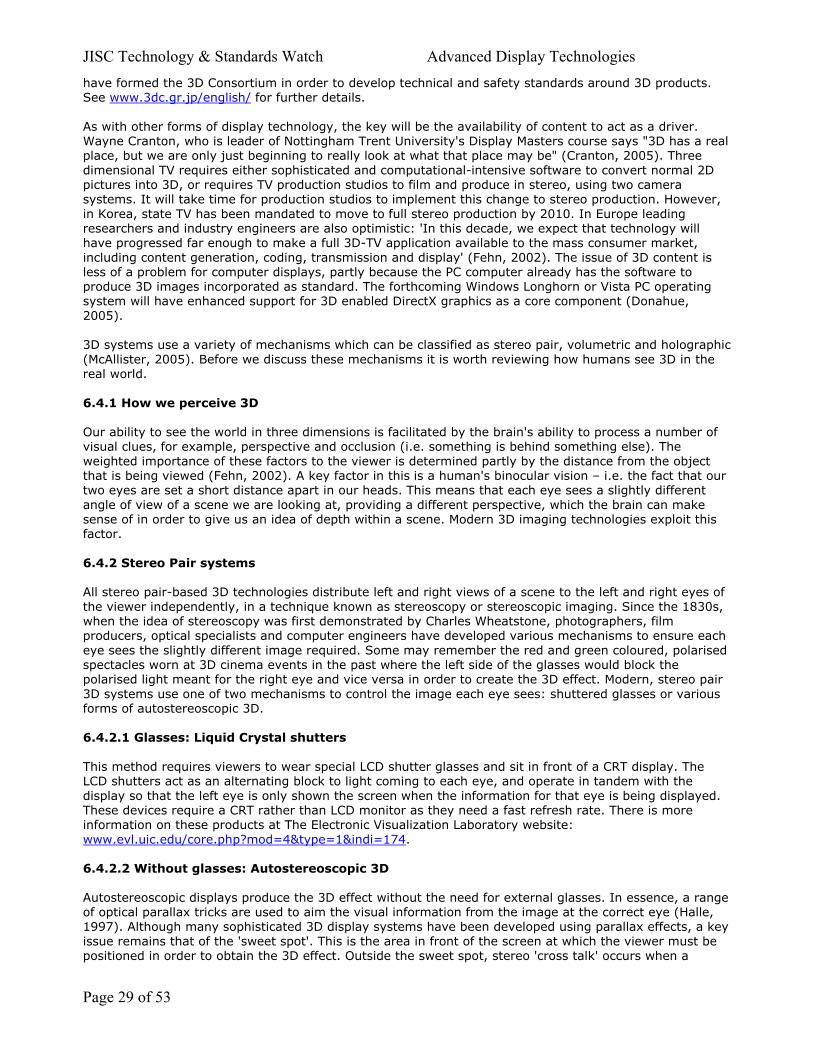
JISC Technology & Standards Watch Advanced Display Technologies have formed the 3D Consortium in order to develop technical and safety standards around 3D products. See www.3dc.gr.jp/english/ for further details. As with other forms of display technology, the key will be the availability of content to act as a driver. Wayne Cranton, who is leader of Nottingham Trent University's Display Masters course says "3D has a real place, but we are only just beginning to really look at what that place may be" (Cranton, 2005). Three dimensional TV requires either sophisticated and computational-intensive software to convert normal 2D pictures into 3D, or requires TV production studios to film and produce in stereo, using two camera systems. It will take time for production studios to implement this change to stereo production. However, in Korea, state TV has been mandated to move to full stereo production by 2010. In Europe leading researchers and industry engineers are also optimistic: 'In this decade, we expect that technology will have progressed far enough to make a full 3D-TV application available to the mass consumer market, including content generation, coding, transmission and display' (Fehn, 2002). The issue of 3D content is less of a problem for computer displays, partly because the PC computer already has the software to produce 3D images incorporated as standard. The forthcoming Windows Longhorn or Vista PC operating system will have enhanced support for 3D enabled DirectX graphics as a core component (Donahue, 2005). 3D systems use a variety of mechanisms which can be classified as stereo pair, volumetric and holographic (McAllister, 2005). Before we discuss these mechanisms it is worth reviewing how humans see 3D in the real world. 6.4.1 How we perceive 3D Our ability to see the world in three dimensions is facilitated by the brain's ability to process a number of visual clues, for example, perspective and occlusion (i.e. something is behind something else). The weighted importance of these factors to the viewer is determined partly by the distance from the object that is being viewed (Fehn, 2002). A key factor in this is a human's binocular vision – i.e. the fact that our two eyes are set a short distance apart in our heads. This means that each eye sees a slightly different angle of view of a scene we are looking at, providing a different perspective, which the brain can make sense of in order to give us an idea of depth within a scene. Modern 3D imaging technologies exploit this factor. 6.4.2 Stereo Pair systems All stereo pair-based 3D technologies distribute left and right views of a scene to the left and right eyes of the viewer independently, in a technique known as stereoscopy or stereoscopic imaging. Since the 1830s, when the idea of stereoscopy was first demonstrated by Charles Wheatstone, photographers, film producers, optical specialists and computer engineers have developed various mechanisms to ensure each eye sees the slightly different image required. Some may remember the red and green coloured, polarised spectacles worn at 3D cinema events in the past where the left side of the glasses would block the polarised light meant for the right eye and vice versa in order to create the 3D effect. Modern, stereo pair 3D systems use one of two mechanisms to control the image each eye sees: shuttered glasses or various forms of autostereoscopic 3D. 6.4.2.1 Glasses: Liquid Crystal shutters This method requires viewers to wear special LCD shutter glasses and sit in front of a CRT display. The LCD shutters act as an alternating block to light coming to each eye, and operate in tandem with the display so that the left eye is only shown the screen when the information for that eye is being displayed. These devices require a CRT rather than LCD monitor as they need a fast refresh rate. There is more information on these products at The Electronic Visualization Laboratory website: www.evl.uic.edu/core.php?mod=4&type=1&indi=174. 6.4.2.2 Without glasses: Autostereoscopic 3D Autostereoscopic displays produce the 3D effect without the need for external glasses. In essence, a range of optical parallax tricks are used to aim the visual information from the image at the correct eye (Halle, 1997). Although many sophisticated 3D display systems have been developed using parallax effects, a key issue remains that of the 'sweet spot'. This is the area in front of the screen at which the viewer must be positioned in order to obtain the 3D effect. Outside the sweet spot, stereo 'cross talk' occurs when a
Page 29 of 53
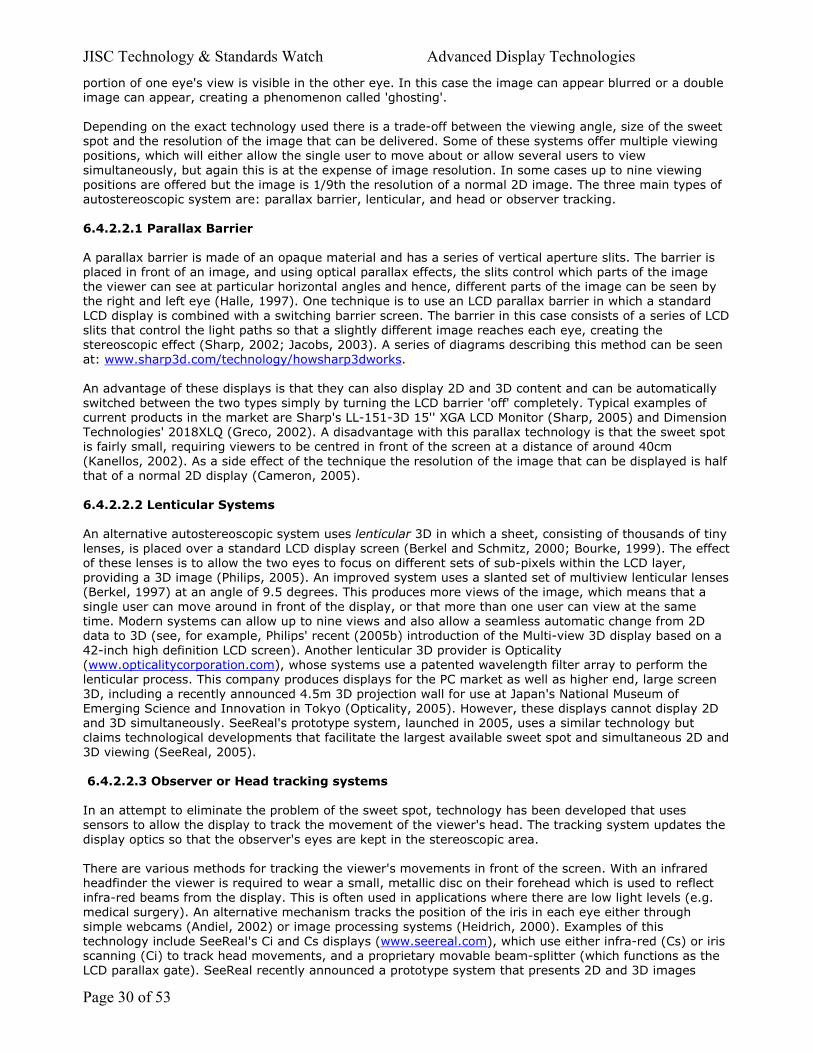
JISC Technology & Standards Watch Advanced Display Technologies portion of one eye's view is visible in the other eye. In this case the image can appear blurred or a double image can appear, creating a phenomenon called 'ghosting'. Depending on the exact technology used there is a trade-off between the viewing angle, size of the sweet spot and the resolution of the image that can be delivered. Some of these systems offer multiple viewing positions, which will either allow the single user to move about or allow several users to view simultaneously, but again this is at the expense of image resolution. In some cases up to nine viewing positions are offered but the image is 1/9th the resolution of a normal 2D image. The three main types of autostereoscopic system are: parallax barrier, lenticular, and head or observer tracking. 6.4.2.2.1 Parallax Barrier A parallax barrier is made of an opaque material and has a series of vertical aperture slits. The barrier is placed in front of an image, and using optical parallax effects, the slits control which parts of the image the viewer can see at particular horizontal angles and hence, different parts of the image can be seen by the right and left eye (Halle, 1997). One technique is to use an LCD parallax barrier in which a standard LCD display is combined with a switching barrier screen. The barrier in this case consists of a series of LCD slits that control the light paths so that a slightly different image reaches each eye, creating the stereoscopic effect (Sharp, 2002; Jacobs, 2003). A series of diagrams describing this method can be seen at: www.sharp3d.com/technology/howsharp3dworks. An advantage of these displays is that they can also display 2D and 3D content and can be automatically switched between the two types simply by turning the LCD barrier 'off' completely. Typical examples of current products in the market are Sharp's LL-151-3D 15'' XGA LCD Monitor (Sharp, 2005) and Dimension Technologies' 2018XLQ (Greco, 2002). A disadvantage with this parallax technology is that the sweet spot is fairly small, requiring viewers to be centred in front of the screen at a distance of around 40cm (Kanellos, 2002). As a side effect of the technique the resolution of the image that can be displayed is half that of a normal 2D display (Cameron, 2005). 6.4.2.2.2 Lenticular Systems An alternative autostereoscopic system uses lenticular 3D in which a sheet, consisting of thousands of tiny lenses, is placed over a standard LCD display screen (Berkel and Schmitz, 2000; Bourke, 1999). The effect of these lenses is to allow the two eyes to focus on different sets of sub-pixels within the LCD layer, providing a 3D image (Philips, 2005). An improved system uses a slanted set of multiview lenticular lenses (Berkel, 1997) at an angle of 9.5 degrees. This produces more views of the image, which means that a single user can move around in front of the display, or that more than one user can view at the same time. Modern systems can allow up to nine views and also allow a seamless automatic change from 2D data to 3D (see, for example, Philips' recent (2005b) introduction of the Multi-view 3D display based on a 42-inch high definition LCD screen). Another lenticular 3D provider is Opticality (www.opticalitycorporation.com), whose systems use a patented wavelength filter array to perform the lenticular process. This company produces displays for the PC market as well as higher end, large screen 3D, including a recently announced 4.5m 3D projection wall for use at Japan's National Museum of Emerging Science and Innovation in Tokyo (Opticality, 2005). However, these displays cannot display 2D and 3D simultaneously. SeeReal's prototype system, launched in 2005, uses a similar technology but claims technological developments that facilitate the largest available sweet spot and simultaneous 2D and 3D viewing (SeeReal, 2005). 6.4.2.2.3 Observer or Head tracking systems In an attempt to eliminate the problem of the sweet spot, technology has been developed that uses sensors to allow the display to track the movement of the viewer's head. The tracking system updates the display optics so that the observer's eyes are kept in the stereoscopic area. There are various methods for tracking the viewer's movements in front of the screen. With an infrared headfinder the viewer is required to wear a small, metallic disc on their forehead which is used to reflect infra-red beams from the display. This is often used in applications where there are low light levels (e.g. medical surgery). An alternative mechanism tracks the position of the iris in each eye either through simple webcams (Andiel, 2002) or image processing systems (Heidrich, 2000). Examples of this technology include SeeReal's Ci and Cs displays (www.seereal.com), which use either infra-red (Cs) or iris scanning (Ci) to track head movements, and a proprietary movable beam-splitter (which functions as the LCD parallax gate). SeeReal recently announced a prototype system that presents 2D and 3D images
Page 30 of 53
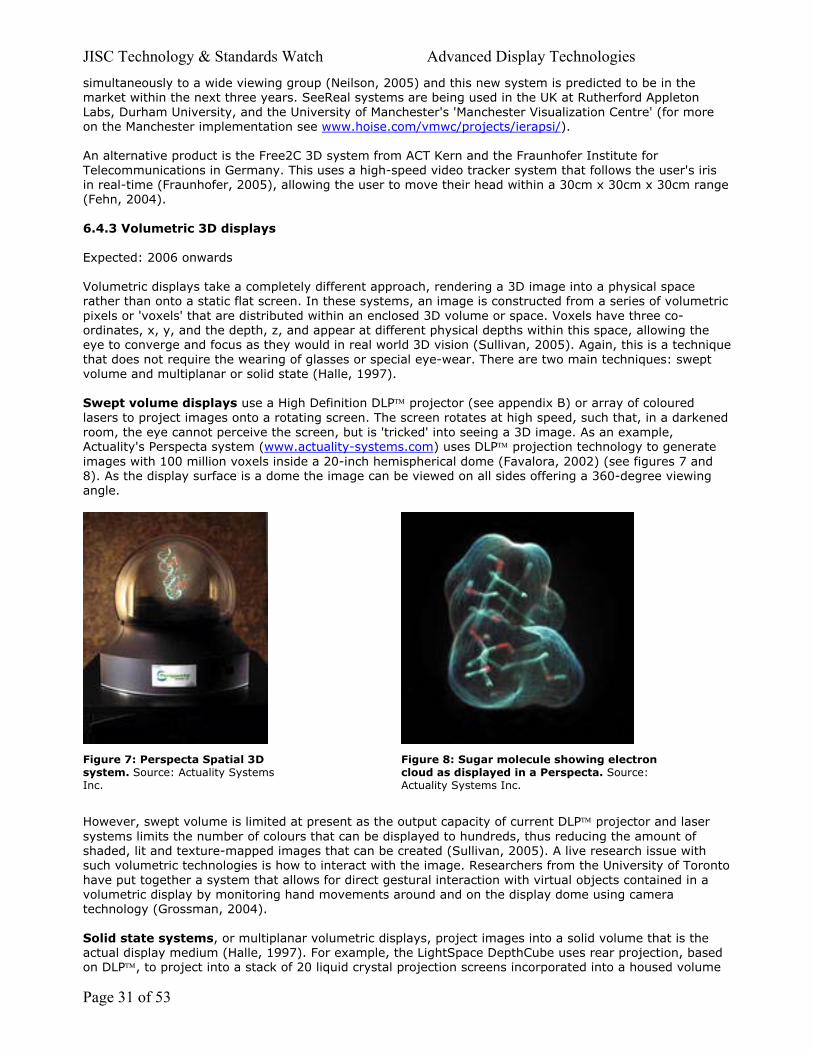
JISC Technology & Standards Watch Advanced Display Technologies simultaneously to a wide viewing group (Neilson, 2005) and this new system is predicted to be in the market within the next three years. SeeReal systems are being used in the UK at Rutherford Appleton Labs, Durham University, and the University of Manchester's 'Manchester Visualization Centre' (for more on the Manchester implementation see www.hoise.com/vmwc/projects/ierapsi/). An alternative product is the Free2C 3D system from ACT Kern and the Fraunhofer Institute for Telecommunications in Germany. This uses a high-speed video tracker system that follows the user's iris in real-time (Fraunhofer, 2005), allowing the user to move their head within a 30cm x 30cm x 30cm range (Fehn, 2004). 6.4.3 Volumetric 3D displays Expected: 2006 onwards Volumetric displays take a completely different approach, rendering a 3D image into a physical space rather than onto a static flat screen. In these systems, an image is constructed from a series of volumetric pixels or 'voxels' that are distributed within an enclosed 3D volume or space. Voxels have three co-ordinates, x, y, and the depth, z, and appear at different physical depths within this space, allowing the eye to converge and focus as they would in real world 3D vision (Sullivan, 2005). Again, this is a technique that does not require the wearing of glasses or special eye-wear. There are two main techniques: swept volume and multiplanar or solid state (Halle, 1997). Swept volume displays use a High Definition DLP projector (see appendix B) or array of coloured lasers to project images onto a rotating screen. The screen rotates at high speed, such that, in a darkened room, the eye cannot perceive the screen, but is 'tricked' into seeing a 3D image. As an example, Actuality's Perspecta system (www.actuality-systems.com) uses DLP projection technology to generate images with 100 million voxels inside a 20-inch hemispherical dome (Favalora, 2002) (see figures 7 and 8). As the display surface is a dome the image can be viewed on all sides offering a 360-degree viewing angle.
Figure 7: Perspecta Spatial 3D system. Source: Actuality Systems Inc.
Figure 8: Sugar molecule showing electron cloud as displayed in a Perspecta. Source: Actuality Systems Inc.
However, swept volume is limited at present as the output capacity of current DLP projector and laser systems limits the number of colours that can be displayed to hundreds, thus reducing the amount of shaded, lit and texture-mapped images that can be created (Sullivan, 2005). A live research issue with such volumetric technologies is how to interact with the image. Researchers from the University of Toronto have put together a system that allows for direct gestural interaction with virtual objects contained in a volumetric display by monitoring hand movements around and on the display dome using camera technology (Grossman, 2004). Solid state systems, or multiplanar volumetric displays, project images into a solid volume that is the actual display medium (Halle, 1997). For example, the LightSpace DepthCube uses rear projection, based on DLP, to project into a stack of 20 liquid crystal projection screens incorporated into a housed volume
Page 31 of 53
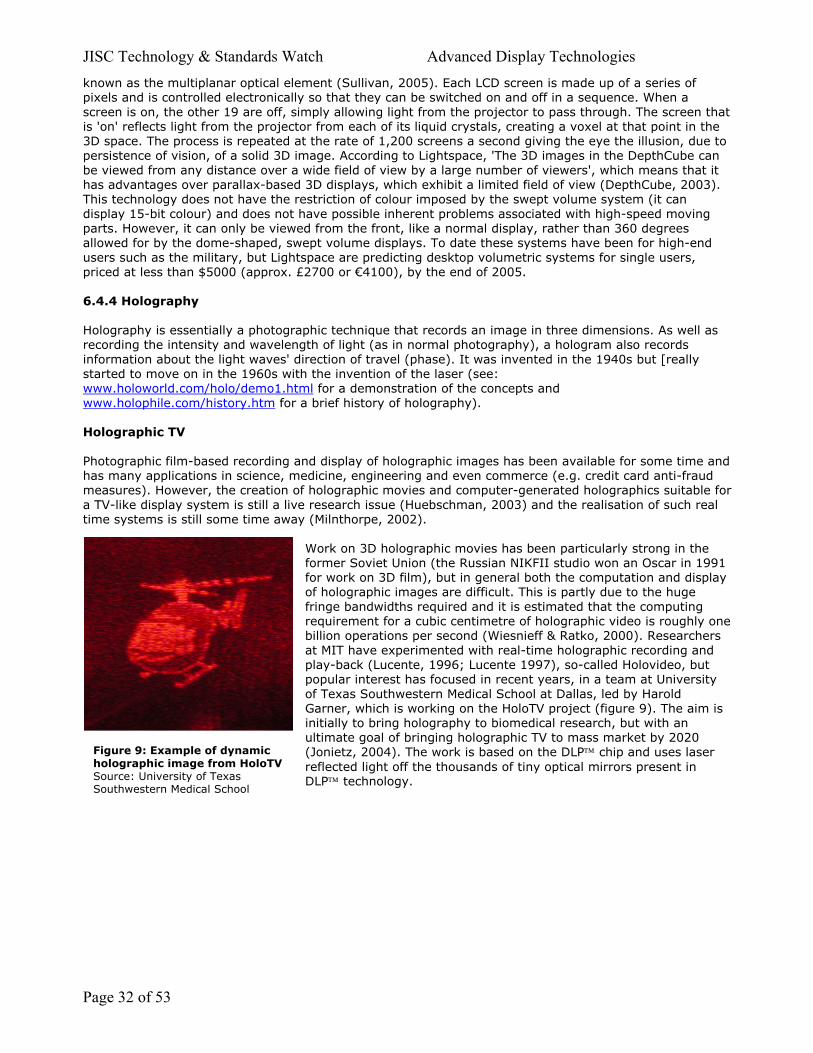
JISC Technology & Standards Watch Advanced Display Technologies known as the multiplanar optical element (Sullivan, 2005). Each LCD screen is made up of a series of pixels and is controlled electronically so that they can be switched on and off in a sequence. When a screen is on, the other 19 are off, simply allowing light from the projector to pass through. The screen that is 'on' reflects light from the projector from each of its liquid crystals, creating a voxel at that point in the 3D space. The process is repeated at the rate of 1,200 screens a second giving the eye the illusion, due to persistence of vision, of a solid 3D image. According to Lightspace, 'The 3D images in the DepthCube can be viewed from any distance over a wide field of view by a large number of viewers', which means that it has advantages over parallax-based 3D displays, which exhibit a limited field of view (DepthCube, 2003). This technology does not have the restriction of colour imposed by the swept volume system (it can display 15-bit colour) and does not have possible inherent problems associated with high-speed moving parts. However, it can only be viewed from the front, like a normal display, rather than 360 degrees allowed for by the dome-shaped, swept volume displays. To date these systems have been for high-end users such as the military, but Lightspace are predicting desktop volumetric systems for single users, priced at less than $5000 (approx. £2700 or €4100), by the end of 2005. 6.4.4 Holography Holography is essentially a photographic technique that records an image in three dimensions. As well as recording the intensity and wavelength of light (as in normal photography), a hologram also records information about the light waves' direction of travel (phase). It was invented in the 1940s but [really started to move on in the 1960s with the invention of the laser (see: www.holoworld.com/holo/demo1.html for a demonstration of the concepts and www.holophile.com/history.htm for a brief history of holography). Holographic TV Photographic film-based recording and display of holographic images has been available for some time and has many applications in science, medicine, engineering and even commerce (e.g. credit card anti-fraud measures). However, the creation of holographic movies and computer-generated holographics suitable for a TV-like display system is still a live research issue (Huebschman, 2003) and the realisation of such real time systems is still some time away (Milnthorpe, 2002).
Figure 9: Example of dynamic holographic image from HoloTV Source: University of Texas Southwestern Medical School
Work on 3D holographic movies has been particularly strong in the former Soviet Union (the Russian NIKFII studio won an Oscar in 1991 for work on 3D film), but in general both the computation and display of holographic images are difficult. This is partly due to the huge fringe bandwidths required and it is estimated that the computing requirement for a cubic centimetre of holographic video is roughly obillion operations per second (Wiesnieff & Ratko, 2000). Reseaat MIT have experimented with real-time holographic recording andplay-back (Lucente, 1996; Lucente 1997), so-called Holovideo, but popular interest has focused in recent years, in a team at University of Texas Southwestern Medical School at Dallas, led by Harold Garner, which is working on the HoloTV project (figure 9). The aim is initially to bring holography to biomedical research, but with an ultimate goal of bringing holographic TV to mass market by 2020 (Jonietz, 2004). The work is based on the DLP chip and uses laser reflected light off the thousands of tiny optical mirrors present in DLP technology.
ne rchers
Page 32 of 53
JISC Technology & Standards Watch Advanced Display Technologies 6.5 Specific Trends: Higher resolution and collaboration – Immersive visualisation technologies "It is unlikely that visualization users can be served adequately, at least in coming years, by an infrastructure largely based on desktop computers."
Brodlie, 2004, p.1 Trend summary: High resolution, immersive and collaborative displays for visualisation of increasingly large data sets and for collaborative team-based research and learning. Within higher education a segment of work that uses display technologies will increasingly focus on visualisation and the display of highly complex graphical information associated with science. Increases in computing power have enabled researchers in fields such as astrophysics and biology to generate a 'data avalanche' and effective data visualization tools are needed in order to make best use of these data sets (Li, 2005). More commercial problems include the visualisation of large telecommunication networks (Wei, 2000). With this in mind, JISC created the Advisory Group on Computer Graphics (AGOCG) (not maintained after 1998), which produced a number of reports and papers on visualization and the state of Virtual Reality (VR) in UK universities (www.agocg.ac.uk/) and, more recently, commissioned the JISC Visualization Foundation study (JISC, 2004). In the UK, work is on-going through, for example, the EPSRC-funded e-Viz project (www.eviz.org). In parallel, educationalists and technologists are investigating the redevelopment of the lecture theatre and classroom as a teaching and learning space, proposing new structures that emphasise interactivity, media-rich environments, collaboration and multi-site working (Long and Ehrmann, 2005; Valenti, 2002). Much of this work has taken place in the USA, but in the UK the Design Council has been leading some development through its 360-degrees flexible classroom project (Thorpe and Asthana, 2005). These new research and educational needs are driving two key requirements for advanced display technologies: increases in resolution, and the development of collaborative, multi-user display spaces. Increased Resolution 'During the past two decades, while computing power, storage density and network bandwidth have improved by more than three orders of magnitude, display resolution has merely doubled' (Li, 2005, page 1). A typical 20-inch desktop science workstation at a university is able to display perhaps 2 million pixels and this is insufficient for an increasing number of science applications, for example, display of genes or plasma physics. Although small numbers of high-end visualisation monitors have been produced, for example IBM’s T221 with 9.2 megapixels, the costs to date have restricted this uptake. Moving away from single user Current display systems are designed for single users, but increasingly, high-end science experiments need to be analysed by teams of researchers working together. 'What the scientists want is a large-scale, shared visualization system that can be manipulated by multiple users simultaneously', (Li, 2005). In parallel, developments in novel, more collaborative teaching methods are leading to new uses of shared networks and public displays in systems known as Shared Event systems. Educationalists are exploiting these systems in new workspaces and classrooms which are designed to facilitate high levels of interaction and shared working, and incorporate wall-sized displays. An example is the Stanford iRoom project (http://iwork.stanford.edu/). These two needs point to the development of new visualisation techniques and technologies and the development of large scale displays. 6.5.1 Scalable display walls and Power walls One leading solution is the development of high-resolution, collaborative Display Walls, or Power Walls (Moreland and Thompson, 2003). These are tiled systems of projectors (Hereld and Judson, 2000) driven by arrays of PCs (Spooner, 2002) which aim to increase resolution rather than to scale existing resolution (Hereld, 2000). Some of the walls work alongside clusters of conventional PC products such as Linux boxes, whilst others use purpose-built, high-end technologies (Wei, 2000). These walls can deliver 'at least an order of magnitude improvement' in visualization ability over a desktop display system (Li, 2005). As an example, the Princeton wall consists of 24 rear projection screens and arrays of LCD-based projectors, driven by a cluster of PCs. Research work has focused on a number of technical challenges such as tile
Page 33 of 53
JISC Technology & Standards Watch Advanced Display Technologies alignment and projector calibration in order to provide a seamless display with very large resolution rates i.e. 20 million pixels or more (Li, 2004). A trend that Princeton predicts is the replacement of the array projectors by tiled FPD-based solutions, removing the need for quite complex, seamless blending processes between the images produced by the array of projectors (Wei, 2000). However, these rear projection systems take up considerable room. A number of front projection systems have also been developed (Molyneaux and Kortuem, 2004) but the future may lie in more flexible systems. Groups of researchers are looking at modular ways to construct different scales of such display systems using 'lego'-like display structures, known as Modular Ambient Display (MAD) Boxes (Schmidt, 2004). Commercially, systems based on the research are now increasingly available. As an example, the following companies offer tiled displays of up to 88 megapixels resolution: Visbox: www.vizbox.com Fakespace Systems: www.fakespacesystems.com/hiPowerWall.htm SGI: www.sgi.com/products/visualization/realitycenter/walls.html Shared Event systems - Collaborative working and learning In parallel with developments in research technologies, educationalists are beginning to look at the use of larger display surfaces for new forms of classroom design, facilitating group work, interaction and teaching (Long and Ehrmann, 2005). These systems, known as Shared Event Systems, use wall-sized display surfaces as a shared collaboration space, accessed through a heterogeneous range of input devices, handheld computers and software applications. A leading example of this is Stanford University’s iRoom project (Johanson, 2002). Immersion As the capability to develop large scale display surfaces with high resolution has developed, so researchers and engineers have turned to the idea of constructing whole walls or even rooms that operate as display surfaces, creating 'immersive environments' and collaborative virtual environments (CVE). Such virtual reality developments offer the potential for an immersive experience for the user, enhancing the potential for visualisation. An early development in this field was CAVE, designed and implemented in 1991 at the Electronic Visualization Laboratory (EVL) at the University of Illinois in Chicago (CAVE, 2005; Cruz-Neira, 1993). See for example, details of the implementation at the University of Reading: www.rvc.rdg.ac.uk/index.shtml. An interesting video showing examples of groups of researchers working in a CAVE immersion system can be seen at: www.rvc.rdg.ac.uk/movies/IPT_video.mpg. Another educational example is Arizona State University's Decision Theatre, an advanced visualization environment that will enable policymakers and others to see in detailed three dimensions, the consequences of their actions (Veritas, 2005b). Whilst it is clear that such immersion systems offer considerable scope to enhance the work of scientific research and offer new and interesting opportunities for teaching and learning, a detailed look at these matters is beyond the scope of this report. Those interested in this area may like to read the JTAP report on virtual design environments which looks at these systems (JTAP, 2000). 6.5.2 The future of visualization As data sets increase in size, visual display architecture and systems will need to handle data streams of 'arbitary large size' (Brodlie, 2004). A key challenge with such datasets is the development of making meaningful information visible to the eye and this will require not only developments in display systems themselves (for example, increased resolution), but also new visualisation and software techniques for visual data mining. One of the drivers for the development of display systems for visualisation will be the developing Grid computing paradigm, for example through the EuroGrid project (www.eurogrid.org), and in the UK through the e-science initiative (www.nesc.ac.uk/index.html) (Mann and Williams, 2003). Widespread access to the Grid through middleware development will enable the creation of new tools for collaborative visualization, data-sharing and remote control of instruments. In the USA, work is underway to develop the Optiputer, a huge, parallel computational platform based on optical networking of widely distributed networks of computer clusters, which is led by Larry Smarr, of the California Institute for Telecommunications and Information Technology (www.optiputer.net/). As part of the work, 'peripherals'
Page 34 of 53
JISC Technology & Standards Watch Advanced Display Technologies will be incorporated into the network, including visualisation display systems like the LambdaVision high resolution display capable of 100 megapixel or more of resolution (Nayak, 2004; Trecc, 2005). 6.6 Specific Trends: Personal and near-to-eye displays 'Don't stay fixated on the idea of screens. Screens might become obsolete sooner than you think.'
Thomas A. Furness III, Human Interface Technology Laboratory (In: Rheingold, 1991). Personal displays, visors and headsets require the user to wear the display close to their eyes, and are becoming relatively common in research, military and engineering environments, and high-end gaming circles. Developments in microdisplay technologies will significantly increase their use and reach in coming years. A microdisplay is a device that is used with some kind of optical magnification system placed between the image screen and the viewer's eye (Insight Media, 2005; Chinock, 2000) i.e. the system is not direct-view. Such displays have the advantage of allowing the display of a large image from a small surface and thereby offer lower power consumption, reduced cost and are extremely portable (Underwood, 2000). A good source of background information on microdisplays is Herbert DeSmet's pages at the University of Ghent (www.elis.rug.ac.be/ELISgroups/tfcg/microdis/). For an introduction to some of the technology involved in the screen display see Armitage (2002) and for a discussion of some of the optics involved in near-to-eye imaging see Allen (2002). Conventional front and rear projection systems involve the use of microdisplays and they are also commonly found in the viewfinders of digital cameras and video recorders; indeed this is the main market at the moment. However, a more interesting development is that microdisplay technologies are helping to facilitate the introduction of near-to-eye or 'heads-up' systems, and the production of lightweight, wearable, personal head-mounted displays with screens. The user wears the screens like a pair of glasses and sees an image in front of the eyes at the same time as being able to view the real world. Although currently the systems are somewhat bulky and obvious, it is expected that as the screen technology is miniaturised and embedded in the frame they will be indistinguishable from a pair of spectacles or sunglasses in a few years' time. Wireless connection to other peripherals and desktop systems is also expected shortly. Near-to-eye systems have been used extensively by the military and by vehicle repair and servicing personnel (Murray, 2004) and are increasingly being taken up by surgeons and other medical staff (Patsuris, 2004). As costs fall and techniques improve, the education and consumer markets will begin to open, with one leading industry commentator expecting to see a $1 billion market by 2008, partly driven by near-to-eye personal TV (Insight Media, 2004). Such developments also point to a potential rise in the number of people actively engaged in augmented reality – interacting with data at the same time as viewing and working in the real world – and a number of commercial companies are working in this area. In the US the largest manufacturer is Kopin, who offer the CyberDisplay line of microdisplays, including video eyewear, cameras and infrared military equipment. The technology is based on very small (less than one inch) active matrix LCD microdisplays which can generate resolutions of 521 x 218. Also based in the States, eMagin provide a range of wearable displays based on OLED technology. In the UK, a leading developer is the University of Edinburgh spin-out, MicroEmissive Displays, who offer the ME32303, a device based on PLEDs and offering 320 x 240 pixels. 6.6.1 Scanned-beam An alternative technology pathway is being opened up by scanned-beam displays in which tiny lasers or light-emitting diodes project light directly into the viewer's retina. The first display systems based on this concept are being introduced in augmented reality scenerios particularly for automotive service personnel (Lewis, 2005). One system, Nomad, is being developed by Microvision Inc, of Bothall, Washington. They have produced a clear, flat window, with a small (1.5mm) mirror which is angled in front of the viewer's eyes and reflects mono-colour (red) laser light into the retina in a sweeping pattern.
Page 35 of 53
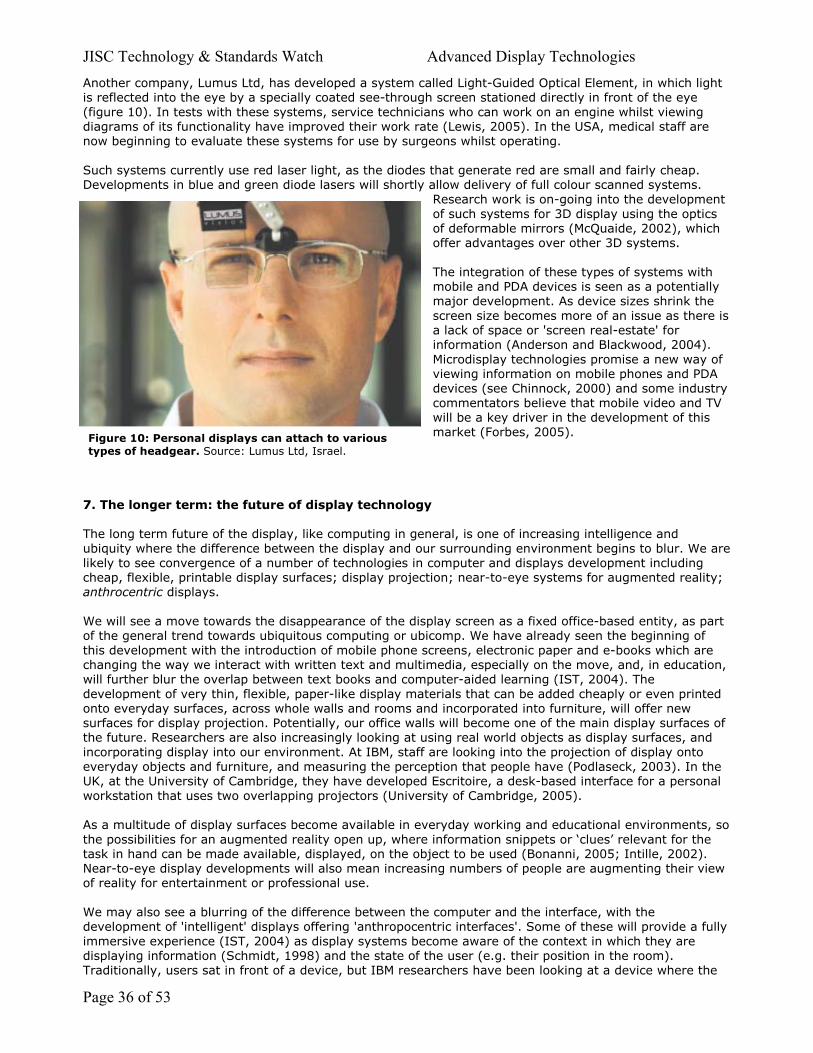
JISC Technology & Standards Watch Advanced Display Technologies Another company, Lumus Ltd, has developed a system called Light-Guided Optical Element, in which light is reflected into the eye by a specially coated see-through screen stationed directly in front of the eye (figure 10). In tests with these systems, service technicians who can work on an engine whilst viewing diagrams of its functionality have improved their work rate (Lewis, 2005). In the USA, medical staff are now beginning to evaluate these systems for use by surgeons whilst operating. Such systems currently use red laser light, as the diodes that generate red are small and fairly cheap. Developments in blue and green diode lasers will shortly allow delivery of full colour scanned systems.
Research work is on-going into the development of such systems for 3D display using the optics of deformable mirrors (McQuaide, 2002), which offer advantages over other 3D systems. The integration of these types of systems with mobile and PDA devices is seen as a potentially major development. As device sizes shrink the screen size becomes more of an issue as there is a lack of space or 'screen real-estate' for information (Anderson and Blackwood, 2004). Microdisplay technologies promise a new way of viewing information on mobile phones and PDA devices (see Chinnock, 2000) and some industry commentators believe that mobile video and TV will be a key driver in the development of this market (Forbes, 2005).
Figure 10: Personal displays can attach to various types of headgear. Source: Lumus Ltd, Israel.
7. The longer term: the future of display technology The long term future of the display, like computing in general, is one of increasing intelligence and ubiquity where the difference between the display and our surrounding environment begins to blur. We are likely to see convergence of a number of technologies in computer and displays development including cheap, flexible, printable display surfaces; display projection; near-to-eye systems for augmented reality; anthrocentric displays. We will see a move towards the disappearance of the display screen as a fixed office-based entity, as part of the general trend towards ubiquitous computing or ubicomp. We have already seen the beginning of this development with the introduction of mobile phone screens, electronic paper and e-books which are changing the way we interact with written text and multimedia, especially on the move, and, in education, will further blur the overlap between text books and computer-aided learning (IST, 2004). The development of very thin, flexible, paper-like display materials that can be added cheaply or even printed onto everyday surfaces, across whole walls and rooms and incorporated into furniture, will offer new surfaces for display projection. Potentially, our office walls will become one of the main display surfaces of the future. Researchers are also increasingly looking at using real world objects as display surfaces, and incorporating display into our environment. At IBM, staff are looking into the projection of display onto everyday objects and furniture, and measuring the perception that people have (Podlaseck, 2003). In the UK, at the University of Cambridge, they have developed Escritoire, a desk-based interface for a personal workstation that uses two overlapping projectors (University of Cambridge, 2005). As a multitude of display surfaces become available in everyday working and educational environments, so the possibilities for an augmented reality open up, where information snippets or ‘clues’ relevant for the task in hand can be made available, displayed, on the object to be used (Bonanni, 2005; Intille, 2002). Near-to-eye display developments will also mean increasing numbers of people are augmenting their view of reality for entertainment or professional use. We may also see a blurring of the difference between the computer and the interface, with the development of 'intelligent' displays offering 'anthropocentric interfaces'. Some of these will provide a fully immersive experience (IST, 2004) as display systems become aware of the context in which they are displaying information (Schmidt, 1998) and the state of the user (e.g. their position in the room). Traditionally, users sat in front of a device, but IBM researchers have been looking at a device where the
Page 36 of 53
JISC Technology & Standards Watch Advanced Display Technologies display follows the user using an EveryWhere Displays Projector (Pingali, 2002). The projector can decide on which surface to project the image based on the user's position and the geometry of the room, and is able to adjust the image projected to the surface to achieve a visually correct display. Others go further on context awareness and predict that the increased use of personal displays in the form of wearable glasses will lead to enhancements that obtain information from the viewer's eyes, such as the rate of blinking, to be used as part of health monitoring systems (Etcoff, 2002). Ambient displays will be developed that are present all around our working and learning environments and which operate implicitly rather than explicitly, providing information without demanding our full attention. They will convey information by subtle changes in sound, light and movement, sometimes acting at the periphery of our visual senses (Streitz, 2003). Displays will also increasingly make more use of the full range of human visual perception. Philips, for example, is interested in working with users' visual experiences and perception to feed in to planned future products. Humans are adept at peripheral vision and as a starting point, Philips have built this in to an experimental TV which has additional, ambient light in the screen's surround (Philips, 2005c), allowing improved perception of the display's actual picture. And finally, the idea of the display interface consisting solely of a visual system may also change. As one example of this potential trend, researchers have begun to look at the development of visual and tangible interfaces through the use of illuminated clay 3D models of a geographical landscape (Ishii, 2004).
8. Conclusion and recommendations
Absorbing and interacting with visual information through displays is an integral part of our everyday working and educational life. The technology behind this has a long history of striving to match the capacity of the human visual system. Until recently this has remained fairly static, being based on the cathode ray tube (CRT), a device virtually unchanged since its commercial introduction. However, we are now in a period of tremendous flux as the state of the art becomes centred on flat display panel technologies through LCD and Plasma. There were a number of different drivers for the introduction and uptake of these new displays in variety of scenarios (for example the lower power consumption required by laptops and the capacity to handle HDTV), but the overriding consideration is the space-saving design inherent in flat screens. Some of these changes will continue the same development curve as current FPDs through new device technologies such as nanotube-based field emission devices; others will take us in new directions, removing the display screen altogether and using microdisplays to scan directly into our eyes. All of these developments will have implications for education, an area of society where easy access to information and the ability to engage the viewer with visually stimulating media is profoundly important. As a generalised recommendation, staff within educational institutions will need to stay abreast of developments in displays as the new technologies are delivered to the marketplace. There are also some specific recommendations, as follows: 1. It can be argued that in a multi-media and increasingly mobile world, education competes for young
people’s attention. The new display technologies will open up avenues for the delivery of highly engaging, high resolution and novel content formats such as HDTV, HD-DVD and 3D, and, within a few years, these are likely to become quite normal in the home environment. Staff who are preparing and delivering teaching and learning materials will need to be aware that, increasingly, people will be used to the visual experience available from such formats and that to continue to engage young people they may need to develop such materials.
2. Our classrooms and research laboratories are changing, and one of the key drivers of that process is
the changing nature of display technologies. New display technologies, such as large, public projection and high definition displays, are also helping to open up opportunities for new forms of classroom and learning space design with increased flexibility and emphasis on collaborative and multi-site work. Many of the experiments in these spaces are being driven by American institutions and the UK will need to absorb and build on some of the lessons being learned.
3. Research, particularly in science, is making new demands on the capabilities of desktop computing
facilities, including the display. There will be an increasing requirement for large scale visualisation with very high resolution. Staff involved in the specification and purchase of equipment for researchers will need to be aware of the implications of new developments such as large-scale displays capable of 100 megapixels.
Page 37 of 53
JISC Technology & Standards Watch Advanced Display Technologies 4. The developments in near-to-eye displays could have the most far reaching implications. If such
systems become cost effective and practical they will inevitably merge with continuing developments in mobile computation to help facilitate an always-on, augmented reality. Just as many people now constantly carry a mobile phone, they may also constantly wear glasses that provide near-to-eye visual display. This will perhaps allow an individual to augment their reality in a personalised manner: imagine a lecture in which the lecturer delivers her talk whilst extra notes and visual information are presented to each student’s individual eye wear, personalised for them, based on their level of attainment in the subject.
As we have seen, the nature of displaying information is changing. The traditional model with a bulky desktop or TV display allocated to perhaps one per person or per household is rapidly disappearing. Screens are becoming flatter, are appearing in an increasing range of environments and technical gadgets are providing new formats of content. Soon the screen may disappear altogether. The pace of this change can only increase in coming years and the changing nature of the display of information will have implications for education as much as any other area of society.
Page 38 of 53
JISC Technology & Standards Watch Advanced Display Technologies 9. References ALLEN, K. 2002. Emerging Displays Review. Stanford University: CA, USA. Also available online at: http://www.lumusvision.com/feb2002.pdf [last accessed 28/07/05]. ALT, P., NODA, K. 1998. Increasing electronic display information content: An introduction. IBM Journal of Research and Development, vol. 42, no. 3/4. IBM: New York, USA. AMARATUNGA, G. 2003. Watching the Nanotubes. IEEE Spectrum, September 2003. IEEE Spectrum magazine: New York, USA. ANDERSON, P., BLACKWOOD, A. 2004. Mobile and PDA technologies and their future use in education. JISC Technology and Standards Watch, report TSW-03-04. JISC: Bristol, UK. Also available online at: http://www.jisc.ac.uk/index.cfm?name=techwatch_reports_0403 [last accessed 19/07/05]. ANDIEL, M., HENTSCHKE, S., ELLE, T., FUCHS, E. 2002 Eye-Tracking for Autostereoscopic Displays using Webcams. Proceedings of SPIE: Stereoscopic Displays and Applications XIII, vol. 4660, 21st-23rd Jan. 2002, San Jose, Ca., USA. ARMITAGE, D., UNDERWOOD, I., WU, S. 2002. Microdisplays move out of the box. The SPEI magazine of photonics technologies and applications. Tutorial, November 2002. Available online at: http://oemagazine.com/fromTheMagazine/nov02/tutorial.html [last accessed 28/07/05]. ASSOCIATED PRESS, 2005. Sharp to sell world's largest LCD TV. Associated Press report, published on MSNBC, June 3rd 2005. Available at: http://msnbc.msn.com/id/8087100/ [last accessed: 19/07/05]. BAUER, D., BONACKER, M., CAVONIUS, C. 1983. Frame repetition rate for flicker-free viewing of bright VDU screens. Displays, vol. 4, Jan 1983 pp. 31-33. BECTA, 2003. What the research says about digital video in teaching and learning. BECTA ICT Research. BECTA: Coventry, UK. BECTA, 2005. Electronic Paper Developments. BECTA Tech News, May 2005. BECTA: Coventry, UK, p. 6. BERKEL, C., AND SCHMITZ, J. 2000. Multi-user 3D displays. Proceedings of Tile, 10th May 2000, London. Available online at: http://www.research.philips.com/technologies/display/3d/paperspatents.html [last accessed 19/07/05]. BERKEL, CORNELIUS VAN., CLARKE, J. 1997. Autostereoscopic display apparatus. United States Patent. 6,064,424. May 26, 2000. Filed 12th Feb., 1997. BONANNI, L., LEE, C., SELKER, T. 2005. Attention-based Design of Augmented Reality Interfaces. Proceedings of CHI 2005, April 2-7, 2005, Portland, Oregon, USA. BOURKE, P. 1999. Autostereoscopic lenticular images. Course notes. Published by The Swinburne Centre for Astrophysics and Supercomputing: Australia. Available online at: http://astronomy.swin.edu.au/~pbourke/stereographics/lenticular/ [last accessed 29/07/05]. BRANDON, J. 2005. Move over Plasma TVs: Nano-screens are coming. Technology Review, 23rd May. MIT: Cambridge, MA., USA. BRODLIE, K., BROOKE, J., CHEN, M. et al. 2004. Visual Supercomputing – technologies, applications and challenges. Eurographics STAR- 2, State of the Art report. European Association for Computer Graphics: Switzerland. N.B. Revised version to be published in Computer Graphics Forum Issue 24 Number 2, 2005. Available online: http://eg04.inrialpes.fr/Programme/STAR/STAR2.html [last accessed 19/07/05]. BROWN ELLIOTT, C. 2004. PenTile Matrix Technology: Low power, Low cost, High Resolution Displays Using Sub-pixel Rendering. Proceedings of AMLCD Conference, Tokyo, JP. 25th-27th Aug.
Page 39 of 53
JISC Technology & Standards Watch Advanced Display Technologies BROWN UNIVERSITY, 2002. The Human Visual System. Lecture notes on Virtual Reality: immersion, decisions, empathy. Dept. of Computer Science, Brown University: Providence, RI, USA. Available online at: http://www.cs.brown.edu/courses/cs196-2/lectures/5Feb02.pdf [last accessed 20/07/05]. BURR, D., MORGAN, M. 1997. Motion deblurring in human vision. Proceedings of the Royal Society. Vol. 264, no. 1380. Royal Society: London. pp. 431 – 436. BUSH, S. 2004. Organic LEDs are on the way. Electronics Weekly, 11th Nov. Reed Business Information Limited: Sutton, SM2 5AS. Also available online at: http://www.electronicsweekly.com/Articles/2004/11/11/33567/OrganicLEDsareontheway.htm [last accessed 19/07/05]. CAMERON, C. 2005. Collaborative Autostereo 3D Display System. Proceedings of joint meeting on 3D technology, 25th April 2005. The Society for Information Display, UK and Ireland Chapter, San Jose, CA. Also available online at: http://www.sid.org/chapters/uki/qinetiq.pdf [last accessed 29/07/05]. CAVE, 2005. Welcome to the CAVE, brochure from NCSA on the CAVE system. NCSA, USA. Available online at: http://cave.ncsa.uiuc.edu/cave.pdf [last accessed 27/07/05]. CHINNOCK, C., 2000. Microdisplays: the end of the beginning. Electronic Design, 10th Jan. 2000. ELECTRONIC DESIGN: Paramus, NJ. CNET, 2005. Monitor Buying Guide. CNet Editor's choice. Available online at: http://reviews.cnet.com/4520-7610_7-5084364-2.html [last accessed: 29/07/05]. CRANTON, W. 2005. Reader in visual display systems, Nottingham Trent University. Private interview with the author, Nottingham, England 7th June 2005. CRAWFORD, C. 2003. Organic Light Emitting Diodes Have Bright Future in Flat Panel Displays. BAEP 557: Technology Commercialization, Spring 2003. University of Southern California Technology Commercialization Alliance: California, USA. CRUZ-NEIRA, C., SANDIN, D., AND DEFANTI, T. 1993. Surround-Screen Projection-Based Virtual Reality: The Design and Implementation of the CAVE. Computer Graphics (Proceedings of SIGGRAPH 93), ACM SIGGRAPH, August 1993, pp. 135-142. DA-LITE, 1995. Units of Measure. Angles of View, vol. 1. Da-Lite: Warsaw, IN, USA. For detailed explanation of the units of brightness also try Da-lite's website: http://www.da-lite.com/education/angles_of_view.php?action=details&issueid=27 [last accessed 19/07/05]. DELL, 2003. High-Resolution, Wide-Aspect, and Wide-Viewing Displays on Dell Portable Computers. ZDNET white paper. Available online at: (requires free membership registration): http://whitepapers.zdnet.co.uk/0,39025945,60052488p-39000369q,00.htm [last accessed 19/07/05]. DEPTHCUBE, 2003. DepthCube Technology White Paper. Lightspace Technologies Inc.: USA. DIGITAL HOME, 2005. HDTV takes off. Digital Home Magazine, iss. 26, June 2005. Future plc: Bath, UK, p. 24. DILLON, A. 2004. 2nd edition. So what do we know? An overview of the empirical literature on reading from screens. Designing Usable Electronic Text. chapter 3, p.56. CRC Press: Boca Raton, Florida. DISPLAY SEARCH, 2003. Wide Aspect Ratio. Notebook PC Strategy Report, Chapter 11.0. Display Search. DONAHUE, C. 2005. DirectX, Longhorn and the future of Windows Gaming. Game Daily Biz, 28th June. Available online at: http://biz.gamedaily.com/features.asp?article_id=9950&filter=interview [last accessed 29/07/05]. DUPONT, B. 2005. LCD Or Plasma - What's Your Pleasure? Understanding Modern Flat-Panel TV Technologies. Tom's Hardware Guide. Available online at: http://graphics.tomshardware.com/display/20050309/index.html [last accessed 10/07/05].
Page 40 of 53
JISC Technology & Standards Watch Advanced Display Technologies ECONOMIST, 2005. On a Roll. The Economist Technology Quarterly, June 11th 2005.The Economist: London. Also available online at: http://www.polymervision.com/assets/downloadablefile/the-economist-june-05(2)-13010.pdf [last accessed 19/07/05]. EICTA, 2005. EICTA announces Conditions for High Definition Labeling of Display Devices. EICTA Press Release, 19th Jan. EU: Brussels. EINK, 2002. Display Readability. E Ink Corporation. Available online at: http://www.eink.com/pdf/eink_readability_02.pdf [last accessed: 18/08/05]. ETCOFF, N. 2002. Brain scans, wearables and brief encounters. The Next Fifty Years, edited by John Brockman. Weidenfeld & Nicolson: London. FAVALORA, G., NAPOLI, J., HALL, D. et al. 2002. 100 million voxel volumetric display. Cockpit Displays IX: Displays for Defense Applications, Proceedings of the SPIE 16th Annual International Symposium on Aerospace/Defense Sensing, Simulation, and Controls. Society of Photo-Optical Instrumentation Engineers: Bellingham WA, USA. FEHN, C., KAUF, P. et al. 2002. An evolutionary optimised approach on 3D TV. Proceedings of the IBC, 2002, 14th September 2002, Amsterdam, Netherlands, pp. 357–365. Also available online at: http://www.broadcastpapers.com/IBC2002/ibc2002.htm [last accessed 19/07/05]. FEHN, C., HOPF, K., QUANTE, B. 2004. Key technologies for an advanced 3D TV system. Proceedings of SPIE, Three-Dimensional TV, Video, and Display III, vol. 5599, October 2004, pp. 66-80. FIHN, M. 2002. Total Cost of Ownership: Energy Cost Considerations. Lecture Notes, Display Masters course, July 2002. http://www.displaymasters.ac.uk/ [last accessed 19/07/05]. FIHN, M., 2004. Lecture on display technologies. Public lecture given at Nottingham Trent University as part of the Display Masters MSc. Course, Nov 2004. Nottingham: UK FIHN, M. 2005. HDMI Takes off! An interview with Les Chard, President of HDMI licensing. Display Standard, May 2005. Published by Verita et Visus, Temple, Texas, USA. FOLEY, D., VAN DAM, A., FEINER, S., HUGHES, J., PHILLIPS, R. 1990. Achromatic and Colored Light. Introduction to Computer Graphics. Addison-Wesley Inc. pp. 395 – 422. FORBES, 2005. More than 200 Attend Kopin's 'Vision 2005' Event to Witness Dawn of Mobile Video Revolution. Forbes Business Wire. Also available online at: http://phx.corporate-ir.net/phoenix.zhtml?c=93548&p=irol-newsArticle&t=Regular&id=703393& [last accessed 27/07/05]. FORREST, S., BURROWS, P., THOMPSON, M. 2000. The dawn of organic electronics: Organic semiconductors are strong candidates for creating flexible, full-color displays and circuits on plastic. IEEE Spectrum, vol. 37, no. 8. (August). IEEE Spectrum magazine: New York, USA. Also available online at: http://www.spectrum.ieee.org/publicfeature/aug00/orgs.html [last accessed 19/07/05]. FOX, B. 2005. Roll-up digital displays move closer to market. New Scientist, 12th March. Reed Business Information Ltd. FRANCE TELECOM, 2004. In a bid to develop a new prototype for communicating clothing, France Telecom develops an integrated flexible screen to display animated graphics on the wearer. Company Press Release, 1st July 2004. France Telecom: Paris. Also available online at: http://www.francetelecom.com/en/financials/journalists/press_releases/CP_old/cp040701.html [last accessed 29/07/05]. FRAUNHOFER, 2005. Free2C 3D Display. Company flier published at CeBIT 2005, 9-12th March, Hannover, Germany. Fraunhofer Institute for Telecommunications: Berlin, Germany. Also available online at: http://www.hhi.fraunhofer.de/english/gf/events_archive/events2005/ev05-03/flyer/Cebit%202005%20Flyer%20-%20FREE2C.pdf [last accessed 29/07/05].
Page 41 of 53
JISC Technology & Standards Watch Advanced Display Technologies FRIEND, R., GYMER, R., HOLMES, A., BURROUGHES, J., MARKS, R. et al. 1999. Electroluminescence in conjucated polymers. Nature, vol. 397, 14th January. FRIEND, R. 2001. Conjugated polymers. New materials for optoelectronic devices. Pure and Applied Chemistry, vol. 73, no. 3, pp. 425-430. FUNADA, F., AND HIJIKIGAWA, M. 1997. Recent trend of display devices. Sharp Technical Journal, no. 1, Dec. 1997. Sharp: Japan. GOODART, J., MONTAG, B., THOMPSON, R. 2003. Industry transition to LCD Flat-panel monitors. White paper, August 2003. Dell: USA. Available at: http://www.dell.com/downloads/global/vectors/2003_flatpanel.pdf [last accessed 29/07/05]. GOODWINS, R. 2004. HP unveils paper-thin flexible screen technology. ZDNet UK, 18th. CNET Networks UK Ltd: London. Available online: http://news.zdnet.co.uk/0,39020330,39170581,00.htm [last accessed 29/07/05]. GRECO, J. 2002. Dimension Technologies' 3D monitor. Computer Graphics World, February, 2002. PennWell Corporation: USA. GROSSMAN, T., WIGDOR, D., BALAKRISHNAN, R. 2004. Multi-finger gestural interaction with 3d volumetric display. Proceedings of the 17th annual ACM symposium on User interface software and technology. Sante Fe, USA. HALLE, M. 1997. Autostereoscopic displays and computer graphics. ACM SIGGRAPH Computer Graphics, 31(2), May 1997, pp. 58–62. HEIDRICH, A., SCHWERDTNER, A., GLATTE et al. 2000. Eye Position Detection System. Stereoscopic Displays and Virtual Reality Systems VII. Proceedings of the SPIE, vol. 3957. Also available online at: http://www.stereoscopic.org/2000/contents.html [last accessed 29/07/05]. HERELD, M., JUDSON, I., PARIS, J., STEVENS, R. 2000. Developing Tiled Projection Display Systems. Proceedings of the Fourth Immersive Projection Technology Workshop. June 19-20. HOPPER, D. 1999. A vision of displays of the future. Society for Information Displays (SID) Electronic Information Displays Digest, Sandown Park, Esher, UK, Nov. 1999, quoted in: IST, 2004. HOWARD, W. 2004. Better Displays with organic films. Scientific American, Feb. 2004. Also available online at: http://www.sciam.com/article.cfm?articleID=0003FCE7-2A46-1FFB-AA4683414B7F0000&pageNumber=1&catID=2 [last accessed 02/07/05]. HUEBSCHMAN, M., MUNJULURI, B., AND GARNER, H., 2003. Dynamic holographic 3-D image projection. Optics Express, Vol. 11, No. 5. 10th March 2003. pp 437. Also available online at: http://www.opticsexpress.org/abstract.cfm?URI=OPEX-11-5-437 [last accessed: 18/08/05] HUTCHINSON, J. 2003. Plasma display panels: The colorful history of an Illinois technology. Electrical and Computing alumni news, winter 2003-2004. University of Illinois: USA. Also available online at: http://www.ece.uiuc.edu/alumni/w02-03/plasma_history.html [last accessed: 10/07/05]. IIJIMA, S. 1991. Helical microtubules of graphitic carbon. Nature. Letter published in vol. 354, 7 (November 1991). INFORMITV, 2005. Sky announces HDTV set-top box plans. Informitv News, 2nd March. Available online at: http://informitv.com/articles/2005/03/02/skyannounceshdtv/ [last accessed 29/07/05]. INSIGHT MEDIA, 2004. Personal Displays: Opportunity Analysis and Forecast 2004. Insight Media. Available online at: http://www.insightmedia.info/PersonalDisplaysRelease.htm [last accessed 29/07/05]. INSIGHT MEDIA, 2005. What is Microdisplay? Insight Media: St. Neots, Cambridgeshire, United Kingdom. Available online at: http://www.insightmedia.info/whatisamd.htm [last accessed 28/07/05]. INTILLE, S. 2002. Designing a Home of the Future. IEEE Pervasive Computing, April-June 2002, p. 76.
Page 42 of 53
JISC Technology & Standards Watch Advanced Display Technologies IEEE COMPUTER SOCIETY: Washington, DC., USA. ISHII, H., RATTI, C., PIPER, B., WANG, Y., BIDERMAN, A., BEN-JOSEPH, E. 2004. Bringing clay and sand into digital design – continuous tangible user interfaces. BT Technical Journal, vol. 22, no. 4, October 2004. Publisher: Springer Science and Business Media B.V. IST, 2004. Smart Displays in Intelligent Environments – a vision for Europe 2007+. Draft white paper, EU IST thematic priority, 23rd Dec. EU: Brussels. Forthcoming as MAISER, E. 2005. Building European OLED Infrastructure. Proceedings of SPIE, vol. 5961. IST, 2005. Technologies and Advanced materials for Kick-OFF in FED manufacturing (TAKOFF). IST Project Fact sheet. CORDIS: Luxembourg. Available online at: http://dbs.cordis.lu/fep-cgi/srchidadb?ACTION=D&CALLER=PROJ_IST&QF_EP_RPG=IST-2000-28519 [last accessed 28/07/05]. JACOBS, A., MATHER, J., WINLOW, R., MONTGOMERY, D., JONES, G., et al. 2003. 2D/3D Switchable Displays. Sharp Laboratories of Europe, Ltd: Oxford, UK. Available online: http://sharp-world.com/corporate/rd/tj4/pdf/4.pdf [last accessed 28/07/05]. JISC. 2004. JISC Visualization Foundation Study. JISC: Bristol, UK. Available online at: http://www.jisc.ac.uk/index.cfm?name=project_visualization [last accessed 28/07/05]. JISC TECHDIS, 2005. Technology Topics: Monitors / Display Screens. JISC TechDis. Available online at: http://new.techdis.ac.uk/index.php?id=29&p=9_20040610041054 [last accessed 01/08/05]. JOHANSON, B., FOX, A., WINOGRAD, T. 2002. The Interactive Workspaces Project: Experiences with Ubiquitous Computing Rooms. IEEE Pervasive Computing, Special Issue on Overviews of Real-World Ubiquitous Computing Environments, April-June 2002, vol. 1, no. 2, pp.67-74. JOHNSON, B., NORRIS, A. 2005. TV on a high – by definition. The Guardian, 14th April. Guardian Newspapers Limited: Manchester, UK. JONIETZ, E. 2004. Demo: Holographic TV. MIT Technology Review, June 2004. JTAP, 2000. JTAP Project 305: Human Factors Aspects of Virtual Design Environments in Education: Project Report. JISC Technologies Applications Programme. Available online at: http://www.avrrc.lboro.ac.uk/JTAP305FinalReport.PDF [last accessed 21/07/05]. KRAZIT, T. 2004. Intel Switches Off LCOS TV Chip. PC World. Available online at: http://www.pcworld.com/news/article/0,aid,118289,00.asp [last accessed 19/07/05]. LEWIS, J. 2005. In the eye of the beholder. IEEE Spectrum, 13th May. IEEE: New York, USA. LUCENTE, M. 1996. Computational holographic bandwidth compression. IBM Systems Journal, vol. 35, nos 3 & 4, 1996. LUCENTE, M. 1997. Interactive three-dimensional holographic displays: seeing the future in depth. SIGGRAPH's Computer Graphics, special issue on `Current, New, and Emerging Display Systems', May 1997. KALLENDER, P. 2005. Toshiba, Canon Bet on New Flat-Panel TV Technology. PC World, 31st May. PC World Communications: San Francisco, USA. Also available online at: http://www.pcworld.com/resource/article/0,aid,121083,pg,1,RSS,RSS,00.asp [last accessed 19/07/05]. KANELLOS, M. 2002. Sharp's 3D Monitors: look no glasses. ZDNet, Dec 19. CNET Networks, Inc. Available online at: http://news.zdnet.com/2100-9584_22-978499.html [last accessed 19/07/05]. KANELLOS, M. 2005. Carbon TVs to edge out liquid crystal and plasma? CNET News.com, Jan 6th. Available at: http://news.com.com/Carbon+TVs+to+edge+out+liquid+crystal,+plasma/2100-1041_3-5512225.html [last accessed 18/07/05]. KATZMAIER, D. 2005. Rear-projection TVs: CRT, DLP, LCD, and LCoS. CNET’s quick guide to TV types, Available online at: http://reviews.cnet.com/4520-6463_7-5023901-4.html [last accessed:
Page 43 of 53
JISC Technology & Standards Watch Advanced Display Technologies 10/07/05]. KIMMEL, J., HAUTANEN J., AND LEVOLA, T. 2002. Display Technologies for Portable Communication Devices. Proceedings of IEEE, vol. 90, no. 4, (April). IEEE: New York, USA. KODAK, 2005. What is OLED? Kodak website. Available online at: http://www.kodak.com/eknec/PageQuerier.jhtml?pq-path=1473/1481/1489&pq-locale=en_US [last accessed 28/07/05]. KOLB, H., FERNADEZ, E., NELSON, R. 2005. Webvision: the organisation of the retina and visual system. John Moran Eye Centre, the University of Utah: Utah, USA. Available online at: http://webvision.med.utah.edu/ [last accessed 29/07/05]. KOLLIN, J. 1993. A Retinal Display for Virtual-Environment Applications. Proceedings of Society for Information Display, International Symposium, Digest of Technical Papers, vol. XXIV. Society for Information Display: Playa del Rey, CA. p. 827. KRIDEL, 2004. Think Small. ProAV magazine, December 2004. ProAV magazine: KS, USA. LANTZ, E., SPITZ, I. 1997. Future Directions in Visual Display Systems. Computer Graphics (ACM), vol.31, issue 2, (May), p. 38. ACM Press: NY, USA. LEMON, S. 2004. Flexible future in store for Flat Panel Displays. Australian PC World, 2nd August. Also available online: http://www.pcworld.idg.com.au/index.php/id;754092846;fp;2;fpid;1 [last accessed 29/07/05]. LI, K., HIBBS, M., WALLACE, G., TROYANSKAYA, O. 2005. Dynamic Scalable Visualization for Collaborative Scientific Applications. Proceedings of the 19th IEEE International Parallel and Distributed Processing Symposium (IPDPS '05), Workshop 10, Volume 11. LI, K., CHEN, H., CHEN, Y., CLARK, D. et al. 2000. Building and Using a scalable display wall system. IEEE Computer Graphics and Applications. July/Aug 2000. LIEBERMAN, D. 2003. Emissive Displays Shine On. Information Display, no. 9. LONG, P. AND EHRMANN, S. 2005. Future of the learning space: breaking out of the box. EduCause Review, vol. 40, no. 4 (July/August 2005), pp. 42–58. MANN, C. 2004. Nanotech on display. Technology Review. vol. 107, issue 9. November 2004. MIT: Cambridge, MA, USA. MANN, R., WILLIAMS, R., ATKINSON, M., BRODLIE, K., STORKEY, A., WILLIAMS, C. 2003. Scientific Data Mining, Integration, and Visualization. Report of the workshop held at the e-Science Institute, Edinburgh, 24-25th October 2002. National e-science centre: Edinburgh, United Kingdom. MCALLISTER, D. 2005. Display Technology: Stereo & 3D Display Technologies. In: Hornak, J. 2005. Wiley Encyclopaedia on Imaging Science and Technology. Wiley Interscience: Bognor Regis, West Sussex, UK, pp. 1327-1344. MCCRAW, D. 2005. Commercialization of Nanotechnology in Nano Emissive Displays. NanoTech 2005 conference, 8th-12th May 2005, Anaheim, California, U.S.A. Presentation by Motorola Labs. MCQUAIDE, S., SEIBEL, E., BURSTEIN, R., FURNESS, T. 2002. Three-dimensional virtual retinal display system using a deformable membrane mirror. Proceedings of Society for Information Display (SID ’02), 19th – 24th May 2002, Boston, USA. Also available online from the Human Interface Technology Lab at: http://www.hitl.washington.edu/publications/r-2002-13/r-2002-13.pdf [last accessed 29/07/05]. MILBOURN, E. 2005. Ed's view - The New Kid On The Block. HDTV Magazine, 11th August. Available online at: http://www.hdtvmagazine.com/articles/2005/08/eds_view_-_the_1.php?page=1 [last accessed 12/07/05].
Page 44 of 53
JISC Technology & Standards Watch Advanced Display Technologies MILNTHORPE, G., MCCORMICK, M., AGGOUN, A., ET AL. 2002. Computer Generated Content for 3D TV Displays. International Broadcasting Convention, Amsterdam, 2002. MOLYNEAUX, D., KORTUEM, G. 2004. Ubiquitous Displays in dynamic environments: Issues and Opportunities. Proceedings of UbiComp 2004, Nottingham, UK. MOKHOFF, N. 2003. Display technology advances light up SID show. EETimes Online, 22nd May. CMP Media LLC: New York, USA. MONCKTON, P. 2005. Big screen celebrities. Personal Computer World, September 2005. VNU Business Publications: London. MORELAND, K., THOMPSON, D., 2003. From Cluster to wall with VTK. Proc. of IEEE Symposium on Parallel and Large-scale Visualization and Graphics (2003), pp. 25-32. MURRAY, C. 2004. Heads-up Displays get second chance. EE Times, 5th Jan. CMP Electronics Group: NY MAZZUCHELLI, 2005. Private e-mail interview with author, 31st May 2005. NATIONAL RESEARCH COUNCIL, 2002. Preparing for the Revolution: Information Technology and the Future of the Research University. Report by the Panel on the impact of Information Technology on the Future of the Research University. The National Academies Press: Washington, D.C. NAYAK, A., VERNON, F., KENT, G., ORCUTT, J., KILB, D., NEWMAN, R., et al. 2004. High resolution visualization of US Array data on a 50 megapixel display using OptIPuter technologies. Eos Transactions of the AGU, 85(47), Fall Meet. Suppl., Abstract SF13A-0702, San Francisco, California. American Geophysical Union (AGU): Washington, DC., USA. Also available online at: http://www.evl.uic.edu/core.php?mod=4&type=3&indi=264 [last accessed 19/07/05]. NEC, 1999. LCD multi-resolution white paper. NEC Technologies Personal Display Division. NEC Display Solutions of America Inc.: USA. Available online at: http://www.necdisplay.com/products/downloads/nec/lcdrsltn.pdf [last accessed 29/07/05]. NEC, 2005. Monitor Technology Guide. NEC Display Solutions of America Inc.: USA. Available online at: http://www.necdisplay.com/support/css/monitortechguide/index05.htm [last accessed 29/07/05]. NEUMANN, Z. 2004. Visual impairment and technology. In: Access all areas: disability, technology and learning, edited by PHIPPS, L., SUTHERLAND, A., SEALE, J., Published by JISC TechDis: York. p.16. NEWBY, H. 2004. Looking to the future: an interview with Howard Newby, Chief Executive, HEFCE. JISC Inform, Issue 8, winter 2004. JISC: Bristol, UK. NIELSEN, E. 2005. Private conversation with Erik Nielsen. SeeReal Technologies GmbH. Blasewitzer Strasse 43, 01307 Dresden, Germany. 30th May 2005. OLED INFO, 2005. OLED – Organic, Light. Emitting Diode. OLED Info Website. Available online: http://www.oled-info.com/introduction.html [last accessed 28/07/05]. OPTICALITY, 2005. Gargantuan 3D Display Introduced at the 2005 World Exposition, Aichi, Japan. Company press release, 12th April. Available online at: http://www.opticalitycorporation.com/news/press_2005-12-04_worldexpo.html [last accessed 28/07/05]. OTAMI, T. 2004. Canon, Toshiba reveal SED with contrast ratio of 8,000:1. NE Asia, December 2004. Nikkei electronic Asia: Japan. PATENT OFFICE, 2004. Vixlim. TRADE MARK 2368596. UK Patent Office: Newport, South Wales, UK. Also available online at: http://webdb4.patent.gov.uk/tm/number?detailsrequested=C&trademark=2368596 [last accessed 21/07/05]. PATSURIS, P. 2004. Wearable Wireless Displays Are In Sight. Forbes magazine, 5th July. Forbes Magazine: New York, USA. As available online at:
Page 45 of 53
JISC Technology & Standards Watch Advanced Display Technologies http://www.forbes.com/infoimaging/2004/05/07/cx_pp_0507microdisplay_ii.html [last accessed: 27/07/05]. PC WORLD, 2003. Buying Guide to LCD displays. PC World magazine. Ziff Davis Publishing Holdings Inc. Available online at: http://www.pcmag.com/article2/0,1759,1457239,00.asp [last accessed: 29/07/05]. PHANTOMS, 2002. Members Highlights 1: Electronic Devices Group, Department of Engineering, University of Cambridge. Phantoms, Issue 4, Jan 2004. CMP Cientifica: Madrid, Spain. PHILIPS, 2001. Materials Research for New Displays. Philips Password, issue 10, October. Philips Research Public Relations Dept: Eindhoven, the Netherlands. PHILIPS, 2004. Polymer OLED displays. Philips Research Password 20, July 2004. Philips Research Public Relations Dept: Eindhoven, the Netherlands. Also available online at: http://www.research.philips.com/password/archive/20/downloads/PW20_PoyLED.pdf [Last accessed 20/07/05]. PHILIPS, 2005. Technical information on 3-D LCD: 3-D display so real you can almost touch it. Philips Research Technologies. Philips: Netherlands. Available online at: http://www.research.philips.com/technologies/display/3d/technical.html [Last accessed 20/07/05]. PHILIPS, 2005b. Philips 3D information display solution adds extra dimension to in-store messaging. Company Press Release, 23rd May 2005. Available online at: http://www.business-sites.philips.com/3dsolutions/news/article-14704.html [last accessed 20/07/05]. PHILIPS, 2005c. Ambilight Television. Philips Research Password, no. 22, Feb. 2005. Philips: Netherlands. PINGALI, G., PINHANEZ, C., LEVAS, T., KJELDSEN, R., PODLASECK, M. 2002. User-following Displays. Proceedings of the IEEE International Conference on Multimedia and Expo, ICME '02, 26th-29th August 2002, Lausanne, Switzerland. PODLASECK, M., PINHANEZ, C., ALVARADO, N, CHAN, M, DEJEUS, E., 2003. On Interfaces Projected onto Real world objects. Proceedings of Human Factors in Computing Systems (CHI), April 5th-10th, 2003, Fort Lauderdale, Florida, USA. POYNTON, C., 1998. Frequently Asked Questions about Gamma. Charles Poynton: Canada. Available online at: http://www.poynton.com/PDFs/GammaFAQ.pdf [last accessed 29/07/05]. PUTMAN, P. 2005. Display Wars: Flat Panels 2005. InfoComm 2005, June 4-10th 2005, Las Vegas, USA. Available online at: http://www.hdtvmagazine.com/articles/2005/06/infocomm_2005_b.php [last accessed 02/08/05]. PROPHET, G. 2003. Thin, flat, and low power: The ideal display is (still) just around the corner. EDN Europe, 4th March 2003. Available online at: http://www.edn.com/article/CA287378.html [last accessed 15/08/05]. RADLO, N. 2004. Report: IBC 2004. IBC, no. 300, Oct 2004. Available online at: http://www.ebu.ch/trev_300-ibc-2004.html [last accessed 29/07/05]. RHEINGOLD, H. 1991. Reality on your retina. Virtual Reality. Secker & Warburg Limited: London. pp. 193-202. SEEREAL, 2005. SeeReal Advances 3D Technology with Highest resolution 3D Display at CEBIT. Company Press Release, 10th March 2005. SeeReal Technologies GmbH: Dresden, Germany. SCHMIDT, A., BEIGL, M., GELLERSEN, H. 1998. There is more to context than location. Proceedings of the International workshop on Interactive Applications of Mobile Computing (IMC '98), Rostock, Germany, November 1998. SCHMIDT, R., PENNER, E., CARPENDALE, S. 2004. Reconfigurable Displays. Workshop on Ubiquitous display environments. UbiComp 2004, Nottingham, UK.
Page 46 of 53
JISC Technology & Standards Watch Advanced Display Technologies SHARP. 2002. Sharp Develops LCD Switchable Between 2D and 3D Viewing. Sharp Company Press Release, September 27th 2002. Sharp Laboratories of Europe Limited: Oxford, UK. SHARP, 2005. LL-151-3D 15'' XGA LCD Monitor: 3D Display Monitor Without the Need For Special Glasses. Company Brochure. Sharp Systems of America: USA. Available online at: http://www.sharpsystems.com/products/lcd_monitors/15-17_inch/ll-151-3d/ [last accessed 27/07/05]. SIDEBOTTOM, S. 1997. Effects of Illumination and Viewing Angle on the Modeling of Flicker Perception in CRT Displays. MSc Thesis. Virginia Polytechnic Institute and State University: USA. Also available online at: http://scholar.lib.vt.edu/theses/available/etd-4229173039731191/unrestricted/flicker.pdf [last accessed 27/07/05]. SINGER, M. 2005. Toshiba readies SED panel rollout. CNET News.Com. June 2nd 2005. http://news.com.com/Toshiba+readies+SED+panel+rollout/2110-1041_3-5730081.html [last accessed: 28/07/05]. SONEIRA, R. 2005. Display Technology Shoot-out: Comparing CRT, Plasma, LCD, DLP Displays. DisplayMate. Technologies Corp: USA. Available online at: http://www.displaymate.com/ShootOut_Part_1.htm [last accessed 29/07/05]. SPOONER, J. 2002. Video wall displays fantastic 3D voyage. CNET News.com, Published by ZDNet. Available online at: http://news.zdnet.com/2100-9584_22-922239.html [last accessed 20/07/05]. STONE D. 2001. Colour Matching. Extreme Tech, June 11, 2001. ExtremeTech: USA. http://www.extremetech.com/article2/0,1558,15467,00.asp [last accessed: 29/07/05]. STREITZ, N., PRANTE, T., RÖCKER, C., VAN ALPHEN, D., MAGERKURTH, C., STENZEL, R., PLEWE, D. 2003. Ambient displays and mobile devices for the creation of social architectural spaces. In K. O'Hara et al. (eds.), Public and Situated Displays: Social and Interactional Aspects of Shared Display Technologies, Chapter 16, pp. 387-409. Kluwer Academic Publisher: Netherlands. SULLIVAN, A., 2005. 3-deep: New displays render images you can almost reach out and touch. IEEE Spectrum, April 2005. IEEE: New York, USA. TAE-GYU, K., 2004. Korea to Develop Next-Generation Display. Korea Times, Oct 5th. Korea Times: Seoul, Republic of Korea. Also available online at: http://times.hankooki.com/lpage/tech/200405/kt2004050917151111780.htm [last accessed 18/07/05]. TAYLOR, B. 2002. The route to low-cost wall-TV demonstrated. IDW '02, 9th International Display Workshop, 4-9th December, 2002. Hiroshima, Japan. TECHNOLOGY REVIEW, 2005. Advanced Materials on Display. Technology Review, Vol. 108, No. 8, August 2005. MIT: Cambridge, MA., USA. THORPE, V., ASTHANA, A. 2005. In this school, the classroom revolution is now a reality – all 360 degrees of it. The Observer, 27th February, 2005. p.13. TRECC, 2005. Optical Race. Company newsletter, March 2005. Technology Research, Education, and Commercialization Center (TRECC), University of Illinois at Urbana-Champaign, USA. Available online at: http://www.trecc.org/newslink/0503optiputer.php [last accessed 28/07/05]. UNDERWOOD, I. 2000. A review of microdisplay technologies. Conference keynote paper presented at the annual conference of the UK and Ireland Chapter of SID, London, 21st Nov. 2000. Also available online at: http://www.see.ed.ac.uk/~slm/pdf_papers/EID2000.pdf?http://oldeee.see.ed.ac.uk/~slm/pdf_papers/EID2000.pdf [last accessed 23/07/05]. UNIVERSITY OF CAMBRIDGE, 2005. Personal Projected Displays. Computer Laboratory Rainbow Research Group Website, The University of Cambridge. http://www.cl.cam.ac.uk/Research/Rainbow/escritoire.html [last accessed 29/07/05].
Page 47 of 53
JISC Technology & Standards Watch Advanced Display Technologies VALENTI, M. 2002. Creating the classroom of the future. EduCause Review, vol. 37, September/October VERITAS, 2005. Polymer Vision shows working model of its rollable display. Flexible Substrate (report on SID 2005). Veritas et Visus: Texas, USA. VERITAS, 2005b. Arizona State University and Fakespace collaborate on “Decision Theater”. 3rd Dimension, vol. 1, no. 1, June 2005. Veritas et Visus: Texas, USA. VESA, 2005. VESA Announces Plan to Develop New Digital Display Interface Standard. VESA Company Press Release, 9th May 2005. Available at: http://www.vesa.org/press/displayportpr.htm [last accessed 21/07/05]. WAGNER, E. 2005. Enabling mobile learning. EduCause Review, vol. 40, No. 3, May/June 2005. WAVE REPORT, 2005. Organic Light-Emitting Diode (OLED) technology. Wave Report. 4th Wave, Inc.: Alexandria, VA. Also available online at: http://www.wave-report.com/tutorials/oled.htm [last accessed 21/07/05]. WEI, B., SILVA, C., KOUTSOFIOS, E., KRISHNAN, S., NORTH, S. 2000. Visualization Research with Large Displays. IEEE Computer Graphics and Applications. July/Aug 2000. IEEE: New York, USA. WHAT PLASMA, 2005. Philips 15PF9936. What Plasma & LCD TV magazine, issue 13, June 2005, page 23. Highbury House Communications plc: London. WHAT PLASMA, 2005b. Plasma vs LCD: which is right for you? What Plasma and LCD TV magazine, Issue 13, June 2005. Highbury House Communications plc: London. WHAT PLASMA, 2005c. BenQ pulls a fast one. What Plasma & LCD TV magazine, issue 13, June, page 9. WHICH? 2005. Full Screen Ahead. Which? Computer, Jan 2005. Which?: London. WHITE ROSE GRID, 2003. gViz – Visualization Middleware for e–Science. The White Rose Grid, leaflet, available online at: http://www.wrgrid.org.uk/leaflets/gViz.pdf [last accessed 28/07/05]. WILLAMS, M. 2004. Sony's TV Plans take shape. PC World, 20th August 2004. PC World Communications: San Francisco, USA. Also available online: http://www.pcworld.com/news/article/0,aid,117485,00.asp [last accessed 29/07/05]. WILSON, R. 2003. Displaying Digital Information on Paper-like Devices. JISC Technology & Standards Watch, TSW0301, Jan 2003. JISC: Bristol, UK. Available online at: http://www.jisc.ac.uk/index.cfm?name=techwatch_report_0301 [last accessed 17/07/05]. WILSON, R. 2005. Amorphous silicon OLED for TV. Electronics Weekly. 3rd June 2005. Reed Business Information Limited: Sutton, UK. Available online at: http://www.electronicsweekly.com/articles/article.asp?liArticleID=39837&liArticleTypeID=1&liCategoryID=1&liChannelID=107&liFlavourID=1&sSearch=&nPage=1 [last accessed 28/07/05]. WISNIEFF, R., RITSKO, J. 2000. Electronic displays for information technology. IBM Journal of Research and Development, vol. 44, no. 3, May 2000. IBM Technical Journals: Yorktown Heights, NY. WOODS, R., WOOD, J. 1995. The role of contrast sensitivity charts and contrast letter charts in clinical practice. Clinical and Experimental Optometry, vol. 78.2, March-April 1995. Optometrists Association Australia: South VIC 3053, Australia. YEATES, H. 2005. Good going on flat. Electronics Weekly, 22nd July. Reed Business Information Limited: Sutton, UK. Also available online at: http://www.electronicsweekly.com/Articles/2005/07/22/35871/Goodgoingontheflat.htm [last accessed 17/0705]. YOUNG, B., 2004. Small displays, big market, growing opportunities. Display Trends, Fall/Winter 2004/5. Published by USDC (United States Display Consortium).
Page 48 of 53
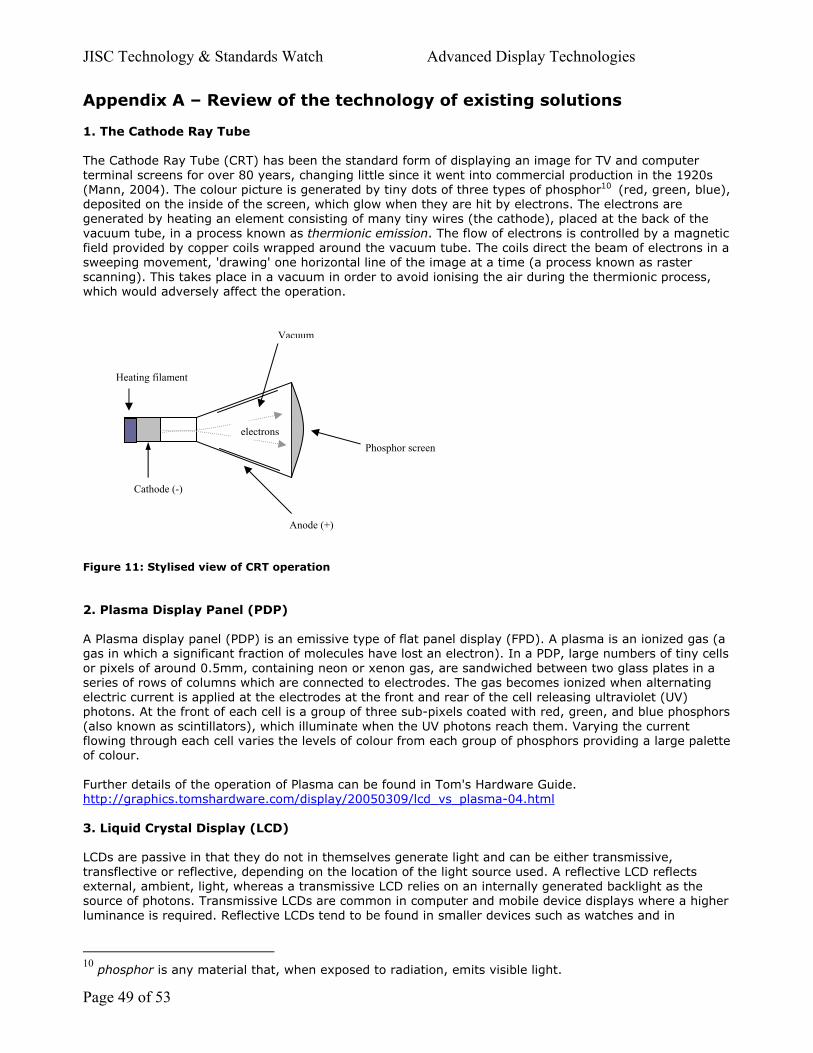
JISC Technology & Standards Watch Advanced Display Technologies
Appendix A – Review of the technology of existing solutions 1. The Cathode Ray Tube The Cathode Ray Tube (CRT) has been the standard form of displaying an image for TV and computer terminal screens for over 80 years, changing little since it went into commercial production in the 1920s (Mann, 2004). The colour picture is generated by tiny dots of three types of phosphor10 (red, green, blue), deposited on the inside of the screen, which glow when they are hit by electrons. The electrons are generated by heating an element consisting of many tiny wires (the cathode), placed at the back of the vacuum tube, in a process known as thermionic emission. The flow of electrons is controlled by a magnetic field provided by copper coils wrapped around the vacuum tube. The coils direct the beam of electrons in a sweeping movement, 'drawing' one horizontal line of the image at a time (a process known as raster scanning). This takes place in a vacuum in order to avoid ionising the air during the thermionic process, which would adversely affect the operation.
Cathode (-)
Heating filament
Figure 11: Stylised view of CRT 2. Plasma Display Panel (PD A Plasma display panel (PDP) isgas in which a significant fractior pixels of around 0.5mm, conseries of rows of columns whichelectric current is applied at thephotons. At the front of each ce(also known as scintillators), wflowing through each cell variesof colour. Further details of the operationhttp://graphics.tomshardware. 3. Liquid Crystal Display (LC LCDs are passive in that they dtransflective or reflective, depeexternal, ambient, light, wheresource of photons. Transmissivluminance is required. Reflectiv
Page 49 of 53
10 phosphor is any material tha
Vacuum
electrons Phosphor screenAnode (+)
operation
P)
an emissive type of flat panel display (FPD). A plasma is an ionized gas (a on of molecules have lost an electron). In a PDP, large numbers of tiny cells taining neon or xenon gas, are sandwiched between two glass plates in a are connected to electrodes. The gas becomes ionized when alternating electrodes at the front and rear of the cell releasing ultraviolet (UV) ll is a group of three sub-pixels coated with red, green, and blue phosphors
hich illuminate when the UV photons reach them. Varying the current the levels of colour from each group of phosphors providing a large palette
of Plasma can be found in Tom's Hardware Guide. com/display/20050309/lcd_vs_plasma-04.html
D)
o not in themselves generate light and can be either transmissive, nding on the location of the light source used. A reflective LCD reflects as a transmissive LCD relies on an internally generated backlight as the e LCDs are common in computer and mobile device displays where a higher e LCDs tend to be found in smaller devices such as watches and in
t, when exposed to radiation, emits visible light.
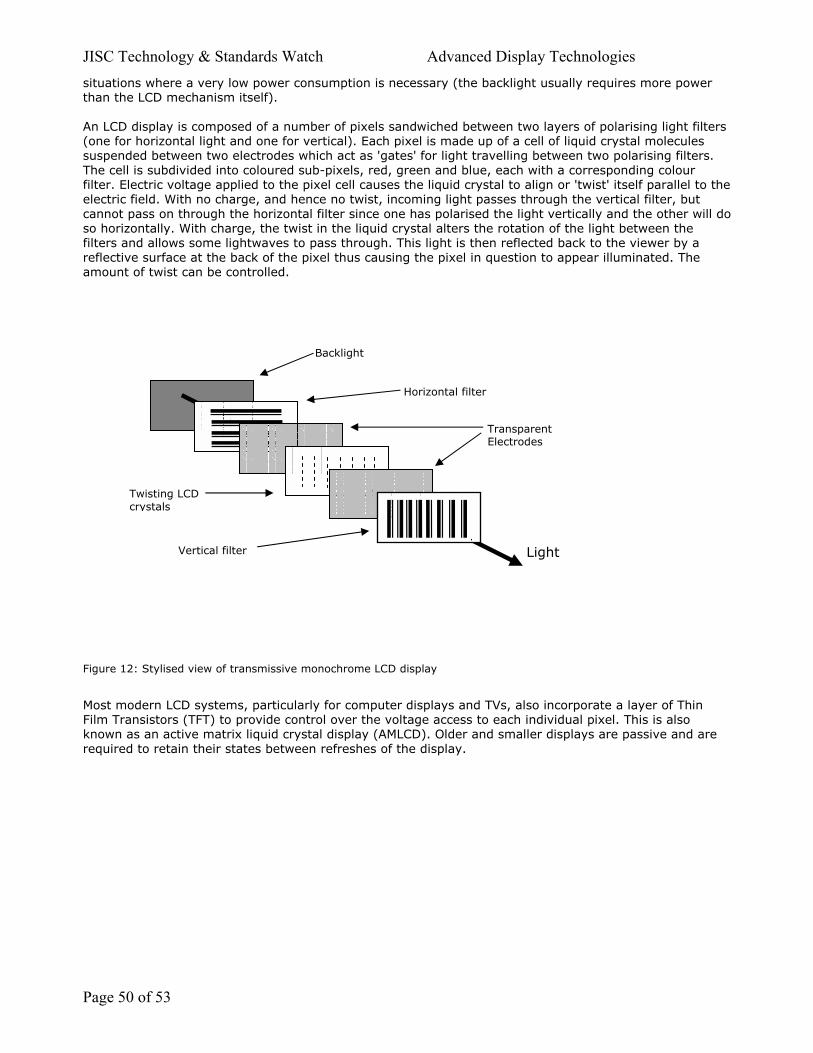
JISC Technology & Standards Watch Advanced Display Technologies situations where a very low power consumption is necessary (the backlight usually requires more power than the LCD mechanism itself). An LCD display is composed of a number of pixels sandwiched between two layers of polarising light filters (one for horizontal light and one for vertical). Each pixel is made up of a cell of liquid crystal molecules suspended between two electrodes which act as 'gates' for light travelling between two polarising filters. The cell is subdivided into coloured sub-pixels, red, green and blue, each with a corresponding colour filter. Electric voltage applied to the pixel cell causes the liquid crystal to align or 'twist' itself parallel to the electric field. With no charge, and hence no twist, incoming light passes through the vertical filter, but cannot pass on through the horizontal filter since one has polarised the light vertically and the other will do so horizontally. With charge, the twist in the liquid crystal alters the rotation of the light between the filters and allows some lightwaves to pass through. This light is then reflected back to the viewer by a reflective surface at the back of the pixel thus causing the pixel in question to appear illuminated. The amount of twist can be controlled.
Backlight
Horizontal filter
Transparent Electrodes
Twisting LCD crystals
Light Vertical filter
Figure 12: Stylised view of transmissive monochrome LCD display
Most modern LCD systems, particularly for computer displays and TVs, also incorporate a layer of Thin Film Transistors (TFT) to provide control over the voltage access to each individual pixel. This is also known as an active matrix liquid crystal display (AMLCD). Older and smaller displays are passive and are required to retain their states between refreshes of the display.
Page 50 of 53
JISC Technology & Standards Watch Advanced Display Technologies
Appendix B – further notes on projection systems There are two classes of projection system: rear and front. In front projection an image is beamed from a projector onto a screen in the same manner as at a cinema. In rear projection, images are projected from behind onto a translucent screen from an integrated display projector. Rear Projection and RPTV The technologies used to handle rear projection (also known as RPTV) include CRT and the microdisplay technologies (DLP, LCoS, LCD). A chart offering a comparison of these technologies is available at: http://www.theprojectorpros.com/learn.php?s=learn&p=rear_screen_pros_and_cons. RPTV is widely used in scenarios where ambient daylight is present, for example, in travel information displays or a display showing a looped video in a university careers centre. They are less likely to be used in lecture theatre settings where ambient light can be controlled through darkening the room. RPTV, particularly DLP-based, has been marketed as a cheaper alternative to Plasma-based displays. CRT-based RPTV, available at sizes up to 61 inches, offers high quality and natural colour, but can exhibit some lack of brightness and suffer, in the long term, from screen burn-in. The DLP systems are also better for situations where they will be used around the clock and, according to Texas Instruments, offer a better lifespan than LCD. They offer a fixed, standard TV display resolution (720 x 576 lines) and, for this reason, are increasingly seen by commentators as unsuitable in the long term, as the move towards digital HD video and TV gets underway (Home Cinema, 2005). Front Projection Much favoured by home cinema buffs and widely used in lecture theatre settings, this technique involves projecting from a separate projector onto a screen. It provides the advantage of high picture quality, with high-end systems offering comparable quality to that of a traditional cinema. The obvious drawbacks include the need for space – at least a few metres between the screen and projection system - and difficulties displaying well in the presence of ambient light. Projectors for these systems can be based on LCD, DLP or LCoS technologies. Resolutions vary from 854 x 480 to 1400 x 1050. In recent years this market segment has been dominated by the popular LCD-based systems, but DLP is the fastest growing technology in the segment. LCD projectors are small, portable and reasonably priced, and have offered sufficient picture quality for most educational and business applications. As with LCD TV such projectors exhibit some problems with true black display and response times for motion. They offer reasonable brightness levels of around 8,000 lumens. DLP projectors, although more expensive, offer high picture quality and are also small and portable. However, there are cheaper, lower specification DLP -based projectors on the market and these can suffer from a 'rainbow' effect due to the performance of the internal colour wheel and cannot offer the brightness levels of other solutions (typically less than 3200 lumens). By contrast, higher end, three chip, DLP projectors offer brightness levels of up to 15,000 lumens. DLP projectors typically offer resolutions of 1280 x 720. It is also worth noting here, that sophisticated display projectors (for example, the Epson EMP8300), also known as Beamers, with the specification to cope with large venues and outdoor, public presentation are coming into the market. As an example, Nottingham Trent University are currently running short courses to train artists in the use of such public display technology for public arts and educational events (NTU, 2005).
CRT-based Projection
CRT-based projection systems use the same basic tube technology as a CRT TV or computer monitor. Such systems offer high quality, natural colours and good reproduction of black and darker colours, at a reasonable cost – although they can suffer from a lack of brightness. The resolution provided is the UK TV standard of 720 x 576 lines (576i). LCD-based Projection This is currently the most popular technology in both front and rear projection systems. LCD projection uses a microdisplay-based transmissive system in which a beam of light is split into the three primary colours (red, green, blue) and passed through three liquid crystal panels each of which is sub-divided into
Page 51 of 53
JISC Technology & Standards Watch Advanced Display Technologies sub-cells that control each pixel of the final, projected, image. The three beams pass through the LCD gates (as with LCD TV) and then through a trichroic prism, which recombines the three colours. The light is then passed through the projector's main lens and out of the projector. See http://www.3lcd.com/eg/ftr_ts_e.html for a diagram and further explanation.
DLP-based Projection
These projection systems make use of Texas Instrument's proprietary optical semiconductor which consists of two million tiny mirrors, each controlling one pixel of the display (see www.dlp.com for a Flash movie explaining the concepts). The mirrors tilt into 'on' and 'off' positions in a series of rapid movements. Red, green and blue coloured light, generated by a spinning colour-wheel, is passed through the optical chip. The mirrors that are turned 'on' for a particular pixel allow the light for that particular pixel to pass through. Shades of colours are produced by reducing the time the mirror is 'on', thereby tricking the eye into believing there is less of the colour in question. Standard DLP projector systems use a single DLP , but for larger venues and cinema, a three chip version is available.
Liquid Crystal on Silicon (LCoS) Projection
This is another reflective, microdisplay technology in which liquid crystals, bonded to a silicon block coated with an aluminiumized reflective layer, act as gates to block/unblock reflected light. Similar technologies are D-ILA and Sony's Silicon X-tal Reflective Display (SXRD) (Williams, 2005). This technology was viewed as having potential for Rear Projection TV and other displays (PC Magazine, 2004), but there has been some uncertainty following announcements at the end of 2004 that Intel and Philips would pull out of its development (Krazit, 2004). Canon, Sony and JVC remain committed, but the technology is still expensive and not widely available to date. References for appendix B HOME CINEMA, 2005. Home Cinema, issue 18, July 2005, p. 132. KRAZIT, T. 2004. Intel Switches Off LCos TV Chip. PC World, 21st October 2004. Available online at: http://www.pcworld.com/news/article/0,aid,118289,00.asp [last accessed: 18/08/05]. NTU, 2005. Creative Collaborations, course website and blog: http://creativecollaborations.blogspot.com/. PC MAGAZINE, 2004. LCOS: now showing on TV. PC Magazine, 5th April 2004. Available online at: http://www.pcmag.com/article2/0,1759,1566120,00.asp [last accessed: 18/08/05] WILLIAMS, M. 2005. Sony Bets on SXRD Projector Technology. PC World, 7th Jan 2005. Available online at: http://www.pcworld.com/news/article/0,aid,119206,00.asp [last accessed 25/07/05].
Page 52 of 53
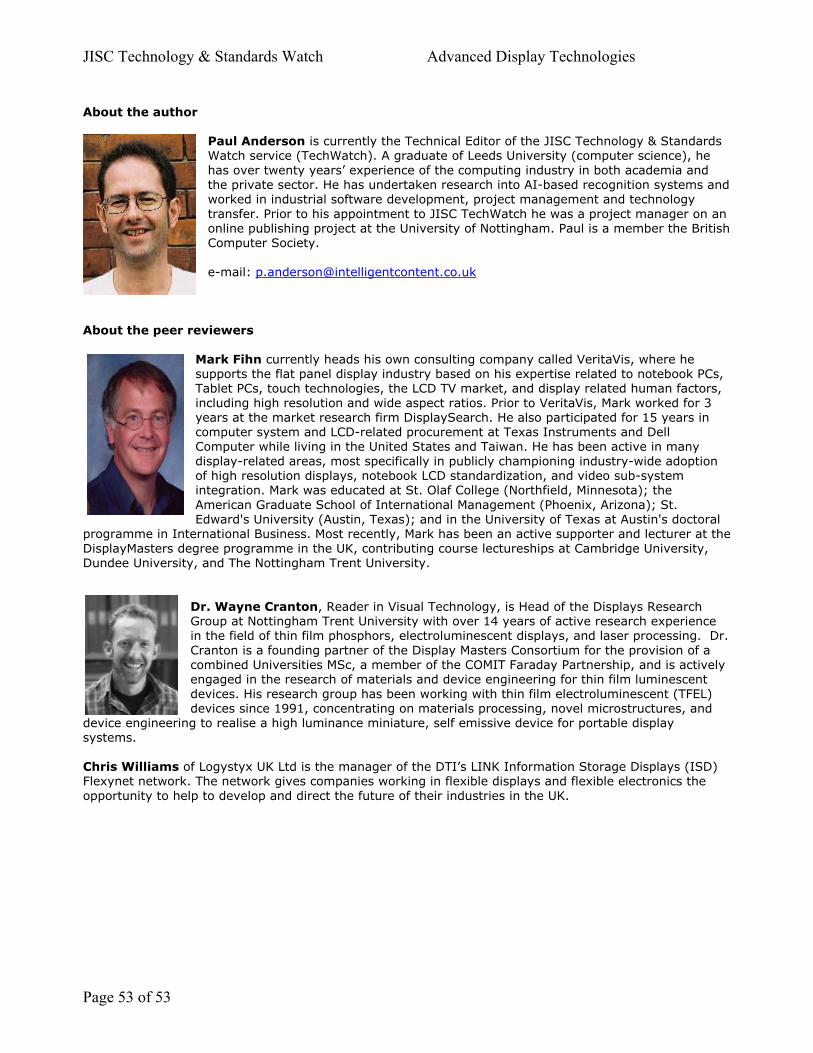
JISC Technology & Standards Watch Advanced Display Technologies
Page 53 of 53
About the author
Paul Anderson is currently the Technical Editor of the JISC Technology & Standards Watch service (TechWatch). A graduate of Leeds University (computer science), he has over twenty years’ experience of the computing industry in both academia and the private sector. He has undertaken research into AI-based recognition systems and worked in industrial software development, project management and technology transfer. Prior to his appointment to JISC TechWatch he was a project manager on an online publishing project at the University of Nottingham. Paul is a member the British Computer Society. e-mail: [email protected]
About the peer reviewers
Mark Fihn currently heads his own consulting company called VeritaVis, where he supports the flat panel display industry based on his expertise related to notebook PCs, Tablet PCs, touch technologies, the LCD TV market, and display related human factors, including high resolution and wide aspect ratios. Prior to VeritaVis, Mark worked for 3 years at the market research firm DisplaySearch. He also participated for 15 years in computer system and LCD-related procurement at Texas Instruments and Dell Computer while living in the United States and Taiwan. He has been active in many display-related areas, most specifically in publicly championing industry-wide adoption of high resolution displays, notebook LCD standardization, and video sub-system integration. Mark was educated at St. Olaf College (Northfield, Minnesota); the American Graduate School of International Management (Phoenix, Arizona); St. Edward's University (Austin, Texas); and in the University of Texas at Austin's doctoral
programme in International Business. Most recently, Mark has been an active supporter and lecturer at the DisplayMasters degree programme in the UK, contributing course lectureships at Cambridge University, Dundee University, and The Nottingham Trent University.
Dr. Wayne Cranton, Reader in Visual Technology, is Head of the Displays Research Group at Nottingham Trent University with over 14 years of active research experience in the field of thin film phosphors, electroluminescent displays, and laser processing. Dr. Cranton is a founding partner of the Display Masters Consortium for the provision of a combined Universities MSc, a member of the COMIT Faraday Partnership, and is actively engaged in the research of materials and device engineering for thin film luminescent devices. His research group has been working with thin film electroluminescent (TFEL) devices since 1991, concentrating on materials processing, novel microstructures, and g to realise a high luminance miniature, self emissive device for portable display
systems. device engineerin
Chris Williams of Logystyx UK Ltd is the manager of the DTI’s LINK Information Storage Displays (ISD) Flexynet network. The network gives companies working in flexible displays and flexible electronics the opportunity to help to develop and direct the future of their industries in the UK.