ADOPTED FORMAT OF BUDGET 2017 Laois County Council · Rents from Houses 5,409,000 Housing Loans...
35
ADOPTED FORMAT OF BUDGET 2017 Laois County Council 1
Transcript of ADOPTED FORMAT OF BUDGET 2017 Laois County Council · Rents from Houses 5,409,000 Housing Loans...
ADOPTED FORMAT OF BUDGET 2017
Laois County Council
1
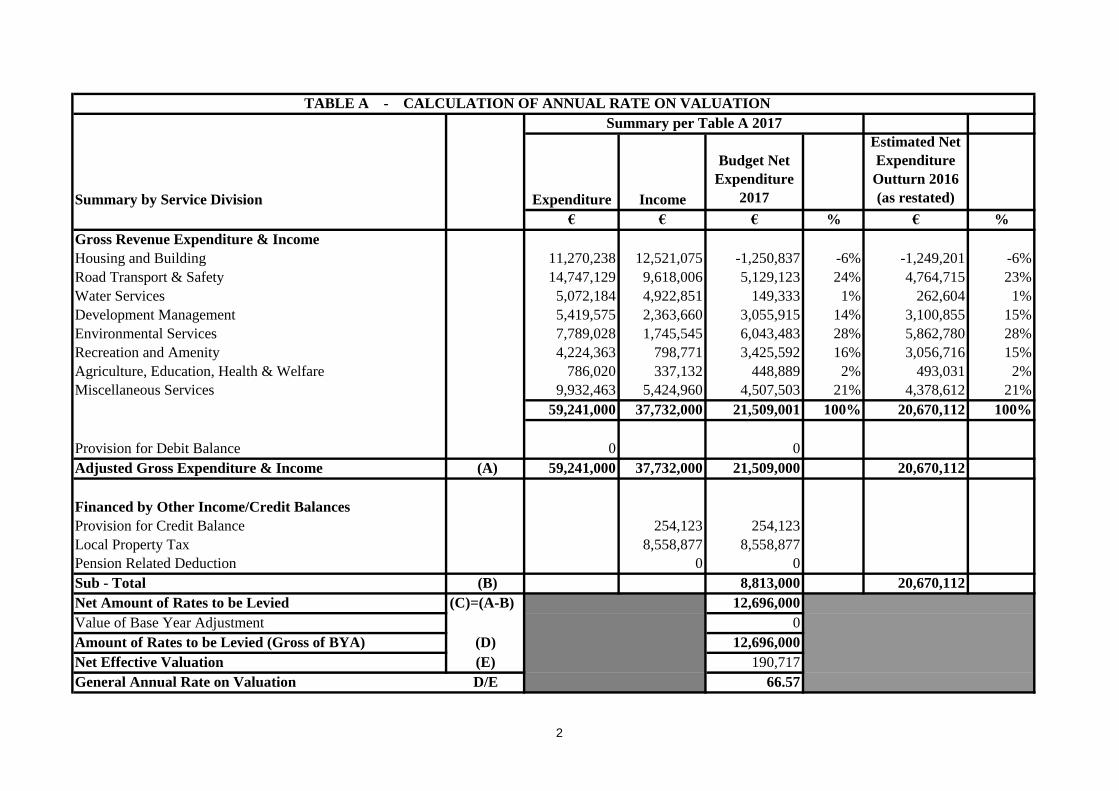
Summary by Service Division Expenditure Income
Budget Net
Expenditure
2017
Estimated Net
Expenditure
Outturn 2016
(as restated)
€ € € % € %
Gross Revenue Expenditure & Income
Housing and Building 11,270,238 12,521,075 -1,250,837 -6% -1,249,201 -6%
Road Transport & Safety 14,747,129 9,618,006 5,129,123 24% 4,764,715 23%
Water Services 5,072,184 4,922,851 149,333 1% 262,604 1%
Development Management 5,419,575 2,363,660 3,055,915 14% 3,100,855 15%
Environmental Services 7,789,028 1,745,545 6,043,483 28% 5,862,780 28%
Recreation and Amenity 4,224,363 798,771 3,425,592 16% 3,056,716 15%
Agriculture, Education, Health & Welfare 786,020 337,132 448,889 2% 493,031 2%
Miscellaneous Services 9,932,463 5,424,960 4,507,503 21% 4,378,612 21%
59,241,000 37,732,000 21,509,001 100% 20,670,112 100%
Provision for Debit Balance 0 0
Adjusted Gross Expenditure & Income (A) 59,241,000 37,732,000 21,509,000 20,670,112
Financed by Other Income/Credit Balances
Provision for Credit Balance 254,123 254,123
Local Property Tax 8,558,877 8,558,877
Pension Related Deduction 0 0
Sub - Total (B) 8,813,000 20,670,112
Net Amount of Rates to be Levied (C)=(A-B) 12,696,000
Value of Base Year Adjustment 0
Amount of Rates to be Levied (Gross of BYA) (D) 12,696,000
Net Effective Valuation (E) 190,717
General Annual Rate on Valuation D/E 66.57
Summary per Table A 2017
TABLE A - CALCULATION OF ANNUAL RATE ON VALUATION
2
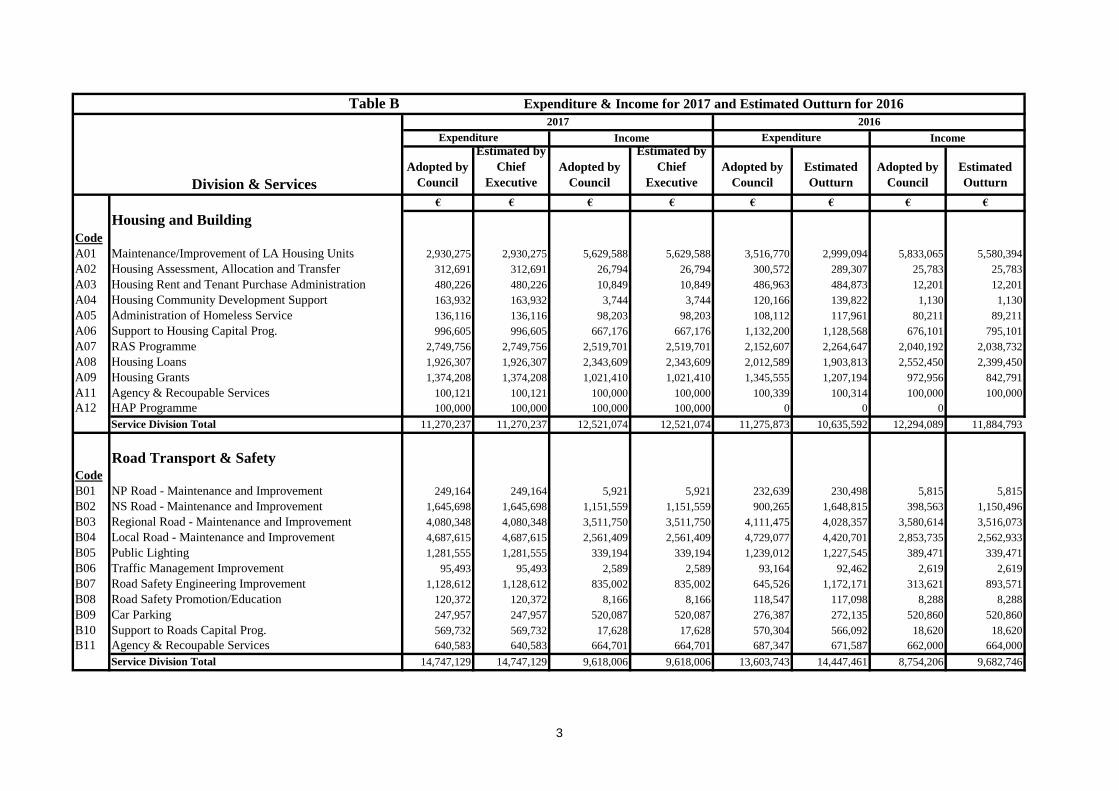
Table B
Division & Services
Adopted by
Council
Estimated by
Chief
Executive
Adopted by
Council
Estimated by
Chief
Executive
Adopted by
Council
Estimated
Outturn
Adopted by
Council
Estimated
Outturn
€ € € € € € € €
Housing and Building
Code
A01 Maintenance/Improvement of LA Housing Units 2,930,275 2,930,275 5,629,588 5,629,588 3,516,770 2,999,094 5,833,065 5,580,394
A02 Housing Assessment, Allocation and Transfer 312,691 312,691 26,794 26,794 300,572 289,307 25,783 25,783
A03 Housing Rent and Tenant Purchase Administration 480,226 480,226 10,849 10,849 486,963 484,873 12,201 12,201
A04 Housing Community Development Support 163,932 163,932 3,744 3,744 120,166 139,822 1,130 1,130
A05 Administration of Homeless Service 136,116 136,116 98,203 98,203 108,112 117,961 80,211 89,211
A06 Support to Housing Capital Prog. 996,605 996,605 667,176 667,176 1,132,200 1,128,568 676,101 795,101
A07 RAS Programme 2,749,756 2,749,756 2,519,701 2,519,701 2,152,607 2,264,647 2,040,192 2,038,732
A08 Housing Loans 1,926,307 1,926,307 2,343,609 2,343,609 2,012,589 1,903,813 2,552,450 2,399,450
A09 Housing Grants 1,374,208 1,374,208 1,021,410 1,021,410 1,345,555 1,207,194 972,956 842,791
A11 Agency & Recoupable Services 100,121 100,121 100,000 100,000 100,339 100,314 100,000 100,000
A12 HAP Programme 100,000 100,000 100,000 100,000 0 0 0
Service Division Total 11,270,237 11,270,237 12,521,074 12,521,074 11,275,873 10,635,592 12,294,089 11,884,793
Road Transport & SafetyCode
B01 NP Road - Maintenance and Improvement 249,164 249,164 5,921 5,921 232,639 230,498 5,815 5,815
B02 NS Road - Maintenance and Improvement 1,645,698 1,645,698 1,151,559 1,151,559 900,265 1,648,815 398,563 1,150,496
B03 Regional Road - Maintenance and Improvement 4,080,348 4,080,348 3,511,750 3,511,750 4,111,475 4,028,357 3,580,614 3,516,073
B04 Local Road - Maintenance and Improvement 4,687,615 4,687,615 2,561,409 2,561,409 4,729,077 4,420,701 2,853,735 2,562,933
B05 Public Lighting 1,281,555 1,281,555 339,194 339,194 1,239,012 1,227,545 389,471 339,471
B06 Traffic Management Improvement 95,493 95,493 2,589 2,589 93,164 92,462 2,619 2,619
B07 Road Safety Engineering Improvement 1,128,612 1,128,612 835,002 835,002 645,526 1,172,171 313,621 893,571
B08 Road Safety Promotion/Education 120,372 120,372 8,166 8,166 118,547 117,098 8,288 8,288
B09 Car Parking 247,957 247,957 520,087 520,087 276,387 272,135 520,860 520,860
B10 Support to Roads Capital Prog. 569,732 569,732 17,628 17,628 570,304 566,092 18,620 18,620
B11 Agency & Recoupable Services 640,583 640,583 664,701 664,701 687,347 671,587 662,000 664,000
Service Division Total 14,747,129 14,747,129 9,618,006 9,618,006 13,603,743 14,447,461 8,754,206 9,682,746
Expenditure & Income for 2017 and Estimated Outturn for 2016
2017 2016
Expenditure Income Expenditure Income
3
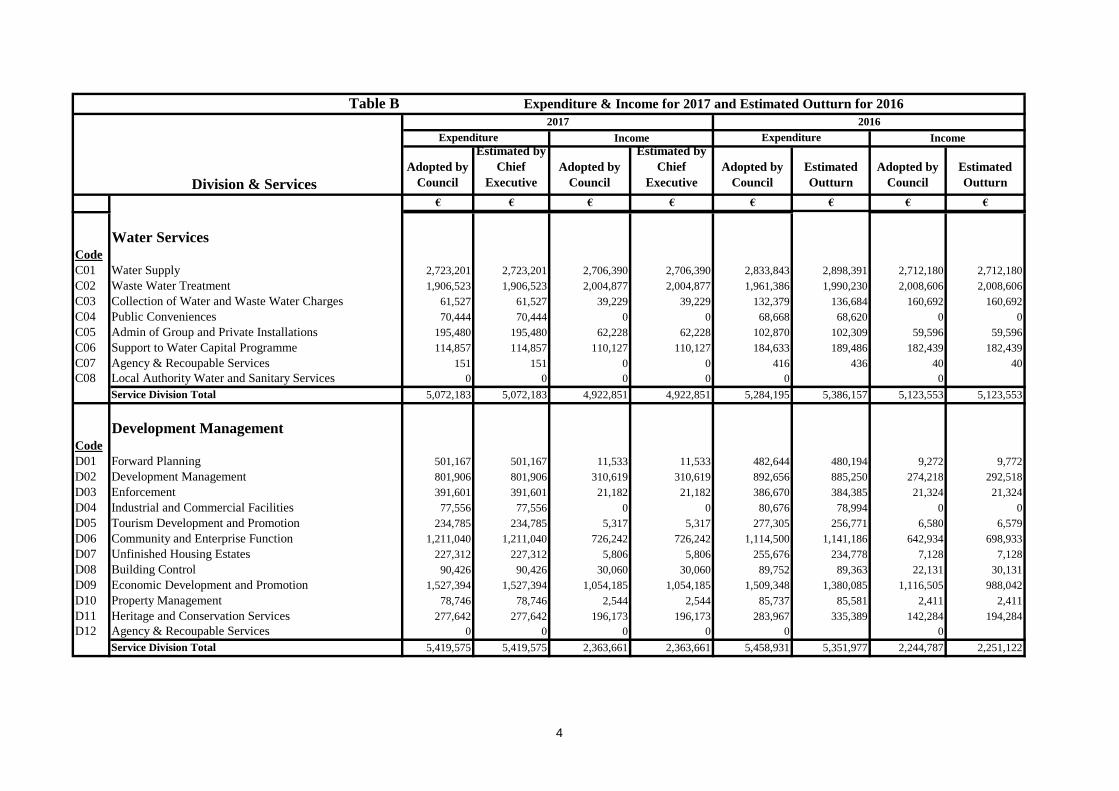
Table B
Division & Services
Adopted by
Council
Estimated by
Chief
Executive
Adopted by
Council
Estimated by
Chief
Executive
Adopted by
Council
Estimated
Outturn
Adopted by
Council
Estimated
Outturn
€ € € € € € € €
Expenditure & Income for 2017 and Estimated Outturn for 2016
2017 2016
Expenditure Income Expenditure Income
Water ServicesCode
C01 Water Supply 2,723,201 2,723,201 2,706,390 2,706,390 2,833,843 2,898,391 2,712,180 2,712,180
C02 Waste Water Treatment 1,906,523 1,906,523 2,004,877 2,004,877 1,961,386 1,990,230 2,008,606 2,008,606
C03 Collection of Water and Waste Water Charges 61,527 61,527 39,229 39,229 132,379 136,684 160,692 160,692
C04 Public Conveniences 70,444 70,444 0 0 68,668 68,620 0 0
C05 Admin of Group and Private Installations 195,480 195,480 62,228 62,228 102,870 102,309 59,596 59,596
C06 Support to Water Capital Programme 114,857 114,857 110,127 110,127 184,633 189,486 182,439 182,439
C07 Agency & Recoupable Services 151 151 0 0 416 436 40 40
C08 Local Authority Water and Sanitary Services 0 0 0 0 0 0
Service Division Total 5,072,183 5,072,183 4,922,851 4,922,851 5,284,195 5,386,157 5,123,553 5,123,553
Development ManagementCode
D01 Forward Planning 501,167 501,167 11,533 11,533 482,644 480,194 9,272 9,772
D02 Development Management 801,906 801,906 310,619 310,619 892,656 885,250 274,218 292,518
D03 Enforcement 391,601 391,601 21,182 21,182 386,670 384,385 21,324 21,324
D04 Industrial and Commercial Facilities 77,556 77,556 0 0 80,676 78,994 0 0
D05 Tourism Development and Promotion 234,785 234,785 5,317 5,317 277,305 256,771 6,580 6,579
D06 Community and Enterprise Function 1,211,040 1,211,040 726,242 726,242 1,114,500 1,141,186 642,934 698,933
D07 Unfinished Housing Estates 227,312 227,312 5,806 5,806 255,676 234,778 7,128 7,128
D08 Building Control 90,426 90,426 30,060 30,060 89,752 89,363 22,131 30,131
D09 Economic Development and Promotion 1,527,394 1,527,394 1,054,185 1,054,185 1,509,348 1,380,085 1,116,505 988,042
D10 Property Management 78,746 78,746 2,544 2,544 85,737 85,581 2,411 2,411
D11 Heritage and Conservation Services 277,642 277,642 196,173 196,173 283,967 335,389 142,284 194,284
D12 Agency & Recoupable Services 0 0 0 0 0 0
Service Division Total 5,419,575 5,419,575 2,363,661 2,363,661 5,458,931 5,351,977 2,244,787 2,251,122
4

Table B
Division & Services
Adopted by
Council
Estimated by
Chief
Executive
Adopted by
Council
Estimated by
Chief
Executive
Adopted by
Council
Estimated
Outturn
Adopted by
Council
Estimated
Outturn
€ € € € € € € €
Expenditure & Income for 2017 and Estimated Outturn for 2016
2017 2016
Expenditure Income Expenditure Income
Environmental ServicesCode
E01 Landfill Operation and Aftercare 1,587,768 1,587,768 597,459 597,459 1,585,446 1,563,970 344,946 344,946
E02 Recovery & Recycling Facilities Operations 518,147 518,147 2,864 2,864 163,951 166,007 40,816 40,816
E03 Waste to Energy Facilities Operations 0 0 0 0 0 0 0 0
E04 Provision of Waste to Collection Services 0 0 12,000 12,000 0 0 8,000 12,000
E05 Litter Management 432,666 432,666 40,317 40,317 457,347 435,582 40,775 40,775
E06 Street Cleaning 410,816 410,816 16,658 16,658 412,813 410,532 17,124 17,124
E07 Waste Regulations, Monitoring and Enforcement 527,860 527,860 190,618 190,618 529,731 499,835 198,530 188,530
E08 Waste Management Planning 84,955 84,955 1,698 1,698 60,034 69,580 1,216 1,216
E09 Maintenance of Burial Grounds 127,511 127,511 61,252 61,252 134,231 133,845 61,210 61,210
E10 Safety of Structures and Places 387,346 387,346 86,572 86,572 371,427 374,669 86,091 86,091
E11 Operation of Fire Service 3,445,557 3,445,557 636,883 636,883 3,426,119 3,495,715 532,427 638,427
E12 Fire Prevention 111,751 111,751 85,435 85,435 107,784 107,169 84,458 85,458
E13 Water Quality, Air and Noise Pollution 154,652 154,652 13,790 13,790 134,192 133,336 10,869 10,869
E14 Agency & Recoupable Servicess 0 0 0 0 0 0
Service Division Total 7,789,029 7,789,029 1,745,546 1,745,546 7,383,075 7,390,242 1,426,462 1,527,462
Recreation & Amenity Code
F01 Leisure Facilities Operations 75,662 75,662 4,041 4,041 75,068 75,063 0
F02 Operation of Library and Archival Service 2,113,259 2,113,259 150,659 150,659 1,891,125 1,853,146 160,491 160,490
F03 Outdoor Leisure Areas Operations 332,537 332,537 17,288 17,288 282,911 281,299 17,761 17,761
F04 Community Sport and Recreational Development 479,092 479,092 34,068 34,068 494,958 472,783 30,256 35,256
F05 Operation of Arts Programme 1,103,813 1,103,813 472,714 472,714 1,048,207 1,061,149 457,217 473,217
F06 Agency & Recoupable Services 120,000 120,000 120,000 120,000 120,000 120,000 120,000 120,000
Service Division Total 4,224,363 4,224,363 798,770 798,770 3,912,269 3,863,440 785,725 806,725
5
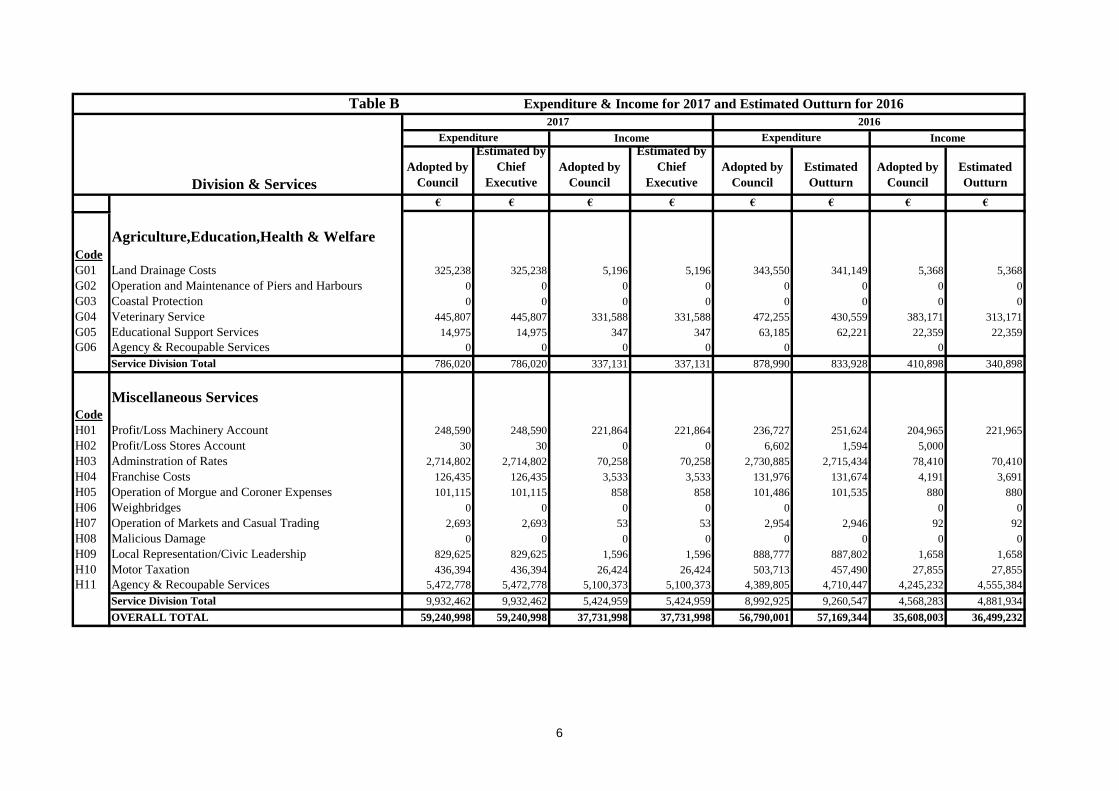
Table B
Division & Services
Adopted by
Council
Estimated by
Chief
Executive
Adopted by
Council
Estimated by
Chief
Executive
Adopted by
Council
Estimated
Outturn
Adopted by
Council
Estimated
Outturn
€ € € € € € € €
Expenditure & Income for 2017 and Estimated Outturn for 2016
2017 2016
Expenditure Income Expenditure Income
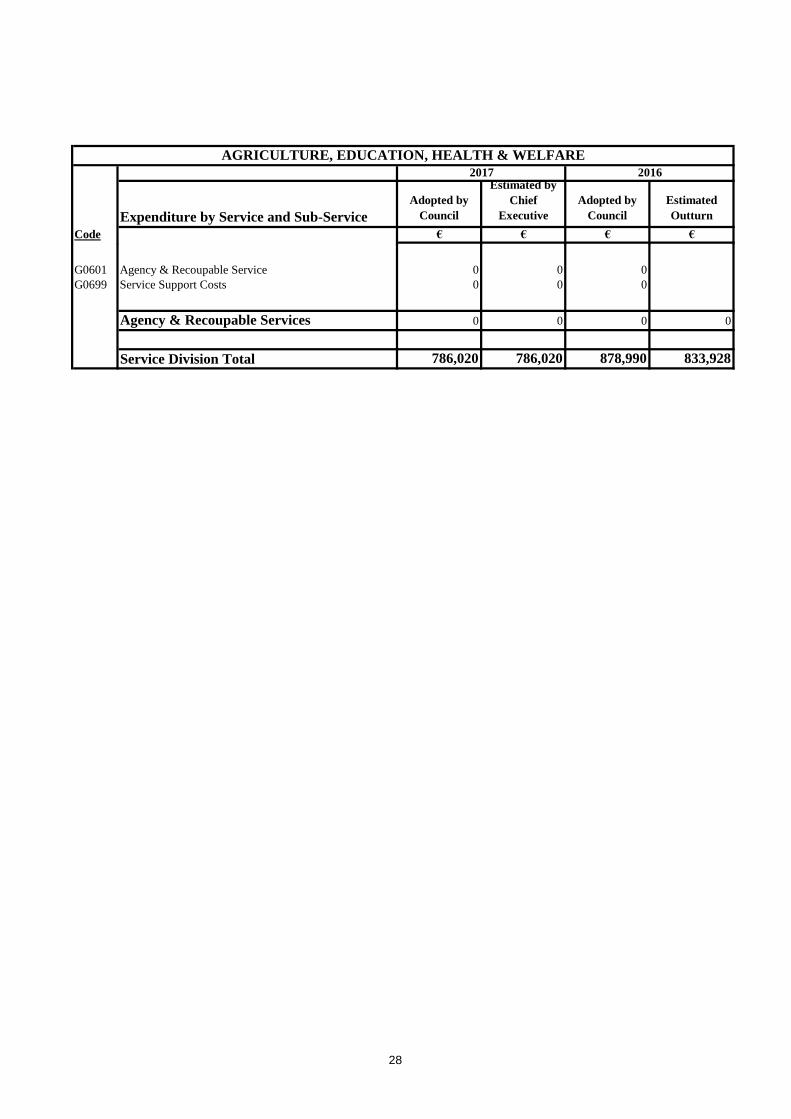
Agriculture,Education,Health & Welfare
Code
G01 Land Drainage Costs 325,238 325,238 5,196 5,196 343,550 341,149 5,368 5,368
G02 Operation and Maintenance of Piers and Harbours 0 0 0 0 0 0 0 0
G03 Coastal Protection 0 0 0 0 0 0 0 0
G04 Veterinary Service 445,807 445,807 331,588 331,588 472,255 430,559 383,171 313,171
G05 Educational Support Services 14,975 14,975 347 347 63,185 62,221 22,359 22,359
G06 Agency & Recoupable Services 0 0 0 0 0 0
Service Division Total 786,020 786,020 337,131 337,131 878,990 833,928 410,898 340,898
Miscellaneous ServicesCode
H01 Profit/Loss Machinery Account 248,590 248,590 221,864 221,864 236,727 251,624 204,965 221,965
H02 Profit/Loss Stores Account 30 30 0 0 6,602 1,594 5,000
H03 Adminstration of Rates 2,714,802 2,714,802 70,258 70,258 2,730,885 2,715,434 78,410 70,410
H04 Franchise Costs 126,435 126,435 3,533 3,533 131,976 131,674 4,191 3,691
H05 Operation of Morgue and Coroner Expenses 101,115 101,115 858 858 101,486 101,535 880 880
H06 Weighbridges 0 0 0 0 0 0 0
H07 Operation of Markets and Casual Trading 2,693 2,693 53 53 2,954 2,946 92 92
H08 Malicious Damage 0 0 0 0 0 0 0 0
H09 Local Representation/Civic Leadership 829,625 829,625 1,596 1,596 888,777 887,802 1,658 1,658
H10 Motor Taxation 436,394 436,394 26,424 26,424 503,713 457,490 27,855 27,855
H11 Agency & Recoupable Services 5,472,778 5,472,778 5,100,373 5,100,373 4,389,805 4,710,447 4,245,232 4,555,384
Service Division Total 9,932,462 9,932,462 5,424,959 5,424,959 8,992,925 9,260,547 4,568,283 4,881,934
OVERALL TOTAL 59,240,998 59,240,998 37,731,998 37,731,998 56,790,001 57,169,344 35,608,003 36,499,232
6
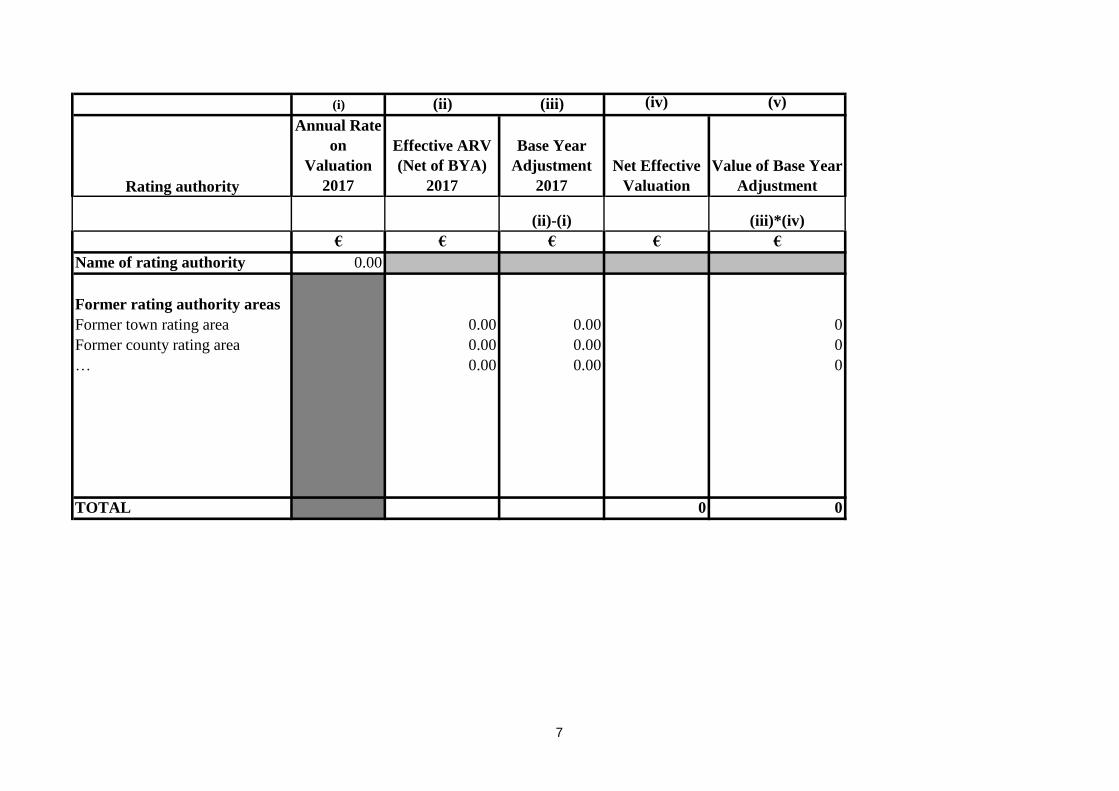
(i) (ii) (iii) (iv) (v)
Rating authority
Annual Rate
on
Valuation
2017
Effective ARV
(Net of BYA)
2017
Base Year
Adjustment
2017
Net Effective
Valuation
Value of Base Year
Adjustment
(ii)-(i) (iii)*(iv)
€ € € € €
Name of rating authority 0.00
Former rating authority areas
Former town rating area 0.00 0.00 0
Former county rating area 0.00 0.00 0
… 0.00 0.00 0
TOTAL 0 0
7
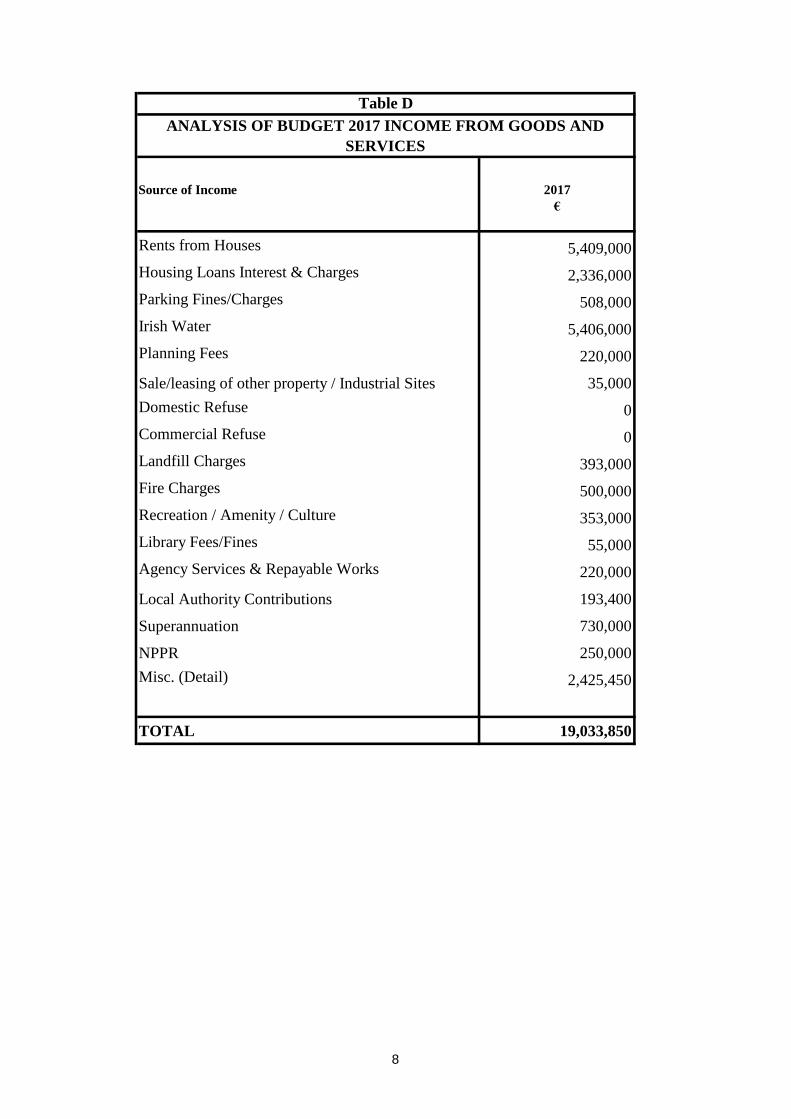
Source of Income 2017
€
Rents from Houses 5,409,000
Housing Loans Interest & Charges 2,336,000
Parking Fines/Charges 508,000
Irish Water 5,406,000
Planning Fees 220,000
Sale/leasing of other property / Industrial Sites 35,000
Domestic Refuse 0
Commercial Refuse 0
Landfill Charges 393,000
Fire Charges 500,000
Recreation / Amenity / Culture 353,000
Library Fees/Fines 55,000
Agency Services & Repayable Works 220,000
Local Authority Contributions 193,400
Superannuation 730,000
NPPR 250,000
Misc. (Detail) 2,425,450
TOTAL 19,033,850
Table D
ANALYSIS OF BUDGET 2017 INCOME FROM GOODS AND
SERVICES
8
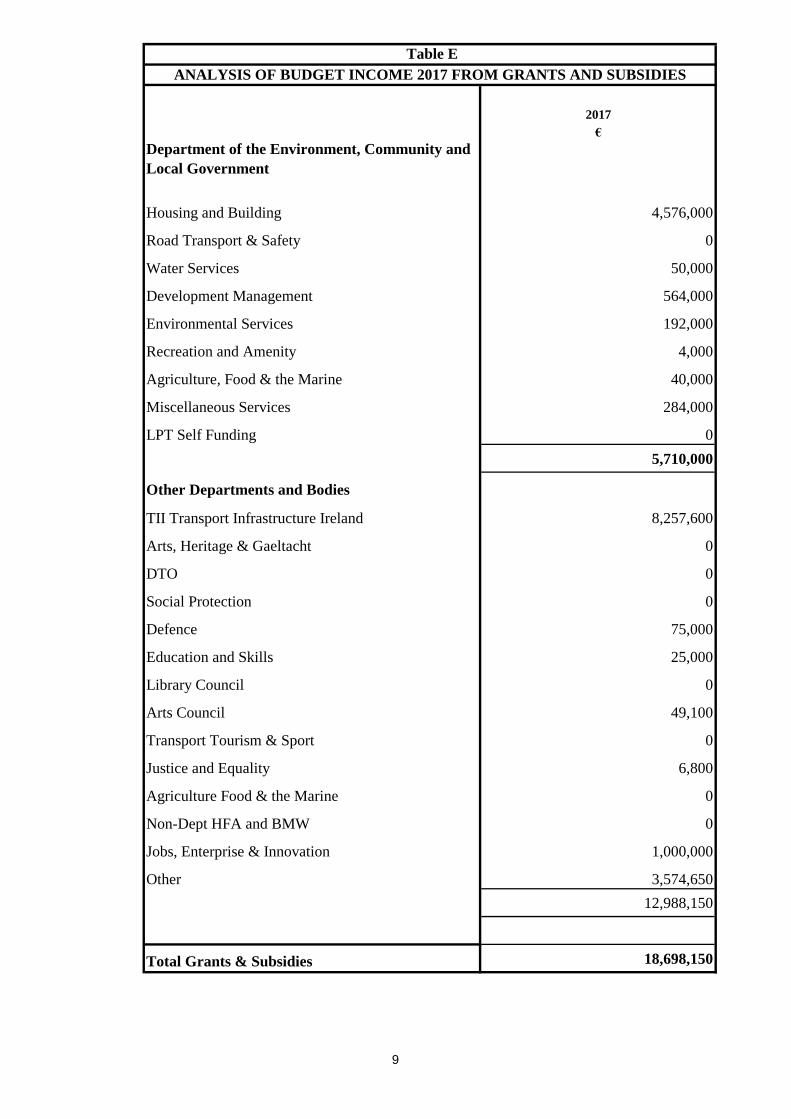
2017
€
Department of the Environment, Community and
Local Government
Housing and Building 4,576,000
Road Transport & Safety 0
Water Services 50,000
Development Management 564,000
Environmental Services 192,000
Recreation and Amenity 4,000
Agriculture, Food & the Marine 40,000
Miscellaneous Services 284,000
LPT Self Funding 0
5,710,000
Other Departments and Bodies
TII Transport Infrastructure Ireland 8,257,600
Arts, Heritage & Gaeltacht 0
DTO 0
Social Protection 0
Defence 75,000
Education and Skills 25,000
Library Council 0
Arts Council 49,100
Transport Tourism & Sport 0
Justice and Equality 6,800
Agriculture Food & the Marine 0
Non-Dept HFA and BMW 0
Jobs, Enterprise & Innovation 1,000,000
Other 3,574,650
12,988,150
Total Grants & Subsidies 18,698,150
Table E
ANALYSIS OF BUDGET INCOME 2017 FROM GRANTS AND SUBSIDIES
9
Table F Comprises Expenditure and Income by
Division to Sub-Service Level
10
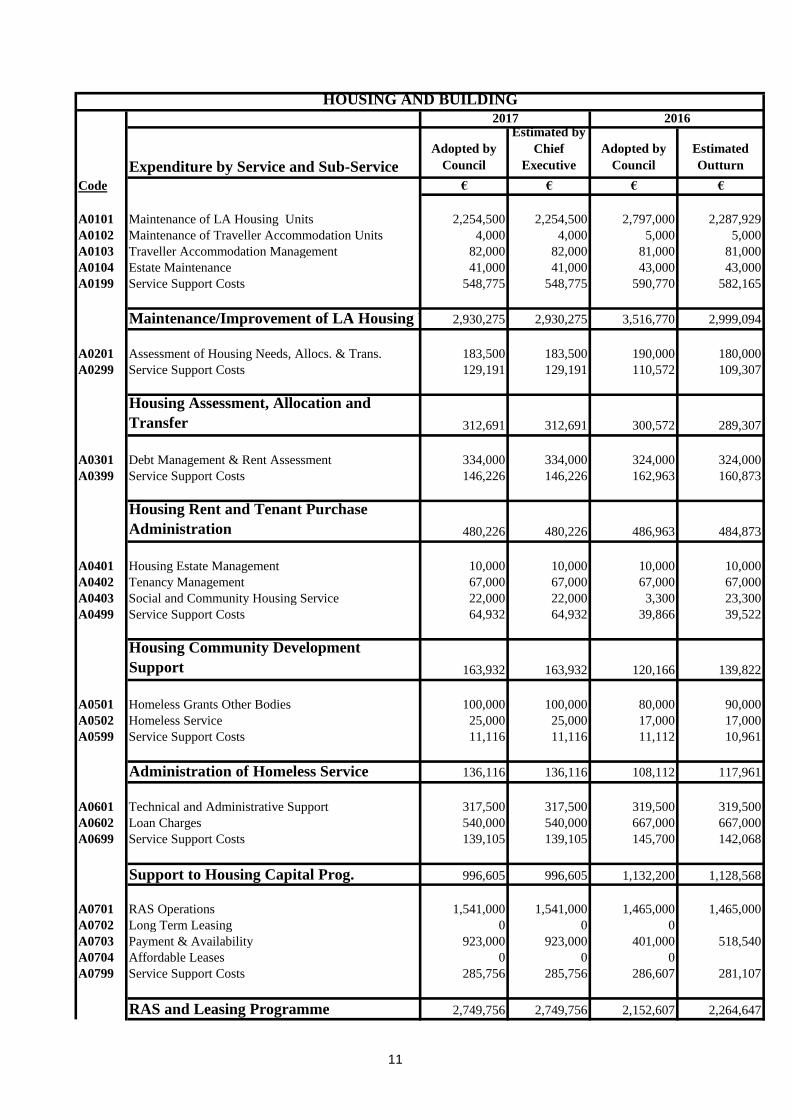
Expenditure by Service and Sub-Service
Adopted by
Council
Estimated by
Chief
Executive
Adopted by
Council
Estimated
Outturn
Code € € € €
A0101 Maintenance of LA Housing Units 2,254,500 2,254,500 2,797,000 2,287,929
A0102 Maintenance of Traveller Accommodation Units 4,000 4,000 5,000 5,000
A0103 Traveller Accommodation Management 82,000 82,000 81,000 81,000
A0104 Estate Maintenance 41,000 41,000 43,000 43,000
A0199 Service Support Costs 548,775 548,775 590,770 582,165
Maintenance/Improvement of LA Housing Units2,930,275 2,930,275 3,516,770 2,999,094
A0201 Assessment of Housing Needs, Allocs. & Trans. 183,500 183,500 190,000 180,000
A0299 Service Support Costs 129,191 129,191 110,572 109,307
Housing Assessment, Allocation and
Transfer 312,691 312,691 300,572 289,307
A0301 Debt Management & Rent Assessment 334,000 334,000 324,000 324,000
A0399 Service Support Costs 146,226 146,226 162,963 160,873
Housing Rent and Tenant Purchase
Administration 480,226 480,226 486,963 484,873
A0401 Housing Estate Management 10,000 10,000 10,000 10,000
A0402 Tenancy Management 67,000 67,000 67,000 67,000
A0403 Social and Community Housing Service 22,000 22,000 3,300 23,300
A0499 Service Support Costs 64,932 64,932 39,866 39,522
Housing Community Development
Support 163,932 163,932 120,166 139,822
A0501 Homeless Grants Other Bodies 100,000 100,000 80,000 90,000
A0502 Homeless Service 25,000 25,000 17,000 17,000
A0599 Service Support Costs 11,116 11,116 11,112 10,961
Administration of Homeless Service 136,116 136,116 108,112 117,961
A0601 Technical and Administrative Support 317,500 317,500 319,500 319,500
A0602 Loan Charges 540,000 540,000 667,000 667,000
A0699 Service Support Costs 139,105 139,105 145,700 142,068
Support to Housing Capital Prog. 996,605 996,605 1,132,200 1,128,568
A0701 RAS Operations 1,541,000 1,541,000 1,465,000 1,465,000
A0702 Long Term Leasing 0 0 0
A0703 Payment & Availability 923,000 923,000 401,000 518,540
A0704 Affordable Leases 0 0 0
A0799 Service Support Costs 285,756 285,756 286,607 281,107
RAS and Leasing Programme 2,749,756 2,749,756 2,152,607 2,264,647
2017 2016
HOUSING AND BUILDING
11
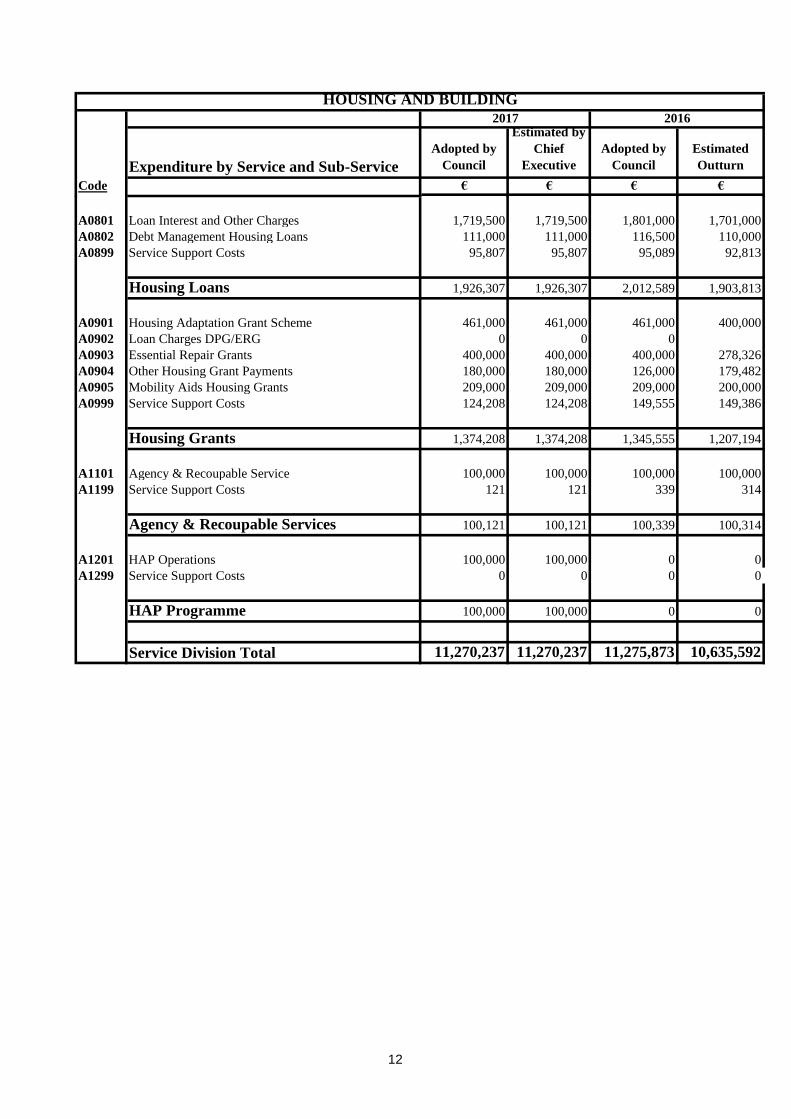
Expenditure by Service and Sub-Service
Adopted by
Council
Estimated by
Chief
Executive
Adopted by
Council
Estimated
Outturn
Code € € € €
2017 2016
HOUSING AND BUILDING
A0801 Loan Interest and Other Charges 1,719,500 1,719,500 1,801,000 1,701,000
A0802 Debt Management Housing Loans 111,000 111,000 116,500 110,000
A0899 Service Support Costs 95,807 95,807 95,089 92,813
Housing Loans 1,926,307 1,926,307 2,012,589 1,903,813
A0901 Housing Adaptation Grant Scheme 461,000 461,000 461,000 400,000
A0902 Loan Charges DPG/ERG 0 0 0
A0903 Essential Repair Grants 400,000 400,000 400,000 278,326
A0904 Other Housing Grant Payments 180,000 180,000 126,000 179,482
A0905 Mobility Aids Housing Grants 209,000 209,000 209,000 200,000
A0999 Service Support Costs 124,208 124,208 149,555 149,386
Housing Grants 1,374,208 1,374,208 1,345,555 1,207,194
A1101 Agency & Recoupable Service 100,000 100,000 100,000 100,000
A1199 Service Support Costs 121 121 339 314
Agency & Recoupable Services 100,121 100,121 100,339 100,314
A1201 HAP Operations 100,000 100,000 0 0
A1299 Service Support Costs 0 0 0 0
HAP Programme 100,000 100,000 0 0
Service Division Total 11,270,237 11,270,237 11,275,873 10,635,592
12
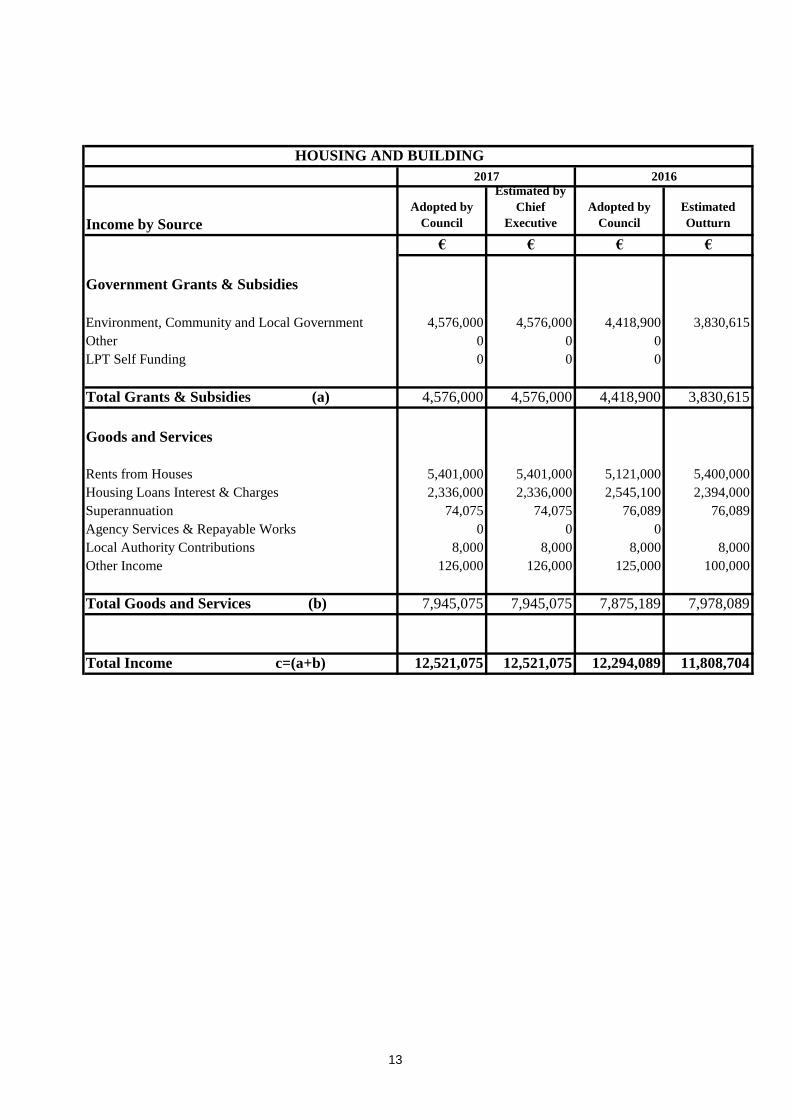
Income by Source
Adopted by
Council
Estimated by
Chief
Executive
Adopted by
Council
Estimated
Outturn
€ € € €
Government Grants & Subsidies
Environment, Community and Local Government 4,576,000 4,576,000 4,418,900 3,830,615
Other 0 0 0
LPT Self Funding 0 0 0
Total Grants & Subsidies (a) 4,576,000 4,576,000 4,418,900 3,830,615
Goods and Services
Rents from Houses 5,401,000 5,401,000 5,121,000 5,400,000
Housing Loans Interest & Charges 2,336,000 2,336,000 2,545,100 2,394,000
Superannuation 74,075 74,075 76,089 76,089
Agency Services & Repayable Works 0 0 0
Local Authority Contributions 8,000 8,000 8,000 8,000
Other Income 126,000 126,000 125,000 100,000
Total Goods and Services (b) 7,945,075 7,945,075 7,875,189 7,978,089
Total Income c=(a+b) 12,521,075 12,521,075 12,294,089 11,808,704
2016
HOUSING AND BUILDING
2017
13
Expenditure by Service and Sub-Service
Adopted by
Council
Estimated by
Chief
Executive
Adopted by
Council
Estimated
Outturn
Code € € € €
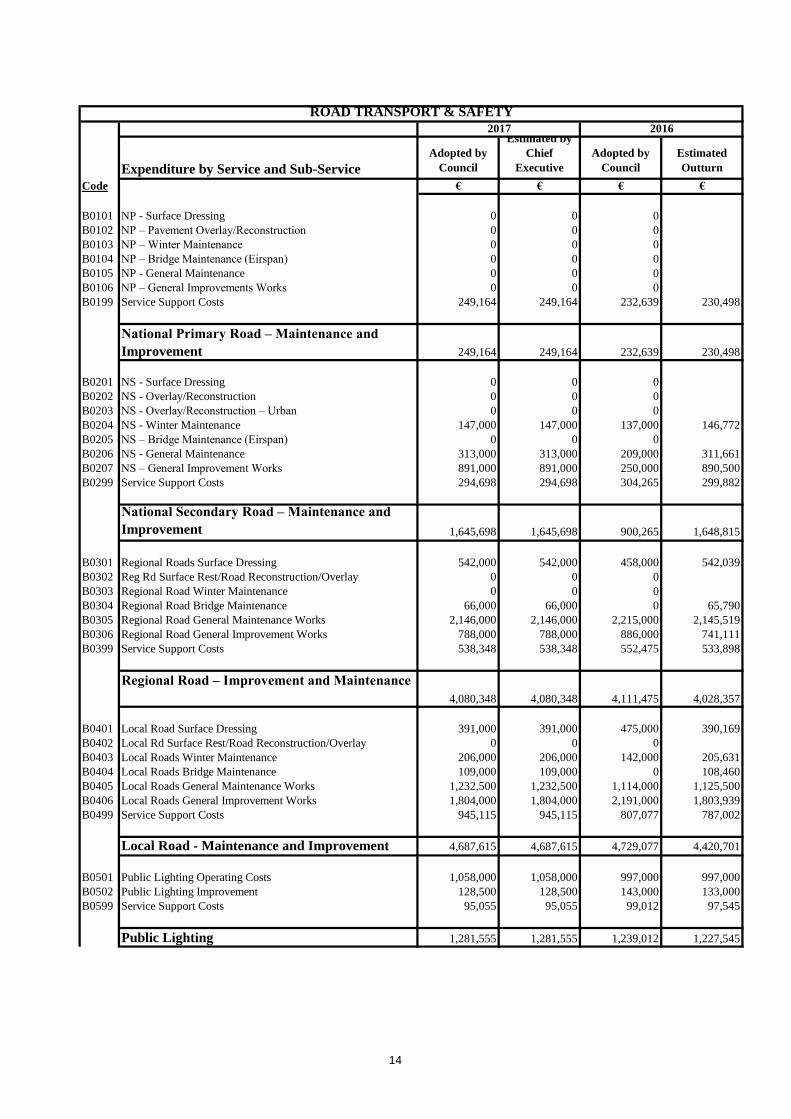
B0101 NP - Surface Dressing 0 0 0
B0102 NP – Pavement Overlay/Reconstruction 0 0 0
B0103 NP – Winter Maintenance 0 0 0
B0104 NP – Bridge Maintenance (Eirspan) 0 0 0
B0105 NP - General Maintenance 0 0 0
B0106 NP – General Improvements Works 0 0 0
B0199 Service Support Costs 249,164 249,164 232,639 230,498
National Primary Road – Maintenance and
Improvement 249,164 249,164 232,639 230,498
B0201 NS - Surface Dressing 0 0 0
B0202 NS - Overlay/Reconstruction 0 0 0
B0203 NS - Overlay/Reconstruction – Urban 0 0 0
B0204 NS - Winter Maintenance 147,000 147,000 137,000 146,772
B0205 NS – Bridge Maintenance (Eirspan) 0 0 0
B0206 NS - General Maintenance 313,000 313,000 209,000 311,661
B0207 NS – General Improvement Works 891,000 891,000 250,000 890,500
B0299 Service Support Costs 294,698 294,698 304,265 299,882
National Secondary Road – Maintenance and
Improvement 1,645,698 1,645,698 900,265 1,648,815
B0301 Regional Roads Surface Dressing 542,000 542,000 458,000 542,039
B0302 Reg Rd Surface Rest/Road Reconstruction/Overlay 0 0 0
B0303 Regional Road Winter Maintenance 0 0 0
B0304 Regional Road Bridge Maintenance 66,000 66,000 0 65,790
B0305 Regional Road General Maintenance Works 2,146,000 2,146,000 2,215,000 2,145,519
B0306 Regional Road General Improvement Works 788,000 788,000 886,000 741,111
B0399 Service Support Costs 538,348 538,348 552,475 533,898
Regional Road – Improvement and Maintenance
4,080,348 4,080,348 4,111,475 4,028,357
B0401 Local Road Surface Dressing 391,000 391,000 475,000 390,169
B0402 Local Rd Surface Rest/Road Reconstruction/Overlay 0 0 0
B0403 Local Roads Winter Maintenance 206,000 206,000 142,000 205,631
B0404 Local Roads Bridge Maintenance 109,000 109,000 0 108,460
B0405 Local Roads General Maintenance Works 1,232,500 1,232,500 1,114,000 1,125,500
B0406 Local Roads General Improvement Works 1,804,000 1,804,000 2,191,000 1,803,939
B0499 Service Support Costs 945,115 945,115 807,077 787,002
Local Road - Maintenance and Improvement 4,687,615 4,687,615 4,729,077 4,420,701
B0501 Public Lighting Operating Costs 1,058,000 1,058,000 997,000 997,000
B0502 Public Lighting Improvement 128,500 128,500 143,000 133,000
B0599 Service Support Costs 95,055 95,055 99,012 97,545
Public Lighting 1,281,555 1,281,555 1,239,012 1,227,545
2017 2016
ROAD TRANSPORT & SAFETY
14
Expenditure by Service and Sub-Service
Adopted by
Council
Estimated by
Chief
Executive
Adopted by
Council
Estimated
Outturn
Code € € € €
2017 2016
ROAD TRANSPORT & SAFETY
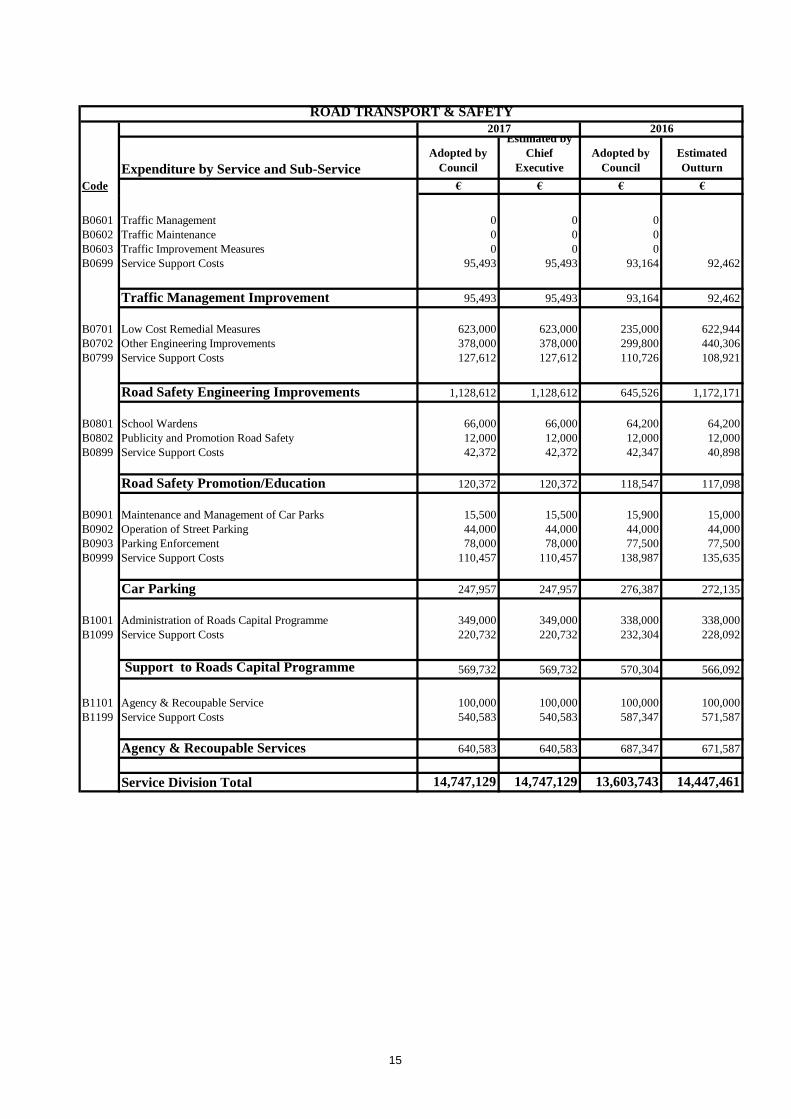
B0601 Traffic Management 0 0 0
B0602 Traffic Maintenance 0 0 0
B0603 Traffic Improvement Measures 0 0 0
B0699 Service Support Costs 95,493 95,493 93,164 92,462
Traffic Management Improvement 95,493 95,493 93,164 92,462
B0701 Low Cost Remedial Measures 623,000 623,000 235,000 622,944
B0702 Other Engineering Improvements 378,000 378,000 299,800 440,306
B0799 Service Support Costs 127,612 127,612 110,726 108,921
Road Safety Engineering Improvements 1,128,612 1,128,612 645,526 1,172,171
B0801 School Wardens 66,000 66,000 64,200 64,200
B0802 Publicity and Promotion Road Safety 12,000 12,000 12,000 12,000
B0899 Service Support Costs 42,372 42,372 42,347 40,898
Road Safety Promotion/Education 120,372 120,372 118,547 117,098
B0901 Maintenance and Management of Car Parks 15,500 15,500 15,900 15,000
B0902 Operation of Street Parking 44,000 44,000 44,000 44,000
B0903 Parking Enforcement 78,000 78,000 77,500 77,500
B0999 Service Support Costs 110,457 110,457 138,987 135,635
Car Parking 247,957 247,957 276,387 272,135
B1001 Administration of Roads Capital Programme 349,000 349,000 338,000 338,000
B1099 Service Support Costs 220,732 220,732 232,304 228,092
Support to Roads Capital Programme 569,732 569,732 570,304 566,092
B1101 Agency & Recoupable Service 100,000 100,000 100,000 100,000
B1199 Service Support Costs 540,583 540,583 587,347 571,587
Agency & Recoupable Services 640,583 640,583 687,347 671,587
Service Division Total 14,747,129 14,747,129 13,603,743 14,447,461
15
Income by Source
Adopted by
Council
Estimated by
Chief
Executive
Adopted by
Council
Estimated
Outturn
€ € € €
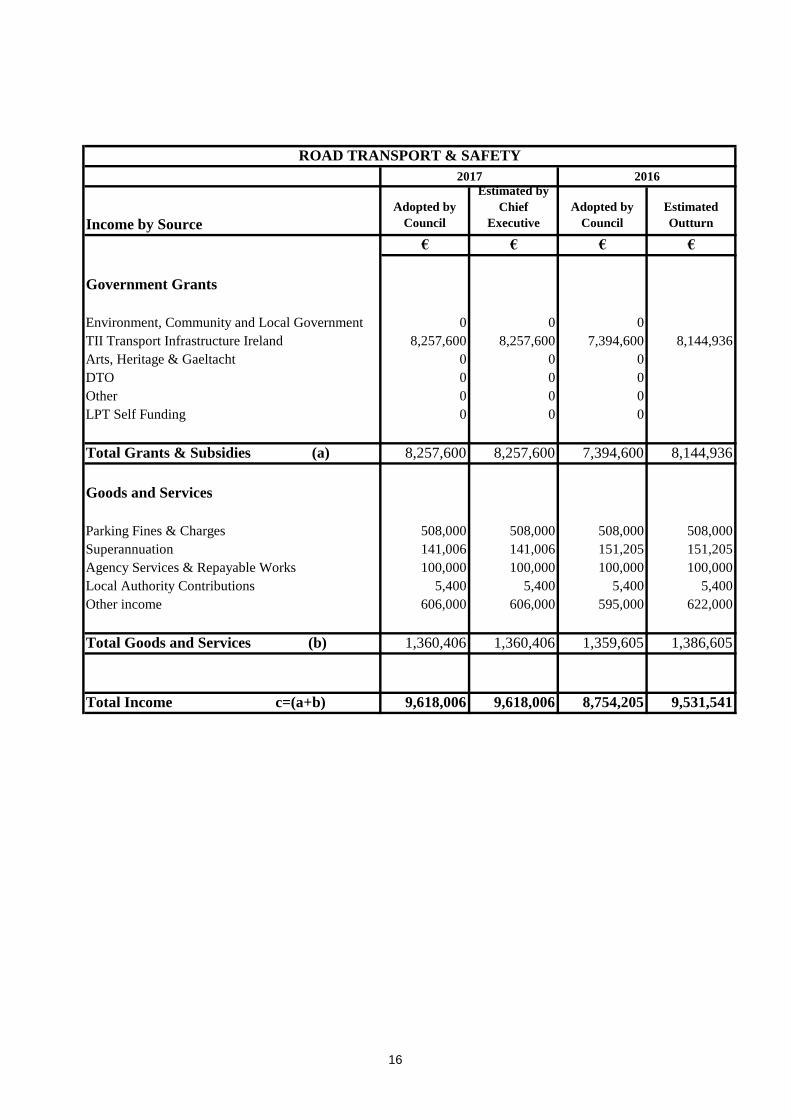
Government Grants
Environment, Community and Local Government 0 0 0
TII Transport Infrastructure Ireland 8,257,600 8,257,600 7,394,600 8,144,936
Arts, Heritage & Gaeltacht 0 0 0
DTO 0 0 0
Other 0 0 0
LPT Self Funding 0 0 0
Total Grants & Subsidies (a) 8,257,600 8,257,600 7,394,600 8,144,936
Goods and Services
Parking Fines & Charges 508,000 508,000 508,000 508,000
Superannuation 141,006 141,006 151,205 151,205
Agency Services & Repayable Works 100,000 100,000 100,000 100,000
Local Authority Contributions 5,400 5,400 5,400 5,400
Other income 606,000 606,000 595,000 622,000
Total Goods and Services (b) 1,360,406 1,360,406 1,359,605 1,386,605
Total Income c=(a+b) 9,618,006 9,618,006 8,754,205 9,531,541
ROAD TRANSPORT & SAFETY
2017 2016
16
Expenditure by Service and Sub-Service
Adopted by
Council
Estimated by
Chief
Executive
Adopted by
Council
Estimated
Outturn
Code € € € €
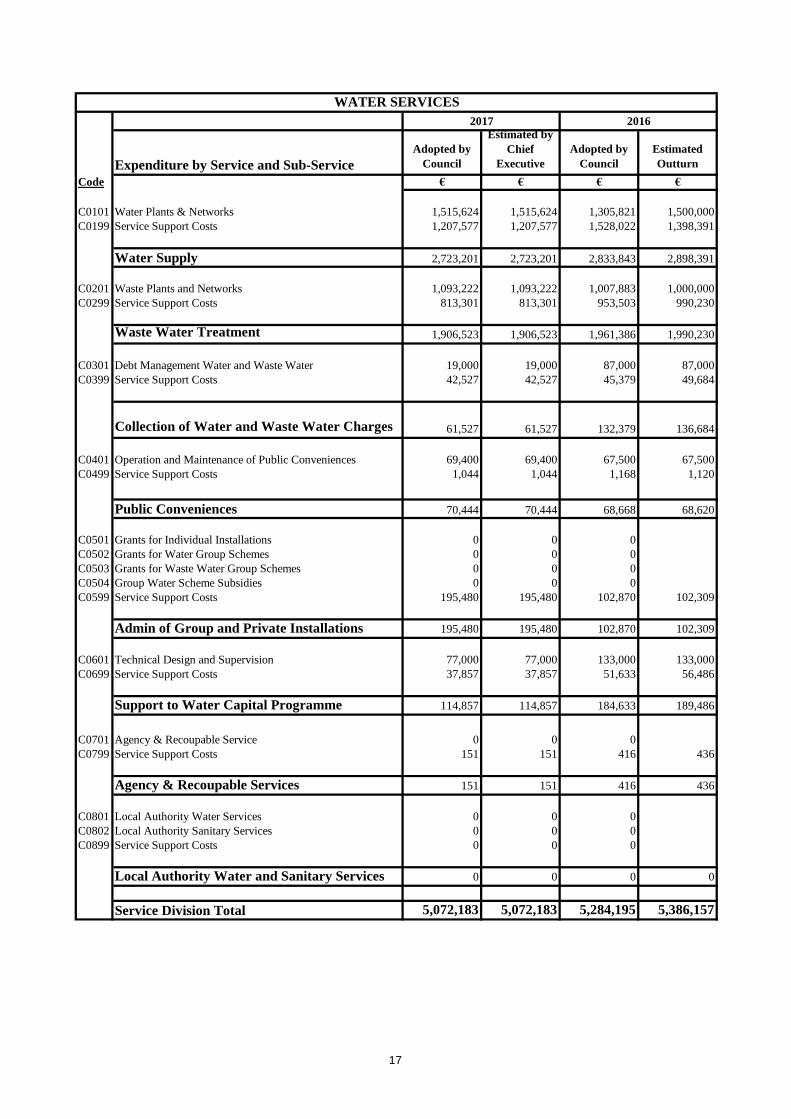
C0101 Water Plants & Networks 1,515,624 1,515,624 1,305,821 1,500,000
C0199 Service Support Costs 1,207,577 1,207,577 1,528,022 1,398,391
Water Supply 2,723,201 2,723,201 2,833,843 2,898,391
C0201 Waste Plants and Networks 1,093,222 1,093,222 1,007,883 1,000,000
C0299 Service Support Costs 813,301 813,301 953,503 990,230
Waste Water Treatment 1,906,523 1,906,523 1,961,386 1,990,230
C0301 Debt Management Water and Waste Water 19,000 19,000 87,000 87,000
C0399 Service Support Costs 42,527 42,527 45,379 49,684
Collection of Water and Waste Water Charges 61,527 61,527 132,379 136,684
C0401 Operation and Maintenance of Public Conveniences 69,400 69,400 67,500 67,500
C0499 Service Support Costs 1,044 1,044 1,168 1,120
Public Conveniences 70,444 70,444 68,668 68,620
C0501 Grants for Individual Installations 0 0 0
C0502 Grants for Water Group Schemes 0 0 0
C0503 Grants for Waste Water Group Schemes 0 0 0
C0504 Group Water Scheme Subsidies 0 0 0
C0599 Service Support Costs 195,480 195,480 102,870 102,309
Admin of Group and Private Installations 195,480 195,480 102,870 102,309
C0601 Technical Design and Supervision 77,000 77,000 133,000 133,000
C0699 Service Support Costs 37,857 37,857 51,633 56,486
Support to Water Capital Programme 114,857 114,857 184,633 189,486
C0701 Agency & Recoupable Service 0 0 0
C0799 Service Support Costs 151 151 416 436
Agency & Recoupable Services 151 151 416 436
C0801 Local Authority Water Services 0 0 0
C0802 Local Authority Sanitary Services 0 0 0
C0899 Service Support Costs 0 0 0
Local Authority Water and Sanitary Services 0 0 0 0
Service Division Total 5,072,183 5,072,183 5,284,195 5,386,157
2017 2016
WATER SERVICES
17
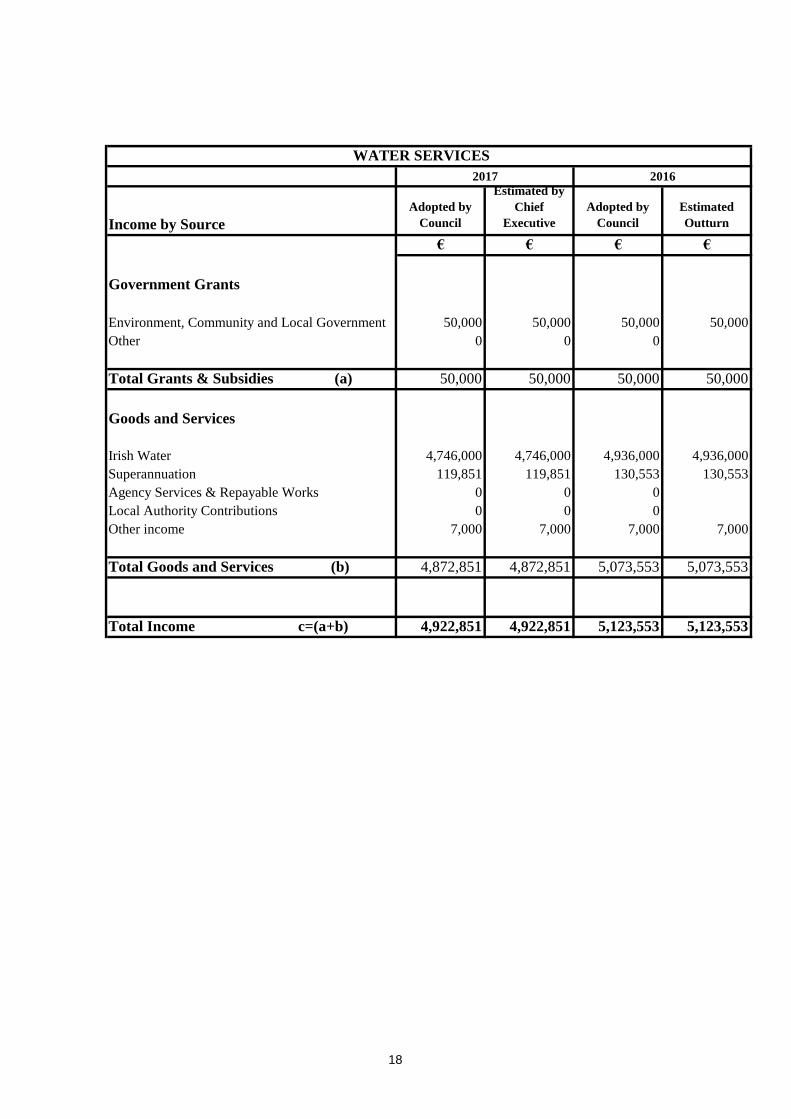
Income by Source
Adopted by
Council
Estimated by
Chief
Executive
Adopted by
Council
Estimated
Outturn
€ € € €
Government Grants
Environment, Community and Local Government 50,000 50,000 50,000 50,000
Other 0 0 0
Total Grants & Subsidies (a) 50,000 50,000 50,000 50,000
Goods and Services
Irish Water 4,746,000 4,746,000 4,936,000 4,936,000
Superannuation 119,851 119,851 130,553 130,553
Agency Services & Repayable Works 0 0 0
Local Authority Contributions 0 0 0
Other income 7,000 7,000 7,000 7,000
Total Goods and Services (b) 4,872,851 4,872,851 5,073,553 5,073,553
Total Income c=(a+b) 4,922,851 4,922,851 5,123,553 5,123,553
WATER SERVICES
2017 2016
18
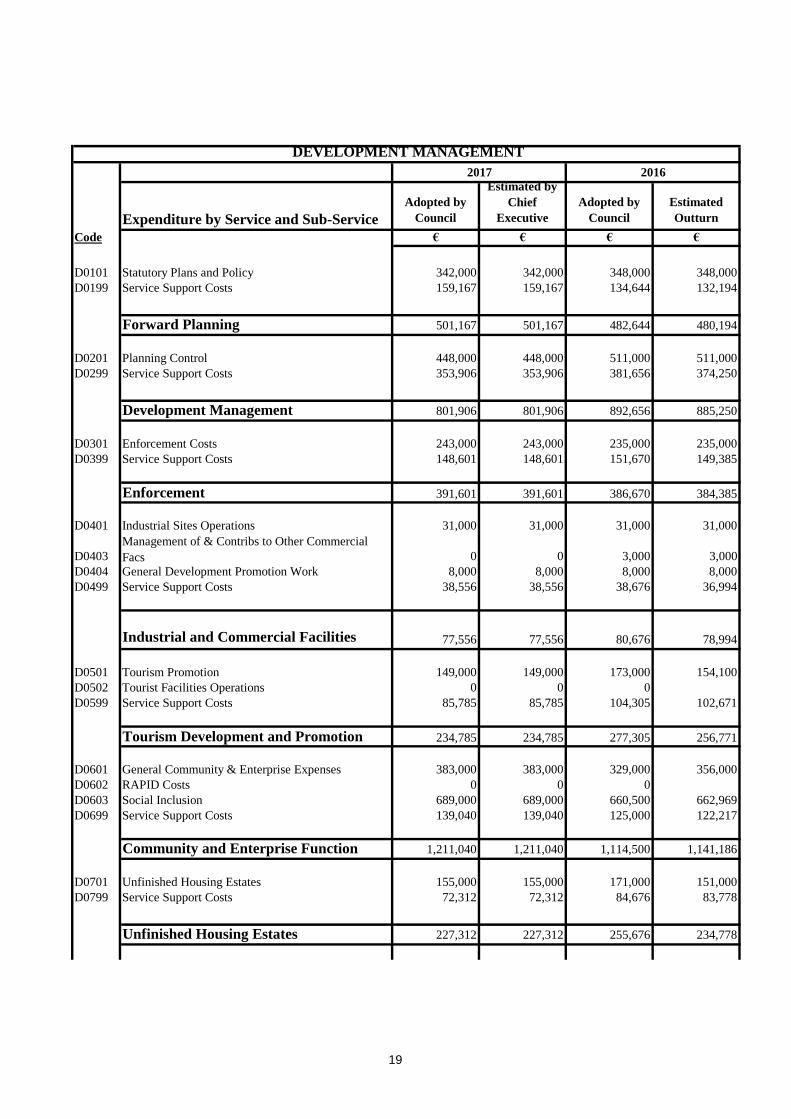
Expenditure by Service and Sub-Service
Adopted by
Council
Estimated by
Chief
Executive
Adopted by
Council
Estimated
Outturn
Code € € € €
D0101 Statutory Plans and Policy 342,000 342,000 348,000 348,000
D0199 Service Support Costs 159,167 159,167 134,644 132,194
Forward Planning 501,167 501,167 482,644 480,194
D0201 Planning Control 448,000 448,000 511,000 511,000
D0299 Service Support Costs 353,906 353,906 381,656 374,250
Development Management 801,906 801,906 892,656 885,250
D0301 Enforcement Costs 243,000 243,000 235,000 235,000
D0399 Service Support Costs 148,601 148,601 151,670 149,385
Enforcement 391,601 391,601 386,670 384,385
D0401 Industrial Sites Operations 31,000 31,000 31,000 31,000
D0403
Management of & Contribs to Other Commercial
Facs 0 0 3,000 3,000
D0404 General Development Promotion Work 8,000 8,000 8,000 8,000
D0499 Service Support Costs 38,556 38,556 38,676 36,994
Industrial and Commercial Facilities 77,556 77,556 80,676 78,994
D0501 Tourism Promotion 149,000 149,000 173,000 154,100
D0502 Tourist Facilities Operations 0 0 0
D0599 Service Support Costs 85,785 85,785 104,305 102,671
Tourism Development and Promotion 234,785 234,785 277,305 256,771
D0601 General Community & Enterprise Expenses 383,000 383,000 329,000 356,000
D0602 RAPID Costs 0 0 0
D0603 Social Inclusion 689,000 689,000 660,500 662,969
D0699 Service Support Costs 139,040 139,040 125,000 122,217
Community and Enterprise Function 1,211,040 1,211,040 1,114,500 1,141,186
D0701 Unfinished Housing Estates 155,000 155,000 171,000 151,000
D0799 Service Support Costs 72,312 72,312 84,676 83,778
Unfinished Housing Estates 227,312 227,312 255,676 234,778
2017 2016
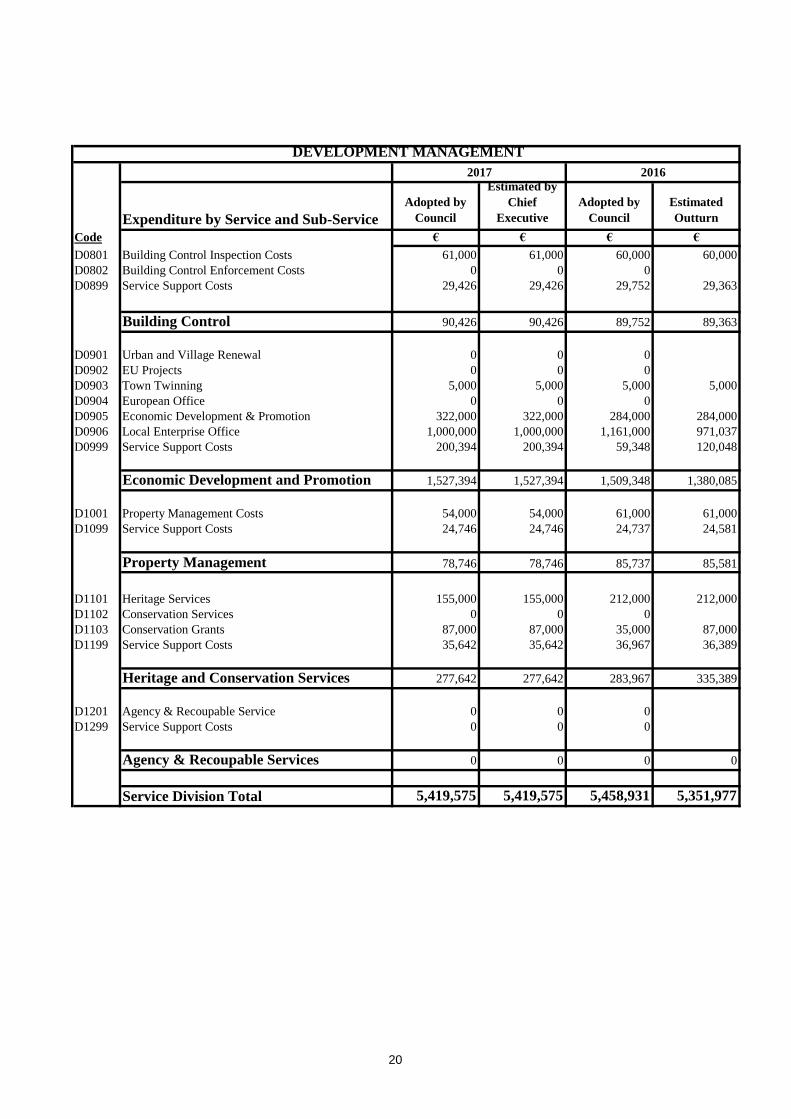
DEVELOPMENT MANAGEMENT
19
Expenditure by Service and Sub-Service
Adopted by
Council
Estimated by
Chief
Executive
Adopted by
Council
Estimated
Outturn
Code € € € €
2017 2016
DEVELOPMENT MANAGEMENT
D0801 Building Control Inspection Costs 61,000 61,000 60,000 60,000
D0802 Building Control Enforcement Costs 0 0 0
D0899 Service Support Costs 29,426 29,426 29,752 29,363
Building Control 90,426 90,426 89,752 89,363
D0901 Urban and Village Renewal 0 0 0
D0902 EU Projects 0 0 0
D0903 Town Twinning 5,000 5,000 5,000 5,000
D0904 European Office 0 0 0
D0905 Economic Development & Promotion 322,000 322,000 284,000 284,000
D0906 Local Enterprise Office 1,000,000 1,000,000 1,161,000 971,037
D0999 Service Support Costs 200,394 200,394 59,348 120,048
Economic Development and Promotion 1,527,394 1,527,394 1,509,348 1,380,085
D1001 Property Management Costs 54,000 54,000 61,000 61,000
D1099 Service Support Costs 24,746 24,746 24,737 24,581
Property Management 78,746 78,746 85,737 85,581
D1101 Heritage Services 155,000 155,000 212,000 212,000
D1102 Conservation Services 0 0 0
D1103 Conservation Grants 87,000 87,000 35,000 87,000
D1199 Service Support Costs 35,642 35,642 36,967 36,389
Heritage and Conservation Services 277,642 277,642 283,967 335,389
D1201 Agency & Recoupable Service 0 0 0
D1299 Service Support Costs 0 0 0
Agency & Recoupable Services 0 0 0 0
Service Division Total 5,419,575 5,419,575 5,458,931 5,351,977
20
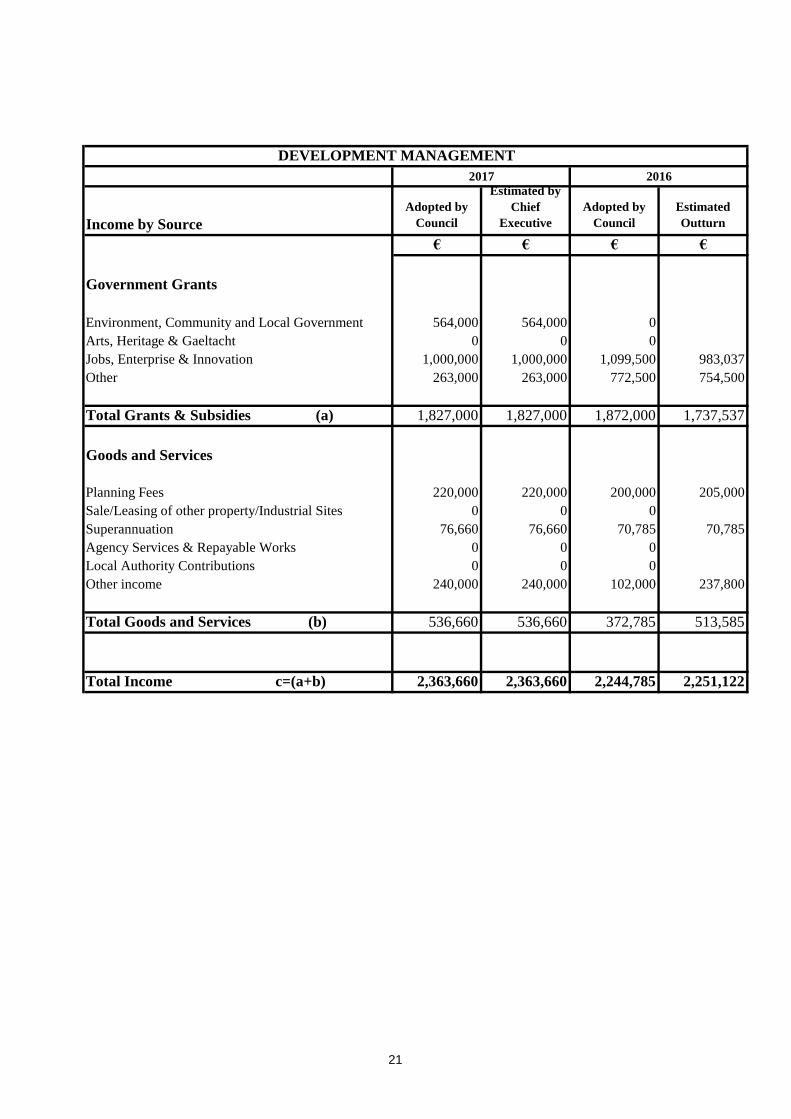
Income by Source
Adopted by
Council
Estimated by
Chief
Executive
Adopted by
Council
Estimated
Outturn
€ € € €
Government Grants
Environment, Community and Local Government 564,000 564,000 0
Arts, Heritage & Gaeltacht 0 0 0
Jobs, Enterprise & Innovation 1,000,000 1,000,000 1,099,500 983,037
Other 263,000 263,000 772,500 754,500
Total Grants & Subsidies (a) 1,827,000 1,827,000 1,872,000 1,737,537
Goods and Services
Planning Fees 220,000 220,000 200,000 205,000
Sale/Leasing of other property/Industrial Sites 0 0 0
Superannuation 76,660 76,660 70,785 70,785
Agency Services & Repayable Works 0 0 0
Local Authority Contributions 0 0 0
Other income 240,000 240,000 102,000 237,800
Total Goods and Services (b) 536,660 536,660 372,785 513,585
Total Income c=(a+b) 2,363,660 2,363,660 2,244,785 2,251,122
DEVELOPMENT MANAGEMENT
2017 2016
21
Expenditure by Service and Sub-Service
Adopted by
Council
Estimated by
Chief
Executive
Adopted by
Council
Estimated
Outturn
Code € € € €
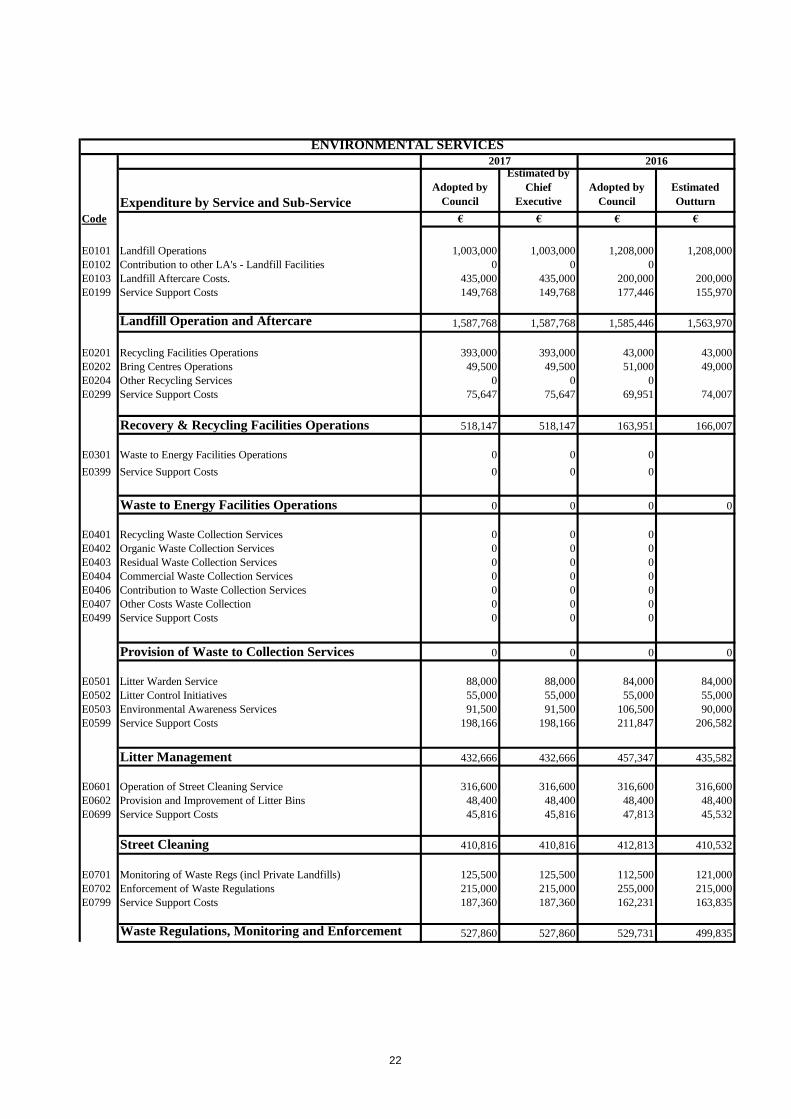
E0101 Landfill Operations 1,003,000 1,003,000 1,208,000 1,208,000
E0102 Contribution to other LA's - Landfill Facilities 0 0 0
E0103 Landfill Aftercare Costs. 435,000 435,000 200,000 200,000
E0199 Service Support Costs 149,768 149,768 177,446 155,970
Landfill Operation and Aftercare 1,587,768 1,587,768 1,585,446 1,563,970
E0201 Recycling Facilities Operations 393,000 393,000 43,000 43,000
E0202 Bring Centres Operations 49,500 49,500 51,000 49,000
E0204 Other Recycling Services 0 0 0
E0299 Service Support Costs 75,647 75,647 69,951 74,007
Recovery & Recycling Facilities Operations 518,147 518,147 163,951 166,007
E0301 Waste to Energy Facilities Operations 0 0 0
E0399 Service Support Costs 0 0 0
Waste to Energy Facilities Operations 0 0 0 0
E0401 Recycling Waste Collection Services 0 0 0
E0402 Organic Waste Collection Services 0 0 0
E0403 Residual Waste Collection Services 0 0 0
E0404 Commercial Waste Collection Services 0 0 0
E0406 Contribution to Waste Collection Services 0 0 0
E0407 Other Costs Waste Collection 0 0 0
E0499 Service Support Costs 0 0 0
Provision of Waste to Collection Services 0 0 0 0
E0501 Litter Warden Service 88,000 88,000 84,000 84,000
E0502 Litter Control Initiatives 55,000 55,000 55,000 55,000
E0503 Environmental Awareness Services 91,500 91,500 106,500 90,000
E0599 Service Support Costs 198,166 198,166 211,847 206,582
Litter Management 432,666 432,666 457,347 435,582
E0601 Operation of Street Cleaning Service 316,600 316,600 316,600 316,600
E0602 Provision and Improvement of Litter Bins 48,400 48,400 48,400 48,400
E0699 Service Support Costs 45,816 45,816 47,813 45,532
Street Cleaning 410,816 410,816 412,813 410,532
E0701 Monitoring of Waste Regs (incl Private Landfills) 125,500 125,500 112,500 121,000
E0702 Enforcement of Waste Regulations 215,000 215,000 255,000 215,000
E0799 Service Support Costs 187,360 187,360 162,231 163,835
Waste Regulations, Monitoring and Enforcement 527,860 527,860 529,731 499,835
2017 2016
ENVIRONMENTAL SERVICES
22
Expenditure by Service and Sub-Service
Adopted by
Council
Estimated by
Chief
Executive
Adopted by
Council
Estimated
Outturn
Code € € € €
2017 2016
ENVIRONMENTAL SERVICES
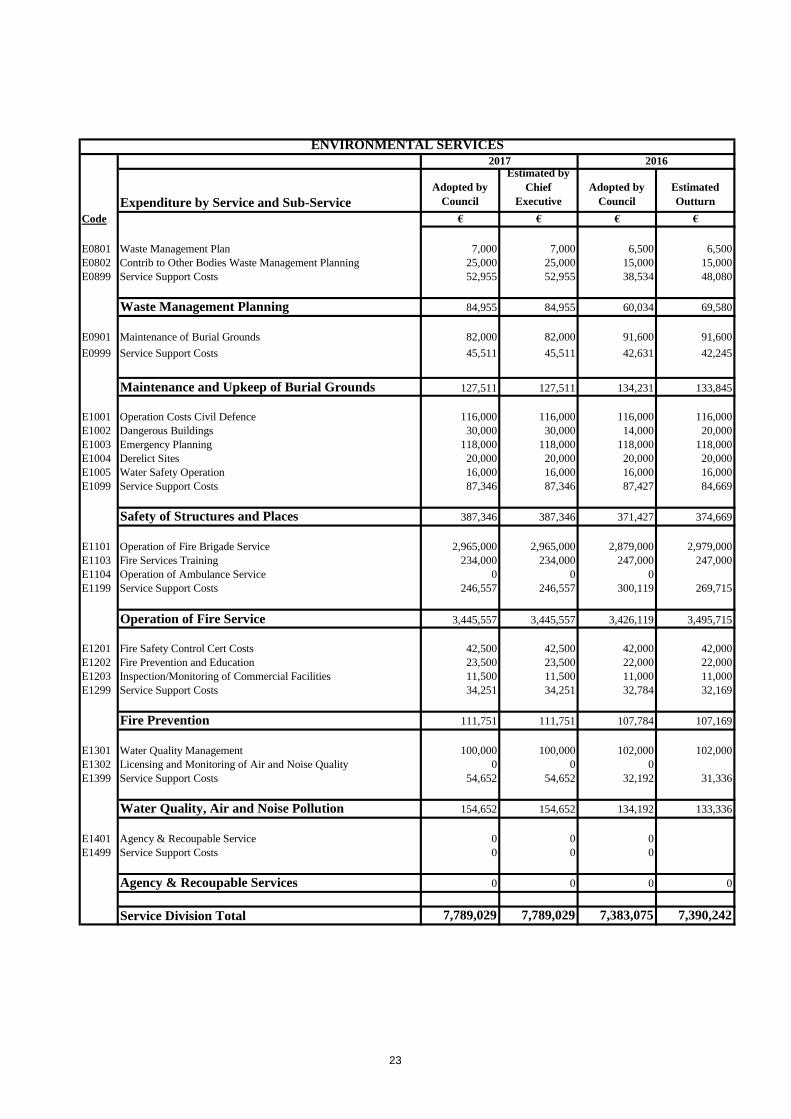
E0801 Waste Management Plan 7,000 7,000 6,500 6,500
E0802 Contrib to Other Bodies Waste Management Planning 25,000 25,000 15,000 15,000
E0899 Service Support Costs 52,955 52,955 38,534 48,080
Waste Management Planning 84,955 84,955 60,034 69,580
E0901 Maintenance of Burial Grounds 82,000 82,000 91,600 91,600
E0999 Service Support Costs 45,511 45,511 42,631 42,245
Maintenance and Upkeep of Burial Grounds 127,511 127,511 134,231 133,845
E1001 Operation Costs Civil Defence 116,000 116,000 116,000 116,000
E1002 Dangerous Buildings 30,000 30,000 14,000 20,000
E1003 Emergency Planning 118,000 118,000 118,000 118,000
E1004 Derelict Sites 20,000 20,000 20,000 20,000
E1005 Water Safety Operation 16,000 16,000 16,000 16,000
E1099 Service Support Costs 87,346 87,346 87,427 84,669
Safety of Structures and Places 387,346 387,346 371,427 374,669
E1101 Operation of Fire Brigade Service 2,965,000 2,965,000 2,879,000 2,979,000
E1103 Fire Services Training 234,000 234,000 247,000 247,000
E1104 Operation of Ambulance Service 0 0 0
E1199 Service Support Costs 246,557 246,557 300,119 269,715
Operation of Fire Service 3,445,557 3,445,557 3,426,119 3,495,715
E1201 Fire Safety Control Cert Costs 42,500 42,500 42,000 42,000
E1202 Fire Prevention and Education 23,500 23,500 22,000 22,000
E1203 Inspection/Monitoring of Commercial Facilities 11,500 11,500 11,000 11,000
E1299 Service Support Costs 34,251 34,251 32,784 32,169
Fire Prevention 111,751 111,751 107,784 107,169
E1301 Water Quality Management 100,000 100,000 102,000 102,000
E1302 Licensing and Monitoring of Air and Noise Quality 0 0 0
E1399 Service Support Costs 54,652 54,652 32,192 31,336
Water Quality, Air and Noise Pollution 154,652 154,652 134,192 133,336
E1401 Agency & Recoupable Service 0 0 0
E1499 Service Support Costs 0 0 0
Agency & Recoupable Services 0 0 0 0
Service Division Total 7,789,029 7,789,029 7,383,075 7,390,242
23

Income by Source
Adopted by
Council
Estimated by
Chief
Executive
Adopted by
Council
Estimated
Outturn
€ € € €
Government Grants
Environment, Community and Local Government 192,000 192,000 210,000 175,000
Social Protection 0 0 0
Defence 75,000 75,000 75,000 75,000
Other 0 0 0
Total Grants & Subsidies (a) 267,000 267,000 285,000 250,000
Goods and Services
Domestic Refuse Charges 0 0 0
Commercial Refuse Charges 0 0 0
Landfill Charges 393,000 393,000 340,000 340,000
Fire Charges 500,000 500,000 400,000 500,000
Superannuation 64,545 64,545 61,462 61,462
Agency Services & Repayable Works 0 0 0
Local Authority Contributions 120,000 120,000 118,000 70,000
Other income 401,000 401,000 222,000 306,000
Total Goods and Services (b) 1,478,545 1,478,545 1,141,462 1,277,462
Total Income c=(a+b) 1,745,545 1,745,545 1,426,462 1,527,462
ENVIRONMENTAL SERVICES
2017 2016
24

Expenditure by Service and Sub-Service
Adopted by
Council
Estimated by
Chief
Executive
Adopted by
Council
Estimated
Outturn
Code € € € €
F0101 Leisure Facilities Operations 75,000 75,000 74,500 75,000
F0103 Contribution to External Bodies Leisure Facilities 0 0 0
F0199 Service Support Costs 662 662 568 63
Leisure Facilities Operations 75,662 75,662 75,068 75,063
F0201 Library Service Operations 1,431,000 1,431,000 1,312,000 1,312,000
F0202 Archive Service 11,000 11,000 10,500 10,500
F0204 Purchase of Books, CD’s etc. 100,000 100,000 100,000 75,000
F0205 Contributions to Library Organisations 0 0 0
F0299 Service Support Costs 571,259 571,259 468,625 455,646
Operation of Library and Archival Service 2,113,259 2,113,259 1,891,125 1,853,146
F0301 Parks, Pitches & Open Spaces 141,000 141,000 106,000 106,000
F0302 Playgrounds 148,400 148,400 132,000 132,000
F0303 Beaches 0 0 0
F0399 Service Support Costs 43,137 43,137 44,911 43,299
Outdoor Leisure Areas Operations 332,537 332,537 282,911 281,299
F0401 Community Grants 119,000 119,000 108,000 108,000
F0402 Operation of Sports Hall/Stadium 0 0 0
F0403 Community Facilities 0 0 0
F0404 Recreational Development 190,000 190,000 179,500 182,000
F0499 Service Support Costs 170,092 170,092 207,458 182,783
Community Sport and Recreational
Development 479,092 479,092 494,958 472,783
F0501 Administration of the Arts Programme 630,700 630,700 598,700 598,700
F0502 Contributions to other Bodies Arts Programme 135,000 135,000 135,000 135,000
F0503 Museums Operations 0 0 0
F0504 Heritage/Interpretive Facilities Operations 2,300 2,300 2,800 2,800
F0505 Festivals & Concerts 94,000 94,000 76,000 94,000
F0599 Service Support Costs 241,813 241,813 235,707 230,649
Operation of Arts Programme 1,103,813 1,103,813 1,048,207 1,061,149
F0601 Agency & Recoupable Service 120,000 120,000 120,000 120,000
F0699 Service Support Costs 0 0 0
Agency & Recoupable Services 120,000 120,000 120,000 120,000
Service Division Total 4,224,363 4,224,363 3,912,269 3,863,440
2017 2016
RECREATION & AMENITY
25
Income by Source
Adopted by
Council
Estimated by
Chief
Executive
Adopted by
Council
Estimated
Outturn
€ € € €
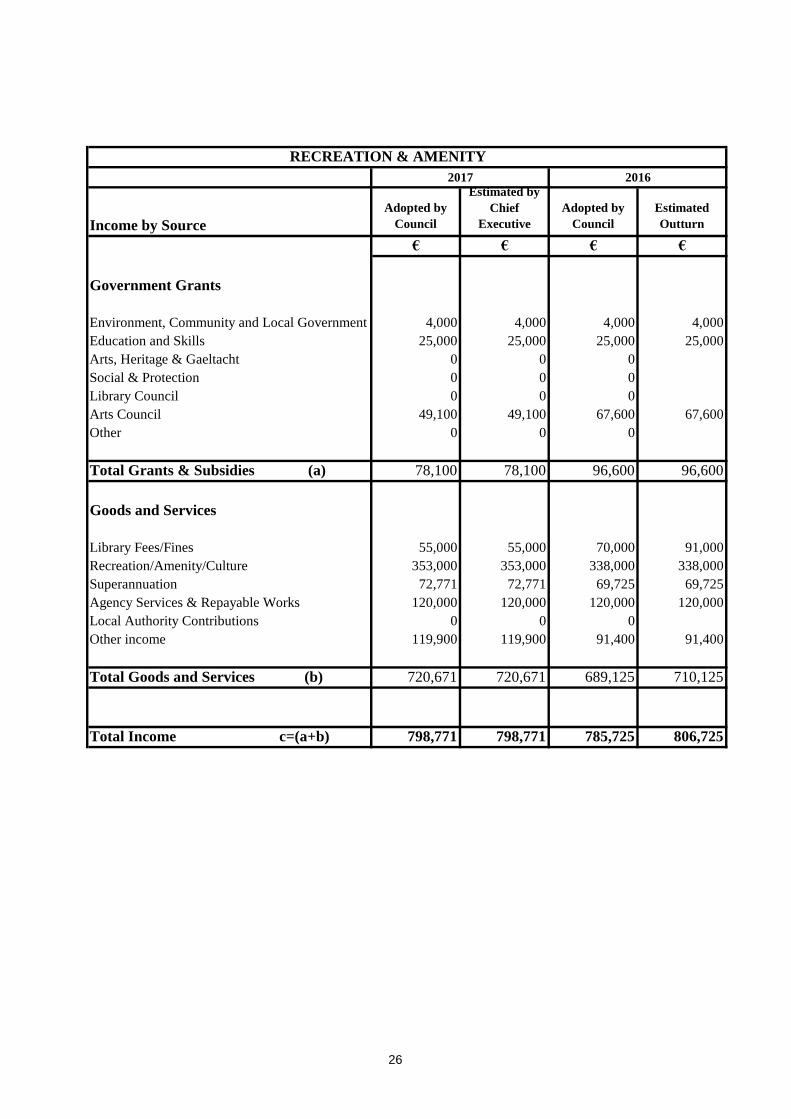
Government Grants
Environment, Community and Local Government 4,000 4,000 4,000 4,000
Education and Skills 25,000 25,000 25,000 25,000
Arts, Heritage & Gaeltacht 0 0 0
Social & Protection 0 0 0
Library Council 0 0 0
Arts Council 49,100 49,100 67,600 67,600
Other 0 0 0
Total Grants & Subsidies (a) 78,100 78,100 96,600 96,600
Goods and Services
Library Fees/Fines 55,000 55,000 70,000 91,000
Recreation/Amenity/Culture 353,000 353,000 338,000 338,000
Superannuation 72,771 72,771 69,725 69,725
Agency Services & Repayable Works 120,000 120,000 120,000 120,000
Local Authority Contributions 0 0 0
Other income 119,900 119,900 91,400 91,400
Total Goods and Services (b) 720,671 720,671 689,125 710,125
Total Income c=(a+b) 798,771 798,771 785,725 806,725
RECREATION & AMENITY
2017 2016
26
Expenditure by Service and Sub-Service
Adopted by
Council
Estimated by
Chief
Executive
Adopted by
Council
Estimated
Outturn
Code € € € €
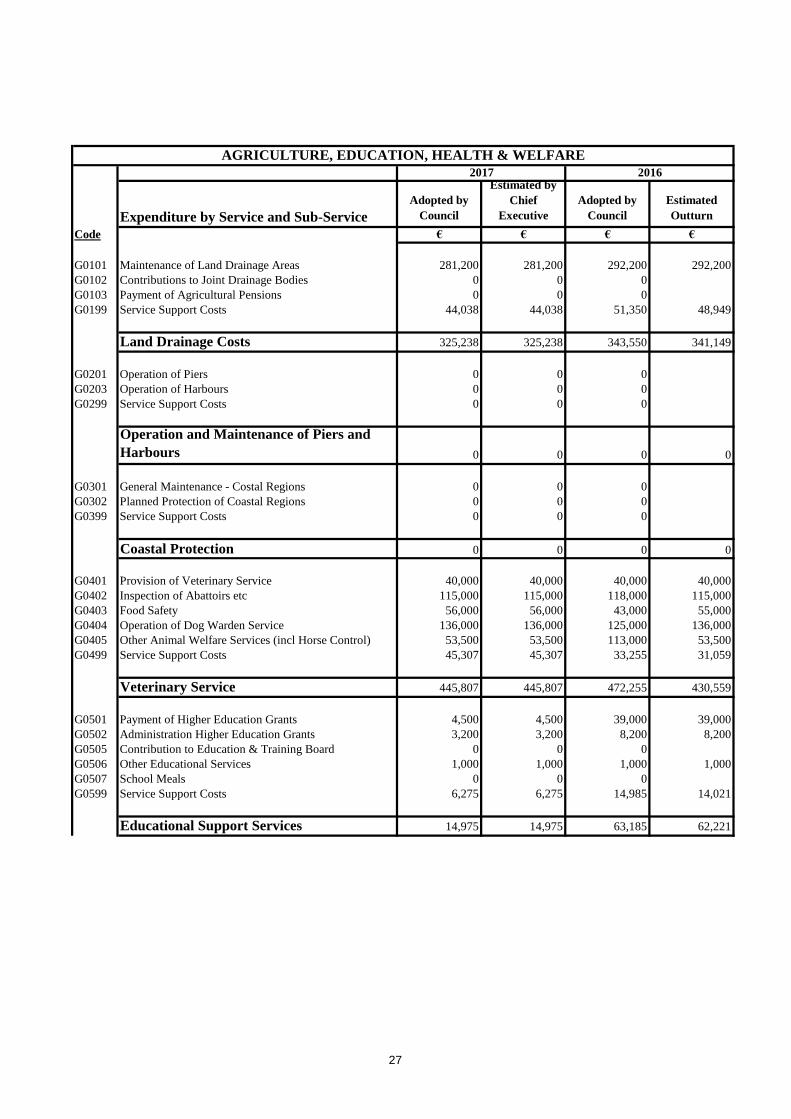
G0101 Maintenance of Land Drainage Areas 281,200 281,200 292,200 292,200
G0102 Contributions to Joint Drainage Bodies 0 0 0
G0103 Payment of Agricultural Pensions 0 0 0
G0199 Service Support Costs 44,038 44,038 51,350 48,949
Land Drainage Costs 325,238 325,238 343,550 341,149
G0201 Operation of Piers 0 0 0
G0203 Operation of Harbours 0 0 0
G0299 Service Support Costs 0 0 0
Operation and Maintenance of Piers and
Harbours 0 0 0 0
G0301 General Maintenance - Costal Regions 0 0 0
G0302 Planned Protection of Coastal Regions 0 0 0
G0399 Service Support Costs 0 0 0
Coastal Protection 0 0 0 0
G0401 Provision of Veterinary Service 40,000 40,000 40,000 40,000
G0402 Inspection of Abattoirs etc 115,000 115,000 118,000 115,000
G0403 Food Safety 56,000 56,000 43,000 55,000
G0404 Operation of Dog Warden Service 136,000 136,000 125,000 136,000
G0405 Other Animal Welfare Services (incl Horse Control) 53,500 53,500 113,000 53,500
G0499 Service Support Costs 45,307 45,307 33,255 31,059
Veterinary Service 445,807 445,807 472,255 430,559
G0501 Payment of Higher Education Grants 4,500 4,500 39,000 39,000
G0502 Administration Higher Education Grants 3,200 3,200 8,200 8,200
G0505 Contribution to Education & Training Board 0 0 0
G0506 Other Educational Services 1,000 1,000 1,000 1,000
G0507 School Meals 0 0 0
G0599 Service Support Costs 6,275 6,275 14,985 14,021
Educational Support Services 14,975 14,975 63,185 62,221
2017 2016
AGRICULTURE, EDUCATION, HEALTH & WELFARE
27
Expenditure by Service and Sub-Service
Adopted by
Council
Estimated by
Chief
Executive
Adopted by
Council
Estimated
Outturn
Code € € € €
2017 2016
AGRICULTURE, EDUCATION, HEALTH & WELFARE
G0601 Agency & Recoupable Service 0 0 0
G0699 Service Support Costs 0 0 0
Agency & Recoupable Services 0 0 0 0
Service Division Total 786,020 786,020 878,990 833,928
28
Income by Source
Adopted by
Council
Estimated by
Chief
Executive
Adopted by
Council
Estimated
Outturn
€ € € €
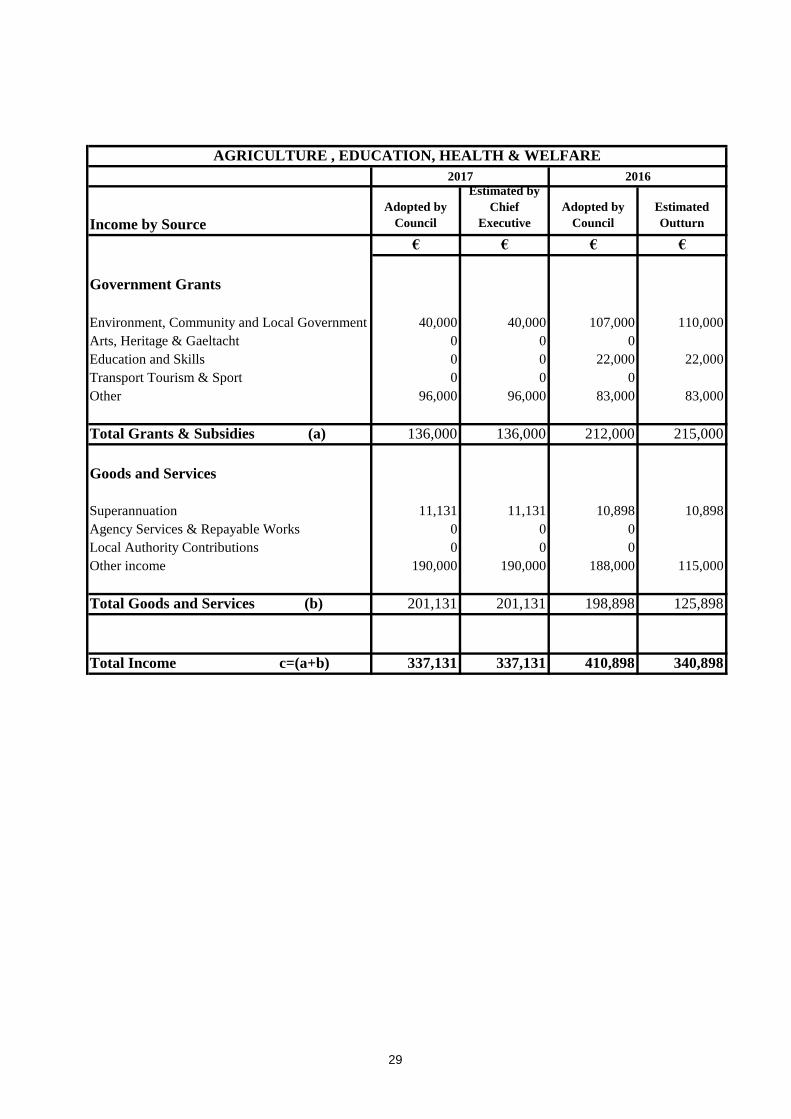
Government Grants
Environment, Community and Local Government 40,000 40,000 107,000 110,000
Arts, Heritage & Gaeltacht 0 0 0
Education and Skills 0 0 22,000 22,000
Transport Tourism & Sport 0 0 0
Other 96,000 96,000 83,000 83,000
Total Grants & Subsidies (a) 136,000 136,000 212,000 215,000
Goods and Services
Superannuation 11,131 11,131 10,898 10,898
Agency Services & Repayable Works 0 0 0
Local Authority Contributions 0 0 0
Other income 190,000 190,000 188,000 115,000
Total Goods and Services (b) 201,131 201,131 198,898 125,898
Total Income c=(a+b) 337,131 337,131 410,898 340,898
AGRICULTURE , EDUCATION, HEALTH & WELFARE
2017 2016
29
Expenditure by Service and Sub-Service
Adopted by
Council
Estimated by
Chief
Executive
Adopted by
Council
Estimated
Outturn
Code € € € €
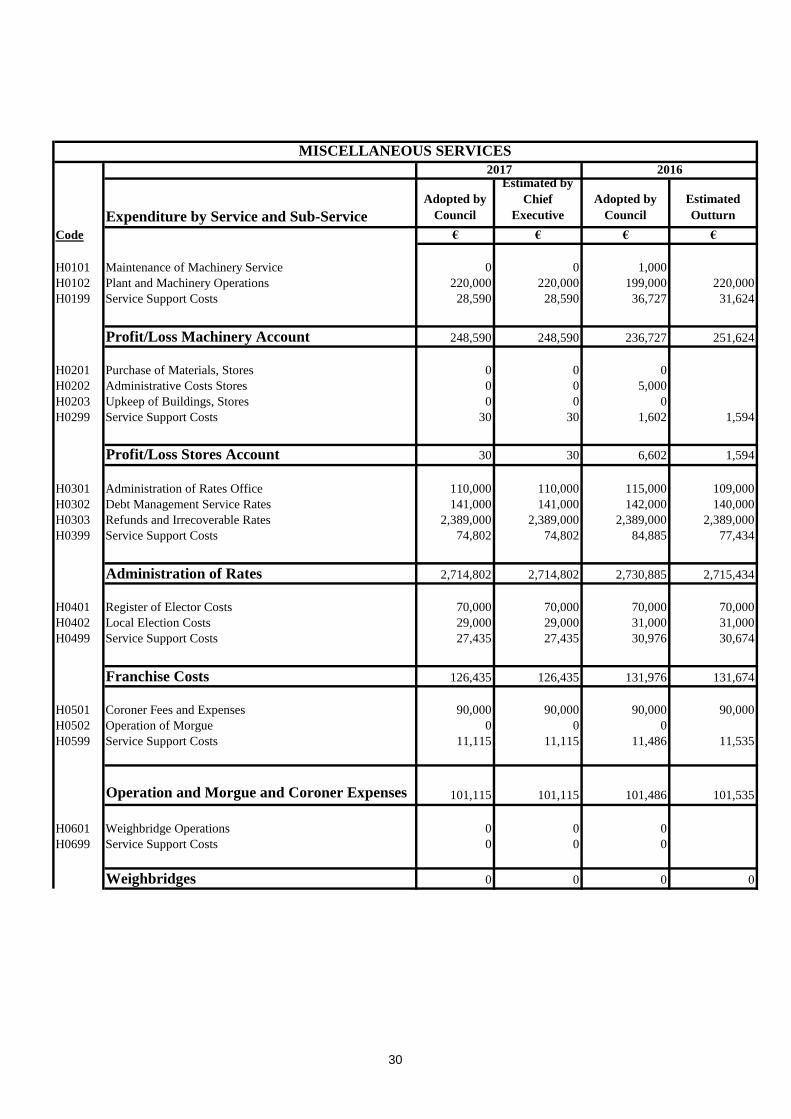
H0101 Maintenance of Machinery Service 0 0 1,000
H0102 Plant and Machinery Operations 220,000 220,000 199,000 220,000
H0199 Service Support Costs 28,590 28,590 36,727 31,624
Profit/Loss Machinery Account 248,590 248,590 236,727 251,624
H0201 Purchase of Materials, Stores 0 0 0
H0202 Administrative Costs Stores 0 0 5,000
H0203 Upkeep of Buildings, Stores 0 0 0
H0299 Service Support Costs 30 30 1,602 1,594
Profit/Loss Stores Account 30 30 6,602 1,594
H0301 Administration of Rates Office 110,000 110,000 115,000 109,000
H0302 Debt Management Service Rates 141,000 141,000 142,000 140,000
H0303 Refunds and Irrecoverable Rates 2,389,000 2,389,000 2,389,000 2,389,000
H0399 Service Support Costs 74,802 74,802 84,885 77,434
Administration of Rates 2,714,802 2,714,802 2,730,885 2,715,434
H0401 Register of Elector Costs 70,000 70,000 70,000 70,000
H0402 Local Election Costs 29,000 29,000 31,000 31,000
H0499 Service Support Costs 27,435 27,435 30,976 30,674
Franchise Costs 126,435 126,435 131,976 131,674
H0501 Coroner Fees and Expenses 90,000 90,000 90,000 90,000
H0502 Operation of Morgue 0 0 0
H0599 Service Support Costs 11,115 11,115 11,486 11,535
Operation and Morgue and Coroner Expenses 101,115 101,115 101,486 101,535
H0601 Weighbridge Operations 0 0 0
H0699 Service Support Costs 0 0 0
Weighbridges 0 0 0 0
MISCELLANEOUS SERVICES
2017 2016
30
Expenditure by Service and Sub-Service
Adopted by
Council
Estimated by
Chief
Executive
Adopted by
Council
Estimated
Outturn
Code € € € €
MISCELLANEOUS SERVICES
2017 2016
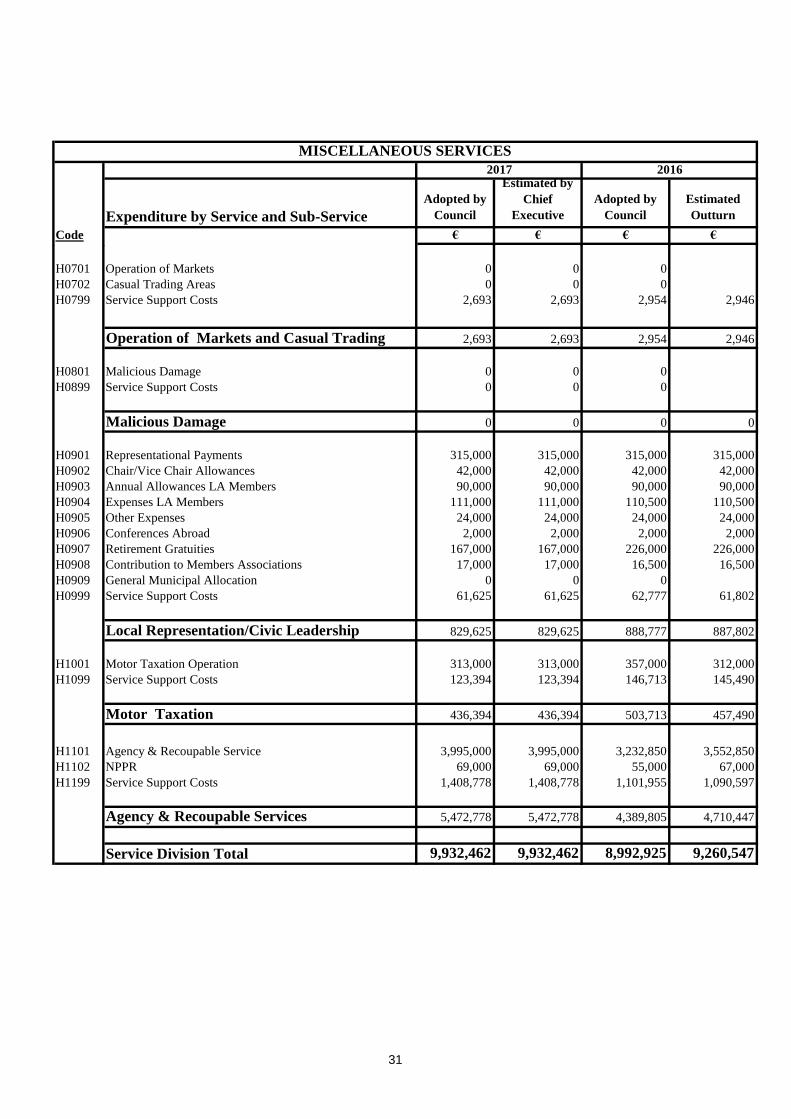
H0701 Operation of Markets 0 0 0
H0702 Casual Trading Areas 0 0 0
H0799 Service Support Costs 2,693 2,693 2,954 2,946
Operation of Markets and Casual Trading 2,693 2,693 2,954 2,946
H0801 Malicious Damage 0 0 0
H0899 Service Support Costs 0 0 0
Malicious Damage 0 0 0 0
H0901 Representational Payments 315,000 315,000 315,000 315,000
H0902 Chair/Vice Chair Allowances 42,000 42,000 42,000 42,000
H0903 Annual Allowances LA Members 90,000 90,000 90,000 90,000
H0904 Expenses LA Members 111,000 111,000 110,500 110,500
H0905 Other Expenses 24,000 24,000 24,000 24,000
H0906 Conferences Abroad 2,000 2,000 2,000 2,000
H0907 Retirement Gratuities 167,000 167,000 226,000 226,000
H0908 Contribution to Members Associations 17,000 17,000 16,500 16,500
H0909 General Municipal Allocation 0 0 0
H0999 Service Support Costs 61,625 61,625 62,777 61,802
Local Representation/Civic Leadership 829,625 829,625 888,777 887,802
H1001 Motor Taxation Operation 313,000 313,000 357,000 312,000
H1099 Service Support Costs 123,394 123,394 146,713 145,490
Motor Taxation 436,394 436,394 503,713 457,490
H1101 Agency & Recoupable Service 3,995,000 3,995,000 3,232,850 3,552,850
H1102 NPPR 69,000 69,000 55,000 67,000
H1199 Service Support Costs 1,408,778 1,408,778 1,101,955 1,090,597
Agency & Recoupable Services 5,472,778 5,472,778 4,389,805 4,710,447
Service Division Total 9,932,462 9,932,462 8,992,925 9,260,547
31
Income by Source
Adopted by
Council
Estimated by
Chief
Executive
Adopted by
Council
Estimated
Outturn
€ € € €
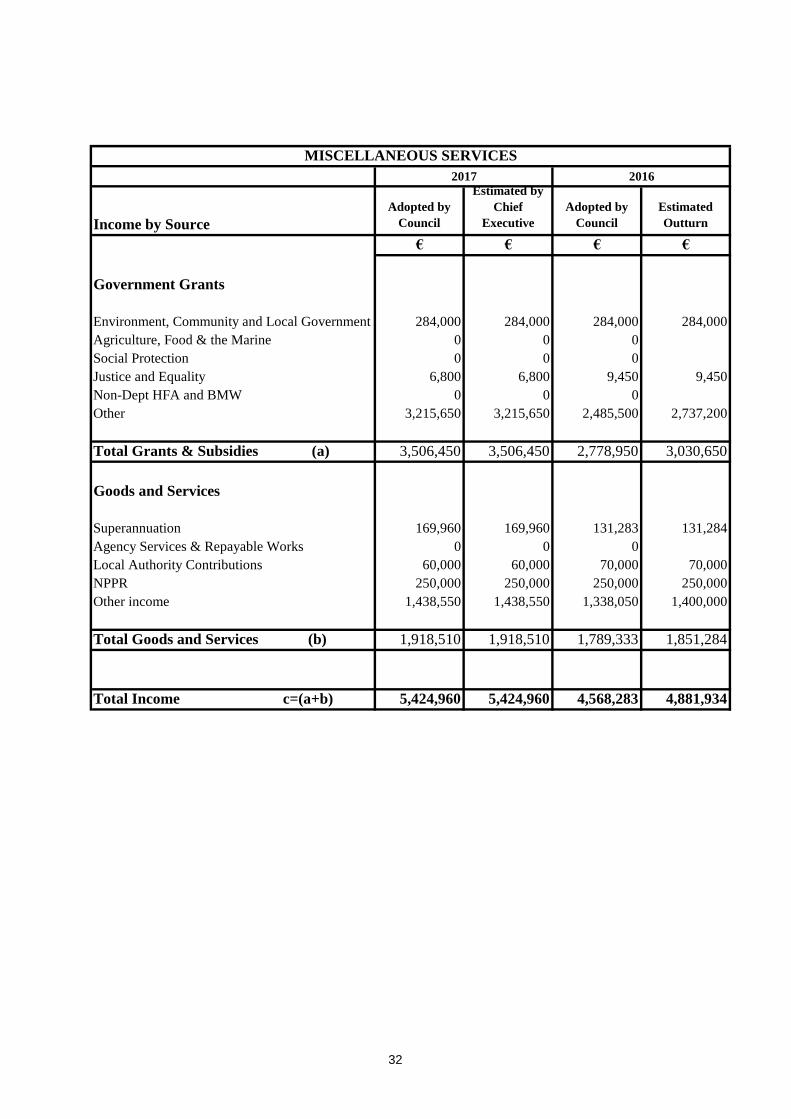
Government Grants
Environment, Community and Local Government 284,000 284,000 284,000 284,000
Agriculture, Food & the Marine 0 0 0
Social Protection 0 0 0
Justice and Equality 6,800 6,800 9,450 9,450
Non-Dept HFA and BMW 0 0 0
Other 3,215,650 3,215,650 2,485,500 2,737,200
Total Grants & Subsidies (a) 3,506,450 3,506,450 2,778,950 3,030,650
Goods and Services
Superannuation 169,960 169,960 131,283 131,284
Agency Services & Repayable Works 0 0 0
Local Authority Contributions 60,000 60,000 70,000 70,000
NPPR 250,000 250,000 250,000 250,000
Other income 1,438,550 1,438,550 1,338,050 1,400,000
Total Goods and Services (b) 1,918,510 1,918,510 1,789,333 1,851,284
Total Income c=(a+b) 5,424,960 5,424,960 4,568,283 4,881,934
MISCELLANEOUS SERVICES
2017 2016
32

CERTIFICATE OF ADOPTION
I hereby certify that at the budget meeting of Laois County Council held this 14th day of November,
2016,the Council by Resolution adopted for the financial year ending on the 31st day of December, 2017
the budget set out in Tables A to F and by Resolution determined in accordance with the said budget the
Rate set out in Table A to be the annual rate on valuation to be levied for that year for the purposes set
out in those Tables.
33
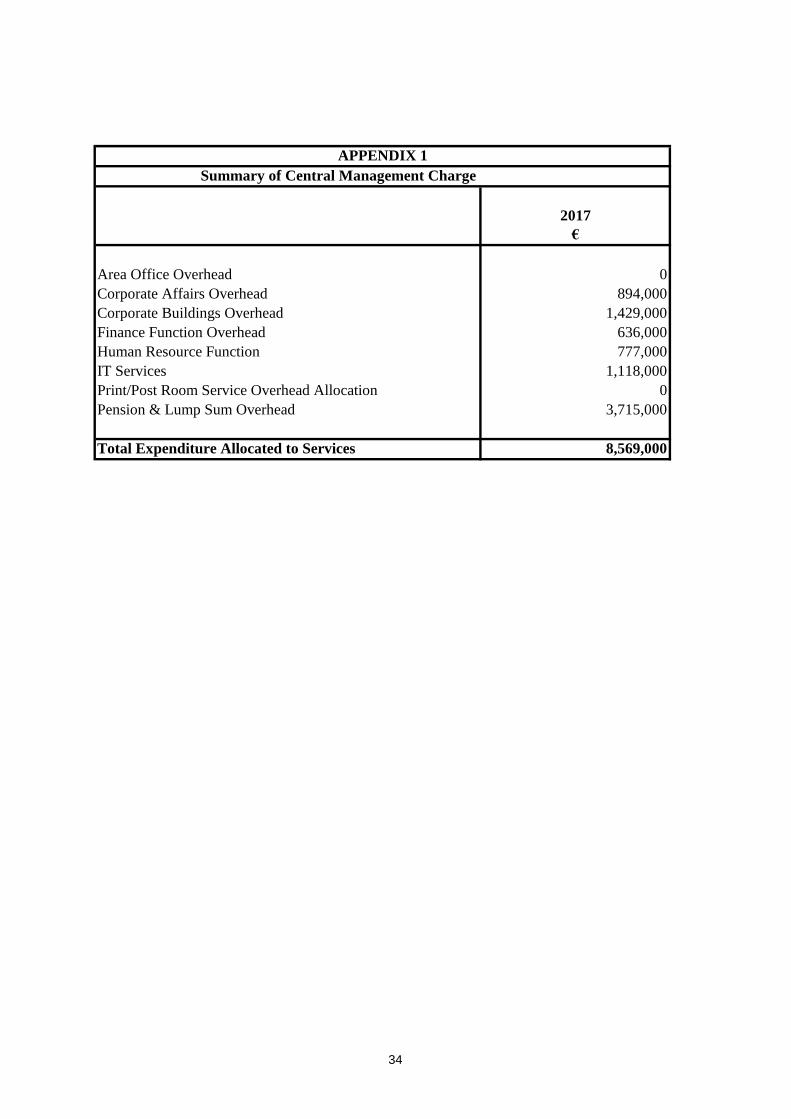
2017
€
Area Office Overhead 0
Corporate Affairs Overhead 894,000
Corporate Buildings Overhead 1,429,000
Finance Function Overhead 636,000
Human Resource Function 777,000
IT Services 1,118,000
Print/Post Room Service Overhead Allocation 0
Pension & Lump Sum Overhead 3,715,000
Total Expenditure Allocated to Services 8,569,000
Summary of Central Management Charge
APPENDIX 1
34
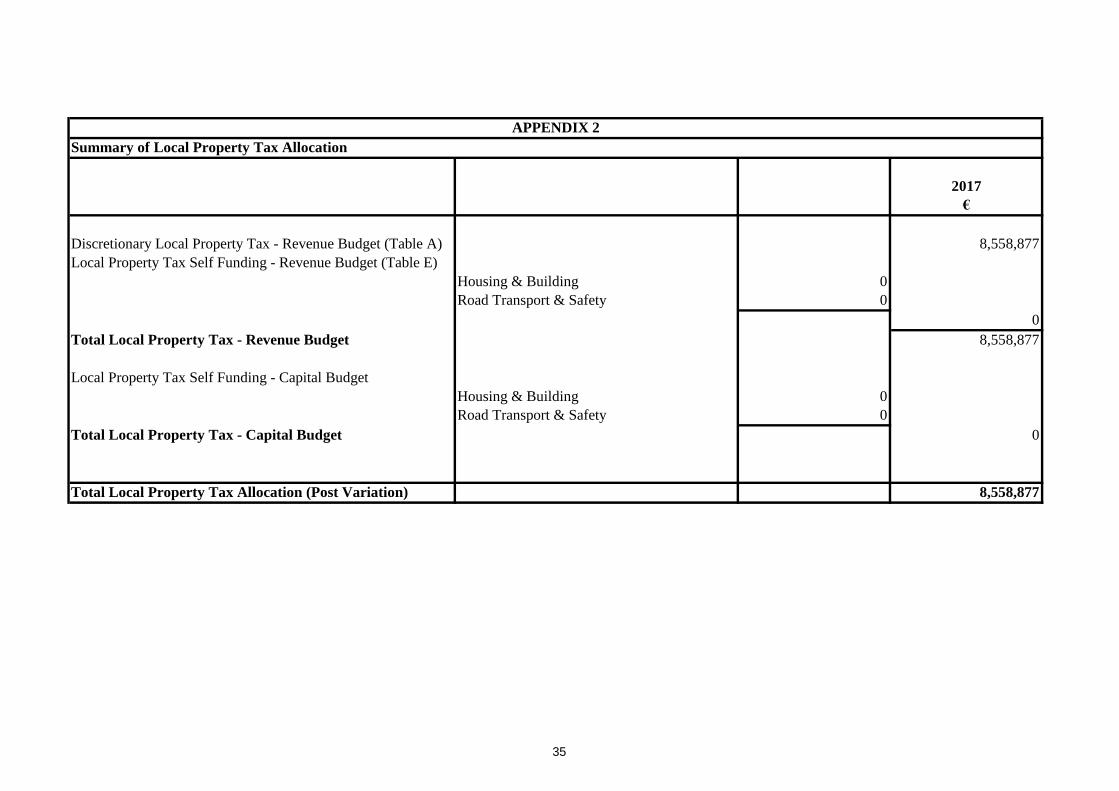
Summary of Local Property Tax Allocation
2017
€
Discretionary Local Property Tax - Revenue Budget (Table A) 8,558,877
Local Property Tax Self Funding - Revenue Budget (Table E)
Housing & Building 0
Road Transport & Safety 0
0
Total Local Property Tax - Revenue Budget 8,558,877
Local Property Tax Self Funding - Capital Budget
Housing & Building 0
Road Transport & Safety 0
Total Local Property Tax - Capital Budget 0
Total Local Property Tax Allocation (Post Variation) 8,558,877
APPENDIX 2
35