Acoustic optimization of funicular shells - ETH Z · Acoustic optimization of funicular shells...
13
Proceedings of the International Association for Shell and Spatial Structures (IASS) Symposium 2015, Amsterdam Future Visions 17 - 20 August 2015, Amsterdam, The Netherlands Acoustic optimization of funicular shells Tomás MÉNDEZ ECHENAGUCIA*, Philippe BLOCK a , * ETH Zurich, Institute of Technology in Architecture, Block Research Group Stefano-Franscini-Platz 5, HIL H 46.2, 8093 Zurich, Switzerland [email protected] a ETH Zurich, Institute of Technology in Architecture, Block Research Group Abstract Funicular shell structures are usually associated to synclastic shapes, which are concave towards the inside. The use of these shapes as sound reflective ceilings in auditoria is generally avoided as they can cause undesirable sound concentrations. These are the source of acoustical defects, such as echoes and colouration, and tend to have a negative subjective impression by the audience. Existing concert spaces built with synclastic shapes thus typically had to be altered by invasive sound reflective surfaces and treatments that significantly influence their spatial quality. Previous research on the use of Multi-Objective Genetic Algorithms (MOGAs) for the shape optimization of concert spaces shows the acoustic potential of freeform, continuous surfaces with both convex and concave areas, and the difficulty of achieving high standards with synclastic shapes (Mendez Echenagucia et al. [13], Mendez Echenagucia [14]). Thrust Network Analysis (TNA) is capable of generating compression-only shapes that go beyond synclastic surfaces, thus presenting an opportunity for the use of funicular structures for concert auditoria (Block [6]). This paper presents the use of Multi-Objective Genetic Algorithms (MOGAs) for the acoustical optimization of compression-only shell structures. The MOGA combines ray-tracing simulation for the study of the acoustical quality of the spaces with TNA for the generation of freeform funicular shapes. The method is exemplified in the case study of a multi-purpose room in Barranquilla, Colombia. The MOGA employed in this paper uses the independent force densities in the TNA framework as design parameters to control the shape of the ceiling. In other words, the geometry is not controlled with a parametric model that moves control points to modify the shape, but by modifying the force distribution and boundary conditions of a TNA model. In doing so, the MOGA generates shapes that are all compression only. Keywords: early-stage design, room acoustics, form finding, funicular shells, multi-objective optimization, genetic algorithms.
-
Upload
phungkhuong -
Category
Documents
-
view
220 -
download
0
Transcript of Acoustic optimization of funicular shells - ETH Z · Acoustic optimization of funicular shells...

Proceedings of the International Association for Shell and Spatial Structures (IASS)
Symposium 2015, Amsterdam
Future Visions
17 - 20 August 2015, Amsterdam, The Netherlands
Acoustic optimization of funicular shells
Tomás MÉNDEZ ECHENAGUCIA*, Philippe BLOCKa,
* ETH Zurich, Institute of Technology in Architecture, Block Research Group
Stefano-Franscini-Platz 5, HIL H 46.2, 8093 Zurich, Switzerland
a ETH Zurich, Institute of Technology in Architecture, Block Research Group
Abstract
Funicular shell structures are usually associated to synclastic shapes, which are concave towards the
inside. The use of these shapes as sound reflective ceilings in auditoria is generally avoided as they
can cause undesirable sound concentrations. These are the source of acoustical defects, such as echoes
and colouration, and tend to have a negative subjective impression by the audience. Existing concert
spaces built with synclastic shapes thus typically had to be altered by invasive sound reflective
surfaces and treatments that significantly influence their spatial quality.
Previous research on the use of Multi-Objective Genetic Algorithms (MOGAs) for the shape
optimization of concert spaces shows the acoustic potential of freeform, continuous surfaces with both
convex and concave areas, and the difficulty of achieving high standards with synclastic shapes
(Mendez Echenagucia et al. [13], Mendez Echenagucia [14]). Thrust Network Analysis (TNA) is
capable of generating compression-only shapes that go beyond synclastic surfaces, thus presenting an
opportunity for the use of funicular structures for concert auditoria (Block [6]).
This paper presents the use of Multi-Objective Genetic Algorithms (MOGAs) for the acoustical
optimization of compression-only shell structures. The MOGA combines ray-tracing simulation for
the study of the acoustical quality of the spaces with TNA for the generation of freeform funicular
shapes. The method is exemplified in the case study of a multi-purpose room in Barranquilla,
Colombia.
The MOGA employed in this paper uses the independent force densities in the TNA framework as
design parameters to control the shape of the ceiling. In other words, the geometry is not controlled
with a parametric model that moves control points to modify the shape, but by modifying the force
distribution and boundary conditions of a TNA model. In doing so, the MOGA generates shapes that
are all compression only.
Keywords: early-stage design, room acoustics, form finding, funicular shells, multi-objective
optimization, genetic algorithms.

Proceedings of the International Association for Shell and Spatial Structures (IASS) Symposium 2015, Amsterdam
Future Visions
1. Introduction
1.1. Funicular shells for concert auditoria
The acoustical quality of spaces intended for the enjoyment of music is greatly dependent on their size
and shape. The distribution and arrival time of reflected sound energy is strongly determined by the
shape and position of sound reflecting surfaces in relation to sound sources and the audience. Concave
surfaces concentrate sound over small room areas while convex surfaces diffuse sound over larger
areas. Funicular shell structures are usually characterized by synclastic shapes which are concave
towards the inside, creating the risk of sound concentrations in small audience areas, echoes and
sound colouration. Examples of buildings in which this problem occurred, are the Royal Albert Hall in
London and the Tonhalle in Dusseldorf. These rooms originally had spherical dome ceilings, which
caused concentrations that could not be fixed without major alterations that obscured the domes from
the sound source (Vercammen [21]). In both cases, unsuccessful attempts were made to correct the
problem by adding sound-absorbing and diffusing surfaces to the domes, but the problem was only
solved by hanging sound reflectors under the domes, which significantly affect the space (figure 1).
Figure 1: Longitudinal section through the Royal Albert Hall showing suspended reflectors
(Barron[3])
For this reason, most concert spaces have false ceilings, which are not self-supporting. In order for
them to be sound reflecting in all sound frequencies, and to avoid vibrations, these surfaces tend to be
quite heavy and costly. They are usually hanging from a substructure that needs to take these high
loads. The present paper proposes the use of Thrust Network Analysis (TNA) in combination with
multi-objective optimization for the purposes of generating funicular shapes that can combine an
efficient (and stiff) shell structure with sound-reflecting surfaces that distribute sound energy
appropriately.
1.2. “Fábrica de Cultura” Barranquilla
The method presented in this paper is being used for the design of a multi-purpose auditorium in the
project "Fábrica de Cultura". This building is an arts school to be built in the heart of Barranquilla,
Colombia, it is designed in a collaboration between the Urban Think Tank chair of architecture and
Urban design, the chair of Architecture and Building Systems and the Block Research Group, all at

Proceedings of the International Association for Shell and Spatial Structures (IASS) Symposium 2015, Amsterdam
Future Visions
ETH Zurich. The Block Research Group is contributing to this joint research project with the
development of the vaulted structure for the auditorium. The structure consists of a ribbed, thin-tile
vault spanning a space of 20 by 40 meters. The room is planned for 500 spectators, and is to be used
by students and performers predominantly for amplified music and theatre, with the additional
possibility to be used for unamplified performances of small ensembles.
2. Methodology
2.1. Room acoustic parameters
In the late 1890's, W.C. Sabine developed the concept of the Reverberation Time, which became the
basis for the study of room acoustics to come. Since Sabine, the subjective impressions experienced
by listeners (like reverberation, intimacy, clarity or sound strength) have been related to objective
measures or room acoustic parameters. Each parameter has been developed to represent one aspect of
the overall sound quality in a given point in the room, for a specific sound frequency. Reverberation
times, as well as most other acoustical parameters, are calculated from the measured impulse response
in that given point in the room. The impulse response is defined by the ISO 3382-1 standard as “the
temporal evolution of the sound pressure observed at a point in a room as a result of the emission of a
Dirac impulse at another point in the room” (ISO [11]). Room acoustic parameters are the subject of
the ISO 3382-1 standard. A historical description of the parameters is presented in Lacatis et al. [12].
A comprehensive study of each parameter, their Just Noticeable Differences (JNDs) and proposed
optimal values or ranges is given in Abdou and Guy [1].
The quality of the acoustics in each point of the room is achieved by obtaining optimal values for a set
of room acoustic parameters, describing a range of subjective impressions, such as reverberation,
clarity, strength, and listener envelopment. Acousticians usually select specific parameters and their
optimal values, according to the purpose of the room. For example, rooms intended for symphonic
orchestras require high reverberation times and rooms intended for speech require high clarity and
definition.
2.1.1 Distribution of Acoustical Quality
ISO 3382-1 parameters are measured in different positions inside the concert spaces, each
measurement is representing the acoustical quality of that position. The distribution acoustical quality
inside concert spaces is not uniform (Akama et al. [2]). Source to receiver distances, as well as local
conditions such as vicinity of sidewalls, balcony overhangs and balcony fronts make for substantial
differences between listening positions. To get an idea of the overall quality of the entire space,
measurements have to be made in many different positions in the room, and with those measurements
a calculation of the distribution of acoustical quality can be made. Such a calculation of the
distribution of sound quality is presented with the following equation:
N
j
ijii PWJNDN
QD1
, )(1 (1)
Where QD,i is the distribution of the ith acoustic parameter, N is the number of listening positions,
W(Pi) is a weighting function (in this case a Gaussian curve), and ΔJNDi,j is the difference between the
optimal value of parameter Pi and the measured value of that parameter at listening position j. The

Proceedings of the International Association for Shell and Spatial Structures (IASS) Symposium 2015, Amsterdam
Future Visions
difference is normalized using the Just Noticeable Difference for that parameter JNDi as shown in the
following equation:
i
optiji
jiJND
PPJND
,,
,
(2)
2.1.2. Acoustic simulation
The impulse response in existing concert spaces is measured by recordings of an impulse emitted on
stage by an omnidirectional sound source. It is now common practice to simulate the impulse response
and, the deriving room acoustic parameters, using computational models. The most widely used
models are the ray tracing and the image source models.
The acoustic simulations in this paper were done with the use of Pachyderm Acoustical Simulation, a
Plugin for Rhinoceros (Van der Harten[18]). Pachyderm Acoustical Simulation is a collection of
acoustical simulation algorithms for use in Rhinoceros, ranging in purpose from prediction to
auralization. Among its features are a growing number of simulation algorithms that can be performed
using mesh or NURBS models. Pachyderm combines the image source method with the ray-tracing
technique.
2.2. Thrust Network Analysis
Thrust Network Analysis (TNA) is a form-finding method capable of generating funicular discrete
networks under vertical loading conditions. It gives the designer a high degree of control over the
shape by allowing different force flow assumptions in the network (Block [6]).
If Γ and Γ* are two planar graphs with the same number of elements, and if Γ* is the convex, parallel
dual of Γ, then Γ and Γ* are the form and force diagram of a three-dimensional thrust (= compression-
only) network G (figure 2). This network is in equilibrium under vertical loads applied to its nodes,
and has Γ as its horizontal projection and Gamma* as its horizontal equilibrium (Van Mele et al.
[19]).
Figure 2: TNA dual graph

Proceedings of the International Association for Shell and Spatial Structures (IASS) Symposium 2015, Amsterdam
Future Visions
Figure 3: Indeterminacy of a four-bar node (Block [7])
The static indeterminacy of nodes in thrust network with a valency higher than three allows for the
existence of more than one force diagram Γ* that satisfies the convexity and parallelity requirements
for the network G to be in equilibrium in compression only. A longer force branch in Γ* results in a
shallower thrust network (figure 3). This feature is exploited in TNA to generate different funicular
shapes with the same form diagram, allowing the designer to explore multiple solutions.
2.3. Multi-Objective Genetic Algorithms
Multi-objective search or optimization differs from single objective in that in order to compare two
solutions and determine which one is best (solutions A and B for example) multiple objective
functions are considered, and not just one. If objective functions are contrasting, it may not be the case
that solution A outperforms B in all functions. Instead, it may be the case that A outperforms B in one
function, while B outperforms A in another. This relationship is studied with the concept of
dominance. The concept of dominance can be summed up with the following statements:
In order for solution A to dominate solution B, solution A has to outperform or equal B in all
functions, as well as outperform B in at least one function.
If solution A outperforms or equals solution B in all objective functions except one in which
solution B outperforms A, then A and B do not dominate each other.
A non-dominated solution is one that is not dominated by any other in the solution pool. A non-
dominated solution typically dominates many of the others in the pool, and it is never dominated by
others. A non-dominated solution may not dominate all other solutions, but none that dominate it (Deb
[9]). The Pareto Front, also called trade-off set or non-dominated set, is the set of all non- dominated
solutions in a given group. They represent the set of solutions that cannot be said to be better from
each other if all objective functions in the problem are considered.
Genetic Algorithms (GAs) are a family of search algorithms based on natural selection the evolution
of the species (Goldberg[10]). First proposed by John Holland in the mid 1970’s in the University of
Michigan, they have been successfully employed in many varied fields of study, including the
architecture and construction field. Modifications on the original GA also allow their use for multi-
objective problems; these are called Multi-Objective Genetic Algorithms (MOGAs). This paper
employs a specific MOGA, called NSGA-II (Deb [9]).
Proceedings of the International Association for Shell and Spatial Structures (IASS) Symposium 2015, Amsterdam
Future Visions
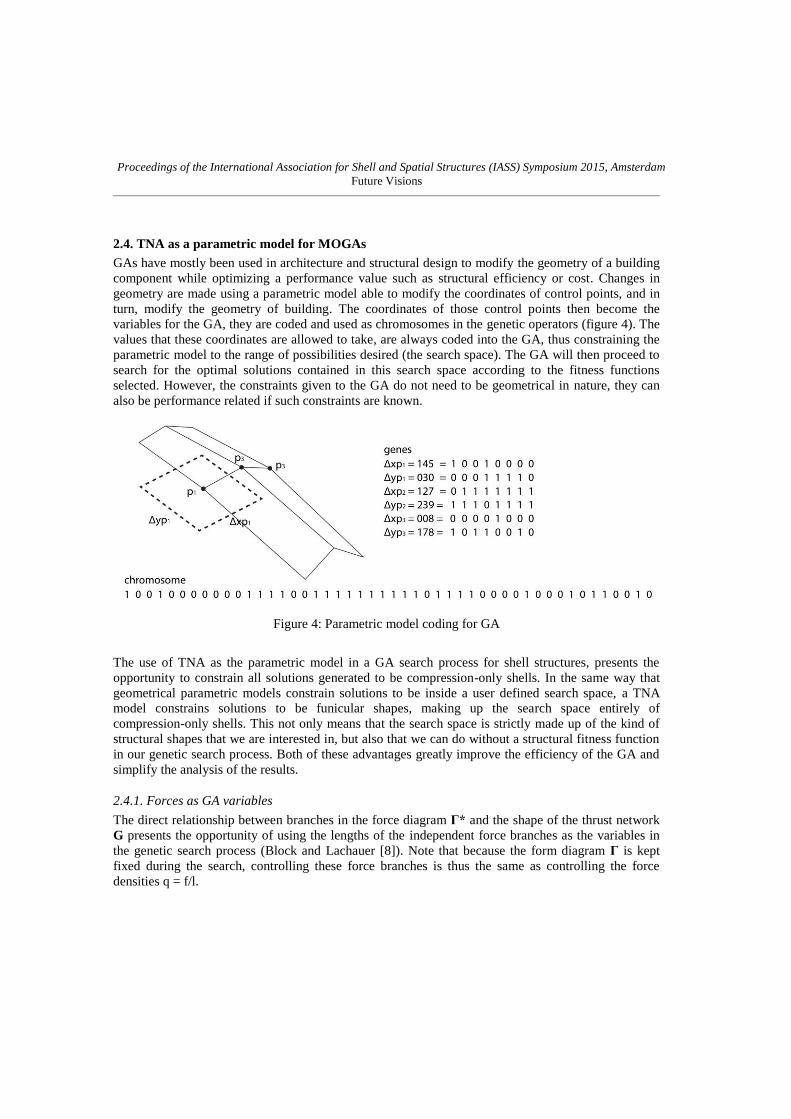
2.4. TNA as a parametric model for MOGAs
GAs have mostly been used in architecture and structural design to modify the geometry of a building
component while optimizing a performance value such as structural efficiency or cost. Changes in
geometry are made using a parametric model able to modify the coordinates of control points, and in
turn, modify the geometry of building. The coordinates of those control points then become the
variables for the GA, they are coded and used as chromosomes in the genetic operators (figure 4). The
values that these coordinates are allowed to take, are always coded into the GA, thus constraining the
parametric model to the range of possibilities desired (the search space). The GA will then proceed to
search for the optimal solutions contained in this search space according to the fitness functions
selected. However, the constraints given to the GA do not need to be geometrical in nature, they can
also be performance related if such constraints are known.
Figure 4: Parametric model coding for GA
The use of TNA as the parametric model in a GA search process for shell structures, presents the
opportunity to constrain all solutions generated to be compression-only shells. In the same way that
geometrical parametric models constrain solutions to be inside a user defined search space, a TNA
model constrains solutions to be funicular shapes, making up the search space entirely of
compression-only shells. This not only means that the search space is strictly made up of the kind of
structural shapes that we are interested in, but also that we can do without a structural fitness function
in our genetic search process. Both of these advantages greatly improve the efficiency of the GA and
simplify the analysis of the results.
2.4.1. Forces as GA variables
The direct relationship between branches in the force diagram Γ* and the shape of the thrust network
G presents the opportunity of using the lengths of the independent force branches as the variables in
the genetic search process (Block and Lachauer [8]). Note that because the form diagram Γ is kept
fixed during the search, controlling these force branches is thus the same as controlling the force
densities q = f/l.

Proceedings of the International Association for Shell and Spatial Structures (IASS) Symposium 2015, Amsterdam
Future Visions
2.4.2. Encoding Isomorphism
The coding of the GA variables and their corresponding solution is very important for the GA to
function properly. Each chromosome should correspond to a unique solution that has a different
fitness value than all other solutions in the design space. Likewise, each solution in the design space
should be represented by only one chromosome. When different chromosomes represent the same
solution, they are said to be isomorphic. This problem is referred to as representational redundancy or
encoding isomorphism (Ronald[17]). Encoding Isomorphism can represent a severe problem in the
GA process. If the gene pool, at any generation, is made up of mostly isomorphic solutions, then the
GA will not be able to select from a diverse set of solutions, meaning that the fitness values of the
population will remain stagnant. Stagnation is addressed in GAs with operators that include random
changes in the chromosomes, such as the mutation operator. However, when isomorphism is present
in the coding, no changes in the chromosome can guarantee an improvement, since solutions with
different chromosomes can have the same fitness value.
Encoding isomorphism is easy to avoid when more traditional parametric models are used, when each
part of the chromosome represents a coordinate for a control point. The solution is defined in an
unambiguous way by the combination of control point coordinates, and the variable is coded
accordingly. However, when the genetic variables do not directly represent the solution and its
phenotype, then it is easy to have encoding isomorphism problems. An example of encoding
isomorphism can be found in (Mendez Echenagucia [14]).
In the specific case presented in this paper, encoding isomorphism could have been present if the
changes in the branches of the force diagram would not respect equilibrium, and further adjustments
would be required to achieve it. In other words, if the form diagram Γ is considered to be fixed, and
the GA generates a force diagram Γ* that is not the convex and parallel dual of Γ, then the force
diagram would have to be further modified to get it in equilibrium. After this modification, the
resulting thrust network would not only be the result of the genetic variables, but also of the
modification to find equilibrium. In such a scenario, it would be common for different chromosomes
to result in the same force diagram and thrust network, and hence the same acoustic fitness value
(encoding isomorphism).
To avoid this problem, the TNA model is set up such that every chromosome generated by the GA
will result in horizontal equilibrium. Both the form and form diagram are rectangular, and nodes are
all positioned according to a grid. In addition, all of the nodes in the boundaries are considered to be
supported nodes. If the GA modifies the force diagram while still keeping the force edges inside the
axis of a grid, then all proposed solutions will be in equilibrium, as the form and force edges will
always be parallel (Van Mele and Block [20]). In such a setup, we can set up the GA to modify the
length of entire rows or columns of force branches. The genetic variables will then be the width of
each row and column of force edges, avoiding encoding isomorphism.

Proceedings of the International Association for Shell and Spatial Structures (IASS) Symposium 2015, Amsterdam
Future Visions
Figure 5: TNA as parametric model – four possible outcomes
2.4.3. RhinoVAULT API
RhinoVAULT (Rippmann et al. [15, 16] is an interactive tool for the creation of funicular shapes
inside Rhinoceros® that was developed by the Block Research Group. RhinoVAULT is based on
TNA and contains an API that allows the user to incorporate Rhino Vault functions into Rhino Python
scripts. This functionality was exploited in the development of the TNA parametric model. The
MOGA was set up in such a way as to generate funicular shapes directly from values out of the
genetic search process.
3. Multipurpose room for “Fábrica de Cultura” Barranquilla
3.1. Room description and requirements
The multipurpose room for the “Fabrica de Cultura” project has a 18.5x25m rectangular in plan with
the stage at one of its ends. The room’s ceiling and main reflecting surface is a funicular shell
covering the entire room area and supported at its edges. A large portion of the audience seating area
is inclined towards the stage at a 17° angle.
The program for the school requires this room to be used for lectures, theatre, dance, Colombian
music as well as the occasional classical performance from a small ensemble. From a room acoustics
point of view, these requirements can be simplified into three room configurations: speech, amplified
and unamplified music.
3.2. MOGA inputs and fitness functions
3.2.1. GA inputs
The MOGA was set up to run for 60 generations with a population size of 50 individuals. The MOGA
was coded using binary strings. The crossover operator was the simple crossover with a random
crossover point. A mutation operator was also employed, mutations were done on the binary strings
depending on a mutation probability of 0.15. This means that 15% of all genes in the chromosome of
each individual was subject to mutation.
Proceedings of the International Association for Shell and Spatial Structures (IASS) Symposium 2015, Amsterdam
Future Visions
3.2.2. Fitness Functions
Based on the characteristics of the room and its requirements, three room acoustic parameters have
been selected to be studied by the MOGA: Early decay time (EDT), definition (D50) and sound
strength (G). Three fitness functions are used in this study, one for each parameter, all using equation
(1) for the Quality distribution QD. This results in three fitness values (QDEDT, QDD50 and QDG). QD
values are normalized by the JND of each room acoustic parameter. For this reason they go from 0 to
1, 1 being the optimal value. The MOGA presented in this paper maximizes the QD values for each
one of the selected parameters. Table 1 shows the optimal value and JND for each one of the room
acoustic parameters used.
Table 1: Room acoustics parameters
Parameter Frequency Subjective
Impression
Optimal Value
Pi,opt
JND
EDT 500-1000Hz Reverberation 2.0 (s) 10%
D50 500-1000Hz Definition > 0.5 5%
G 500-1000Hz Sound Strength Barron’s Curve (Barron [4])
1 (dB)
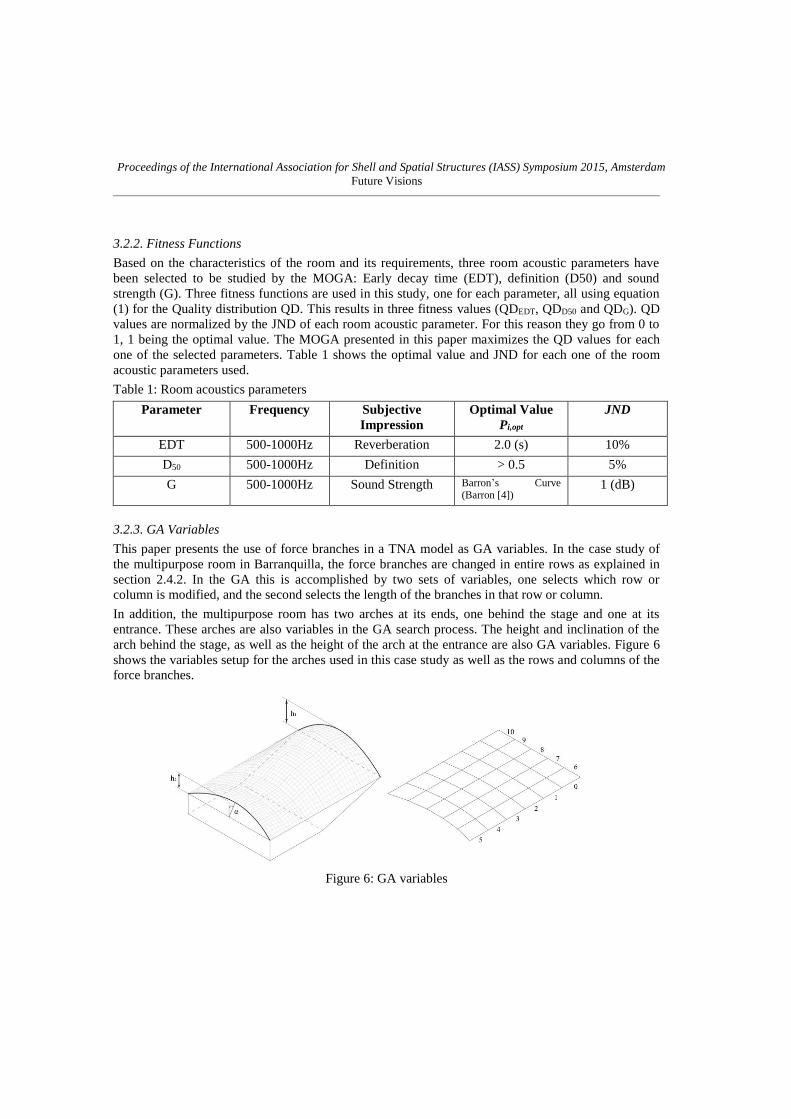
3.2.3. GA Variables
This paper presents the use of force branches in a TNA model as GA variables. In the case study of
the multipurpose room in Barranquilla, the force branches are changed in entire rows as explained in
section 2.4.2. In the GA this is accomplished by two sets of variables, one selects which row or
column is modified, and the second selects the length of the branches in that row or column.
In addition, the multipurpose room has two arches at its ends, one behind the stage and one at its
entrance. These arches are also variables in the GA search process. The height and inclination of the
arch behind the stage, as well as the height of the arch at the entrance are also GA variables. Figure 6
shows the variables setup for the arches used in this case study as well as the rows and columns of the
force branches.
Figure 6: GA variables

Proceedings of the International Association for Shell and Spatial Structures (IASS) Symposium 2015, Amsterdam
Future Visions
Table 2 sums up the complete set of GA variables used in this paper.
Table 2: GA variables
Number Variable
1 Arch 1 height
2 Arch 1 angle
3 Arch 2 height
4 Force branch set 1
5 Force branch set 2
6 Force branch set 3
7 Force branch set 4
8 Force branch 1 length
9 Force branch 2 length
10 Force branch 3 length
11 Force branch 4 length
3.3. Results
The MOGA presented in this paper contains three fitness functions, and therefore the result is a 3D
Pareto front. Figure 7 shows 2D sections of the 3D Pareto front. Figure 7a shows the Pareto front
formed by the QDEDT and QDD50 fitness functions. This front shows the most contrast between the two
functions, and this is to be expected as QDEDT represents the impression of reverberation and QDD50
shows sound definition and speech intelligibility. The higher the reverberation the lower the definition
of sound. This contrast is however manageable, the MOGA was able to find funicular shell shapes
with QD values for both functions that are quite close to 1. Figure 7b and 7c show the fronts created
by QDEDT and QDG, and QDD50 and QDG respectively. These figures show very little contrast between
the functions, and the MOGA was also able to find quite high QD values for all functions.
Out of these shapes, one of selected for further development, based on its QD values, spatial quality
and other architectural considerations. Figure 8 shows the selected shape. It shows a funicular shape
with convex and concave elements. The convex longitudinal section on top of the stage seems to be of
particular importance for the uniform distribution of optimal acoustic parameter values.
4. Discussion
The present paper presents the use of Multi Objective Genetic Algorithms for the acoustic
optimization of funicular shapes by means of Thrust network analysis as a parametric model. The
MOGA maximized the acoustic quality distribution for parameters EDT, D50 and G with great results.
A good distribution of room acoustic parameter values, as found by the MOGA in the present paper, is
achieved by avoiding sound concentrations that are typical when concave shapes are present.

Proceedings of the International Association for Shell and Spatial Structures (IASS) Symposium 2015, Amsterdam
Future Visions
Figure 7: Pareto Fronts for the Barranquilla Multipurpose room

Proceedings of the International Association for Shell and Spatial Structures (IASS) Symposium 2015, Amsterdam
Future Visions
Figure 8: Selected solution
References
[1] Abdou, A. and Guy, R. W., Spatial information of sound fields for room acoustics evaluation
and diagnosis, The Journal of the Acoustical Society of America, 1996; 100(5); 3215-3226.
[2] Akama, T., Suzuki, H. and Omoto, A., Distribution of selected monaural acoustical parameters
in concert halls. Applied Acoustics, 2010; 71; 564-577.
[3] Barron, M., Auditorium Acoustics and Architectural Design, Spon Press, London, 2009.
[4] Barron M., When is a concert hall too quiet? Proceedings of the 19th International Congress on
Acoustics, International Congress on Acoustics 2009.
[5] Beranek, L. L., Concert Halls and Opera Houses: Music, Acoustics, and Architecture, Springer,
New York, 2004.
[6] Block, P., Thrust Network Analysis: Exploring Three-dimensional Equilibrium, PhD thesis,
Massachusetts Institute of Technology, Cambridge, MA, 2009.
[7] Block, P., Lachauer, L. and Rippmann, M., Thrust Network Analysis - Design of a cut-stone
masonry vault, in: Shell Structures for Architecture: Form Finding and Optimization,
Adriaenssens, S., Block, P., Veenendaal, D. and Williams, C. (eds.), Routledge, London,2014.
[8] Block, P. and Lachauer, L., Three-dimensional Funicular Analysis of Masonry Vaults,
Mechanics Research Communications, 2104; 56; 53-60.
[9] Deb, K., Multi-Objective Optimization using Evolutionary Algorithms. John Wiley & Sons,
Chichester, 2001.
[10] Goldberg, D., Genetic algorithms in Search, Optimization & Machine Learning, 1st edn,
Addison-Wesley Professional, Boston, 1989.
[11] ISO 3382-1:2009; Acoustics—Measurement of Room Acoustic Parameters. I: Performance
Spaces.International Standards Organization, 2009.
[12] Lacatis, R., Gimenez, A., Barba Sevillano, A., Cerda, S., Romero, J. & Cibrian, R., Historical
and chronological evolution of the concert hall acoustics parameters, Proceedings of Acoustics
08, Paris, 2008.
[13] Mendez Echenagucia, T., Astolfi, A., Shtrepi, L., Van der Harten, A. and Sassone, M., EDT,
C80 and G Driven Auditorium Design. Building Acoustics, 2014; 21(1); 43-54.

Proceedings of the International Association for Shell and Spatial Structures (IASS) Symposium 2015, Amsterdam
Future Visions
[14] Mendez Echenagucia, T., Computational Search in Architectural Design, PhD thesis, Politecnico
di Torino, Italy, 2014.
[15] Rippmann, M., Lachauer, L., and Block, P., RhinoVAULT - Designing funicular form with
Rhino, computer software, 2012. http://block.arch.ethz.ch/brg/tools/rhinovault
[16] Rippmann, M., Lachauer, L. and Block, P., Interactive Vault Design,International. Journal of
Space Structures, 2012; 27(4); 219-230.
[17] Ronald, R., Asenstorfer, J. and Vincent, M., Representational redundancy in evolutionary
algorithms, in: D. Fogel (Ed.), Proceedings of the 1995 IEEE International Conference on
Evolutionary Computation, IEEE Press, New York, 1995, 631-637.
[18] Van der Harten, A., Pachyderm Acoustical Simulation: An Open Source Geometrical Acoustics
Laboratory. URL: http://www.perspectivesketch.com/pachyderm/
[19] Van Mele, T., Panozzo, D., Sorkine-Hornung, O. and Block, P., S. Adriaenssens, P. Block, D.
Veenendaal & C. Williams, (eds), Shells for Architecture: Form finding and structural
optimization, Routledge Architecture, 2014.
[20] Van Mele, T. and Block, P., Novel Form Finding Method for Fabric Formwork for Concrete
Shells, Journal of the International Association for Shell and Spatial Structures, 2011; 52(4);
217-224.
[21] Vercammen, M., Sound Concentration Caused by curved Surfaces, PhD thesis, Eindhoven
University of Technology, 2011.


![Interactive Design of Shell Structures Using Multi Agent ...papers.cumincad.org/data/works/att/cf2017_601.pdf · exploration of funicular shells [23] [24] [25]. Block, introduced](https://static.fdocuments.in/doc/165x107/5e7ba60e0bba855396117f13/interactive-design-of-shell-structures-using-multi-agent-exploration-of-funicular.jpg)