Achieving Enterprise-Wide Operational Intelligence...
22
© Copyright 2015 OSIsoft, LLC Presented by: © Copyright 2015 OSIsoft, LLC Achieving Enterprise-Wide Operational Intelligence Using the PI Server's Asset Framework (AF) Stephen Reynolds SunCoke Energy
-
Upload
nguyenxuyen -
Category
Documents
-
view
214 -
download
0
Transcript of Achieving Enterprise-Wide Operational Intelligence...
© Copyright 2015 OSIsoft, LLC
Presented by:
© Copyright 2015 OSIsoft, LLC
Achieving Enterprise-Wide Operational Intelligence Using the PI Server's Asset Framework (AF)
Stephen Reynolds
SunCoke Energy
© Copyright 2015 OSIsoft, LLC 2
Agenda
• SunCoke Energy
• Our Vision
• Yield and Business Intelligence
• Oven Performance
• Asset Maintenance
• Next Steps

© Copyright 2015 OSIsoft, LLC
SunCoke Energy
3
Our coke-making operations are strategically located in proximity to our customers’ integrated steel-making facilities.
© Copyright 2015 OSIsoft, LLC
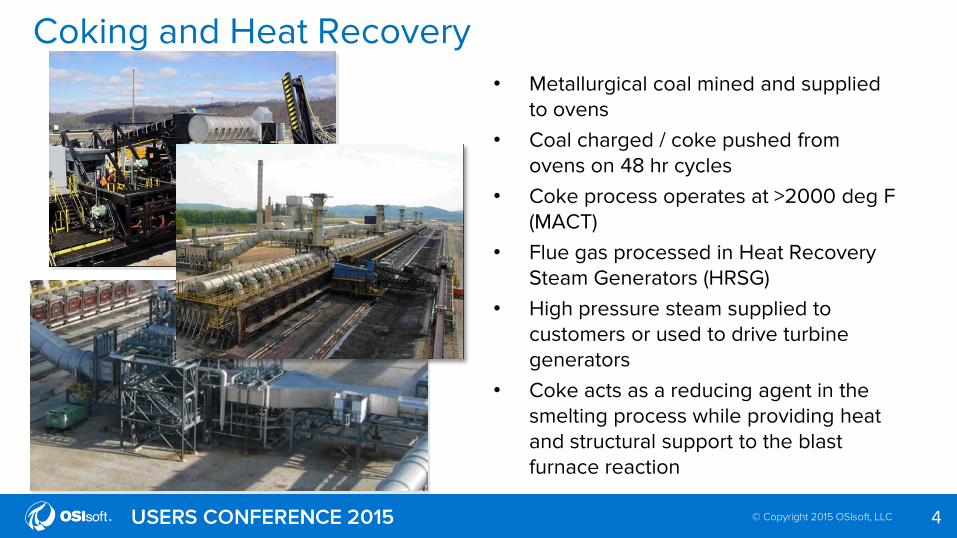
Coking and Heat Recovery
4
• Metallurgical coal mined and supplied to ovens
• Coal charged / coke pushed from ovens on 48 hr cycles
• Coke process operates at >2000 deg F (MACT)
• Flue gas processed in Heat Recovery Steam Generators (HRSG)
• High pressure steam supplied to customers or used to drive turbine generators
• Coke acts as a reducing agent in the smelting process while providing heat and structural support to the blast furnace reaction
© Copyright 2015 OSIsoft, LLC
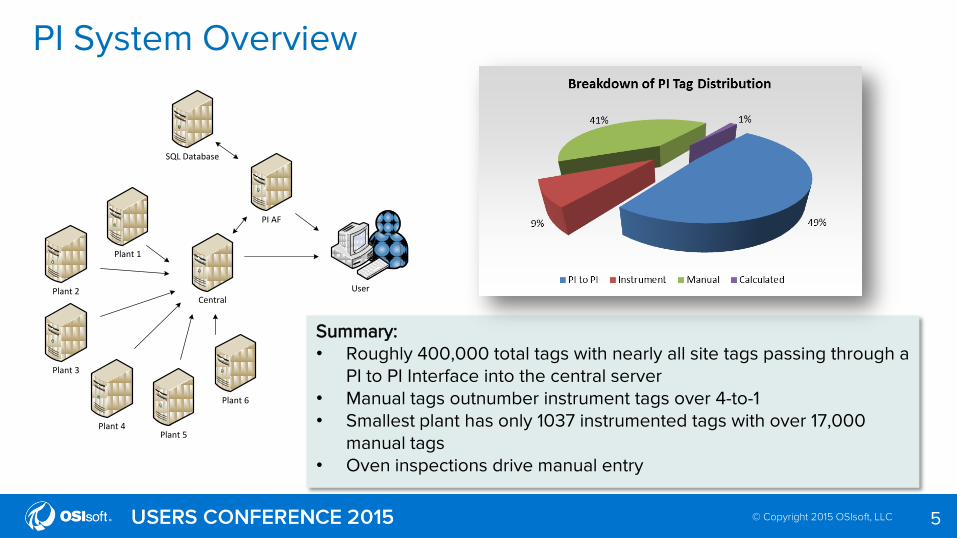
PI System Overview
5
Central
Plant 6
Plant 4Plant 5
Plant 2
Plant 1
Plant 3
PI AF
User
SQL Database
Summary: • Roughly 400,000 total tags with nearly all site tags passing through a
PI to PI Interface into the central server • Manual tags outnumber instrument tags over 4-to-1 • Smallest plant has only 1037 instrumented tags with over 17,000
manual tags • Oven inspections drive manual entry
© Copyright 2015 OSIsoft, LLC
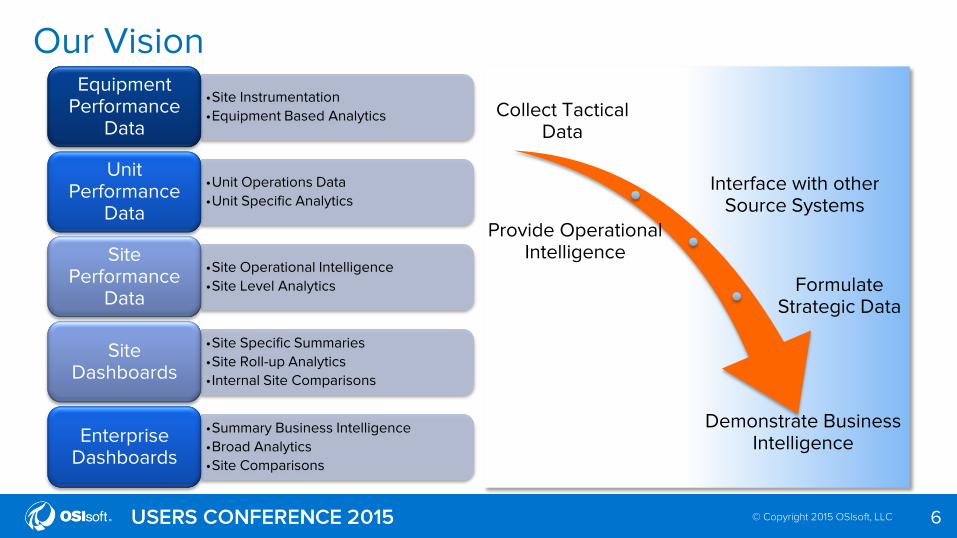
Our Vision
6
•Site Instrumentation
•Equipment Based Analytics
Equipment Performance
Data
•Unit Operations Data
•Unit Specific Analytics
Unit Performance
Data
•Site Operational Intelligence
•Site Level Analytics
Site Performance
Data
•Site Specific Summaries
•Site Roll-up Analytics
•Internal Site Comparisons
Site Dashboards
•Summary Business Intelligence
•Broad Analytics
•Site Comparisons
Enterprise Dashboards
Collect Tactical Data
Interface with other Source Systems
Provide Operational Intelligence
Formulate Strategic Data
Demonstrate Business Intelligence
© Copyright 2015 OSIsoft, LLC
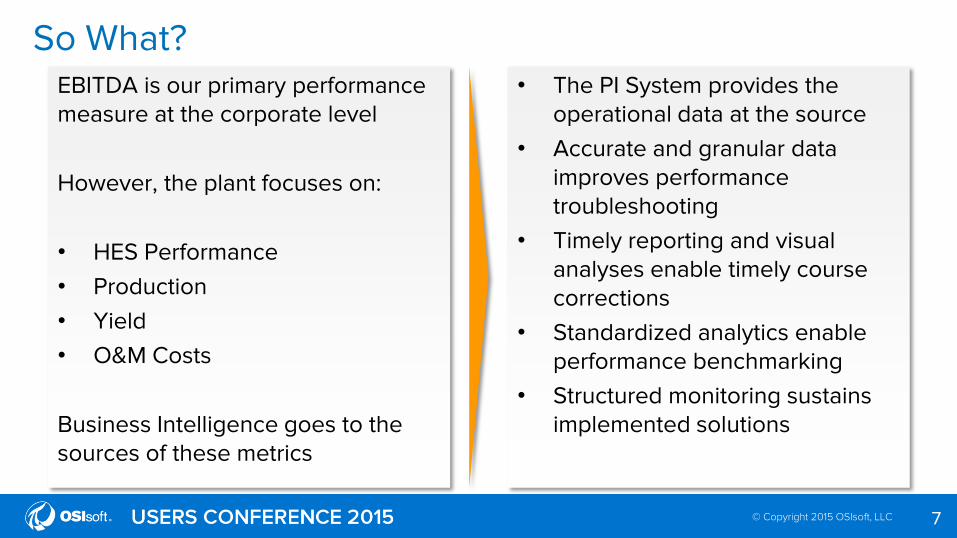
So What?
7
EBITDA is our primary performance measure at the corporate level
However, the plant focuses on:
• HES Performance
• Production
• Yield
• O&M Costs
Business Intelligence goes to the sources of these metrics
• The PI System provides the operational data at the source
• Accurate and granular data improves performance troubleshooting
• Timely reporting and visual analyses enable timely course corrections
• Standardized analytics enable performance benchmarking
• Structured monitoring sustains implemented solutions
© Copyright 2015 OSIsoft, LLC
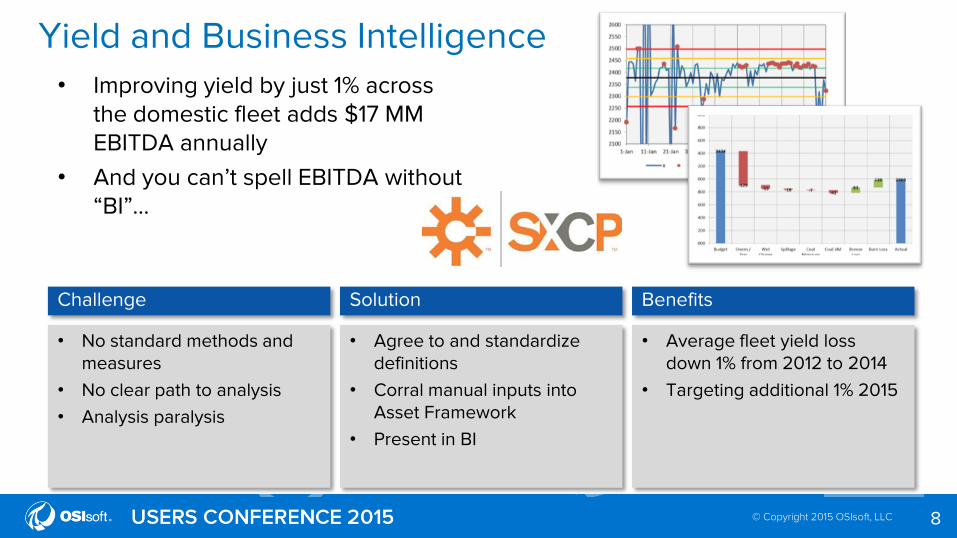
Yield and Business Intelligence
8
• Improving yield by just 1% across the domestic fleet adds $17 MM EBITDA annually
• And you can’t spell EBITDA without “BI”…
• No standard methods and measures
• No clear path to analysis
• Analysis paralysis
• Agree to and standardize definitions
• Corral manual inputs into Asset Framework
• Present in BI
• Average fleet yield loss down 1% from 2012 to 2014
• Targeting additional 1% 2015
Challenge Solution Benefits
© Copyright 2015 OSIsoft, LLC
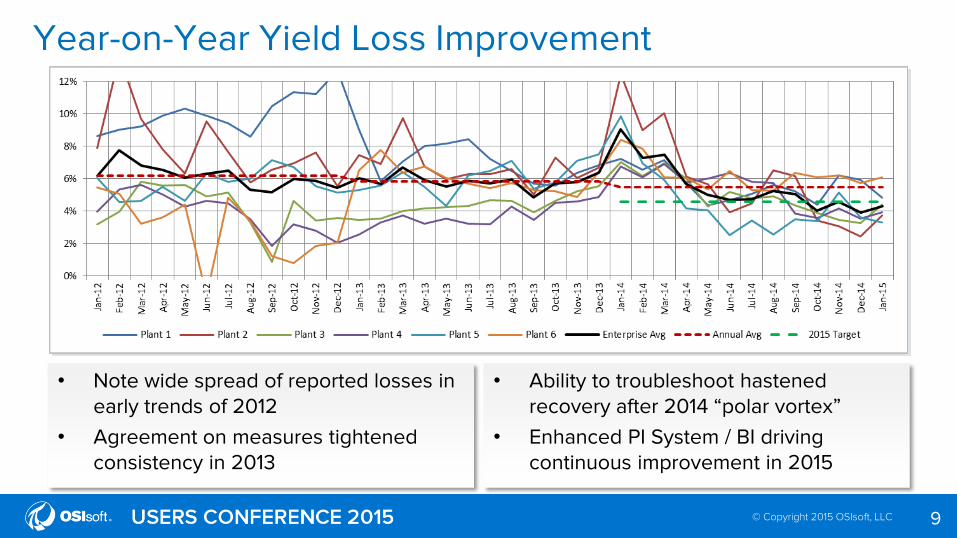
Year-on-Year Yield Loss Improvement
9
• Note wide spread of reported losses in early trends of 2012
• Agreement on measures tightened consistency in 2013
• Ability to troubleshoot hastened recovery after 2014 “polar vortex”
• Enhanced PI System / BI driving continuous improvement in 2015
© Copyright 2015 OSIsoft, LLC
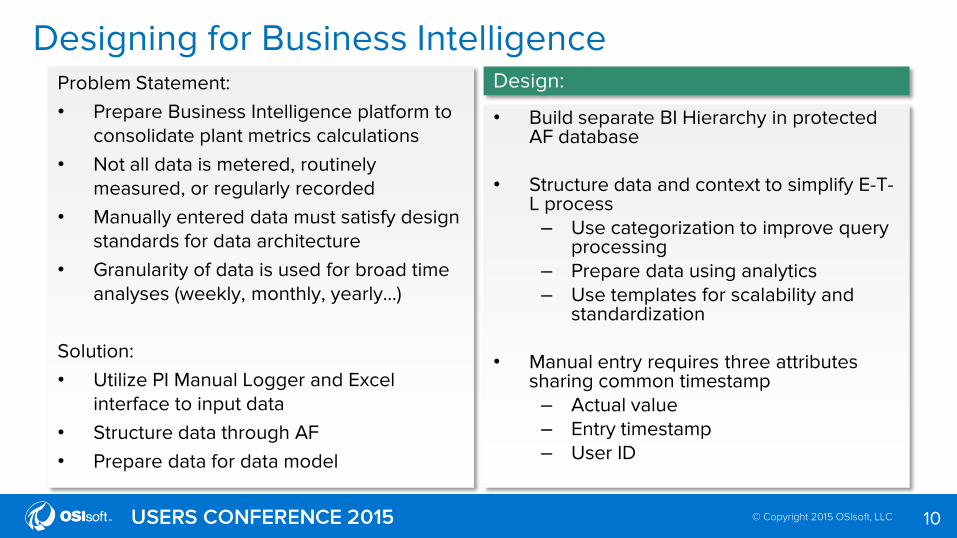
Designing for Business Intelligence
10
Problem Statement:
• Prepare Business Intelligence platform to consolidate plant metrics calculations
• Not all data is metered, routinely measured, or regularly recorded
• Manually entered data must satisfy design standards for data architecture
• Granularity of data is used for broad time analyses (weekly, monthly, yearly…)
Solution:
• Utilize PI Manual Logger and Excel interface to input data
• Structure data through AF
• Prepare data for data model
• Build separate BI Hierarchy in protected AF database
• Structure data and context to simplify E-T-L process – Use categorization to improve query
processing – Prepare data using analytics – Use templates for scalability and
standardization
• Manual entry requires three attributes sharing common timestamp – Actual value – Entry timestamp – User ID
Design:
© Copyright 2015 OSIsoft, LLC
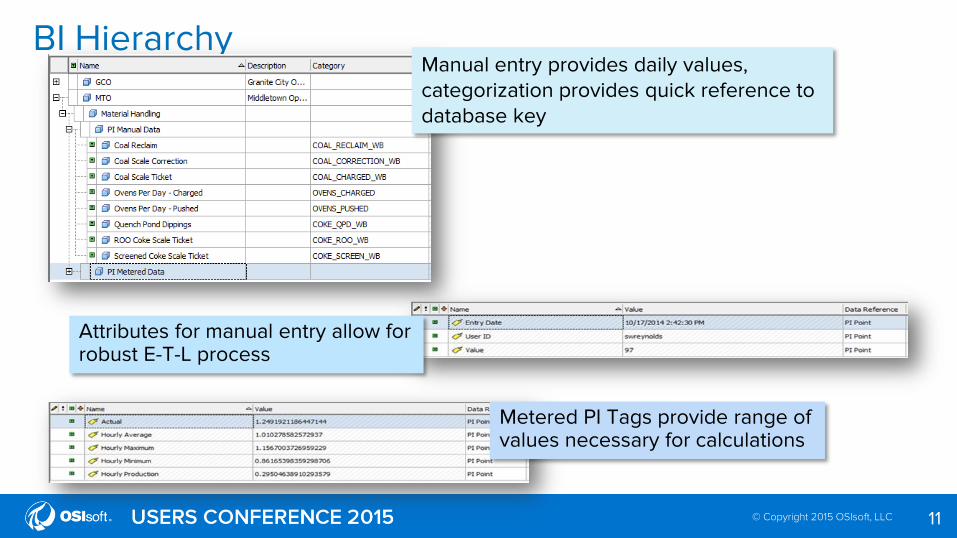
BI Hierarchy
11
Attributes for manual entry allow for robust E-T-L process
Metered PI Tags provide range of values necessary for calculations
Manual entry provides daily values, categorization provides quick reference to database key
© Copyright 2015 OSIsoft, LLC
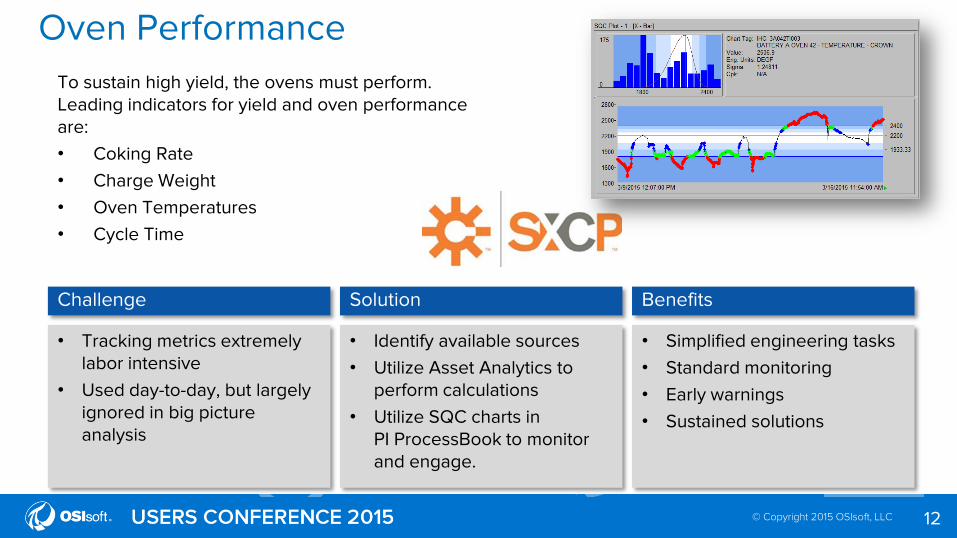
Oven Performance
12
To sustain high yield, the ovens must perform. Leading indicators for yield and oven performance are:
• Coking Rate
• Charge Weight
• Oven Temperatures
• Cycle Time
• Tracking metrics extremely labor intensive
• Used day-to-day, but largely ignored in big picture analysis
• Identify available sources
• Utilize Asset Analytics to perform calculations
• Utilize SQC charts in PI ProcessBook to monitor and engage.
• Simplified engineering tasks
• Standard monitoring
• Early warnings
• Sustained solutions
Challenge Solution Benefits
© Copyright 2015 OSIsoft, LLC
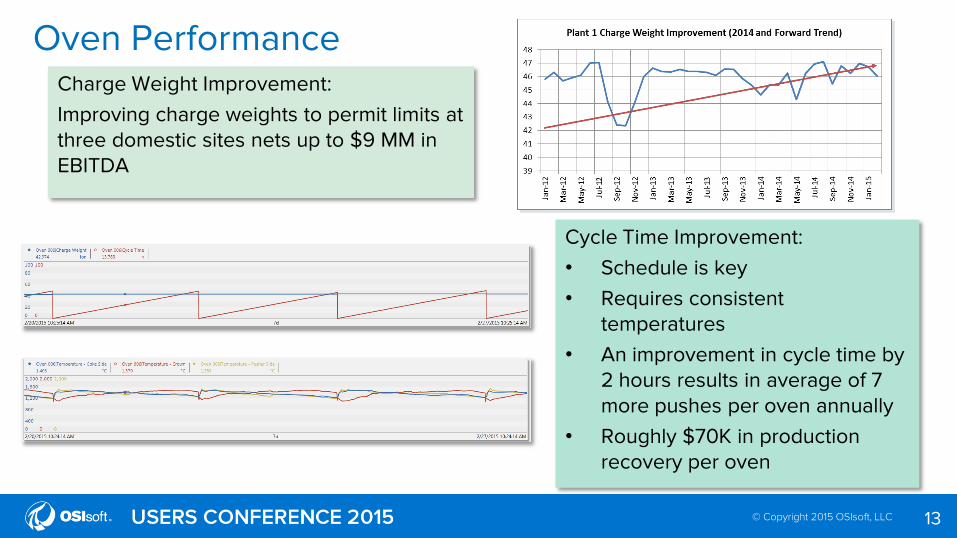
Oven Performance
13
Charge Weight Improvement:
Improving charge weights to permit limits at three domestic sites nets up to $9 MM in EBITDA
Cycle Time Improvement:
• Schedule is key
• Requires consistent temperatures
• An improvement in cycle time by 2 hours results in average of 7 more pushes per oven annually
• Roughly $70K in production recovery per oven
© Copyright 2015 OSIsoft, LLC
True Operational Intelligence
14
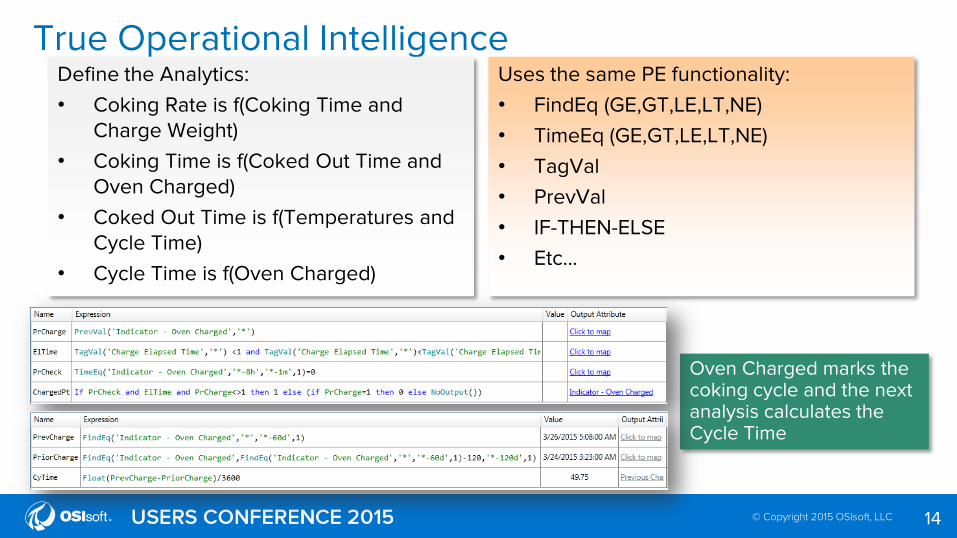
Define the Analytics:
• Coking Rate is f(Coking Time and Charge Weight)
• Coking Time is f(Coked Out Time and Oven Charged)
• Coked Out Time is f(Temperatures and Cycle Time)
• Cycle Time is f(Oven Charged)
Oven Charged marks the coking cycle and the next analysis calculates the Cycle Time
Uses the same PE functionality:
• FindEq (GE,GT,LE,LT,NE)
• TimeEq (GE,GT,LE,LT,NE)
• TagVal
• PrevVal
• IF-THEN-ELSE
• Etc…
© Copyright 2015 OSIsoft, LLC
Asset Management
15
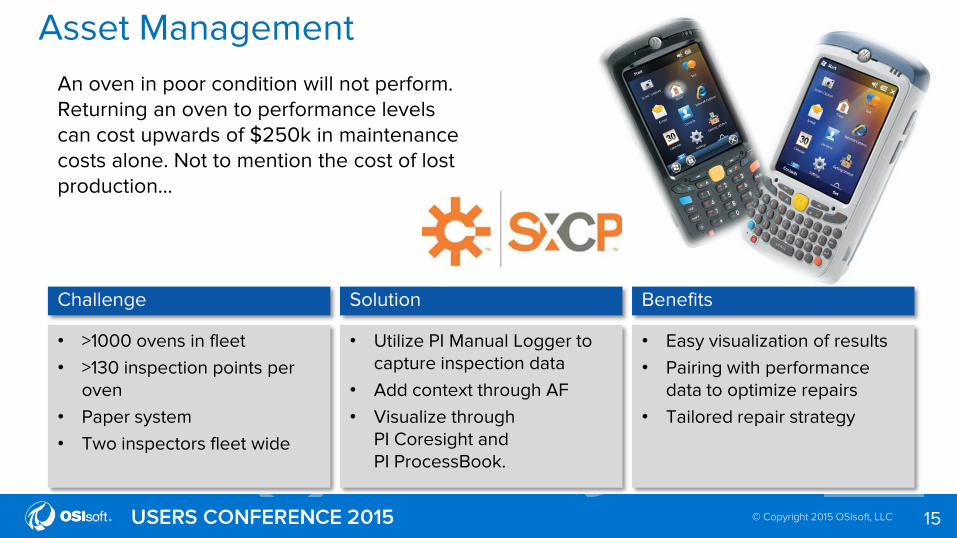
An oven in poor condition will not perform. Returning an oven to performance levels can cost upwards of $250k in maintenance costs alone. Not to mention the cost of lost production…
• >1000 ovens in fleet
• >130 inspection points per oven
• Paper system
• Two inspectors fleet wide
• Utilize PI Manual Logger to capture inspection data
• Add context through AF
• Visualize through PI Coresight and PI ProcessBook.
• Easy visualization of results
• Pairing with performance data to optimize repairs
• Tailored repair strategy
Challenge Solution Benefits
© Copyright 2015 OSIsoft, LLC
Using Asset Framework
16
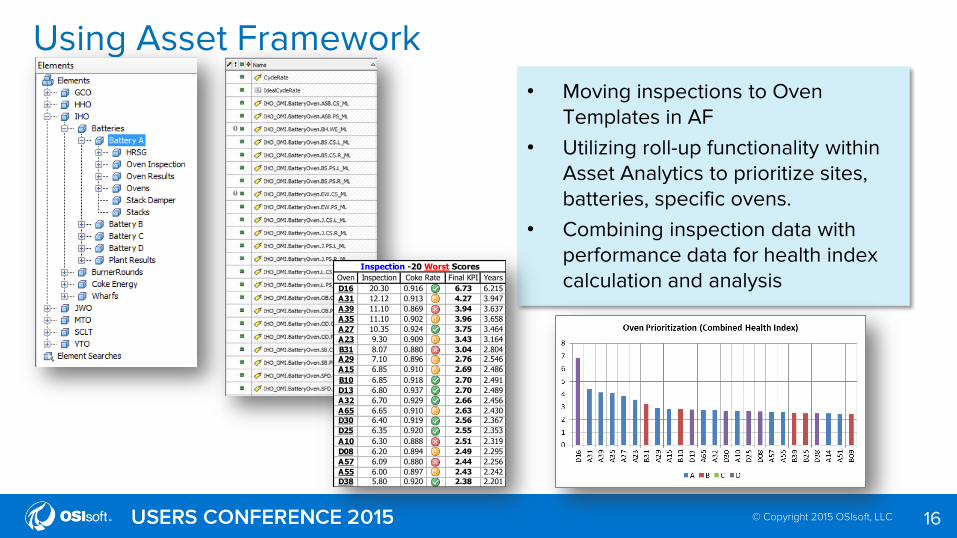
• Moving inspections to Oven Templates in AF
• Utilizing roll-up functionality within Asset Analytics to prioritize sites, batteries, specific ovens.
• Combining inspection data with performance data for health index calculation and analysis Oven Inspection Final KPI Years
D16 20.30 0.916 6.73 6.215
A31 12.12 0.913 4.27 3.947
A39 11.10 0.869 3.94 3.637
A35 11.10 0.902 3.96 3.658
A27 10.35 0.924 3.75 3.464
A23 9.30 0.909 3.43 3.164
B31 8.07 0.880 3.04 2.804
A29 7.10 0.896 2.76 2.546
A15 6.85 0.910 2.69 2.486
B10 6.85 0.918 2.70 2.491
D13 6.80 0.937 2.70 2.489
A32 6.70 0.929 2.66 2.456
A65 6.65 0.910 2.63 2.430
D30 6.40 0.919 2.56 2.367
D25 6.35 0.920 2.55 2.353
A10 6.30 0.888 2.51 2.319
D08 6.20 0.894 2.49 2.295
A57 6.09 0.880 2.44 2.256
A55 6.00 0.897 2.43 2.242
D38 5.80 0.920 2.38 2.201
Coke Rate
Inspection -20 Worst Scores
© Copyright 2015 OSIsoft, LLC
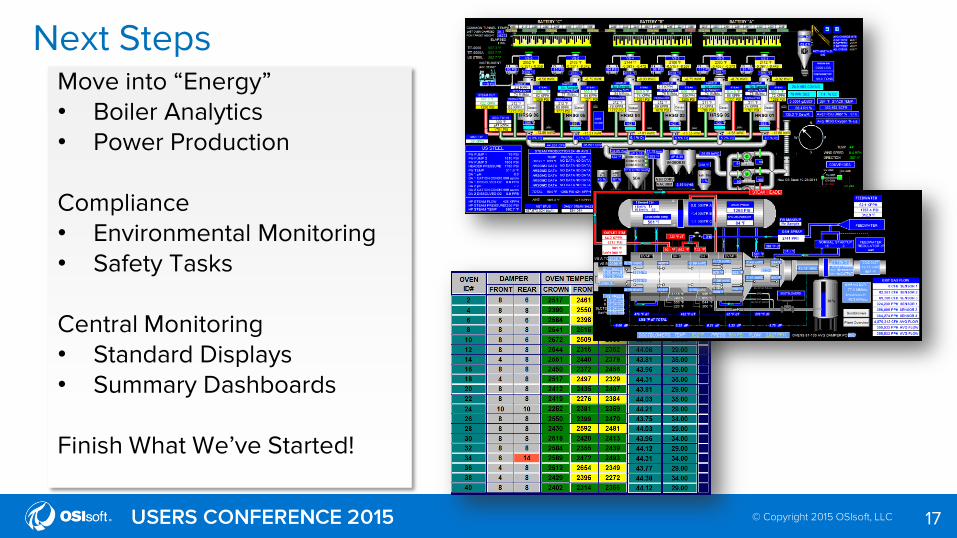
Next Steps
17
Move into “Energy” • Boiler Analytics • Power Production
Compliance • Environmental Monitoring • Safety Tasks
Central Monitoring • Standard Displays • Summary Dashboards
Finish What We’ve Started!
© Copyright 2015 OSIsoft, LLC
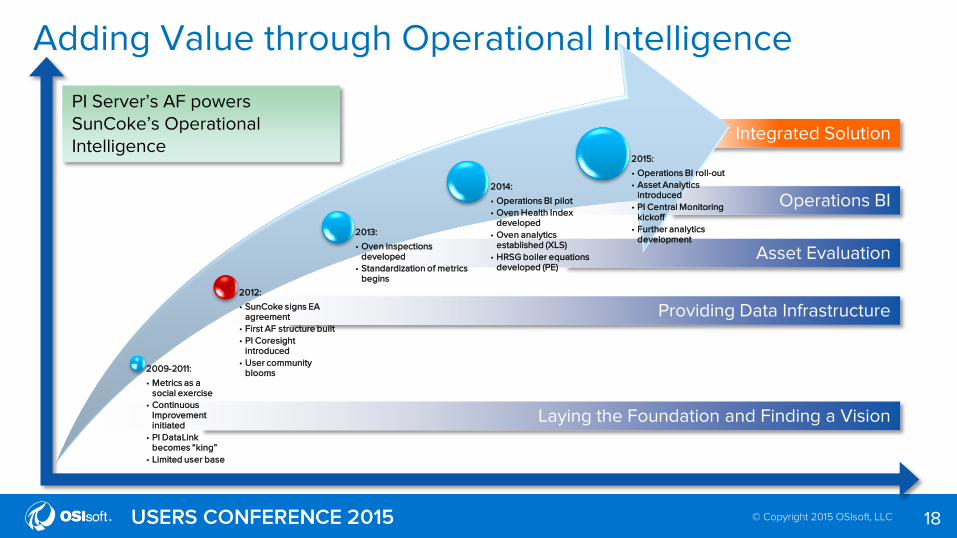
PI Server’s AF powers SunCoke’s Operational Intelligence
Integrated Solution
Adding Value through Operational Intelligence
18
Laying the Foundation and Finding a Vision
Providing Data Infrastructure
Asset Evaluation
Operations BI
2009-2011:
• Metrics as a social exercise
• Continuous Improvement initiated
• PI DataLink becomes “king”
• Limited user base
2012:
• SunCoke signs EA agreement
• First AF structure built
• PI Coresight introduced
• User community blooms
2013:
• Oven inspections developed
• Standardization of metrics begins
2014:
• Operations BI pilot
• Oven Health Index developed
• Oven analytics established (XLS)
• HRSG boiler equations developed (PE)
2015:
• Operations BI roll-out
• Asset Analytics introduced
• PI Central Monitoring kickoff
• Further analytics development
© Copyright 2015 OSIsoft, LLC 19
Closing Points
• Recruit a willing internal business partner
• Find common ground
• Structure the data
• Build the analytics
• Get help
• Deploy
• Enjoy!
© Copyright 2015 OSIsoft, LLC
Stephen Reynolds
20
Solution Architect
Manager – Continuous Improvement
SunCoke Energy
© Copyright 2015 OSIsoft, LLC 21
Questions?
Please wait for the microphone before asking your questions
State your name & company
© Copyright 2015 OSIsoft, LLC