Process Control and Operational Intelligence
40
345 Osvaldo Bascur, Principal, Academia–Industry Innovation, OSIsoft LLC, Houston, Texas, USA CHAPTER 10.3 Process Control and Operational Intelligence Osvaldo Bascur This chapter presents a summary of the state of the art for mineral–metallurgical process control and “plant operational intelligence.” Operational intelligence is a way of providing an augmented view of real-time data rather than using tradi- tional fxed plant information management reports. The data are transformed into insights for further analysis using busi- ness intelligence tools. Basic process control is an integral part of most mineral and metal processing plants. It has helped many operations reduce costs and increase productivity and performance. Developments in process control in the mineral–metallurgical processing industry over the past decade have been greatly infuenced by new measurements, advances in computer soft- ware and communications, and internet/cloud technologies. Another extremely important factor has been the selection of strategies to link control actions to process measurement to form an overall control and plant management system. These three components—measurements, process control strategies, and computer hardware—form a triangle of integrating ele- ments, as shown in Figure 1. The knowledge workers who are the operators and process engineers are at the center of these elements. These individuals operate the process units. They are learning about the process and designing and maintain- ing the process control strategies. These control strategies are integrated with an operational management support system, combining all forms of information in a mineral processing plant. A continuous improvement and innovation culture is required for enabling operational excellence. In the following paragraphs, a control triangle is used to describe the process control and operational management technologies in the digi- tal age. This is called “Industries 4.0” and refers to the digital revolution that is currently taking place. The decades between 1990 and 2010 saw the paral- lel development of three important aspects of modern min- eral processing control: (1) measurement devices designed especially for the particulate systems encountered in these industrial plants, (2) mathematical models constructed for the analysis of these systems, and (3) control strategies developed using the capabilities of digital computers. In recent years, the development of intelligent sensors (advanced control systems based on object technologies and communications networks) have transformed the way plants are managed. Plants require many sensors to measure the process and equipment variables to monitor conditions and to process sensor data using a variety of algorithms to assist in the sta- bilization of operations and the optimization of resources to minimize operating costs for an environmentally safe, proft- able operation. The “Process Measurements” section provides an overview of this topic. The lower right side of the triangle in Figure 1 shows the control hardware and computer systems that provide the environment for delegating the transforma- tion of the measurements into real-time controls for manipu- lating the fnal control elements for all process units. Shown at the top of the triangle are the control and performance man- agement strategies that process the sensor data to manipulate the fnal control elements in a process plant. The “Process Process Control Measurements Sensors Control Hardware Computer Systems Mine/ Mineral/ Metals Processing Knowledge Worker Maintenance Training Adapted from Herbst and Bascur 1984 Figure 1 Control triangle—basic components and interactions in automatic control 100300 ProcessControl.indd 345 5/7/18 6:47 PM
Transcript of Process Control and Operational Intelligence

345
Osvaldo Bascur, Principal, Academia–Industry Innovation, OSIsoft LLC, Houston, Texas, USA
CHAPTER 10.3
Process Control and Operational Intelligence
Osvaldo Bascur
This chapter presents a summary of the state of the art for mineral–metallurgical process control and “plant operational intelligence.” Operational intelligence is a way of providing an augmented view of real-time data rather than using tradi-tional fixed plant information management reports. The data are transformed into insights for further analysis using busi-ness intelligence tools.
Basic process control is an integral part of most mineral and metal processing plants. It has helped many operations reduce costs and increase productivity and performance. Developments in process control in the mineral–metallurgical processing industry over the past decade have been greatly influenced by new measurements, advances in computer soft-ware and communications, and internet/cloud technologies. Another extremely important factor has been the selection of strategies to link control actions to process measurement to form an overall control and plant management system. These three components—measurements, process control strategies, and computer hardware—form a triangle of integrating ele-ments, as shown in Figure 1. The knowledge workers who are the operators and process engineers are at the center of these elements. These individuals operate the process units. They are learning about the process and designing and maintain-ing the process control strategies. These control strategies are integrated with an operational management support system, combining all forms of information in a mineral processing plant. A continuous improvement and innovation culture is required for enabling operational excellence. In the following paragraphs, a control triangle is used to describe the process control and operational management technologies in the digi-tal age. This is called “Industries 4.0” and refers to the digital revolution that is currently taking place.
The decades between 1990 and 2010 saw the paral-lel development of three important aspects of modern min-eral processing control: (1) measurement devices designed especially for the particulate systems encountered in these industrial plants, (2) mathematical models constructed for the analysis of these systems, and (3) control strategies developed using the capabilities of digital computers. In recent years, the development of intelligent sensors (advanced control systems
based on object technologies and communications networks) have transformed the way plants are managed.
Plants require many sensors to measure the process and equipment variables to monitor conditions and to process sensor data using a variety of algorithms to assist in the sta-bilization of operations and the optimization of resources to minimize operating costs for an environmentally safe, profit-able operation. The “Process Measurements” section provides an overview of this topic. The lower right side of the triangle in Figure 1 shows the control hardware and computer systems that provide the environment for delegating the transforma-tion of the measurements into real-time controls for manipu-lating the final control elements for all process units. Shown at the top of the triangle are the control and performance man-agement strategies that process the sensor data to manipulate the final control elements in a process plant. The “Process
Process
Control
Measurements
Sensors
Control
Hardware
Computer Systems
Mine/Mineral/
Metals Processing
Knowledge WorkerMaintenance
Training
Adapted from Herbst and Bascur 1984
Figure 1 Control triangle—basic components and interactions in automatic control
100300 ProcessControl.indd 345 5/7/18 6:47 PM

346 SME Mineral Processing and Extractive Metallurgy Handbook
Control Strategies” section provides an overview of com-monly used process control techniques. At the center of the triangle are the people who design, operate, and maintain the systems necessary to keep the overall process of the triangle in working order.
Operators are usually part of the control loop because they must oversee the plant to achieve the desired target set daily by management. Process engineers are the support personnel who use the process data to develop strategies to manage con-straints; process advisors also support plant operations. Real-time data are used to assist with condition-based maintenance to prevent costly equipment downtime or to prevent process excursions due to failure to detect these abnormal situations in real time. Condition-based equipment maintenance, process excursions, and fault detection support functions belong to the plant data infrastructure, which provides data for performance monitoring, statistical process control, overall performance management, predictive analytics, evolutionary optimization, metallurgical mass balances, and energy management. These systems include ore blasting to the final tailings ponds and route deliveries to the filter plants and port.
Figure 2 shows a typical mineral processing plant. It starts with the mine trucks feeding the ore to a primary crusher, fol-lowed by comminution circuits to liberate the metal-bearing mineral in the ore for further separation in a flotation circuit to capture the metal-bearing species and discard the waste in to a tailings dump prior to the thickening of the waste to reprocess as much water as possible. The flotation circuit uses the min-eral characteristics to float the desired species and to hinder the waste material that needs to be separated from the rock. The major process variables are recovery and the grade of the
metals, depending on the type of ore being processed that is sent from a mine area or several mines.
These plants have traditionally used automation in the form of regulatory controls to stabilize process operation by rejecting the main disturbances.
Table 1 shows the variables that are used as controlled variables and those that are used as manipulated variables to achieve the desired business objectives in the regulation and stabilization of crushing, grinding, flotation, leaching, thickening, filtering, slurry transport, drying, smelting, and converting and refining the minerals and final metal products. The process control and operational management technologies are very unique. However, the basic principles are applicable to all industrial process systems. First, the control objective needs to be defined and then the behavior of the process units needs to be observed (and modeled). The best pair of manipu-lated variables needs to be coupled to the desired control vari-ables while avoiding process and equipment constraints for an environmentally safe, profitable operation.
Today’s technologies are enabling mineral and metallur-gical processors to develop competency centers where they can manage their mine and mineral processing plants remotely to coordinate mining operations with downstream operations. The objective is to find the optimal cut of grade at the mine and the optimal cut size at comminution to achieve the best recovery grade combination to maximize profits. The typi-cal process control objective is to maximize the metal yield while lowering operating production and mine costs. Because grades at mines have been lowered, large volumes of ore are processed to achieve economical production targets. As such, it has become more expensive to transport the ore and dispose
Primary Crusher
To Dump
Plant Feed
Ore Stockpile
Pre-Crusher
SAG MillBall Mill
Cyclones
Bulk Cu-Mo Flotation
Mo FlotationHyperbaric Filter
Final Cu
Tailings Dam
Final Mo
Sump Water
Feed Water
Figure 2 Integrated mineral processing block process diagram
100300 ProcessControl.indd 346 5/7/18 6:47 PM

Process Control and Operational Intelligence 347
of the waste. At mills, energy costs have increased to liber-ate the metal-bearing particles. Large volumes of water are also required by the wet grinding circuits. Final water recov-ery is achieved at tailing impoundment facilities at large min-eral processing complexes. The center of excellence can be located nearby to integrate the mine and the mill, or it can be based remotely to enable a virtual, cloud-based environment. Integration of the operational data and events transforms the organization into a continuous improvement and innovation culture. An operational excellence program is an ongoing pro-cess of improvement to achieve environmentally safe, profit-able operations.
The overall objective of process control and management systems is to stabilize operations to be able to maximize the economic profit of the operations while adhering to equipment, production, quality, environmental, and safety constraints.
The “Plant Operational Intelligence Management” sec-tion briefly describes the disruptive technology in process industries. In the past, process controls have lacked mainte-nance and training. Distributed control system (DCS) hard-ware is expensive, so this hardware is not updated very often. As such, many vendors provide alternative cost-effective solu-tions on other, more modern platforms. However, the software on which all these tools are built requires constant upgrades to perform well and deliver value. The rapid rate of change in computer systems and software applications requires modern maintenance practices. DCSs and programmable logic con-trollers (PLCs) can provide robust data to external systems that have professional data and analytical capabilities. Being able to access or share data with external services allows plant employees to augment their acquisition of knowledge and allows extended support of remote plant operations.
The next section, “Industrial Internet of Things: Disruption in Automation,” presents new ways of using real-time data and remote connectivity for collaboration using the cloud.
The “Conclusions and Future Implications” section sum-marizes process control and data infrastructure in the mining, mineral processing, and extractive metallurgy industries. It provides an overview of the benefits and methodology for the assessment of advanced process controls and newer predictive analytics.
PLANT DATA AND CONTROL HIERARCHYFigure 3 shows a data and control hierarchy diagram with two sides. The right side of the pyramid shows the traditional real-time control levels fed by the sensors and data collected from the field. At the lowest level is the instrumentation level, which consists of devices for acquiring data from sensors, field displays, and hardware safety interlocks for ensuring emergency shutdowns. The “Process Measurements” section of this chapter lists the basic concepts to explain the many fac-tors involved in implementing the right measurements in this very harsh environment for the mineral and metals industry.
The instrumentation level reports the data to the regula-tory control level, which is implemented using control hard-ware such as DCSs and PLCs. This level provides integration of the real-time data for the regulatory control level. It is one of the most important levels because it has to be extremely robust for industrial process continuity and operational safety. (This is equivalent to the brain stem and cerebellum in the brain.)
Table 1 Controlled and manipulated variables for crushing, grinding, flotation, thickening, slurry transport, and filtration
Process Units Controlled Variables Manipulated Variables
Crushing Product fineness Feed rate
Circulating load Closed-side setting
Power draw Screen area
Bin level Screen speed
Crusher level
Grinding Product size distribution Feed rate
Feed size Sump level
Sump level Pumping rate
Circulating load Solids in feed
Holdup of solids Mill speed
Flotation Recovery Aeration
Grade Agitator speed of rotation
Circulating loads Pulp levels
Froth levels Reagents
Froth speed Frother
Percent solids Collector
Modifiers
Depressants
Water spray
Thickening Slime level Flocculant addition
Rake torque Pumping rate
Underflow % solids Rake position
Underflow viscosity Water dilution
Bed level Viscosity modifier
Slurry transport Slurry flow Water dilution
Slurry density Pump speed
Slurry viscosity Upstream pressure
Suction and discharge pressure
Tank level
Slurry pH, oxygen Slurry inhibitor
Slurry–water interface Viscosity modifier
Filtration Cake humidity Feed rate
Cake thickness Pressure
Water removal
Time
Adapted from Herbst and Bascur 1984
Business Objectives
Planning and ExecutionManagement
Performance Monitoring
Event ManagementData Aggregation
Condition-BasedMaintenance
Chain Supply Optimization
Coordination Controls
Multivariate Controls
Regulatory Controls
Control HierarchyData + Time + Analysis Integration Hierarchy
Source: Bascur 2016
Figure 3 Plant data and control hierarchies for process control and operational intelligence
100300 ProcessControl.indd 347 5/7/18 6:47 PM
Diane
Highlight

348 SME Mineral Processing and Extractive Metallurgy Handbook
Regulatory ControlsRegulatory controls maintain the process variables at their prescribed set point, stabilizing the variations due to local disturbances occurring at a time scale of seconds to minutes. The disturbances can be caused by many factors, including weather conditions, changes in the raw material characteris-tics, ore hardness changes, particle size distributions, or min-eralogical compositions’ start-up and shutdown at the other sections of the chain supply of the plant. In addition, this level allows the operator to take control of the plant in an emer-gency, and it can be controlled manually. The DCS and PLCs require software tools to configure the control strategies and require a human operator interface to monitor the behavior of the plant under control. The level sends the streaming data collected from the plant to a dedicated industrial historian (like the black box of an airplane). The stream data are used for enhanced equipment condition-based maintenance and for control tuning and improvements.
The “Process Control Strategies” section provides addi-tional details about ways to capture the process dynamics and the configuration of the possible control strategies. The pro-portional–integral–derivative (PID) controller is perhaps the most commonly used process control algorithm to implement local single-input, single-output (SISO) control loops. The DCS is used to implement multiloop control strategies such as feedforward, cascade, ratio, and constraint controls. DCSs have augmented their capabilities so that the next level is also part of a modern DCS.
Multivariate ControlsThe next level is called multivariable process control or model-based process control. This level has evolved in recent years due to advances in hardware and computing capabilities. In a processing plant, the problems are typically multivariable with many control interactions due to the nonlinearities of the process, process equipment constraints, and unknown process disturbances. Because of the possible interaction among the variables, all the control movements must be coordinated. Control actions are taken to accommodate longer duration disturbances at a time scale of approximately minutes. This is also due to the slow processing time of the online process sensors or the instream process analyzers. Mineral and metal operation process dynamics are important, and a dynamic process model is necessary. The output of this level is used by the DCS as a set point to drive the final control actuators that operate the plant. The final control elements are the valves, variable-speed pumps, and weight feeders, among others. This level is metaphorically equivalent to the hypothalamus, which maintains brain chemistry and controls appetite, thirst, body temperature, and libido. This last statement stresses the impor-tance of having a hierarchy in process control design. It is highly recommended that priorities are clarified when imple-menting and maintaining overall control strategies.
Coordination ControlsThe plant coordination controls are implemented to balance the overall constraints to find the optimal steady-state operat-ing conditions of the plant based on the current production requirements and factors, such as raw materials, energy and consumable costs, and production demand. These process controls require the left-side level to analyze operations to identify the current process and equipment constraints.
Chain Supply OptimizationThe planning and scheduling activities are usually determined by the integration of the plant’s industrial data infrastructure with the enterprise business systems, which contain the pro-duction plans and utility costs. For example, in mineral pro-cessing plants, the mine production, mill, tailing, and port production areas are integrated to optimize the overall energy and water use based on the type of ore being mined (drilling, explosives, and blasting strategies). The lowering of the ore grades requires a much more detailed analysis for classifying the operating strategies and lineups of the plant for the best and most profitable alternative. Mill data are now being used to optimize mine-blasting operations for minimum operating costs while maximizing throughput.
Condition-Based Equipment MonitoringThis section describes alternative ways of reusing data, gener-ating events to create actionable insights based on operational intelligence. It is critical to be vigilant about maintaining equipment to achieve high productivity and availability lev-els to remain competitive in the mining and mineral process-ing industry. Maintenance activities were not carried out in the past because the technology was not available. Reusing data from the industrial data infrastructure is the most cost- effective way of achieving high productivity levels. Today, operations and maintenance teams have to work with the same data to keep the instrumentation, process controls, and equip-ment online 24/7 for optimal production levels. Using the process sensors and capabilities of a modern industrial data infrastructure, maintenance personnel can implement condi-tion-based maintenance strategies to monitor and predict the performance of moving equipment in real time. Now there is powerful data analytics to filter data to detect problems prior to a failure.
Because the process and equipment data are always avail-able, employees can use the data to generate notifications to initiate a programmed shutdown as opposed to dealing with an unscheduled shutdown.
When regulatory controls and multivariable control loops underperform, this can cause process variability that adversely affects profitability. Having the stream data available in an easily accessible format for advanced analysis simplifies the continuous improvement process required to support the con-trols at all levels for all process units in the plant.
The increasing use of real-time data is elevating the role of plant personnel to that of knowledge workers who are expected to make real-time decisions to improve business per-formance. The high variability of ore qualities, rapid changes in energy costs, reduced availability of process water (or, in some cases, too much water in equatorial regions) require adaptive real-time performance strategies.
Event Management Data AggregationThe left side second level supports the validation and clas-sification of the data to develop actionable information. This actionable information is the key ingredient for implementing a continuous improvement and innovation program in pro-cess industries. This is called an operation intelligence pro-gram. It allows the sensor data and the operational events to enable online analytics to evaluate the production and opera-tional costs on a shift-by-shift basis. The transformation of data and operational events into actionable information using
100300 ProcessControl.indd 348 5/7/18 6:47 PM
Diane
Highlight

Process Control and Operational Intelligence 349
these operational events to obtain production, energy, water, reagents, and other consumption variables at a high level of detail is the new currency in business. These operational events are the new transactions to optimize production and reduce operating costs. Transactional systems are now inte-grated with this new data to proactively improve the over-all production performance of mineral and metal processing plants (Bascur et al. 2017).
Performance MonitoringThe left side of the pyramid represents the support center, which provides actionable information to all functions of the plant to improve productivity. The operational metrics can be calculated by using proper data classification and aggregation at a high level of detail. This new strategy enables faster com-munication and collaboration within the functional teams at the plant and within the global business via the cloud. At this level, the business and time contexts are added to the process measurement. This level is used to generate tangible benefits for improvements. The data and events are analyzed to deter-mine the best course of action for the plant.
Planning and Execution ManagementThe integration of operational analysis and business intelli-gence is the next level. At this level, plans are constantly being adapted by defining the best targets to optimize all process areas, beginning with the mine, process plants, and tailings management. Botin (2009) describes the latest strategies to integrate sustainability into a mining organization. Data man-agement and automation are what allow these strategies to be successfully implemented.
PROCESS CONTROL FUNDAMENTALSMany excellent books have been written about process con-trol and there are many different approaches, but it is best to follow the advice that best suits the needs and goals of one’s specific company.
In his textbook, Stephanopoulos (1984) states: “All the requirements (safety, environmental constraints, product specifications, operational constraints and plant economics) listed above dictate the need for continuous monitoring of the operation of a chemical plant (process), and external interven-tion (control) to guarantee the satisfaction of the operational objectives.”
This is accomplished through a rational arrangement of equipment (e.g., measurement devices, valves, controllers, computers) and human intervention (e.g., plant designers, plant operators), which together constitute the control system. In fact, one’s working definition of process control is shaped by one’s specific interests. The point is that to be successful in the long term, one must recognize that a systems or holistic approach will be essential (i.e., the broader definition of pro-cess control).
Why Do We Need Controls?A critical problem in the process of ore extraction is the vari-ability of the different elements that constitute the ore; these unmeasured variables are called disturbances in the process control vocabulary. Each section of the mine has different ore types, hardnesses, mineralogical compositions, and geo-logical characteristics; in addition, there are disturbances due to weather changes, people, equipment deterioration, power oscillations, and water qualities. Marlin (2014) outlines seven
major categories of control objectives, which are discussed in the following sections.
Safety and HealthThe safety of the people in the plant and in the surrounding community is of paramount importance. Plants are designed to operate safely at expected temperatures and pressures; how-ever, improper operation can lead to equipment failure and the release of potentially hazardous materials.
Environmental ProtectionProtection of the environment is critically important. This objective is mostly a process design issue—that is, the process must have the capacity to convert potentially toxic compo-nents to benign material. For example, in smelters, the gases are cleaned and processed in sulfuric acid plants, where the sulfur dioxide (SO2) generated in the smelting of sulfides is converted into sulfuric acid (H2SO4). Many sensors are used to monitor the gas cloud of smelters. Tailing ponds are always very well designed to prevent issues with the re-treatment of the water and effluents.
Equipment ProtectionMuch of the equipment in a plant is expensive and difficult to replace without costly delays. Therefore, operating conditions must be maintained within constraints to prevent damage. The types of control strategies for equipment protection are similar to those for personnel protection, that is, controls to maintain conditions near desired values and emergency control to stop operations safely when the process reaches boundary values. Many sensors are used to robustly maintain the equipment to prevent exceeding the mechanical strength or the chemical limits of the material. This is very important for the steel used in smelters or in hydrometallurgical plants. Pumps, compres-sors, and blowers are typically subjected to high temperatures and corrosive gases. Installing the proper sensors in addition to process control sensors to protect the equipment will pre-vent costly downtimes and loss of production. All these sup-port strategies have become an important part of implementing environmentally safe, sustainable process control strategies.
Smooth OperationA mineral or metallurgical plant includes a complex net-work of interacting processes; thus, the smooth operation of a process is desirable because it results in few disturbances to all integrated units. A typical example is the comminution circuits. These are highly unstable due to the large variation of the ore qualities (soft and hard ore); these variations are directly sensed by the rougher flotation banks. Having a stable grinding operation is necessary to have an optimum flotation performance. Most of the disturbances in flotation circuits come from the grinding circuits.
Product QualityThe final products and quality specification in a metallurgical complex are determined by customer requirements. Having the right humidity for the concentrate and the right mineral composition for the downstream processes such as smelting or pellets used in blast furnaces is extremely important. It is extremely expensive to remove high silica content in a blast furnace if the pellet quality has reached the target level. The same is true for the quality of the concentrates—they must have the right amount of sulfur and the right metal grade. The
100300 ProcessControl.indd 349 5/7/18 6:47 PM

350 SME Mineral Processing and Extractive Metallurgy Handbook
specifications may be expressed in terms of composition (e.g., percentage of each component, chalcopyrite, pyrite), physical properties (e.g., density, humidity), or a combination of these factors. Process control contributes to efficient plant opera-tions by maintaining the operating conditions required for excellent product quality. Improving product quality control is a major economic factor in the application of digital com-puters and advanced control algorithms. This is where process models are used to estimate the quality variables in the pro-cess due to the inadequacy of the quality sensors to measure the particle size distributions, mineralogical compositions, or chemistry of the process streams. Laboratory samples can be correlated with process variables using machine learning to accurately determine the quality conditions in a plant. The augmentation of knowledge provided by the operational intel-ligence data infrastructure is changing how mineral and metal-lurgical plants are operated.
EconomicsNaturally, the goal of the plant is to return a profit. There are several strategies based on sustainable long-term prof-its. Process control improves plant performance by reducing the variation of key variables. When variations are reduced, the desired value of the controlled variable can be adjusted to move closer to constraints, enabling an increase in prof-its. Furthermore, it should be as economical as possible in its use of raw materials, energy, capital, and human labor. Thus, operating conditions must be controlled at optimum levels of minimum operating costs, maximum yields, and minimum metal losses.
Monitoring, Fault Prevention, and DiagnosisComplex mineral and metallurgical complexes require excel-lent automation processes. Plant control and computing sys-tems generally provide monitoring features for everyone in the organization to properly manage the instrumentation calibration, process control identification and tuning of the control algorithms, stream samplers for metallurgical stream laboratory data, equipment sensor maintenance, environmen-tal remote monitoring, and so on. Because employees can-not monitor all variables simultaneously, the control system includes alarms that can draw attention to a problem. Now there are new ways of alerting operations and maintenance personnel to problems using plant computers and competency centers. Operational intelligence and machine learning algo-rithms are now used to predict faults or quality. Many oppor-tunities exist to reduce minor losses that previously may not have been prevented in remote plants. New ways of using data and events are discussed later in the chapter.
All seven of the aforementioned requirements should be addressed simultaneously; failure to do so could lead to unprofitable or, worse, dangerous operations. Today, ever-increasing environmental and safety regulations require per-sonnel to be more knowledgeable to avoid penalties due to process incidents in mineral and metallurgical plants.
Automatic controls are devices that assist operators with performing routine tasks faster and better than they could do manually without assistance. Mills run for 24 hours a day, and it is impossible for a human worker to remain alert at all times. Automation using the feedback principle is not new; there are many examples throughout history of automatic control prin-ciples being used for many applications. Process control is a
subdiscipline of automatic control that involves the selection and tailoring of methods for the efficient operation of chemi-cal and metallurgical processes.
Proper application of process control can improve the safety and profitability of a process while maintaining con-sistently high-quality products at a production target set by the economics and planning department. The automation of selected functions has relieved plant personnel of tedious routine tasks, allowing them more free time to analyze data, supervise, and learn from the process. The operational data and metadata available in process information systems help to improve processes. The data can be used to analyze the current operating conditions for ore types and economic conditions. As such, there are many different approaches to running a mill these days, especially with the high volatility of metal prices and energy and water costs.
The variability of ore qualities and lower grades requires plants to process larger volumes of ore; at the same time, plants must also implement environmentally safe process controls.
Process Control LoopsA typical control loop can be described in terms of input and output process variables. These variables are measured using online sensors, if available, or inferred from online calculations.
The output variables are associated with the control objective. The input refers to a variable that causes an output. The input is the tonnage flow rate to the mill, and the output is the % circulating load of the ball mill circuit, for example. The input could also be the water addition to the sump, and the output of the controlled variable could be the % solids of the hydrocyclone overflow.
The input causes the output, and this relationship cannot be inverted. The causal relationship inherent in the physical process forces one to select the input as the manipulated vari-able and the output as the measured variable. Selected exam-ples in mineral and extractive metallurgical processing are presented later to illustrate the process control pairing of con-trolled variables and manipulated variables. The final pairing is the responsibility of the mineral processing engineer who understands the process units and has a clear objective for the design strategy. A basic list of the possible available variables for selected process units is also given later in this chapter.
For example, for a grinding circuit control, the objective could be to maximize the product throughput while maintain-ing the cut particle size on target for the best recovery and grade possible. The engineer selects sensors that measure important variables rapidly and with sufficient accuracy. The engineer must provide the manipulated variables that can be adjusted by the control calculation.
The engineer must decide which variable should be manipulated for each controlled variable. He or she should determine the most logical structure, or pairing, that requires a causal relationship between the final control element of the manipulated variable (usually a valve, pump, or belt con-veyor) and the controlled variable. Many other issues must be considered in a complex mineral processing plant, such as favorable dynamic responses and reducing the interactions among controllers.
The development of mathematical models for the analysis of dynamics and the control of mineral processing systems is extremely important. Digital process simulators for crushing,
100300 ProcessControl.indd 350 5/7/18 6:47 PM

Process Control and Operational Intelligence 351
grinding, classification, flotation, dewatering, and agglom-eration models assist with defining the control algorithms. Dynamic process simulators can help with process control system training and selection of alternative control strate-gies. The design of the operator interface is also vital; this is where workers can visualize and respond to problems within the plant. Figure 4 shows a simple process control diagram displaying the controller and the selected variables.
Based on the control algorithm, the manipulated vari-ables change the output of the controlled variables to adjust for process disturbances. Every process control strategy has a clear objective and a profit objective function to evaluate the performance of the setting and methods used to analyze the manipulated variables.
The set point is the target that is determined for the con-trolled variable. Figure 4 also shows a feedback control loop. The process outputs are measured by sensors that have noise and require good calibration. These controlled variables are compared with the set point to come up with a way, using the controller, to manipulate a variable that will maintain the desired target. The manipulated variable connects to an actua-tor that drives the pump or conveyor to the desired target—say, for example, the correct flow of water into the sump pump to achieve the right change in the hydrocyclone overflow par-ticle size.
ControlThe control maintains the desired condition in a physical sys-tem by adjusting a selected variable in the process. A control strategy can be defined in several ways. The most common one is a feedback controller.
Feedback ControlThe feedback controller uses an output of the process to cal-culate the value of the manipulated variable to produce the desired effect on the desired output by setting a set point.
Feedforward ControlA feedforward controller does not use an output of the process—it uses the measurement of an input disturbance to the plant. This measurement provides an early warning that the controlled variable will be disturbed sometime in the future. With this warning, the feedforward controller has the oppor-tunity to adjust the manipulated variable before the controlled variable deviates from its set point. A good process model is required to produce this advanced calculation for assessing the calculation. For example, knowing the hardness variation of the ore can drive the feed to the mill. If it is difficult to mea-sure the ore hardness, the controller can reduce the feed flow rate to prevent overloading the mill, for example. This type of controller provides the value for the set point of the controlled variable.
The operating conditions of the process are measured—that is, all control systems use sensors to measure the physical variables that are to be manipulated near the desired values (operating targets). Each process has a control calculation or algorithm that uses the measured and desired values to deter-mine a correction to the process operation. The control cal-culation can be very simple or sophisticated, depending on the stability of the given process circuit. The results of the calculation are implemented by adjusting a valve or motor in the process for the manipulated variable to compensate for the disturbances in the process inputs (measured or unmeasured).
Process Control DocumentationGood control engineering always requires a thorough under-standing of the process. A good process flow diagram show-ing the major sensors provides a solid start when designing a process control system (Bhattacharyya et al. 2012; Turton et al. 2012). A process flow control diagram (PFCD) is different from a traditional piping and instrumentation diagram (P&ID), which is a great visual for detailed process documentation. A P&ID is a detailed graphic used in the process industry that
Controllers Actuators
Controllers Need:• Configuration• Tuning• Maintenance
Process Unknowns:• Dead Time• Difficult Dynamics• Strong Interactions• Process Constraints
SetPoints
Sensors
Measured andUnmeasuredDisturbances
Disturbances:• Mineralogy• Hardness• Size• Humidity
• Noise• Calibration
Actuators Need:• Hysteris• Nonlinearities• Maintenance
Pc = Oil PressureW = Belt Weight and Speed
Jb = Mill PowerN = Rotation SpeedNc = Critical Speed
Pc
JbScreen
SAG MillWater
Fresh Feed
% – 6” + 1” W
N/Nc
Pebble CrusherCyclones
Ball Mill
Pump
Sump
Figure 4 Process control diagram overview
100300 ProcessControl.indd 351 5/7/18 6:47 PM
Diane
Highlight
Diane
Highlight

352 SME Mineral Processing and Extractive Metallurgy Handbook
shows the piping and vessels in the process flows along with the instrumentation and control devices. These drawings are used for many purposes, including designing plants, purchas-ing equipment, and reviewing operating and safety procedures. Having a good PFCD of the plant is necessary to design the process control strategy well. In addition, it serves as a good way for the operator to understand the behavior of the process and have a clear picture of the overall progression. Therefore, many people use PFCDs, and to avoid misunderstandings, standards have been developed by the International Society of Automation (ISA) for all countries worldwide (ANSI/ISA-S5.4-1991; ANSI/ISA-S5.5-1985).
It is important to use the best possible process control diagrams to document the process and its controls not only to document the strategies but also to teach users about the cause and effect of the manipulated and controlled variables in the overall circuit. This is also valid for performing a mass balance of the process units or the combined process systems in a plant. It is good practice to be able to close a mass balance with the process control data available. These diagrams can be used for process diagnostics and troubleshooting. They might also be used for developing process control graphic diagrams to build a human graphical interface for the operators.
Referring to Figure 4, all process equipment—piping, vessels, valves, and so forth—is drawn in solid lines. Sensors are designated by a circle connected to the point in the process where they are located. The first letter in the PFCD indicates the type of variable measured. Some of the most common des-ignations are as follows: A = analyzer, F = flow rate, L = level, P = pressure, W = mass flow rate, J = power measurement, T = temperature, C = control, and I = indicator.
If the signal is used in a real-time calculation, it is also shown in a circle in the PFCD. The second letter in the symbol indicates the type of calculation. Two possibilities can be con-sidered: C for feedback control and Y for another calculation. A noncontrol calculation might be used to measure the flow and temperature around a furnace to calculate its work level, that is, Q = rCPF(Tin – Tout).
The first reason for control is to maintain the tempera-ture at its desired value when disturbances occur. The second reason is to be able to navigate to the desired variable (set point) without overshooting. The desired values are based on a thorough analysis of the plant operations and objectives. The selection of sensors and the proper manipulated variables and their physical control elements (valves, pumps, motors) with the right controlled variables is very important for good pro-cess control performance.
Today, virtually all large and medium-sized mineral pro-cessing plants around the world practice some form of auto-matic control. The interactions between the basic elements of the control triangle can be summarized as follows: The state of the art involves the use of several stabilizing control loops involving a mixture of control strategies. These control strate-gies include a variety of classical control strategies, advanced control strategies using models, and expert controls based on best practices. By capturing and analyzing the process vari-ables, employees can maintain the instrumentation and process control loop performance to achieve a high level of productiv-ity and simplify the maintenance of the control loops.
The vast majority of control schemes can be classified as classical control strategies. The feedback control law involving proportional and integral actions is used to com-pute changes in the controller output (manipulated variable) in
response to measured deviations from a set point for a specific controlled variable. For such strategies, each manipulated variable is linked to a controlled variable on a one-to-one basis with the formation of a SISO control system. The com-putation capabilities of the control systems allow several pro-cess measurements to derive estimates as controlled variables. These soft sensors are derived from early work on advanced model-based control strategies. However, they require addi-tional information for successful implementation. The opera-tor requires training to understand this additional information embedded in the control loops. These strategies are usually called advanced controlled strategies. Many algorithms are available in modern DCSs to account for many of the time domain industrial aspects of a plant.
Control handling is delivered using a human–machine interface. The engineers building, tuning, and maintaining the control strategies design these tactics. These engineers need to design the visualization of the process controls for operator interaction. This is something that can be overlooked. Bascur (1991a) presents some guidelines that were used to success-fully implement process controls in several plants. Li et al. (2011) also discusses the new role of the operator and his or her training requirements. The design of the control room also plays a very important role in the delivery of the controls and the management of the operations (Lundmark 2008).
PROCESS MEASUREMENTSTable 2 summarizes the mineral processing instrumenta-tion available along with the principle of measurement and the types of circuits in which it is most often used. Many of the sensors used in the mineral industries take advantage of microprocessors, digital imaging, and sophisticated signal processing required for particulate system measurements.
Table 2 also lists the many types of measurement devices used in mining and metal processing. Flow, pressure, tempera-ture, load, vision, sound, particle size, and chemical online analyzers of all types and shapes are available. The newest measurement devices use optics in video cameras to transform the images into process variables by measuring particle sizes at the mine and the mill. Other novel vision measurement devices have been used in semiautogenous grinding (SAG) mills to analyze particle sizes, mill liner conditions, and flota-tion circuits.
Recently, additional vision sensors have entered the mar-ket (Coker 2015). By combining the application of standard imaging technology with new liner wear monitoring hardware, the Kaltech Sentinel reveals live information about a running mill. The Kaltech Sentinel is a system that incorporates two main components: the MillWatch camera unit and the elec-tronic bolt (eBolt). By providing visualization along with the process, the data can be analyzed to optimize the grind cut and the overall grinding circuit availability.
Soft SensorsSoftware sensors (or soft sensors) are another important process monitoring tool. Soft sensors essentially use other easy-to-measure process variables to estimate the value of an important property of a piece of equipment or process unit that is otherwise difficult, costly, or time-consuming to measure. Predictive analytics capabilities to obtain empirical models using a hierarchical data model are shown later in Figure 13 (Bascur 2016). After data classification and assessment of the process unit operating conditions, the process variables can be
100300 ProcessControl.indd 352 5/7/18 6:47 PM
Diane
Highlight

Process Control and Operational Intelligence 353
Table 2 Mineral–metallurgical processing instrumentation
Measurement Devices Type of Circuit
Aeration, oxygen, gases Magnetic rotameterOrifice plateTurbineDelta pressure
Flotation, hydrometallurgy, pyrometallurgy
Belt conveyor speed Measurement of revolutions per minute All operations
Bin level Sonic sensorCapacitance probeLaserRadar
All operations
Crusher power, mill power, flotation power, process unit power
Watt meterTorque meterMotor current
All rotating process equipment
Feed rate dry solids WeightometerTwo-dimensional profile
All operations
Flotation cell level Bubble tubeFloatFloat and ultrasonicResistance tapeConductivity probe
Flotation cell froth level Digital visionCapacitance probeConductivity probe
Flotation
Mill load, converter load, process unit load Load cellsWatt meterTorque meterSound meterVibration sensorsBearing temperatureOil pressureVision sensors
Grinding
Mineral species composition X-ray fluorescence analyzerNeutron activation analyzer
Flotation, hydrometallurgy
Particle size Ultrasonic particle size analyzerLight-scattering size analyzerDigital vision (dry solids) (two-dimensional, three-dimensional)
All operations
pH ElectrodeConductivity
All operations
Pressure Load cellsMany technologies
All operations
Pulp density Gamma nuclear gaugeU tube/load cellDifferential pressure cell
All operations
Pulp level Capacitance probeSonic sensorConductivity probeDelta pressureRadarBubbling methods
Flotation
Sludge level FloatUltrasonic sensorLight attenuation
All operations
Slurry flow rate Magnetic flowmetersUltrasonic flowmetersSonar flowmeters
All operations
Torque AmperageLoad cellTorsion bar
All operations
Viscosity Shear stressFlow
Thickening
Water (liquid) flow rate Orifice plate and other delta P devicesTurbine meterMagnetic flowmetersSonar flowmeters
All operations
Adapted from Herbst and Bascur 1984
100300 ProcessControl.indd 353 5/7/18 6:47 PM

354 SME Mineral Processing and Extractive Metallurgy Handbook
used to predict other variables using a deterministic first prin-ciple model or a semi-empirical model. The use of a first-order filter is recommended to smooth the data to remove noise. It is also possible to use a Kalman filter to determine the opti-mal estimation if a dynamic process model is available. An extended Kalman filter is capable of providing an estimate of the process kinetics. As such, the flotation kinetics or com-minution kinetics can be obtained (Bascur and Herbst 1985b, 1986; Herbst and Harris 2007).
The most common procedure is to run experiments in the plant and measure the critical variable while recording all pro-cess variables in the history log. Then, operators typically run a procedure to obtain the process variables at the same time as the sample measurement and run a multilinear regression using Excel data analysis tools or other software tools such as Python, R, or Microsoft Azure Machine Learning Studio.
The objective of soft sensors is to make this information immediately available to operators and to advanced process control systems. Soft sensors combine critical process vari-ables to infer quality variables such as particle size, flotation cell air holdup, % metal content in a process stream, inventory, and many other operational variables required to optimize a process plant. These estimates can be easily obtained by using the current analyzers to develop these regression models.
Detection and diagnosis of process faults and critical con-ditions are essential for efficient operations. Faults can typi-cally be determined from the measured data by identifying a given or normal process operating pattern. If the composite measurements or indicators fall outside the original or normal operating pattern, then a fault must be present in the process. Using time-derived variables or using statistical process con-trol or multivariate statistical control can become a valuable tool to perform fault diagnosis and to prevent problems.
Sampling SystemsMining, mineral, and metallurgical plants and ports require special sampling systems. Automated slurry sampling to analysis is typically used when systems cannot deliver the accuracy required to manage the plant. Samples are automati-cally taken from the slurry streams, then automatically filter pressed, dried, pulverized, and analyzed, with results quickly returned to the plant for plan control. Typical systems pro-cess four feed lines, four concentrator lines, and four tailing streams, giving the plant metallurgists a picture of the process every few minutes. All the data are captured by a plant his-torian at the original resolution in real time. The metallurgi-cal laboratory manual data are time-stamped for correlation process data when the sample is taken. A data infrastructure system can generate quality empirical models to produce lab estimates from process data. At port laboratories, the entire process, from sampling to analysis and cargo certification, is fully automated. In the case of iron ore processing, for exam-ple, primary cuts of up to 1 t are taken. Each cut is split within the sampling system to produce a sample for the automated laboratory. A portion representing each primary cut is trans-ported automatically to the robotic laboratory via a conveyor system. These aliquots are composited and split to produce sublots. The particle sizes and moisture levels are determined for each sublot. Depending on the quality requirement, sublot chemical analysis is carried out; sometimes, however, only a final composite is done. Chemical analysis as well as particle size and moisture analysis is performed automatically, with data then transmitted to the plant control system. There are
variations of sampling, such as truck and train integrated sam-pling and bulk bag sampling.
There are dry product samplers for primary sampling, such as heavy-duty rotating samplers, continuous reverse- discharge samplers, continuous forward-discharge samplers, and front-discharge cross-belt samplers, among others. There are also secondary samplers such as Vezin samplers, rotating plate dividers, and rotating sample divider multi-output.
Slurry sampling and analysis systems with in-line auto-mated analytical and particle size measurement techniques are also used. In-line analysis provides very fast feedback for plant control. There are, however, applications in which offline sampling and analysis are required. Some examples include metal accounting or cases in which the analyses cannot be measured by online techniques or in which online techniques do not achieve the required detection limits. Applications include phosphate ore and precious metals.
Typical slurry samplers include primary samplers such as gravity samplers, linear cross-out samplers, rotary cross-out samplers, and pipe offtake samplers. Secondary samplers include gravity samplers, launder (cross-cut) samplers, pri-mary slurry samplers, two-in-one samplers, pipe offtake sam-plers, and timed and continuous Vezin samplers.
All mining metallurgical plants require analyses of plant in-process streams to monitor plant performance. Typically, automated cross-stream cutters are used to provide shift or daily composites that are then sent to an analytical labora-tory for analysis. The turnaround time for plant personnel to receive the analytical data is typically 24 to 48 hours after the laboratory receives the samples.
Thus, the data report the past performance of the plant and cannot be used as a real-time tool to control plant per-formance. This is where new machine learning tools come in handy to model the ore types with the process and laboratory data to determine quality estimates that are modeled and then used as predictors.
Keeping a plant running at peak performance is mainly dependent on the skill and experience of plant operators. They should notice changes, such as the absence of bubbles in a flotation circuit, and then immediately apply corrective mea-sures. Advances in video analysis are also being made; opera-tors can then use video analysis to manage the plant rather than physically monitor and analyze occurrences.
Specialized Online AnalyzersOnline analyzers are available for slurry streams but typically require a great deal of maintenance, are not very accurate due to calibration difficulties, and have high detection limits due to the high dilution factor in the slurry streams. IMP Automation provides near-online analysis for metallurgical plants for fire assay (precious metals). X-ray fluorescence spectrometry using fusion discs for major elements and pressed pellets for minor and trace elements can also be used (see Braden et al. [2002] for more information).
However, these analytical methods provide data for indi-vidual elements. If a process in a metallurgical plant involves the separation of phases containing the same element(s), these analytical methods produce less useful data. In addition, online and in-line analyzers can be used for particulate systems.
Belt product analyzers use advanced neutron-gamma technology to provide elemental composition measurements that are both rapid and accurate. This technology uses the penetrating power of neutron radiation to interrogate a large
100300 ProcessControl.indd 354 5/7/18 6:47 PM

Process Control and Operational Intelligence 355
volume of material flowing on the conveyor belt. When neu-trons interact with the material, gamma radiation is emitted promptly with energy signatures that are characteristic of ele-ments present in the material.
Online X-ray diffraction provides information on the min-eralogy of the product. In-line rapid mineralogical analysis can significantly improve process control for an improved recovery and grade. These analyzers can be integrated with sampling and sample preparation equipment, presenting the analyzer with a dry representative product for analysis. Robotics technology is used to automate this process in the laboratory. On-belt moisture measurement allows for the accurate measurement of moisture in real time from belt conveyors.
There are many video camera–based particle size analyz-ers, such as the split online analyzer, which are mounted on trucks and on belt conveyors in comminution systems. These provide reduction ratio factors based on the operating con-ditions and enable improvements from the blast to the final concentrate products by integrating all data points using a real-time industrial data infrastructure.
For pyrometallurgical integrated sampling, IMP invented a special system to automatically sample an Ausmelt con-verter with a hearth depth of 17 m.
Instrumentation and Devices NetworkSome examples of control networks are Profibus, DeviceNet, Modbus Plus, Ethernet/IP, Fieldbus, and remote input/ output systems. Ethernet networks and security gateways are typically used for information networks. For more infor-mation, refer to the studies by Stuffco and Sunna (2002), Medower and Cook (2002), and Lukas (1986).
PROCESS CONTROL STRATEGIESThis section discusses the types of controls that are needed to optimize the operations of a process plant. There is a con-trol hierarchy in the implementation of these controllers. Regulatory controls govern these controllers, just as the brain controls the involuntary responses of the body (located in the brain stem and the cerebellum). As the human body needs to control its chemistry for dealing with emotions, thus enters the limbic system. These can be called the body’s advanced controls, which are based on multivariate controls due to the integrations of the many variables that need to be considered. The more sophisticated plant-based controls need to coor-dinate several process units—from the raw materials, to the products that provide targets, to all the process units to opti-mize the plant. This is similar to the function of the thalamus, which relays sensory impulses from receptors throughout the body to the brain and controls motor skills, language skills, vision, and emotions. This is called the performance moni-toring management system, as shown in the left side of the triangle in Figure 3.
Process DynamicsOne of the most important aspects in process control is under-standing process unit dynamics to identify the best way to reduce the variations of the output or controlled variables to achieve a certain process business objective. Process response modeling and analysis can help us obtain this required knowledge.
The process reaction curve is probably the most widely used method for identifying dynamic models. It enables us to identify the reaction times between the controlled and manipu-lated variables. The analysis provides a good foundation for
coupling the regulatory basic controls and methods to tune a PID feedback controller. From a steady-state operating mode, a step change is introduced with the manipulated variable, and the response data of the process-controlled variables are col-lected until the process again reaches a steady state. Figure 5 shows the process reaction curve. MVΔ is the magnitude of the input change of the manipulated variable, PVΔ is the magni-tude of the output or controlled variable, and S is the maximum slope of the output versus the time plot. This slope represents the rate of change or velocity of the response. The sign of this slope can be positive or negative or both. In addition, the veloc-ity of the response can be fast or slow compared to other output variables in the process. The values of the real-time plot can be related to the model parameters according to the following relationships for a first order with a dead-time process model. A typical model of the form y(t) = KpMVΔ(1 – exp[–(t – q)/t)] is used to calculate the parameters Kp, t, and q. The variable t is the time while performing this response test.
• Kp = PV∆/MV∆: This constant is called the gain of the reaction curve.
• τ = PV∆/slope of the reaction curve: This time constant is called the time constant of the reaction curve.
• θ = intercept of the maximum slope: This time constant is called the delay for reacting to the input.
The process reaction curve is a way to obtain basic knowledge about the controlled and manipulated variables. The typical process to obtain a process control model is
• Perform step testing,• Perform time domain modeling using curve fitting, and• Perform pseudorandom pulse tests and other frequency
domain modeling.
The following section presents the results of this type of pro-cess testing based on dynamic simulators and industrial expe-rience from tests in these types of processes.
Process Knowledge Table for Mineral Processing OperationsMineral processing unit operations have many nonlinearities and interactions that complicate their behavior. This complex
0 20 minutesTime
0
5
15
25
Slope
Θ
Manipulated Variable
PVΔ
Process Variable
MVΔ
Proce
ss V
ariable
, Fl
ow
Mani
pul
ate
d V
ariable
, %
Open
Valv
e
Kp = PVΔ/MVΔ
Figure 5 Dynamic process reaction curve for modeling and analysis purposes
100300 ProcessControl.indd 355 5/7/18 6:47 PM
Diane
Highlight
Diane
Highlight
356 SME Mineral Processing and Extractive Metallurgy Handbook
behavior can be visualized in a process matrix table for pairing the possible combinations using traditional processing control loops and adding decoupling actions to compensate for the behavior. Table 3 shows the typical process output as control variables measured subject to an increase in the manipulated variable. It shows the direction of a step response from the manipulated variables—increase (+) and decrease (–)—and the speed of the response (slow or fast). The speed of the response is the combination of the controlled variable and the manipulated variable. A + and – means that there is an inverse response. This means that the variable will start going up very fast and then will decrease, which is called nonlinear behavior. For example, in a closed-loop grinding circuit, when water is added to the sump pump, the % solids in the cyclone overflow will shoot up immediately but will come down once the over-all circuit settles down. The time is usually about the overall residence time of the circuit (volume/feed rate)—15 minutes or so. This table can be validated using the process history of the variables from a history log to be calculated using a spreadsheet with mathematical analysis multivariable statisti-cal tools.
The process response matrices for crushing, ball mill grinding, flotation, and thickening provide a qualitative guide to strategy selection. All other factors being equal, it is desir-able to perform manipulations that will result in the largest possible change in the process output variable to be controlled and the quickest rate while minimizing undesirable changes in the other variables. Without models, this must be translated into quantitative terms for each application with the possibil-ity that, under some circumstances, incorrect control actions may be taken. It is recommended that a clear uncontrolled or open-loop mode is used while performing the step responses to perform a test.
Table 3 shows a process control knowledge table that rec-ommends combinations of controlled and manipulated vari-ables to comply with process control objectives. It presents cause-and-effect and speed-of-response scenarios of these pairings that can be obtained from plant process data or with process dynamic simulators. In addition to these pairings of variables, one must take into account additional observed variables that are used in the diagnosis of process constraints of the ever-changing operating conditions in a mill due to ore variability disturbances, the age of the equipment, mainte-nance issues, and operator strategies. The concept of such a matrix is important and can provide insight with respect to the pairing of the variables available in the field. It is a good way to track the control performance of the process units once the computer automatically evaluates the parameters.
Table 3 was derived using mineral processing dynamic models and empirical data collected from plant trials (Herbst and Bascur 1984; Bascur and Herbst 1985a, 1986). Having the process control matrix available simplifies the implementation of both traditional regulatory PID controllers and multivari-able process controllers.
Regulatory ControlsRegulatory controls are the foundations of process control and must perform well for supervisory control to succeed. In a mineral processing plant, this class of control typically includes flow, level, power, composition, loops, and so on. These are implemented with proportional integral (PI) con-trollers that are available in DCS operating software. In some instances, cascade or ratio control structures are used to
achieve operational objectives. Because PI control has been well studied and because most instrument technicians and process/control engineers are exposed to the theory and appli-cation, it would be logical to conclude that regulatory control is not usually a significant problem.
Continuous feedback control offers the potential for improved plant operation by maintaining selected variables close to their desired values. The PID control algorithm has been successfully used in process industries since the 1940s and remains the most commonly used algorithm today. This algorithm is used for single-loop systems, which have one controlled and one manipulated variable. Usually, many single-loop systems are implemented simultaneously in a process, and the performance of each control system can be affected by interaction with other loops. As such, one needs to rely on other technologies to deal with these nonlinearities, constraints, and interactions.
The Proportional Integral and Derivative Control AlgorithmThis algorithm is based on measuring the error between the controlled variable, CV(t), and the set point, SP(t). Based on this difference, we can calculate the manipulated variable, M(t), setting to correct for the error (Marlin 2014). The error, E(t), is defined in the following equation:
t t tE SP CV= −^ ^ ^h h h6 @ (EQ 1)
Proportional ModeThe first mode to take the control action (i.e., the adjustment to the manipulated variable) is proportional to the error signal because as the error increases, the adjustment to the manipu-lated variable should increase. As such, MV(t) = KC E(t) + IP. This is a very simple way to calculate the moves of a valve, for example, to control the flow rate of the liquid in a pipe to maintain the flow at a desired value. KC is the proportional controller gain, which will need to be estimated to tailor the controller to the desired level. The controller gain has engi-neering units of (manipulated variable)/(controlled variable). IP is a constant or bias that is used during the initialization of the algorithm.
Integral ModeBecause the proportional mode does not eliminate the error (because it uses the error to move the output), the next mode should be persistent in adjusting the manipulated variable until the magnitude of the error is reduced to zero. These results are achieved by the following integral mode:
t tMVTI
KCE dt IT= +^ ^h h# (EQ 2)
The new adjustment parameter is termed the integral time, TI, which has units of time. IT is an initialization constant. The manipulated variable increases linearly with the slope of E(t) KC/TI. This behavior is different from that of the proportional mode, in which the value is constant over time for a constant error.
Derivative ModeIf the error is zero, both the proportional and integral modes give zero adjustment to the manipulated variable. This is a proper result if the controlled variable does not change; how-ever, when the disturbance just begins to affect the controlled
100300 ProcessControl.indd 356 5/7/18 6:47 PM
Diane
Highlight

Process Control and Operational Intelligence 357
Table 3 Process knowledge table for pairing control and manipulated variables
Manipulated Variables Controlled Variables
Crushing Product Finesse Circulating Load Power Draw Bin Level Crusher Level
Feed rate (±) (0) (–) (+) (+)
Fast Slow Slow Slow Fast
Closed-side setting (±) (–) (–) (–) (–)
Fast Slow Fast Slow Fast
Screen area (±) (–) (–) (–) (–)
Slow Slow Slow Slow Slow
Grinding Product Finesse Circulating Load Sump Level % Solids in Mills
Sump water addition rate (+) (+) (0) (±)
Fast Fast Fast Slow
Fresh feed solids rate (–) (+) (+) (+)
Slow Slow Slow Slow
Cyclone feed-pumping rate (±) (+) (–) (+)
Fast Fast Fast Fast
Feed water addition rate (±) (+) (+) (–)
Slow Slow Slow Fast
Number of hydrocyclones (±) (+) () (–)
Fast Fast Fast Slow
Mill speed (±) (±) (–) (–)
Fast Fast Slow Slow
Semiautogenous Grinding Mill Load Power Draw Product Size
Feed rate (+) (±) (0)
Slow Slow Slow
Water addition rate (±) (±) (±)
Fast Fast Slow
Mill speed (±) (±) (±)
Slow Fast Slow
Feed size coarse ratio (0) (±) (±)
Slow Fast Slow
Flotation Grade Recovery Froth Depth Air Holdup
Aeration rate (–) (+) (+) (+)
Fast Fast Fast Fast
Agitation rate (0+) (±) (+) (–)
Slow Slow Slow Slow
Pulp level (–) (+) (–) (–)
Slow Fast Fast Fast
Froth addition rate (–) (+) (+) (–)
Fast Fast Fast Fast
Collector addition rate (+) (0) (+)
Slow Slow Slow
Depressant (+) (–) (–)
Slow Slow Slow
Tailings opening gate (+) (–) (+)
Slow Slow Slow
Thickener Sludge Level Settling Rate Torque Underflow Viscosity
Pump speed (–) (–) (±)
Fast Fast Slow
Flocculant addition rate (–) (±) (+) (–)
Fast Slow Slow Fast
Rake position (+) (–) (0+)
Fast Fast Fast
Feed rate (+) (0+) (0+) (0+)
Fast Fast Fast Fast
Rake speed (0–) (+) (+)
Slow Fast Fast
Adapted from Herbst and Bascur 1984
100300 ProcessControl.indd 357 5/7/18 6:47 PM

358 SME Mineral Processing and Extractive Metallurgy Handbook
variable, the error and integral error are nearly zero, but a sub-stantial change in the manipulated variable would seem appro-priate because the rate of change of the controlled variable is large. This situation is addressed by the following derivative mode:
tt
MV KCTDdt
dEID= +^
^h
h (EQ 3)
The final adjustable parameter is the derivative time, TD, which has units of time, and the mode gain has an initializa-tion constant. The derivative mode provides rapid correction based on the rate of change of the controlled variable and can cause an undesirable high-frequency variation in the manipu-lated variable. Therefore, the PID control algorithm can be set as follows:
tE t
tt1
MV KCTI
E dt TDdt
dEI=
++ +^
^^
^h
hh
h; E# (EQ 4)
This is the ISA form, also known as the ideal form.Control tuning must be performed using the same algo-
rithm that is applied in the control system. The implementation should be done in a DCS or by using PLCs. This configu-ration will present several options depending on the type of hardware. The implementation of the control algorithm will require presenting the information to the operator and the set-tings available will depend on the overall control, strategy. There are many good strategies to tune the desired PID or PI controllers.
It is very important to understand the manipulated vari-able actuator. This actuator is usually mechanical in nature, so it will have what is known as hysteresis and backlash. This means that for a given value, it might operate physically dif-ferently than normal. A process identification of the actuator is recommended, and an adjustment should be made in the implementation using the control block of the DCS or PLC.
The dynamic behavior of both the controlled and manip-ulated variables must be understood to evaluate the perfor-mance of a feedback control system.
Regulatory strategies maintain key local operational vari-ables associated with the different process units in their set point values, compensating for the effects of high-frequency disturbances. In addition, they ensure safe start-up and shut-down, minimizing the risk of damage to people and equip-ment by keeping the variables within the known operational and safety limits. The regulatory control strategies act locally, and they are usually designed around PID controllers and set standardized control functions such as selectors, multipliers, time lead or lag functions, and so on. The proper maintenance of these strategies is fundamental for sustaining any advanced control strategy. These types of controllers include cascade controls in which a process flow rate controls the temperature of a process furnace. Here, rather than acting directly on a valve, the control design prefers to control the flow, which will control the opening and closing of the valve to regulate the temperature of the interior of the furnace. Usually, the pro-cess controls for overflow density and/or particle size controls in grinding circuits are driven by a cascade controller for the water flow controllers, which direct the opening and closing of the valves. It is easier to control the flow than the position of the valve (or that of a pump or belt conveyor). It is simpler to use a cascade controller to control the flow and let the underly-ing controller do the positioning of the manipulated variables to open or close the flow with whichever actuator is in use.
Regulatory controls require the tuning of the algorithm parameters. These are usually obtained from the process dynamics response using some suggestions provided by Ruel (2010a, 2010b). Many tuning strategies are available by per-forming an online Google search. Rice (2015) also wrote a PID tuning guide.
Multivariable Process Control StrategiesThe optimal operation of a mineral processing plant requires acting simultaneously over different control variables and tak-ing into account operational constraints. Thus, the objective of advanced control strategies is to keep the process operating at near-optimum conditions expressed by a proper objective function defined in a time horizon. The strategy calculates the set points of the controllers associated with the regula-tory strategies to optimize this objective function (Flintoff 1995, 2002; Flintoff et al. 2014; Sbarbaro and del Villar 2010; Ferrarini and Veber 2009).
A discrete mathematical model is used to predict the pro-cess responses and calculate over the time horizon the future control actions based on the available measurements and pre-dictions of the disturbances. According to model predictive control (MPC), only the first action is actually implemented, and the optimization process is repeated at the next sampling time. In these strategies, the dynamic process model is very important because it is used explicitly in the calculation of the control variables. Good mathematical models are necessary for the successful implementation of a model-based control strategy. The parameters of simple models can be obtained by performing a dynamic test during the process or by using open-loop historical data. As in regulatory strategies, it is very important to establish proper maintenance procedures to update the models and check the tuning of the different parameters associated with the control strategy. MPC models are obtained based on the process matrices shown in Table 3. There is a relationship between the controlled variables y(t) and the manipulated variables u(t).
Effective MPC depends on a model that is representative of the process dynamics. After several months, the process tends to differ enough from the model that performance dete-riorates. Determining a good model that matches the current process is a challenge that can be easily overcome by using current data analytics capabilities.
Holistic and Expert System Process ControlsIf the process models are difficult or impossible to obtain, then the control strategy can rely on the knowledge of an operator or an expert in the field to calculate the control variables. This knowledge is expressed in terms of rules describing the experiences of the operator. These heuristics are written in statements with an if–then form. A set of rules constitutes the knowledge base required to control a given system. Because the expert knowledge is expressed in lin-guistic terms, a suitable framework to describe the ambigu-ity of the natural language is provided by fuzzy logic. Even though these strategies can deal with complex control prob-lems, they cannot be easily extended to multivariable systems with many inputs and outputs. In addition, because they do not use detailed information about the evolution of the pro-cess and/or disturbances, their performance is no better than the one obtained by model-based strategies.
The decision to use a model-based approach or a rule-based approach depends on models. If the process and
100300 ProcessControl.indd 358 5/7/18 6:47 PM
Diane
Rectangle
Diane
Highlight
Diane
Highlight

Process Control and Operational Intelligence 359
disturbances can be modeled, the controller will be developed to handle constraints, combat disturbances, and react accord-ingly to expected performance. If the process cannot be mod-eled, can the operator be modeled? If so, a rule-based approach can be used and the controller will mimic the best operator.
Instead of using process models, these types of controls use process rules based on heuristics and fuzzy logic controls. In rule-based approaches, an expert operator manipulates set points on control loops. A fuzzy control system is a control system based on fuzzy logic; decisions are made using analog inputs that represent a value ranging from 0 (false) to 1 (true). The logic deals with partially true and partially false values. In many projects, the result will be a combination of model- and rule-based systems.
Time-Derived VariablesTime-derived variables are used in operator mimic controls and in fault diagnosis procedures. Object-oriented expert sys-tems are discussed later. Using an industrial data infrastruc-ture that provides the analytics and the data-derived process algorithms allows for a smoother implementation of dynamic process analytics, and it is easier to maintain the analytics in the long term. This also allows for the classification of data to implement model-based inferential controls. Table 4 lists several time-derived variables and observed variables that are used to develop process specifications and detect abnormal situations (Bascur 1990a, 1999). Many algorithms are avail-able to filter the process signal to eliminate noise and to infer additional information from the raw data (Otnes and Enochson 1978; Bascur 1988).
Example for MPC Strategy Implementation of SAG and Ball MillsFigure 6 shows a typical SAG and ball mill control strategy (Henriquez et al. 2012).
Process Control ObjectivesThe objectives of process control are to maximize throughput, decrease variability of the product size and % solids to flota-tion, improve overall equipment availability, and reduce spe-cific power consumption. The implementation of the control strategies consists of three steps:
1. The first step focuses on the standardization of the pro-cess measurements and process knowledge through
characterization of the disturbances and the manipulated and controlled variables.
2. The second step focuses on the reduction in process vari-ability by properly selecting the manipulated variables and providing extensive operator support to test and tune the system.
3. The third step consists of process optimization by collect-ing stable metallurgical results, managing process flow, and maximizing throughput while optimizing particle size (P80).The main characteristics of process control are as follows:
• Particle size control is based on the main hydrocyclone pressure. Solids concentration control maintains the pump box to prevent overflowing or pump cavitation.
• Fine hydrocyclone pressure control is obtained by manip-ulating the pump speed; coarse pressure control is regu-lated by the available number of hydrocyclones. Thus, depending on the incoming feed flow, more or fewer open hydrocyclones will be required to maintain the same working pressure.
• Solids concentration control (% solids) is obtained by manipulating dilution water to the pump box.
• It has intelligent hydrocyclone rotation control and moni-tors the running hours for each hydrocyclone (for mainte-nance purposes). The system also tries to keep at least one hydrocyclone available.
• The operator sets the desired working pressure and den-sity. The proper selection of both parameters and stable control (provided by the MPC) will result in an optimal working P80.
• In the case of two running hydrocyclone batteries, the number of open hydrocyclones in each battery is equal-ized (to balance throughput).
• The control strategy uses a combination of MPC and expert logic for adapting to the changing conditions of the feed flow and the available hydrocyclones.In the case of the P80 variability from the data feed of
the rougher flotation line, Figure 7 shows the improvement results for circuit 8 with the use of the MPC systems for two consecutive periods (69 days each). Despite the increase in the mean value from 195 μm to 217 μm, the variance decreased by 54%. The plant tonnage operating range is 145,000 to 200,000 t/d, the hydrocyclone pressure is more than 68.9 kPa,
Table 4 Time-derived variables used in digital control systems and real-time information systems
Measured Variables Snapshot Moving Average (time) Rate of Change (time) 1-Hour Average1-Hour Standard
Deviation
Temperature High High High rate Medium Maximum
Flow 1 Normal — — — —
Level — — — — —
Flow 2 Normal — — — —
Flow 3 Normal — — — —
Press 1 — High High rate High Maximum
Press 2 — High — High Maximum
Additional Information
Weather: Rainy/sunny/cloudyUnit location: Geographical coordinates
Unit age: Old/middle/new/unknownNumber of cells in series: Few/many/very many
Source: Bascur 1990b
100300 ProcessControl.indd 359 5/7/18 6:47 PM
Diane
Highlight

360 SME Mineral Processing and Extractive Metallurgy Handbook
the hydrocyclone feed % solids is more than 50%, and the sump box level is more than 70%.
In conclusion, the MPC system reduces variability in pres-sure and % solids in the hydrocyclone batteries. The reduced variability allows for reduced variability in the P80 to flota-tion and thus leads to a better metallurgical performance. The reduced P80 variability enables the reduction of pulp trans-portation flow variability, therefore improving the dewatering
process. Reducing the variability is the main control objective of the MPC implementation. This MPC enables the operation to approach the operating constraints to optimize the process.
Additional comminution circuit process control strate-gies are discussed by Bascur (1990b, 1991b) for traditional grinding mills and by Edwards et al. (2002), Karageorgos et al. (2001, 2006), Fuenzalida and Olivares (2012), Baas
OptimizingAlgorithm
Cyclones Rotation ControlCheck cyclones availability and running hours
AIT
AIT
PIT
FIC
FIC
LIT
TargetP80
P80
Water
Water
Density control to cyclonesmanipulates water addition
Pressure Controlmanipulates pumpspeed and number
of cyclones
Variable Feed
AIT = Analytical Instrument TransmitterFIC = Flow Instrument ControllerLIT = Level Instrument TransmitterPIT = Pressure Instrument Transmitter
Source: Henriquez et al. 2012
Figure 6 Example of SAG/ball mill multivariable process controller at Minera Los Pelambres in Chile
ML—8—Analysis on Consecutive Periods of Time
Hydrocyclone Pressure
■ Same average value■ 47% less variability with MPC system ON
Hydrocyclone Feed Solid Percentage
■ Same average value■ 44% less variability with MPC system ON
After Reaching P8O
■ 11% Increase on average value (197 to 217 μm)■ 54% less variability with MPC system ON
LCL = Lower Control LimitUCL = Upper Control Limit
Source: Henriquez et al. 2012
Figure 7 Ball mill hydrocyclone pressure, % solids, and product size P80 results before and after MPC implementation
100300 ProcessControl.indd 360 5/7/18 6:47 PM
Diane
Highlight

Process Control and Operational Intelligence 361
et al. (2014), and Ruel (2012) for SAG and ball mill grinding circuits.
Example of a Copper Flotation Rougher and Scavenger MPC ImplementationThe flotation process is a complex physicochemical process (Fuerstenau 1999). Table 5 lists the many operational variables that influence the flotation of minerals. The detailed dynamic process shows that it is a zero-order process that is controlled by the interface between the froth and the pulp (Bascur 2005). A zero-order process is unstable by nature. A flotation model is a dynamic process where the froth interface is always in a dynamic state, receiving bubbles with attached particles and draining them back to the pulp hydrophilic particles. A flux model defines the hydraulics of a flotation system. As such, maintaining a proper interface and froth height is crucial for the cleaning action in a flotation cell. The attachment and detachment of particles in the pulp zone are attributed to the physicochemical characteristics of the minerals and the turbu-lence in this zone to achieve bubble generation and the bub-ble–particle attachment (Bascur 2010, 2012).
The most important control variables for the flotation process are categorized for process control and optimization as disturbances, measured variables, manipulated (physical and chemical) variables, and controlled variables, as shown in Table 5.
The flotation process is highly multivariable, which means that there are strong couplings between the various control variables and the important stages of the process. The choices depend on the particular design and application of the flotation system and the materials to be separated.
Controlling an entire flotation circuit correctly is still one of the most difficult process control problems in a processing
plant. Figure 8 shows a typical flotation circuit, including the rougher section, the scavenger circuit, and the concentrate cleaner circuit.
It is difficult to control a flotation circuit because the majority of the measurements that are required for control rely on various analyzers and instruments that require regu-lar maintenance and calibration checks. Sometimes the regu-lar maintenance checks or required calibration checks are forgotten or delayed in a maintenance schedule, resulting in these measurements becoming unreliable. When they become consistently unreliable, the control system cannot operate correctly, and the control room operators then tend to run in manual mode.
Even though correct flotation control is one of the most difficult control problems in a processing plant, if each required flotation control function is broken down into man-ageable “bite size” control strategies, it is possible over time to develop a robust flotation process control system that high-lights the required critical measurements as each part of the flotation control strategy is implemented. By implementing such a control system over time and breaking the system down into various sections, the value to the business of each of these parts can be demonstrated and thus justified. With this, the cost of the aforementioned required maintenance and calibra-tion checks can then be justified to management and scheduled as part of a routine preventive maintenance plan.
The control functions that are required to develop a good robust flotation control strategy can be divided into three parts:
1. Interface-level stabilization control for each flotation section,
2. Rougher and scavenger mass pull with grade/recovery control as limits, and
3. Cleaner and recleaner grade/recovery control.The first two control functions are relatively easy to design and commission; however, designing and implementing the third function of cleaner and recleaner grade/recovery con-trol is more complicated. Baas et al. (2007) describe good, robust grade/recovery control as the “holy grail” of flotation control. Figure 9 shows a schematic of how the first two levels of flotation control are broken down into manageable bite-size functions.
Grade/recovery control is so complex because the recov-ery of some minerals, especially those that are finely liberated, can be affected by factors such as surface and pulp chemistry changes. To date, there have been very few methods of suc-cessfully measuring the required pulp chemistry parameters. (Some companies can successfully measure the pulp chemis-try; however, these companies are in the minority.)
Even when some of these chemistry parameters are suc-cessfully measured online, attempting to control these has proven to be difficult because the effect of changing the pulp chemistry does not lead to consistent changes to the grade/recovery in the cleaner and recleaner circuit.
In recent years, new instruments and analyzers have been developed that can help accurately measure some of the parameters in a flotation cell; previous methods were either unavailable or only somewhat reliable. These parameters include the actual particle size of the fine fractions, the verti-cal and horizontal bubble velocity in the froth zone, the froth depth and froth density, the pulp depth and pulp density, and the chemistry of the pulp zone. As these new instruments are introduced and tested, flotation control will likely become a
Table 5 Variables of importance for a flotation process
Disturbance Variables Measured Variables
Mineralogical composition
Degree of surface oxidation
Fluctuating feed size distribution
Surface modifications
Fluctuating feed rate
Fluctuating feed composition
Pulp viscosity and density
Water characteristics
Metal analysis
Volumetric flow rate
Pulp densities
Size distribution
Pulp level
Froth level
Eh and pH
Collector addition
Frother addition
Power intensity
Manipulated Variables
Physical Chemical
Air flow rate
Pulp level
Impeller speed
Conditioning time
Stream diversion
Froth sprinkling rate
Coarse/fine split
Frother addition rateCollector addition rateModifier addition rate (activation, pH, etc.)Reagent addition pointsElectrochemical potential
Controlled Variables
RecoveryGradeTonnage throughputCirculating loads
Feed % solidsPulp levelFeed size distribution
100300 ProcessControl.indd 361 5/7/18 6:47 PM

362 SME Mineral Processing and Extractive Metallurgy Handbook
less complex and difficult process. Processing plants take the regular maintenance of these new analyzers and instruments quite seriously.
There have also been advances in froth video analysis in the control of flotation circuits. An additional sensor can pro-vide more information in order for the plant to manage the cleaning action of the froth and to stabilize the flotation mass balance of the flotation banks. Kewe et al. (2014) incorporated froth visualization analysis to improve flotation circuits using a combination of froth visualization and a professional control system.
For additional information, refer to the studies by Johansson et al. (1999), Herbst and Pate (1999), Herbst and Harris (2007), and Baas et al. (2014).
Example of Thickener Multivariable Process ControlDeveloping thickener control is similar to the Cinderella story (Karageorgos et al. 2009; Weidenbach and Lombardi 2012). To date, the majority of the process control applications on a mineral processing site have predominantly focused on SAG mill control, general grinding circuit control, and various aspects of flotation control. Unfortunately, control of thick-eners and countercurrent decantation (CCD) circuits is only performed well by a small number of companies worldwide. Thickeners are zero-order processes, which are unstable by nature. The generation of an interface is modeled using a flux curve (Concha 2014). Bascur and Herbst (1986) implemented an industrial variation of an online model to obtain additional information for the thickener inventory, the interface level, and the torque of the rake. This online model was very use-ful in identifying the many variables that affect the thickening operation. The most important factors are the large variations of the mineral specific gravity and the amount of clay in the
feed, which affect the overall behavior of the thickener under-flow density and rheology. However, in this model, the addi-tion of flocculant was not capable of aggregating the particles to control their settling rate. In addition, changes to the feed well design were necessary. An inventory prediction was used to modify the scheduling of the plant, which was constrained by the capacity of the pipeline due to the large variations in the underflow product.
Those who have the opportunity to begin the process of controlling a thickener or a CCD circuit will go through sev-eral stages. At first, the initial perception may be that control-ling a thickener is easy, but this perception soon ends with the realization that obtaining good thickener control is more dif-ficult than SAG mill or grinding circuit control and even some parts of flotation control. Once one begins to develop and implement thickener control, the process may be considered to be refreshing and exciting. Because there has been very little published in textbooks or studies on thickener control, it can be exciting to work with innovative technology. New concepts have to be defined, developed, and implemented to improve good thickener control and eventually create excep-tional thickener control.
As with controlling any unit process, the first step is to define the outcome that is required and how this will benefit the processing plant. Improving the control on a thickener is initially performed to improve the amount of process water that can be recovered; another important benefit is the ability to treat a higher throughput than what was previously achiev-able without good control. A reduction in flocculant of approx-imately 20% to 30% can also be achieved, which is important, as this is a consumable.
The objective of thickener control is to improve the amount of water that can be recovered; this then translates to
Grinding Circuit
Copper Rougher Pyrite Rougher
TailingsThickener
Copper CleanerScavengers
CopperCleaners
Copper Recleaners
Final CopperConcentrate Tank
Copper Concentrate
Flash Flotation
Metal Stream AnalyzerSample Point
StillingBox
Figure 8 Typical copper flotation circuit
100300 ProcessControl.indd 362 5/7/18 6:47 PM

Process Control and Operational Intelligence 363
improving the underflow density. Therefore, it would follow that underflow density control should form a major part of the thickener control strategy; however, a paradigm shift must be realized.
As a general rule, it is not possible to directly control the density of any given thickener, and any thickener control strategy that mainly relies on thickener underflow density will inevitably fail or operate poorly.
To design and implement a robust control strategy for a thickener, three main objectives must be achieved:
1. Correct inventory control (it is important to measure the inventory correctly in a thickener)
2. Particle settling control3. Thickener protection control
The underflow controller monitors the mud level (the true compacted bed level), the rake torque, the bed pressure, and the underflow density. It calculates the optimum underflow flow rate (manipulated variable) to achieve the best underflow density (controlled variable subject to the other constraint variables) while safely maintaining the thickener.
A key sensor was developed to measure the density pro-file of a thickener called SmartDiver. The SmartDiver is an instrument patented and made by Precious Light and Air. The SmartDiver uses an ultrasonic probe to measure the clarity of the liquid. The probe is lowered and retracted by a cable drum into the thickener approximately every 5 minutes, depending on the rake position (Weidenbach and Lombardi 2012).
The flocculant controller examines the settling band (con-trolled variable) within the thickener, the thickener overflow clarity, and the rake torque. It calculates the optimum floccu-lent rate (manipulated variable) to achieve the required parti-cle solids settling rate (controlled variable subject to the other constraint variables) just above the compacted bed.
The three aforementioned thickener control strategy requirements do not address underflow density control (Hartog et al. 2014; Weidenbach and Lombardi 2012). Figure 10 shows a process graphic for the implementation of a multivariable thickener control strategy using the Manta Cube system. This multivariable control strategy has improved the stability of the underflow density by 70%, reduced the risk of bogging the tailing thickener, reduced the reliance on the water supply, and improved water recovery rates.
Once one has realized the paradigm shift, it becomes clear that improving the underflow density simply depends on correctly controlling the thickener. That is, once the inventory is controlled correctly, the particle settling is controlled cor-rectly, and the thickener protection control is implemented, the thickener will operate in a more stable and reliable man-ner. The suggested control hierarchy allows the particles to settle and compact correctly, which all translates to improved underflow density control. The thickener can then safely pro-cess a higher throughput than would be possible without the aforementioned control strategy in place.
Additional thickener controls are described by Schoenbrunn et al. (2002). The authors use an expert system
Level 1 Control Strategy—Final Control and Measurement Elements
Cell Flow Coordination Cell Stabilization
Cell Coordination BalanceSurface
ChemistryPulp
Chemistry
Section Balancing Grade Recovery
Copper Recovery Copper Grade
Level 2 Control Strategy—Regulatory Control B
Level 3 Control Strategy—Regulatory Control A
Level 4 Control Strategy—Optimization and Constraint Control
pH, ORP*Collectors, Depressants,
ActivatorHopper Pump
Flow RateFroth or Bubble
VelocityAir Injection Flow Rate
Froth DepthGrinding Circuit
ThroughputConcentrate and
Tails Grade
*Oxidation–Reduction Potential
Source: Baas et al. 2007, reprinted with permission from the Australasian Institute of Mining and Metallurgy
Figure 9 Flotation hierarchy of control for interface-level stabilization and mass pull with grade/recovery control for the rougher and scavenger circuit
100300 ProcessControl.indd 363 5/7/18 6:47 PM
Diane
Line

364 SME Mineral Processing and Extractive Metallurgy Handbook
Sum
p D
isch
arg
e Slu
rry
34
10
PPS
05
3
Sum
p D
isch
arg
e Slu
rry
34
10
PPS
05
4
Sum
p D
isch
arg
e Slu
rry
34
10
PPS
05
5
Sum
p D
isch
arg
e Slu
rry
38
11
PPS
06
7
Sum
p D
isch
arg
e Slu
rry
34
20
PPS
11
5
Sum
p D
isch
arg
e Slu
rry
34
10
PPS
10
5
Sum
p D
isch
arg
e Slu
rry
3`1
0 P
PS 0
70
49.6
m3/h
50.0
m3/h
Pr
oce
ss W
ate
r
Flocc
ulant
3720 P
PD 1
87/188
Proce
ss S
lurr
yO
SA
0.0
pH
0.5
pH
Proce
ss W
ate
r
Tails
Sam
ple
Filt
er
Inst
rum
ent
Air
100%
3610 P
PC 1
02
0.2
3 g
/L
2.0
1 m
2.0
5 m
2.1
9 m
0.1
6 m
Cla
rity
2.5
g/L
l/F
Leve
l
19.5
g/L
l/F
Leve
l
Hea
vy M
ud L
evel
Set
tling
Band
Proce
ss W
ate
r
Proce
ss W
ate
r
0.2
3 g
/L
Bed
Lev
el
0.0
m3/h
77.0
m3/h
Proce
ss W
ate
r
0.0
m3/h
77.0
m3/h
Proce
ss W
ate
r
–0.1
m3/h
0.0
m3/h
Proce
ss W
ate
r
3610 H
PR 0
38
Gla
nd S
eal
Wate
r
Proce
ss W
ate
r
118.4
kPa
120.0
kPa
58.9
Bed
Pre
ssur
e
62.5
8 %
1.8
2 T
/m
3
1.9
0 T
/m
3
Den
sity
Proce
ss S
lurr
y3610 H
PR 0
38
62.5
5 %
1.8
2 T
/m
3
1.9
0 T
/m
3
Den
sity
Proce
ss S
lurr
y3610 H
PR 0
38
Proce
ss S
lurr
y3610 H
PR 0
38
0 %
0 %
0 %
Des
alin
ate
d W
ate
r
Inst
rum
ent A
ir
Flo-d
ose
Uni
t
221.9
m3/h
30.0
m3/h
Drive
Torq
ue
42.0
N/m
Rake
Hei
ght
3.5
%
Rake
Direc
tion
Forw
ard
Proce
ss W
ate
r
Proce
ss S
lurr
yFl
oat Ta
ils P
ump
HPR
= H
ydra
ulic
Pum
p R
egul
atin
gO
SA
= O
nlin
e Strea
m A
naly
zer
PPC
= P
ress
ure
Pum
pPP
D =
Per
ista
ltic
Pum
p D
ispen
sing
PPS =
Pre
cisi
on
Pum
p S
yste
m
Sour
ce: W
eiden
bach
and
Lom
bard
i 2012,
reprint
ed w
ith p
erm
issi
on
from
the
Aus
trala
sian
Inst
itute
of M
inin
g a
nd M
etallu
rgy
Fig
ure
10
Thic
kener
mul
tiva
ria
ble
contr
ol
stra
teg
y hum
an i
nte
rfa
ce
100300 ProcessControl.indd 364 5/7/18 6:47 PM
Diane
Highlight
Diane
Highlight
Diane
Highlight
Diane
Highlight
Diane
Highlight
Diane
Highlight
Diane
Oval
Diane
Oval
Diane
Highlight

Process Control and Operational Intelligence 365
strategy and present a good overview of the process instrumen-tation and the rules to consider to meet the control objectives.
Example of a Gold Cyanide Leach Multivariable ControllerFigure 11 shows a graphical interface that illustrates the implementation of a multivariable control strategy for gold cyanide leaching as reported by Hartog et al. (2014). The leach circuit consists of two leach tanks (TA-111 and TA-112) and seven absorption tanks. The slurry is fed to the leach feed thickener, and after leaching the slurry flows to the tailings thickener. The cyanide leach is supplied to the leach circuit by two variable-speed pumps in a standby configuration (manip-ulated variable). The barren eluate from the elution circuit is returned as a batch to the first leach tank.
Originally, the cyanide in the solution was measured in the first leach tank by a Cyantific cyanide analyzer. The cya-nide concentration was originally manually controlled by the control room operator. The operator would manually adjust the cyanide flow rate into Tank TA-111 depending on the cya-nide concentration in Tank TA-111.
In 2012, a process control strategy configured an auto-matic cyanide concentration sample-and-hold controller that automatically determined the required cyanide solution flow rate depending on the cyanide concentration in Tank TA-111. This flow controller adjusted the speed of the standby cya-nide pump to maintain the desired cyanide flow rate set point. The control system was configured so that the cyanide flow rate was stopped when the measured cyanide concentration reached a certain limit.
The cyanide set point for the first leach tank would be set with the aim of achieving a desired cyanide profile across the adsorption tanks. When the measured cyanide concentration showed large-amplitude cycles, the sample-and-hold control-ler were retuned to achieve better control.
Improved process control in the cyanide leach circuit involved both equipment and control strategy changes. With the Cyantist cyanide analyzer and the associated sampling system at the end of its maintainable life, the analyzer was replaced by a Cynoprobe cyanide analyzer (sensor and con-trolled variable). This new cyanide analyzer was configured to draw samples from the first leach tank, the second leach tank, and the final adsorption tank. To expand the flexibility of the cyanide dosing, new cyanide dosage points were added to the second leach tank and the fourth adsorption tank that consisted of a flowmeter and flow control valve.
A cyanide leach multivariable controller called Manta Cube was configured to determine the cyanide solution flow set point for the first and second leach tanks and the cyanide set point for the second leach tank based on the cyanide measure-ments from the cyanide analyzer. The multivariable control strategy for the cyanide leach may be configured for cyanide dosing to the first leach tank only, split cyanide dosing to the first and second leach tanks, or control of the cyanide level in the leach circuit tail. The multivariable controller leach system for cyanide addition was commissioned in conjunction with a new free cyanide analyzer. The cyanide multivariable control-ler was installed to ensure that maximum gold recovery was obtained in the leach circuit while cyanide use was minimized.
Following the commissioning period, a significant reduc-tion in the variation of the free cyanide measurement was observed. As a result of this decreased variation, the free
cyanide set point could be reduced, as there was confidence that the system would maintain free cyanide levels at or above those required for effective leaching. The free cyanide set point was reduced from 600 ppm in December 2012 to cur-rent levels of 450 ppm. Following the commissioning of this system, a clear reduction in cyanide consumption of 0.18 kg/t (>10%) was observed. This was due to both the reduced free cyanide set point and the reduced process variable variation, resulting in less cyanide waste.
The net present value for the reduction in cyanide con-sumption is calculated using a 5% discount rate for the current 5-year mine life based on the data and assumptions. The net present value is calculated to be approximately $1.9 million for the $150,000 capital project, with a payback period of only 106 days.
The work by Bascur et al. (2008) and Steyn et al. (2018) provides additional details about hydrometallurgical process plants.
Pyrometallurgy: Implementation Example of an Integrated Furnace Electric Arc Control for FerronickelThe efficient operation of a shielded-arc smelting furnace requires good control of the power and feed delivered to the furnace to maintain the arc cover and the slag bath temperature.
The electric power input to the furnace has two compo-nents: arc power and bath power. Figure 12 from Voermann et al. (2004) shows the arc power labeled as Pa. This is power delivered to the furnace by the long, powerful arc between the electrode tip and the surface of the slag bath. The slag bath has an average height (ys), as shown in Figure 12. The charge material covers the electrode tip, and the arc power heats the charge. The bath power is labeled Pb. This is power delivered to the slag batch by the resistance or Joule heating caused by the electrode current flowing through the slag level.
The furnace power controller is part of the integrated con-trol system that regulates the power delivery to the furnace. The furnace power controller controls not only the total power delivered to the furnace but also the power balance between electrodes and the ratio of the arc to bath power (Pa/Pb). The ratio of the arc to bath power is a critical control parameter: Too little slag bath power will make the slag colder and more viscous, making it more difficult to cleanly separate the matte or metal and also difficult to tap. Too much slag bath power will increase heat transfer from the furnace walls due to increased slag temperature and more vigorous stirring. This increased heat flux results in increased refractory wear and excessive furnace losses, according to Janzen et al. (2004).
The furnace feed material—or calcine—is supplied from a rotary kiln and stored above the furnace in the feed bins. The hot calcine in the feed bins is metered into the furnace through feed ports in the roof of the furnace, as shown in Figure 12.
The heat in the furnace crucible is shown in Figure 12 as the bottom heat losses (Qbottom) and sidewall losses from the metal and slag levels (Qmetalsidewall and Qsidewall, respec-tively). The tapped slag (msarc + msbank at Tsbulk) and the tapped material (mmarc + mmbank at Tm) also lose heat. The slag and metal accumulation in the furnace are represented by the slag height (ys) and the metal height (ym), respectively, in Figure 12.
The furnace incorporates a significant number of instru-ments to provide a great deal of information about the process. Some of the instruments on the furnace are
100300 ProcessControl.indd 365 5/7/18 6:47 PM
Diane
Highlight
Diane
Highlight
Diane
Highlight

366 SME Mineral Processing and Extractive Metallurgy Handbook
TA-1
11 C
yani
de
Additi
on
TA-1
12 C
yani
de
Additi
on
Barr
en E
luate
pH
Lim
e A
dditi
on
TA-1
12 C
yani
de
Leve
l
Oxy
gen
Flo
w
PU-2
7
PU-2
8
Oxy
gen
Regen
erate
d
Carb
on
Loaded
Carb
on
TA-1
11
TA-1
12
From
PS-5
6
From
PS-5
7
PS-9
1
Proce
ss W
ate
r
Tails
Thic
kene
r
PS-4
0
Lead
Flota
tion
Feed
Hopper
SC
-14
PS-3
6TA
-46
TA-4
5
TA-4
4
TA-4
3
TA-4
2
AG
-14
AG
-15
AG
-16
AG
-17
AG
-18
pH
Lim
eA
dditi
on
Carb
on-
in-Lea
ch T
ails
Cya
nide
Leve
l
PS-6
0
SC
-12
Cya
nide
Flow
1.2
1 k
g/t
Cya
nide
Usa
ge
7.6
lt/m
in
61
.8 m
3/h
315.2
ppm
250.0
ppm
AG
-59 A
mps
60
.0 A
mps
32.3
Am
ps
19.7
Am
ps
26.7
Am
ps
19.7
Am
ps
5.8
20.9
Am
ps
0.0
20
7.5
ppm
150.0
ppm0
.0 A
mps
0.0
%
1.0
Am
ps
54.7
%
1.0 0,8
6.5
6.6
TA111
Cya
nide
Leve
l
41
2.5
ppm
42
0.0
ppm
AG
-59 A
mps
66.0
Am
ps
TA-1
13
53.0
50.0
PS-4
0Spee
d C
ont
rol
25.6
0
72.5
%
0.0
Am
ps
10.5
10.5
AG
= A
gita
tor
PS =
Pre
gna
nt S
olu
tion
PS =
Pum
p S
pee
d C
ont
rol
PU =
Pum
pSC
= S
cree
nTA
= T
ank
Sour
ce: H
artog e
t al.
2014,
reprint
ed w
ith p
erm
issi
on
from
the
Aus
trala
sian
Inst
itute
of M
inin
g a
nd M
etallu
rgy
Fig
ure
11
Gold
cya
nid
e le
ach
op
era
tion m
ultiva
ria
ble
contr
ol d
iag
ram
100300 ProcessControl.indd 366 5/7/18 6:47 PM
Diane
Highlight
Diane
Highlight
Diane
Highlight
Diane
Highlight
Diane
Highlight

Process Control and Operational Intelligence 367
• Power consumption meters,• Electrode slip meters,• Load cells on the feed bins,• Water temperature thermocouple at the entrance and exit
of each water-cooled element,• Water flowmeters at the entrance and exit of each water
flow circuit,• Two level refractory thermocouples,• Furnace pressure monitor,• Furnace temperature thermocouples,• Air flowmeters, and• Air thermocouples.
For maximum production and efficiency, coordinated control software architecture is needed.
The integrated furnace control system for the furnace includes five main modules or controllers:
1. Power controller: The power controller provides operat-ing points tailored to the measured slag batch resistance.
2. Feed controller: Feeding is based on the actual amount of material charged (using bins on load cells) and the actual power delivered to the furnace.
3. Online heat balance module: This continuously moni-tors surface temperatures, water flow, and temperature increases to calculate energy losses and adjust the power and feed balance accordingly.
4. Slipping control: A slip is recommended for each elec-trode based on actual conditions (power, current, limit switches).
5. Supervisory controller: The supervisory controller coordinates the work of other controllers.
These modules are described in detail in the study by Janzen et al. (2004).
The furnace power controller controls the total power delivered to the furnace to
• Control slag bath power to maintain target metal and slag temperatures and acceptable sidewall heat flux,
• Provide stable long-arc operation to enable high furnace power production without excessive sidewall heat flux, and
• Reduce the occurrence and duration of loss of arc.
The power controller is used to control the power delivered to the furnace, including balancing the power delivered by the three electrodes and controlling the ratio of arc to bath power (Pa/Pb).
The feed control system distributes the charge to maintain a covered-arc operation, which is vital to a stable, reliable, and efficient operation.
The online heat balance (OHB) module tracks the energy losses from the furnace and estimates the metal accumulation in the furnace. The OHB module also collects sensor data to establish and track the furnace net specific energy use in terms of kilowatt-hours per ton (kW·h/t). Heat from air infiltration and electrode consumption are also accounted for.
The furnace supervisory control module provides overall control of the furnace and governs the interaction between the various modules of the furnace control system. The furnace
Furnace
Center
Smelting Gas (Vg at Tc)
Arc Power
(Pa)
Arc Slag and Metal
at Slag Freezing Point
(msarc, mmarc)
Slag
Height
(ys)
Metal
Height Above
Taphole
(ym)Metal Taphole Level
Slag and Metal
from Charge Bank
at Slag Freezing Point
(msbank, mmbank)
Integrated Heat Transfer
from Slag to Calcine
(Qcalcine)
Bulk Circulation of Slagout Toward Sidewall
(ms)
Metal Fall
(mmarc + mmbank)
TswallIntegrated Heat Transfer
from Slag to Metal(Qmetal)
Sidewall Losses from Slag(Qsidewall)
Sidewall Losses from Metal(Qmetalsidewall)Constant Metal Tapping Temp (Tm)
Bottom Heat losses (Qbottom)
Tapped Slag(msarc+msbank at Tsbulk)
Tapped Metal(mmarc+mmbank at Tm)
Electrodes Heat Transfer
Mass Flow
Charge Bank
(Tc)rwall
Tsmax
Bath
Power
(Pb)
re
Source: Voermann et al. 2004, reprinted with permission from the Southern African Institute of Mining and Metallurgy
Figure 12 Ferronickel furnace diagram
100300 ProcessControl.indd 367 5/7/18 6:47 PM
Diane
Highlight

368 SME Mineral Processing and Extractive Metallurgy Handbook
supervisory controller integrates and coordinates the feed con-troller, the furnace power controller, and the online furnace heat balance. The feed rate and net specific energy require-ment (kW·h/t) are used to determine the power set point.
The automatic electrode positioning and feeding used on the furnace provide stable operation at the design power of 75 MW. The integrated control system provides the operators with both control and process control information for optimiz-ing the overall metal production. It enables the operator to increase the power with minimum excursions and upsets.
Another advanced control module is used in plants where there are several furnaces on the same high-voltage bus. This module balances the total power draw of a group of furnaces. For example, if an electrode on one of the furnaces strikes a limit switch and as a result unbalances the furnace power draw, the individual electrode set points on the other furnaces on the grid are temporarily altered to balance the total draw of all the furnaces (Voermann et al. 2004).
In a smelting furnace, the ratio of arc to slag bath power is one of the key parameters. If the power delivered to the slag bath is too high, the slag bath temperature and stirring will increase, resulting in increased refractory wear. If it is too low, the metal and possibly the slag will be too cold and difficult to tap. Hatch has developed a system to provide an online esti-mate of slag bath resistance; this system has been installed on several smelting furnaces.
For nonferrous metals, additional information can be found in the study by Boulet et al. (1997). Tan and Vix (2005) also report advances in controlling the magnetite formation in copper converting.
Maintenance of the Instrumentation and Process Control SystemsMineral processing and extractive metallurgy process control and instrumentation present unique challenges in the main-tenance of process measurements and control devices. The typical harsh environment and difficult process conditions require special consideration of the ruggedness, reliability, and maintainability of these devices. Most advanced control strategies fail due to lack of maintenance, being in the wrong location, and incorrect calibration of the sensors and instru-ments. Sienkiewicz (2002) provides some guidelines:
• The controls should be regarded as another part of the process and must be used and maintained.
• Annual maintenance and support should be established in the initial plans and likely reinforced to obtain the highest return on the capital and intellectual investment.
• A maintenance program should be designed and imple-mented that will allow for preventive maintenance of the systems, instruments, controls, and operator interface. A program for change management should be put in place to keep up with expansions and modifications.
• Treat sensors and field devices as critical plant assets if good control usability and performance are to be achieved. Planned maintenance causes the production availability of particular equipment to decrease to approximately 90%–95%. Unplanned downtime may reduce equipment availability by another 5% or more. Low availability and unplanned downtime translate into lost production opportunities that can represent a significant portion of revenues and profits. In fact, unplanned downtime is one of the largest factors that erode production performance.
Combining the maintenance of the instrumentation and process controls into a condition-based maintenance pro-gram is recommended.
The following section provides additional information on enhancing the traditional maintenance and tuning of the process control algorithm by instituting regular maintenance and performance monitoring of all instruments, actuators, and control algorithms. A change management policy and updates of these vital procedures should go hand in hand with the Occupational Safety and Health Administration (OSHA) 29 CFR 1910 (OSHA 2017) and Process Safety Management guidelines.
PLANT OPERATIONAL INTELLIGENCE MANAGEMENTToday, operational efficiencies (such as improved equipment availability and use, increased tonnages, and reduced dilu-tion) are necessary to increase production and lower operating costs in mining, mineral, and metallurgical processing plants. In addition, continuous improvements, innovation, and under-standing where opportunities exist are the key to increasing profits. This is where measuring, managing, and maximizing mineral/metallurgical performance is enabled by using an industrial data infrastructure. Transforming the sensor data into performance metrics becomes a reality. To do so, a data hierarchy strategy like the one shown in Figure 13 is needed. Real-time streaming data are transformed into information by using online analytics, generating operational events to aggre-gate the production and consumable data into improvement workflows generated by the automation of current operational knowledge. The classification of the data enables us to aggre-gate the data at the desired level of detail to determine where opportunities for improvement are. As such, collaboration among production, economics and planning, maintenance, and all the safety and environmental support become active and not passive as they were in the past.
Figure 13 shows the various levels that can be included in the implementation of process controls and plant management (Bascur 1988, 2016; Bascur and Kennedy 1999). Figure 14 shows a typical process control network with the process information and enterprise network integration. On the left side are data collectors within the systems. The security of the process control network is protected by a demilitarized zone. In the plant information network, the servers that manage the streaming data, the relational information, and the context data model feed the local data visualization and analysis tools to local users. This level feeds the enterprise global server information for integration with the enterprise resource plan-ning (ERP) or a connection to the cloud for external services collaboration.
All the data are captured by sensors through the diverse control systems. These are specialized data acquisitions and control devices that reside near the process equipment or in mobile equipment. These control systems are integrated with PI data servers. The first level is the traditional process control level. This is where the process equipment is regulated for stabilization, start-up, and shutdown of the units. Data valida-tion is required to check the validity of the sensor signal. This is required when advanced process controls are implemented. Data are classified to coordinate the integrated processes for overall plant optimization. Data modeling is conducted when an operating mode is known to perform performance calcula-tions, such as equipment condition alerts, process efficiencies,
100300 ProcessControl.indd 368 5/7/18 6:47 PM
Diane
Highlight
Diane
Highlight

Process Control and Operational Intelligence 369
energy management, and estimation of inferred process vari-ables based on line process models or real-time simulations.
Process coordination is used to integrate the chain supply to extend the analysis from all processes (such as in a mine to a mill to a port, for example). Mine-to-mill business analy-sis and mine-to-mill mass balancing are discussed later in the chapter.
Once the process chain is well tuned, chain supply opti-mization becomes a reality. Through energy and mass balanc-ing, it is now possible to identify opportunities to move closer to operating constraints. Operational (real-time) data can be used to explore new opportunities while using business analy-sis, visualization, and analysis of data and events.
Plant
Data Streams
Data Acquisition
Data Validation
Class Analysis
Model Estimation
Process Coordination
Plant Optimization
Controls
Alerts
Analyze
Predicts
Improve
Optimize
Panel Station
Operators
Asset Diagnostics
Process Engineers
Supervisors
Management
Object Model
Server
Raw Materials Products
Databases Context Analytics Visualization and Action
Source: Bascur 2016
Figure 13 Data hierarchy infrastructure for transforming data into actionable information
Process ControlNetwork (PCN)
Data Sources Site DemilitarizedZone (DMZ)
Site Corporate LAN Internet
Cloud Data AnalysisEnterprise Competence Center
Thin Clients
SAP
GlobalPI Server
PI SystemVisualization(PI Vision)
Thin ClientsPI Vision MobilePI Manual LoggerMobile
ApplicationsServer
PI to PIInterface toCorporate HQ
Smart Clients- PI ProcessBook- PI Manual Logger- PI DataLink
PI NotificationsPI AF Analytics
PI Interface Nodes(In FailoverConfiguration)
PI Data Archive &PI Asset Framework Server
GIS
Text Files/Flat Files
HTML/Web Services
RelationalDatabases
Process ControlsDSCs/PLCsOPC DAOPC HADOPC A&EOPC UA
Network DevicesIT MonitorMCN HealthMonitor
DCSs/PLCs = Distributed Control Systems/Programmable Logic ControllersGIS = Geographic Information SystemHQ = HeadquartersLAN = Local Area NetworkPI = Plant Information (software)
Source: Bascur 2016
Figure 14 Typical process controls and data management infrastructure
100300 ProcessControl.indd 369 5/7/18 6:47 PM
Diane
Line
Diane
Line
Diane
Rectangle
Diane
Rectangle
Diane
Rectangle
Diane
Highlight
Diane
Highlight
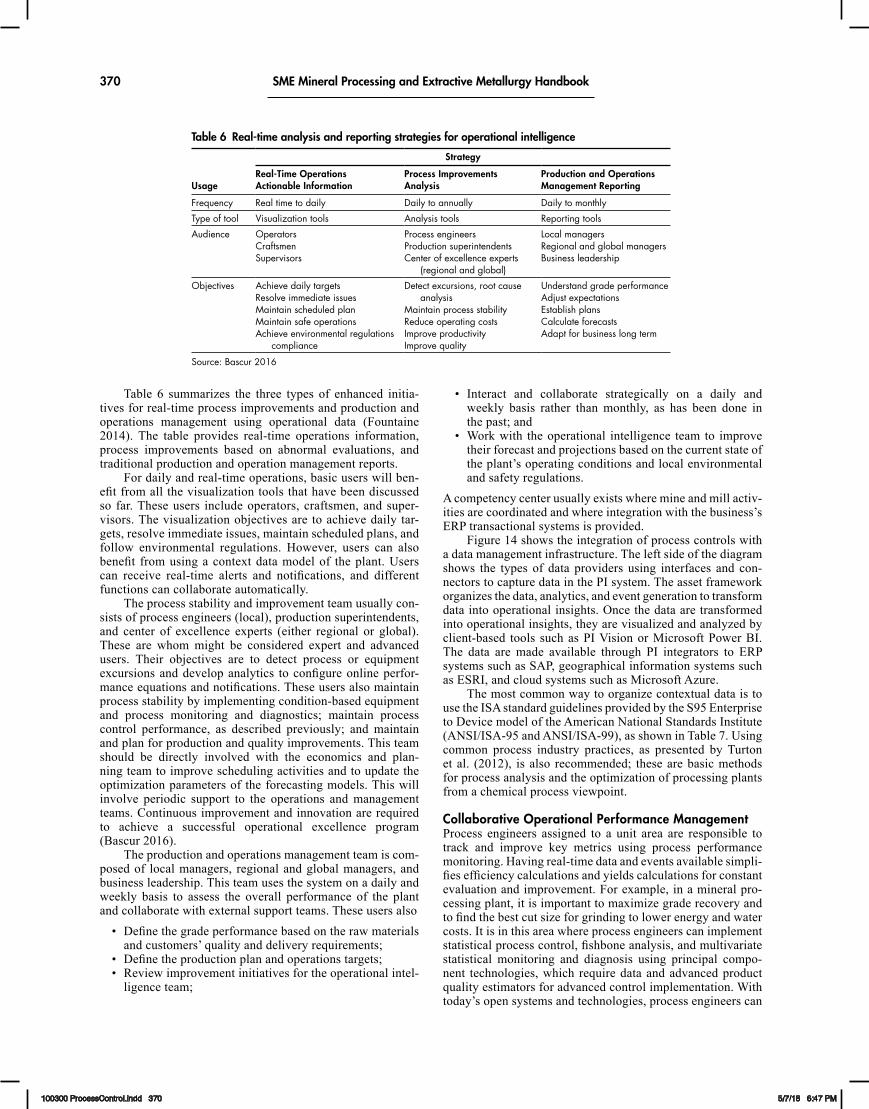
370 SME Mineral Processing and Extractive Metallurgy Handbook
Table 6 summarizes the three types of enhanced initia-tives for real-time process improvements and production and operations management using operational data (Fountaine 2014). The table provides real-time operations information, process improvements based on abnormal evaluations, and traditional production and operation management reports.
For daily and real-time operations, basic users will ben-efit from all the visualization tools that have been discussed so far. These users include operators, craftsmen, and super-visors. The visualization objectives are to achieve daily tar-gets, resolve immediate issues, maintain scheduled plans, and follow environmental regulations. However, users can also benefit from using a context data model of the plant. Users can receive real-time alerts and notifications, and different functions can collaborate automatically.
The process stability and improvement team usually con-sists of process engineers (local), production superintendents, and center of excellence experts (either regional or global). These are whom might be considered expert and advanced users. Their objectives are to detect process or equipment excursions and develop analytics to configure online perfor-mance equations and notifications. These users also maintain process stability by implementing condition-based equipment and process monitoring and diagnostics; maintain process control performance, as described previously; and maintain and plan for production and quality improvements. This team should be directly involved with the economics and plan-ning team to improve scheduling activities and to update the optimization parameters of the forecasting models. This will involve periodic support to the operations and management teams. Continuous improvement and innovation are required to achieve a successful operational excellence program (Bascur 2016).
The production and operations management team is com-posed of local managers, regional and global managers, and business leadership. This team uses the system on a daily and weekly basis to assess the overall performance of the plant and collaborate with external support teams. These users also
• Define the grade performance based on the raw materials and customers’ quality and delivery requirements;
• Define the production plan and operations targets;• Review improvement initiatives for the operational intel-
ligence team;
• Interact and collaborate strategically on a daily and weekly basis rather than monthly, as has been done in the past; and
• Work with the operational intelligence team to improve their forecast and projections based on the current state of the plant’s operating conditions and local environmental and safety regulations.
A competency center usually exists where mine and mill activ-ities are coordinated and where integration with the business’s ERP transactional systems is provided.
Figure 14 shows the integration of process controls with a data management infrastructure. The left side of the diagram shows the types of data providers using interfaces and con-nectors to capture data in the PI system. The asset framework organizes the data, analytics, and event generation to transform data into operational insights. Once the data are transformed into operational insights, they are visualized and analyzed by client-based tools such as PI Vision or Microsoft Power BI. The data are made available through PI integrators to ERP systems such as SAP, geographical information systems such as ESRI, and cloud systems such as Microsoft Azure.
The most common way to organize contextual data is to use the ISA standard guidelines provided by the S95 Enterprise to Device model of the American National Standards Institute (ANSI/ISA-95 and ANSI/ISA-99), as shown in Table 7. Using common process industry practices, as presented by Turton et al. (2012), is also recommended; these are basic methods for process analysis and the optimization of processing plants from a chemical process viewpoint.
Collaborative Operational Performance ManagementProcess engineers assigned to a unit area are responsible to track and improve key metrics using process performance monitoring. Having real-time data and events available simpli-fies efficiency calculations and yields calculations for constant evaluation and improvement. For example, in a mineral pro-cessing plant, it is important to maximize grade recovery and to find the best cut size for grinding to lower energy and water costs. It is in this area where process engineers can implement statistical process control, fishbone analysis, and multivariate statistical monitoring and diagnosis using principal compo-nent technologies, which require data and advanced product quality estimators for advanced control implementation. With today’s open systems and technologies, process engineers can
Table 6 Real-time analysis and reporting strategies for operational intelligence
Usage
Strategy
Real-Time Operations Actionable Information
Process Improvements Analysis
Production and Operations Management Reporting
Frequency Real time to daily Daily to annually Daily to monthly
Type of tool Visualization tools Analysis tools Reporting tools
Audience OperatorsCraftsmenSupervisors
Process engineersProduction superintendentsCenter of excellence experts
(regional and global)
Local managersRegional and global managersBusiness leadership
Objectives Achieve daily targetsResolve immediate issues Maintain scheduled planMaintain safe operationsAchieve environmental regulations
compliance
Detect excursions, root cause analysis
Maintain process stabilityReduce operating costsImprove productivityImprove quality
Understand grade performanceAdjust expectationsEstablish plansCalculate forecastsAdapt for business long term
Source: Bascur 2016
100300 ProcessControl.indd 370 5/7/18 6:47 PM

Process Control and Operational Intelligence 371
also connect to process simulators to provide estimates based on process data to optimize process conditions and improve control strategies.
Improvements in thickening process control and avail-ability and dewatering processes can be enhanced by analyz-ing geometallurgical data and using real-time operating control strategies to optimize water recovery and tailings disposal. Tailing impoundment remote operating conditions are now monitored carefully to manage mine and mill environmental performance, risks, and compliance to governmental and com-munity regulations. In the mining industry, pumping tailings, which consist of ground rock and process effluents, present several challenges to operating personnel. Online real-time monitoring of pumps is now feasible using condition-based monitoring strategies. These strategies combine real-time pro-cess variables such as flow rates, pump motor amperage, run-ning time, pressure, temperature, % solids, pump vibration, oil ferocity, and other measurements to reduce leaks, increase operational availability, decrease maintenance costs, and diminish safety incidents by preventing downtime.
The field of multivariate statistical process control enabled by industrial data infrastructures has been grow-ing in recent years. Principal component analysis methods enable the reduction of a set of variables to the minimum level required to discover unusual process events that may occur during regular operations. A good example of this is the imple-mentation of caster breakout by ArcelorMittal Dofasco at each of its casters (Bascur and Kennedy 2002). Applications in the mineral industry have been reported by Hodouin et al. (1993), Garrigues et al. (2000), Bascur et al. (2006), and Romero et al. (2006).
Rigorous model-based technology is also becoming pop-ular due to its ability to access real-time data through dynamic simulators. These simulators require validated and classified data for the estimator to be robust. State estimators are a great way to detect equipment or process changes (Bascur 1999). These techniques are now evolving into machine learning algorithms.
Collecting and reusing process equipment data from DCS and PLC systems and laboratory information systems is usu-ally done within an industrial data infrastructure (data, analyt-ics, event framing, visualization, and collaboration tools).
Operational excellence is one of the most valuable enter-prise programs to boost morale. Employees feel empowered knowing that they are contributing to the company’s overall
mission. Implementing a culture of continuous improvement and innovation is necessary to add value to process controls and data management.
Planning and Production Operational IntelligenceThe intention of online performance monitoring, as shown in Figure 15, is to detect and predict causes that could lead to a problem. Maintaining a plant and keeping the process flow on target according to the business plan is key for an operational manager. A reduction in process flow is an issue that requires investigation. Using new ways of transforming data into actionable information is the new transaction of the future, and submitting and analyzing any problems requires proper action. The proper alert mechanisms are email, process graph-ics, and visualization tools. These events can be monetized by estimating losses, having the necessary time intervals avail-able, and integrating the data to the desired level of detail. The alerts can trigger collaboration and further analysis, as shown in Figure 15. Operations must be strict to ensure that control loops operate at peak performance—they are essential to oper-ating the plant safely and efficiently.
Figure 15 is a conceptual diagram that shows the pro-cess of detecting abnormal operating modes for continuous improvement and innovations. The schematic shows a process workflow that inputs the targets from the daily plant schedule and the process inputs into a process unit analytics template that classifies the operating modes of all the process units in an industrial plant. The variance is the difference between the expected and actual results. The expected results are generally specified in the operational budget or in the current production schedule. This variance can be used as an exemption operat-ing strategy when implementing an operational intelligence program. As such, the classification of operating times can be used to aggregate the information for all the process units. The schematic presents two questions: (1) Are we on target? and (2) Are we satisfied? (Bascur and Kennedy 1996; Bascur et al. 2016). In essence, it is an innovative strategy that automates the theory of constraints for a digital plant (Goldratt 1984).
The data for the first question can be monitored in real time by defining the interval of time that the process units are running on target, are in trouble, are idle, are down, or are in maintenance. These operational events can then be used by the continuous improvement team to aggregate the data to look for opportunities. The large amount of data calls for the use of modern tools such as Microsoft Power BI to visualize the
Table 7 ANSI/ISA-95 Enterprise to Device decomposition model
Physical Model Abstraction Typical Model
Enterprise A collection of sites A process block diagram of a plant, including inventory, shipping, and receivables and a geographical model integrated with a geographic information system and enterprise resource planning
Site A set of plants within a site, including inventory, shipping, and receivables
A plant layout map, integration with geographical information systems
Plant A set of processing units within a plant area, including inventory, shipping, and receivables
Process block diagram
Plant area A set of units Process flow diagram
Unit A unit with all sensors defined Process flow control diagram
Equipment Equipment with all sensors included Process equipment diagram
Device Detailed sensor locations Piping and instrumentation diagram
Source: Bascur 2016
100300 ProcessControl.indd 371 5/7/18 6:47 PM

372 SME Mineral Processing and Extractive Metallurgy Handbook
information and to assess operational losses and gains (Bascur 2016).
Figure 16 shows a typical smelter process block diagram (Bascur and Kennedy 2004b). The smelter data are modeled using process unit templates to standardize the nomenclature for the information to be accessed by the process analytics and visualization tools. Figure 17 shows a diagram of the data transformation to detect operating events and provide further analysis.
Figure 18 shows the results of the data aggregated by the operational events for all the units in the smelter process dia-gram presented in Figure 16. For this time interval, all the units exhibit many events in “Trouble” mode. This means that the daily production set for these units was not satisfactory, resulting in many minor losses, as presented in this unique set of tools. Presenting the information using this innovative tool enables users to ask questions about the data and view graph-ics that present the results for evaluation and further analysis.
Inventories
Demand
Pricing
ProductionModel
Optimization and Simulation Tools
Targets
Metadata
Real-time Data
Process Unit Template
Analytics
Are we on target?Real-Time Analyticsand Notifications
Are we satisfied?Analysis for Improvement
OperationalEvent Data
Classification
• Operational Insights• Predictive Models• Notifications• Workflows
T = Transaction of the Feed Material into the PlantO, R, C1–C4 = Inventories
Source: Bascur 2016
Figure 15 Real-time operational intelligence strategy
KPI = Key Performance Indicator
Adapted from Bascur and Kennedy 2004b
Figure 16 Smelter process model context for data modeling for performance management
100300 ProcessControl.indd 372 5/7/18 6:47 PM

Process Control and Operational Intelligence 373
Power BI downloads the event data, and Cortana assists in providing the best visualization of the information.
Using these tools allows users to access the dashboards via the cloud either onsite or remotely. These new tools pro-vide a collaborative environment to enhance improvements in the operating plant. As such, a user can upload a report to the cloud and send an email from his or her tablet or smartphone to others to request assistance with analyzing the data.
Equipment Condition-Based MonitoringCondition-based monitoring is a very beneficial practice when real-time data from the process and equipment become avail-able. Equipment performance monitoring provides accurate
performance information on equipment such as boilers; com-pressors; furnaces; heat exchangers; and general rotating equipment such as pumps, conveyors, turbines, and so on. This monitoring focuses on increasing throughput, determin-ing when to stop the equipment before it breaks, and reduc-ing unscheduled equipment downtime. Thus, increasing plant availability and consequently reducing the overall specific consumption of utilities and production losses by analyzing real-time data enable operators to detect the first indications of an increase in the motor amperage standard deviation or to analyze the lube chemistry of the rotating equipment. This condition-based monitoring strategy directly supports the elimination of waste, which is consistent with an operational
Digital Process Industries Plant Based on Unit Template
From Data Model to Business Perspective
Production
Raw Materials
Utilities
Business Perspective• What We Do—KPIs (Management) 1. Variances (Plan–Current)• What We Manage—Metrics 1. Production 2. Costs, KWh/ton, $/ton 3. Availability 4. Yields 5. Quantity 6. Environmental 7. Safety• Plant Data 1. Inventories 2. Lab 3. Process 4. Equipment 5. Receiving/Shipping
What We Do
Operations Data
What We Manage
Operational Data
Events
Metrics
AggregatedInformation
By AreaBy GroupBy Region
HourShift
Week
Time Context
AnalyticExpression
AnalyticsTimeContext
Geospatial
Anytime
Multidimensional Data Model
Process
Operating Conditions
Shift
Perio
dTime
Units
Advanced Analytics
Source: Bascur 2016
Figure 17 Digitizing a smelter plant for performance monitoring in an operational excellence program
Figure 18 Microsoft Power BI with Cortana presenting the smelter electricity consumption and operating states for all process units
100300 ProcessControl.indd 373 5/7/18 6:47 PM
Diane
Highlight
Diane
Highlight

374 SME Mineral Processing and Extractive Metallurgy Handbook
excellence program (Pierce 2015). Mojtabai (2009) provides an overall description of mine planning and production man-agement. The author discusses the latest concepts in equip-ment reliability, functionality, and the maintenance life cycle in mining and mineral processing operations.
Figure 19 shows equipment conditions over time. Over time, the performance of the equipment can be captured in real time using sensors to monitor the overall quality of the equip-ment (Pierce 2015). The P in Figure 19 stands for potential failure. Potential failure event detection is the moment when the first sign of deterioration is seen and reported. There are additional measures that can help assess the condition of the equipment over time.
The “run to failure” portion of the graphic in Figure 19 represents the risk of asset failure, assuming that the test method indicates that a failure is imminent. The response opportunity time varies based on the assets, the type of test, and the frequency of the testing method. Quite often, there is little time to respond, depending on plant conditions, time of the notification, and so on. Most commonly, alarms for criti-cal items are sent to operations to ensure that equipment can be moved to a safe location prior to catastrophic failure (rep-resented by F). At this point, a work order is generated and work begins. Pierce (2015) describes several alternatives to this process.
Control Loop Performance MonitoringAnother strategy enabled by an enterprise data infrastructure program is control loop monitoring. This strategy focuses on process control loop monitoring, instrumentation calibration, and process stabilization and optimization. The goal is to mon-itor the key metrics for the unit and unify the process control loops associated with the unit optimization strategy. Control loops require continuous monitoring and tuning to maintain their performance and usability. Degradation of the sensors, final control elements, and process changes in the equipment must always be taken into account. Maintaining all the control loops is a challenge for all process plants. Having the capabil-ity to track the controlled and manipulated variables against process disturbances allows for the improvement of product
quality and the overall management of the process on a day-to-day basis.
Control loop performance monitoring not only helps identify faulty control valves but also indicates that properly functioning valves may have been targeted for maintenance through a preventive maintenance program. The costs resulting from not performing maintenance can be significant (Bascur and Soudek 2014; Ruel 2010a, 2010b; Van Scholkwyk 2012).
Several control performance goals should be taken into consideration. These are discussed in the following sections.
Controlled Variable PerformanceThe standard deviation, variability, percentage of time inside limits, percentage of time not saturated, noise level, and oscil-lation index should be monitored.
Model ErrorThe variability and integral moving average should be monitored.
Control Loop PerformanceThe percentage of time in the highest mode, percentage of time in service, percentage of time in normal range, oscilla-tion index, and maximum error should be monitored.
Manipulated Variable BehaviorThe percentage of time not saturated, error due to manipu-lated device stiction, valve travel, and valve reversals should be monitored.
Sensor monitoring is intended to validate data and detect failures to reduce the risk of damaging equipment and to improve overall production performance and availability. The primary benefits of intelligent field devices are improved pro-cess control and optimization, as well as the ability to bet-ter manage the health and life cycle of the devices. Rigorous equipment monitoring focuses on increasing throughput, determining when maintenance is needed, and increasing plant availability.
The ideal approach is to use real-time data and equipment information to classify the current operating data to provide alerts and notifications to prevent process downtime.
Predictive Preventive Run To Failure
Opportunity Window
Failure Initiated Power Statistics
Vibration Detection
Oil Analysis Detected
Audible Noise
Hot to Touch
Mechanically Loose
Ancillary Damage
Catastrophic Failure
Detection Limit
Equi
pm
ent C
onditi
on
Time
P
F
Incipient Failure Detection
Damage Limit
Courtesy of Michael Santucci
Figure 19 Condition-based monitoring: Proactive detection of equipment issues
100300 ProcessControl.indd 374 5/7/18 6:47 PM

Process Control and Operational Intelligence 375
Mine-to-Mill Big Data Analysis ExampleOne of the most valuable tools today is the availability to provide context to real-time data for big data analysis using self-service tools such as Microsoft Power BI and machine learning tools.
Consumables such as power and water are monitored in real time, as well as the average, maximum, and minimum targets for each operational mode by shift, month, or any inter-val of time. The average, maximum, and minimum targets are calculated using an algorithm from the data infrastruc-ture. These are called time-derived variables for operational modes, as given in Table 4. The variability of consumption is therefore monitored and provides the engineer with infor-mation to investigate abnormal consumption and identify the root cause of this occurrence. The status and availability of the assets in the grinding circuit are also monitored to pro-vide vital information on events—whether an asset is running properly, idling, in maintenance, down, or having trouble, as well as how often it has been in these states and for how long. Monitoring process events enables operators to aggregate the data by ore type, shift operator, and process modes to evaluate
the copper grade, recovery energy, and water consumption based on the ore type (e.g., Bascur and Soudek 2014; Bascur et al. 2017).
Figure 20 shows a process data model for a typical min-eral processing concentrator. A process unit template is used to organize and perform online calculations. These calcula-tions generate event frames to aggregate the data and events into real-time insights.
A cause-and-effect diagram, also called a fishbone dia-gram, is used to organize the operational data for business analysis. The process data are aggregated by the events (peo-ple, quality, and equipment operating modes) for analysis and visualization.
Figure 21 shows an example of a fishbone structure for concentrator analysis. It contains five key categories: people, ore type, process parameters, equipment, and consumables. Each of these branches contains subcategories of variables that can be organized depending on the type of cause-and-effect analysis to be done.
In this example, the assets are organized by production line with the monitoring of consumables. Real-time statistics
Water
Power
ConcentrateOre Type
EnergyOre
Water
EnergyOre
Water
EnergyOre
Water
EnergyOre
Water
EnergyOre
Water
Crushing Grinding Flotation Thickening Tailings
Scaling the Production Line Object Model
Waste
Figure 20 Integration of mine mill tailings and port
Strategy for Grade Recovery Improvements
People Ore TypeProcess
Parameters
Shift No.Maintenance
MineMill
Training
Block No.Ore Type
FragmentationRock AlterationOre Hardness
Work IndexGrade
StockpileBin LevelMill LoadCyclone Pressure
Sump LevelSize Distribution CrusherSize Distribution SAG Mill
Size Distribution Mill
Maximize Yields
ReducingOperating
Costs Energy
Water Steel
Limestone Reagents
ConsumablesEquipment
State(OK, Trouble, Down, Stopped,
Maintenance)Run Time
Equipment Age Availability
Mine Plan
Events Events
Events
Source: Bascur 2016
Figure 21 Cause-and-effect fishbone (Ishikawa) analysis design structure
100300 ProcessControl.indd 375 5/7/18 6:47 PM
Diane
Highlight

376 SME Mineral Processing and Extractive Metallurgy Handbook
are used to calculate the minimum, maximum, and standard deviation of each consumable by asset, by production line, and by mill. Users can modify the time range they are inter-ested in from, say, 1 hour to a shift or a day. The statistics are recalculated in real time based on this time range. This way, operations and the plant floor are using the same assets as the business systems, but these departments have different views of the same data for their own purposes and needs (Bascur et al. 2017). Figure 22 shows the handling of the process data, process events, equipment status, process areas in consider-ation, material type (ore/blend), and process time. This figure shows the analysis of the results shown using Power BI in Figures 18 and 23.
Figure 23 shows a Microsoft Power BI dashboard, where the selected event is sliced into data segments. These filters are used to modify the table based on the events chosen by the user. These can be based on many selected criteria, such as block number, process area, ore type, and shift team for all the
variables selected, such as total production, reagent consump-tion, water consumption, and electricity consumption for the process lines in the mill. The variables are time interval, ore type, ore type block number, number of production lines (bin, mill, flotation), and production line availability (running, in trouble, down, stopped, in maintenance) (Bascur et al. 2012). Kanchibotla (2014) and Bennett et al. (2014) discuss advances in integration with blasting and mine-to-mill implementations.
Predictive Analytics and Machine LearningPrevious sections of this chapter discussed strategies to perform gross operational data classification, as shown in Figure 13, as a prerequisite to perform online modeling of the process plant. Predictive analytics is an important subfield of data analytics. Predictive analytics is the art of building and using models that make predictions based on patterns extracted from histori-cal data. Some examples are particle size distribution; Gaudin module estimation; particle size; flotation air holdup in the
Dimensions
Unit 1
Unit 2Unit 3
Unit 4
Net Production(tons)Energy Consumption(kW·h/t)Water Consumption(m3/t)Services(kg/t)
Units Blast
Comminution
Hidromet
Flotation
Process
Real-Time Data
1:00 2:00 3:00
Time and Events
Mineral 1
MaterialMineral 2
Mineral 3
Mineral 4
44.70044.49044.70544.701
42.51243.25847.25849.635
85.21687.21789.34892.108
94.32194.21594.77794.517
79.21480.21481.00083.779
85.13285.66385.97685.585
41.11141.78941.95241.001
94.44494.11194.10094.102
44.35844.32144.44744.666
92.11192.41593.25894.333
81.11181.35282.47482.444
55.55555.64655.36355.999
Source: Bascur 2016
Figure 22 Multidimensional cube of real-time data with context and data services
Source: Bascur 2016
Figure 23 Example of a multidimensional analysis report to perform dynamic operation analysis using Microsoft Power BI
100300 ProcessControl.indd 376 5/7/18 6:47 PM

Process Control and Operational Intelligence 377
pulp; metal recovery; grade predictions based on process con-ditions and feed grade material; equipment conditions based on their current speed, power, and vibration to prevent down-time; and quality data versus process variables. Identification of the proper manipulated variables to achieve the right size distribution or the best strategy to minimize metal losses in the tails can predict emissions based on process parameters (Steyn et al. 2018).
An empirical model makes predictions to advise opera-tors. The model is obtained by training an algorithm to make predictions based on a set of historical examples. This is called field machine learning based on the evolutions of the algorithms to classify and fit the data to empirical models. Machine learning is defined as an automated process that can extract patterns from data. An example of this is called supervised machine learning. In this process, a model of the relationships among a set of descriptive features and a target feature based on a set of historical data examples is created. The generated data from an algorithm model are used to make predictions (Kelleher et al. 2015; Raschka 2015). The opera-tional data subset is obtained from the gross operational mode classification, as shown in Figure 15. Defining an operating mode for each process unit can help provide a good set of his-torical data to develop process models for plant optimization (Steyn et al. 2018; Plourde et al. 2017).
Figure 24 shows an integrated grinding flotation circuit using an online predictive model for recommendations and/or supervisory controls. A yield-based model can be derived from the fishbone analysis shown in Figure 21. The airflow rate to the flotation cell is a measured variable and can be con-trolled. The air holdup is a soft sensor calculation based on a flotation model (Bascur 2012). Having the right air holdup
profile in a flotation bank improves the overall recovery of metal into the concentrate. It is a critical variable that can be used with these new tools.
The fishbone analysis shows the effect of the recovery grades and losses based on the operating parameters; the equipment events; the operating shifts; the material grades; and the amount of energy, water, and reagents used to achieve the recovery and grades. Classification of the operating data enables operators to build this predictive model using regres-sion analysis and other models provided by the new tools that are available.
Once a training data set is obtained, a search for the best algorithm to fit the data can begin. To do so, one must have a good understanding of the business and the problem to be solved, a good understanding of the data, and proper prepa-ration of the data. The key variables shown in the proposed fishbone cause-and-effect diagram are used in designing the predictive analytic model. The data hierarchy model shown in Figure 13 can then be used.
There are many algorithms to choose from in modern machine learning tools. Least-squares multiple regression, neural networks, and random forest trees are the most tra-ditional models used. These models are found in Microsoft Azure Machine Learning Studio, or it might be useful to learn how to use Python and R. Python and R are of the most com-monly used programming languages for predictive analytics. They are not especially difficult to learn, but learning these programs may be more difficult for someone who has not been a process control engineer or process engineer. One can also use the Analysis ToolPak available in Excel to develop regres-sion models.
Controls
Advisor
Model
Data
Reconciliation
Mill
Rate
Wate
r A
dditi
ons
Siz
e D
istrib
utio
nPu
lp L
evel
Froth
Lev
elA
ir H
old
ups
Bub
ble
Siz
eRe
agen
tspH
Mill Feed Water
SumpLevel
Mill
Power
Mill Feed Rate
Sump Water
Cyclone Feed Pump
Roughers
EstimationSection
Scavengers
Tailings
To Regrind
Cleaner
Recleaner
To RegrindFromRegrind Final ConcentrateFlowrate
Levels% SolidsX-Ray AnalysisMill PowerPump AmpsEconomics
Recovery GradeProfit IndicesMill RateMill LoadGrind Cut Size
Integrated Online Estimation of Grinding/Flotation Property Changesfor Global Performance Management
Adapted from Bascur 1991b
Figure 24 Online model predicting quality variables for integrated grinding/flotation optimization
100300 ProcessControl.indd 377 5/7/18 6:47 PM
Diane
Line
Diane
Rectangle
Diane
Text Box
two
Diane
Pencil
Diane
Pencil

378 SME Mineral Processing and Extractive Metallurgy Handbook
Mass Balances and Data ReconciliationThere are several requirements for developing a methodology to implement a data reconciliation system. First, the algorithm that is able to balance and reconcile the plant data must be robust and must perform correctly against any process topol-ogy or configuration. In the past, several mathematical and statistical tools have been developed to solve this reconcilia-tion problem. However, a mathematical algorithm without an information infrastructure is of little value. Second, the right infrastructure to connect the object-oriented model to the real-time process data must be in place. A database that allows storage and manipulation of elements is necessary. The system has to adapt to changes in the process topology because, for example, a meter going out of service is enough to change the mass balance of a process network. Additionally, this object-oriented database should be able to communicate with the real-time information system. Third, the real-time system acts as a repository of process data and inventory data and as a metallurgical laboratory of both the raw and reconciled data. The results are distributed to all staff, including the operators and the plant manager.
The typical problems with process data in industrial plants are
• An overwhelming amount of data,• Low confidence in the available data,• Lack of consistency—the data do not make sense,• The data violate known constraints (mass and energy bal-
ances), and• Poor data quality creates a decision-making “fog” at all
levels of an organization and results in a financial penalty (fine).
These problems have been addressed in the past using tradi-tional methods to capture the required information. However, the main problem with these traditional methods is that human errors can occur during manual data entry, and operational events, which are typical in metallurgical complexes, may be ignored.
The instream analyzer measures the metal compositions for the period of the balance analysis. The mass balancing algorithm runs daily, producing the operational reconciled reports. Figure 25 describes the daily procedure to recon-cile process data. The unbalanced data are collected from the
real-time information system. Once the data are in the system, a set of analysis rules is executed to detect gross errors that can negatively affect results. These gross errors are eliminated before the final data reconciliation is run. The results provide a unified balance for the whole complex. The assay errors are identified and reported.
A concentrator plant mass balance model includes the operational data, metal assays, metal inventories and receipts of mineral from the mine, stockpiles, bins, thickeners, crush-ers, grinding, flotation circuits, and the overall flow and com-position balance of the chemical components. Once the mass flow, stream, and inventory compositions are available from the system, many calculations and reports can be performed. In the process of solving the network problem, the measure-ments are validated and gross errors are detected prior to pro-viding a solution (Bascur and Kennedy 2002, 2004a).
Once the data are reconciled, they can be sent to the busi-ness information system, where they can be distributed to all users, from operators to engineers and managers. The infra-structure of the data reconciliation system has to adapt to any changes to the process flow or the measuring system because both the process topology and the data are not static.
The reconciled data can then be used to improve yield performance, balancing the optimal recovery and grades while minimizing metal losses in the tails. The data can be reused to improve process planning and to determine the optimal set points for steady-state optimization of the plant (Bascur and Linares 2005; Bascur and Soudek 2009a, 2009b). Hodouin (2011) also described additional uses for this type of methodology.
INDUSTRIAL INTERNET OF THINGS: DISRUPTION IN AUTOMATIONIndustrial companies have pursued horizontal and vertical con-nectivity within their operations for some time now in their ongoing efforts to improve performance and achieve opera-tional excellence. Most existing sensor and actuator points in an industrial automation system are there to support pro-cess or production control, safety, and regulatory compliance. However, in the past, adding sensors to support condition-based maintenance or other noncontrol uses was done infrequently due in part to the costs of adding the sensors and associated software systems to existing hierarchical control systems.
Real-TimeInformation
System
AutomaticData
Collection
BusinessRule
Filtering
EliminateGrossErrors
ConnectivityModel
ReconcilePlantModel
ReportGeneration
GenerateReports
and Publish
Source: Bascur and Linares 2005
Figure 25 Daily procedure for data reconciliation
100300 ProcessControl.indd 378 5/7/18 6:47 PM

Process Control and Operational Intelligence 379
However, new approaches, including technologies such as less expensive strap-on sensors, Wi-Fi connectivity, predictive ana-lytics, and cloud computing can make condition-based mainte-nance and other “connected world” applications practical.
Large mining and metal companies rely on many vendors and partners. There is an increasing degree of outsourcing and integration between an operating company and its partners. There is also constant pressure to improve performance and reduce costs. Minerals are becoming more complex. All of these challenges require companies to innovate and simplify access to process and equipment information. Data transfer is a manual process; it is very time-consuming and has very little auditability and security.
In many mining operations, ore is crushed and wet milled to liberate the valuable mineral. This slurry is concentrated by flotation and then filtered to form a dry mineral concentrate that is shipped to refineries to produce metallic products. The type of filtration equipment required depends on the particle size, mineralogy, and shipping requirements. As with all min-ing operations, the required equipment is robust and designed to be reliable even under the toughest operating conditions.
The availability of a central data infrastructure database allows operational information to be shared with external collaborators. As shown in Figure 26, PI Cloud Connect can be used to share and expand the use of the operational data. Cloud-based strategies simplify access to real-time informa-tion through simple registration to PI Cloud Services running on Microsoft Azure. A plant asset framework data model is selectively shared using PI Cloud Connect between the enter-prise and an equipment vendor. The data published by the mineral processing company pertain to a set of equipment used for material separation such as filters. As such, the opera-tional data of the filters are shared by the customer and the service provider in real time. This new capability provides a secure, auditable, and low-maintenance exchange of real-time processes and equipment. It drastically reduces the time spent accessing data and enhances the use of data for equipment vendors. As such, vendors can make recommendations about the optimal use of energy. Many exciting new possibilities are currently being explored by service providers using the
data at the original resolution. This allows for the monitoring of sophisticated equipment by experts, integration with utili-ties, automatic restocking, and integration with joint ventures (Bascur et al. 2016).
Plant Operational Intelligence Strategy ConclusionsDespite the advances in automatic data collection and archiving, business decision makers face the problem of exploiting information that is relevant for plant operations and the sustainability of the business enterprise.
The plant operational intelligence strategy adds opera-tional context to the data. The data can be transformed into operational insights for further analysis using machine learning and business intelligence tools. This novel strategy improves collaboration and provides real-time feedback on decisions made at all levels of the organization. This strategy allows the operating and support team to proactively detect shifts in process performance; the team can use statistical tools and process knowledge to identify shifts in performance. It can provide structure and a means of determining the root cause of the shifts and, if needed, propose corrective action. The competence team is in charge of identifying process improvement opportunities and providing sufficient informa-tion and root-cause diagnostics to identify areas of improve-ment and identify new performance indicators.
The efficient use of water, energy, and resources is criti-cal; the best approach is to have the infrastructure in place to be able to conduct small focused projects, collaborate among different teams in the organization, and understand that this is a continuous improvement process.
CONCLUSIONS AND FUTURE IMPLICATIONSMany advances in sensors, control systems, and information systems are now converging into what is being called the “internet of things.” It is always a challenge to assess the situ-ation in operating plants moving forward, but it is clear that an operational excellence program that takes into account the sustainability of the company is mandatory. Process analysis, control, and optimization are part of the ecosystem.
™
AF = Asset Framework Object DatabasePI = Plant Information (software)
Central Site
Partners 2
PI AF PI Server
PI AF PI Server
PI AF PI Server
PI Server PI AF
Partners 1
Partners n
Site 3
Site 1
Site 2
Site 4 Site 5
Source: Bascur 2016
Figure 26 PI Cloud Connect computer architecture example connecting an enterprise to its service partners
100300 ProcessControl.indd 379 5/7/18 6:47 PM

380 SME Mineral Processing and Extractive Metallurgy Handbook
For new plants, it will be a challenge to select the best practices in this field to be able to exceed the traditional state of the art. This chapter has discussed the state the art of what is available and most prevalent today.
For existing plants, plant optimization will generate the best return on investment because if equipment or software is not added, optimization consists of using what one has on hand. A step-by-step process is proposed in the study by Ruel (2014b).
The first phase is to remediate instrumentation problems, including the ones pertaining to valves, variable-speed drives, analyzers, transmitters, and so on. When equipment is in order, loops are put back in automatic mode. The key performance indicators (KPI) for this phase is the proportion of loops oper-ating in the highest mode. If a loop oscillates, standard default values can be used for this type of loop.
The second phase consists of validating the control strate-gies, properly configuring the systems (control system, pro-grams and parameters, human–machine interface, alarms), and then tuning the loops and control strategies. The KPI for this phase is the number of loops in service (right mode, non-saturated, nonoscillating, low variability). Soft sensors should also be validated.
The third phase consists of analyzing the process and expected performances to optimize the control loops and control strategies. When mixing products, for instance, each flow loop should move at the same speed to ensure the proper recipe when increasing the total flow. The KPI for this phase is variability (per loop, per unit) and economic weight.
The fourth phase is necessary when performance is not sufficient. In this phase, advanced control should be added: advanced regulatory control, MPC, or fuzzy logic control. A decision tree should be presented to determine the right approach. The KPI is the same as that of the third phase, but a percentage of time use should also be added.
Once all steps have been completed, control performance monitoring software should be used to sustain the results and pinpoint equipment or loops that are not performing as stated. Also, after an audit on the alarm system, alarm management and rationalization should be performed if needed.
To calculate benefits, the following need to be analyzed: the past and benchmark production, recovery, chemical prod-uct consumption, water consumption, energy usage, and other factors. KPIs (e.g., energy/t, $/t, %/t) need to be estimated.
Once an area is optimized, the KPIs need to be reviewed and the return on investment needs to be calculated. In most cases, the optimization projects will be funded within a week.
Figure 27 shows that most plants have invested in auto-mation hardware, which is the most costly item, as discussed by Ruel (2014b). It is clear that process control hardware is a large part of the investment in new plants. However, the plants are living things—they evolve, and the process must adapt to new raw materials. As such, plants must change and adopt new technologies to operate efficiently based on current economic and local environmental regulations. Additional information can be found in the studies by Ruel (2010b, 2014a, 2014b).
Boufard (2015) discussed the benefits of process control systems in mineral processing grinding circuits, concluding that the benefits are undisputable: a 1%–16% gain in through-put, up to a 1% gain in recovery, fewer operator interventions, and a payback in less than 6 months (Bouche et al. 2005). Gupta (2016) described the new set of skills required to man-age process control and advanced operational techniques and stated that “technology has both complicated process control and made it easier.”
Bauer and Craig (2008) provided an economic assess-ment of advanced process controls. The framework provides a method to evaluate the advanced process control program for benefits estimation. The main profit contributors from their survey are as follows:
• Throughput increase (67%–70%)• Process stability improvements (45%–67%)• Energy consumption reduction (45%–65%)• Increased yield mass of more valuable product
(40%–60%)• Quality giveaway reduction (30%–40%)• Downtime reduction (15%–22%)• Better use of raw materials (15%–19%)• Reprocessing cost reduction (11%–12%)• Response increase (11%–14%)• Safety increase (9%–11%)
Advanced Control
Coordinated Control
Advanced Automationor Control
Cost Return on Investment
Regulatory DCS
Optimization
Regulatory DCS
Coordinated Control
Optimization
20%
40%
60%
80%
100%
0%
ImpactsBusinessProfitability($$)
Take advantage of previous investments in process controland information technology
Leveraging Technology
Source: Ruel 2014b
Figure 27 Process control investments and return on investment based on knowledge strategies
100300 ProcessControl.indd 380 5/7/18 6:47 PM

Process Control and Operational Intelligence 381
• Operating labor reduction (5%–15%)• Other (7%–15%)
The data generated by the evolution of sensors, process control, vision, sound, and other fields will continue to grow. This big data opportunity is a fact. It requires a reengineering of the current situation. The integration of real-time data and operational data with business systems will converge. Today, new large file systems can handle the large data requirements. In addition, new machine learning algorithms are becoming available to develop online predictive models to improve the early detection of problems within plants.
Mill availability remains one the most significant indi-cators of efficient mill operation and a KPI for concentrate managers. Maintaining the optimum charge and composition in a SAG mill remains a fundamental challenge for efficient mill processes.
Continuous improvements of liner life prediction and reline planning are now a great augmented alternative for improving availability and optimizing the grinding behavior for optimal metal recovery.
Tailings are a necessary by-product of mining activities. An operational excellence program is a holistic view that requires data analysis to conserve energy, conserve water, and manage geowaste materials such as tailings and waste rock.
Wireless and cellular technologies can transmit opera-tional data from supervisory control and data acquisition systems to operational site computers for additional analysis to classify the data to detect problems. Historical, operation mode–based data can be used to develop models for the pro-active generation of alerts using a real-time industrial data infrastructure.
ACKNOWLEDGMENTSThe author sincerely thanks the following people for taking the time to read the draft of this manuscript and provide feed-back to improve the content of the chapter: John Karageorgos, Mantra Controls, Australia; Michel Ruel, BBA Inc., Canada; Daniel Sbarbaro, University of Concepción, Chile; Gina Laviste, OSIsoft Asia; and many other dear colleagues who have contributed to the author’s work over the years.
REFERENCESANSI/ISA-95. Enterprise to Control System Integration. New
York: American National Standards Institute. Available from www.ansi.org.
ANSI/ISA-99. Control System Integration. New York: American National Standards Institute. Available from www.ansi.org.
ANSI/ISA-S5.4-1991. Instrument Loop Diagrams. Research Triangle Park, NC: International Society of Automation.
ANSI/ISA-S5.5-1985. Graphics Symbols for Process Diagrams. Research Triangle Park, NC: International Society of Automation.
Baas, D., Hille, S., and Karageorgos, J. 2007. Improved flotation process control at Newcrest’s Telfer opera-tion. Presented at the Ninth AusIMM Mill Operators’ Conference, Fremantle, Australia.
Baas, D., Bennett, D., and Walker, P. 2014. Developing pro-cess control standards for optimal plant performance at PanAust Limited. Presented at the 12th AusIMM Mill Operators’ Conference, Townsville, Australia.
Bascur, O.A. 1988. A control data framework with dis-tributed intelligence. In Advances in Instrumentation: Proceedings of the ISA/88 International Conference and Exhibit. Research Triangle Park, NC: Instrument Society of America.
Bascur, O.A. 1990a. Profit based grinding controls. Miner. Metallurg. Process. 7:9–10.
Bascur, O.A. 1990b. Expert process operator advisor. In Control 90: Mineral and Metallurgical Processing. Edited by R. Rajamani and J.A. Herbst. Littleton, CO: SME. pp. 67–77.
Bascur, O.A. 1991a. Human factors and aspects in process control use. In Plant Operators. Edited by D.N. Halbe. Littleton, CO: SME.
Bascur, O.A. 1991b. Integrated grinding/flotation controls and management. Presented at the Copper 91/Cobre 91 International Symposium, Ottawa, Ontario, Canada.
Bascur, O.A. 1999. The industrial desktop—Real time busi-ness and process analysis to increase the productivity in industrial plants. Presented at the Second International Conference on Intelligent Processing and Manufacturing of Materials, Vancouver, British Columbia, Canada.
Bascur, O.A. 2005. Example of a dynamic flotation frame-work. Presented at the Centenary of Flotation Symposium, Brisbane, Australia.
Bascur, O.A. 2010. A flotation model framework for dynamic performance monitoring. In Proceedings of the 7th International Mineral Processing Seminar. Santiago, Chile: Gecamin.
Bascur, O.A. 2012. Dynamic model-based flotation per-formance monitoring. In Separation Technologies for Minerals, Coal, and Earth Resources. Edited by C.A. Young and G.H. Luttrell. Englewood, CO: SME. pp. 709–718.
Bascur, O.A. 2016. A journey toward a digital transformation in the process industries. https://pisquare.osisoft.com/docs/DOC-2935-journeydigitaltransformation-draft-c1 -4-binder1pdf. Accessed December 2017.
Bascur, O.A., and Herbst, J.A. 1985a. Dynamic simulators for training personnel in the control of grinding/flotation sys-tems. IFAC P. Ser. 18(6):315–324.
Bascur, O.A., and Herbst, J.A. 1985b. On the development of a model-based control strategy for copper-ore flo-tation. In Flotation of Sulphide Minerals. Edited by K.S.E. Forssberg. Amsterdam: Elsevier. pp. 409–431.
Bascur, O.A., and Herbst, J.A. 1986. Improved thickener per-formance through the use of an extended Kalman filter. In Design and Installation of Concentration and Dewatering Circuits. Edited by A.L. Mular and M.A. Anderson. Littleton, CO: SME. pp. 835–845.
Bascur, O.A., and Kennedy, J.P. 1996. Measuring, manag-ing and maximizing refinery performance. Hydrocarb. Process. 75(1):111–116.
Bascur, O.A., and Kennedy, J.P. 1999. Real time business and process analysis to increase productivity in the pro-cess industries. Presented at the 1999 ISA Conference, Houston.
Bascur, O.A., and Kennedy, J.P. 2002. Reducing maintenance costs using process and equipment event management. In Mineral Processing Plant Design, Practice, and Control: Proceedings. Edited by A.L. Mular, D.N. Halbe, and D.J. Barratt. Littleton, CO: SME. pp. 507–527.
100300 ProcessControl.indd 381 5/7/18 6:47 PM

382 SME Mineral Processing and Extractive Metallurgy Handbook
Bascur, O.A., and Kennedy, J.P. 2004a. Are you really using your information to increase the effectiveness of assets and people? In Plant Operators’ Forum. Edited by E.C. Dowling and J.I. Marsden. Littleton, CO: SME. pp. 47–62.
Bascur, O.A., and Kennedy, J.P. 2004b. Improving metallur-gical performance in pyrometallurgical processes. JOM 56(12):22–27.
Bascur, O.A., and Linares, R. 2005. Grade recovery optimiza-tion using data unification and real time gross error detec-tion. Miner. Eng. 19(6-8):696–702.
Bascur, O.A., and Soudek, A. 2009a. Real-time integration of mining and metallurgical information for efficient use of energy and water. SME Preprint No. 09-103. Littleton, CO: SME.
Bascur, O.A., and Soudek, A. 2009b. Real time information management infrastructure—Collaboration at mine-mill for asset optimization. In Recent Advances in Mineral Processing Plant Design. Edited by D. Malhotra, P. Taylor, E. Spiller, and M. LeVier. Littleton, CO: SME. pp. 490–498.
Bascur, O.A., and Soudek, A. 2014. Implementation strat-egies for energy effectiveness and sustainability—Example of Anglo American Platinum. Presented at the 12th AusIMM Mill Operators’ Conference, Townsville, Australia, September 1–3.
Bascur, O.A., Linares, R., and Yacher, L. 2006. Improving mine mill performance in large metallurgical complexes. Presented at the XXIII International Mineral Processing Congress, Istanbul, Turkey, September 3–8.
Bascur, O.A., Linares, R., and Riveros, E. 2008. Hydrometallurgical operational management strat-egies. Presented at the Fifth International Copper Hydrometallurgy Workshop, Antofagasta, Chile, May 13–15.
Bascur, O.A., Hertler, C., and Benavides, N. 2012. Specific energy and water reductions in mine to mill operations. In Proceedings of the International Mineral Processing Congress. New Delhi, India: Indian Institute of Metals.
Bascur, O.A., Halhead, M., Garrigues, L., and Jarvis, M. 2016. Mineral processing plant asset and energy optimization: The calming cloud over operations. In Proceedings of the XXVIII International Mineral Processing Congress. Westmount, QC: Canadian Institute of Mining, Metallurgy and Petroleum.
Bascur, O.A., Plourde, M., Paquet, S., Morissette, S., and Gervais, D. 2017. A journey towards mine to port opera-tional intelligence. Presented at the 2017 SME Annual Conference and Exposition, Denver, CO, February 19–22.
Bauer, M., and Craig, I.K. 2008. Economic assessment of advanced process control—A survey and framework. J. Process Control 18(1):2–18.
Bennett, D., Tordoir, A., Walker, P., La Rosa, D., Valery, W., and Duffy, K. 2014. Throughput forecasting and optimization at the Phu Kham Copper-Gold Operation. In Proceedings of the 12th AusIMM Mill Operators’ Conference, Townsville, Australia, September 1–3. Carlton, Australia: Australasian Institute of Mining and Metallurgy.
Bhattacharyya, D., Shaeiwitz, J.A., Turton, R., and Whiting, W.B. 2012. Diagrams for understanding chemical pro-cesses. In Analysis, Synthesis and Design of Chemical Processes, 4th ed. Edited by R.A. Turton, R.C. Bailie, W.B. Whiting, J.A. Shaeiwitz, and D. Bhattacharyya. Indianapolis: Pearson Education.
Botin, J.A. 2009. Integrating sustainability into the organiza-tion. In Sustainable Management of Mining Operations. Edited by J.A. Botin. Littleton, CO: SME. pp. 71–132.
Bouche, C., Brandt, C., Broussaud, A., and Drunick, V.W. 2005. Advanced control of gold ore grinding plants in South Africa. Miner. Eng. 18:866–876.
Boufard, S.C. 2015. Benefits of process control systems in mineral processing grinding circuits. Miner. Eng. 79:139–142.
Boulet, B., Vaculik, V., and Wind, G. 1997. Control of non-fer-rous electric furnaces. IEEE Can. Rev. (Summer):1–13.
Braden, T.F., Kongas, M., and Saloheimo, K. 2002. On-line composition analysis of mineral slurries. In Mineral Processing Plant Design, Practice, and Control: Proceedings. Edited by A.L. Mular, D.N. Halbe, and D.J. Barratt. Littleton, CO: SME. pp. 2020–2021.
Coker, R. 2015. A clearer picture. Min. Mag. (November):38–42.Concha, F.A. 2014. Solid–Liquid Separation in the Mining
Industry. Cham, Switzerland: Springer.Edwards, R., Vien, A., and Perry, R. 2002. Strategies for
the instrumentation and control of grinding circuits. In Mineral Processing Plant Design, Practice, and Control: Proceedings. Edited by A.L. Mular, D.N. Halbe, and D.J. Barratt. Littleton, CO: SME. pp. 2130–2151.
Ferrarini, L., and Veber, C. 2009. Modeling, Control, Simulation, and Diagnosis of Complex Industrial and Energy Systems. Research Triangle Park, NC: International Society of Automation.
Flintoff, B. 1995. Control of mineral processing systems. In Proceedings of the XIX International Mineral Processing Congress. Littleton, CO: SME.
Flintoff, B. 2002. Introduction to process control. In Mineral Processing Plant Design, Practice, and Control: Proceedings. Edited by A.L. Mular, D.N. Halbe, and D.J. Barratt. Littleton, CO: SME. pp. 2051–2065.
Flintoff, B., Guyot, O., McKay, J., and Vien, A. 2014. Innovations in comminution and control. In Mineral Processing and Extractive Metallurgy: 100 Years of Innovation. Edited by C.G. Anderson, R.C. Dunne, and J.L. Uhrie. Englewood, CO: SME.
Fountaine, L. 2014. Leveraging data as an enabler for oper-ational excellence. Presented at the OSIsoft Regional Seminar, São Paulo, Brazil.
Fuenzalida, R., and Olivares, J. 2012. Experiences and projec-tions on SAG mill multivariable predictive control. SME Preprint No. 12-123. Englewood, CO: SME.
Fuerstenau, D.W. 1999. The flotation century. In Advances in Flotation Technology. Edited by B.K. Parekh and J.D. Miller. Littleton, CO: SME. pp. 3–21.
Garrigues, L., Kettaneh, N., Wold, S., and Bascur, O.A. 2000. Multivariate process analysis and optimization in min-eral processing. In Control 2000. Edited by J.A. Herbst. Littleton, CO: SME. pp. 41–50.
Goldratt, E.M. 1984. The Goal: A Process of Ongoing Improvement. Great Barrington, MA: North River Press.
100300 ProcessControl.indd 382 5/7/18 6:47 PM

Process Control and Operational Intelligence 383
Gupta, M.S. 2016. Rethinking the role of process control. www.arcweb.com/blog/rethinking-role-process-control. Accessed December 2017.
Hartog, J., Beehan, V., Karageorgos, J., and Beeson, D. 2014. Optimization of the Peak Gold Mine’s processing plant through advanced process control. Presented at the 12th AusIMM Mill Operators’ Conference, Townsville, Australia.
Henriquez, F., Silva, D., and Jiménez, C. 2012. Improving ball mills operations by applying MPC and advanced control systems at Minera Los Pelambres. Presented at the XXVI International Mineral Processing Congress 2012, New Delhi, India.
Herbst, J.A., and Bascur, O.A. 1984. Mineral processing control: Realities and dreams. In Control ’84: Mineral Metallurgical Processing. Edited by J.A. Herbst, D.B. George, and K.V.S. Sastry. Littleton, CO: SME. pp. 197–215.
Herbst, J.A., and Harris, J. 2007. Modeling and simulation of industrial flotation processes. In Froth Flotation: A Century of Innovation. Edited by M.C. Fuerstenau, G. Jameson, and R.-H. Yoon. Littleton, CO: SME. pp. 757–777.
Herbst, J.A., and Pate, W. 1999. Developments in flotation control: One part evolution, two parts revolution. In Advances in Flotation Technology. Edited by B.K. Parekh and J.D. Miller. Littleton, CO: SME. pp. 399–412.
Hodouin, D. 2011. Methods for automatic control, observa-tion, and optimization in mineral processing plants. J. Process Control 21(2):211–225.
Hodouin, D., MacGregor, J., Hou, M., and Franklin, M. 1993. Multivariate statistical analysis of mineral processing data. CIM Bull. 23–34.
Janzen, J., Gerritsen, T., Voermann, N., Veloza, E.R., and Delgado, R.C. 2004. Integrated furnace controls: Implementation on a covered-arc furnace at Cerro Matoso. In Proceedings of the Tenth Ferroalloys Congress, Cape Town, South Africa, February 1–4. Marshalltown, South Africa: Southern African Institute of Mining and Metallurgy.
Johansson, B., Bergmark, B., Guyot, O., Bouche, C., and Broussaud, A. 1999. Model-based control of Aitik bulk flotation. Miner. Metall. Process. 16(2):41–45.
Kanchibotla, S. 2014. Mine mill value chain optimization: Role of blasting. In Mineral Processing and Extractive Metallurgy: 100 Years of Innovation. Edited by C.G. Anderson, R.C. Dunne, and J.L. Uhrie. Englewood, CO: SME.
Karageorgos, J., Skrypniuk, J., Valery, W., and Ovens, G. 2001. SAG milling at the Fimiston Plant (KCGM). Presented at the SAG 2001 Conference, Vancouver, British Columbia, Canada.
Karageorgos, J., Genovese, P., and Baas, D. 2006. Current trends in SAG and AG mill operability and control. Presented at the SAG 2006 Conference, Vancouver, British Columbia, Canada.
Karageorgos, J., Davies, S., Broers, E., and Goh, J. 2009. Current trends in countercurrent decantation and thick-ener circuit operability and control. Presented at the 10th AusIMM Mill Operators’ Conference, Adelaide, Australia.
Kelleher, J.D., Namee, B.M., and D’Arcy, A. 2015. Fundamentals of Machine Learning for Predictive Analytics. Cambridge, MA: MIT Press.
Kewe, T., Moffatt, N., and Schaffer, M. 2014. Porgera flotation circuit upgrade and expert system installation. Presented at the 12th AusIMM Mill Operators’ Conference, Townsville, Australia.
Li, X., McKee, D.J., Horberry, T., and Powell, M.S. 2011. The control room operator: The forgotten element in mineral process control. Miner. Eng. 24(8):894–902.
Lukas, M.P. 1986. Distributed Control Systems: Their Evaluation and Design. New York: Van Nostrand Reinhold.
Lundmark, P. 2008. Collaboration with the operator in focus. Presented at Automining 2008, Santiago, Chile.
Marlin, T.E. 2014. Process Control: Designing Processes and Control Systems for Dynamic Performance, 2nd ed. New York: McGraw-Hill.
Medower, R.A., and Cook, R.E. 2002. The selection of control hardware for mineral processing. In Mineral Processing Plant Design, Practice, and Control: Proceedings. Edited by A.L. Mular, D.N. Halbe, and D.J. Barratt. Littleton, CO: SME. pp. 2077–2103.
Mojtabai, N. 2009. Mine planning and production manage-ment. In Sustainable Management of Mining Operations. Edited by J.A. Botin. Littleton, CO: SME. pp. 261–356.
OSHA (Occupational Health and Safety Administration). 2017. 29 CFR 1910. OSHA General Industry Regulations. Washington, DC: OSHA. Available from www.osha-safety-training.net/product/osha-general -industry-regulations-book/.
Otnes, R.K., and Enochson, L. 1978. Applied Time Series Analysis. New York: John Wiley and Sons.
Pierce, K. 2015. A Guidebook to Implementing Condition-Based Maintenance (CBM) Using Real-Time Data. San Leandro, CA: OSIsoft.
Plourde, M., Bascur, O.A., Paquet, S., and Gervais, D. 2017. Digital innovation in modern engineering and opera-tional excellence. Presented at the 2017 SME Annual Conference and Expo, Denver, CO, February 19–22.
Raschka, S. 2015. Python Machine Learning. Birmingham, UK: Packt Publishing.
Rice, R.C. 2015. PID Tuning Guide. Bethlehem, PA: NovaTech.
Romero, F., Yacher, L., and Bascur, O.A. 2006. Extended semiautogenous milling: Smooth operations and extended availability at C.M. Doña Ines de Collahuasi SCM, Chile. In Advances in Comminution. Edited by S.K. Kawatra. Littleton, CO: SME. pp. 181–190.
Ruel, M. 2010a. Control system performance assessment—Best practices. Presented at the Second International Congress of Automation in the Mining Industry (Automining 2010), Santiago, Chile.
Ruel, M. 2010b. Closed loop tuning vs. open loop tun-ing: Tuning all your loops while the process is run-ning is now possible. Presented at the 2010 TAPPI PAPTAC International Chemical Recovery Conference, Williamsburg, VA, March 29–April 1.
Ruel, M. 2012. Fuzzy logic control: A successful example. Presented at ISA 2012 Automation Week, San Diego, CA.
100300 ProcessControl.indd 383 5/7/18 6:47 PM

384 SME Mineral Processing and Extractive Metallurgy Handbook
Ruel, M. 2014a. Advanced control decision tree. In Proceedings of the 46th Annual Canadian Mineral Processors Operators Conference. Westmount, QC: Canadian Institute of Mining, Metallurgy and Petroleum.
Ruel, M. 2014b. Successful methodology to select advanced control approach. Presented at the Process Control and Safety Symposium of the International Society of Automation, Houston, TX, October 6–9.
Sbarbaro, D., and del Villar, R. 2010. Advanced Control and Supervision of Mineral Processing Plants. London: Springer-Verlag.
Schoenbrunn, F., Hales, L., and Bedell, D. 2002. Strategies for instrumentation and control of thickeners and other solid–liquid separation circuits. In Mineral Processing Plant Design, Practice, and Control: Proceedings. Edited by A.L. Mular, D.N. Halbe, and D.J. Barratt. Littleton, CO: SME. pp. 2164–2173.
Sienkiewicz, J.R. 2002. Basic field instrumentation and con-trol system maintenance. In Mineral Processing Plant Design, Practice, and Control: Proceedings. Edited by A.L. Mular, D.N. Halbe, and D.J. Barratt. Littleton, CO: SME. pp. 2104–2113.
Stephanopoulos, G. 1984. Chemical Process Control: An Introduction to Theory and Practice. Englewood Cliffs, NJ: Prentice Hall.
Steyn, J., Bascur, O.A., and Gorain, B. 2018. Metallurgy ana-lytics: Transforming plant data into actionable insights. SME Preprint No. 18-029. Englewood, CO: SME.
Stuffco, T., and Sunna, K. 2002. Well balanced control sys-tems. In Mineral Processing Plant Design, Practice, and Control: Proceedings. Edited by A.L. Mular, D.N. Halbe, and D.J. Barratt. Littleton, CO: SME. pp. 2066–2076.
Tan, P., and Vix, P. 2005. Control of magnetite formation dur-ing slag-making in copper smelters. In Converter and Fire Refining Practices. Edited by A. Roos, T. Warner, and K. Scholey. Pittsburgh: Minerals, Metals and Materials Society. pp. 247–258.
Turton, R., Bailie, R.C., Whiting, W.B., Shaeiwitz, J.A., and Bhattacharyya, D. 2012. Analysis, Synthesis, and Design of Chemical Processes, 4th ed. Upper Saddle River, NJ: Prentice Hall.
Van Scholkwyk, T. 2012. PI applications in Anglo American Platinum: Control loop monitoring and reporting. Presented at the OSIsoft Regional Seminar, Johannesburg, South Africa.
Voermann, N., Gerritsen, T., Candy, I., Stober, F., and Matyas, A. 2004. Developments in furnace technology for ferro-nickel production. Presented at the 10th International Ferroalloys Congress, Cape Town, South Africa.
Weidenbach, M., and Lombardi, J. 2012. Tailing thickener operability and control improvements at Prominent Hill. Presented at the 11th AusIMM Operators’ Conference, Hobart, Tasmania.
100300 ProcessControl.indd 384 5/7/18 6:47 PM