accouting slides
45
CHAPTER CHAPTER 1 Tools for Business Decision-Making Fifth Canadian Edition Financial Accounting: Prepared By: Debbie Musil Kwantlen Polytechnic University Copyright John Wiley & Sons Canada, Ltd. 1 14
-
Upload
bellohales -
Category
Documents
-
view
17 -
download
2
description
Free accounting summary slide for acconting class
Transcript of accouting slides

CHAPTERCHAPTER
1
Tools for Business Decision-Making
Fifth Canadian Edition
Financial Accounting:
Prepared By:Debbie Musil
Kwantlen Polytechnic University
Copyright John Wiley & Sons Canada, Ltd.1 14

CHAPTERCHAPTER
1
CH
AP
TE
R
Performance Measurement
Study Objectives
1. Understand the concept of sustainable income and indicate how irregular items are presented.
2. Explain and apply horizontal analysis.
3. Explain and apply vertical analysis.
4. Identify and calculate ratios that are used to analyze liquidity.
5. Identify and calculate ratios that are used to analyze solvency.
6. Identify and calculate ratios that are used to analyze profitability.
7. Understand the limitations of financial analysis.
14
Copyright John Wiley & Sons Canada, Ltd.2 14

CHAPTERCHAPTER
1Sustainable Income
• The level of profit that is likely to be attainable in the future
• Differs from actual profit due to irregular revenues, expenses, gains and losses that are included in profit
• Two common types of irregular items:– Discontinued operations– Changes in accounting policy
Copyright John Wiley & Sons Canada, Ltd.3 14
CHAPTERCHAPTER
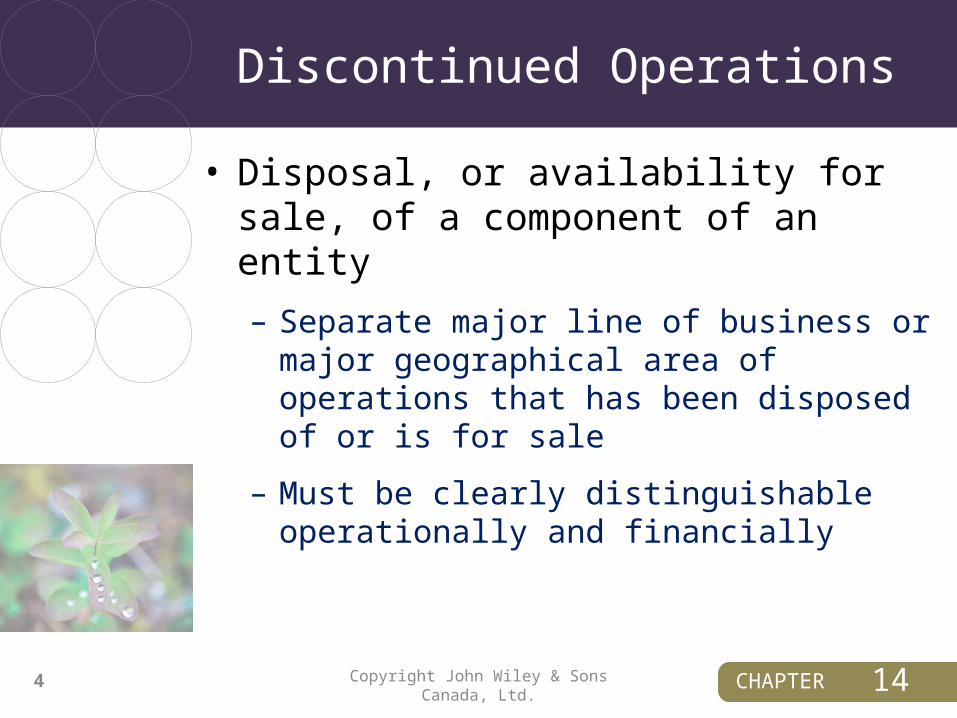
1Discontinued Operations
• Disposal, or availability for sale, of a component of an entity
– Separate major line of business or major geographical area of operations that has been disposed of or is for sale
– Must be clearly distinguishable operationally and financially
Copyright John Wiley & Sons Canada, Ltd.4 14

CHAPTERCHAPTER
1
Discontinued Operations:Statement of Financial Position
• Assets and liabilities are reported separately
• Valued and reported at lower of carrying amount and fair value, less any expected costs of disposition
– Reported as non-current assets or liabilities
Copyright John Wiley & Sons Canada, Ltd.5 14

CHAPTERCHAPTER
1
Discontinued Operations:Income Statement
• Segregated from continuing operations and reported separately on the income statement
– Shown immediately following profit/loss from continuing operations
• Consists of two parts:
– Profit (loss) from discontinued operations
– Gain (loss) on disposal of the segment
– Both components are reported net of applicable taxes
Copyright John Wiley & Sons Canada, Ltd.6 14

CHAPTERCHAPTER
1Change in Accounting Policy
• Occurs when the policy used in the current year is different from the one used in the preceding year
– Voluntary change: Allowed when new policy results in more reliable and relevant presentation
– Mandatory: Required by standard setters
Copyright John Wiley & Sons Canada, Ltd.7 14

CHAPTERCHAPTER
1
Change in Accounting Policy:Effect on Reporting
• Cumulative effect of change to prior years is reported as adjustment to opening retained earnings
– In statement of changes in equity (IFRS)
– In statement of retained earnings (ASPE)
• New policy used to report results of current year
• Prior period statements restated
• Effects of change detailed in notes
Copyright John Wiley & Sons Canada, Ltd.8 14

CHAPTERCHAPTER
1Discussion Question
Discuss the adoption of international financial reporting standards (IFRS) as a change in accounting policy.
Copyright John Wiley & Sons Canada, Ltd.9 14

CHAPTERCHAPTER
1Comparative Analysis
• Three types of comparisons:
– Intracompany basis – comparisons within a company
– Intercompany basis – comparisons between one or more competitor companies
– Industry averages
Copyright John Wiley & Sons Canada, Ltd.10 14

CHAPTERCHAPTER
1
Comparative Analysis:Three Tools
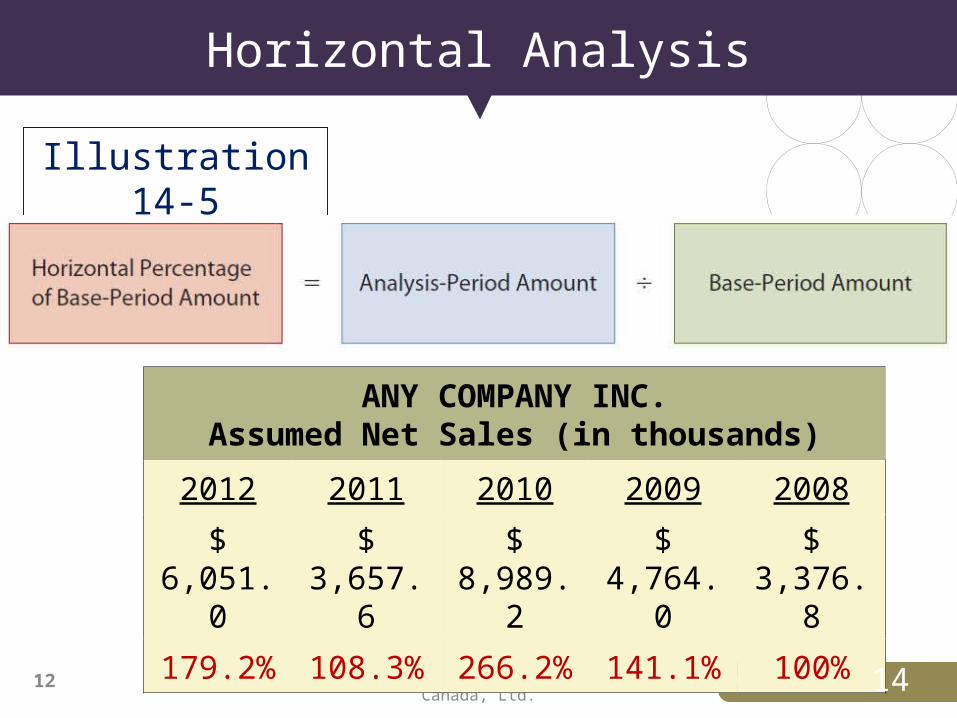
• Horizontal analysis (trend analysis)
– A technique to determine the change over time
• Percentage of base-period amount
• Percentage change for the period
• Vertical analysis (common size analysis)
• Ratio analysis
Copyright John Wiley & Sons Canada, Ltd.11 14
CHAPTER
1
Horizontal Analysis
Copyright John Wiley & Sons Canada, Ltd.12
Illustration 14-5
ANY COMPANY INC.Assumed Net Sales (in thousands)
2012 2011 2010 2009 2008
$ 6,051.0 $ 3,657.6 $ 8,989.2 $ 4,764.0 $ 3,376.8
179.2% 108.3% 266.2% 141.1% 100%
14
CHAPTER
1
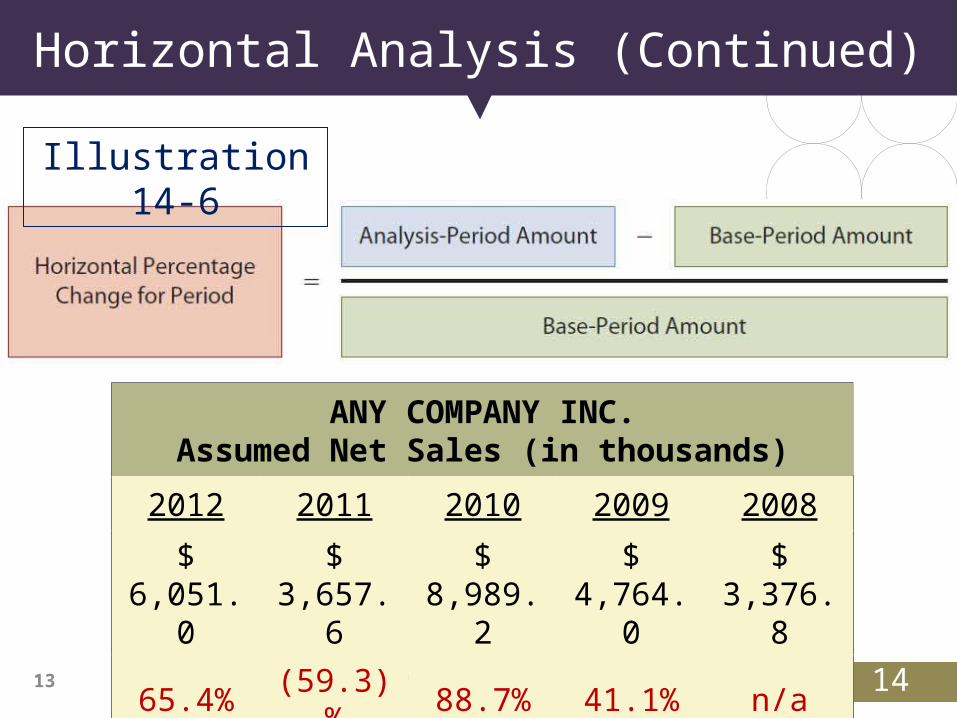
Horizontal Analysis (Continued)
Copyright John Wiley & Sons Canada, Ltd.13 14
ANY COMPANY INC.Assumed Net Sales (in thousands)
2012 2011 2010 2009 2008
$ 6,051.0 $ 3,657.6 $ 8,989.2 $ 4,764.0 $ 3,376.8
65.4% (59.3)% 88.7% 41.1% n/a
Illustration 14-6

CHAPTER
1
Vertical Analysis
Copyright John Wiley & Sons Canada, Ltd.14
Expresses each item in a financial statement as a percent of a base amount (total assets or net sales)
Illustration 14-9
14

CHAPTER
1
Vertical Analysis (Continued)
Copyright John Wiley & Sons Canada, Ltd.15 14
ANY COMPANY INC.Condensed Statement of Financial Position
December 31 (in thousands)
2012 2011
Assets Amount Percent Amount Percent
Current Assets $ 2,139.9 20.3% $ 2,271.7 25.1%
Property, Plant, and Equipment 8,062.7 76.3% 6,413.3 70.9%
Other Assets 363.1 3.4% 359.9 4.0%
Total Assets $ 10,565.7 100% $ 9,044.9 100%

CHAPTERCHAPTER
1Discussion Question
Identify some situations when a horizontal or vertical percentage cannot be calculated or is not meaningful.
Copyright John Wiley & Sons Canada, Ltd.16 14

CHAPTERCHAPTER
1Ratio Analysis
• Liquidity Ratios: Measure short-term ability of the company to pay its maturing obligations and to meet unexpected needs for cash
• Solvency Ratios: Measure the ability of the company to survive over a long period of time
• Profitability Ratios: Measure the earnings or operating success of a company for a given period of time
Copyright John Wiley & Sons Canada, Ltd.17 14

CHAPTERCHAPTER
1Liquidity Ratios
• Working capital
• Current ratio
• Cash current debt coverage
• Receivables turnover
• Average collection period
• Inventory turnover
• Days in inventory
Copyright John Wiley & Sons Canada, Ltd.18 14

CHAPTERCHAPTER
1Working Capital
• Measures short-term debt paying ability
Working Capital = Current Assets – Current Liabilities
Copyright John Wiley & Sons Canada, Ltd.19 14
Higher is better

CHAPTERCHAPTER
1Current Ratio
• Measures short-term debt paying ability
Copyright John Wiley & Sons Canada, Ltd.20 14
Current Ratio = Current Assets Current Liabilities
Higher is normally (but not always) better. Be cautious about influences of slow moving
inventory and receivables on this ratio.

CHAPTERCHAPTER
1Cash Current Debt Coverage
• Measures short-term debt-paying ability (cash basis)
Copyright John Wiley & Sons Canada, Ltd.21 14
Cash Current Debt Coverage =
Cash Provided (Used) by Operating
ActivitiesAverage Current
Liabilities
Higher is better

CHAPTERCHAPTER
1Receivables Turnover
• Measures liquidity of receivables
Copyright John Wiley & Sons Canada, Ltd.22 14
Receivables Turnover =
Net Credit SalesAverage Gross Receivables
Higher is better

CHAPTERCHAPTER
1Average Collection Period
• Measures number of days receivables are outstanding
Copyright John Wiley & Sons Canada, Ltd.23 14
Average Collection
Period =
365 DaysReceivables Turnover
Lower is better

CHAPTERCHAPTER
1Inventory Turnover
• Measures liquidity of inventory
Copyright John Wiley & Sons Canada, Ltd.24 14
Inventory
Turnover =
Cost of Goods SoldAverage Inventory
Higher is better

CHAPTERCHAPTER
1Days in Inventory
• Measures number of days inventory is on hand
Copyright John Wiley & Sons Canada, Ltd.25 14
Days in Inventory =365 Days
Inventory Turnover
Lower is better
CHAPTERCHAPTER
1Solvency Ratios
• Debt to total assets• Times interest earned• Cash total debt coverage• Free cash flow
Copyright John Wiley & Sons Canada, Ltd.26 14

CHAPTERCHAPTER
1Debt to Total Assets Ratio
• Measures % of total assets provided by creditors
Copyright John Wiley & Sons Canada, Ltd.27 14
Debt to Total Assets =Total Liabilities
Total Assets
Lower is better

CHAPTERCHAPTER
1Times Interest Earned
• Measures ability to meet interest payments as they come due
Copyright John Wiley & Sons Canada, Ltd.28 14
Times Interest Earned =
Profit + Interest Expense + Income Tax
Expense (EBIT)Interest Expense
Higher is better

CHAPTERCHAPTER
1Cash Total Debt Coverage
• Measures long-term debt-paying ability (cash basis)
Copyright John Wiley & Sons Canada, Ltd.29 14
Cash Total Debt Coverage =
Cash Provided (Used) by Operating Activities
Average Total Liabilities
Higher is better

CHAPTERCHAPTER
1Free Cash Flow
• Measures cash available for paying dividends or expanding operations
Copyright John Wiley & Sons Canada, Ltd.30 14
Net Cash Provided (Used) by Operating Activities
Net Capital Expenditures Dividends
Paid =Free Cash Flow
Higher is better

CHAPTERCHAPTER
1Profitability Ratios
Copyright John Wiley & Sons Canada, Ltd.31 14
• Return on common shareholders’ equity• Profit margin• Return on assets• Asset turnover• Gross profit margin• Earnings per share (EPS)• Price-earnings (P-E) ratio• Payout ratio• Dividend yield

CHAPTERCHAPTER
1
Return on Common Shareholders’ Equity
• Measures overall profitability of shareholders’ investment
Copyright John Wiley & Sons Canada, Ltd.32 14
Return on Common
Shareholders’ Equity =
Profit – Preferred Dividends
Average Common Shareholders’ Equity*
*Common shareholders’ equity = Total shareholders’ equity – Preferred shares
Higher is better

CHAPTERCHAPTER
1Return on Assets
• Measures overall profitability of assets– How much is earned on each dollar invested in
assets
Copyright John Wiley & Sons Canada, Ltd.33 14
Return on Assets =Profit
Average Total Assets
Higher is better

CHAPTERCHAPTER
1Profit Margin
• Measures the percentage of profit generated by each dollar of sales
Copyright John Wiley & Sons Canada, Ltd.34 14
Profit Margin =Profit
Net Sales
Higher is better

CHAPTERCHAPTER
1Asset Turnover
• Measures how efficiently assets are used to generate sales
Copyright John Wiley & Sons Canada, Ltd.35 14
Asset Turnover =Net Sales
Average Total Assets
Higher is better

CHAPTERCHAPTER
1Gross Profit Margin
• Measures margin between selling price and cost of goods sold
Copyright John Wiley & Sons Canada, Ltd.36 14
Gross Profit Margin =
Gross ProfitNet Sales
Higher is better

CHAPTER
1
Relationship Amongst Profitability Ratios
Copyright John Wiley & Sons Canada, Ltd.37
Illustration 14-15
14

CHAPTERCHAPTER
1Earnings per Share (EPS)
• Measures profit earned on each common share
Copyright John Wiley & Sons Canada, Ltd.38 14
Earnings Per Share =
Profit – Preferred Dividends
Weighted Average Number of Common
Shares
Not comparable between companies

CHAPTERCHAPTER
1Price-Earnings (P-E) Ratio
• Measures relationship between market price per share and earnings per share
Copyright John Wiley & Sons Canada, Ltd.39 14
Price-Earnings Ratio =
Share PriceEarnings Per Share
Higher indicates investors expect favourable profitability in future
CHAPTERCHAPTER
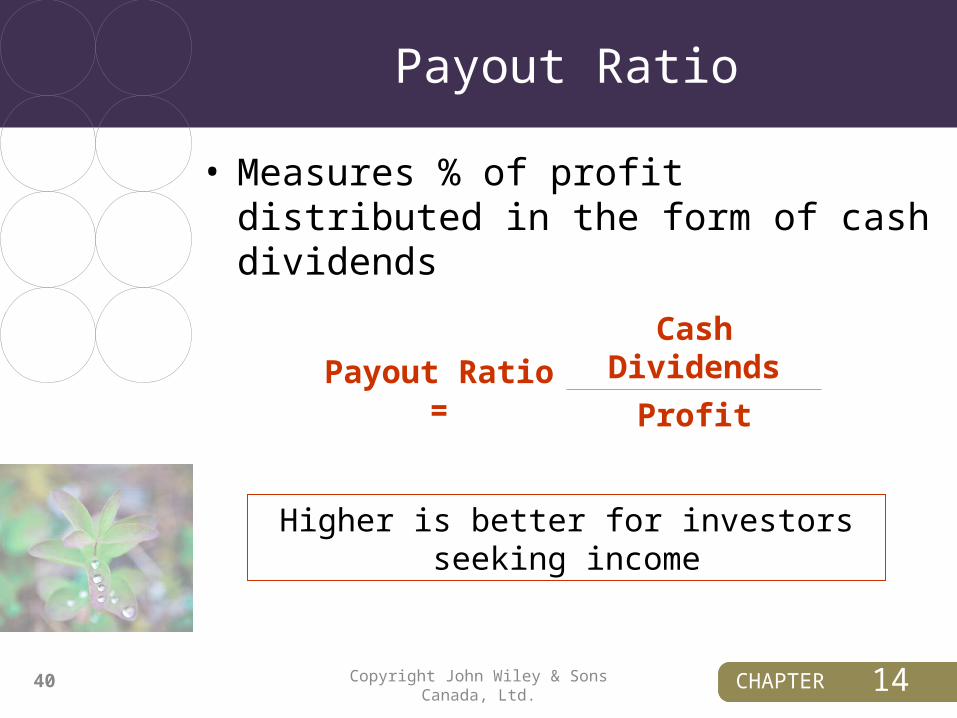
1Payout Ratio
• Measures % of profit distributed in the form of cash dividends
Copyright John Wiley & Sons Canada, Ltd.40 14
Payout Ratio =Cash Dividends
Profit
Higher is better for investors seeking income

CHAPTERCHAPTER
1Dividend Yield
• Measures rate of return earned from dividends during the year
Copyright John Wiley & Sons Canada, Ltd.41 14
Dividend Yield =Dividend per Share
Market Price per Share
Higher is better for investors seeking income

CHAPTERCHAPTER
1Discussion Question
Why are the P-E and dividend yield ratios known as market measures?
Copyright John Wiley & Sons Canada, Ltd.42 14

CHAPTERCHAPTER
1Limitations of Financial Analysis
• Can be impacted by– Alternative accounting principles– Professional judgement– Comprehensive income– Diversification – Inflation– Economic factors
Copyright John Wiley & Sons Canada, Ltd.43 14

CHAPTER
1
Comparing IFRS and ASPE
14

CHAPTERCHAPTER
1Copyright Notice
Copyright © 2012 John Wiley & Sons Canada, Ltd. All rights reserved. Reproduction or translation of this work beyond that permitted by Access Copyright (The Canadian Copyright Licensing Agency) is unlawful. Requests for further information should be addressed to the Permissions Department, John Wiley & Sons Canada, Ltd. The purchaser may make back-up copies for his or her own use only and not for distribution or resale. The author and the publisher assume no responsibility for errors, omissions, or damages caused by the use of these programs or from the use of the information contained herein.
Copyright John Wiley & Sons Canada, Ltd.45 14