ABSTRACT Title of Thesis : THE EFFECTS OF INTERACTIVE ...
81
ABSTRACT Title of Thesis: THE EFFECTS OF INTERACTIVE PEDAGOGY DURING THE NINTH GRADE ON HIGH SCHOOL DROPOUT Christopher Boccanfuso, Master of Arts, 2005 Directed By: Dr. Steven Martin, Department of Sociology This paper tests existing educational theory regarding the effectiveness of interactive pedagogy in order to determine the predictive ability of interactive pedagogy during ninth grade math and English classes towards graduation. This is done using a mixed methods approach which examines correlations between student teacher interaction and dropout through logistic regression models using data from the Philadelphia Educational Longitudinal Study (PELS), and qualitatively links interactive methods examined in the quantitative section (and some not examined) to pedagogy the sample of Philadelphia ninth-grade students find effective. Quantitative results provide strong evidence that low student-teacher interaction predicts a higher probability of dropout, as well as make suggestive connections between interactive methods and graduation. The qualitative results link both the non-interactive methods as part of the “pedagogy of poverty” and in- class discussion to pedagogy which students find effective in creating attachment to school, confirming the quantitative findings. Implications for educational theory are discussed.
Transcript of ABSTRACT Title of Thesis : THE EFFECTS OF INTERACTIVE ...
ABSTRACT
Title of Thesis: THE EFFECTS OF INTERACTIVE PEDAGOGY DURING THE NINTH GRADE ON HIGH SCHOOL DROPOUT
Christopher Boccanfuso, Master of Arts, 2005
Directed By: Dr. Steven Martin, Department of Sociology
This paper tests existing educational theory regarding the effectiveness of interactive
pedagogy in order to determine the predictive ability of interactive pedagogy during ninth
grade math and English classes towards graduation. This is done using a mixed methods
approach which examines correlations between student teacher interaction and dropout
through logistic regression models using data from the Philadelphia Educational
Longitudinal Study (PELS), and qualitatively links interactive methods examined in the
quantitative section (and some not examined) to pedagogy the sample of Philadelphia
ninth-grade students find effective. Quantitative results provide strong evidence that low
student-teacher interaction predicts a higher probability of dropout, as well as make
suggestive connections between interactive methods and graduation. The qualitative
results link both the non-interactive methods as part of the “pedagogy of poverty” and in-
class discussion to pedagogy which students find effective in creating attachment to
school, confirming the quantitative findings. Implications for educational theory are
discussed.
THE EFFECTS OF INTERACTIVE PEDAGOGY DURING THE NINTH GRADE ON
HIGH SCHOOL DROPOUT
By
Christopher Boccanfuso
Thesis submitted to the faculty of the Graduate School of the University of Maryland, College Park in partial fulfillment
of the requirements for the degree of Master of Arts
2005
Advisory Committee:Dr. Steven P. Martin, ChairDr. Laura MamoDr. Dae Young Kim
ii
Acknowledgements
I would like to take the opportunity to thank several people, without whom this
project would not be possible. First and foremost, I would like to thank Drs. Lory J.
Dance, Steven Martin, Laura Mamo, Dae Young Kim and Reeve Vanneman from the
University of Maryland for their effort and insight. I also would like to thank Dr. Ruth
Neild, Dr. Frank Furstenberg, Patricia Miller, Emily West and the rest of the “Frank
Tank” for their assistance on my trips to the University of Pennsylvania. Finally I would
also like to thank Dr. Jim Ayrer and the entire Philadelphia School District Research
Review Committee for their cooperation in allowing me to access school district records.
iii
Table of Contents
IntroductionThe Problem 1The Effects of Pedagogy 3
BackgroundThe “Pedagogy of Poverty” 5The Benefits of Interactive Pedagogy 6Critical Thinking Pedagogy 8Pedagogy of Care 9Culturally Relative Pedagogy 10Why is the Ninth Grade Transition Critical? 13Academic Resilience 15External Factors Contributing to Dropout 16What Exactly does At-Risk Mean? 17Limitations of Past Research 18
Hypotheses 20
Research DesignQuantitative Data 21Sample Size 23Dependent Variables 25Student-Teacher Interaction Variables 26Other Explanatory Variables 29Quantitative Methods 30Qualitative Data 31Qualitative Methods 34
Quantitative ResultsInitial Evidence 36Regression Analyses 38Validity and Reliability 43Supplemental Math Regression Analyses 44
Qualitative ResultsTeachers as an Influence in Dropout: Student Perspectives 49Critical Thinking 50Effect and Perceptions of Caring 52The Consequences of a Perceived Lack of Care 55“Throwing a Joke” 58
Conclusions 59Appendices 64Bibliography 72
1
Introduction
The Problem
What are the contributing factors of high school dropout among at-risk urban
students? Numerous indicators show that high school dropout rates are at or approaching
crisis levels in several major urban centers. In cities such as Chicago and Philadelphia,
graduating classes are only thirty to forty percent of the size of incoming freshmen
classes. New York, Chicago, Philadelphia, Baltimore and Detroit all reported dropout
rates of around thirty percent in 2001. These statistics indicate that many thousands of
urban children leave high school prior to completion yearly, given that there are hundreds
of thousands of students within urban school systems (Neild 2002b)1. In addition, the
high standards imposed by the “No Child Left Behind” act are increasing pressure on
schools to find ways to improve learning environments and more importantly raise
academic standards while reducing dropout rates (Lee 2003).
Scholars have identified numerous internal-to-school factors that can negatively
influence graduation rates among at-risk urban youth. These factors include teacher
shortages (Howard 2003), a lack of fully certified teachers, large class size, (Neild
2002c), a lack of school funding (Parker, et al 1998), the mismatch of high standards and
high stakes testing imposed by “No Child Left Behind” (Lee 2003), and the physical
decaying of school facilities (Rose 1995).
Research has suggested that external to school and the previously mentioned
internal to school factors do not fully account for the dropout rate among this group.
1 In the interest of succinctness I have chosen to omit a section dealing with the consequences of high school dropout. However this has been shown to have significant effects individually and on a macro-level. Dropouts are more likely to be unemployed, have lower earnings trajectories than those with higher
2
Despite external to school obstacles to learning, thousands of at-risk students graduate2
every year. Wang, Haertel and Wahlberg’s (1993) study concluded that school policy,
the school’s demographic makeup, peer support and school size affected students’
academic achievement indirectly. Factors in dropout such as class size, high stakes
testing, and funding would logically have detrimental effects on the quality and type of
pedagogy (defined as an instructor’s teaching philosophy) within classrooms. Classroom
instruction was characterized as a key component of student learning, specifically
classroom instruction considered interactive either in an academic or social sense.
Furthermore, ethnographic studies have linked highly interactive pedagogies to levels of
student engagement in high school (Howard 2002, Dance 2002). However, few if any
quantitative studies have connected interactive pedagogy specifically to high school
dropout, for reasons I will discuss in the following section.
This study fills a gap in knowledge about high school dropout among youth in
high dropout schools by examining the effect of pedagogy on high school dropout. This
will be measured through quantitatively examining methods that correlate to dropout or
graduation, and qualitatively connecting these methods to specific pedagogies that
students find effective or ineffective. The vast majority of the student’s day in school is
spent in the classroom. Therefore it stands to reason that the teacher has an integral role
in shaping the experience of the student in school, and pedagogy thus becomes a focal
point in examining dropout.
education, and are increasingly more sensitive to economic conditions than more skilled workers. This trend is becoming more and more apparent with the bifurcation or our economy (BLS 2000, Boesel 1998).2 By graduation, in this paper, I specifically refer to uninterrupted graduation. Dropout also refers to students who drop out of high school but return later to obtain their GED. Research has shown that uninterrupted high school graduation is important in the sense of earning trajectories. GED holders make significantly less throughout the life course (around 12%) than high school graduates on average (BLS 2000, Boesel 1998).
3
The Effects of Pedagogy
The connection between pedagogy and dropout rates has been difficult to verify
quantitatively. It is difficult to create a set of survey questions that can accurately
encompass a single pedagogy. Furthermore, teachers may feel constrained in their
teaching methods by a lack of teaching materials or large class size3. Finally, the style of
each teacher varies, making the effect of a single teacher on a student problematic to
discern. Due in part to these potential roadblocks, I was unable to uncover any
quantitative attempts to specifically link pedagogy to dropout. There have been several
qualitative works which have provided in-depth examinations of the effects of pedagogy
on attachment to school. These studies are vitally important to examining the processes
of attachment and distancing from school. However, quantitative studies supplementing
these important findings are necessary as well to examine the breath as well as the depth
of this issue.
Studies over the prior decade have indicated that the transition year to high school
may be an important place to look for quantitative evidence of a link between pedagogy
and dropout. This recent emphasis on the transition year to high school was based upon
Melissa Roderick’s (1993) The Path to Dropping Out. Roderick examines the effect that
retention in the transition year to high school (ninth grade in most school districts) has on
the young student. She finds that a poor ninth grade experience, and particularly ninth
grade retention has an extremely detrimental effect on future high school graduation. If
failing ninth grade has a profound impact on the rest of the student’s academic career,
3 As I will explain later, the teacher has an important part in the student’s school experience, but this is far from the only factor of school experience for the student. This paper is not an attempt to lay sole blame on teachers, many of whom perform extraordinarily well under adverse conditions in high dropout schools.
4
pedagogy during this period might also have a particularly important effect on future
dropout outcomes.
This study merges the bodies of literature regarding the importance of interactive
pedagogy and the importance of the transition year to high school by quantitatively by
examining the correlations between interactive (and non-interactive) methods within one
of the most fundamental courses of the ninth grade, English, and dropout through several
regression models, with supplemental models examining math class4 included as well.
This qualitative phase of this study then connects these interactive and non-interactive
methods (which presumably will have a predictive effect on dropout) with specific
pedagogies through interviews with at-risk high school students in order to examine
which specific pedagogies (which include but are not limited to teaching methods) are
most effective in preventing dropout. The qualitative phase will also allow us to examine
pedagogy that does not correlate to any teaching methods variables from the quantitative
phase, but is important nonetheless in predicting dropout according to the students. I
believe pedagogy that emphases critical thinking, caring, and a sense of cultural relativity
will be most effective in predicting student self-reports of attach. These pedagogies have
a key element: student-teacher interaction.
While teachers may feel constrained in their pedagogy, it is the researcher’s job to examine the reality of pedagogy in at-risk schools, regardless of teacher feelings of constraint, as a predictor of dropout.
5
Background
The “Pedagogy of Poverty”
Several studies have shown that schools serving impoverished areas often focus
less on higher order thinking skills and more on remediation and repetition. The
emphasis in many schools is on basic skill levels, and in doing so, this has lowered
teacher expectations and created a less challenging curriculum (Waxman & Padron
1995). Students are often times treated as “empty vessels”, treated as cognitively and
linguistically remedial, or taught from a “deficit model”, where remedial skills are
emphasized (Lee 2003, Resnick and Hall 1998). Schools in impoverished areas often
employ instructional styles that do not encourage interaction; Haberman (1992) calls this
the “pedagogy of poverty”. The pedagogy prevalent in many schools in impoverished
areas is taken from the direct instructional model. Under this model, the teacher is
responsible for “making” the student learn. Knowledge is the sole property of the
teacher, the distributor of knowledge to the students, who are addressed as a whole, not as
individuals. The direct instructional model emphasizes lecture, drill and practice, and
instruments such as worksheets which rely on repetition. This also may include other
types of repetitive or non-interactive “busy work” such as doing homework in class.
According to Haberman, this style leads to passive resentment and compliance on the part
of the student, as well as teacher burnout. This also causes a lack of motivation on the
part of the student (Haberman 1992, Waxman & Padron 1995). Unfortunately, this style
of instruction is also prevalent in part due to high stakes testing, and the increasing
4 In the school district I examine, block scheduling is required for almost all ninth graders, meaning that math and English may make up half of most 9th graders’ school day.
6
pressure teacher are put under to “teach to the test”, which precludes abstract thinking
endemic to interactive pedagogy.
Studies have shown the direct instructional pedagogy, which typifies Haberman’s
“pedagogy of poverty” to be prevalent in many urban school districts. One study of a high
dropout urban school district in the southern United States found that whole-class instruction
(i.e. lecturing or doing in-class assigned work) was implemented eighty percent of the time.
Other teaching methods related to a more interactive pedagogy, such as encouraging
extended responses from the student, demonstrating, and cueing/prompting students for
responses happened less than ten percent of the class time (Waxman et al. 1994). These
styles of direct instruction are prevalent in high-dropout districts from the time the student
enters school, as Waxman & Padron (1994) found that higher order thinking skills were
encouraged less than ten percent of the time in K-8 math and science classrooms in one high-
dropout district.
The Benefits of Interactive Pedagogy
Several theorists, most notably the late Paulo Friere (1970), have condemned the
“banking” concept of teaching, where the teacher is the distributor of knowledge and the
child is the unquestioning recipient of knowledge. Instead of treating the minds of young
students like storehouses to be filled with information, an approach Friere characterizes
as dehumanizing, Friere instead called on the dialogical. The dialogical, to Friere, is
interactive, problem-posing education that avoids treating the student as isolated,
alienated and abstract beings (having little interaction with students or the teacher in the
classroom, with all teacher interaction being of an authoritative nature). According to
Friere, students fulfill their vocation as human beings and obtain true knowledge through
7
dialogue with the teacher, experience and challenging assumptions instead of simply
being told what constitutes knowledge. Friere intends this as a means of liberation, as the
dialogical allows underprivileged students to question the nature of their surroundings
and challenge the group to which they are subordinate. Within this framework, there is
no such thing as students and teachers, rather teacher-students and student-teachers, a
term I adapt to my own research (Friere 1970).
This idea of experience and interaction producing knowledge is related to John
Dewey’s philosophical works on constructivist education during the early 20th century.
Dewey was the forerunner of calling upon experience as an important teaching tool in
order to encourage thinking on a conceptual, symbolic level (Vanderstraeten 2002).
Interactive instruction is more practically useful for the student, as higher- order
thinking skills such as abstraction or critical thinking are often presented through
increased interaction. These types of skills are necessary within most college classrooms
or skill oriented occupations. This type of interaction also situates schooling in a context
more relevant to the lives of students, giving them motivation to succeed, making school
feel less “useless”, and also creating a less mundane atmosphere for the learner. In a
human capital sense, interactive pedagogy also allows the student to internalize the
concept of learning. This style of teaching also prepares students for social roles by
emphasizing social and academic responsibility through being more active participants in
curriculum development5 (Waxman & Padron 1995).
5 Darder also found that increased student involvement in curriculum development is an effective strategy using critical thinking. In this particular method, the teacher uses a dialogue of critical thinking between teacher and students to create new activities based on issues students find challenging or interesting in their own words.
8
For the teacher, an interactive pedagogy also holds benefits. Not only does this
help prevent teacher burnout, but a more interactive, learner-centered approach also
allows the teacher to understand the social and cultural milieux of their students, creating
more effective dialogue between the student and teacher (Waxman & Padron 1995). In
addition, Darder (1993) found that teachers who engaged in increased interaction with
their students were more likely to recognize and address the academic and social needs of
their students. A greater understanding of the student is an important goal for pedagogy,
and can facilitate the development of an attachment to high school within the student.
Few published studies have directly linked interactive pedagogy with higher
graduation rates, but several case studies have shown that teachers and students judge
such pedagogical styles to be effective (Howard 2003, Wang, et al 1993, Ball 2000, Rose
1995). James Comer is one of few researchers who have extensively and specifically
studied teachers and pedagogy as correlates of student performance and dropout in high
dropout schools. Comer has suggested that an approach which develops the at-risk
student cognitively and emotionally through curriculum which the student can internalize
and relate to their life is most effective in creating a solid student whose attachment to
school will prevent dropout (Comer and Maholmes 1999).
Critical Thinking Pedagogy
A key aspect of critical thinking pedagogy, also referred to as constructivist
pedagogy, is the assumption that students are intelligent, motivated learners who should
be challenged through high standards. Constructivist pedagogy emphasizes a student-
centered approach and “authentic projects” in which the student’s base of knowledge is
consistently challenged and supplemented through active student efforts as opposed to
9
passively receiving knowledge. “Authentic projects” encourage students to find solutions
which are not readily apparent, explain concepts, justify their reasoning, seek
explanations and provide extended answers. This model encourages student-teacher
interaction through implementation of high standards and rigorous investigation of
knowledge by student and teacher (Lee 2003, Gutstein 2003). This sort of investigation
of knowledge and emphasis on active, experience-based instruction has been linked to
effective student learning (Wang, et al 1993, Comer and Maholmes 1999).
There have been several qualitative case studies which examine effective
pedagogies which incorporate critical thinking. This may take the form of emphasizing
the power of choice, consciousness raising discourse, and challenging students towards
agency. Teachers who encourage their students to question their teachings, question the
world around them and seek agency will be more effective. This process also allows for
students to make subjects like math and English culturally relative, as the material and
student-teacher interaction empower students to critically examine their own everyday
lives and social constraints (Ball 2000, Gutstein 2003). Several good examples of this
come from Rose’s qualitative study of a Chicago classroom in Possible Lives, such a s
students critically analyzing the theme and content of As I Lay Dying (Ball 2000, Rose
1995). Again, a critical relation of curriculum and everyday student life fosters
attachment to school (Waxman & Padron 1995).
Pedagogy of Care
While some pedagogy relies explicitly on interaction for creating skills, others
such as caring pedagogy rely on interaction between student and teacher to instill a sense
of morality or a sense of being cared for within the student. Caring pedagogy, most
10
notably put forth by Nel Noddings (1995, 2002), has several aspects. Caring pedagogy
creates a home-like, caring, environment where there is both a familial sense of
obligation, but more importantly of reciprocal interaction, meaning that the student and
teacher are both open and honest about their life experiences, as a family member or
friend would be to another. Noddings also emphasizes an interdisciplinary curriculum
based on a holistic education; an education in which growth personally, academically,
morally and emotionally is emphasized throughout all subjects. Through caring
pedagogy, the student can seek more holistic personal development and discover topics
of interest outside of the highly competitive structures of schools currently in place
(Noddings 2002 & 1995, Stanford 1997). While not an explicit goal6, high school
retention is an implicit goal, as the student ideally becomes a more moral, caring and
well-rounded person who develops a sense of responsibility as a student.
Wang, et al’s “Toward a Knowledge Base for School Learning” also contributes
to the idea of caring interaction, characterizing frequent social interactions (as opposed to
academic interactions) as positive in student learning. These interactions seem to foster
student self-esteem and take the form of establishing an atmosphere of comfort and
membership for the student through praise and extensive feedback. This type of
interaction also takes the form of dissuading students from disruptive behavior (Wang, et
al 1993).
Culturally Relative Pedagogy
A culturally relative pedagogy is another interactive pedagogy which may benefit
at-risk students. This pedagogy may take the form of using rap lyrics (Paul 2000),
6 Noddings intends this pedagogy for all classrooms, as she believes this style of instruction will create more well-rounded students. She does not distinguish between classrooms in high and low dropout areas.
11
“Ebonics” or “Black English Vernacular” (BEV) in the case of African-American
students, bilingual education in the case of first generation immigrant students, using oral
rather than written expression, or relating classics from periods not tangible to students to
a more familiar setting. For example one teacher created a “rap” version of Homer’s
Odysseus (Howard 2001). This can also be manifested through more direct methods of
communication and including more culturally relevant casual conversation within class.
By more direct communication, I mean that students are given instructions or reprimands
in a very literal way, as opposed to indirect methods of communication which are
common in many classrooms. For example, if a student is talking during class time, a
teacher utilizing indirect communication may stop the class to say that “good boys and
girls don’t talk during class”, whereas a teacher using direct communication will call the
student by name and order him or her to stop talking, in an attempt to mirror forms of
communication which are more prevalent in the home (Ball 2000, Delpit 1996, Howard
2001).
Again, a culturally relative pedagogy is often linked to critical thinking pedagogy.
In essence, a culturally relative approach uses students’ cultural capital to their
advantage. Through culturally relative pedagogy the teacher conveys a shared sense of
standpoint, for whatever culture is prevalent in the classroom. While I recognize there is
no such thing as a shared experience for every member of a group (culture itself can be a
tenuous term), it may be more helpful to understand this pedagogy through
approximating a culture that many members of a classroom may be familiar with. When
this standpoint as part of a disadvantaged group(s) is conveyed and internalized, we may
12
examine this type of education as conducive to critical thinking as students critically
examine their standpoint (Collins 1998).
At the same time, other researchers such as Lisa Delpit (1996) have also
examined the dangers of using exclusively a curriculum based on the student’s cultural
capital. If, through using a culturally relative curriculum, the student is not exposed to
certain types of knowledge which they will need at higher levels of education where this
curriculum is not enforced, this culturally relative curriculum may act as a sort of gate
keeping force, denying students the type of knowledge needed to access certain levels of
higher education (Delpit 1996).
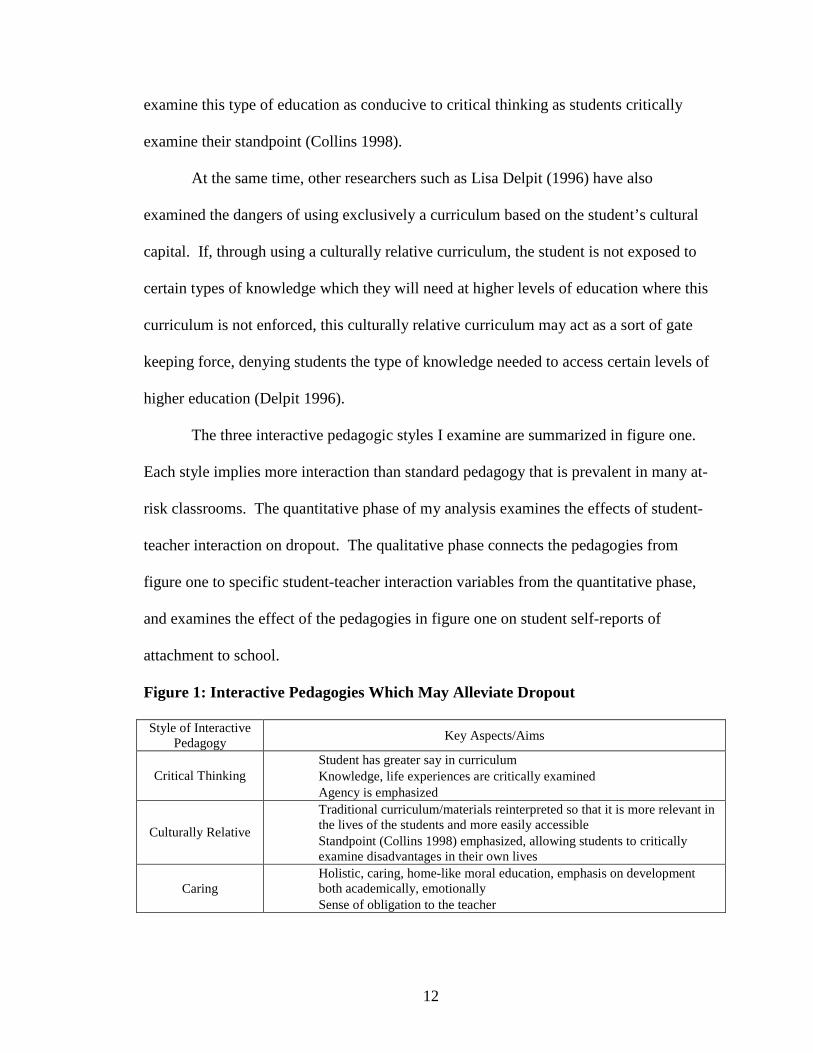
The three interactive pedagogic styles I examine are summarized in figure one.
Each style implies more interaction than standard pedagogy that is prevalent in many at-
risk classrooms. The quantitative phase of my analysis examines the effects of student-
teacher interaction on dropout. The qualitative phase connects the pedagogies from
figure one to specific student-teacher interaction variables from the quantitative phase,
and examines the effect of the pedagogies in figure one on student self-reports of
attachment to school.
Figure 1: Interactive Pedagogies Which May Alleviate Dropout
Style of Interactive Pedagogy
Key Aspects/Aims
Critical Thinking• Student has greater say in curriculum• Knowledge, life experiences are critically examined• Agency is emphasized
Culturally Relative
• Traditional curriculum/materials reinterpreted so that it is more relevant in the lives of the students and more easily accessible
• Standpoint (Collins 1998) emphasized, allowing students to critically examine disadvantages in their own lives
Caring• Holistic, caring, home-like moral education, emphasis on development
both academically, emotionally• Sense of obligation to the teacher
13
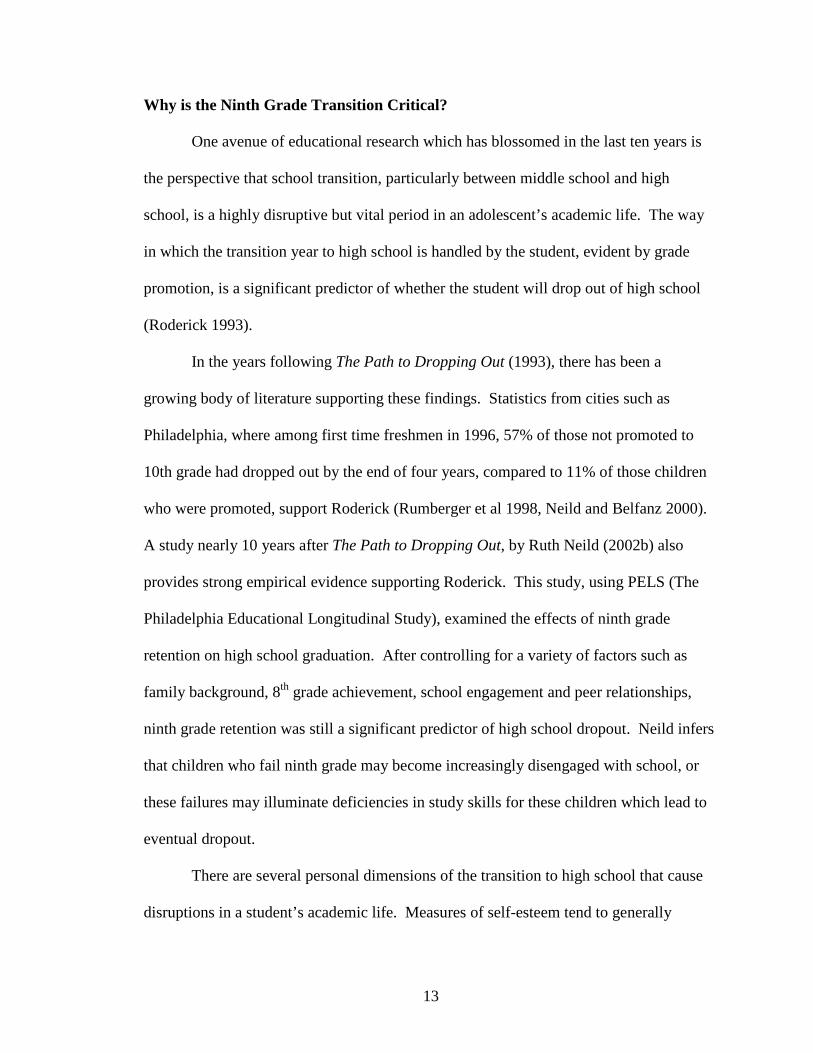
Why is the Ninth Grade Transition Critical?
One avenue of educational research which has blossomed in the last ten years is
the perspective that school transition, particularly between middle school and high
school, is a highly disruptive but vital period in an adolescent’s academic life. The way
in which the transition year to high school is handled by the student, evident by grade
promotion, is a significant predictor of whether the student will drop out of high school
(Roderick 1993).
In the years following The Path to Dropping Out (1993), there has been a
growing body of literature supporting these findings. Statistics from cities such as
Philadelphia, where among first time freshmen in 1996, 57% of those not promoted to
10th grade had dropped out by the end of four years, compared to 11% of those children
who were promoted, support Roderick (Rumberger et al 1998, Neild and Belfanz 2000).
A study nearly 10 years after The Path to Dropping Out, by Ruth Neild (2002b) also
provides strong empirical evidence supporting Roderick. This study, using PELS (The
Philadelphia Educational Longitudinal Study), examined the effects of ninth grade
retention on high school graduation. After controlling for a variety of factors such as
family background, 8th grade achievement, school engagement and peer relationships,
ninth grade retention was still a significant predictor of high school dropout. Neild infers
that children who fail ninth grade may become increasingly disengaged with school, or
these failures may illuminate deficiencies in study skills for these children which lead to
eventual dropout.
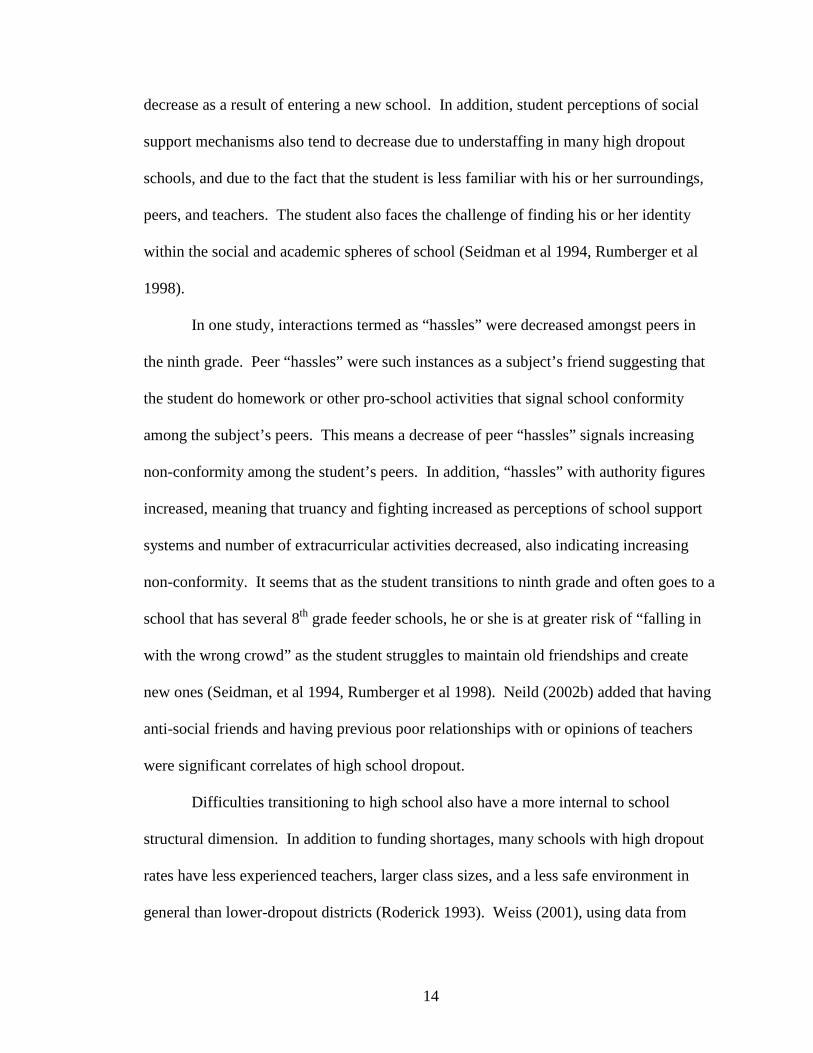
There are several personal dimensions of the transition to high school that cause
disruptions in a student’s academic life. Measures of self-esteem tend to generally
14
decrease as a result of entering a new school. In addition, student perceptions of social
support mechanisms also tend to decrease due to understaffing in many high dropout
schools, and due to the fact that the student is less familiar with his or her surroundings,
peers, and teachers. The student also faces the challenge of finding his or her identity
within the social and academic spheres of school (Seidman et al 1994, Rumberger et al
1998).
In one study, interactions termed as “hassles” were decreased amongst peers in
the ninth grade. Peer “hassles” were such instances as a subject’s friend suggesting that
the student do homework or other pro-school activities that signal school conformity
among the subject’s peers. This means a decrease of peer “hassles” signals increasing
non-conformity among the student’s peers. In addition, “hassles” with authority figures
increased, meaning that truancy and fighting increased as perceptions of school support
systems and number of extracurricular activities decreased, also indicating increasing
non-conformity. It seems that as the student transitions to ninth grade and often goes to a
school that has several 8th grade feeder schools, he or she is at greater risk of “falling in
with the wrong crowd” as the student struggles to maintain old friendships and create
new ones (Seidman, et al 1994, Rumberger et al 1998). Neild (2002b) added that having
anti-social friends and having previous poor relationships with or opinions of teachers
were significant correlates of high school dropout.
Difficulties transitioning to high school also have a more internal to school
structural dimension. In addition to funding shortages, many schools with high dropout
rates have less experienced teachers, larger class sizes, and a less safe environment in
general than lower-dropout districts (Roderick 1993). Weiss (2001), using data from
15
PELS, added to the transition period literature by examining what he deemed
“turbulence” in a student’s ninth grade year. Turbulence was defined as experiencing a
switch in class schedule or teacher within a class, not having sufficient textbooks, or not
having sufficient seats for a class during the initial two months of the ninth grade year.
These four measures of turbulence are all endemic to many schools with high dropout
rates. Weiss found that while there was significant resilience to turbulence if this
occurred three times or less during the first months of the year, as incidences of
turbulence increased beyond three there were significant negative effects on the student’s
GPA (Weiss 2001). Neild also added that perceptions of safety in a new school also are a
correlate of high school completion, as students who perceive school as unsafe are more
likely to be retained in ninth grade (Neild 2002b). These are just a few of the factors that
place the student in a situation with fewer support systems in place should they struggle
academically in ninth grade.
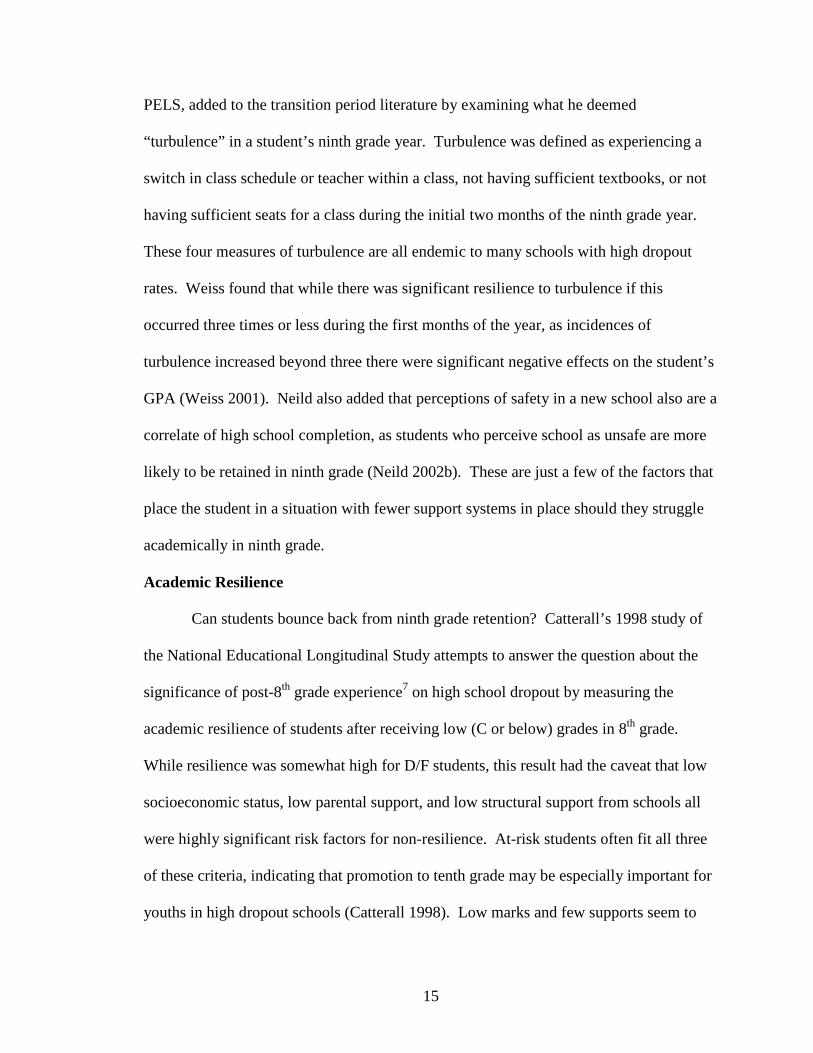
Academic Resilience
Can students bounce back from ninth grade retention? Catterall’s 1998 study of
the National Educational Longitudinal Study attempts to answer the question about the
significance of post-8th grade experience7 on high school dropout by measuring the
academic resilience of students after receiving low (C or below) grades in 8th grade.
While resilience was somewhat high for D/F students, this result had the caveat that low
socioeconomic status, low parental support, and low structural support from schools all
were highly significant risk factors for non-resilience. At-risk students often fit all three
of these criteria, indicating that promotion to tenth grade may be especially important for
youths in high dropout schools (Catterall 1998). Low marks and few supports seem to
16
discourage students and facilitate disengagement from school as the student progresses
beyond the first year of ninth grade (Neild 2002b).
Overall, this body of research on ninth grade transition makes a compelling
argument for the importance of this transition year to high school in predicting future
outcomes. There are several factors of transition referred to within this body of literature,
most of which look at daily in-school experiences of the ninth grade student and their
effects on dropout. This study adds to previous research by examining pedagogy during
the transition year to high school (ninth grade in this study) as a potential determining
factor in high school dropout, combining the literature on interactive pedagogy and ninth
grade transition.
External Factors Contributing to Dropout
Scholars have answered the question of why school high school dropout rates in
impoverished districts are so high in several ways, not only examining internal factors,
but factors external to school as well. While the focus of this project is to determine the
effects of pedagogy on dropout, it is important to account for the fact that some students
bring situations into the classroom that impede learning, such as poor parental support
with schoolwork, or crippling poverty. The lack of income tax revenue in low-income
districts that causes some public schools to undersupply their teachers and facilities
constitutes a likely correlate of dropout as well, but is not addressed in this analysis.
Scholars such as William Julius Wilson (1987) and Massey and Denton (1993)
have looked at structural inequalities that have brought about a lack of community
resources and an urban “underclass”. This underclass is characterized by such social
maladies as single parenthood, gang/criminal activity, liquor/drug consumption, and
7 Few if any widely published studies such specifically examine post-9th grade experience.
17
inadequate living conditions. These difficulties affect the student’s ability to perform in
school and their resilience to grade retention in secondary school in several possible
ways, such as poor dieting which leads to sickness, time missed due to lack of
appropriate clothes or transportation, or lack of concentration within class due to poor
diet or chemical exposure due to poor living conditions (Catterall 1998, Parker, et al
2003). This also affects the degree and type of parental involvement in schoolwork or
school decisions. Parental involvement in and knowledge of the daily activities of their
child, and especially the academic life of the child, are also a strong correlate of school
performance. Single parents have a greater challenge in providing this sort of necessary
involvement. (Wang, et al 1993, Neild and Belfanz 2000, Neild 2002a). Ensminger and
Slusarcick’s (1991) research also demonstrated that poor parental financial resources and
less time spent helping children with schoolwork translates into a decreased chance of
high school completion.
What Exactly does At-Risk Mean?
The term “at-risk” is widely used in educational literature to describe children
who are in danger of dropping out of high school. Looking more deeply into this label,
the question becomes, who is “at risk”, and what factors characterize the “at-risk”
student? This term is ambiguous, and has been used in several manners, most of which
refer to particular actions, such as gang and criminal involvement, or to particular family
situations, such as being the child of a single parent, that put the child in a position where
they are more likely statistically to drop out. Many such studies focus on urban areas and
focus broadly on urban youths. Researchers must take extra care to not attribute a
classification such as “at-risk” to socially constructed classifications such as these. The
18
term “at-risk” has the potential to become a euphemism for “black”, “poor”, or “ghetto”.
In addition, the labeling of such a group as at-risk has shown to have damaging
consequences on the self-esteem of the labeled group, as well as negatively affect the
amount of positive teacher-student interaction these students receive in some cases (Nunn
& Parish 1992, Walker et al 1998, Ronda & Valencia 1994).
My definition of at-risk follows in line with the definition of at-risk given in
Waxman and Padron’s 1995 article “Improving the Quality of Classroom Instruction for
Students At-Risk of Failure in Urban Schools”, as I wish to problematize non-interactive
“pedagogies of poverty”. I define at-risk students to be those students who are exposed
to a non-interactive pedagogic system on a consistent, daily basis. I do not attribute at-
risk status to a personal attribute of the student, instead attributing it to pedagogy in the
school in which the child is enrolled in addition to enrollment in a school district with a
high (over 30%) dropout rate.
The data made available to me for this study focuses on inner city youths. While
this is certainly a fruitful place to begin my inquiry given the prevalence of the
“pedagogy of poverty” in many low-income urban schools, I want to stress that an urban
population is by no means the only population that may be characterized as “at-risk”.
Limitations of Past Research
Prior case studies of pedagogy have not focused exclusively on high school,
instead focusing on both elementary and middle school, only elementary school, or
alternative types of learning, such as community-sponsored job training. Also, the
literature that examines pedagogy has primarily used qualitative methods looking only at
a single teacher and that teacher’s students (Howard 2001, 2002, Rose 1995, Ball 2000,
19
Gutstein 2003). Such studies provide essential in-depth examinations of pedagogy and
its immediate effects on the student. However, qualitative methods are less adequate to
examine the long-term effects of pedagogy to a larger population without quantitative
methods to supplement these findings, examining both the breadth and the depth of this
issue. In the studies (outside of Neild (2002b), who used PELS but did not exclusively
examine pedagogy) I’ve examined on highly interactive pedagogy, positive outcomes
have been characterized by student, teacher or parent satisfaction and at times marks in
the specific grade the “star” teacher(s) taught in, rather than future academic outcomes8.
Margaret Wang (et al)’s 1993 study comes close to approximating the relationship
between pedagogy and dropout, however this study examines interactions in general, not
specific pedagogy, and examines the outcome of student learning, a correlate of
graduation.
This research represents an important step towards understanding the connection
between student-teacher interaction, pedagogy and dropout because of the mixed
methods I employ. The quantitative phase of this project examines the effects of methods
involving high or low student-teacher interaction (STI) in ninth grade on dropout. This
allows me to gather evidence that STI is a predictor of dropout/graduation. This lays the
foundation for a later connection through the qualitative section of the teaching methods
examined in the quantitative section with interactive or non-interactive pedagogies (as
pedagogy constitutes more than simply methods), that students described as having
positive or negative effects on attachment to school. The qualitative section also allows
us to examine interactive pedagogy that does not necessarily connect with a quantitative
8 Again, this is primarily due to difficulties in measuring pedagogy quantitatively, and accompanying difficulties in linking dropout to pedagogy in a single class qualitatively.
20
teaching methods variable but is important in examining dropout nonetheless. Given the
secondary data in both phases, the logical inferences regarding the effects of pedagogy
and dropout taken through these phases are the only way that I could link pedagogy and
dropout.
In order to further research on high school dropout and the development of
student attachment to high school, we must ask what the ultimate goal of the educational
system is. If the goal is to produce a highly or at least minimally skilled labor force, then
we must extend our focus within pedagogical literature to results beyond student
satisfaction or beyond the specific grade the “star” teacher teaches in. We must look at
high school completion as an important benchmark in measuring the effectiveness of
teaching methods. Given the evidence of ninth grade as a pivotal year in determining
future high school completion, pedagogy during the ninth grade year becomes an
important starting point for reconceptualizing teacher effectiveness.
Hypotheses
Hypothesis 1: Students with higher levels of student-teacher interaction in their ninth
grade English and mathematics classes will have lower levels of dropout in subsequent
years.
Hypothesis 2: Students with higher levels of student-teacher interaction in their ninth
grade English and mathematics classes will have lower levels of ninth grade retention.
Student-teacher interaction will be measured using variables examining how often
the student experienced teaching methods that are classified as interactive or non-
interactive. These relationships should hold as simple observed patterns independent of
other internal and external factors that have been controlled for. Qualitatively, I
21
hypothesize that students will describe methods, discussions and experiences consistent
with caring, critical thinking or culturally relative pedagogy as conducive to creating
attachments to school. Since I do not have access to these students’ dropout outcomes,
this idea of attachment to school during the ninth grade will act as a proxy for future
dropout outcomes. I use Roderick’s Path to Dropping Out as a basis for this connection
between attachment to school and dropout. I also hypothesize that students will describe
non-interactive methods consistent with the “pedagogy of poverty”, as measured in the
quantitative section, as inhibiting attachment to school.
Research Design
Quantitative Data
To conduct the quantitative analysis, I used data from the Philadelphia
Educational Longitudinal Study (PELS). PELS is a study of students (with
parents/guardians supplying information as well) conducted through the University of
Pennsylvania which ranges in topic from internal to school classroom activities to
external to school activities such as gang or sexual behavior. The researchers in this
study first interviewed students during the summer of 1996, the summer after their 8th
grade year.
With approximately 200,000 students and 250 schools, the public school system
in Philadelphia is one of the largest in the United States. This district is also one of the
poorest in the country, with more than 75% of its students classified as low-income. It is
important to note that although whites make up 45% of Philadelphia’s population, only
20% of Philadelphia public school students are white, the majority being African-
American. In addition, the neighborhoods of Philadelphia are highly segregated, and
22
despite an extensive school choice system, eleven magnet schools and four vocational
schools, around 70% of the students attending public schools in Philadelphia do so in
their own neighborhood, creating a high amount of segregation between schools (Neild
2002b).
This study uses multistage cluster sampling from the School District of
Philadelphia. Forty-five public eighth grade schools were randomly selected within
Philadelphia, ranked in order of size of the 8th grade class, and a random sample of
students was drawn from each school: 26 percent for smaller schools, and 16 percent for
larger schools. The students in this study and a parent/legal guardian for each student
were first contacted in the summer of 1996 through telephone interviews. Subsequently,
they were interviewed over the phone twice more during the 9th grade year, in the middle
and end of the school year, and contacted one time a year afterwards at the end of the
school year.
I gathered student information on interactive teaching methods from the third
wave of PELS, taken at the end of the 9th grade year (summer 1997). Data from the first
wave for students and their parent/legal guardian was also used to create some of the 8th
grade control variables. I used 8th grade data for many of my control variables in order to
examine and control for the contextual aspects of student lives before they enter high
school. Data from wave three was also used in incorporating certain control variables.
Philadelphia school district records were then matched to each student to determine
whether the student dropped out, graduated or moved to another district. These records
were also used in order to determine ninth grade retention outcomes and create a control
23
variable for 8th grade English class GPA. Students who were removed from school
involuntarily due to psychiatric reasons or death were eliminated from the study.
A concern of PELS in regards to my study is that it can not incorporate wave one
data for ninth graders who are new9 to the district, nor does it include children that were
retained after eighth grade. This characterizes roughly 10% of the 9th grade population.
Therefore, I infer that this sample characterizes the majority, but not all of students in
Philadelphia public high schools. In addition, students who moved into schools outside
of Philadelphia or have moved to private schools within Philadelphia have been excluded
from the analysis on high school completion. PELS does not follow the academic
outcomes of students who move outside of the Philadelphia or go to private schools
because of the necessity of supplementing PELS data with Philadelphia school district
data. While this group of students in wave three of PELS who have moved or gone to
private school may also have something interesting to say about the effects of pedagogy
on dropout, especially in light of the Pribesh and Downey (1999) study that examined the
negative effects of moving on children, I do not have the data with which to examine
their dropout outcomes, or in some case even their ninth grade retention outcomes (Neild
2002b).
Sample Size
After combining waves one and three of PELS, I obtained a sample size of 1033
students for this study. This group of 1033 is the proportion of the 1470 students who
participated in wave one that continued through wave three at the end of ninth grade.
Demographically, the differences between the group that completed waves one and three
9 By new I mean a student enrolled in a public school for ninth grade that was not enrolled in a Philadelphia public school for eighth grade.
24
and the group that only completed wave one are minimal, with the percentage female
dropping from 54 to 53%. Racially, whites makes up around 22% of the combined
waves and 23% of wave one10. African-Americans make up 64% of the combined waves
and 60% of wave one, while Latinos move up slightly from 8% in wave one around 9-
10% in the combined waves. This sample is similarly representative of the target
population of ninth grade students in Philadelphia public schools as the larger wave one
sample.
One difficulty I encountered in combining the different waves of PELS data with
Philadelphia school district records has to do with the way in which the eighth grade
marks were recorded. The student data was entered class by class rather than by student
ID. By this, I mean that cases were sorted by variables for each marking period, rather
than by student ID, creating a variable called marking period one grade, which would
then have eight to ten duplicate student IDs each considered their own case, so that one
case was the individual student’s grades for English for each marking period, another
case included only the student’s grades for writing through four marking periods, etc. I
assumed (correctly) that the eighth grade GPA variable would be highly (<.001)
significant in predicting dropout for all test models, so that not incorporating this in a full
model of dropout would be highly detrimental to discerning the independent effects of
ninth grade STI. In order to compensate for this problem, I programmed my English
class STI regression models only to include a case if the student’s course code was
English (or English 8, English A, etc., all of which denoted standard English classes for
different middle schools, I made sure these codes were mutually exclusive). I then did
10 Due to issues with Student ID that will be discussed in the following paragraph, the estimates for the combined waves are a combination of two slightly different estimates, one for students with math class in
25
the same for math class STI models using math course codes. In this way, I eliminated
the problem of multiple student IDs, however in doing this the sample size decreased
from the 1033 I have from the combined waves of PELS. My sample sizes vary across
two outcome groups for each subject due to the qualifying aspect of enrollment in math
or English class in the 8th grade. We also must consider that students who moved out of
the district are not included in the dropout models, and students who moved before the
tenth grade are not included on the dropout or ninth grade retention models when
examining the final sample sizes.
For the models examining dropout, the sample sizes are 792 for tests examining
English teaching methods and 844 for tests examining math teaching methods. For the
models examining ninth grade retention, the sample sizes are 875 for English teaching
methods and 898 for math teaching methods.
Dependent Variables
My main dependent variable is a dichotomous high school completion dummy
variable which examines only the outcomes of dropout11 or graduation, eliminating
students who moved from the district or have unknown outcomes12. The second
dependent variable of interest is a ninth grade retention dummy, examining only those
8th grade, one for students with an English class for 8th grade (see Appendix C)11 Again, any involuntary removal from school, with the exceptions of death or emotional disturbance I deem dropout, as well as any voluntary withdrawal from school. I should also note there were two cases in PELS where the student died (which were removed), and no cases where a student was removed due to emotional disturbance.12 Dropout codes are kept up to date rigorously by the Philadelphia School District as an effect of “No Child Left Behind”. Because school performance is now a key component of funding, schools have incentive to monitor who has been missing school for an extended period, as those students are likely to miss or do poorly on standardized tests, hurting the school’s chances at sufficient funding. Keeping students who have essentially dropped out of school on the school roster damages the school’s chance for demonstrating sufficient progress.
26
students with the outcomes of retained or promoted to tenth grade13. The ninth grade
retention dummy examines the more immediate effects of pedagogy in ninth grade on the
student. Testing for this outcome also allows us to include students who move after the
beginning of tenth grade whose eventual dropout or graduation outcomes are unknown.
Considering the research of Roderick (1992) and Neild (2002b) on the effect of ninth
grade outcomes on future dropout in addition to the literature on academic resilience
(Catterall 1998), the relation of STI to ninth grade retention is well worth studying.
Student-Teacher Interaction Variables
My independent variables examine student-teacher interaction (STI) in ninth
grade. There are a series questions in PELS relating to in class activities, and how often
these activities occurred (see Appendix A). For example, the PELS student respondent
answered the questions: “In your math class, how often did: a) the teacher lecture for
most of the period, b)….” The student answered each question about how often each
activity occurred either “almost every day”, “once or twice a week”, “a few times a
month”, or “less often”. I will be concerned with responses of “almost every day” for
most questions, as the effects of methods implemented less often should have a negligible
impact on the student.
The main focus of the quantitative phase is the examination of STI in the
student’s ninth grade English class. This is because of the more extensive list of STI
variables that is available examining English class teaching methods as opposed to math
class teaching methods. There are six variables that deal with interactive or non-
13 Due to some confusion with student identification, a small number of students (two) were dropped from this study due to unknown outcome regarding ninth grade retention. The Philadelphia school district data I was given was in the form of a grade status for each student taken at the beginning of each school year,
27
interactive teaching methods in the student’s English class. These STI variables are in
the form of dummy variables which are used to examine the frequency of these activities
(1 = almost every day, 0 = all other frequencies) so that the effects of prolonged high or
low STI can be examined.
Of the six English STI variables, five embody methods that I consider to be low
interaction. The first low STI variable is based on a question asking if the student’s
English “teacher lectured most of the period”. This is a major aspect of the direct
instructional model. Another low STI variable is based on the question “how often in
your English class did students work by themselves in class on worksheets or problems in
a textbook?” The third low STI variable examines how many times per week students
were allowed to do homework within English class. Answers above once a week,
including “whenever there was homework” were coded as low interaction for all
respondents. This can be seen as a form of “busy work” for the students. The last two
English low STI variables are based on a question that examines how often a student was
assigned fill in the blank questions and a question that examines how often the student
wrote in a journal in English class. Fill in the blank questions serve the same purpose as
worksheets or book work in the sense that they are based on repetition. Educational
researchers such as Lisa Tsui consider writing in a journal to have critical thinking
components; however writing in a journal is coded as lower interaction in this study due
to the difference in context between the colleges Tsui (2002) studied and the at-risk
classroom. Because of the lack of materials and overcrowding within classrooms in
making it impossible for me to find whether students who moved in the summer after ninth grade were promoted to tenth grade before leaving or were retained
28
many PELS schools, writing in a journal is not often used as a tool for critical thinking,
but instead as “busy work”.
This leaves us with the English teaching methods variable which I characterize as
high STI. This is based on the question: “how often in your English class did the teacher
have a discussion in which many students participated?” As with the low STI variables,
this will be coded as a dummy variable to indicate having this method almost every day
versus less than almost every day. Unlike the previous variables, which may
approximate a low STI “pedagogy of poverty” (although this is impossible to verify
without the qualitative data); it would be impossible to categorize this one variable as
indicative of a certain pedagogical style. Discussion in class is an aspect of multiple
highly interactive pedagogies that I believe are effective in dropout prevention. The
qualitative section both links discussion to interactive pedagogy, and examines different
types of discussion as parts of different effective interactive pedagogies.
I supplement the six STI variables in English class with models examining four
STI variables based on the student’s math class. Of these four variables, we may
characterize three as indicators of low STI, and one as an indicator of high STI. These
variables are based on questions identical to questions on which the four of the English
STI variables are based. The one math high STI variable is based on the question “how
often in your math class did the teacher have a discussion in which many students
participated?” The three low STI variables are based off of questions regarding how
often the student’s math teacher lectured in class, how often the student’s math teacher
assigned worksheets or book for the student to do alone, and how often the student’s
math teacher allowed class time for student to do homework. Again, answers above once
29
a week, including “whenever there was homework” were coded as low interaction for all
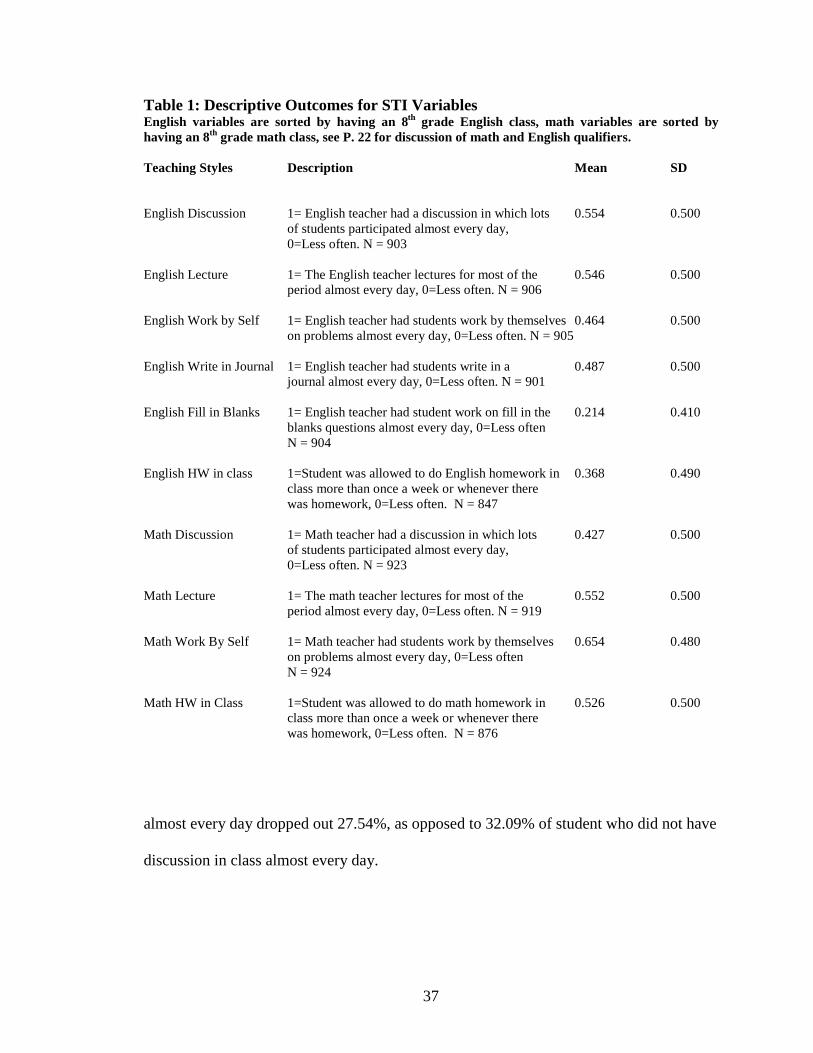
respondents, and all variables were coded as dummy variables. Table one displays
descriptive statistics for all ten teaching methods variables that are used to measure STI.
Other Explanatory Variables
I employed control dummy variables14 for race and gender as well as family
background taken from wave one of PELS at the end of the 8th grade year. The family
background variables include three dummy variables on mother’s educational level (less
than high school, high school, more than high school), a mother’s marital status dummy,
and a dummy for welfare receipt. I also used several 8th grade control variables as a
measure of previous within school student experience. These variables included 8th grade
English class GPA15 and index variables for social integration, pro-social friends, self-
esteem16 and educational level aspirations.
I also included 9th grade variables such as level of math class (college prep/non
college prep) so that we may have an indication of whether the student is in a lower level
track. I should note there is little tracking in Philadelphia schools, and the students are
mostly responsible for creating their own schedules. I also controlled for whether the
student is in a SLC (small learning community). Some Philadelphia schools have been
able to implement a program of SLCs (around thirteen students per class) for students
who apply and are accepted into this program, recognizing that smaller class size means
14 See Appendix B for a further explanation of these variables, as well descriptive statistics for each based on math and English class participation.15 Because English is one class which is required for all 8th grade students, I decided to examine their performance in English class across all four marking periods of eighth grade as an indicator of academic performance. Due to the difficulties described above, creating an overall GPA variable for students would have required collapsing the student ID’s into a single ID, which was impossible to do given my time frame for this project. In addition, many students who performed poorly in most classes did get an A in gym class, which I feel may improperly inflate their GPA had I decided to do an overall GPA.
30
more one on one teacher attention. In other cases without SLCs I assume the student is in
a larger class. Both of these variables may be seen as proxies for parental/guardian
involvement, as it is often the student’s parent or guardian who is integral in making sure
the student applies to programs such as SLCs or college prep classes.
In addition, I created dummy variables for each control variable to flag missing
cases (one would equal missing, zero would equal valid response). I then replaced all
missing values with zero. I did this in order to isolate and control for the effect of
missing values within the regression models. These dummy variables which flag missing
cases were also included in the full regression analysis model along with the control
variables.
Quantitative Methods
I employed several logistic regression models within this study, mainly focusing
on two groups of models examining the effects of English class STI on dropout or ninth
grade retention. These were supplemented by two additional groups of regression models
examining the effects of math class teaching methods on dropout or ninth grade retention
outcomes.
Within each regression group, three separate models were employed. The first
regression model examined the effect of teaching methods directly on dropout or ninth
grade retention without any control variables examined. The second regression model
examines the effect of teaching methods in conjunction with the other STI variables for
the particular subject. For English STI models, the explanatory STI variable of interest is
put into a model with the other five explanatory English STI variables. The explanatory
16 Self-esteem in this sense can be looked at as a general, but imperfect measure of prior emotional problems within the student.
31
Math STI variables will be combined with the other three explanatory STI variables in
the same manner. Given that there is likely much overlap between different teaching
methods for the students (as we will see), this is a particularly important model. Finally,
the third regression model examines the predictive power of one teaching method on
dropout or retention within a full regression model employing all control variables
mentioned above. This model will also include the full set of explanatory STI variables
by subject, similar to the second model. This model does exclude certain dummy
variables (female, mother received high school education but not more, African-
American, and student aspirations to complete a four year college) as reference groups.
Given that we have two subjects, math and English, and three groups of tests
based on dichotomous dropout and ninth grade retention outcomes, this brings the total
number of regression models based to six for each subject, and the total number of
regression analyses for this project to twelve.
Qualitative Data
PELS interviewers asked students questions such as “how often in math class did
the class have a discussion where lots of students participated?” While a variable based
on this question is adequate to characterize student-teacher interaction levels, this
question is not adequate in characterizing a specific interactive pedagogy such as caring
or critical thinking. However, the main purpose of this study is to examine if interactive
pedagogies during the ninth grade are effective at preventing high school dropout, and in
what ways do these pedagogies constitute “pedagogies of enlightenment” (Waxman &
Padron, 1995), instead of “pedagogies of poverty” (Haberman 1992)?
32
The qualitative phase allows to examine through the students’ own words which
specific pedagogic styles (interactive or not) students feel is affective or ineffective in
creating attachments to school that should prevent dropout. This phase also illustrates
connections between the in-class experiences of students that PELS measures
quantitatively and specific pedagogies such as connecting discussion to critical thinking,
or connecting journals in class or worksheets to a lack of critical thinking. The
qualitative section takes the findings of the quantitative section one step further by
examining interactive pedagogy that does not correlate to any teaching methods variables
from the quantitative phase.
The qualitative research I use in this study is secondary; it has been provided to
me by Dr. Lory J. Dance (2001). The qualitative phase of the research employs aspects
of grounded theory to code secondary data from nine students in two West Philadelphia
PELS participant schools which are representative of low-income Philadelphia public
schools. I find this sample to be appropriate for my study because these schools typify
at-risk Philadelphia public schools in income level, school population, and demographic
characteristics. The two schools are both in a section of the city in which a large
percentage of residents are considered low income, and both schools are very large, with
a population of well over two thousand students each. The vast majority of students in
these schools were African-Americans, with a minority of West Indian or Latino origin.
There were very few whites or Asian-Americans in these two schools.
The qualitative data was gathered late in the 2000-2001 school year. The data was
collected from three one-on-one interviews (Wolverine, Sole and Mya17), an interview
17 All of the students chose their own aliases before their interview in order to protect their privacy. These aliases often reflected the student’s favorite singers or rappers.
33
with two students (Bleek and Busta), and a small focus group with four students (Beanie,
Nas, Eve and Mary J.) 18. All nine students interviewed were African-American. Four of
the nine students interviewed were females (Sole, Mya, Mary J. and Eve). Seven of the
students, with the exceptions of Bleek and Busta19, were in the ninth grade at the time of
the interviews. While there were no specific questions asked regarding academic
performance, the comments of the students on their own academic performance indicate
that they are diverse in this sense20.
Dance interviewed these students during the 1999-2000 and 2000-2001 school
years using ethnographic methods. Each interview lasted between thirty and forty-five
minutes. Dance granted me permission to transcribe the tapes of these interviews for use
in this study. These interviews mainly covered the subjects of high school dropout,
problems the students perceived within the school, and problems outside of school that
affect the subjects’ daily lives. Dance began the interviews by having her subjects watch
a ten minute clip of the movie “Ride” before interviewing them. This clip showed
portrayals of high school students in several situations, such as a teen pregnancy, teens
robbing a convenience store, and teens dealing with identity issues. This leads to the first
two questions of Dance’s interview: “what are some of the things shown/not shown that
kids in your school are dealing with?” Dance followed up these questions by asking
18 Dance gained entry to the two Philadelphia schools from which she collected her interviews through her work with the PELS study as a visiting scholar to the University of Pennsylvania. Her research goal was to examine the students’ transitions between school and non-school environments. Initially, her role was one of an ethnographic observer who sat in the classrooms. However, over the three semesters that she conducted research at these schools, she became a sort of informal adviser to both teachers and students. She collected interviews with approximately 100 students using focus groups, as well as ten in depth interviews with teachers. 19 Bleak and Busta were both 11th graders at the time of their interview.20 The same can be said of parental involvement and extra-curricular activity, as we see students ranging from high parental involvement in several extra-curricular activities to low parental involvement and no extra-curricular activity according to the students’ comments.

34
such questions as “if you were superintendent of Philadelphia public schools, what
changes would you make?”, “what things outside of school pull kids out of school/push
kids into school?”, “what things inside of school make kids want to stay in school”,
“what things inside of school push kids out of school”, and “give me your definition of
the streets”. Dance also asked more specific follow up questions to the students based
on their responses for these general questions. However, the questions listed above were
used as an overarching framework with which she steered the interviews.
Qualitative Methods
I borrowed from grounded theory in coding this data21. The use of grounded
theory in this project allowed the student to express him or herself in his or her own
words, and allowed me to develop my own interpretations of their words inductively.
This is a contrast from my deductive quantitative research. Because the main focus of
this study is the importance of the student’s opinions on what pedagogies are effective, in
concordance with the ideas of Waxman (1989), methods such as triangulation, which I
could not perform due to my restricted access to the actual schools and students sampled,
are less critical in this case. However, I do consider my quantitative phase to be a sort of
triangulation method, as we see the student’s comments on pedagogies and specific
methods that create attachment to the school verified through PELS data examining the
connection between dropout and low STI methods.
I borrowed aspects of grounded theory as I listened to the qualitative research
tapes and engaged in open coding, where I searched for patterns among student answers
in order to discern emerging themes of attachment to school, STI, pedagogy and dropout
21 Due to the secondary nature of the data, I was unable to re-interview students based on their previous statements to the point of saturation, a key component of grounded theory.
35
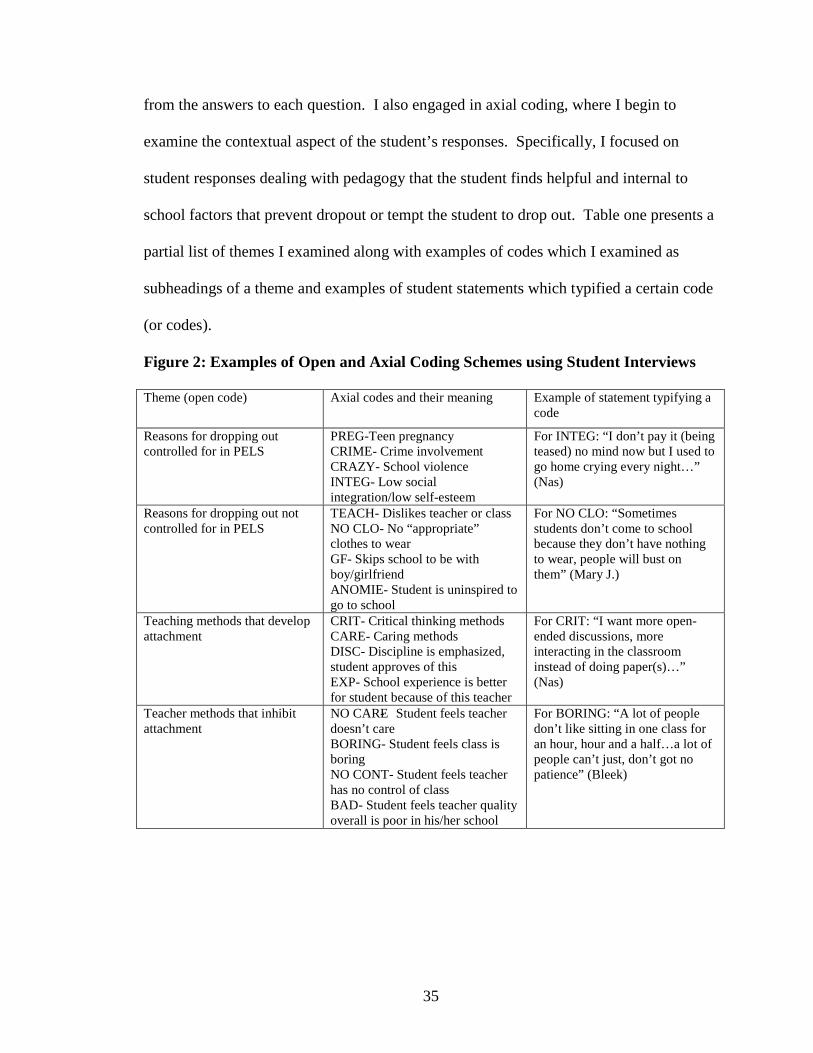
from the answers to each question. I also engaged in axial coding, where I begin to
examine the contextual aspect of the student’s responses. Specifically, I focused on
student responses dealing with pedagogy that the student finds helpful and internal to
school factors that prevent dropout or tempt the student to drop out. Table one presents a
partial list of themes I examined along with examples of codes which I examined as
subheadings of a theme and examples of student statements which typified a certain code
(or codes).
Figure 2: Examples of Open and Axial Coding Schemes using Student Interviews
Theme (open code) Axial codes and their meaning Example of statement typifying a code
Reasons for dropping out controlled for in PELS
PREG-Teen pregnancyCRIME- Crime involvementCRAZY- School violenceINTEG- Low social integration/low self-esteem
For INTEG: “I don’t pay it (being teased) no mind now but I used to go home crying every night…” (Nas)
Reasons for dropping out not controlled for in PELS
TEACH- Dislikes teacher or classNO CLO- No “appropriate” clothes to wearGF- Skips school to be with boy/girlfriendANOMIE- Student is uninspired to go to school
For NO CLO: “Sometimes students don’t come to school because they don’t have nothing to wear, people will bust on them” (Mary J.)
Teaching methods that develop attachment
CRIT- Critical thinking methodsCARE- Caring methodsDISC- Discipline is emphasized, student approves of thisEXP- School experience is better for student because of this teacher
For CRIT: “I want more open-ended discussions, more interacting in the classroom instead of doing paper(s)…” (Nas)
Teacher methods that inhibit attachment
NO CARE- Student feels teacher doesn’t careBORING- Student feels class is boringNO CONT- Student feels teacher has no control of classBAD- Student feels teacher quality overall is poor in his/her school
For BORING: “A lot of people don’t like sitting in one class for an hour, hour and a half…a lot of people can’t just, don’t got no patience” (Bleek)
36
Quantitative Results
Initial Evidence
Before examining the results based on regression models, it is important to
examine the percentages of students who report interactive or non-interactive teaching
styles for English class, as well as math class22. These statistics are elaborated further in
table one. Interestingly, around half of the PELS respondents reported frequent use of
interactive classroom discussions. While we can not tell through this table how often
these methods were mixed with other less interactive methods, I will later demonstrate
that there is no validity threat to this data based on colinearity.
Table two examines descriptive statistics regarding the dropout rates of students
based on their answers to each of the six English STI variables. This evidence, along
with the statistics from table one, establishes initial evidence of a relationship between
non-interactive teaching methods and dropout. This connection is apparent in the cases
of students who had homework, worksheets, journals, or fill in the blank questions during
class. Because I was able to obtain a more extensive stable of variables which examine
non-interactive methods, we may examine the group of non-interactive methods
including worksheets, homework, journals and fill in the blank questions in class as a
rough approximate of the “pedagogy of poverty”. However, this link is tenuous at best,
and is more effectively supplemented through the qualitative phase of this project.
Discussion during class seemed to help prevent dropout, as students with discussion
22 Descriptive statistics for all variables can be examined in Appendix B. Among both the groups of students based on participation in 8th grade English and the group based on participation in 8th grade math, the statistics on dropout (see Appendix C) are similar to the dropout rates experienced district-wide for the 1997 cohort of first time ninth graders. Other descriptive statistics are similar to those in Neild’s (2002b) study in which she uses PELS as well (although the samples are not identical between studies).
37
Table 1: Descriptive Outcomes for STI Variables English variables are sorted by having an 8th grade English class, math variables are sorted by having an 8th grade math class, see P. 22 for discussion of math and English qualifiers.
Teaching Styles Description Mean SD
English Discussion 1= English teacher had a discussion in which lots 0.554 0.500of students participated almost every day,0=Less often. N = 903
English Lecture 1= The English teacher lectures for most of the 0.546 0.500period almost every day, 0=Less often. N = 906
English Work by Self 1= English teacher had students work by themselves 0.464 0.500on problems almost every day, 0=Less often. N = 905
English Write in Journal 1= English teacher had students write in a 0.487 0.500journal almost every day, 0=Less often. N = 901
English Fill in Blanks 1= English teacher had student work on fill in the 0.214 0.410blanks questions almost every day, 0=Less oftenN = 904
English HW in class 1=Student was allowed to do English homework in 0.368 0.490class more than once a week or whenever therewas homework, 0=Less often. N = 847
Math Discussion 1= Math teacher had a discussion in which lots 0.427 0.500of students participated almost every day,0=Less often. N = 923
Math Lecture 1= The math teacher lectures for most of the 0.552 0.500period almost every day, 0=Less often. N = 919
Math Work By Self 1= Math teacher had students work by themselves 0.654 0.480on problems almost every day, 0=Less often N = 924
Math HW in Class 1=Student was allowed to do math homework in 0.526 0.500class more than once a week or whenever therewas homework, 0=Less often. N = 876
almost every day dropped out 27.54%, as opposed to 32.09% of student who did not have
discussion in class almost every day.
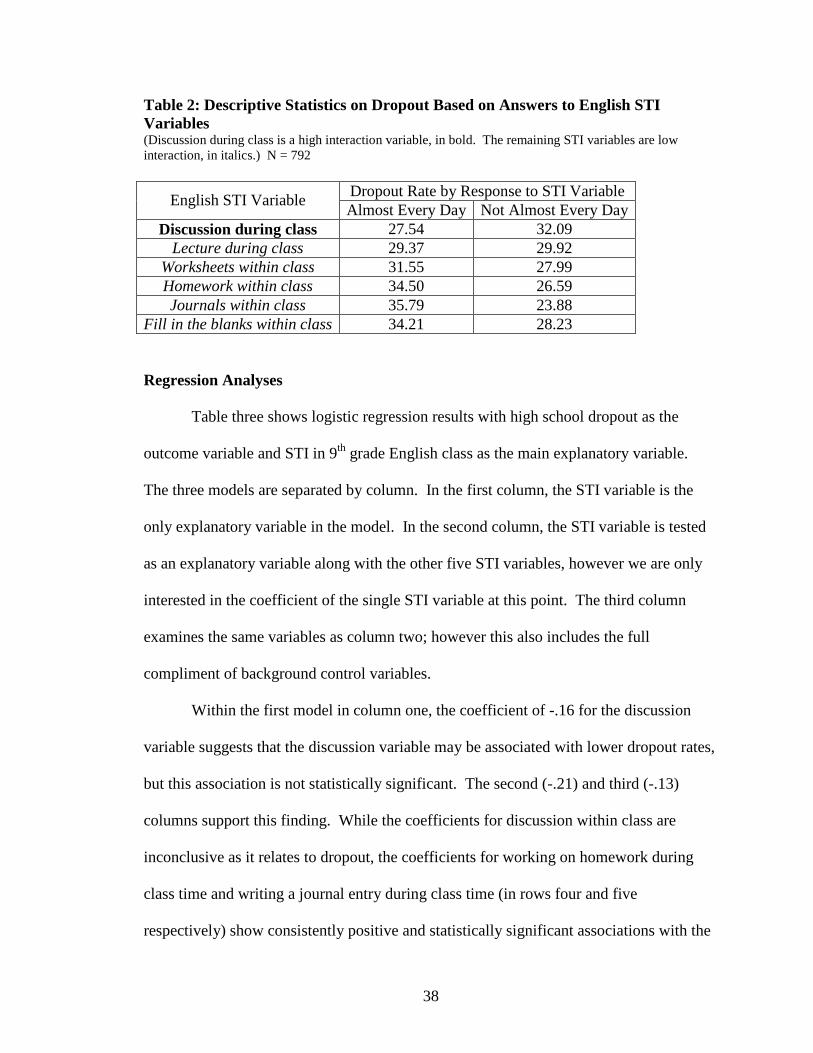
38
Table 2: Descriptive Statistics on Dropout Based on Answers to English STI Variables(Discussion during class is a high interaction variable, in bold. The remaining STI variables are low interaction, in italics.) N = 792
Dropout Rate by Response to STI VariableEnglish STI Variable
Almost Every Day Not Almost Every DayDiscussion during class 27.54 32.09
Lecture during class 29.37 29.92Worksheets within class 31.55 27.99Homework within class 34.50 26.59Journals within class 35.79 23.88
Fill in the blanks within class 34.21 28.23
Regression Analyses
Table three shows logistic regression results with high school dropout as the
outcome variable and STI in 9th grade English class as the main explanatory variable.
The three models are separated by column. In the first column, the STI variable is the
only explanatory variable in the model. In the second column, the STI variable is tested
as an explanatory variable along with the other five STI variables, however we are only
interested in the coefficient of the single STI variable at this point. The third column
examines the same variables as column two; however this also includes the full
compliment of background control variables.
Within the first model in column one, the coefficient of -.16 for the discussion
variable suggests that the discussion variable may be associated with lower dropout rates,
but this association is not statistically significant. The second (-.21) and third (-.13)
columns support this finding. While the coefficients for discussion within class are
inconclusive as it relates to dropout, the coefficients for working on homework during
class time and writing a journal entry during class time (in rows four and five
respectively) show consistently positive and statistically significant associations with the
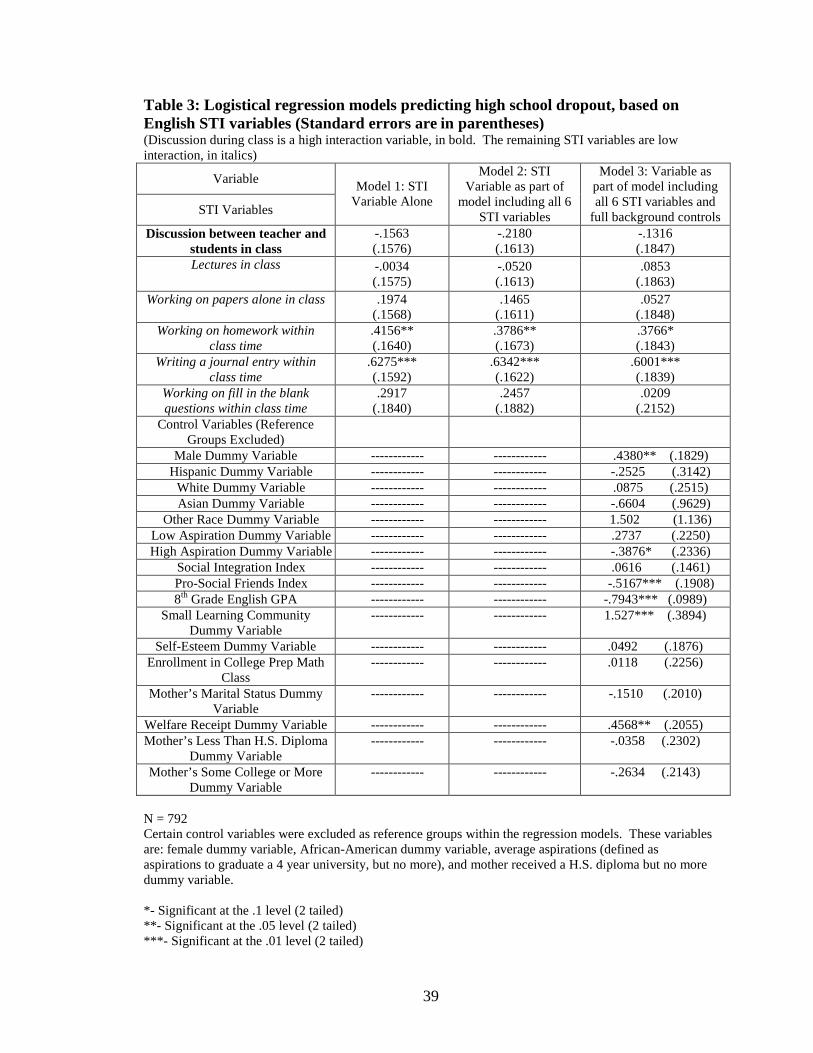
39
Table 3: Logistical regression models predicting high school dropout, based on English STI variables (Standard errors are in parentheses)(Discussion during class is a high interaction variable, in bold. The remaining STI variables are low interaction, in italics)
Variable
STI Variables
Model 1: STI Variable Alone
Model 2: STI Variable as part of
model including all 6 STI variables
Model 3: Variable as part of model including all 6 STI variables and
full background controlsDiscussion between teacher and
students in class-.1563 (.1576)
-.2180(.1613)
-.1316(.1847)
Lectures in class -.0034 (.1575)
-.0520(.1613)
.0853(.1863)
Working on papers alone in class .1974(.1568)
.1465(.1611)
.0527(.1848)
Working on homework within class time
.4156** (.1640)
.3786**(.1673)
.3766*(.1843)
Writing a journal entry within class time
.6275***(.1592)
.6342***(.1622)
.6001***(.1839)
Working on fill in the blank questions within class time
.2917(.1840)
.2457(.1882)
.0209(.2152)
Control Variables (Reference Groups Excluded)
Male Dummy Variable ------------ ------------ .4380** (.1829)Hispanic Dummy Variable ------------ ------------ -.2525 (.3142)
White Dummy Variable ------------ ------------ .0875 (.2515)Asian Dummy Variable ------------ ------------ -.6604 (.9629)
Other Race Dummy Variable ------------ ------------ 1.502 (1.136)Low Aspiration Dummy Variable ------------ ------------ .2737 (.2250)High Aspiration Dummy Variable ------------ ------------ -.3876* (.2336)
Social Integration Index ------------ ------------ .0616 (.1461)Pro-Social Friends Index ------------ ------------ -.5167*** (.1908)8th Grade English GPA ------------ ------------ -.7943*** (.0989)
Small Learning Community Dummy Variable
------------ ------------ 1.527*** (.3894)
Self-Esteem Dummy Variable ------------ ------------ .0492 (.1876)Enrollment in College Prep Math
Class ------------ ------------ .0118 (.2256)
Mother’s Marital Status Dummy Variable
------------ ------------ -.1510 (.2010)
Welfare Receipt Dummy Variable ------------ ------------ .4568** (.2055)Mother’s Less Than H.S. Diploma
Dummy Variable------------ ------------ -.0358 (.2302)
Mother’s Some College or More Dummy Variable
------------ ------------ -.2634 (.2143)
N = 792Certain control variables were excluded as reference groups within the regression models. These variables are: female dummy variable, African-American dummy variable, average aspirations (defined as aspirations to graduate a 4 year university, but no more), and mother received a H.S. diploma but no more dummy variable.
*- Significant at the .1 level (2 tailed)**- Significant at the .05 level (2 tailed)***- Significant at the .01 level (2 tailed)
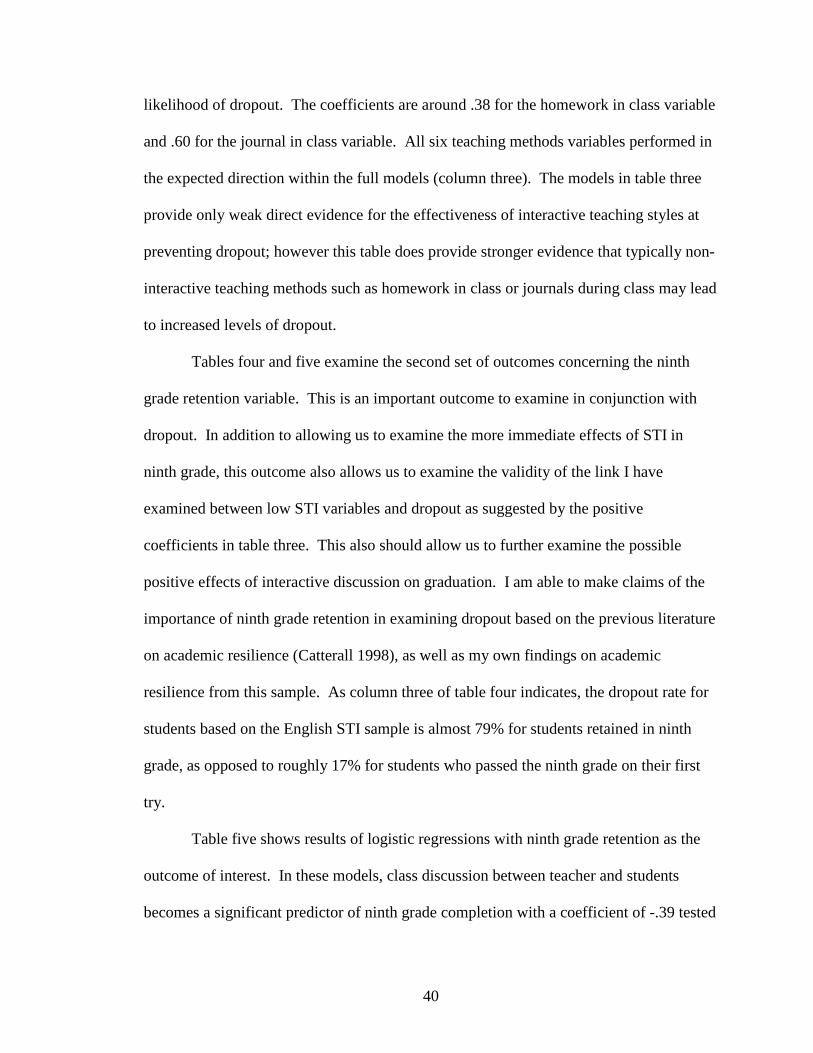
40
likelihood of dropout. The coefficients are around .38 for the homework in class variable
and .60 for the journal in class variable. All six teaching methods variables performed in
the expected direction within the full models (column three). The models in table three
provide only weak direct evidence for the effectiveness of interactive teaching styles at
preventing dropout; however this table does provide stronger evidence that typically non-
interactive teaching methods such as homework in class or journals during class may lead
to increased levels of dropout.
Tables four and five examine the second set of outcomes concerning the ninth
grade retention variable. This is an important outcome to examine in conjunction with
dropout. In addition to allowing us to examine the more immediate effects of STI in
ninth grade, this outcome also allows us to examine the validity of the link I have
examined between low STI variables and dropout as suggested by the positive
coefficients in table three. This also should allow us to further examine the possible
positive effects of interactive discussion on graduation. I am able to make claims of the
importance of ninth grade retention in examining dropout based on the previous literature
on academic resilience (Catterall 1998), as well as my own findings on academic
resilience from this sample. As column three of table four indicates, the dropout rate for
students based on the English STI sample is almost 79% for students retained in ninth
grade, as opposed to roughly 17% for students who passed the ninth grade on their first
try.
Table five shows results of logistic regressions with ninth grade retention as the
outcome of interest. In these models, class discussion between teacher and students
becomes a significant predictor of ninth grade completion with a coefficient of -.39 tested
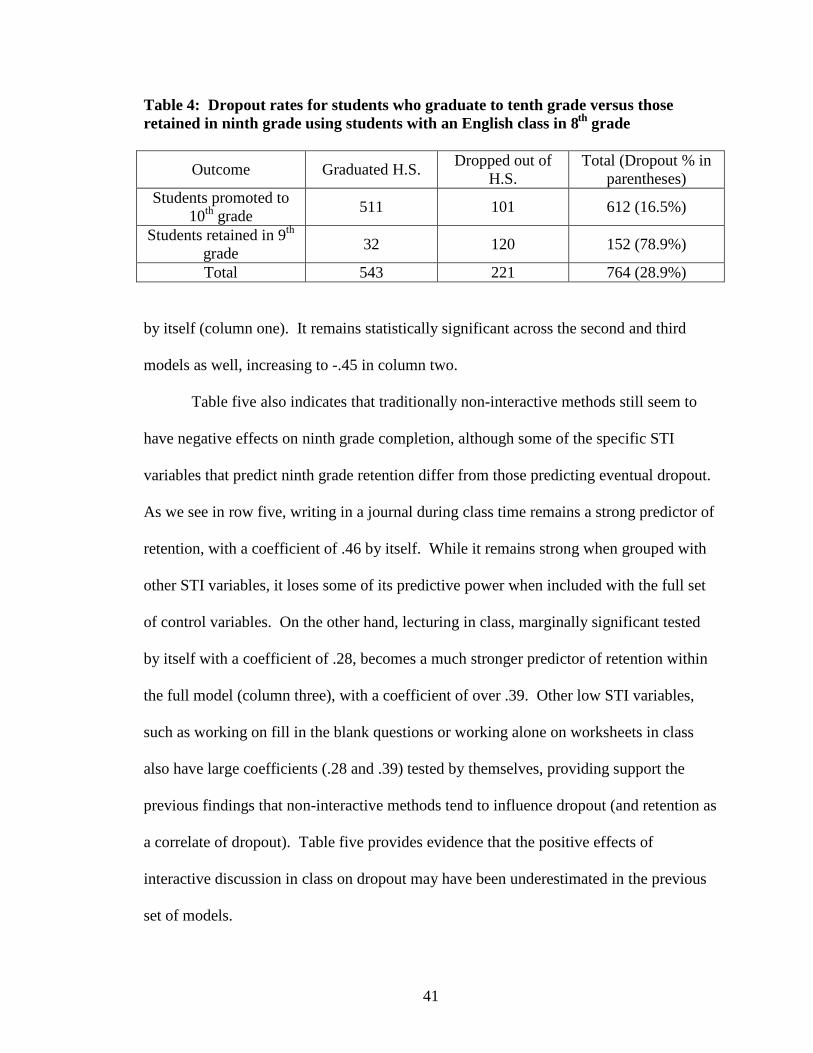
41
Table 4: Dropout rates for students who graduate to tenth grade versus those retained in ninth grade using students with an English class in 8th grade
Outcome Graduated H.S.Dropped out of
H.S.Total (Dropout % in
parentheses)Students promoted to
10th grade511 101 612 (16.5%)
Students retained in 9th
grade32 120 152 (78.9%)
Total 543 221 764 (28.9%)
by itself (column one). It remains statistically significant across the second and third
models as well, increasing to -.45 in column two.
Table five also indicates that traditionally non-interactive methods still seem to
have negative effects on ninth grade completion, although some of the specific STI
variables that predict ninth grade retention differ from those predicting eventual dropout.
As we see in row five, writing in a journal during class time remains a strong predictor of
retention, with a coefficient of .46 by itself. While it remains strong when grouped with
other STI variables, it loses some of its predictive power when included with the full set
of control variables. On the other hand, lecturing in class, marginally significant tested
by itself with a coefficient of .28, becomes a much stronger predictor of retention within
the full model (column three), with a coefficient of over .39. Other low STI variables,
such as working on fill in the blank questions or working alone on worksheets in class
also have large coefficients (.28 and .39) tested by themselves, providing support the
previous findings that non-interactive methods tend to influence dropout (and retention as
a correlate of dropout). Table five provides evidence that the positive effects of
interactive discussion in class on dropout may have been underestimated in the previous
set of models.
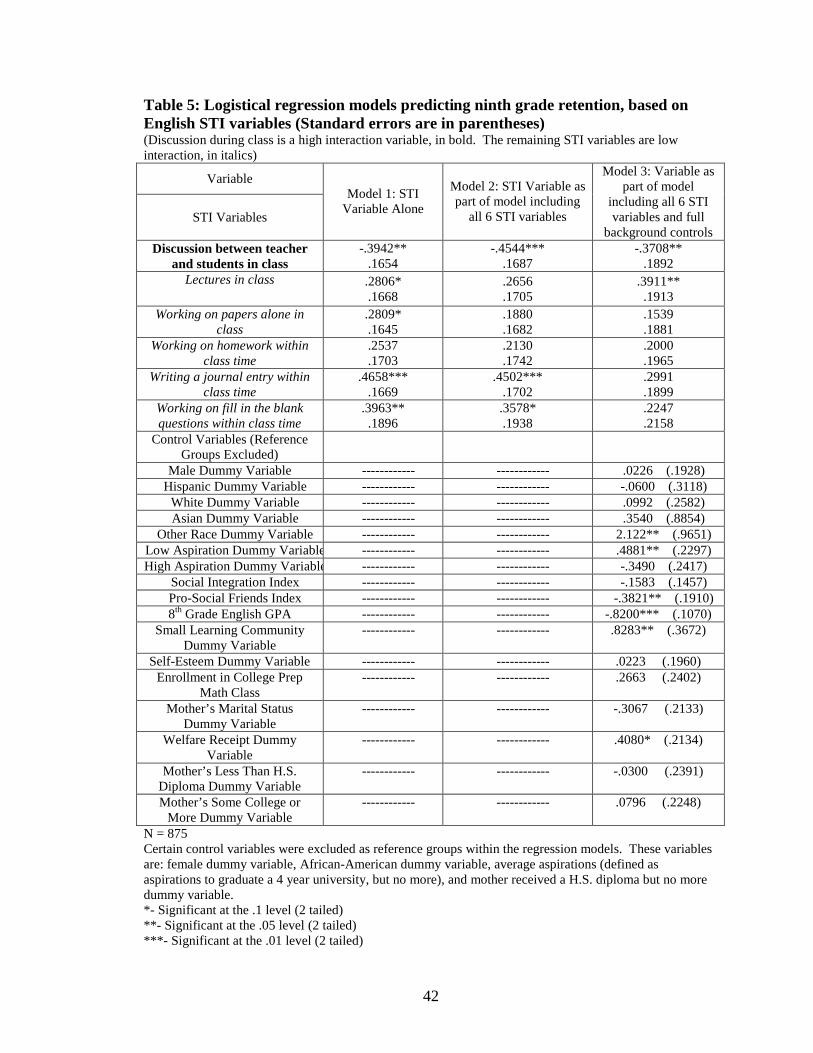
42
Table 5: Logistical regression models predicting ninth grade retention, based on English STI variables (Standard errors are in parentheses)(Discussion during class is a high interaction variable, in bold. The remaining STI variables are low interaction, in italics)
Variable
STI Variables
Model 1: STI Variable Alone
Model 2: STI Variable as part of model including
all 6 STI variables
Model 3: Variable as part of model
including all 6 STI variables and full
background controlsDiscussion between teacher
and students in class-.3942**
.1654-.4544***
.1687-.3708**
.1892Lectures in class .2806*
.1668.2656.1705
.3911**.1913
Working on papers alone in class
.2809*.1645
.1880
.1682.1539.1881
Working on homework within class time
.2537
.1703.2130.1742
.2000
.1965Writing a journal entry within
class time.4658***
.1669.4502***
.1702.2991.1899
Working on fill in the blank questions within class time
.3963**.1896
.3578*.1938
.2247
.2158Control Variables (Reference
Groups Excluded)Male Dummy Variable ------------ ------------ .0226 (.1928)
Hispanic Dummy Variable ------------ ------------ -.0600 (.3118)White Dummy Variable ------------ ------------ .0992 (.2582)Asian Dummy Variable ------------ ------------ .3540 (.8854)
Other Race Dummy Variable ------------ ------------ 2.122** (.9651)Low Aspiration Dummy Variable ------------ ------------ .4881** (.2297)High Aspiration Dummy Variable ------------ ------------ -.3490 (.2417)
Social Integration Index ------------ ------------ -.1583 (.1457)Pro-Social Friends Index ------------ ------------ -.3821** (.1910)8th Grade English GPA ------------ ------------ -.8200*** (.1070)
Small Learning Community Dummy Variable
------------ ------------ .8283** (.3672)
Self-Esteem Dummy Variable ------------ ------------ .0223 (.1960)Enrollment in College Prep
Math Class ------------ ------------ .2663 (.2402)
Mother’s Marital Status Dummy Variable
------------ ------------ -.3067 (.2133)
Welfare Receipt Dummy Variable
------------ ------------ .4080* (.2134)
Mother’s Less Than H.S. Diploma Dummy Variable
------------ ------------ -.0300 (.2391)
Mother’s Some College or More Dummy Variable
------------ ------------ .0796 (.2248)
N = 875Certain control variables were excluded as reference groups within the regression models. These variables are: female dummy variable, African-American dummy variable, average aspirations (defined as aspirations to graduate a 4 year university, but no more), and mother received a H.S. diploma but no more dummy variable.*- Significant at the .1 level (2 tailed)**- Significant at the .05 level (2 tailed)***- Significant at the .01 level (2 tailed)
43
Validity and Reliability
Given these results, which are somewhat different than in our first model despite a
historically high correlation between high school dropout and ninth grade retention, we
must examine these tests more closely to determine its reliability and validity. We may
consider the distance between coefficients of the teaching methods variables which most
accurately represent high and low STI across both outcomes as a test of reliability. For
this test I consider discussion between teacher and students as the most accurate (and
only) indicator of high STI. I consider writing in journals during class to be the most
accurate indicator of low STI (although homework during class is also an accurate
indicator, and produces the same results as journal in class variable for this diagnostic
test). These are also the methods which seem to have the most explanatory power of
dropout (journals) and ninth grade retention (discussion) over the two outcomes. If we
examine the differences between the coefficients for journal and discussion over both
outcomes, we will notice that the distances between the coefficients of the two methods
across the different models are very similar. This suggests that results of the two sets of
models are consistent, as the intercept is simply at different points between the dropout
and ninth grade retention models.
The outcome of journals and homework within class becoming less significant in
ninth grade retention as opposed to dropout makes sense. As I examine later, some of the
students interviewed in the qualitative phase speak of teachers who they believe do not
care about the students. These teachers sometimes assign “busy work” such homework
or worksheets in class, and promote students to tenth grade without the skills necessary to
perform well on that level. If this is true on a larger scale, it makes sense that certain
44
non-interactive methods may not foster ninth grade retention, as the teachers employing
these methods may be more likely to allow a student to advance. However, without these
skills, students may be more likely to perform poorly in future grades and eventually drop
out of school.
To test for possible concerns related to colinearity of teaching styles, I examined
the percentages of students that have discussion within class every day, broken down by
each possible combination of the five non-interactive methods. The results are in
Appendix D; however I can summarize Appendix D here by relating that there was no
clear correlation between the answer a student gave for the discussion in class variable
and any other combination of answers the student submitted regarding low STI variables.
It is likely that students had teachers who employed several types of methods within the
classroom to varying degrees23.
I must also address the issue of sample size before moving on. Unfortunately, due
to attrition between waves of PELS, as well as the difficulties discussed earlier with the
eighth grade student identification codes from the Philadelphia school district, my sample
size was between seven hundred ninety two and eight hundred and ninety eight for all
models. Unfortunately, this small size can make it difficult to verify the statistical
significance of different teaching methods variables on dropout.
Supplemental Math Regression Analyses
The supplemental math STI variables preformed in a similar manner to the
corresponding English teaching methods variables with respect to dropout, with the
notable exception of the math homework in class variable acting as a predictor of
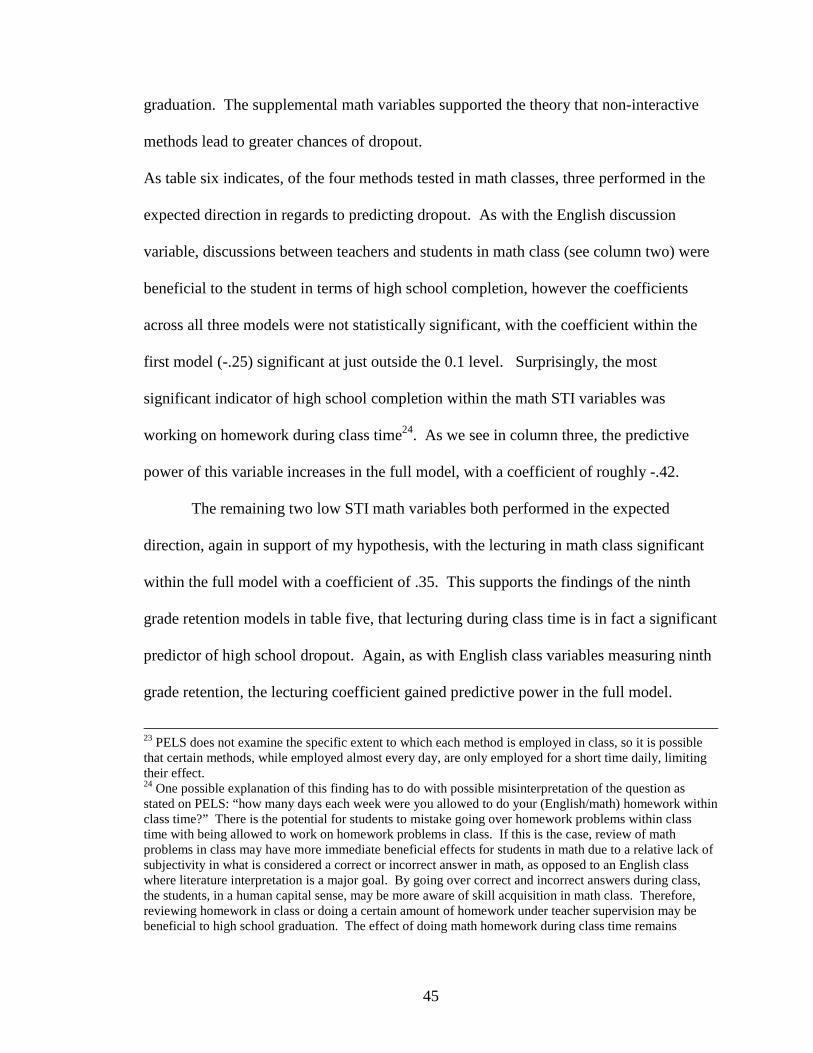
45
graduation. The supplemental math variables supported the theory that non-interactive
methods lead to greater chances of dropout.
As table six indicates, of the four methods tested in math classes, three performed in the
expected direction in regards to predicting dropout. As with the English discussion
variable, discussions between teachers and students in math class (see column two) were
beneficial to the student in terms of high school completion, however the coefficients
across all three models were not statistically significant, with the coefficient within the
first model (-.25) significant at just outside the 0.1 level. Surprisingly, the most
significant indicator of high school completion within the math STI variables was
working on homework during class time24. As we see in column three, the predictive
power of this variable increases in the full model, with a coefficient of roughly -.42.
The remaining two low STI math variables both performed in the expected
direction, again in support of my hypothesis, with the lecturing in math class significant
within the full model with a coefficient of .35. This supports the findings of the ninth
grade retention models in table five, that lecturing during class time is in fact a significant
predictor of high school dropout. Again, as with English class variables measuring ninth
grade retention, the lecturing coefficient gained predictive power in the full model.
23 PELS does not examine the specific extent to which each method is employed in class, so it is possible that certain methods, while employed almost every day, are only employed for a short time daily, limiting their effect.24 One possible explanation of this finding has to do with possible misinterpretation of the question as stated on PELS: “how many days each week were you allowed to do your (English/math) homework within class time?” There is the potential for students to mistake going over homework problems within class time with being allowed to work on homework problems in class. If this is the case, review of math problems in class may have more immediate beneficial effects for students in math due to a relative lack of subjectivity in what is considered a correct or incorrect answer in math, as opposed to an English class where literature interpretation is a major goal. By going over correct and incorrect answers during class, the students, in a human capital sense, may be more aware of skill acquisition in math class. Therefore, reviewing homework in class or doing a certain amount of homework under teacher supervision may be beneficial to high school graduation. The effect of doing math homework during class time remains
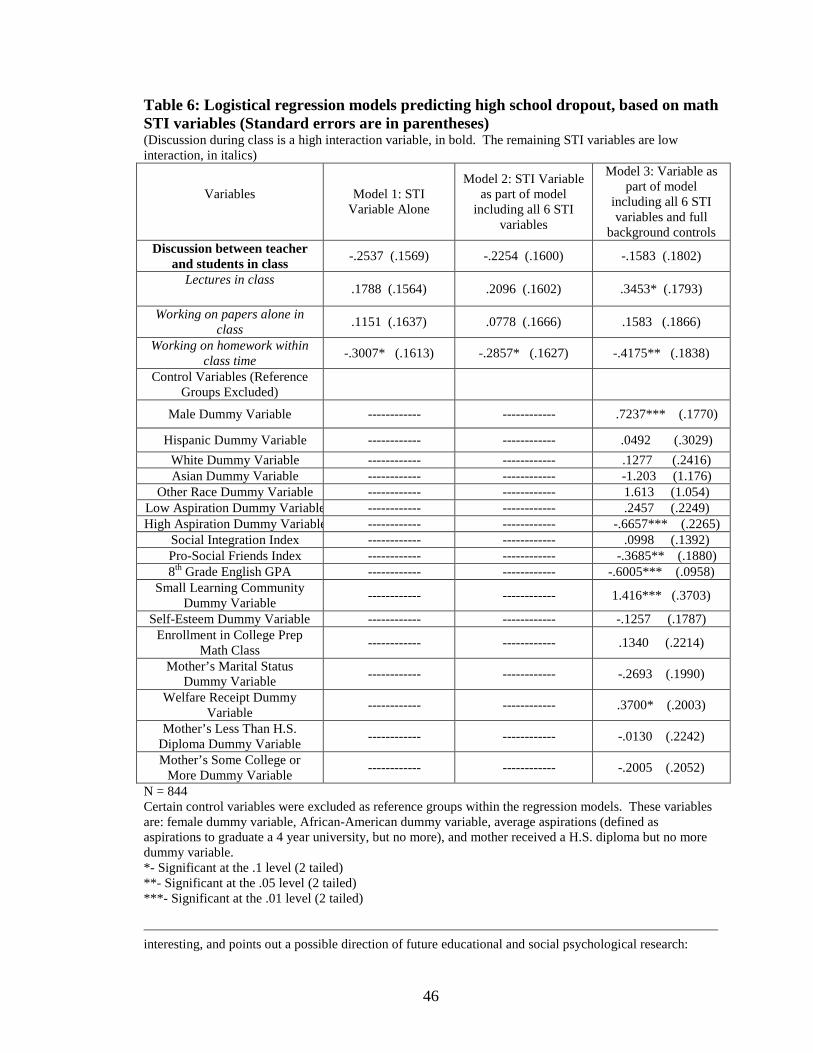
46
Table 6: Logistical regression models predicting high school dropout, based on math STI variables (Standard errors are in parentheses)(Discussion during class is a high interaction variable, in bold. The remaining STI variables are low interaction, in italics)
Variables Model 1: STI Variable Alone
Model 2: STI Variable as part of model
including all 6 STI variables
Model 3: Variable as part of model
including all 6 STI variables and full
background controlsDiscussion between teacher
and students in class-.2537 (.1569) -.2254 (.1600) -.1583 (.1802)
Lectures in class.1788 (.1564) .2096 (.1602) .3453* (.1793)
Working on papers alone in class
.1151 (.1637) .0778 (.1666) .1583 (.1866)
Working on homework within class time
-.3007* (.1613) -.2857* (.1627) -.4175** (.1838)
Control Variables (Reference Groups Excluded)
Male Dummy Variable ------------ ------------ .7237*** (.1770)
Hispanic Dummy Variable ------------ ------------ .0492 (.3029)
White Dummy Variable ------------ ------------ .1277 (.2416)Asian Dummy Variable ------------ ------------ -1.203 (1.176)
Other Race Dummy Variable ------------ ------------ 1.613 (1.054)Low Aspiration Dummy Variable ------------ ------------ .2457 (.2249)High Aspiration Dummy Variable ------------ ------------ -.6657*** (.2265)
Social Integration Index ------------ ------------ .0998 (.1392)Pro-Social Friends Index ------------ ------------ -.3685** (.1880)8th Grade English GPA ------------ ------------ -.6005*** (.0958)
Small Learning Community Dummy Variable
------------ ------------ 1.416*** (.3703)
Self-Esteem Dummy Variable ------------ ------------ -.1257 (.1787)Enrollment in College Prep
Math Class ------------ ------------ .1340 (.2214)
Mother’s Marital Status Dummy Variable
------------ ------------ -.2693 (.1990)
Welfare Receipt Dummy Variable
------------ ------------ .3700* (.2003)
Mother’s Less Than H.S. Diploma Dummy Variable
------------ ------------ -.0130 (.2242)
Mother’s Some College or More Dummy Variable
------------ ------------ -.2005 (.2052)
N = 844Certain control variables were excluded as reference groups within the regression models. These variables are: female dummy variable, African-American dummy variable, average aspirations (defined as aspirations to graduate a 4 year university, but no more), and mother received a H.S. diploma but no more dummy variable.*- Significant at the .1 level (2 tailed)**- Significant at the .05 level (2 tailed)***- Significant at the .01 level (2 tailed)
interesting, and points out a possible direction of future educational and social psychological research:
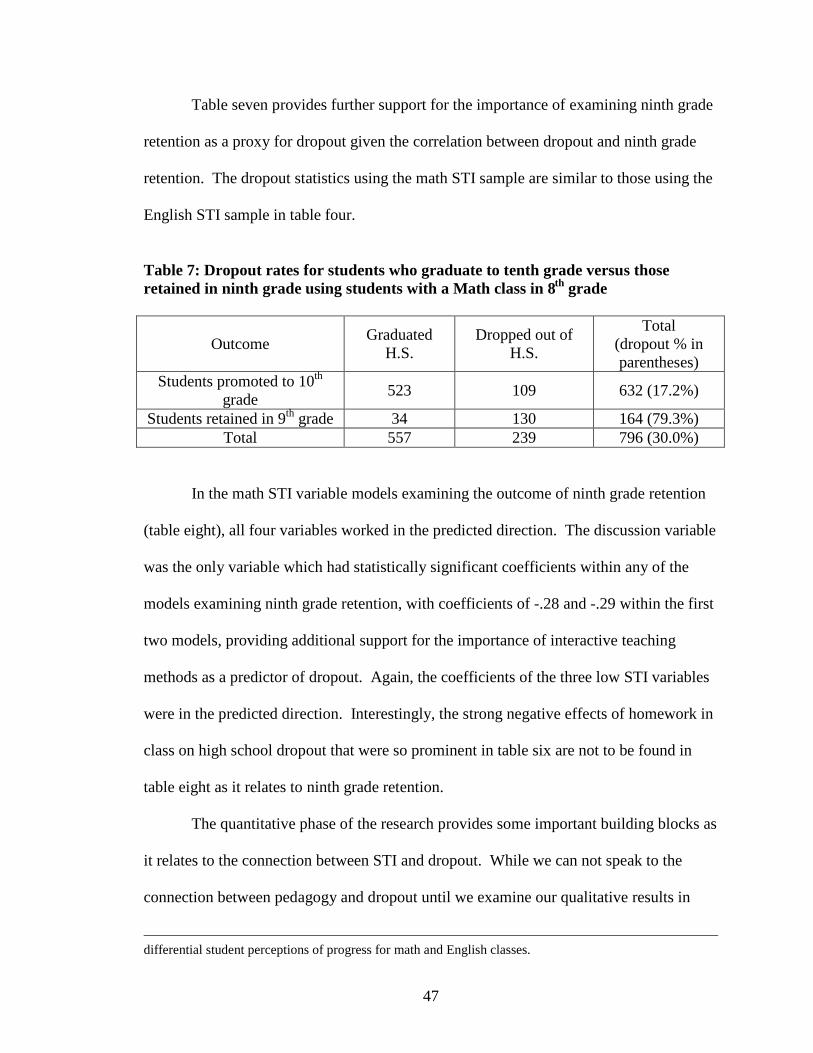
47
Table seven provides further support for the importance of examining ninth grade
retention as a proxy for dropout given the correlation between dropout and ninth grade
retention. The dropout statistics using the math STI sample are similar to those using the
English STI sample in table four.
Table 7: Dropout rates for students who graduate to tenth grade versus thoseretained in ninth grade using students with a Math class in 8th grade
OutcomeGraduated
H.S.Dropped out of
H.S.
Total(dropout % in parentheses)
Students promoted to 10th
grade523 109 632 (17.2%)
Students retained in 9th grade 34 130 164 (79.3%)Total 557 239 796 (30.0%)
In the math STI variable models examining the outcome of ninth grade retention
(table eight), all four variables worked in the predicted direction. The discussion variable
was the only variable which had statistically significant coefficients within any of the
models examining ninth grade retention, with coefficients of -.28 and -.29 within the first
two models, providing additional support for the importance of interactive teaching
methods as a predictor of dropout. Again, the coefficients of the three low STI variables
were in the predicted direction. Interestingly, the strong negative effects of homework in
class on high school dropout that were so prominent in table six are not to be found in
table eight as it relates to ninth grade retention.
The quantitative phase of the research provides some important building blocks as
it relates to the connection between STI and dropout. While we can not speak to the
connection between pedagogy and dropout until we examine our qualitative results in
differential student perceptions of progress for math and English classes.
48
Table 8: Logistical regression models predicting ninth grade retention, based on math STI variables (Standard errors are in parentheses)(Discussion during class is a high interaction variable, in bold. The remaining STI variables are low interaction, in italics)
Variable
STI Variables
Model 1: STI Variable Alone
Model 2: STI Variable as part of model
including all 6 STI variables
Model 3: Variable as part of model
including all 6 STI variables and full
background controlsDiscussion between teacher
and students in class-.2788*(.1690)
-.2918*(.1704)
-.1848(.1872)
Lectures in class .2106(.1671)
.2269(.1688)
.2114(.1863)
Working on papers alone in class
-.0288(.1728)
-.0586(.1740)
-.0062(.1912)
Working on homework within class time
.1612(.1767)
.1841(.1722)
.1174(.1896)
Control Variables (Reference Groups Excluded)
Male Dummy Variable ------------ ------------ .3092* (.1843)
Hispanic Dummy Variable ------------ ------------ .2099 (.3047)
White Dummy Variable ------------ ------------ .1922 (.2490)
Asian Dummy Variable ------------ ------------Predicted Failure
PerfectlyOther Race Dummy Variable ------------ ------------ 1.850* (1.098)
Low Aspiration Dummy Variable ------------ ------------ .4066* (.2229)High Aspiration Dummy Variable ------------ ------------ -.5264** (.2332)
Social Integration Index ------------ ------------ -.1518 (.1395)Pro-Social Friends Index ------------ ------------ -.2934 (.1878)8th Grade English GPA ------------ ------------ -.6580*** (.1009)
Small Learning Community Dummy Variable
------------ ------------ .7092** (.3390)
Self-Esteem Dummy Variable ------------ ------------ -.0924 (.1861)Enrollment in College Prep
Math Class ------------ ------------ .2225 (.2354)
Mother’s Marital Status Dummy Variable
------------ ------------ -.5536*** (.2102)
Welfare Receipt Dummy Variable
------------ ------------ .3477* (.2056)
Mother’s Less Than H.S. Diploma Dummy Variable
------------ ------------ -.0719 (.2342)
Mother’s Some College or More Dummy Variable
------------ ------------ .0998 (.2121)
N = 898
Certain control variables were excluded as reference groups within the regression models. These variables are: female dummy variable, African-American dummy variable, average aspirations (defined as aspirations to graduate a 4 year university, but no more), and mother received a H.S. diploma but no more dummy variable.*- Significant at the .1 level (2 tailed)**- Significant at the .05 level (2 tailed)***- Significant at the .01 level (2 tailed
49
order to link the STI variables and specific pedagogies (and also examine other
interactive pedagogies which PELS is unable to approximate), we have provided an
important foundation on which I base my later results. The quantitative results indicate
that non-interactive teaching methods during the ninth grade are predictive of dropout for
this at-risk population. In addition, these results provide us with suggestive evidence that
interaction during ninth grade classes is predictive of ninth grade completion, a strong
correlate of high school graduation.
Qualitative Results
Teachers as an Influence in Dropout: Student Perspectives
This section examines the positive effects, namely attachment to school, of
specific interactions and methods the students referenced which primarily typify critical
thinking and caring pedagogies. It is this attachment to school, or sense of identity as a
student that Roderick and other theorists believe is an important factor in attachment to
high school and high school completion. Through negative student characterizations of
some of the low STI methods that were predictive of dropout in the quantitative section,
this section solidly connects the non-interactive low STI methods to the “pedagogy of
poverty”. This section also adds to our understanding of the positive effects of
interactive pedagogy by examining the specific types of in-class discussions that facilitate
attachment to school according to the students, exploring important types of interactive
pedagogy that may or may not relate to a specific STI variable25.
25 Before moving on I must briefly acknowledge other well-research impediments to high school graduation that the students revealed in a very personal way. The students described of the types of daily struggles we generally associate with high school age students in impoverished, crime-ridden areas: gang violence, single parenthood, drug addiction and distribution. In addition to these issues, the interviews indicated that students in PELS high schools deal with the same types of issues that affect many high school age children: self-esteem, self-identity, peer pressure, and boyfriend/girlfriend issues.
50
Critical Thinking
Many of the high school students interviewed felt that methods that stress critical
thinking may reduce school dropout through creating attachments to school. I interpreted
this through the manner in which they described the types of exercises that they perceive
as interesting. The methods which students found interesting have the common link of
utilizing critical thinking techniques:
Interviewer: If I could take y’alls teachers, and give them advice about the stuff you like that they doing…what you want me to tell them?Nas: More interacting in the classroom instead of doing papers, more open ended discussions.Eve: They need to do more of, like, in math you don’t gotta do worksheets and books and stuff, if you can get little games that deal with math, or you can have the student create games and stuff that’s dealing with math…
The comment from Nas specifically illustrates a link between in class discussion as
measured in PELS and high school attachment and completion. Eve’s desire to create
“little games” that deal with math also illustrates a desire an atmosphere which
encourages critical thinking exercises (which necessitate discussion) within the
classroom. On the other hand, we see methods consistent with the “pedagogy of poverty”
such as bookwork and worksheets, methods which are non-interactive by nature and
connected to dropout using PELS, also characterized here as impeding attachment to
school. These types of activities seem to discourage interaction and critical thinking as is
the case with other methods associated with the “pedagogy of poverty” (Haberman 1992,
Waxman & Padron 1995, Waxman & Padron 1994).
The student’s lived school experience allows a connection to emerge between
methods which inhibited critical thinking and a perceived lack of teacher caring:
51
Interviewer: What kind of things be keeping kids out of school, keep kids from coming to school?Wolverine: Some teachers. Our teachers, they don’t do nothing in the classroom, they just sit there, (we) do all the work, they don’t know nothing.
Busta: (Good teachers) pay attention to you, help you with your work. They make sure you just learning, they teach, know what I mean? A lot of teachers now, they just put something on the board and just want you to copy or work out a book. I want a teacher to teach me, to talk to me and make sure I understand...to me there aren’t a lot of good teachers in this school.
In Busta’s quote, he made a clear connection between critical thinking and caring
pedagogy. Busta equated “teaching” with interactive methods and examining knowledge,
as he wished for teachers to talk to him and make sure he understands the concepts they
teach. At the same time he considered methods such as copying off of the board,
consistent with lecturing (an STI variable), or working out of a book not to be “teaching”,
as this method did not promote critical thinking. I also interpret ed this passage as
equating critical thinking interaction with caring, through Busta’s wish to have teachers
pay attention to him and help him with his work to “make sure” he learns. We also see
through Wolverine’s quote that his teacher’s non-interactive methods seemed to instill
attitudes of hostility or apathy towards school within the student. This, in turn, led to
disassociation with school. These quotes lead us to question exactly what type of
pedagogy the student views as a caring. This is an interactive style of pedagogy I will
explore in the following section that does not directly associate with any quantitative STI
variable.
Before moving on, I should note that the students failed to mention any
involvement in Friere-like dialogical discourse. Consequently, they made no indication
that they desired or were aware of that style of pedagogy, which emphasizes a macro-
level sort of revolutionary agency within the classroom. They did, however, desire
52
critical thinking and a curriculum based on student teaching discussion that pushes the
student towards a sense of agency26 on a sort of micro-level. By this, I mean that
students reacted well to pedagogies or programs which help them feel as if they can
transform their immediate area or empower themselves towards fulfilling a personal goal.
An example of this is a program set up for high school students through University of
Pennsylvania’s Wharton Business School, where students learn the realities of
entrepreneurship through interactions with several guest speakers. Students then set up a
business proposal with contingencies for dealing with real life problems. This program
convinced Sole that she will stay in school and eventually “start (her) own entertainment
service where I have like singers, dancers, poets, and (celebrity) imposters” as a way to
become financially independent. These interactive types of agency building and critical
thinking based exercises have the potential, as Waxman and Padron (1994, 1995)
emphasize, to create links between the classroom and the daily lives of the students. This
in itself should make school more relevant to the students and create more of an
attachment to school.
Effects and Perceptions of Caring
Many students who characterized their teachers as a positive influence on their
staying in school described these teachers as people who genuinely cared about them and
created an atmosphere of care. Caring, according to the students, consisted of concerns
about their performance in the immediate sense of course achievement and in the long-
term sense of high school completion and beyond. It has been argued, most notably by
Noddings, that pedagogy of care, which includes a holistic, interdisciplinary education
26 By agency, I mean the actor’s perceived ability to influence and change any sort of oppressive social structures the actor may be a part of or encounter on a daily basis.
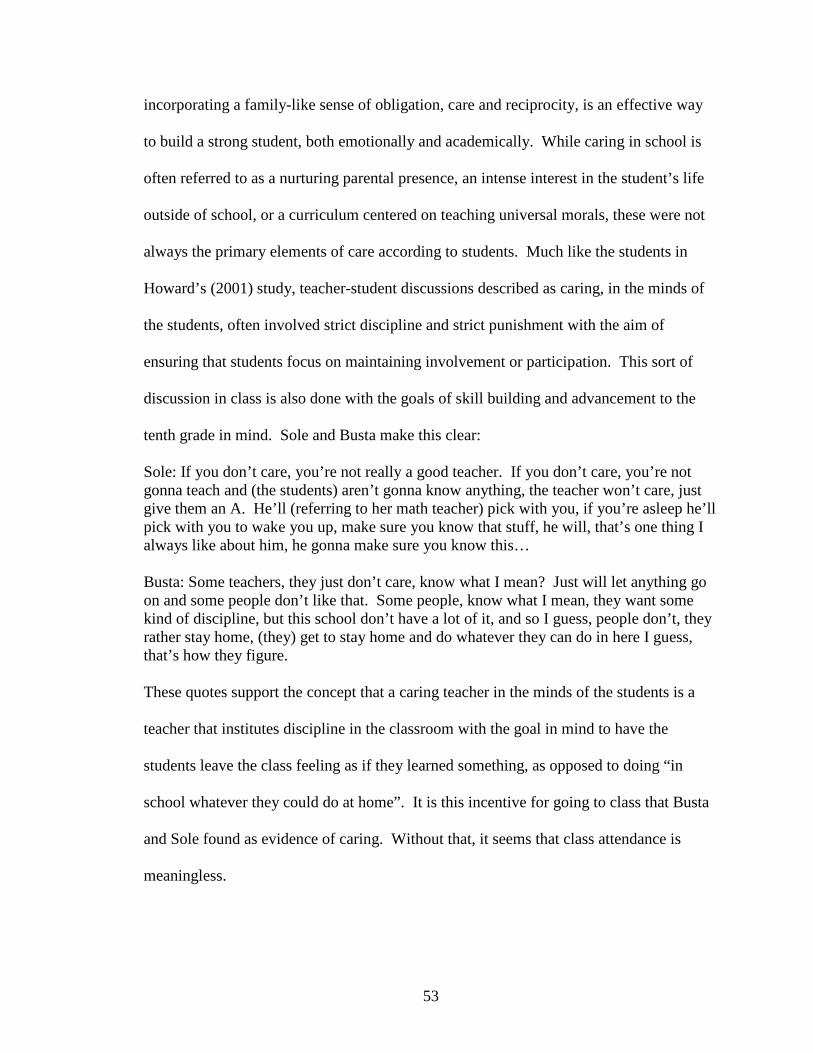
53
incorporating a family-like sense of obligation, care and reciprocity, is an effective way
to build a strong student, both emotionally and academically. While caring in school is
often referred to as a nurturing parental presence, an intense interest in the student’s life
outside of school, or a curriculum centered on teaching universal morals, these were not
always the primary elements of care according to students. Much like the students in
Howard’s (2001) study, teacher-student discussions described as caring, in the minds of
the students, often involved strict discipline and strict punishment with the aim of
ensuring that students focus on maintaining involvement or participation. This sort of
discussion in class is also done with the goals of skill building and advancement to the
tenth grade in mind. Sole and Busta make this clear:
Sole: If you don’t care, you’re not really a good teacher. If you don’t care, you’re not gonna teach and (the students) aren’t gonna know anything, the teacher won’t care, just give them an A. He’ll (referring to her math teacher) pick with you, if you’re asleep he’ll pick with you to wake you up, make sure you know that stuff, he will, that’s one thing I always like about him, he gonna make sure you know this…
Busta: Some teachers, they just don’t care, know what I mean? Just will let anything go on and some people don’t like that. Some people, know what I mean, they want some kind of discipline, but this school don’t have a lot of it, and so I guess, people don’t, they rather stay home, (they) get to stay home and do whatever they can do in here I guess, that’s how they figure.
These quotes support the concept that a caring teacher in the minds of the students is a
teacher that institutes discipline in the classroom with the goal in mind to have the
students leave the class feeling as if they learned something, as opposed to doing “in
school whatever they could do at home”. It is this incentive for going to class that Busta
and Sole found as evidence of caring. Without that, it seems that class attendance is
meaningless.
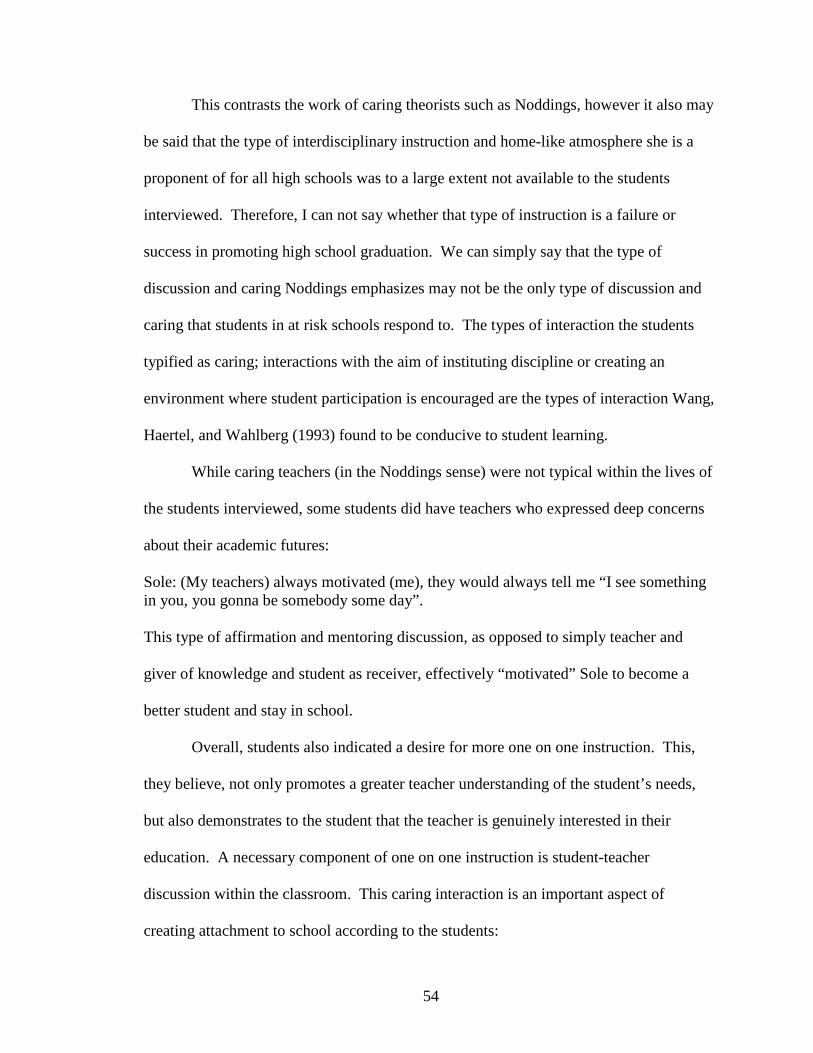
54
This contrasts the work of caring theorists such as Noddings, however it also may
be said that the type of interdisciplinary instruction and home-like atmosphere she is a
proponent of for all high schools was to a large extent not available to the students
interviewed. Therefore, I can not say whether that type of instruction is a failure or
success in promoting high school graduation. We can simply say that the type of
discussion and caring Noddings emphasizes may not be the only type of discussion and
caring that students in at risk schools respond to. The types of interaction the students
typified as caring; interactions with the aim of instituting discipline or creating an
environment where student participation is encouraged are the types of interaction Wang,
Haertel, and Wahlberg (1993) found to be conducive to student learning.
While caring teachers (in the Noddings sense) were not typical within the lives of
the students interviewed, some students did have teachers who expressed deep concerns
about their academic futures:
Sole: (My teachers) always motivated (me), they would always tell me “I see something in you, you gonna be somebody some day”.
This type of affirmation and mentoring discussion, as opposed to simply teacher and
giver of knowledge and student as receiver, effectively “motivated” Sole to become a
better student and stay in school.
Overall, students also indicated a desire for more one on one instruction. This,
they believe, not only promotes a greater teacher understanding of the student’s needs,
but also demonstrates to the student that the teacher is genuinely interested in their
education. A necessary component of one on one instruction is student-teacher
discussion within the classroom. This caring interaction is an important aspect of
creating attachment to school according to the students:
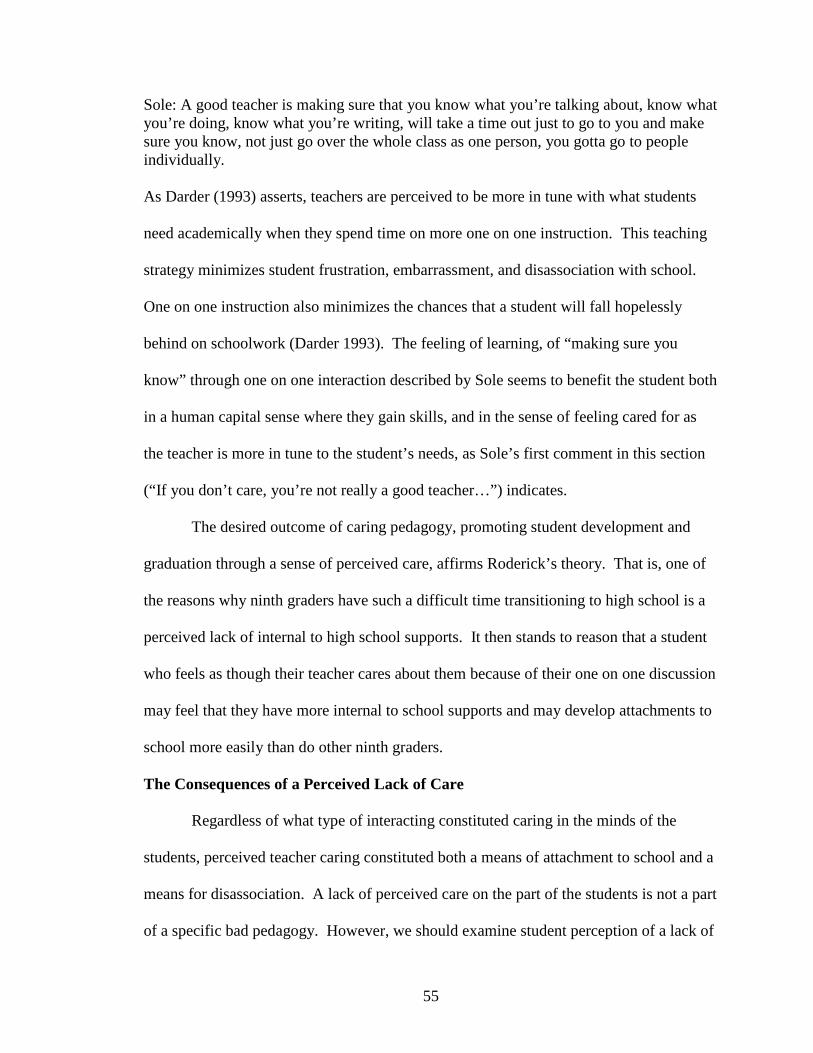
55
Sole: A good teacher is making sure that you know what you’re talking about, know what you’re doing, know what you’re writing, will take a time out just to go to you and make sure you know, not just go over the whole class as one person, you gotta go to people individually.
As Darder (1993) asserts, teachers are perceived to be more in tune with what students
need academically when they spend time on more one on one instruction. This teaching
strategy minimizes student frustration, embarrassment, and disassociation with school.
One on one instruction also minimizes the chances that a student will fall hopelessly
behind on schoolwork (Darder 1993). The feeling of learning, of “making sure you
know” through one on one interaction described by Sole seems to benefit the student both
in a human capital sense where they gain skills, and in the sense of feeling cared for as
the teacher is more in tune to the student’s needs, as Sole’s first comment in this section
(“If you don’t care, you’re not really a good teacher…”) indicates.
The desired outcome of caring pedagogy, promoting student development and
graduation through a sense of perceived care, affirms Roderick’s theory. That is, one of
the reasons why ninth graders have such a difficult time transitioning to high school is a
perceived lack of internal to high school supports. It then stands to reason that a student
who feels as though their teacher cares about them because of their one on one discussion
may feel that they have more internal to school supports and may develop attachments to
school more easily than do other ninth graders.
The Consequences of a Perceived Lack of Care
Regardless of what type of interacting constituted caring in the minds of the
students, perceived teacher caring constituted both a means of attachment to school and a
means for disassociation. A lack of perceived care on the part of the students is not a part
of a specific bad pedagogy. However, we should examine student perception of a lack of
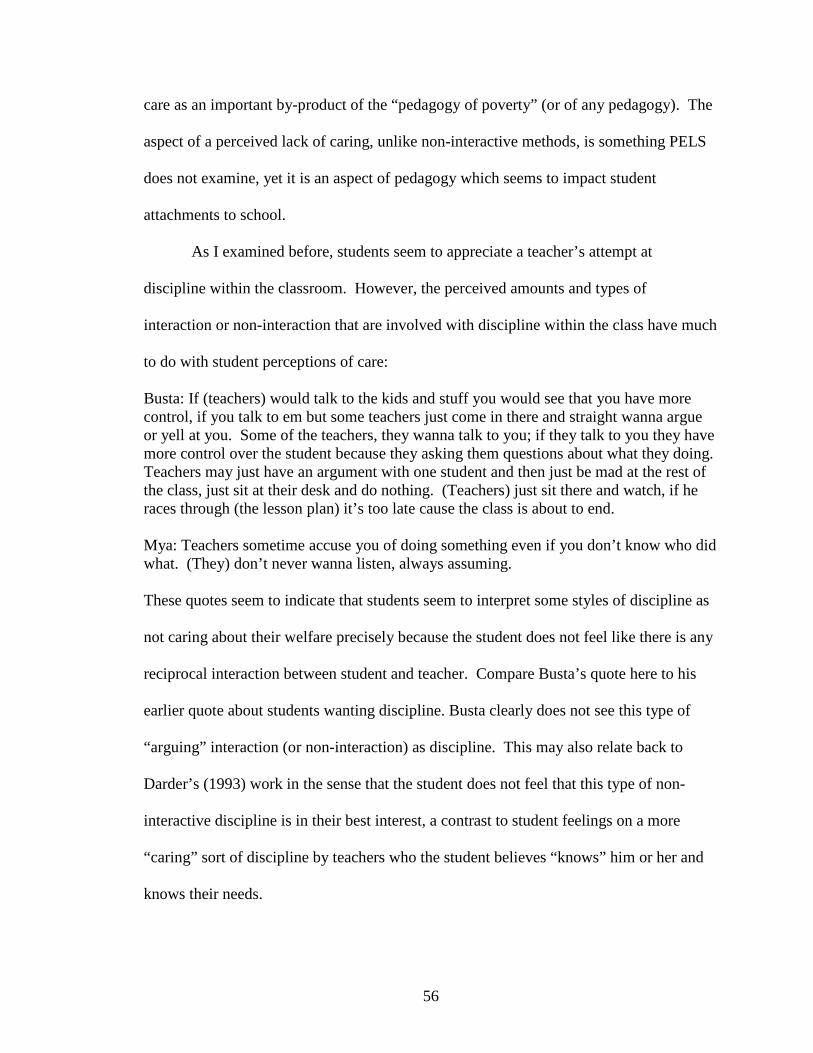
56
care as an important by-product of the “pedagogy of poverty” (or of any pedagogy). The
aspect of a perceived lack of caring, unlike non-interactive methods, is something PELS
does not examine, yet it is an aspect of pedagogy which seems to impact student
attachments to school.
As I examined before, students seem to appreciate a teacher’s attempt at
discipline within the classroom. However, the perceived amounts and types of
interaction or non-interaction that are involved with discipline within the class have much
to do with student perceptions of care:
Busta: If (teachers) would talk to the kids and stuff you would see that you have more control, if you talk to em but some teachers just come in there and straight wanna argue or yell at you. Some of the teachers, they wanna talk to you; if they talk to you they have more control over the student because they asking them questions about what they doing. Teachers may just have an argument with one student and then just be mad at the rest of the class, just sit at their desk and do nothing. (Teachers) just sit there and watch, if he races through (the lesson plan) it’s too late cause the class is about to end.
Mya: Teachers sometime accuse you of doing something even if you don’t know who did what. (They) don’t never wanna listen, always assuming.
These quotes seem to indicate that students seem to interpret some styles of discipline as
not caring about their welfare precisely because the student does not feel like there is any
reciprocal interaction between student and teacher. Compare Busta’s quote here to his
earlier quote about students wanting discipline. Busta clearly does not see this type of
“arguing” interaction (or non-interaction) as discipline. This may also relate back to
Darder’s (1993) work in the sense that the student does not feel that this type of non-
interactive discipline is in their best interest, a contrast to student feelings on a more
“caring” sort of discipline by teachers who the student believes “knows” him or her and
knows their needs.
57
Students also shared their personal experiences in which teachers punished
students verbally through negative reinforcement:
Bleek: I had a teacher come up to me and say “well I don’t like you, why are you here?” If I didn’t think of myself highly and what, I would care what he said and wouldn’t do what I have to do, and I would have left, I wouldn’t have came to school anymore like well the teachers don’t care so I don’t care either.
This is quote a contrast from Mya’s earlier statement about her teachers, who told her “I
see something in you, you gonna be somebody someday”. While not all cases may be
this clear cut, negative reinforcement from a teacher may signal decisions to drop out of
school not only from frustration with the “banking” education concept, but also from the
perspective of self-esteem. Students who have negative experiences with teachers similar
to Bleek have their self-esteem directly attacked during a transition period where students
struggle to find their place in school. According to Seidman, LaRue, Aber, Mitchell and
Feinman’s “The Impact of School Transitions in Early Adolescence on the Self-System
and Perceived Social Context of Poor Urban Youth” (1994), this is where the student’s
self-esteem is at its weakest. With little support from the school, students choose to react
in ways that allow them to look “hard”27 in the eyes of their peers:
Bleek: They (students) got too much pride…they not gonna listen to (teachers) because their pride, their peoples (friends) are around, they can’t feel like a dummy or get chumped (made to look foolish) in front of somebody.
Mya: What I think keeps kids out of school are some of the teachers and the way they treat the students… they just snap on a kid and the kid say “I’m not coming here”.
Mya and Bleek’s quotes above illustrate this point. If a teacher caused the student to feel
stupid or treated the student in a manner the student found disrespectful, as when Mya
27 L. Janelle Dance, in her book “Tough Fronts” conceptualizes the term “being hard”. I define being hard as giving off a perception (which may or may not be reality) that one is ready to defend him or herself verbally or physically if need be, and that it is dangerous for anyone to “chump” them or make them out to
58
said that a teacher “snaps” on a student, the student seemed to remove themselves from
the class either physically (as in Mya’s quote) or mentally (as in Bleek’s quote) in
reaction to the teacher.
“Throwing a Joke”
Another interesting aspect of the focus group and interviews was the frequency
with which having a teacher that the students considered funny or entertaining was
correlated with building attachment to school. Teachers that carried on a positive, casual
discussion with the classroom as a part of the daily activities often endeared themselves
to the students. This mirrors one aspect of Ball’s (2000) study of effective teaching
methods in non-academic settings, in which she chronicled the positive student-teacher
relationships which came in part from the teacher conversing casually with the students
and using the student’s cultural capital to their advantage through sometimes informal,
joking, culturally relative instruction. It was in this manner one teacher in the Ball study
conveyed encouragement to her students. These methods seem to humanize the teacher
in the eyes of the students that were interviewed, as well as create a sense of more
individualized interaction. This affected both student’s viewpoint of school and their
feeling of attachment to school as we see by revisiting Busta’s earlier comment:
Interviewer: Would there by any changes (in school) you would make to pull kids back into the school?Busta: You gotta make it, the teachers, they gotta like do something interesting, like Mr. Johnson’s class, his class is interesting because he throws a joke in there every once in a while and we laughing but some teachers just take their job too seriously they just say well do this and do that, I thought they were there to help you.
look foolish because of the possibility of verbal or physical retribution. This also refers to a sense of “street smarts”. Being “hard” may also be seen as a derivation of Erving Goffman’s (1959) idea of “saving face”.
59
An interesting aspect of Busta’s quote is how he seemed to equate joking and an
ability to keep the class interesting and helpful. This may describe another process by
which “throwing a joke” helps create attachments to school for the high school students.
When Busta’s teacher began to joke with the class, the teacher humanized himself, and
this breech of the teacher as distributor and student as receiver of knowledge introduced
elements of reciprocity and perceived care. This perceived care through “throwing a
joke”, in turn, is something Busta believed would help “pull students into school”.
While we may characterize “throwing a joke” as an effective interactive teaching
method in relation to dropout, because students did not specifically characterize this
joking as culturally relative, we may only infer that it may be a component of a caring,
critical thinking or a culturally relative pedagogy.
Conclusions
In developing this research, my goal was to answer the question: “what are the
effects (if any) of interactive pedagogy during the ninth grade on future dropout?” I set
out to answer this by quantitatively examining the predictive power of pedagogy relying
on student-teacher interaction, and pedagogy deficient of student-teacher interaction on
dropout outcomes. The quantitative phase of the analysis provided supporting evidence
that interactive and non-interactive teaching methods impacts the dropout outcomes of
students. In particular, low STI (non-interactive) methods such as homework or journals
during English class have predictive effects on high school dropout for students. The
models examining the outcome of ninth grade retention as a correlate of dropout
demonstrated both the positive effects of STI through discussion in class and the negative
effects of non-interaction through lecture and journals during class. The next step was to
60
link these teaching methods with pedagogy, as well as examine pedagogy with aspects
the PELS variables could not approximate.
The students described in further detail pedagogy that they find most compelling
in developing an attachment to school in the qualitative phase. I was able to link several
teaching methods from the quantitative phase, particularly discussion during the class, to
aspects of pedagogy students described as employing critical thinking (and caring to an
extent). Furthermore, I was able to display the importance of critical thinking and caring
pedagogy in creating attachment to school. I was also able to link some of the low STI
methods such as worksheets in class to a lack of critical thinking or perceived caring.
The students expressed their displeasure with these non-interactive methods consistent
with the “pedagogy of poverty”, characterizing these methods as influential in
detachment to school and dropout.
The aspects of the pedagogies which students find important in high school
graduation may be summed up through two main themes: a practical skill building
approach, and an emphasis on micro-level agency. These two themes incorporate the
caring pedagogy typified by both “respectful” discipline and an emphasis on skill
building. These themes incorporate aspects of the critical thinking pedagogy both in the
sense of skill building and in the sense of encouraging agency. Agency is encouraged
two ways through a critical thinking pedagogy: first through the less traditional teaching
methods that are a contrast to the more common methods which typify the “pedagogy of
poverty”, and secondly through the content of a critical thinking curriculum, which
emphasized a micro-level agency that stresses the ability of the student to change his or
her immediate surroundings.
61
In examining the effect of student-teacher interaction within the ninth grade, my
aim was to fit an important piece into place within a very complicated puzzle. While
many of these pieces have already been put into place, transition year pedagogy may be
seen as an especially large piece of this puzzle, for this seems to be a more direct factor in
dropout decisions as opposed to external to school factors which many students
experienced.
The effect of student-teacher interaction during the transition year to high school
is a relatively new piece of the puzzle of high school dropout, near its center. As we
examine this piece of the puzzle and find a place for it in the grander scheme of
educational research concerning dropout , we begin to get an idea about how other nearby
empty spaces in this puzzle may be shaped, however we do not exactly know how the
pieces that fit in these spaces look. Exploring these empty spaces of research will bring
about important implications within educational theory and social psychology.
From an educational theory standpoint, in addition to my main findings regarding
the effects of interactive ninth grade pedagogy on dropout, I have provided further
support for the works of Melissa Roderick and others who have emphasized the
importance of the transition year to high school. This also lends some measure of support
to academic resilience literature in the sense that we see that at-risk districts seem to have
very low rates of resilience. This research also provides an interesting spin on Noddings’
pedagogy of care and provides us with an alternative lens through which students may
perceive care; namely a pedagogy of skill building and agency encouraging.
Furthermore, I have examined the link between interaction and perceived care/critical
thinking.
62
The question of attachment to school has implications in social psychological
theory as well. This study provides ample support through its qualitative phase of the
study for existing research regarding the concept of diminishing self-esteem during a
transition to a new school. Several of the students interviewed raised the issue of self-
identity and how this is developed and questioned during the transition year to school,
leading many new students to not have a clear sense of self. The diminishing self-esteem
and unclear sense of self that many students transitioning to high school deal with lead us
to question the internal process of developing attachments within a school, or within any
organization. While we begin to see the process of attachment in detail through the
micro-level lens of the qualitative phase, more research is needed to examine what
factors, particularly internal but external to school as well such as parental involvement,
play a role in developing an attachment to and identification with school. The
implications of this question reach not only to educational theory but to organizational
theory as well.
I would like to end with a quote from Sole: “Students, really they are the future.
We need to keep our priorities straight…that (education) is really everything. It really is
everything”. While some might debate Sole that education really is the “great equalizer”,
and while our educational system is hardly unflawed, I believe that our educational
system does have potential to become an equalizing force. In an age where No Child
Left Behind has left schools more accountable for their student’s performance while
inadequately providing these districts with the tools for improving their student’s skills,
there is a priority to examine methods through which high school dropout can be
minimized and student performance can be maximized. Without an increased emphasis
63
on ways in which high dropout districts can help students build skills, recognize their
agency and raise test scores while encouraging them to stay in school, the district in
which a student attends school will have an increasingly deterministic effect on the
student’s outcome, putting thousands of students at an increasing risk.
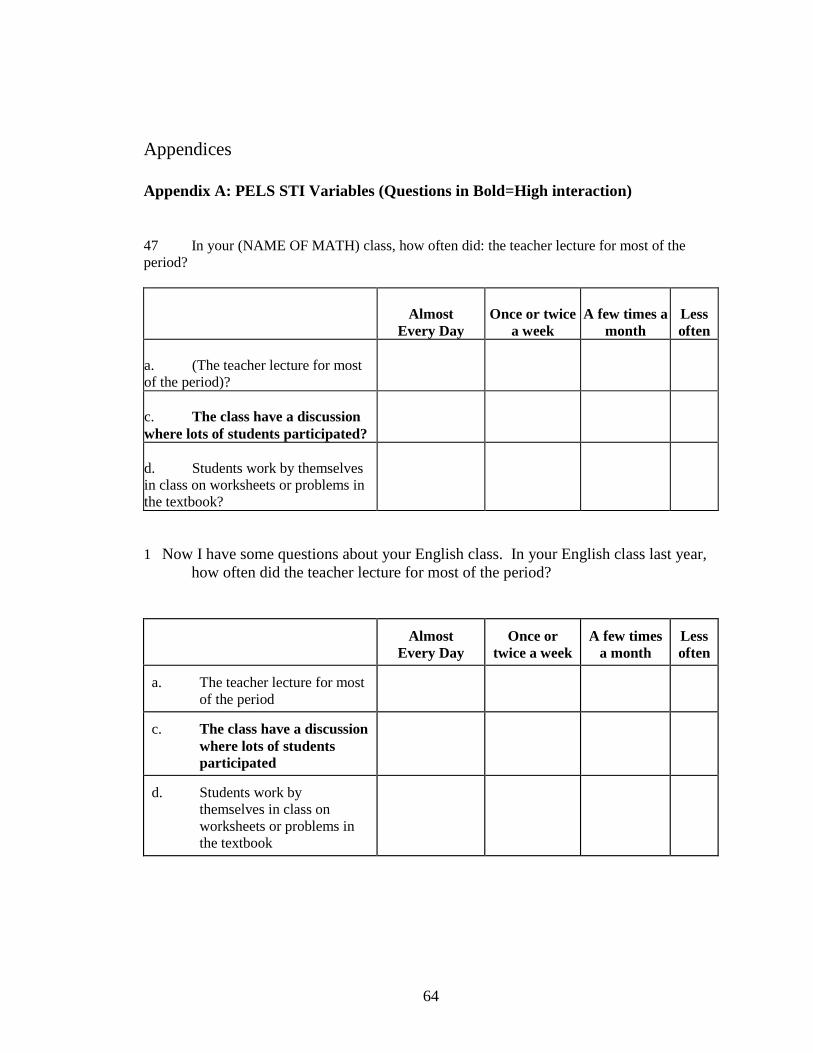
64
Appendices
Appendix A: PELS STI Variables (Questions in Bold=High interaction)
47 In your (NAME OF MATH) class, how often did: the teacher lecture for most of the period?
Almost Every Day
Once or twice a week
A few times a month
Less often
a. (The teacher lecture for most of the period)?
c. The class have a discussion where lots of students participated?
d. Students work by themselves in class on worksheets or problems in the textbook?
1 Now I have some questions about your English class. In your English class last year, how often did the teacher lecture for most of the period?
Almost Every Day
Once or twice a week
A few times a month
Less often
a. The teacher lecture for most of the period
c. The class have a discussion where lots of students participated
d. Students work by themselves in class on worksheets or problems in the textbook
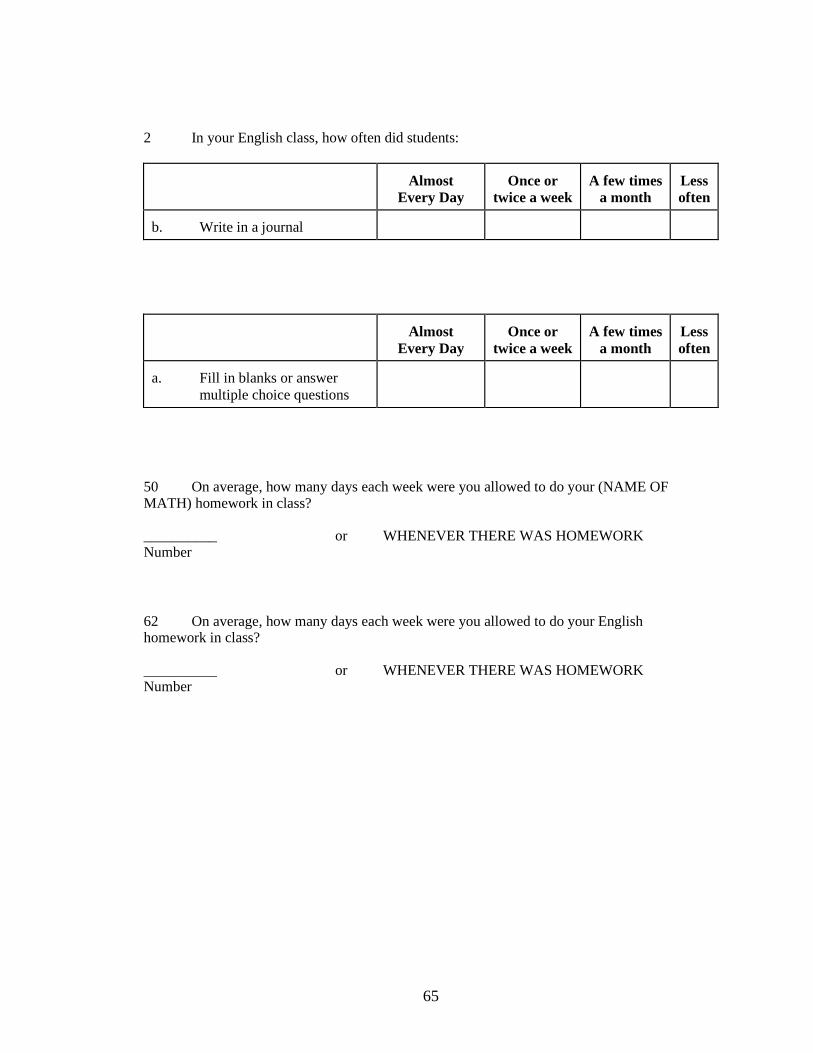
65
2 In your English class, how often did students:
Almost Every Day
Once or twice a week
A few times a month
Less often
b. Write in a journal
Almost Every Day
Once or twice a week
A few times a month
Less often
a. Fill in blanks or answer multiple choice questions
50 On average, how many days each week were you allowed to do your (NAME OF MATH) homework in class?
__________ or WHENEVER THERE WAS HOMEWORKNumber
62 On average, how many days each week were you allowed to do your English homework in class?
__________ or WHENEVER THERE WAS HOMEWORKNumber
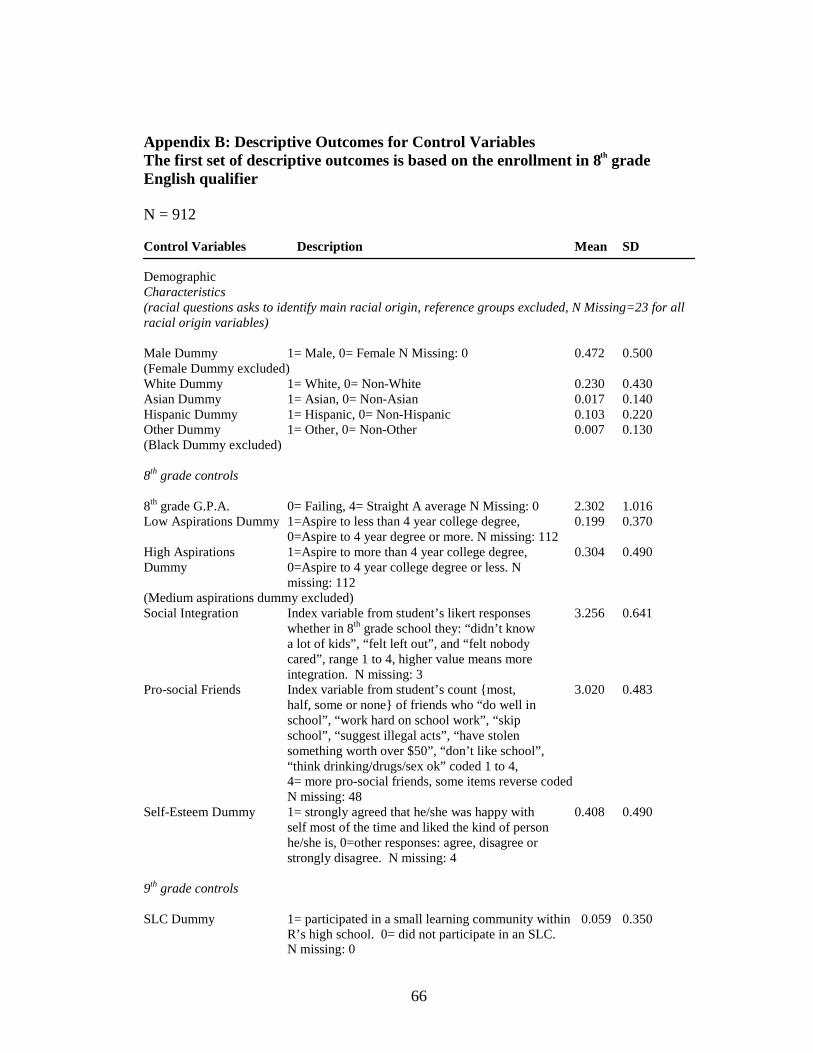
66
Appendix B: Descriptive Outcomes for Control VariablesThe first set of descriptive outcomes is based on the enrollment in 8th grade English qualifier
N = 912
Control Variables Description Mean SD
Demographic Characteristics (racial questions asks to identify main racial origin, reference groups excluded, N Missing=23 for all racial origin variables)
Male Dummy 1= Male, 0= Female N Missing: 0 0.472 0.500(Female Dummy excluded)White Dummy 1= White, 0= Non-White 0.230 0.430Asian Dummy 1= Asian, 0= Non-Asian 0.017 0.140Hispanic Dummy 1= Hispanic, 0= Non-Hispanic 0.103 0.220Other Dummy 1= Other, 0= Non-Other 0.007 0.130(Black Dummy excluded)
8th grade controls
8th grade G.P.A. 0= Failing, 4= Straight A average N Missing: 0 2.302 1.016Low Aspirations Dummy 1=Aspire to less than 4 year college degree, 0.199 0.370
0=Aspire to 4 year degree or more. N missing: 112High Aspirations 1=Aspire to more than 4 year college degree, 0.304 0.490Dummy 0=Aspire to 4 year college degree or less. N
missing: 112(Medium aspirations dummy excluded)Social Integration Index variable from student’s likert responses 3.256 0.641
whether in 8th grade school they: “didn’t know a lot of kids”, “felt left out”, and “felt nobody cared”, range 1 to 4, higher value means more integration. N missing: 3
Pro-social Friends Index variable from student’s count {most, 3.020 0.483 half, some or none} of friends who “do well in school”, “work hard on school work”, “skip school”, “suggest illegal acts”, “have stolen something worth over $50”, “don’t like school”, “think drinking/drugs/sex ok” coded 1 to 4, 4= more pro-social friends, some items reverse codedN missing: 48
Self-Esteem Dummy 1= strongly agreed that he/she was happy with 0.408 0.490self most of the time and liked the kind of person he/she is, 0=other responses: agree, disagree or strongly disagree. N missing: 4
9th grade controls
SLC Dummy 1= participated in a small learning community within 0.059 0.350R’s high school. 0= did not participate in an SLC.N missing: 0
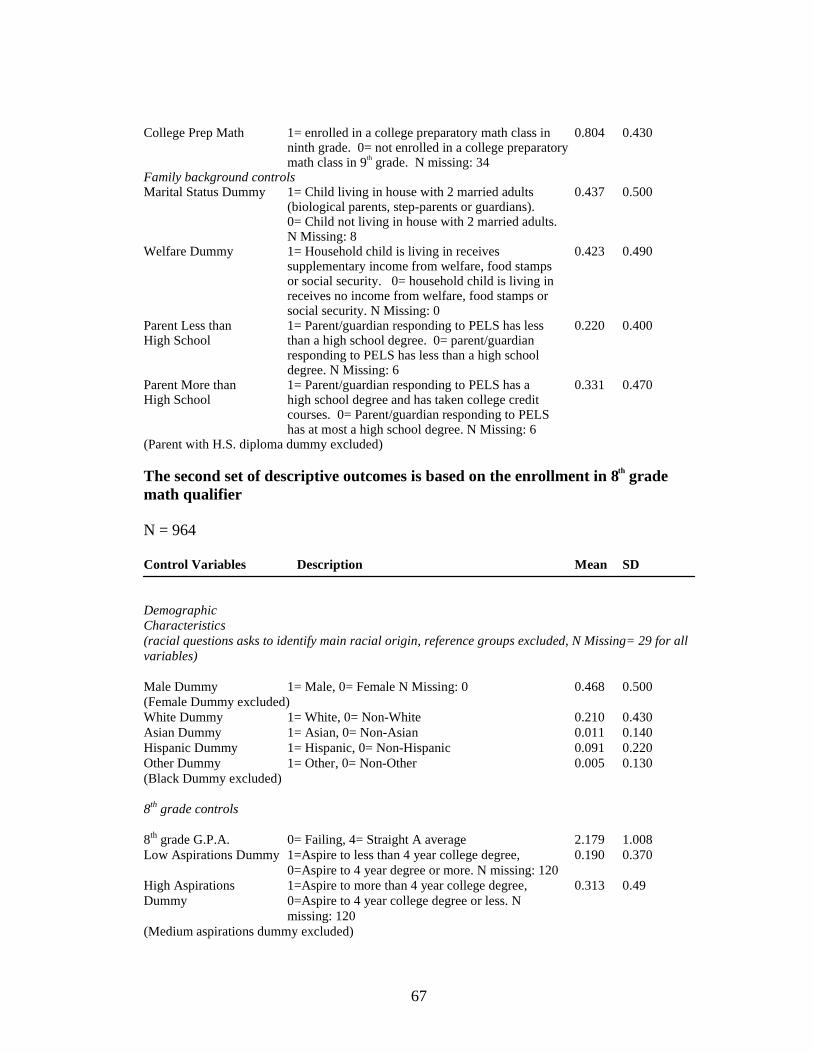
67
College Prep Math 1= enrolled in a college preparatory math class in 0.804 0.430ninth grade. 0= not enrolled in a college preparatory math class in 9th grade. N missing: 34
Family background controls Marital Status Dummy 1= Child living in house with 2 married adults 0.437 0.500
(biological parents, step-parents or guardians). 0= Child not living in house with 2 married adults.N Missing: 8
Welfare Dummy 1= Household child is living in receives 0.423 0.490supplementary income from welfare, food stamps or social security. 0= household child is living in receives no income from welfare, food stamps orsocial security. N Missing: 0
Parent Less than 1= Parent/guardian responding to PELS has less 0.220 0.400High School than a high school degree. 0= parent/guardian
responding to PELS has less than a high school degree. N Missing: 6
Parent More than 1= Parent/guardian responding to PELS has a 0.331 0.470High School high school degree and has taken college credit
courses. 0= Parent/guardian responding to PELShas at most a high school degree. N Missing: 6
(Parent with H.S. diploma dummy excluded)
The second set of descriptive outcomes is based on the enrollment in 8th grade math qualifier
N = 964
Control Variables Description Mean SD
Demographic Characteristics (racial questions asks to identify main racial origin, reference groups excluded, N Missing= 29 for all variables)
Male Dummy 1= Male, 0= Female N Missing: 0 0.468 0.500(Female Dummy excluded)White Dummy 1= White, 0= Non-White 0.210 0.430Asian Dummy 1= Asian, 0= Non-Asian 0.011 0.140Hispanic Dummy 1= Hispanic, 0= Non-Hispanic 0.091 0.220Other Dummy 1= Other, 0= Non-Other 0.005 0.130(Black Dummy excluded)
8th grade controls
8th grade G.P.A. 0= Failing, 4= Straight A average 2.179 1.008Low Aspirations Dummy 1=Aspire to less than 4 year college degree, 0.190 0.370
0=Aspire to 4 year degree or more. N missing: 120High Aspirations 1=Aspire to more than 4 year college degree, 0.313 0.49Dummy 0=Aspire to 4 year college degree or less. N
missing: 120(Medium aspirations dummy excluded)
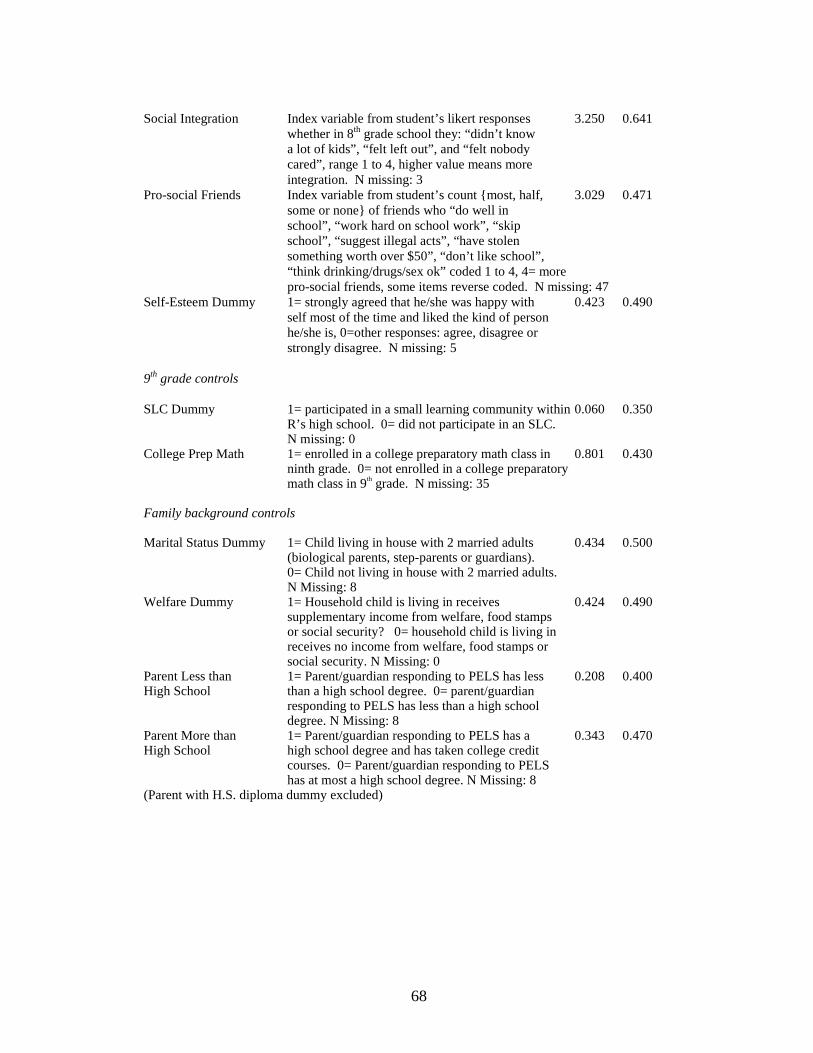
68
Social Integration Index variable from student’s likert responses 3.250 0.641whether in 8th grade school they: “didn’t know a lot of kids”, “felt left out”, and “felt nobody cared”, range 1 to 4, higher value means more integration. N missing: 3
Pro-social Friends Index variable from student’s count {most, half, 3.029 0.471 some or none} of friends who “do well in school”, “work hard on school work”, “skip school”, “suggest illegal acts”, “have stolen something worth over $50”, “don’t like school”, “think drinking/drugs/sex ok” coded 1 to 4, 4= morepro-social friends, some items reverse coded. N missing: 47
Self-Esteem Dummy 1= strongly agreed that he/she was happy with 0.423 0.490self most of the time and liked the kind of person he/she is, 0=other responses: agree, disagree or strongly disagree. N missing: 5
9th grade controls
SLC Dummy 1= participated in a small learning community within 0.060 0.350R’s high school. 0= did not participate in an SLC.N missing: 0
College Prep Math 1= enrolled in a college preparatory math class in 0.801 0.430ninth grade. 0= not enrolled in a college preparatory math class in 9th grade. N missing: 35
Family background controls
Marital Status Dummy 1= Child living in house with 2 married adults 0.434 0.500(biological parents, step-parents or guardians). 0= Child not living in house with 2 married adults.N Missing: 8
Welfare Dummy 1= Household child is living in receives 0.424 0.490supplementary income from welfare, food stamps or social security? 0= household child is living in receives no income from welfare, food stamps orsocial security. N Missing: 0
Parent Less than 1= Parent/guardian responding to PELS has less 0.208 0.400High School than a high school degree. 0= parent/guardian
responding to PELS has less than a high school degree. N Missing: 8
Parent More than 1= Parent/guardian responding to PELS has a 0.343 0.470High School high school degree and has taken college credit
courses. 0= Parent/guardian responding to PELShas at most a high school degree. N Missing: 8
(Parent with H.S. diploma dummy excluded)
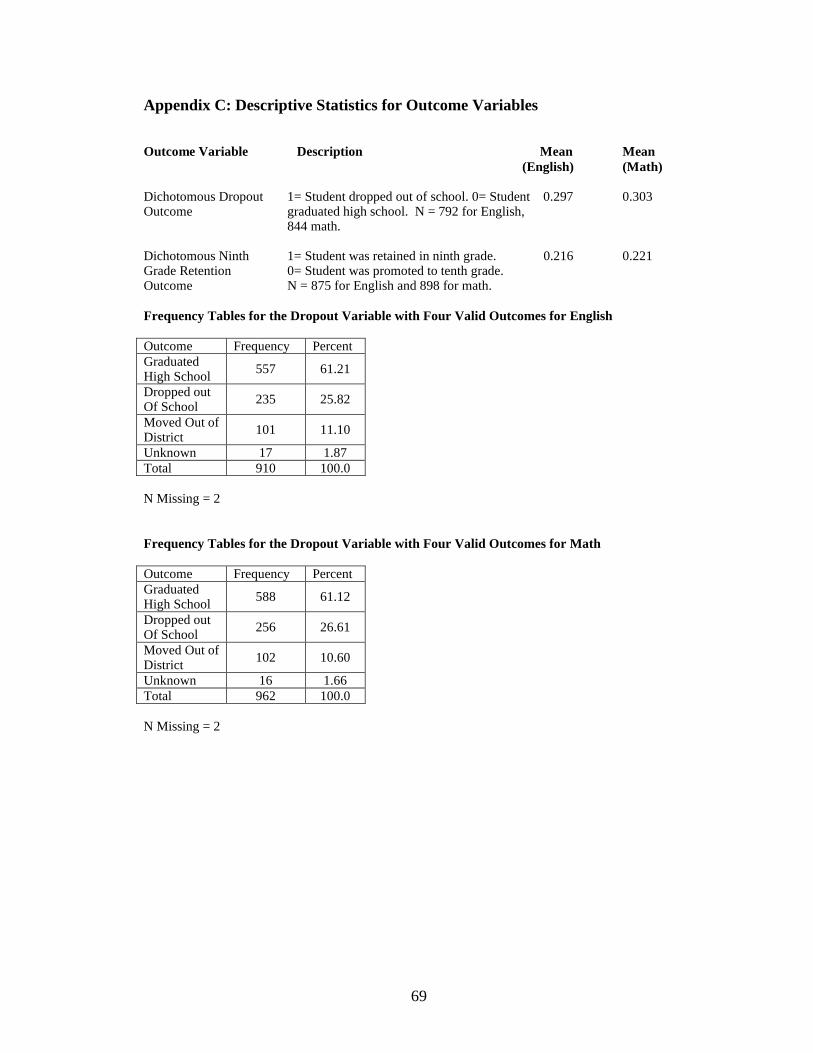
69
Appendix C: Descriptive Statistics for Outcome Variables
Outcome Variable Description Mean Mean(English) (Math)
Dichotomous Dropout 1= Student dropped out of school. 0= Student 0.297 0.303Outcome graduated high school. N = 792 for English,
844 math.
Dichotomous Ninth 1= Student was retained in ninth grade. 0.216 0.221Grade Retention 0= Student was promoted to tenth grade. Outcome N = 875 for English and 898 for math.
Frequency Tables for the Dropout Variable with Four Valid Outcomes for English
Outcome Frequency PercentGraduatedHigh School
557 61.21
Dropped outOf School
235 25.82
Moved Out ofDistrict
101 11.10
Unknown 17 1.87Total 910 100.0
N Missing = 2
Frequency Tables for the Dropout Variable with Four Valid Outcomes for Math
Outcome Frequency PercentGraduatedHigh School
588 61.12
Dropped outOf School
256 26.61
Moved Out ofDistrict
102 10.60
Unknown 16 1.66Total 962 100.0
N Missing = 2
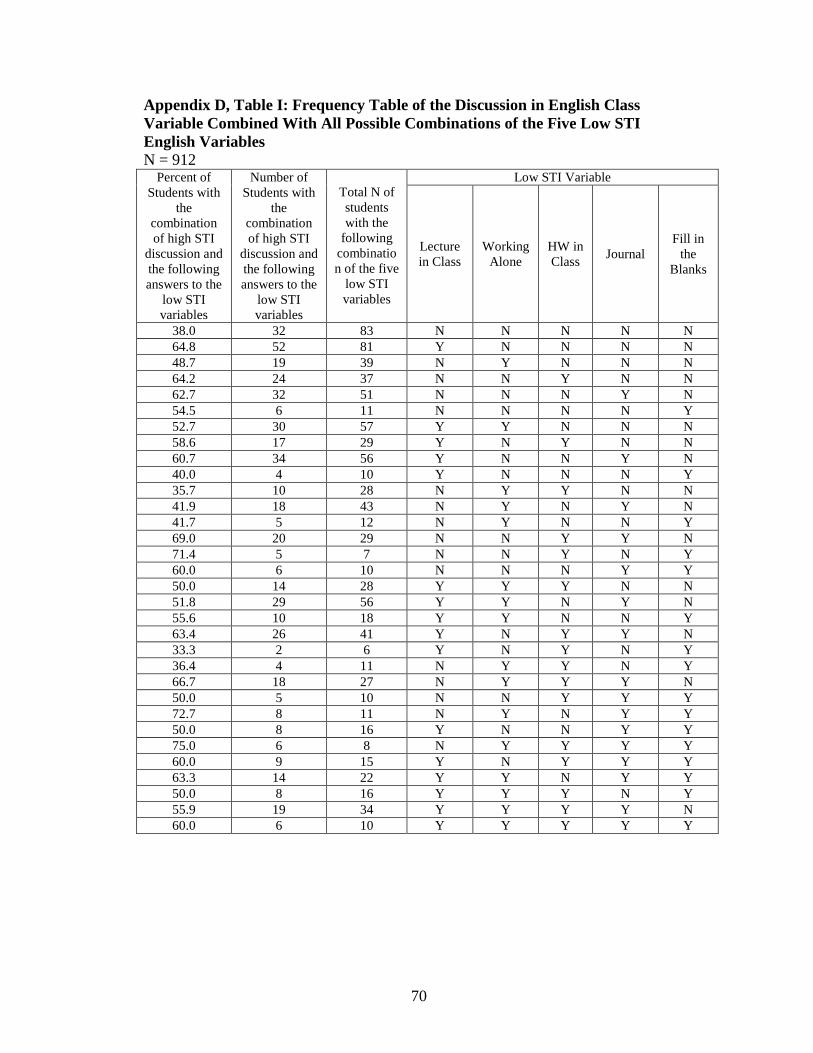
70
Appendix D, Table I: Frequency Table of the Discussion in English Class Variable Combined With All Possible Combinations of the Five Low STI English VariablesN = 912
Low STI VariablePercent of Students with
the combination of high STI
discussion and the following answers to the
low STI variables
Number of Students with
the combination of high STI
discussion and the following answers to the
low STI variables
Total N of students with the
following combination of the five
low STI variables
Lecture in Class
Working Alone
HW in Class
JournalFill in
the Blanks
38.0 32 83 N N N N N64.8 52 81 Y N N N N48.7 19 39 N Y N N N64.2 24 37 N N Y N N62.7 32 51 N N N Y N54.5 6 11 N N N N Y52.7 30 57 Y Y N N N58.6 17 29 Y N Y N N60.7 34 56 Y N N Y N40.0 4 10 Y N N N Y35.7 10 28 N Y Y N N41.9 18 43 N Y N Y N41.7 5 12 N Y N N Y69.0 20 29 N N Y Y N71.4 5 7 N N Y N Y60.0 6 10 N N N Y Y50.0 14 28 Y Y Y N N51.8 29 56 Y Y N Y N55.6 10 18 Y Y N N Y63.4 26 41 Y N Y Y N33.3 2 6 Y N Y N Y36.4 4 11 N Y Y N Y66.7 18 27 N Y Y Y N50.0 5 10 N N Y Y Y72.7 8 11 N Y N Y Y50.0 8 16 Y N N Y Y75.0 6 8 N Y Y Y Y60.0 9 15 Y N Y Y Y63.3 14 22 Y Y N Y Y50.0 8 16 Y Y Y N Y55.9 19 34 Y Y Y Y N60.0 6 10 Y Y Y Y Y
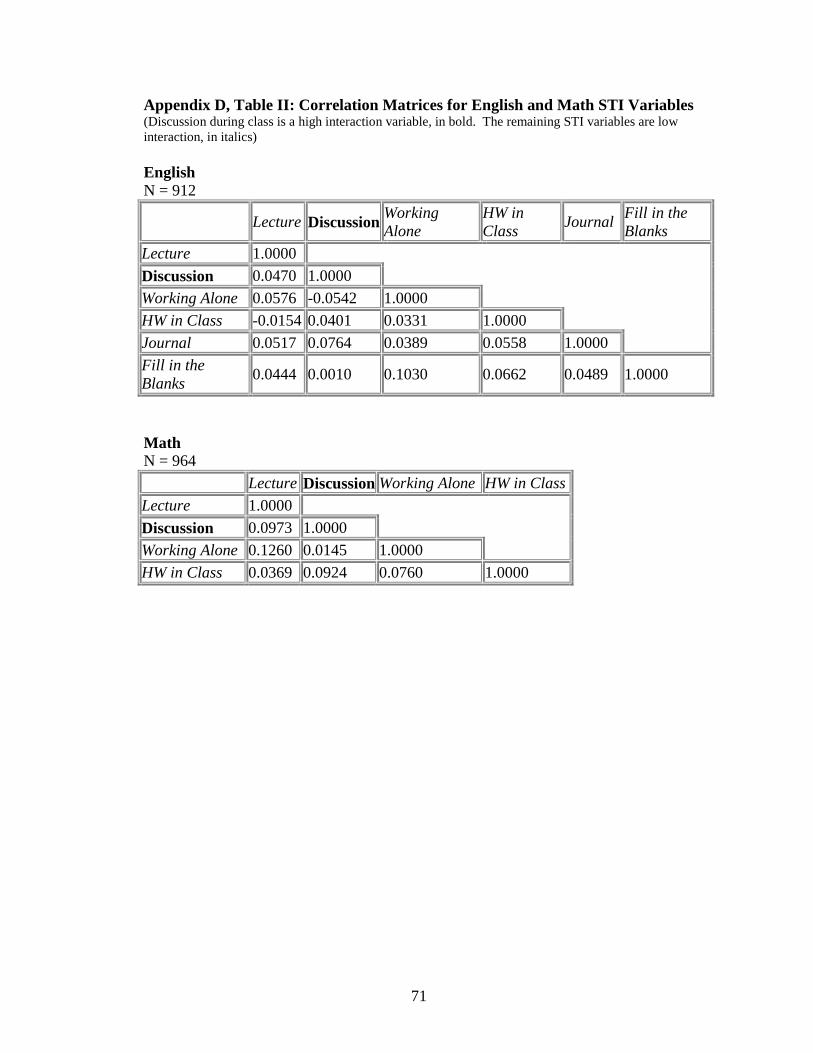
71
Appendix D, Table II: Correlation Matrices for English and Math STI Variables(Discussion during class is a high interaction variable, in bold. The remaining STI variables are low interaction, in italics)
EnglishN = 912
Lecture DiscussionWorking Alone
HW in Class
JournalFill in the Blanks
Lecture 1.0000
Discussion 0.0470 1.0000
Working Alone 0.0576 -0.0542 1.0000
HW in Class -0.0154 0.0401 0.0331 1.0000
Journal 0.0517 0.0764 0.0389 0.0558 1.0000
Fill in the Blanks
0.0444 0.0010 0.1030 0.0662 0.0489 1.0000
MathN = 964
Lecture Discussion Working Alone HW in Class
Lecture 1.0000
Discussion 0.0973 1.0000
Working Alone 0.1260 0.0145 1.0000
HW in Class 0.0369 0.0924 0.0760 1.0000
72
Bibliography
Ball, Arnetha. 2000. “Empowering Pedagogies that Enhance the Learning of
Multicultural Students”. Teachers College Record 102:1006-1035.
Boesel, David. 1998. “The Street Value of the GED Diploma”. Phi Delta
Kappan 80:65-68, 96.
Bureau of Labor Statistics. 2000. “High School Graduates About Twice as
Likely as Dropouts to Work or Go to School”. Occupational Outlook Quarterly
44:40.
Catterall, James S. 1998. “Risk and Resilience in Student Transitions to High
School”. American Journal of Education 106:302-333.
Collins, Patricia Hill. 1998. Fighting Words: Black Women & the Search for
Justice. Minneapolis: University of Minnesota Press.
Comer, James and Valerie Maholmes. 1999. “Creating School of Child
Development and Education in the USA: teacher preparation for urban schools”. Journal
of Education for Teaching 25:3-15
Dance, L. Janelle. 2002. Tough Fronts: The Impact of Street Culture on
Schooling. New York: Routledge Falmer.
Darder, A. 1993. “How Does the Culture of the Teacher Shape the
Classroom Experience of Latino Students?” In S.W. Rothstein (Ed.), Handbook of
Schooling in Urban America. Westport, CT: Greenwood.
Delpit, Lisa. 1995. Other People’s Children: Cultural Conflict in the
Classroom. New York: The New Press.

73
Duncan, Greg J., Johanne Boisjoly and Timothy Smeeding. 1996.
“Economic Mobility of Young Workers in the 1970s and 1980s”. Demography
33:497-509.
Ensminger, Margaret E. and Anita L. Slusarcick. 1991. “Paths to High
School Graduation or Dropout: A Longitudinal Study of a First-Grade Cohort”.
Sociology of Education 65:95-113.
Friere, Paulo. 1970. Pedagogy of the Oppressed. New York: Continuum.
Goffman, Erving. 1959. The Presentation of Self in Everyday Life. Garden
City, NY: Doubleday.
Gutstein, Eric. 2003. “Teaching and Learning Mathematics for Social Justice
in an Urban, Latino School”. Journal for Research in Mathematics Education 34:37-
73.
Haberman, Martin. 1992. “The Pedagogy of Poverty vs. Good Teaching”.
Education Digest 58:16-20.
Howard, Tyrone C. 2003. “Who Recieves the Short End of the Shortage?
Implications of the U.S. Teacher Shortage on Urban Schools”. Journal of
Curriculum and Supervision 18:142-160.
----------------------. 2002. “Hearing Footsteps in the Dark: African American
Students’ Descriptions of Effective Teachers”. Journal of Educational for Students
Placed at Risk 7:425-444.
----------------------. 2001. “Powerful Pedagogy for African American
Students: A Case of Four Teachers”. Urban Education 36:179-202.
74
Lee, James O. 2003. “Implementing High Standards in Urban Schools:
Problems and Solutions”. Phi Delta Kappan 84:449-456.
Massey, Douglas and Nancy A. Denton. 1993. American Apartheid:
Segregation and the Making of the Underclass. Cambridge, MA: Harvard University
Press.
Neild, Ruth Curran. 2002(a). “Ninth Grade Teacher Qualifications and
Turnover in an Urban District”. Unpublished, to be presented at 2003 meetings of the
American Educational Research Association, Chicago.
Neild, Ruth Curran, Frank F. Furstenberg Jr., and Scott Stoner-Eby. 2002(b).
“Connecting Entrance and Departure: The Transition to Ninth Grade and High School
Dropout”. Unpublished.
Neild, Ruth Curran. 2002(c). Teacher Staffing in the School District of
Philadelphia. Philadelphia, Philadelphia Education Fund.
-----------------------. 2002(d). “Parent Management of School Choice in a
Large Urban District”. Unpublished.
Neild, Ruth Curran and Robert Belfanz. 2000. “An Extreme Degree of
Difficulty: The Educational Demographics of Urban Neighborhood High Schools”.
Unpublished.
Noddings, Nel. 2002. Educating Moral People, A Caring Alternative to
Character Education. New York: Teachers College Press, Columbia University.
------------------- 1995. “Teaching Themes of Care”. Phi Delta Kappan
76:675-680.
75
Nunn, Gerald D. and Thomas S. Parish. 1992. “The Psychosocial
Characteristics of At-Risk High School Students”. Adolescence 27:435-440.
Parker, Laurence, Michelle Kelly, and Jaymin Sanford. 1998. “The Urban
Context of Schools and Education: Community, Commitment, and Change”.
Educational Theory 48:123-137.
Paul, Dierdre Glenn. 2002. “Rap and Orality: Critical Media Literacy,
Pedagogy, and Cultural Synchronization”. Journal of Adolescent & Adult Literacy
44:246-251.
Pribesh, Shana and Douglas B. Downey. 1999. “Why Are Residential and
School Moves Associated with Poor School Performance?” Demography 36:521-
534.
Resnick, Lauren and Meghan Williams Hall. 1998. “Learning Organizations
for Sustainable Education Reform”. Daedalus Winter1998:89-118.
Roderick, Melissa. 1993. The Path to Dropping Out. Chicago, University of
Chicago Press.
Ronda, Michelle A. and Richard R. Valencia. 1994. “At-risk Chicano
Students: the Institutional and Communicative Life of a Category”. Hispanic Journal
of Behavioral Sciences 16:363-395.
Rumberger, Russell W. and Katherine A. Larson. 1998. “Student Mobility
and the Increased risk of High School Dropout”. American Journal of Education
107:1-35.
76
Stanford, Grace Cureton.1997. “Successful Pedagogy in Urban Schools:
Perspectives of Four African American Teachers”. Journal of Education for Students
Placed at Risk 2:107-119.
Seidman, Edward, LaRue Allen, J. Lawrence Aber, Christina Mitchell and
Joanna Feinman. 1994. “The Impact of School Transitions in Early Adolescence on
the Self-System and Perceived Social Context of Poor Urban Youth”. Child
Development 65:507-522.
Tsui, Lisa. 2002. “Fostering Critical Thinking Through Effective Pedagogy”.
The Journal of Higher Education 73:740-763.
Vanderstraeten, Raf. 2002. “Dewey’s Transactional Constructivism”.
Journal of Philosophy of Education 36:233-246
Walker, Susan, Sally Grantham-McGregor, & John Himes. “School
Performance in Adolescent Jamaican Girls: Associations With Health, Social and
Behavioral Characteristics, and Risk Factors for Dropout”. Journal of Adolescence
21:109-122.
Wang, M.C, G.D. Haertel and H.J. Wahlberg. 1993. “Toward a Knowledge
Base for School Learning”. Review of Educational Research. 63:249-294.
Waxman, H.C. 1989. “Urban Black and Hispanic Elementary School
Students’ Perception of Classroom Instruction”. Journal of Research and
Development in Education 22:57-61.
Waxman, H.C. and Yolanda Padron. 1995. “Improving the Quality of
Classroom Instruction for Students At-Risk of Failure in Urban Schools”. Peabody
Journal of Education 70:44-66.
77
-------------------. 1994. “Eliminating the Pedagogy of Poverty in
Mathematics and Science Classrooms Through Technology Use”. In G.H. Marks
(Ed.) Mathematics/Science Education. Charlottesville, VA: Association for the
Advancement of Computing in Education.
Waxman, H.C., S.L. Huang, D.S. Saldana and Y.N. Padron. 1994.
“Investigating the Pedagogy of Poverty in Inner-City Elementary and Middle
Schools”. Unpublished.
Weiss, Christopher. 2001. “Difficult Starts: Turbulence in the School Year
and Its Impact on Urban Students’ Achievement”. American Journal of Education
109:196-227.
Wilson, William Julius. 1987. The Truly Disadvantaged: The Inner City, the
Underclass, and Public Policy. Chicago: University of Chicago Press.