About NCAER
70
Transcript of About NCAER


About NCAER | Quality . Relevance . ImpactThe National Council of Applied Economic Research (NCAER) is an independent policyresearch institute that supports India's economic development through empirical economic andsociological research. It is India's oldest and largest policy think-tank. NCAER was inaugurated bythe President of India, Dr Rajendra Prasad, on December 18, 1956. The bulk of NCAER'srevenues today come from research studies done for the government and the private sector. This issupplemented by internal resources from NCAER's endowment income and from donor grants.NCAER's work programme is currently divided into four areas:
Growth, trade, and economic management The investment climate and physical and economic infrastructure Agriculture, rural development, and natural resource management Poverty, human development, household behaviour, and gender
A broad theme that permeates the Council's current research activities is the progress of India'seconomic reform programme and its impact on agriculture, industry, and human development.
NCAER has links with major policy research institutes and universities abroad, including theNational Bureau of Economic Research in Cambridge, MA; the Brookings Institution inWashington, DC; the New Economic School, Moscow; Tsinghua University, Beijing; the Centrefor Economic Policy Research, London; the University of Maryland, College Park, MD; OxfordUniversity; and the Institute for Applied Economic Research in Brasilia. In South Asia, it has linkswith the Institute of Policy Studies, Colombo; the Pakistan Institute of Development Economics,Islamabad; and the Bangladesh Institute of Development Studies and the Centre for PolicyDialogue in Dhaka.
For further details please visit www.ncaer.org
Assessment of Economic Impact and Regional Benefits
National Council of Applied Economic Research
Emirates in India

ii
Emirates in India
© National Council of Applied Economic Research, 2012
All rights reserved, no part of this publication may be reproduced, stored in a retrieval system, or transmitted, in any form or by any means, electronic, mechanical, photocopying, recording and/or otherwise, without the prior written permission of the publisher.
Published by
Jatinder S. Bedi, Secretary & Head, Operations, for and on behalf of the National Council of Applied Economic Research, Parisila Bhawan, 11, Indraprastha Estate, New Delhi–110 002
Printed at
Cirrus Graphics Pvt Ltd, B-61, Sector 67, Noida 201 301

iii
Emirates in India
Air travel remains the fastest mode of long-distance passenger transport and freight. Its wide-ranging inter-linkages with other sectors in the economy means that air transportation can bring with it tremendous direct and indirect benefi ts to the economies in which it operates. An effi cient national civil aviation infrastructure and effi ciently run airlines have the potential of bringing down transport costs, promoting commerce, expanding culture and communications, and ultimately drawing people together.
This NCAER study provides an assessment of the impact of expanding air travel and the civil aviation sector in India by using the experience of one of the largest international carriers oper-ating in India – Emirates Airlines. Emirates began its operations in India in the mid-1980s and carried 12 per cent of India’s international passengers and 14 per cent of international freight in 2010–11. Emirates’ success in India mirrors the deep and still rapidly growing economic links between India and the Middle East, which in turn also integrate India more closely with the global economy.
A large international airline’s operations demand many inputs. Besides generating income, the supply of these inputs creates a multiplier effect for other goods and services required to pro-duce these inputs. Besides air travel or the movement of air frieght, aviation also generates other outputs such as second order effects on tourism. Input–output analysis provides a methodology to estimate the effects of one sector on another as well as on the entire economy. Emirates asked NCAER to take a look at its India operations and estimate what these multiplier effects across sectors would be. This report by NCAER is an assessment of these effects. Using input–output analysis, the study quantifi es these effects in the form of direct economic contributions, multi-plier effects on output and employment, and induced effects on tourism.
This study was carried out under the leadership of Tushar Nandi at NCAER. Devender Pratap, Shashanka Bhide, Saurabh Bandyopadhyay and Nikita Jain at NCAER provided important in-puts at different stages of the work. I would like to acknowledge the fi nancial and information support from Emirates for this study and their willingness to share data, knowledge, and their understanding of India’s civil aviation sector.
I hope that the analysis and the results of this NCAER report will be useful to policy makers and policy analysts. I also hope the report and the methodology used will facilitate further analysis of India’s civil aviation sector.
New Delhi Shekhar ShahDirector-General
NCAER
Foreword

iv
Emirates in India

v
Emirates in India
Disclaimer: The fi ndings, interpretations, and conclusions expressed are those of the authors and do not necessarily imply endorsement by NCAER or its Governing Body.
The study team wishes to place on record the support received from Emirates Airline in terms of data and information relating to their operations as relevant for the assessment of economic impact.
Acknowledgements

vi
Emirates in India
vi
vii
Emirates in India
Executive Summary .................................................................................................................................... 1
1. Introduction ......................................................................................................................7
1.1 Structure of the Report ...................................................................................................................7
2. Indian Economic Context and Air Transport Sector .............................................................9
2.1 Policies to Catalyse the Sector ......................................................................................................13
2.2 Airports Economic Regulatory Authority (AERA) ......................................................................13
2.3 Airports Authority of India (AAI)................................................................................................14
2.4 Directorate General of Civil Aviation (DGCA) ...........................................................................14
2.5 The Issues .....................................................................................................................................14
2.6 Air Services Agreements ...............................................................................................................15
2.7 Aviation Turbine Fuel Cost ...........................................................................................................15
2.8 Service Tax on Air Tickets ............................................................................................................16
2.9 Foreign Direct Investment in the Domestic Airline Industry .......................................................16
3. Emirates in India ..............................................................................................................19
3.1 Introduction ..................................................................................................................................19
3.2 Emirates in the Indian Air Transport Sector ................................................................................19
3.3 Emirates’ Passenger and Freight Traffi c in 10 Indian Airports .....................................................21
3.4 Share of Emirates’ Traffi c at Various Indian Airports ...................................................................22
3.5 Emirates’ Passenger Traffi c: 3rd, 4th, and 6th Freedoms, 2011–12 ..............................................24
3.6 Emirates’ Passenger Traffi c to MENA Countries, 2011–12 .........................................................27
4. Economic Impacts Associated with Emirates Airline Operations in India ...........................31
4.1 Introduction ..................................................................................................................................31
4.2 Economic Contribution of Airline Operations .............................................................................31
4.3 Direct Impact of Emirates’ Operation in India .............................................................................33
4.3.1 Direct Contribution to Indian Civil Aviation ....................................................................33
4.3.2 Direct Contribution at Indian Airports .............................................................................34
4.3.3 Seat Factors ........................................................................................................................36
4.3.4 Direct Employment in India ..............................................................................................36
4.3.5 Contribution to the Indian Carriers ...................................................................................37
4.3.6 Media and Other Spending ...............................................................................................37
Contents
vii

viii
Emirates in India
4.4 Multiplier Impact of Emirates’ Operation in India .......................................................................38
4.4.1 Output Multiplier Impact ..................................................................................................38
4.4.2 Multiplier Impact on Sectors .............................................................................................39
4.4.3 Impact on Indian Cities .....................................................................................................40
4.4.4 Employment Multiplier Impact .........................................................................................42
4.5 Induced Effect on Tourism in India ..............................................................................................43
4.6 Other Benefi ts ..............................................................................................................................47
5. Expansion of Emirates’ Operations in India .......................................................................49
5.1 Scenario 1: 60,000 Seats per Week ...............................................................................................49
5.2 Scenario 2: 70,000 Seats per Week ...............................................................................................50
5.3 Scenario 3: 80,000 Seats per Week ...............................................................................................51
5.4 Sector-wise Distribution of Benefi ts from Higher Seat Allocations .............................................51
5.5 Benefi t from Emirates’ Operation to Additional Points ...............................................................52
5.5 Conclusion ....................................................................................................................................53
5. Appendix .........................................................................................................................55

ix
Emirates in India
E.1: Passenger and Freight share of Emirates Airlines ..........................................................................2
E.2: Percentage share of Emirates in India for destinations Dubai and beyond ....................................2
E.3: Economic Impact of Emirates operation-1 ....................................................................................3
E.4: Economic Impact of Emirates operation-2 ....................................................................................4
E.5: Economic Impact of Emirates operation-3 ....................................................................................4
E.6: Economic Impact of Emirates operation-4 ....................................................................................5
2.1: Air Passenger Traffi c, India, 2008–09 to 2010–11 .......................................................................11
3.1: International Air Traffi c: Emirates and India ...............................................................................19
3.2: Emirates’ passenger (in numbers) and Freight Traffi c (in tonnes) in India ..................................20
3.3: Emirates in India: Year to year growth (%) ..................................................................................22
3.4: Emirates’ Passenger and Freight Share in 10 Airports (%) ..........................................................23
3.5: Emirates’ Passenger Traffi c in India: To and From Dubai and Beyond (%), 2011-12 ..................25
3.6: Number of Points Connected by Emirates’ 6th Freedom Traffi c, 2011–12 ..................................26
3.7: Emirates’ Passenger Traffi c: India - MENA and India - outside MENA, 2011-12 (%) ..............27
4.1: Emirates’ Direct Contribution in India’s Economy: 2008–09 to 2010–11 ...................................33
4.2: Emirates Expenditure in India: 2008–09 to 2010–11 (%) ............................................................34
4.3: Emirates’ Contribution at Points of Operation: 2008–09 to 2010–11, (million US$) .................35
4.4: Emirates Seat Factor at 10 Airports: 2008–09 to 2010–11 (%) ...................................................35
4.5: Emirates’ contribution to Indian carriers, 2010–11 ......................................................................37
4.6: Emirates’ Advertisement and Promotion in India (million US$) .................................................37
4.7: Emirates’ Total Contribution to India in 2010–11 (million US$) ................................................38
4.8: Multiplier Impact of Emirates’ Contribution ...............................................................................39
4.9: Emirates’ Multiplier Impact at 10 Airports, 2010–11 (million US$) ...........................................40
4.10: Emirates Passenger Traffi c in Routes without Direct Link from Indian Airports, 2010–11 (%) ..................................................................................................................42
4.11: Emirates’ Contribution to India’s Tourism Sector, 2009 ..............................................................44
4.12: Emirates’ Passenger Traffi c to Nine Major Countries Outside MENA (2011-12) ......................45
4.13: Tourist arrivals by Emirates from Major Countries, 2009 ............................................................46
5.1: Scenario 1: Emirates with 60,000 Seats per Week .......................................................................49
5.2: Scenario 2: Emirates with 70,000 Seats per Week .......................................................................50
5.3: Scenario 3: Emirates with 80,000 Seats per Week .......................................................................51
5.4: Output and Employment Multiplier Impacts ..............................................................................52
5.5: Direct Impact from Expansion to Four Additional Points (US$ million) ....................................52
List of Tables

x
Emirates in India
5.6: Output and Employment Multiplier Impacts at the Four Additional Points ..............................53
A1: Input–Output Table .....................................................................................................................55
A2: Mapping of Sectors from 130×130 to 33×33 Table ......................................................................57
2.1: Air Passenger Traffi c in India (million): 2007–08 to 2010–11 .....................................................10
2.2: Air Freight Traffi c in India during 2007–08 to 2010–11 (thousand tonnes) ................................10
3.1: Emirates Passenger Share at Hub Airports and Non-Hub Airports (%) .....................................23
3.2: Emirates Freight Share at Hub and Non-Hub Airports (%) .......................................................23
3.3: Emirates’ Passenger Traffi c: India to Middle East and North Africa (MENA) 16 countries, 2011-12, [%](2.7 million PAX) ................................................................28
3.4: Emirates’ Passenger Traffi c: India to 50 countries outside MENA, 2011-12, [%](2.0 million PAX) ...................................................................................................................28
3.5: Emirates’ India Traffi c to/from MENA Countries, 2011-12, [%] (2.7 million PAX) ..................29
4.1: Distribution of Emirates’ Expenditure in different components in India (%) ..............................34
4.2: Sector-wise Distribution of Multiplier Impact (%) ......................................................................39
4.3: Emirates’ Multiplier Effect at Hub Airports: 2010–11 (million US$) .........................................40
4.4: Emirates’ Multiplier Effect at Non-Hub Airports 2010–11, (million US$) ................................41
4.5: Sector-wise distribution of employment impact (%) ....................................................................43
4.6: Emirates’ Traffi c: India to 50 Countries Outside MENA (%) (2.0 million PAX) ........................45
2.1: A Note on JV airports ..................................................................................................................12
List of Figures
List of Boxes
1
Executive Summary
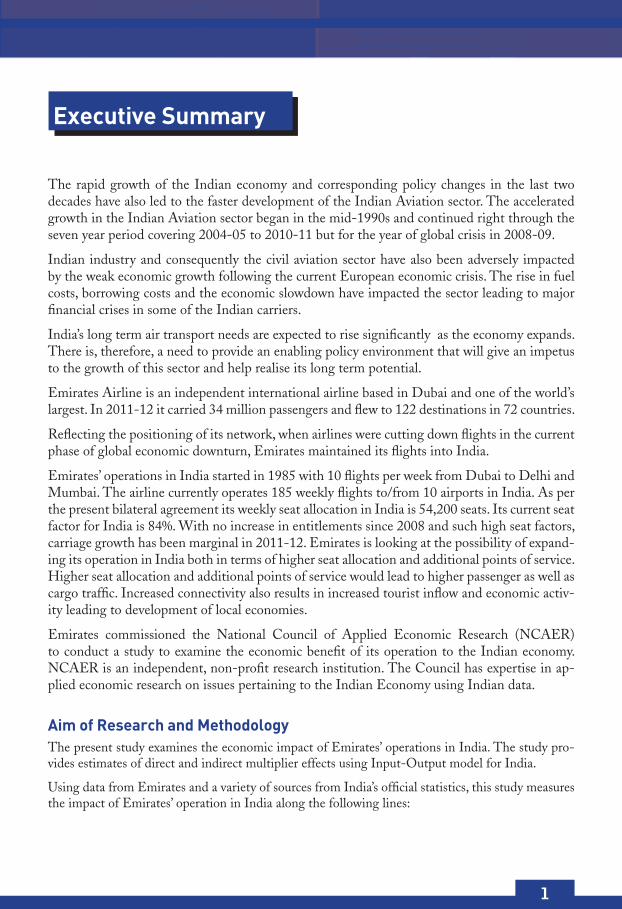
The rapid growth of the Indian economy and corresponding policy changes in the last two decades have also led to the faster development of the Indian Aviation sector. The accelerated growth in the Indian Aviation sector began in the mid-1990s and continued right through the seven year period covering 2004-05 to 2010-11 but for the year of global crisis in 2008-09.
Indian industry and consequently the civil aviation sector have also been adversely impacted by the weak economic growth following the current European economic crisis. The rise in fuel costs, borrowing costs and the economic slowdown have impacted the sector leading to major fi nancial crises in some of the Indian carriers.
India’s long term air transport needs are expected to rise signifi cantly as the economy expands. There is, therefore, a need to provide an enabling policy environment that will give an impetus to the growth of this sector and help realise its long term potential.
Emirates Airline is an independent international airline based in Dubai and one of the world’s largest. In 2011-12 it carried 34 million passengers and fl ew to 122 destinations in 72 countries.
Refl ecting the positioning of its network, when airlines were cutting down fl ights in the current phase of global economic downturn, Emirates maintained its fl ights into India.
Emirates’ operations in India started in 1985 with 10 fl ights per week from Dubai to Delhi and Mumbai. The airline currently operates 185 weekly fl ights to/from 10 airports in India. As per the present bilateral agreement its weekly seat allocation in India is 54,200 seats. Its current seat factor for India is 84%. With no increase in entitlements since 2008 and such high seat factors, carriage growth has been marginal in 2011-12. Emirates is looking at the possibility of expand-ing its operation in India both in terms of higher seat allocation and additional points of service. Higher seat allocation and additional points of service would lead to higher passenger as well as cargo traffi c. Increased connectivity also results in increased tourist infl ow and economic activ-ity leading to development of local economies.
Emirates commissioned the National Council of Applied Economic Research (NCAER) to conduct a study to examine the economic benefi t of its operation to the Indian economy. NCAER is an independent, non-profi t research institution. The Council has expertise in ap-plied economic research on issues pertaining to the Indian Economy using Indian data.
Aim of Research and MethodologyThe present study examines the economic impact of Emirates’ operations in India. The study pro-vides estimates of direct and indirect multiplier effects using Input-Output model for India.
Using data from Emirates and a variety of sources from India’s offi cial statistics, this study measures the impact of Emirates’ operation in India along the following lines:

2
Emirates in India
Direct contribution to the Indian economy.
Contribution through linkages of the aviation sector to other sectors – Multiplier im-pact.
Employment generation in India – Direct and Multiplier impact.
Contribution to foreign exchange earnings from tourists.
The study also takes into consideration the multiplier effect if Emirates expands its operations to four additional points.
Emirates in IndiaEmirates carries passenger and freight to/from 10 airports in India. They are Delhi, Mumbai, Ben-galuru, Hyderabad, Kochi, Kozhikode, Kolkata, Chennai, Thiruvananthapuram and Ahmedabad.
The following table shows Emirates’ share in international passenger traffi c at these 10 airports, hub (Delhi and Mumbai) and non-hub airports and in India for the year 2010-11.
Table E.1: Passenger and Freight share of Emirates Airlines
Emirates’ Passenger share (%), 2010-11
10 airports Hub airports Non-hub airports India
13.28 8.87 18.14 12.26
Emirates’ Freight share (%), 2010-11
10 airports Hub airports Non-hub airports India
14.50 9.95 20.80 14.39
Emirates carried 12.26 per cent of India’s international passenger and 14.39 percent of inter-national freight in 2010-11. Its share at non-hub points is higher than that at hub points.
Emirates’ India operation carried 45 per cent of the passengers between 10 Indian points and Dubai. The remaining 55 per cent of passenger traffi c was carried between Indian airports and points beyond Dubai.
Table E.2: Percentage share of Emirates in India for destinations Dubai and beyond
Emirates’ Passenger share (%), 2011–12
3rd/4th freedom 45
6th freedom 55
Division of 6th freedom traffi c To/from points served by Indian carriers 18
To/from points served by non-Indian carriers 15
To/from points without any direct link 67

3
Executive Summary
Out of the total 6th freedom passenger traffi c, only 18 per cent is carried between points served by Indian carriers. A vast majority of the 6th freedom passenger traffi c, 82 per cent, is carried between points not served by Indian carriers. In fact 67 per cent of the 6th freedom traffi c is between points that do not have any direct link.
Summary of Emirates’ Economic Impact in IndiaThe study examines the economic impacts of Emirates operation in India for current (54,200 seats per week) and possible future operations in terms of additional seat allocation and addi-tional points of service.
Table E.3: Economic Impact of Emirates operation-1
54,200 seats per week (4.65 million passengers in 2010-11)
Note: Impact would have been similar for 2011-12 given marginal growth in carriage to 4.71 million due to constrained entitlements).
Direct Contribution:US$274 million
US$67 million in hub airports
US$207 million in non-hub airports
Multiplier Impact: US$ 596 million to Indian Economy
US$274 million in the Air transport sector
US$76 million in the Petroleum and Chemicals sector
US$62 million in the Manufacturing sector
US$39 million in the Trade, Banking & Insurance sector
US$145 million in the rest of the economy
Employment Impact
Emirates employs 1045 employees in India
Emirates’ operations support a total of 72,323 jobs in India
9,304 jobs as a direct employment impact
63,019 jobs as an indirect employment impact
Induced eff ect on Tourism:
529,928 foreign tourist arrival by Emirates
US$1153 million as Foreign Exchange Earning (FEE)

4
Emirates in India
Table E.4: Economic Impact of Emirates operation-2
60,000 seats per week(5.03 million passengers per year)
Direct Contribution: US$296 million
Multiplier Impact: US$644 million to Indian Economy
US$296 million in the Air transport sector
US$83 million in the Petroleum and Chemicals sector
US$67 million in the Manufacturing sector
US$42 million in the Trade, Banking & Insurance sector
US$157 million in the rest of the economy
Employment Impact:
Emirates’ operations will support a total of 78,227 jobs in India
10,063 jobs as a direct employment impact
68,163 jobs as an indirect employment impact
Induced eff ect on Tourism:
641,260 foreign tourist arrival by Emirates
US$1485 million as Foreign Exchange Earning (FEE)
Table E.5: Economic Impact of Emirates operation-3
70,000 seats per week(5.63 million passengers per year)
Direct Contribution: US$332 million
Multiplier Impact: US$721 million to Indian Economy
US$332 million in the Air transport sector
US$92 million in the Petroleum and Chemicals sector
US$75 million in the Manufacturing sector
US$47 million in the Trade, Banking & Insurance sector
US$176 million in the rest of the economy
Employment Impact
Emirates’ operations will support a total of 87,572 jobs in India
11,266 jobs as a direct employment impact
76,306 jobs as an indirect employment impact
Induced eff ect on Tourism
717,868 foreign tourist arrival by Emirates
US$1662 million as Foreign Exchange Earning
5
Executive Summary
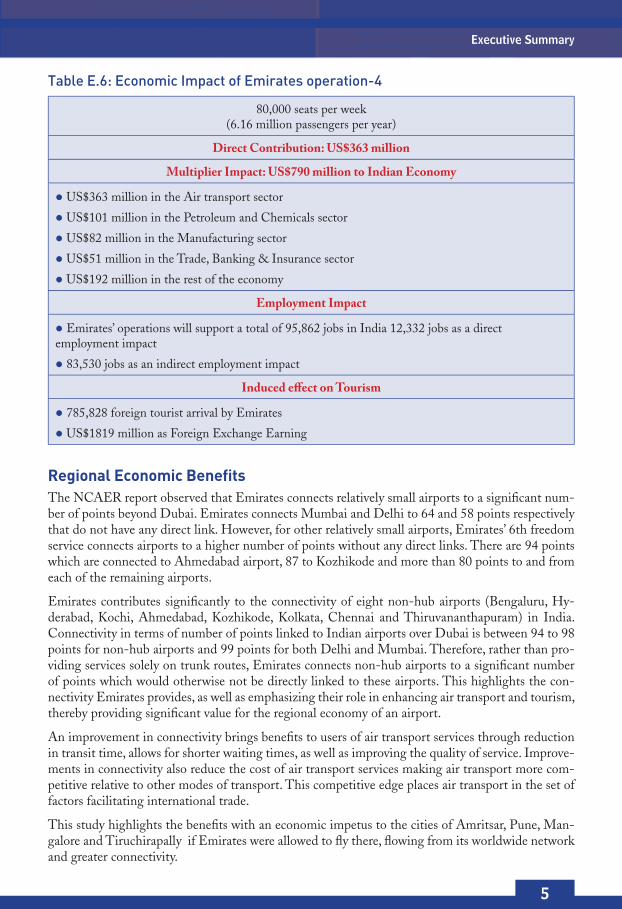
Table E.6: Economic Impact of Emirates operation-4
80,000 seats per week(6.16 million passengers per year)
Direct Contribution: US$363 million
Multiplier Impact: US$790 million to Indian Economy
US$363 million in the Air transport sector
US$101 million in the Petroleum and Chemicals sector
US$82 million in the Manufacturing sector
US$51 million in the Trade, Banking & Insurance sector
US$192 million in the rest of the economy
Employment Impact
Emirates’ operations will support a total of 95,862 jobs in India 12,332 jobs as a direct employment impact
83,530 jobs as an indirect employment impact
Induced eff ect on Tourism
785,828 foreign tourist arrival by Emirates
US$1819 million as Foreign Exchange Earning
Regional Economic BenefitsThe NCAER report observed that Emirates connects relatively small airports to a signifi cant num-ber of points beyond Dubai. Emirates connects Mumbai and Delhi to 64 and 58 points respectively that do not have any direct link. However, for other relatively small airports, Emirates’ 6th freedom service connects airports to a higher number of points without any direct links. There are 94 points which are connected to Ahmedabad airport, 87 to Kozhikode and more than 80 points to and from each of the remaining airports.
Emirates contributes signifi cantly to the connectivity of eight non-hub airports (Bengaluru, Hy-derabad, Kochi, Ahmedabad, Kozhikode, Kolkata, Chennai and Thiruvananthapuram) in India. Connectivity in terms of number of points linked to Indian airports over Dubai is between 94 to 98 points for non-hub airports and 99 points for both Delhi and Mumbai. Therefore, rather than pro-viding services solely on trunk routes, Emirates connects non-hub airports to a signifi cant number of points which would otherwise not be directly linked to these airports. This highlights the con-nectivity Emirates provides, as well as emphasizing their role in enhancing air transport and tourism, thereby providing signifi cant value for the regional economy of an airport.
An improvement in connectivity brings benefi ts to users of air transport services through reduction in transit time, allows for shorter waiting times, as well as improving the quality of service. Improve-ments in connectivity also reduce the cost of air transport services making air transport more com-petitive relative to other modes of transport. This competitive edge places air transport in the set of factors facilitating international trade.
This study highlights the benefi ts with an economic impetus to the cities of Amritsar, Pune, Man-galore and Tiruchirapally if Emirates were allowed to fl y there, fl owing from its worldwide network and greater connectivity.

6
Emirates in India
In 2011-12, Emirates carried passengers between India and 66 countries. India, being an important investment destination and trading partner of the MENA (Middle East and North African) coun-tries, witnessed a lot of passenger traffi c to and from these nations. The traffi c share of the other 50 countries connected to India by Emirates is 43 per cent.
ConclusionThe study fi nds that Emirates makes an important contribution to the Indian air transport sector in terms of passenger and freight traffi c and connectivity to points not directly served by other carri-ers. The airline’s economic contribution to the air transport sector magnifi es to the wider economy through the multiplier effect. The benefi t to non-hub points appears to be signifi cant in regional economies. Income, employment and tourism impacts point to the potential of Emirates’ contribu-tion to regional economic development.
The study predicts further economic benefi t for the Indian economy in scenarios of Emirates’ ex-pansion in India. They are quantifi ed as direct economic contribution, multiplier effect on output and employment and induced effect on tourism. Apart from quantifi ed benefi ts from Emirates’ operations in India, the identifi ed qualitative benefi ts highlight the need for an expansion of air transportation capacities in India.
The Civil aviation sector is a critical segment of the transport infrastructure in a large country like India. It not only provides for movement of goods and passengers, but is also an enabler of global economic integration. This sector provides domestic and overseas linkages that boost international trade and tourism. Policies that enhance these benefi ts will contribute to the growth of India’s econ-omy through a variety of direct and indirect multiplier effects.

7
Executive Summary
1. Introduction
Emirates Airline, based in Dubai, is one of the world’s largest and fastest growing carriers. It is the largest foreign airline in the Indian air transport sector and contributes a signifi cant propor-tion of the market for India’s international passenger and freight volumes.
The airline currently operates a fl eet of more than 170 wide-bodied aircraft and in 2010–11 recorded its 23rdconsecutive profi t, earning US$1.61 billion. The airline has focused on its own network expansion and has remained independent of the three global alliances. Largely because of Emirates’ growth, Dubai International Airport is now the world’s eighth largest hub, han-dling nearly 51 million passengers in 2011.
The present bilateral agreement between India and Dubai allows Emirates to operate 54,200 seats weekly to and from India. The airline enjoys strong demand for its Indian services with fl ights operating on an average of 84 per cent full (seat factor). The airline currently operates 185 weekly fl ights to and from 10 Indian destinations and is looking at the possibility of ex-panding its operation and introducing the Airbus A380 into India.
1.1 Structure of the ReportThe report presents the economic analysis carried out to assess the economic impact of Emir-ates’ operation in India and is structured as follows:
Chapter 2 presents Indian economic landscape and the role of air transport in stimulat-ing its economic growth.
Chapter 3 covers the role of Emirates in the international segment of India’s air trans-port sector.
Chapter 4 presents the analysis of the economic impact of Emirates’ operations in India. It quantifi es the economic benefi ts in terms of direct impacts, induced impacts and the multiplier effects on India’s tourism industry.
Chapter 5 forecasts the benefi ts to the Indian economy derived by Emirates’ expansion.

8
Emirates in India

9
2. Indian Economic Context and Air Transport Sector
India’s recent economic growth has been propelled by a sustained increase in the service sector. Over the last decade, the service sector contributed more than half of India’s total GDP. The service sector accounted for 56.3 per cent of GDP (at factor cost) for 2011–12, or approxi-mately US$987 billion.
The service sector requires strong transport and communication networks to connect the differ-ent centres of economic growth within India and abroad. Air transport plays a vital role in this respect. It is the fastest mode of transport and is a necessity rather than a luxury.
The Indian service sector is connected to trade centres abroad. India is a cost-effective and labour-abundant economy with a strong manufacturing and export oriented industrial frame-work. It has thus benefi ted immensely from outsourcing work opportunities from developed countries. Faster modes of transportation between Indian growth centres and their trade part-ners abroad have facilitated the economic ties that drive the Indian economy. International air transport contributes to this aspect of the economy by providing faster transportation of pas-sengers and freight.
The importance of FDI (foreign direct investment) on India’s economic growth since liberalisa-tion in 1991 is well recognised. Labour costs, political stability, and tax rules are considered to be the main factors that determine the fl ow of FDI. Recent trends show that transport links also play an important role in investment decisions. International air transport and connectivity makes the Indian economy an attractive investment destination.
It is estimated that transport contributes 17 per cent to the Indian service sector GDP. This sig-nifi cant contribution is partially accounted for by the increase in air transport. Though the air transport sector in India has witnessed a remarkable growth in the present decade, its potential is yet to be fully realised. It was only in 2006–07 that air transport overtook water transport in terms of its contribution to India’s transport GDP. Air transport still contributes less than 1 per cent of the country’s GDP but is predicted to rise considerably in the coming years.
Air transport in India witnessed a steady growth over the last decade except in 2008–09, when the global downturn had an adverse impact on demand for domestic air travel. However, inter-national passenger traffi c to and from India was largely unaffected. The total passenger volumes (international and domestic) grew by 14 per cent in 2009–10, and by 15 per cent in 2010–11. Figure 2.1 presents the Indian passenger traffi c from 2007–08 to 2010–11. It may be noted that during the period, international passenger traffi c increased by 27 per cent while domestic passenger traffi c grew by 21 per cent. Freight traffi c in India during 2007–08 to 2010–11 is presented in Figure 2.2. Except for 2008–09, it has experienced a steady increase. On the other hand, international and domestic freight traffi c increased by 30 per cent and 50 per cent, respec-tively during the same period.

10
Emirates in India
Figure 2.1: Air Passenger Traffic in India (million): 2007–08 to 2010–11
30 32 34 38
87
77
89
105
117109
123
143
2007-08 2008-09 2009-10 2010-11
International Domestic Total
Source: Airport Authority of India, Director General of Civil Aviation, India.
These fi gures show that the Indian air transport sector is back to its growth path after a year-long slowdown due to the global downturn.
Figure 2.2: Air Freight Traffic in India during 2007–08 to 2010–11 (thousand tonnes)
InternationalDomesticTotal
2349
1950
1696
1713
853
685
547
1496
1265
1149
2007-08
2008-09
2009-10
2010-11
566
1147
Source: Airport Authority of India, Director General of Civil Aviation, India.
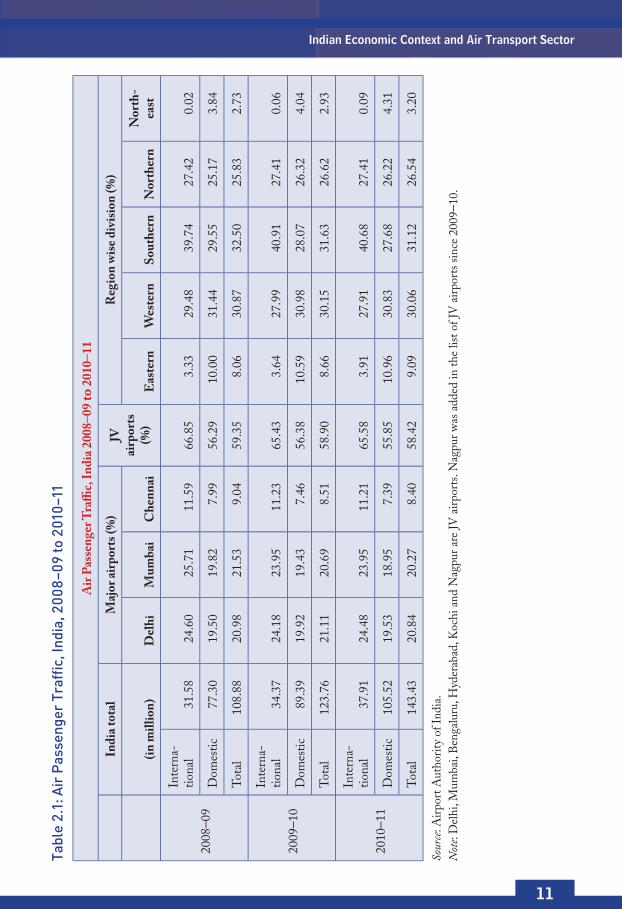
India has 37 airports, of which 17 operate international services while 20 focus on domestic op-erations. Among the international airports, there are six JV (joint venture) airports, namely Delhi, Mumbai, Bengaluru, Hyderabad, Kochi and Nagpur. Data suggests that JVs have handled an aver-age of 56 per cent of domestic passenger traffi c and 66 per cent of international passenger traffi c during 2008–09 and 2010–11.1 (Table 2.1) This implies that the other 31 airports handle a small proportion of air passengers. This share will be very low if two major non-JV airports – Chennai and Kolkata are left out. Chennai has handled 7 per cent of domestic passenger traffi c and 11 per cent of international passenger traffi c from 2008–09 to 2010–11, while Kolkata airport handled 4 per cent and 8 per cent of domestic and international passenger traffi c, respectively, during the same period.
1. Note that the calculation for 2008–09 does not include Nagpur as a JV airport. There were fi ve JV airports in 2008–09.
11
Indian Economic Context and Air Transport SectorTa
ble
2.1:
Air
Pas
seng
er T
raff
ic, I
ndia
, 200
8–09
to 2
010–
11
Air
Pas
sen
ger
Tra
ffi c
, In
dia
200
8–09
to 2
010–
11
In
dia
to
tal
Maj
or
airp
ort
s (%
)JV
ai
rpo
rts
(%)
Reg
ion
wis
e d
ivis
ion
(%
)
(i
n m
illi
on
)D
elh
iM
um
bai
Ch
enn
aiE
aste
rnW
este
rnS
ou
ther
nN
ort
her
nN
ort
h-
east
2008
–09
Inte
rna-
tiona
l31
.58
24.6
025
.71
11.5
966
.85
3.33
29.4
839
.74
27.4
20.
02
Dom
estic
77.3
019
.50
19.8
27.
9956
.29
10.0
031
.44
29.5
525
.17
3.84
Tot
al10
8.88
20.9
821
.53
9.04
59.3
58.
0630
.87
32.5
025
.83
2.73
2009
–10
Inte
rna-
tiona
l34
.37
24.1
823
.95
11.2
365
.43
3.64
27.9
940
.91
27.4
10.
06
Dom
estic
89.3
919
.92
19.4
37.
4656
.38
10.5
930
.98
28.0
726
.32
4.04
Tot
al12
3.76
21.1
120
.69
8.51
58.9
08.
6630
.15
31.6
326
.62
2.93
2010
–11
Inte
rna-
tiona
l37
.91
24.4
823
.95
11.2
165
.58
3.91
27.9
140
.68
27.4
10.
09
Dom
estic
105.
5219
.53
18.9
57.
3955
.85
10.9
630
.83
27.6
826
.22
4.31
Tot
al14
3.43
20.8
420
.27
8.40
58.4
29.
0930
.06
31.1
226
.54
3.20
Sour
ce: A
irpo
rt A
utho
rity
of I
ndia
.N
ote:
Del
hi, M
umba
i, B
enga
luru
, Hyd
erab
ad, K
ochi
and
Nag
pur a
re JV
air
port
s. N
agpu
r was
add
ed in
the
list o
f JV
air
port
s si
nce
2009
–10.
12
Emirates in India
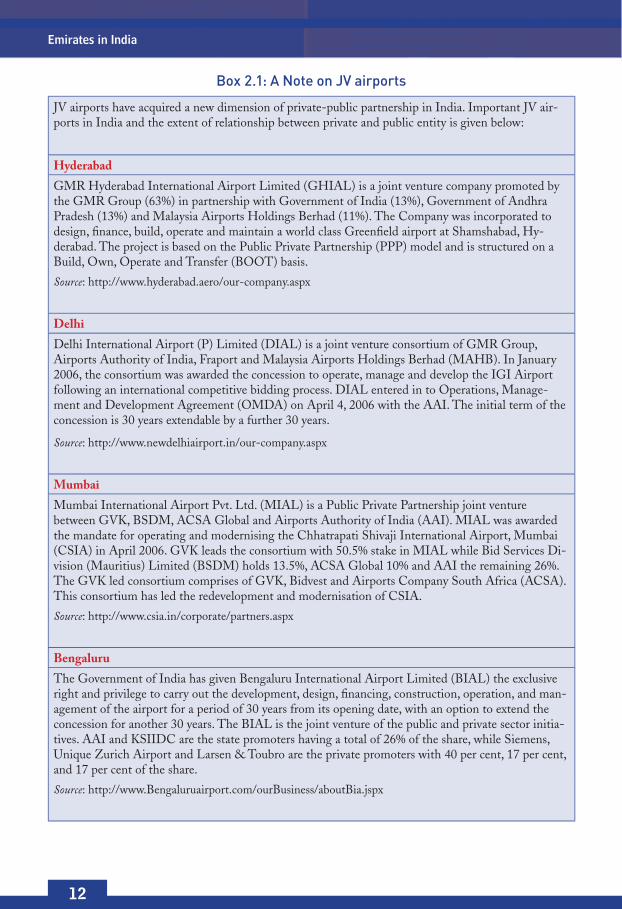
Box 2.1: A Note on JV airports
JV airports have acquired a new dimension of private-public partnership in India. Important JV air-ports in India and the extent of relationship between private and public entity is given below:
Hyderabad
GMR Hyderabad International Airport Limited (GHIAL) is a joint venture company promoted by the GMR Group (63%) in partnership with Government of India (13%), Government of Andhra Pradesh (13%) and Malaysia Airports Holdings Berhad (11%). The Company was incorporated to design, fi nance, build, operate and maintain a world class Greenfi eld airport at Shamshabad, Hy-derabad. The project is based on the Public Private Partnership (PPP) model and is structured on a Build, Own, Operate and Transfer (BOOT) basis.
Source: http://www.hyderabad.aero/our-company.aspx
Delhi
Delhi International Airport (P) Limited (DIAL) is a joint venture consortium of GMR Group, Airports Authority of India, Fraport and Malaysia Airports Holdings Berhad (MAHB). In January 2006, the consortium was awarded the concession to operate, manage and develop the IGI Airport following an international competitive bidding process. DIAL entered in to Operations, Manage-ment and Development Agreement (OMDA) on April 4, 2006 with the AAI. The initial term of the concession is 30 years extendable by a further 30 years.
Source: http://www.newdelhiairport.in/our-company.aspx
Mumbai
Mumbai International Airport Pvt. Ltd. (MIAL) is a Public Private Partnership joint venture between GVK, BSDM, ACSA Global and Airports Authority of India (AAI). MIAL was awarded the mandate for operating and modernising the Chhatrapati Shivaji International Airport, Mumbai (CSIA) in April 2006. GVK leads the consortium with 50.5% stake in MIAL while Bid Services Di-vision (Mauritius) Limited (BSDM) holds 13.5%, ACSA Global 10% and AAI the remaining 26%. The GVK led consortium comprises of GVK, Bidvest and Airports Company South Africa (ACSA). This consortium has led the redevelopment and modernisation of CSIA.
Source: http://www.csia.in/corporate/partners.aspx
Bengaluru
The Government of India has given Bengaluru International Airport Limited (BIAL) the exclusive right and privilege to carry out the development, design, fi nancing, construction, operation, and man-agement of the airport for a period of 30 years from its opening date, with an option to extend the concession for another 30 years. The BIAL is the joint venture of the public and private sector initia-tives. AAI and KSIIDC are the state promoters having a total of 26% of the share, while Siemens, Unique Zurich Airport and Larsen & Toubro are the private promoters with 40 per cent, 17 per cent, and 17 per cent of the share.
Source: http://www.Bengaluruairport.com/ourBusiness/aboutBia.jspx

13
Indian Economic Context and Air Transport Sector
Cochin
Cochin International Aviation Services Limited (CIASL) is a subsidiary of Cochin International Airport Limited, established on 8th September 2005 under Companies Act, 1956. CIASL has been established for the purpose of setting up a world class Aircraft maintenance, repair and overhaul (MRO) facility clubbed with an Aviation Training Institute for imparting training to Pilots, Cabin Crew, Engineers and Technicians for in-fl ight and ground support, at Cochin International Airport, Nedumbassery.
Source: http://www.cial.aero/contents/viewcontent.aspx?linkIdLvl2=73&linkId=73
Nagpur
In February, 2009, the government approved a joint venture between the Airports Authority of India (AAI) and Maharashtra Airport Development Co. (MADC) – promoted by the Maharashtra gov-ernment – for developing the Nagpur airport as a multi-modal international passenger and cargo hub. In this, AAI, India’s airports operator, would hold 49 per cent while MADC will have 51 per cent equity in the joint venture. AAI has been permitted to invest Rs 490 million (Rs 4.9 crore) in the venture. The Nagpur airport modernisation programme also includes a special economic zone (SEZ) besides a second airstrip, which would be 60 metres wide and 4,000 metres long.
Three major airports Delhi, Mumbai, and Chennai, accounted for 45.87 per cent or 48.4 mil-lion of the domestic passenger traffi c in 2010–11. For international passenger traffi c, the share of these airports stood at 59.64 per cent or 22.6 million passengers in 2010–11. This indicates the concentration of traffi c in these airports, specifi cally in Delhi and Mumbai. Though Delhi’s airport share in both domestic and international passenger traffi c has remained constant over the last three years, the share of Mumbai airport has declined marginally.
Regional differences in air passenger traffi c refl ect disparities in economic opportunities and connectivity. The southern region has the highest share of international passenger traffi c and the western region has the highest share in domestic passenger traffi c. Passenger traffi c is rela-tively low in the eastern and north-eastern regions.
2.1 Policies to Catalyse the SectorThe regulatory framework for India’s civil aviation sector has been evolving over the last few years as the sector has seen considerable expansion of its role in the economy. Globalisation of Indian economy has necessitated faster expansion of air transportation services. We fi rst note some of the key regulatory institutions and their role and then discuss some of the critical policy issues facing the sector.
2.2 Airports Economic Regulatory Authority (AERA)The Airports Economic Regulatory Authority (AERA) is a statutory body constituted under the Airports Economic Regulatory Authority of India Act, 2008. The statutory functions of the AERA are to determine the tariff for the aeronautical services taking into consideration a num-ber of factors like capital expenditure incurred and timely investment in improvement of airport facilities, service provided and its quality, revenue received from services other than aeronautical services, concession offered by the Central Government in any agreement, etc.

14
Emirates in India
Apart from this, AERA determines the amount of the Development Fees in respect of major airports and the amount of the Passengers Service Fee levied under rule 88 of the Aircraft Rules, 1937 made under the Aircraft Act, 1934. It monitors the set performance standards relating to quality, continuity and reliability of service as may be specifi ed by the Central Gov-ernment or any authority authorised by it in this behalf.
2.3 Airports Authority of India (AAI)The Airports Authority of India (AAI) is an organisation working under the Ministry of Civil Aviation that manages most of the airports in India. The AAI manages and operates 126 air-ports and 329 airstrips, including 16 international airports, 89 domestic airports and 26 civil enclaves.
The main functions of AAI inter alia include construction, modifi cation & management of passenger terminals, development & management of cargo terminals, development & main-tenance of apron infrastructure including runways, parallel taxiways, apron etc., provision of communication, navigation and surveillance which includes provision of DVOR / DME, ILS, ATC radars, visual aids etc., provision of air traffi c services, provision of passenger facilities and related amenities at its terminals thereby ensuring safe and secure operations of aircraft, pas-senger and cargo in the country.
2.4 Directorate General of Civil Aviation (DGCA)The Directorate General of Civil Aviation (DGCA) is the Indian governmental regulatory body for civil aviation under the Ministry of Civil Aviation. DGCA renders advice to the Government on matters relating to air transport including bilateral air services agreements, on ICAO matters and generally on all technical matters relating to civil aviation, and acts as an overall regulatory and developmental body for civil aviation in the country.
The authority is responsible for registration of civil aircraft; formulation of standards of air-worthiness for civil aircraft registered in India and grant of certifi cates of airworthiness to such aircraft; licensing of pilots; licensing of air traffi c controllers; granting of Air Operator’s Certifi -cates to Indian carriers and regulation of air transport services operating to/from/within/over India by Indian and foreign operators, including clearance of scheduled and non-scheduled fl ights of such operators. DGCA also conducts investigation into accidents/incidents and takes accident prevention measures including formulation of implementation of Safety Aviation Management Programmes.
2.5 The Issues
Notwithstanding the impressive numbers and future projections relating to the prospects for Indian civil aviation, there are important reforms that are needed to realize this potential. Even from the perspective of Indian carriers, they presently carry only 30 per cent of the country’s international traffi c. Indian carriers are also not able to tap into intercontinental markets like Europe to South East Asia and Europe to Australasia. The Indian carriers Air India, Jet Air-ways and Kingfi sher have 1 per cent of this traffi c share. On the Europe to Australasia route Indian carriers again have a negligible presence.

15
Indian Economic Context and Air Transport Sector
A lot of this state of affairs has to do with the regulatory bottlenecks that exist in the Indian aviation sector. The regulations constrain not only the expansion of Indian carriers but also the expansion of the sector as a whole that can also help economic growth.
Some of the signifi cant regulatory policy decisions have to do with:
1. Bilateral air service agreements that India has with various countries for operating fl ights to and from India.
2. ATF taxes.
3. Service tax on tickets.
4. Foreign direct investment in private Indian carriers.
2.6 Air Services Agreements Bilateral air services agreements are offi cial agreements that governments of various countries exchange with each other so as to allow their airlines to operate fl ights between the two coun-tries. In principle, these agreements help expand the services available to the consumers and economic activities such as business operations and tourism. The agreements create an op-portunity for the expansion of the domestic airlines and also international airlines. However, realizing the benefi ts of this opportunity will also depend on the network that the airlines are able to create globally.
India has allowed operations of international airlines under bilateral agreements as well as an ‘open sky’ policy to facilitate global commerce and transportation. There is an obvious concern that this policy has not led to the expansion of Indian carriers as much as it has helped expand traffi c volumes.
The situation in Indian aviation has changed dramatically in the last decade with private do-mestic Indian carriers growing substantially. Today Jet Airways, SpiceJet, IndiGo, Air India, Air India Express, JetLite and Kingfi sher are fl ying to different parts of the world. At the mo-ment Air India, Jet and Kingfi sher are operating to Europe, America and Canada. Along with these three airlines, other Indian private carriers are also operating to destinations in South Asia, the Far East and the Gulf.
Strategies to provide adequate opportunities to Indian carriers should be pursued while Indian consumers and global travel is not restricted by such policies.
2.7 Aviation Turbine Fuel CostOne of the most critical issues in Indian aviation is the high price of ATF. Cost of ATF con-stitutes approximately 40 to 50 per cent of the operational expenses of an airline in India. The world average cost on ATF is 20 per cent of an airline’s operational expenses. ATF prices at Delhi and Mumbai airports are 10 to 18 per cent higher than those at other competing hubs.
ATF’s base cost in India has increased by 46 per cent since 2007 which has led to a further dent in the profi tability especially of Indian carriers.
16
Emirates in India
The reason for this state of affairs is the fact that the sale of ATF in India is subject to a number of taxes and duties that add to the already higher base cost of the fuel. The sales tax on ATF imposed by state governments is the biggest component here as this tax ranges from 16 per cent to 30 per cent in the different states with an average of around 25 per cent across the country.
One measure that is likely to benefi t the sector is the direct import of ATF by the airlines. This may help in the reduction of cost of fuel.
2.8 Service Tax on Air Tickets Another major policy working against the aviation industry is the service tax that is levied by the government on air tickets. Not only is India among the few countries in the world which levy this tax, but this service tax is also among the highest in the world.
Just as high ATF taxes make cost of operating airlines more expensive, service tax on air tickets makes air transport more expensive to travellers which in turn limits the growth of both do-mestic and international travel.
The Indian government started levying service tax on air tickets in July 2010. During fi nancial year 2012–13, the service tax on air tickets was increased four times and now it is levied on 40 per cent of the gross value of the ticket (earlier it was 10 per cent of the gross value or Rs 100 per journey, whichever was lower for domestic passengers fl ying on any class and 10 per cent of the gross ticket value or Rs 500 per journey whichever was lower for international travel).
This changeover to an ad valorem rate of taxation without any maximum cap means that air travellers now have to pay much more for fl ying in India.
2.9 Foreign Direct Investment in the Domestic Airline IndustryAt present there is no automatic approval given to an international airline or a fi rm wanting to invest in a domestic carrier. Each proposal has to be approved by the inter-ministerial Foreign Investment Promotion Board (FIPB) under the Commerce Ministry.
The situation was, however, different a few years ago when foreign airlines were allowed to invest in domestic airlines till the mid-1990s. Hence, Jet Airways had a stake from Kuwait Airways and Gulf Air. The policy was changed and when that happened, Jet Airways bought back the equity that foreign airlines owned in its airline.
Today, there are a number of foreign airlines which may be interested in acquiring a stake in domestic Indian airlines. This is primarily because India is one of the few global aviation mar-kets that are seeing strong growth. It makes sense for international carriers to look at investing in domestic Indian airlines for various other reasons as well. Compared to a developed aviation market like the US, which has around 2.5 air trips per year per capita, India has under 0.05 air trips per capita per year so there is a large domestic market potential in the coming years.
Changing the policy on FDI in aviation will also provide a breather to Indian carriers who are fi nding it fi nancially diffi cult to keep their operations afl oat. Further, creditors to the airlines too need assurances that they will get returns on the investments that they have made in do-mestic airlines. Moreover requirements of capital will be increasing for expanding the sector to meet the future needs

17
Indian Economic Context and Air Transport Sector
The present economic conditions and air transport’s role in it points to the need for investment and regulatory reforms to realise its full potential. It is expected that demand for air transport will grow in the future in view of the continued globalisation of the Indian economy, the grow-ing GDP, anticipated policy reforms to facilitate expansion of civil aviation sector, as well as the ongoing investments in airport modernisation.

18
Emirates in India

19
3. Emirates in India
3.1 IntroductionEmirates Airline is an independent international airline based in Dubai and one of the world’s largest. In 2011/12 it carried 34 million passengers and fl ew to 122 destinations in 72 countries. Its operations in India started in 1985 with 10 fl ights per week to Mumbai and Delhi. Cur-rently, Emirates operates 185 passenger fl ights every week between Dubai and 10 places in In-dia, namely Ahmedabad, Bengaluru, Chennai, Delhi, Hyderabad, Kochi, Kolkata, Kozhikode, Mumbai and Thiruvananthapuram.
Over the last 27 years, Emirates has progressively increased its investment in the Indian market and expanded its services. Trade and tourism links between UAE and India have benefi ted Emirates’ growth. In fact, Emirates has served as an important catalyst in creating broader bilateral links between the two countries. Emirates is a commercial carrier and its operation in India is driven by rational commercial behaviour. This has allowed Emirates to grow in India, and India in turn to benefi t from its services.
3.2 Emirates in the Indian Air Transport SectorIn the last three years, Emirates’ contribution to India’s air transport industry has grown signifi -cantly. India’s international passenger traffi c increased from 32 million in 2008–09 to 38 million in 2010–11, an increase of 20 per cent (Table 3.1). In the same period, Emirates’ contribution to India’s international passenger traffi c increased from 9.84 to 12.26 per cent.
In addition to passenger traffi c, Emirates has also signifi cantly contributed to India’s inter-national cargo traffi c segment. India’s international cargo traffi c was 1.15 million tonnes in 2007–08 which grew to 1.50 million tonnes in 2010–11, a 30 per cent increase. During the same period, Emirates’ cargo traffi c in India, as a percentage of India’s total international cargo, increased from 11.43 to 14.39 per cent.
Table 3.1: International Air Traffic: Emirates and India
2008–09 2009–10 2010–11
Passenger millions
India 31.58 34.37 37.91
Emirates 3.11 4.15 4.65
Emirates (%) 9.84 12.09 12.26
Cargo ‘000 tonnes
India 1149 1271 1496
Emirates 131 190 215
Emirates (%) 11.43 14.92 14.39
Source: Emirates; Airport Authority of India.
20
Emirates in IndiaTa
ble
3.2:
Em
irat
es’ p
asse
nger
(in
num
bers
) and
Fre
ight
Tra
ffic
(in
tonn
es) i
n In
dia
Em
irat
es’ p
asse
nge
r tr
affi
c in
In
dia
H
ub
Air
po
rtN
on
-hu
b A
irp
ort
s (S
ou
th I
nd
ia)
No
n-h
ub
Air
po
rts
(Oth
er t
han
So
uth
In
dia
)
D
elhi
Mum
bai
Ben
galu
ruC
henn
aiH
yder
abad
Koc
hiK
ozhi
kode
*T
hiru
vana
-nt
hapu
ram
Kol
kata
Ahm
edab
ad
2008
-09
517,
232
736,
123
243,
465
364,
301
334,
591
301,
012
120,
794
186,
927
154,
585
146,
429
2009
-10
669,
118
889,
424
393,
971
511,
988
402,
452
407,
312
231,
279
242,
265
198,
295
207,
884
% g
row
th fr
om
2008
-09
to 2
009-
1029
2162
4120
3591
3028
42
2010
-11
677,
694
950,
284
444,
077
575,
848
470,
951
424,
948
328,
801
288,
961
248,
154
237,
619
% g
row
th fr
om
2009
-10
to 2
010-
111
713
1217
442
1925
14
2011
-12
707,
195
949,
402
445,
375
584,
267
490,
543
433,
487
328,
682
297,
100
239,
402
234,
343
% g
row
th fr
om
2010
-11
to 2
011-
124
-0.1
0.3
24
2-0
.04
3-4
-1
Em
irat
es’ f
reig
ht
traffi
c
(to
nn
es)
in I
nd
ia
2008
-09
19,3
8734
,600
12,6
9923
,005
7,15
49,
510
2,61
59,
404
7,29
156
69
2009
-10
30,6
7249
,458
19,1
6331
,701
10,1
2512
,602
7,61
611
,887
9,93
16,
394
% g
row
th fr
om
2008
-09
to 2
009-
1058
4351
3842
3319
126
3613
2010
-11
32,5
7053
,140
22,7
9437
,059
14,2
4711
,321
8,59
914
,795
12,2
228,
527
% g
row
th fr
om
2009
-10
to 2
010-
116
719
1741
-10
1324
2333
2011
-12
28,4
3251
,561
19,8
1331
,836
13,6
209,
309
9,68
415
,194
11,6
728,
676
% g
row
th fr
om
2010
-11
to 2
011-
12-1
3-3
-13
-14
-4-1
813
3-5
2
Sour
ce: E
mir
ates
, *O
pera
tion
at K
ozhi
kode
com
men
ced
from
1st Ju
ly 2
008.

21
Emirates in India
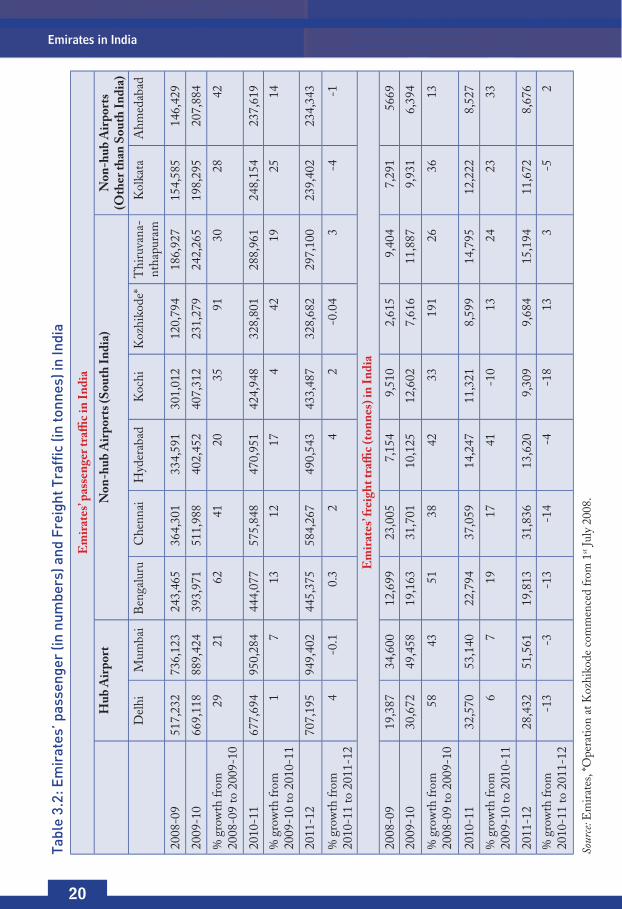
3.3 Emirates Passenger and Freight Traffic in 10 Indian airportsTable 3.2 shows Emirates’ international passenger and freight traffi c at 10 airports in India for four years, 2008-09 to 2011-12. During the years 2008-09 to 2010-11, Emirates’ passenger and freight traffi c steadily increased in nine airports, with one exception being a decline in freight traffi c at Kochi airport in 2010-11. The year 2011-12, however, has shown a decline in both the passenger and freight traffi c strength at most of the airports as the economy slowed down in India considerably during the year.
A comparison of year-on-year data reveals that Emirates’ traffi c grew to non-hub airports by 66 per cent, compared to 32 per cent in India’s hub airports over the last four years. The share of two airport hubs, i.e. Mumbai and Delhi, in Emirates’ overall passenger traffi c declined as the share of passenger traffi c grew in some non-hub and regional airports such as Kozhikode. The combined share of the two airports of Mumbai and Delhi has decreased from 40 per cent in 2008-09 to 35 per cent in 2011-12. Mumbai’s share in passenger traffi c dropped to 20 per cent in 2011-12 from 24 per cent in 2008-09. Delhi’s share dropped to 15 per cent in 2011-12 from 16.7 per cent in 2008-09. Yet Emirates continues to grow in passenger volumes at both airports. On a stand-alone basis, Mumbai witnessed arrivals and departures totaling 949,402 passengers carried by Emirates in 2011-12, an increase of 29 per cent from 736,123 in 2008-09. Delhi registered arrivals and departures of 707,195 Emirates passengers in 2011-12, an increase of 32 per cent from 517,232 in 2008-09.
The share of these two airports in Emirates’ Indian freight traffi c also decreased, even though overall freight volume rose. This is because at these airports, as with passenger operations, freight at points other than Mumbai and Delhi have grown at faster rates. Comparing 2009-10 and 2010-11 data indicates that Emirates’ international passenger traffi c increased by 42 per cent in Kozhikode and 25 per cent in Kolkata. Against such gains, passenger traffi c in Mumbai and Delhi in the same period increased by a mere 7 per cent and 1 per cent, respectively. Over the same period, Emirates’ freight traffi c at Ahmedabad and Hyderabad increased by 33 and 41 per cent, respectively while the increase in Delhi and Mumbai were just 6 and 7 per cent, respectively.
Between 2008-09 and 2009-10, Emirates’ passenger volume to and from India grew by 1.04 million. i.e., 34 per cent, was due to the increase in passenger volumes at the non-hub airports. Table 3.3 below presents Emirates’ growth in hub and non-hub points. The adverse impact of slower economic growth in 2011-12 on passenger traffi c was less pronounced in Mumbai and Delhi as compared to the other airports in the country but the freight traffi c declined in the hub airports more than in the non-hub airports.
22
Emirates in India
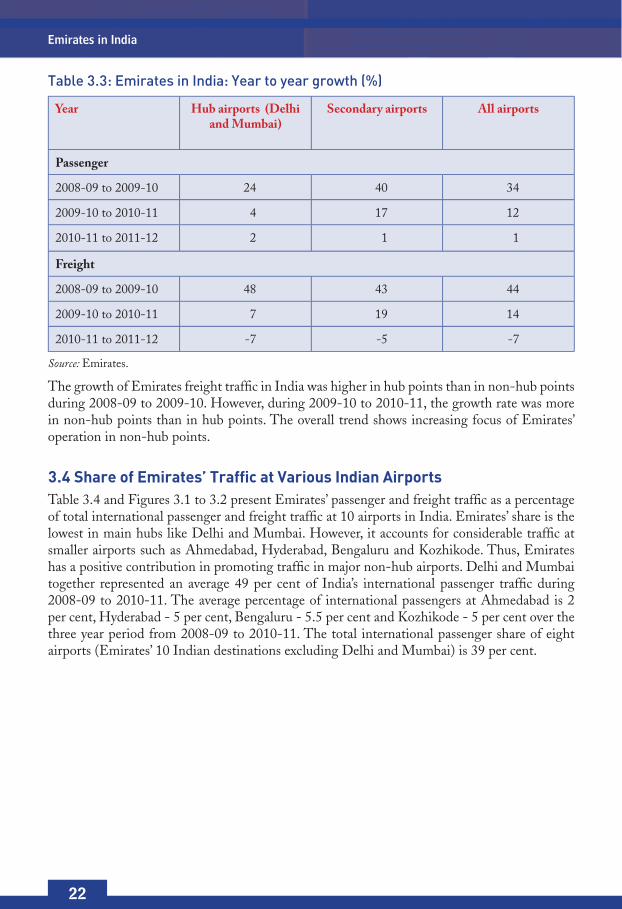
Table 3.3: Emirates in India: Year to year growth (%)
Year Hub airports (Delhi and Mumbai)
Secondary airports All airports
Passenger
2008-09 to 2009-10 24 40 34
2009-10 to 2010-11 4 17 12
2010-11 to 2011-12 2 1 1
Freight
2008-09 to 2009-10 48 43 44
2009-10 to 2010-11 7 19 14
2010-11 to 2011-12 -7 -5 -7
Source: Emirates.
The growth of Emirates freight traffi c in India was higher in hub points than in non-hub points during 2008-09 to 2009-10. However, during 2009-10 to 2010-11, the growth rate was more in non-hub points than in hub points. The overall trend shows increasing focus of Emirates’ operation in non-hub points.
3.4 Share of Emirates’ Traffic at Various Indian AirportsTable 3.4 and Figures 3.1 to 3.2 present Emirates’ passenger and freight traffi c as a percentage of total international passenger and freight traffi c at 10 airports in India. Emirates’ share is the lowest in main hubs like Delhi and Mumbai. However, it accounts for considerable traffi c at smaller airports such as Ahmedabad, Hyderabad, Bengaluru and Kozhikode. Thus, Emirates has a positive contribution in promoting traffi c in major non-hub airports. Delhi and Mumbai together represented an average 49 per cent of India’s international passenger traffi c during 2008-09 to 2010-11. The average percentage of international passengers at Ahmedabad is 2 per cent, Hyderabad - 5 per cent, Bengaluru - 5.5 per cent and Kozhikode - 5 per cent over the three year period from 2008-09 to 2010-11. The total international passenger share of eight airports (Emirates’ 10 Indian destinations excluding Delhi and Mumbai) is 39 per cent.

23
Emirates in India
Table 3.4: Emirates’ Passenger and Freight Share in 10 Airports (%)
Emirates’ Passenger Share in 10 Airports
Emirates’ Freight Share in 10 Airports
2008–09 2009–10 2010–11 2008–09 2009–10 2010–11
Ahmedabad 21.4 24.54 28.74 55.07 54.85 65.69
Bengaluru 14.83 20.29 19.97 12.74 18.65 16.85
Mumbai 9.07 10.8 10.47 9.14 12.11 11.3
Kozhikode 7.97 13.95 17.97 20.83 44.46 39.15
Kolkata 15.43 16.7 17.38 17.9 24.77 27.1
Kochi 14.98 18.29 18.02 37.71 38.45 35.16
Delhi 6.66 8.05 7.31 6.51 9.2 8.33
Hyderabad 21.35 23.46 24.91 24.12 27.9 33.84
Chennai 9.94 13.26 13.56 10.48 12.7 12.54
Thiruvananthapuram 12.68 14.29 15.68 31.17 37.49 39.15
Source: Emirates; Airport Authority India.
Figure 3.1: Emirates Passenger Share at Hub Airports and Non-Hub Airports (%)
40.4
59.6
Hub Non-Hub
2008-09 2009-10 2010-11
37.5
62.5
35.0
65.0
Figure 3.2: Emirates Freight Share at Hub and Non-Hub Airports (%)
Hub Non-Hub
2008-09 2009-10 2010-11
78.1
21.9 20.7
79.3
21.5
78.5

24
Emirates in India
It may be noted that India’s international traffi c at the non-hub airports have a lower share as a result of limited international links from these points. The higher percentage of Emirates’ share at these airports demonstrates the fact that Emirates has no immediate substitute or potential competitor at these points. It also indicates that Emirates’ passenger and freight operations to connecting points in India are often underserved by other carriers.
3.5 Emirates’ Passenger Traffic: 3rd, 4th, and 6th Freedoms, 2011–12International commercial aviation traffi c rights are usually expressed as “freedoms of the air”, which constitute a set of commercial aviation rights granting a country’s airline(s) the privilege to enter and land in another country’s airspace. There are six freedoms of which the fi rst two are covered by IASTA (International Air Services Transit Agreement). They are the following, as defi ned by ICAO (International Civil Aviation Organisation):
1st freedom: The right or privilege, in respect of scheduled international air services, granted by one State to another State or States to fl y across its territory without landing.
2nd freedom: The right or privilege, in respect of scheduled international air services, granted by one State to another State or States to land in its territory for non-traffi c purposes.
The 3rd, 4th, and 5th freedoms are negotiated between countries through ASAs (Air Services Agreements). They are as follows:
3rd freedom: The right or privilege, in respect of scheduled international air services, granted by one State to another State to put down, in the territory of the fi rst State, traffi c coming from the home State of the carrier.
4th freedom: The right or privilege, in respect of scheduled international air services, granted by one State to another State to take on, in the territory of the fi rst State, traffi c destined for the home State of the carrier.
5th freedom: The right or privilege, in respect of scheduled international air services, granted by one State to another State to put down and to take on, in the territory of the fi rst State, traf-fi c coming from or destined to a third State, for example New Delhi-London-New York and vice versa for Indian carriers (5th freedom rights granted by UK applies in the example).
6th freedom: The privilege, in respect of scheduled international air services, of transporting, via the home State of the carrier, traffi c moving between two other States. For example, in India the 6th freedom traffi c of Emirates involves fl ying passengers from India through Dubai (its home state) to Egypt, South Africa or Brazil. Table 3.5 below presents Emirates’ passenger traffi c for 2011-12 divided into 3rd/4th and 6th freedom traffi c.
25
Emirates in India
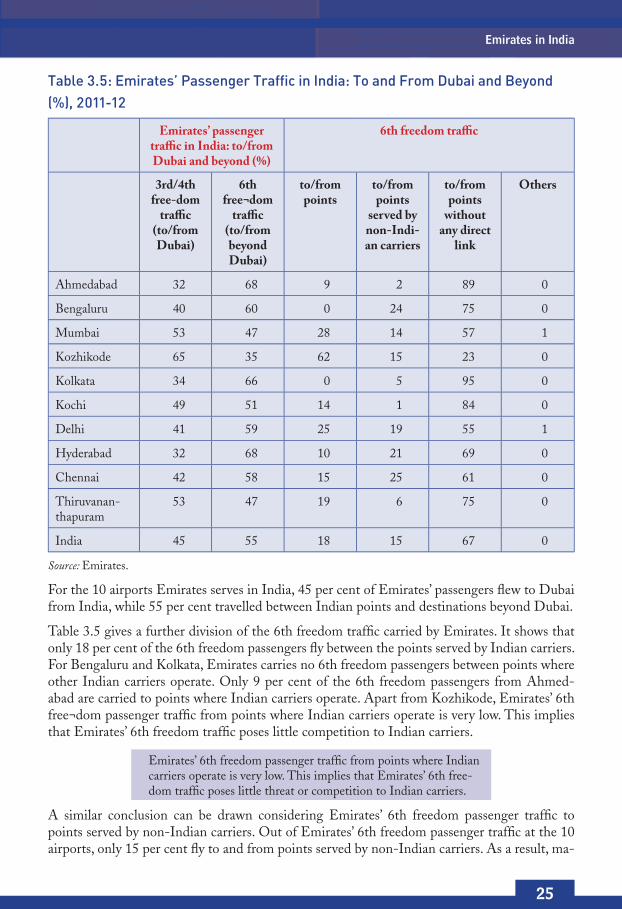
Table 3.5: Emirates’ Passenger Traffic in India: To and From Dubai and Beyond (%), 2011-12
Emirates’ passenger traffi c in India: to/from Dubai and beyond (%)
6th freedom traffi c
3rd/4th free-dom
traffi c (to/from Dubai)
6th free¬dom
traffi c (to/from beyond Dubai)
to/from points
to/from points
served by non-Indi-an carriers
to/from points
without any direct
link
Others
Ahmedabad 32 68 9 2 89 0
Bengaluru 40 60 0 24 75 0
Mumbai 53 47 28 14 57 1
Kozhikode 65 35 62 15 23 0
Kolkata 34 66 0 5 95 0
Kochi 49 51 14 1 84 0
Delhi 41 59 25 19 55 1
Hyderabad 32 68 10 21 69 0
Chennai 42 58 15 25 61 0
Thiruvanan-thapuram
53 47 19 6 75 0
India 45 55 18 15 67 0
Source: Emirates.
For the 10 airports Emirates serves in India, 45 per cent of Emirates’ passengers fl ew to Dubai from India, while 55 per cent travelled between Indian points and destinations beyond Dubai.
Table 3.5 gives a further division of the 6th freedom traffi c carried by Emirates. It shows that only 18 per cent of the 6th freedom passengers fl y between the points served by Indian carriers. For Bengaluru and Kolkata, Emirates carries no 6th freedom passengers between points where other Indian carriers operate. Only 9 per cent of the 6th freedom passengers from Ahmed-abad are carried to points where Indian carriers operate. Apart from Kozhikode, Emirates’ 6th free¬dom passenger traffi c from points where Indian carriers operate is very low. This implies that Emirates’ 6th freedom traffi c poses little competition to Indian carriers.
Emirates’ 6th freedom passenger traffi c from points where Indian carriers operate is very low. This implies that Emirates’ 6th free-dom traffi c poses little threat or competition to Indian carriers.
A similar conclusion can be drawn considering Emirates’ 6th freedom passenger traffi c to points served by non-Indian carriers. Out of Emirates’ 6th freedom passenger traffi c at the 10 airports, only 15 per cent fl y to and from points served by non-Indian carriers. As a result, ma-

26
Emirates in India
jority of Emirates’ 6th freedom passenger traffi c is between points that have no direct link from the Indian points. On an average, 67 per cent of Emirates’ 6th freedom passengers are carried between such points. At the airport level, the share of Emirates’ 6th freedom passenger traffi c to points without any direct link is as high as 95 per cent for Kolkata, 89 per cent for Ahmedabad, 84 per cent for Kochi, 75 per cent each for Bengaluru and Thiruvananthapuram, and 69 per cent for Hyderabad. At all airports except Kozhikode, which is principally guest worker and VFR (visiting friends and relatives) traffi c, the split is more than 50 per cent. Table 3.6 shows the connectivity in terms of number of points for Emirates’ 6th freedom passenger traffi c.
Table 3.6: Number of Points Connected by Emirates’ 6th Freedom Traffic, 2011–12
to/from points served
by India carri¬ers
to/from points
served by non-Indi¬an
carriers
to/from points
without any direct link
Others Total
Ahmedabad 2 1 94 1 98
Bengaluru 1 8 82 7 98
Mumbai 11 14 64 10 99
Kozhikode 5 2 87 0 94
Kolkata 0 1 93 4 98
Kochi 6 1 87 3 97
Delhi 12 15 58 14 99
Hyderabad 3 4 88 3 98
Chennai 3 8 82 4 97
Thiruvananthapuram 4.0 1 88 1 94
India 14 17 53 15 99
Source: Emirates.
Emirates carried 6th freedom passengers to only 14 destinations abroad where Indian carriers oper¬ate. There are 17 points to which Emirates carried 6th freedom traffi c where non-Indian carri-ers are also present. In addition, Emirates carried 6th freedom passengers between India and 53 for-eign points that have no direct links. This number is more than triple the number of points on those des¬tinations where the connectivity is provided either by Indian carriers or non-Indian carriers.
We observe that Emirates connects relatively small airports to a signifi cant number of points beyond Dubai. Emirates connect Mumbai and Delhi to 64 and 58 points respectively that do not have any direct link. However, for other relatively small airports, Emirates’ 6th freedom service connects air¬ports to a higher number of points without any direct links. There are 94 points which are connected to Ahmedabad airport, 93 to Kolkata and more than 80 points to and from each of the remaining airports.
It is evident that Emirates contributes signifi cantly to the connectivity of eight non-hub airports in India. Connectivity in terms of number of points linked to Indian airports over Dubai is between 94 to 98 points for non-hub airports and 99 points for both Delhi and Mumbai. Connectivity to

27
Emirates in India
and from airports that are not directly linked is the lowest for hub airports where other non-Indian carriers are available. Rather than providing services solely on trunk routes, Emirates connects non-hub airports to a signifi cant number of points which would otherwise not be directly linked to these airports. This highlights the connectivity Emirates provides, as well as emphasizing their role in enhancing air transport and tourism, thereby providing signifi cant value for the regional economy of an airport.
A recent report by Oxford Economics2 on Indian Transport found that an improvement in connec¬tivity brings benefi ts to users of air transport services by: reducing time spent in transit, allowing for shorter waiting times and improving the quality of service. Improvements in connectiv-ity also re¬duce the cost of air transport services making air transport more competitive relative to other modes of transport. This competitive edge places air transport in the set of factors facilitating international trade.
3.6 Emirates’ Passenger Traffic to MENA Countries, 2011-12In 2011-12, Emirates carried passengers between India and 66 countries. India, being an im¬portant investment destination and trading partner of the MENA (Middle East and North African) countries,3 witnessed a lot of passenger traffi c to and from these nations. At present, Emirates carries passengers between India and 16 MENA countries via its hub in Dubai. With Emirates’ 6th freedom traffi c into and out of India, 57 per cent is with the MENA region. The traffi c share of the other 50 countries connected to India by Emirates is 43 per cent. Table 3.7 and Figures 3.3 and 3.4 show the percentage of Emirates’ traffi c between the MENA region and India and the percentages of Emirates’ traffi c at Indian airports to 50 non-MENA destinations.
Table 3.7: Emirates’ Passenger Traffic: India - MENA and India - outside MENA, 2011-12 (%)
City Emirates’ passenger traffi c: India-Middle East & North Africa
(MENA) (%)
Emirates› passenger traffi c: India - 45 countries outside MENA (%)
Ahmedabad 41 59
Bengaluru 49 51
Mumbai 59 41
Kozhikode 92 8
Kolkata 50 50
Kochi 58 42
Delhi 49 51
Hyderabad 51 49
Chennai 54 46
Thiruvanantha puram
72 28
India 57 43
Source: Emirates.
2. Oxford Economics (2011), Economic benefi ts from air transport in India.3. India represents 1 to 4 per cent of total imports of most MENA countries [World Bank (2008) “Strengthening MENA’s trade and investments links with China and India”]

28
Emirates in India
Figure 3.3: Emirates’ Passenger Traffic: India to Middle East and North Africa (MENA) 16 countries, 2011-12, [%](2.7 million PAX)
41
49
59
92
50
58
49 5154
72
57
Ah
me
da
ba
d
Be
ng
alu
ru
Mu
mb
ai
Ko
zh
iko
de
Ko
lka
ta
Ko
ch
i
De
lhi
Hyd
era
ba
d
Ch
en
na
i
Th
iru
va
na
n-
tha
pu
ra
m
Ind
ia
Figure 3.4: Emirates’ Passenger Traffic: India to 50 countries outside MENA, 2011-12, [%](2.0 million PAX)
Ah
me
da
ba
d
Be
ng
alu
ru
Mu
mb
ai
Ko
zh
iko
de
Ko
lka
ta
Ko
ch
i
De
lhi
Hyd
era
ba
d
Ch
en
na
i
Th
iru
va
na
n-
tha
pu
ra
m
Ind
ia
59
51
41
8
50
42
5149
46
28
43
In all the Indian airports that Emirates serves apart from Ahmedabad, the majority of passen¬ger traffi c is carried between India and MENA countries. In Kozhikode and Thiru-vanantha-puram, the share is as high as 92 per cent and 72 per cent respectively. Even at a small airport like Kochi, 58 per cent of Emirates’ passengers fl y to MENA countries. Only Delhi, Bengaluru, and to some extent Kolkata, witness equal distribution of passengers to both MENA and non-MENA countries. Emirates carried passengers from all the Indian points to each of the 16 MENA countries. Apart from Thiruvananthapuram, Emirates connects each of the 10 Indian points to 50 non-MENA countries.
The following are the details of Emirates’ India traffi c with MENA countries (2.7 million pas¬sengers) (Figure 3.5).
UAE (Dubai) – 80 per cent
Qatar – 5 per cent

29
Emirates in India
Kuwait – 5 per cent
Saudi Arabia – 5 per cent
Bahrain – 2 per cent
Oman – 1 per cent
Other 10 MENA countries – 2 per cent
Figure 3.5: Emirates’ India Traffic to/from MENA Countries, 2011-12, [%] (2.7 million PAX)
UAE (Dubai)
80%
Kuwait
5%
Qatar
5%
Bahrain
2%
Oman
1%
Other 10 MENA
Countries
1%
Saudi Arabia
5%

30
Emirates in India

31
4. Economic Impacts Associated with Emirates Airline Operations in India
4.1 IntroductionThis chapter presents a brief overview of the overall economic and social impact of the air transport operations in a country. Estimating the economic impact can be helpful for under-standing potential benefi ts. Other than generating income and employment opportunities in the aviation sector itself, an airline service also provides benefi ts to the public in the form of a comfortable, fast and modern mode of transport. At the outset, a short note on the economic rationale is being provided that brings out the importance of the air transport facilities in the overall performance of the economy.
This chapter also examines in detail the economic benefi ts that the Indian operations of Emir-ates Airlines provide to the Indian economy. These benefi ts are accrued through the following channels:
Direct impacts: Benefi ts specifi c to the aviation sector by generating economic activities and business opportunities at airports and supporting services.
Multiplier eff ects: The additional income and employment opportunities generated in other sectors of the economy down the supply line of aviation sector.
Induced impacts: The effects of airlines’ operation, in addition to direct and multiplier effects, by enabling activities in other sectors of the economy, such as tourism.
4.2 Economic Contributions of Airline OperationsAir transport services and economic growth are related through a series of mutually causal feedback mechanisms. The causality is the relationship between an event, for example the pro-vision of air transport, and the second event, that is, the economic growth. Thus, both the airlines’ operations and economic growth impact each other. Air transport generates income and employment in the aviation sector and also contributes in the form of wider socioeconomic benefi ts through its potential to enable certain type of activities in an economy. For instance, the availability of air transport services effectively increases the scope of economic activity. This economic activity in turn generates the need for air transport of passenger and freight, and drives the demand for air transport services.
At the macroeconomic level, air transportation impacts the economy by not only providing employment but also by enabling access to:
Markets
People and communities
Capital

32
Emirates in India
Ideas and knowledge
Labor supply, skills, and opportunities
Resources
This macro level impetus to the economy in turn provides capital and generates demand for passenger and freight travel. This mutually benefi cial mechanism drives both economic devel-opment and air transport.
The following distinctive features of air transport sets it apart from other modes of transporta-tion, such as:
Speed
Cost
Flexibility
Reliability
Safety
In addition, air transport is the only feasible long-distance mode of transportation for high-value perishable commodities. It is often the only means of access for geographically remote or isolated areas and also critical for time-sensitive corporate initiatives. It is because of these features that the economic impact of air transport differs from other transport modes.
Internal to the air transportation system is the supply and demand relationship. Airlines pro-vide supply through pricing and scheduling of fl ights based on the revenues and profi tability of a particular route, factors that are governed by both passenger and freight demand on these routes. The passenger fl ow can be divided into three categories:
Business
Leisure (holiday and recreation)
Personal (visiting friends and relatives, and education related trips)
The passenger fl ow shapes up the economy by its effect on investment, tourism, remittance and knowledge. The cargo fl ow similarly affects the economy by enabling a faster fl ow of exports and imports.
Several methodologies exist in economic literature to examine the effect of airlines’ operation in each dimension, namely:
Investment
Tourism
Remittances
Flow of knowledge across borders
These methodologies differ in their purpose and data requirements. Often, a distinction is made between air transport’s impact on an economy along the lines of direct impact, indirect impact, and induced impact.
Of all the quantitative economic techniques, Input–Output model represents the interdepen-

33
Economic Impacts Associated with Emirates Airline Operations in India
dence between different sectors (industries) of an economy. This technique is widely used in order to assess the economic impact of air transport. The present study uses the Input-Output model of the Indian economy to study the economic impact of Emirates’ operation in India. The methodology allows for the identifi cation of output and employment multiplier effects. The impact on tourism sector of India is obtained using an indirect estimation method.
Therefore, the focus of the study is to quantify the impact of Emirates’ operation in India along the following lines:
Direct impact
Multiplier impact – output and employment
Induced effect on tourism
4.3 Direct Impact of Emirates’ Operation in IndiaAn airline operation requires a wide range of facilities and supporting services provided by the airport. Since Emirates is the largest foreign airline operating in India and creates signifi cant demand for services at the 10 airports it serves, its expenditures contribute signifi cantly to the Indian aviation industry.
4.3.1 Direct contribution to Indian civil aviationEmirates’ operation in India contributed US$ 274 million in 2010–11. This is 0.32 per cent of India’s transport GDP4 for the year (Table 4.1).
Table 4.1: Emirates’ Direct Contribution in India’s Economy: 2008–09 to 2010–11
Year Contribution (in million US $) % Transport GDP of India
2008–09 134 0.20
2009–10 217 0.33
2010–11 274 0.32
Overall (Total & Average) 631 0.28
Source: Emirates; Central Statistical Organisation, India.
The total for three years has been calculated using defl ator and adjusts for infl ation. Emirates’ total contribution for the last three years is worth US$ 631 million in 2010 after adjusting by defl ator.5
4. Transport GDP of India includes contribution from land, water, and air transport and services incidental to it. Its average share in total GDP over the last three years is 5.4 per cent. The lion’s share of transport GDP comes from road transport, followed by air and water transport. In 2010–11, the transport GDP of India is US$ 85542 million (estimate) and the air transport GDP is US$3311 million (estimate).5. Defl ators are used to compare relative worth of money in different periods of time. The idea derives from the observation that with positive infl ation, value of money decreases. Hence adjustment is required to compare the amounts in different time periods. We use US GDP defl ator to calculate the value of Emirates’ contribution in the three-year period. GDP defl ator is provided by the Bureau of Economic Analysis, US Department Commerce.

34
Emirates in India
Emirates’ direct contribution generates demand for goods and services essential for its opera-tion. Table 4.2 and Figure 4.1 show the share of Emirates’ main expenditures in India. Of the total expenditures over the last three years, 43 per cent accounts for fuel uplift and 32 per cent on services such as landing, handling and over-fl ight charges.
On an average, 5 per cent of Emirates’ expenditure in India goes to employee remuneration. Emirates has its operational base in Dubai and a low employment base in India as compared to Indian carriers. Indian carriers account for an average of 9.23 per cent of expenditure towards employee remuneration. Emirates’ per capita expenditure on employee remuneration is higher.
Table 4.2: Emirates Expenditure in India: 2008–09 to 2010–11 (%)
2008–09 2009–10 2010–11 3 year average
Fuel uplift 30.93 43.68 49.00 43.27
Landing, aircraft handling and over fl ying costs
43.11 31.05 27.21 31.96
Employee remuneration 5.98 4.61 4.71 4.94
Others 19.98 20.66 19.08 19.83
Total 100 100 100 100
Figure 4.1: Distribution of Emirates’ Expenditure in different components in India (%)
30
.93
43
.11
5.9
8
19
.98
2008-09 2009-10 2010-11 3 year average
Fuel uplift OthersLanding, aircraft handling and over flying costs Employee Remuneration
43
.68
31.0
5
4.6
1
20
.66
49
27
.21
4.7
1
19
.08
43
.27
31.9
6
4.9
4
19
.83
Source: Emirates.
4.3.2 Direct contribution at Indian airportsTable 4.3 shows Emirates’ direct contribution at the airports it serves in India. In all 10 air-ports the expenditures incurred by Emirates increased by 106 per cent over the last three years. The highest increase was registered at Hyderabad (160%) followed by Kozhikode (157%). In 2010–11, only 35 per cent of Emirates’ direct contribution in terms of passenger share went to the three big airports of Mumbai, Delhi, and Chennai whereas 65 per cent was spent on non-hub airports. This indicates Emirates’ role in developing economic activities at non-hub points.

35
Economic Impacts Associated with Emirates Airline Operations in India
Table 4.3: Emirates’ Contribution at Points of Operation: 2008–09 to 2010–11, (million US$)
2008-09 2009-10 2010-11
Hub Airports Delhi 13 23 30
Mumbai 16 33 37
Non-hub Air-ports
Bengaluru 11 20 23
Hyderabad 9 15 24
Kochi 12 17 17
Ahmedabad 5 8 9
Kozhikode 5 8 12
Kolkata 9 10 16
Chennai 16 24 31
Thiruvanan-thapuram
7 10 15
Overheads in India
30 49 60
Total 134 217 274
Source: Emirates.
Analysis of the data6 reveals that the growth slowed down during 2009–10 to 2010–11 com-pared to the previous period of 2008–09 to 2009–10. The average growth of direct contributions among the 10 Indian airports was 58 per cent for the period 2008–09 to 2009–10. It declined to 32 per cent during 2009–10 to 2010–11. This decline in growth of direct contributions can be attributed to the increase in Emirates’ seat factor at different airports.
Table 4.4: Emirates Seat Factor at 10 Airports: 2008–09 to 2010–11 (%)
2008-09 2009-10 2010-11
Ahmedabad 72.52 78.43 83.58
Bengaluru 60.18 72.93 82.3
Mumbai 78.35 81.58 86.59
Kozhikode 75.61 88.92 90.84
Kolkata 77.57 79.92 73.51
Kochi 86.9 87.16 88.58
Delhi 80.03 81.9 82.33
6. The year to year growth calculation does not incorporate defl ator. However, the high percentages imply that even after defl ating for price changes the growth fi gures remain substantial and do not alter the conclusions derived.
(Contd.)

36
Emirates in India
Hyderabad 66.44 73.01 83.72
Chennai 81 78.87 84.96
Thiruvananthapuram 89.02 86.93 83.2
Average 76.47 80.39 84.32
Source: Emirates.
4.3.3 Seat factors Emirates’ average seat factor in 2008-09 was 76 per cent. At four airports, the seat factors
were greater than 80 per cent.
The average seat factor grew to 80 per cent in 2009-10, leaving limited opportunity to expand and revealing signifi cant capacity constraints. In 2009-10, the number of airports where Emirates had above 80 per cent seat factor increased to fi ve.
In 2010-11, Emirates’ operations in India enjoyed higher demand, with seat factor regis-tering 84.3 per cent, exceeding 80 per cent at all airports except Kolkata.
This indicates that with the present high seat factors, Emirates’ growth in terms of its contri-bution to the Indian economy is being slowed down and its operations capped by the current bilateral agreement.
Emirates’ contribution to Kozhikode increased by 157 per cent in the last three years. Its seat factor in this airport was 76 per cent in 2008-09 which increased to 91 per cent in 2010-11. Without an increase in seat allocation, the growth in economic benefi ts to Kozhikode is liable to slow down, as operating at 91 per cent seat factor already implies a binding constraint on traffi c growth.
Similarly, the growth of Emirates’ contribution to Kochi over the last three years, 36 per cent, has been the lowest among all airports. Emirates’ seat factor at Kochi was already 87 per cent in 2008-09, leaving limited scope for growth over the following years.
It is important to note that over the long-term, Emirates introduces capacity ahead of de-mand, and this is thought to have a catalytic effect by stimulating previously untapped demand. For example, in 2008-09 Emirates’ seat factors in Bengaluru and Hyderabad were 60 and 66 per cent, respectively. This allowed Emirates to invest and stimulate market demand in these points. In 2010-11, the seat factors in these points grew considerably and stood close to the Emirates average seat factor in India.
4.3.4 Direct employment in IndiaAs the largest international airlines in the Indian market, Emirates’ operation has created sub-stantial employment in the Indian economy.
Emirates’ operation in India involves 1045 employees in the country.
Emirates’ direct employment in India generated an income of US$13 million for its em-ployees in 2010–11.
This does not take into account the many more jobs that are supported by Emirates’ service in the tourism and trade industries.
Table 4.4: (Contd...)

37
Economic Impacts Associated with Emirates Airline Operations in India
4.3.5 Contribution to the Indian carriersCode sharing between two or more airlines is an agreement that allows the airlines to share a fl ight. One airline actually operates the fl ight; the others sell tickets on the fl ight.
Interline agreements between airlines allow carriage of passenger and freight by one airline on behalf of another airline through acceptance of the latter’s tickets and coordinating through-check-in, baggage transfer, etc.
Emirates has interline arrangements with three Indian carriers, including a code share agree¬ment with Jet Airways. The interline arrangements allow Emirates to sell tickets on Indian carriers for domestic connections.
Table 4.5 shows that in 2010-11, Emirates sold 33611 tickets on three Indian carriers, for which the total value was US$4.07 million. The highest contribution was to Jet Airways at US$ 2.91 million. It is also important to note that most of the coupons were sold abroad. Emirates’ presence in more than 67countries provides superior distribution and marketing channel for destinations in India. This has also been benefi cial for Indian carriers.
Table 4.5: Emirates’ contribution to Indian carriers, 2010–11
Carrier Number of pas-sengers
% sold abroad Value (million US$)
Air India 1423 94 0.24
Kingfi sher 10629 92 0.92
Jet Airways 21559 89 2.91
Total 33611 - 4.07
Note: Emirates’ interline agreement with Kingfi sher Airlines ended on 12thMarch 2012.
Source: Emirates.
4.3.6 Media and other spendingEmirates’ promotions, advertisements and sponsorships also generate income for the Indian economy. It spent US$16 million during 2008–09 and 2009–10. In 2010–11, the media expen-diture further increased to US$22 million.
Table 4.6: Emirates’ Advertisement and Promotion in India (million US$)
Item of Expenditure 2008–09 2009–10 2010–11
Advertisement/promotion 12 13 13
Sponsorship /public relations 4 3 9
Total 16 16 22
Source: Emirates.
Emirates’ contribution is summarised as follows:

38
Emirates in India
Emirates carried 12.26 per cent and 14.39 per cent of India’s international passenger and freight traffi c, respectively, in 2010-11.
The airline carried 8.87 per cent of international passenger traffi c at hub airports and 18.14 per cent of passenger traffi c at non-hub airports in 2010-11.
It accounted for 9.95 per cent of international freight traffi c at hub-airports and 20.80 per cent of freight traffi c at non-hub airports in 2010-11.
Emirates’ 6th freedom traffi c in 2010-11 connected India to 89 points beyond Dubai, including points not served by Indian carriers. The connectivity expanded to 99 points beyond Dubai including 85 points not served by Indian carriers in 2011-12.
The average connectivity of 6th freedom traffi c is to 89 hub-airports and 87 non-hub airports in 2010-11. The connectivity to hub-airports increased to 99 points in 2011-12.
Emirates’ direct economic contribution was US$66 million in hub-airports and US$148 million in non-hub airports in 2010-11.
Table 4.7 adds up the direct economic contribution of Emirates in India in 2010–11.
Table 4.7: Emirates’ Total Contribution to India in 2010–11 (million US$)
Own operation To Indian carriers Advertisement and promo-tion
Total
274 4 22 300
It may be observed from the Table 4.7 that Emirates’ direct economic contribution in 2010–11 was US$300 million.
4.4 Multiplier Impact of Emirates’ Operation in IndiaEmirates’ operation in India provides a positive impact not only on the civil aviation sector, but also in other sectors of the Indian economy. There is always a relationship between various sectors of an economy through inter-sectoral linkages. The outputs of one sector benefi ts other sectors and vice versa. These help generate additional income and employment in various sec-tors throughout the Indian economy.
We have already explained that present study is based on the Input–Output model of the Indian economy. This model helps to evaluate and quantify the benefi ts of inter-sectoral linkages in great detail. The Input-Output model allows the assessment of the multiplier effect. The mul-tiplier effect is the mechanism that leads to incremental amounts of spending and consumption throughout the economy. This has a positive effect on India’s GDP. Thus, knowledge about the multiplier effect will determine Emirates’ total contribution to the economy in general, and in the air transport sector in particular. A technical description of the methodology is presented in the Appendix.
4.4.1 Output multiplier impactOutput multipliers determine the impact of direct contributions in a sector to the whole econ-omy. Our calculation shows that the output multiplier for Emirates’ contribution in the Indian

39
Economic Impacts Associated with Emirates Airline Operations in India
economy is 2.176. The magnitude of the multiplier 2.176 implies that any contribution of Emirates to Indian air transport sector generates additional 117.6 per cent economic benefi t or output in the economy through sectoral feedback mechanism. Thus, for every dollar spent by Emirates, an additional income of US$1.176 is generated in other sectors of economy.
Table 4.8 further elaborates on the multiplier impact. In 2010–11, Emirates’ direct contribu-tion to the air transport sector has been estimated at US$274 million, which in turn generated a total economic output of US$596 million throughout the economy, an additional income of US$322 million.
Table 4.8: Multiplier Impact of Emirates’ Contribution
Year Direct Impact Multiplier impact Gain (%)
2010–11 US$274 million US$596 million 117.6
4.4.2 Multiplier impact on sectorsUsing the Input-Output model we can deduce the economic contribution of any specifi c sector to another sector. The Indian Input-Output model is a matrix of 130 by 130 sectors. For the sake of computational tractability, we have considered 30 important sectors in it. Figure 4.2 gives a clear picture of the distribution of the multiplier effect at the individual level of major group of sectors.
Figure 4.2: Sector-wise Distribution of Multiplier Impact (%)
Air Transport
46%
Petroleum & Chemicals
13%
Manufacturing
10%
Trade, Banking & Insurance
7%
Rest of the economy
24%
In the Indian air transport sector alone, Emirates’ operations generate an economic output of US$274 million. This is nearly 46 per cent of the total income generated through the multiplier effect by Emirates in India. The petroleum and chemicals industry, which is an important ancil-lary industry of the air transport sector, is impacted by 13 per cent of the total multiplier effect benefi ts. The manufacturing sector accounts for 10 per cent gains due to multiplier impact of Emirates’ operations; whereas trade, banking and insurance sectors are benefi ted by only 6 per cent of Emirates’ total economic contribution. Other 25 per cent of Emirates’ contribution goes to the remaining sectors of the Indian Economy.

40
Emirates in India
4.4.3 Impact on Indian citiesTo assess the impact of the multiplier effect in the domestic economy, it is important to identify to what extent various cities have benefi ted from Emirates’ Indian operations. The model we used for this study provides us a method to calculate the monetary gains at the city level, where the multiplier effect of Emirates’ operation is calculated using weights estimated from direct contribution, and passenger and freight traffi c at each airport.7 The weights are calculated using regression analysis. Table 4.9 and Figures 4.3 and 4.4 below present the multiplier impact of Emirates’ operations throughout its Indian network.
Table 4.9: Emirates’ Multiplier Impact at 10 Airports, 2010–11 (million US$)
City Values (million US$)
Delhi 88
Mumbai 134
Bengaluru 60
Hyderabad 51
Kochi 44
Ahmedabad 27
Kozhikode 34
Kolkata 33
Chennai 87
Thiruvananthapuram 39
Total 596
Figure 4.3: Emirates’ Multiplier Effect at Hub Airports: 2010–11 (million US$)
DelhiUS$ 88 million
MumbaiUS$ 134 million
7. A regression analysis of direct contribution using passenger and freight traffi c at each airport gives a weight of 5.04 per passenger and 94.96 per thousand tonnes of freight. This analysis is done for 2010–11, to which the multiplier impact cor-responds.

41
Economic Impacts Associated with Emirates Airline Operations in India
Figure 4.4: Emirates’ Multiplier Effect at Non-Hub Airports 2010–11, (million US$)
2010-112009-102008-09
AhmedabadBengaluru Kozhikode KolkataKochiHyderabad Chennai Thiruvanan-
thapuram
11
9
12
5 5
9
16
7
20
15
17
8 8
10
24
10
2324
17
9
12
16
31
15
Mumbai, the business capital of India, received US$ 134 million, the highest share of Emir-ates’ benefi t. Emirates has 5 daily fl ights to Mumbai and operates with higher number of seats compared to other points. Mumbai is also India’s leading international and domestic hub. Thus, Mumbai alone accounts for 22 per cent of the overall benefi ts of US$ 596 million. Mumbai is followed by Delhi with a total income of US$ 88 million and Chennai with a total income of US$ 87 million.
The total output share of six metro cities—Delhi, Mumbai, Chennai, Bengaluru, Hyderabad, and Kolkata—comes to US$ 452 million, which is nearly 76 per cent of the overall multiplier output. The importance of this economic benefi t should be judged in relation to the size of the regional economy and population. Chennai, Bengaluru, and Hyderabad each has less than half of the population of Delhi.8 Yet, the revenue of Chennai (US$ 87 million) is almost as much as that of Delhi (US$ 88 million). This indicates the importance of Emirates’ contribution to non-hub cities. Bengaluru (with US$ 60 million) and Hyderabad (with US$ 51 million), though not amongst major tourist hubs, registered nearly 67 per cent of the multiplier income.
The importance of Emirates’ contribution to India’s regional economies is visible from the fact that even though these regional cities have a small contribution to India’s GDP, Emirates still services them.
Bengaluru’s contribution to national GDP is half that of Delhi while both Chennai and Hy-derabad contribute a little more than one-third that of Delhi. Yet, these are important points of call for Emirates and its service to these cities is a major economic contributor to the regional economies.
The contribution to non-metro cities is also worth emphasising. The total economic impact of Emirates in non-metro cities is US$ 143 million. Thiruvananthapuram, a small city in the southern part of India, has a population base of only 1.7 million. Yet Emirates’ economic im-pact on this city was still quite signifi cant, at US$ 39 million in 2010–11. Similarly, Kochi and Kozhikode each have around 2 million residents, but the income multiplier impact is US$44 million and US$ 34 million, respectively. As these are small cities with relatively limited eco-nomic opportunities compared to Hyderabad, Bengaluru or even Ahmedabad, Emirates’ im-pact represents an important factor in their overall economic growth.
8. Census 2011, Registrar General of India.
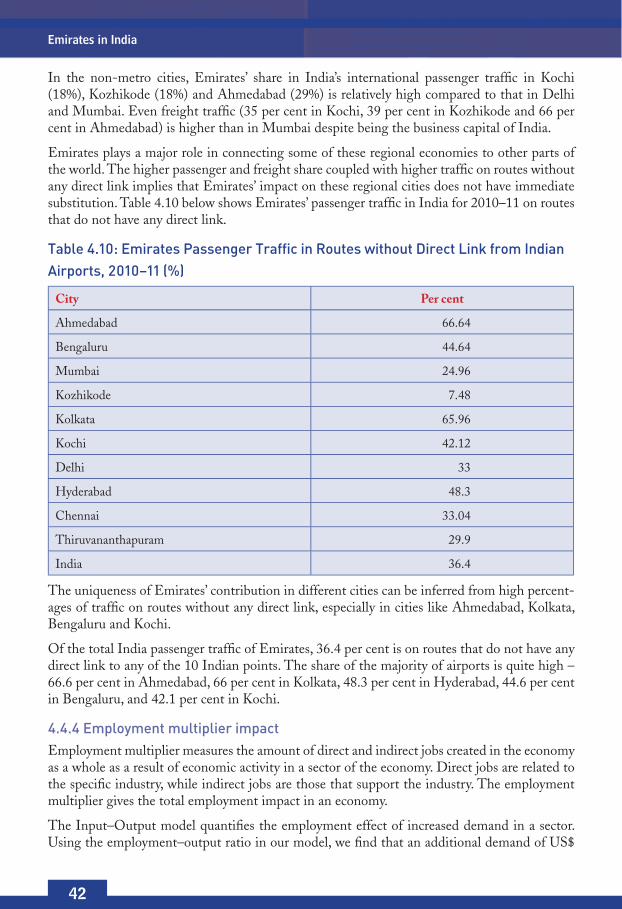
42
Emirates in India
In the non-metro cities, Emirates’ share in India’s international passenger traffi c in Kochi (18%), Kozhikode (18%) and Ahmedabad (29%) is relatively high compared to that in Delhi and Mumbai. Even freight traffi c (35 per cent in Kochi, 39 per cent in Kozhikode and 66 per cent in Ahmedabad) is higher than in Mumbai despite being the business capital of India.
Emirates plays a major role in connecting some of these regional economies to other parts of the world. The higher passenger and freight share coupled with higher traffi c on routes without any direct link implies that Emirates’ impact on these regional cities does not have immediate substitution. Table 4.10 below shows Emirates’ passenger traffi c in India for 2010–11 on routes that do not have any direct link.
Table 4.10: Emirates Passenger Traffic in Routes without Direct Link from Indian Airports, 2010–11 (%)
City Per cent
Ahmedabad 66.64
Bengaluru 44.64
Mumbai 24.96
Kozhikode 7.48
Kolkata 65.96
Kochi 42.12
Delhi 33
Hyderabad 48.3
Chennai 33.04
Thiruvananthapuram 29.9
India 36.4
The uniqueness of Emirates’ contribution in different cities can be inferred from high percent-ages of traffi c on routes without any direct link, especially in cities like Ahmedabad, Kolkata, Bengaluru and Kochi.
Of the total India passenger traffi c of Emirates, 36.4 per cent is on routes that do not have any direct link to any of the 10 Indian points. The share of the majority of airports is quite high – 66.6 per cent in Ahmedabad, 66 per cent in Kolkata, 48.3 per cent in Hyderabad, 44.6 per cent in Bengaluru, and 42.1 per cent in Kochi.
4.4.4 Employment multiplier impactEmployment multiplier measures the amount of direct and indirect jobs created in the economy as a whole as a result of economic activity in a sector of the economy. Direct jobs are related to the specifi c industry, while indirect jobs are those that support the industry. The employment multiplier gives the total employment impact in an economy.
The Input–Output model quantifi es the employment effect of increased demand in a sector. Using the employment–output ratio in our model, we fi nd that an additional demand of US$

43
Economic Impacts Associated with Emirates Airline Operations in India
1 million in the Indian civil aviation sector generates 264 jobs in the whole economy. Emirates’ operation in India supports 72,323 jobs through its demand for services required for its opera-tion and through the multiplier effect on other sectors. Of the total jobs created by Emirates’ operations, nearly 60,000 jobs are in the supporting sectors. This highlights the importance of Emirates’ activities in India and the role the airline plays in creating aggregate demand in vari-ous other industries.
Emirates’ employment impact in India: 72,323 jobs
9,304 jobs as direct employment impact
63,019 jobs as indirect employment impact
Figure 4.5 below presents the distribution of employment impact in various sectors.
Figure 4.5: Sector-wise distribution of employment impact (%)
Air Transport
13%
Petroleum & Chemicals
4%
Manufacturing
14%
Trade, Banking & Insurance
17%
Rest of the economy
52%
There are 9,304 jobs generated in the air transport sector through Emirates’ direct impact. This is nearly 13 per cent of the overall jobs created by Emirates. However, unlike the output impact distribution where air transport absorbed the largest share (46%) of income, employment is widely distributed among air transport, manufacturing and trade, and banking and insurance sectors. The employment impact resulted in 10,133 jobs in manufacturing, which is 14 per cent of the overall impact; 12,330 jobs in trade, banking and insurance sector, which is 17 per cent of the overall jobs creation and 2,658 jobs in petroleum and chemicals sector. It is important to note that more jobs have been created by Emirates’ activities in the miscellaneous sectors of the Indian economy. Of the total jobs, nearly 52 per cent were scattered in sectors other than air transport, manufacturing, petroleum and chemicals and trade, and banking and insurance sectors. This group termed ‘rest of the economy’ in Figure 4.5 includes 118 sectors throughout the Indian economy.
4.5 Induced Effect on Tourism in IndiaForeign tourist arrivals are a major source of foreign exchange earnings for any country. In the past few years, foreign tourist arrivals have seen an uptrend in India.
This study estimates Emirates’ contribution in the Indian tourism sector using 2009 data from these sources:

44
Emirates in India
Airport Authority of India on passenger arrivals from different countries, by different airlines, and percentage of tourists
Ministry of Tourism on foreign exchange earnings from foreign tourists
In 2009, 529,928 foreign tourists arrived in India by Emirates, 27.71 per cent of Emirates’ in-bound passengers in India (Table 4.11).
Table 4.11: Emirates’ Contribution to India’s Tourism Sector, 2009
Number of foreign tourist arrival by Emirates
Share of Emirates› in-bound traffi c (%)
Total Foreign Exchange Earnings (FEE) from tourist arrived by Emir-
ates (US$ million)
529,928 27.71 1,153.72
Source: FEE data / calculation.
The foreign exchange earnings from tourists fl ying through Emirates were US$1.15 billion in 2009. This amounted to 10 per cent of the total foreign exchange earnings for India in 2009.
Emirates’ network has a catalytic effect on the Indian tourism industry as it connects India to a wider set of countries. Emirates carries passengers between India, the UAE, and 16 other MENA countries as well as connects 50 countries outside the MENA region with Indian points.
The following is the distribution of Emirates’ traffi c to 50 non-MENA countries:
UK – 26 per cent
USA – 27 per cent
Germany – 7 per cent
South Africa – 5 per cent
Italy – 4 per cent
France – 3 per cent
Nigeria and Switzerland – 3 per cent each
The Netherlands – 2 per cent
Other 41 countries – 19 per cent (less than 1 per cent each)

45
Economic Impacts Associated with Emirates Airline Operations in India
Figure 4.6: Emirates’ Traffic: India to 50 Countries Outside MENA (%) (2.0 million PAX)
USA
27%
UK
26%
Germany
7%
South Africa
5%
Italy
4%
France
3%
Other 41 Countries
19%
Switzerland
3%
The Netherlands
2%
Nigeria
3%
Figure 4.6 shows that nine countries account for 81 per cent of Emirates’ India traffi c for these countries. However, within these nine major countries Emirates’ passenger traffi c is distributed between hub and non-hub airports. Table 4.12 shows the percentage of Emirates’ passenger traffi c from hub and secondary airports in these countries.
Table 4.12: Emirates’ Passenger Traffic to Nine Major Countries Outside MENA (2011-12)
Country Number of airports served
Passengers (%)
Hub airport (s) Non-hub airport (s)
USA 6 34 66
UK 6 52 48
Germany 4 59 41
South Africa 3 65 35
Italy 3 43 57
France 2 86 14
Nigeria 1 100 0
Switzerland 2 82 18
The Netherlands 1 100 0
For four out of these nine countries, over 40 per cent of Emirates’ passenger traffi c is derived from regional and secondary airports. Over 55 per cent of Emirates’ passenger traffi c to and from USA and Italy connects from regional and secondary airports.
In sum, Emirates’ global network provides greater connectivity with all the important airports in India. It connects major Indian hubs as well as non-hub points to a vast number of countries. This fl ow of passengers at smaller airports like Kozhikode, Thiruvananthapuram and Kochi is

46
Emirates in India
particularly important for providing economic benefi ts to small cities and holds great potential in increasing aviation activities and tourism in the future.Table 4.13 shows the number of tour-ists carried by Emirates from major source countries.
Table 4.13: Tourist arrivals by Emirates from Major Countries, 2009
Country Number of foreign tourists
Australia 11,233
Austria 4461
Bahrain 18,081
Canada 5426
Egypt 4213
France 22,168
Germany 44,972
Greece 2931
Iran 3876
Italy 34,360
Kenya 9948
Mauritius 6894
Netherlands 2230
Yemen 2162
Russia 9156
Saudi Arabia 49,049
South Africa 32,508
Switzerland 20,335
Tanzania 5197
Turkey 4866
United Kingdom 146,408
United States 85,249
India received 5.1 million foreign tourists in 2009. Twenty countries contributed more than a 1 per cent share each in foreign tourist arrivals in India. Emirates’ operation collects tourists from 19 out of these 20 countries. The relevance of Emirates’ operation can be gauged from the fact that it brings tourists from those countries that are often not considered to be among major contributors to the Indian tourism sector, such as Tanzania, Turkey, Kenya, Yemen, Bahrain, Egypt, Mauritius, Saudi Arabia, and South Africa. Emirates’ share in overall tourist arrivals from these countries is very high – 67 per cent for Egypt, 41 per cent for Kenya, 38 per cent for Mauritius, 45 per cent for Turkey and 32 per cent for Tanzania. Thus, apart from carrying passengers from prominent tourist source countries for India, Emirates contributes to India’s tourism industry by stimulating demand from non-major source countries. This clearly opens up the Indian tourism industry to new countries.
47
Economic Impacts Associated with Emirates Airline Operations in India
4.6 Other BenefitsEmirates brings other benefi ts to the Indian economy although some of them are not directly measurable by our Input–Output methodology. Their potential benefi ts can be substantial for an economy, however and some are listed below.
Emirates facilitates the fl ow of capital into the Indian economy. It is well recognised in eco-nomic literature that the availability of faster transportation affects investment decisions and fl ow of FDI (foreign direct investment). Emirates connects India to its major investor coun-tries, thus facilitating the fl ow of investment to India. In 2010–11 India’s FDI infl ow was US$ 27 billion. Major investor countries in the year were Mauritius, USA, UK, UAE, Netherlands, Germany and France. The cumulative FDI infl ow to India from UAE during 2000–2011 was US$ 1.9 billion. After the 2008 fi nancial crisis, the FDI infl ow into India from MENA coun-tries increased.
Emirates’ service in India potentially has a benefi cial effect on India’s foreign trade. The airline connects India not only to major trading partners like UAE, EU and USA, but also to poten-tial trading partners of the future. Emirates’ freight traffi c in India accounts for 14 per cent of India’s total international freight traffi c. The strong economic ties between UAE and India benefi ted from Emirates service in India. India’s exports to UAE in 2010–11 were US$ 34.3 billion. Exports to UAE increased by 43 per cent from that of the previous year. In effect, the total UAE trade with India, which amounted to US$ 67.1 billion in 2010–11, has placed UAE as the largest trading partner for the third year in a row, ahead of China and the US. India’s trade relations with MENA countries have been on the rise in recent years. In 2010–11, India’s exports to 16 MENA countries, connected by Emirates, were US$ 52.2 billion. This shows a 43 per cent increase from previous year.
India’s trade volumes to African countries have increased and are forecast to continue growing over time. India’s export to African countries in 2010–11 was US$ 16.3 billion, an increase of 58 per cent from the previous year. This shows how Emirates facilitates the opening up of new markets in the African continent for Indian exporters.
Dubai is a major employment destination for Indians and Emirates itself has employed 11,603 Indian nationals. India received a total of US$ 55 billion in 2010 as remittances from Indians working overseas. This constitutes 3.6 per cent of India’s GDP. World Bank ranks India as the largest receiver country of remittances. The recent increase in remittances to India is due to the increased transfer from Gulf countries. In 2010, remittance from UAE was US$ 10.5 billion and UAE represents the largest source of remittances to India. About 30 per cent of UAE’s population is Indian. Indians constitute 42.5 per cent of its labour force. Around 1.2 million Indians reside in Dubai and the Northern Emirates.

48
Emirates in India

49
5. Expansion of Emirates’ Operations in India
This Chapter forecasts Emirates’ impact on the Indian economy if the seats allocated to it un-der the bilateral agreement are increased. Emirates currently has operations to 10 airports across India and has the rights to fl y 54,200 seats per week to and from India. If the seats allocated to Emirates are increased then the corresponding benefi ts to the economy and tourism sector will also increase.
We consider three scenarios, the increase of the seat allocation from the present 54,200 per week to 60,000, 70,000 and 80,000 seats per week, respectively. The aim is to assess the varied impact on the output, employment and tourism benefi ts in all three conditions using forecasts from the Input–Output model that has already been explained in Chapter 4.
5.1 Scenario 1: 60,000 Seats per WeekTable 5.1 presents the output, employment multiplier, and tourism impact of Emirates’ opera-tion with 60,000 seats per week.
Table 5.1: Scenario 1: Emirates with 60,000 Seats per Week
60000 seats per week
Number of passengers (million/year) 5.03
Output multiplier impact
Total (US$ million) 644
Direct 296
Indirect 348
Employment multiplier impact
Total (number of jobs) 78,227
Direct 10,063
Indirect 68,163
Tourism impact
Number of tourists/year 641,260
Foreign Exchange Earnings (US$ million) 1,485
A weekly allocation of 60,000 seats to Emirates would result in their carrying 5.03 million pas-sengers to and from India every year. The total economic benefi ts accrued to the economy as
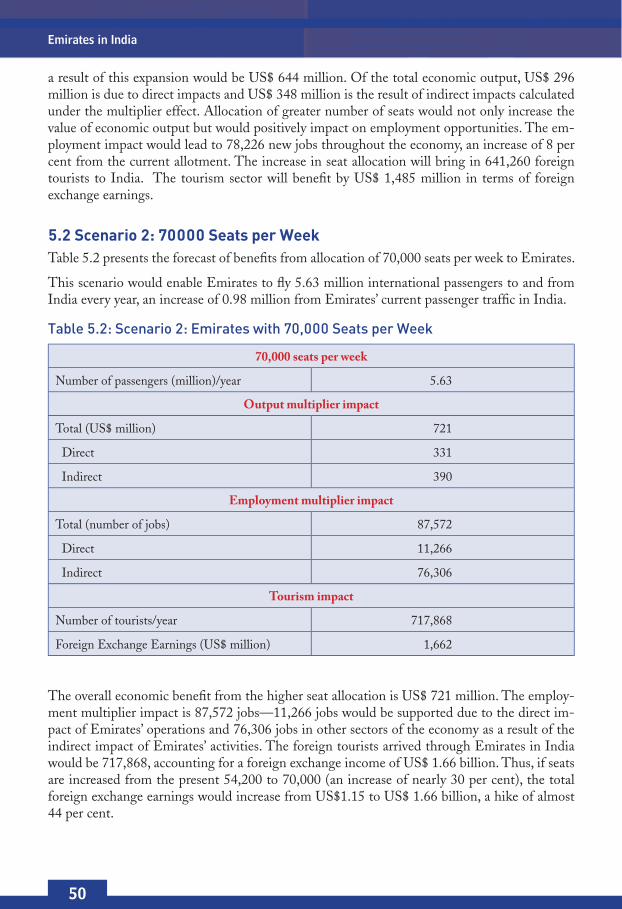
50
Emirates in India
a result of this expansion would be US$ 644 million. Of the total economic output, US$ 296 million is due to direct impacts and US$ 348 million is the result of indirect impacts calculated under the multiplier effect. Allocation of greater number of seats would not only increase the value of economic output but would positively impact on employment opportunities. The em-ployment impact would lead to 78,226 new jobs throughout the economy, an increase of 8 per cent from the current allotment. The increase in seat allocation will bring in 641,260 foreign tourists to India. The tourism sector will benefi t by US$ 1,485 million in terms of foreign exchange earnings.
5.2 Scenario 2: 70000 Seats per WeekTable 5.2 presents the forecast of benefi ts from allocation of 70,000 seats per week to Emirates.
This scenario would enable Emirates to fl y 5.63 million international passengers to and from India every year, an increase of 0.98 million from Emirates’ current passenger traffi c in India.
Table 5.2: Scenario 2: Emirates with 70,000 Seats per Week
70,000 seats per week
Number of passengers (million)/year 5.63
Output multiplier impact
Total (US$ million) 721
Direct 331
Indirect 390
Employment multiplier impact
Total (number of jobs) 87,572
Direct 11,266
Indirect 76,306
Tourism impact
Number of tourists/year 717,868
Foreign Exchange Earnings (US$ million) 1,662
The overall economic benefi t from the higher seat allocation is US$ 721 million. The employ-ment multiplier impact is 87,572 jobs—11,266 jobs would be supported due to the direct im-pact of Emirates’ operations and 76,306 jobs in other sectors of the economy as a result of the indirect impact of Emirates’ activities. The foreign tourists arrived through Emirates in India would be 717,868, accounting for a foreign exchange income of US$ 1.66 billion. Thus, if seats are increased from the present 54,200 to 70,000 (an increase of nearly 30 per cent), the total foreign exchange earnings would increase from US$1.15 to US$ 1.66 billion, a hike of almost 44 per cent.

51
Expansion of Emirates’ Operations in India
5.3 Scenario 3: 80,000 Seats per WeekTable 5.3 presents the benefi ts of an even higher seat allocation, 80,000 seats per week, to Emirates in India. A higher seat allocation to Emirates would provide a tremendous boost to the air traffi c and tourism activities in India. It would lead to annual infl ows and outfl ows of 6.16 million international passengers by Emirates.
Table 5.3: Scenario 3: Emirates with 80,000 Seats per Week
80,000 seats per week
Number of passengers (million)/year 6.16
Output multiplier impact
Total (US$ million) 790
Direct 363
Indirect 427
Employment multiplier impact
Total (number of jobs) 95,862
Direct 12,332
Indirect 83,530
Tourism impact
Number of tourists/year 785,828
Foreign Exchange Earnings (US$ million) 1,819
If Emirates was granted 80,000 seats per week, the total economic benefi t for the overall econ-omy would be US$ 790 million. Of this, US$363 million is the direct impact and US$ 427 million is the indirect income generated by the Indian economy. This higher seat allocation would also help generate 95,862 jobs, an increase of 32.5 per cent from the current allotment. The tourism industry would tremendously benefi t with 785,828 foreign tourist arrivals and an impressive gain of US$ 1,819 million as foreign exchange earnings, an increase of 57 per cent.
5.4 Sector-Wise Distribution of Benefits from Higher Seat AllocationsThe sector-wise distribution of output multiplier impact and employment multiplier impact at different seat allocations is presented in Table 5.4 below.
The increase in allocation from 54,200 to 80,000 seats per week would increase Emirates’ contribution in the Indian air transport sector from US$ 274 million to US$ 363 million. The multiplier impact would increase from US$ 596 million to US$ 790 million.
The employment impact for the same expansion would lead to 12,345 jobs in the Indian air transport sector. The multiplier impact implies that total employments would increase from the present 72,323 to 95,862 jobs.

52
Emirates in India
Table 5.4: Output and Employment Multiplier Impacts
54,200 seats (present)
60,000 seats
70,000 seats
80,000 seats
Output multiplier impact (US$ million) 596 644 721 790
Air transport 274 296 332 363
Petroleum & Chemicals 76 83 92 101
Manufacturing 62 67 75 82
Trade, Banking & Insurance 39 42 47 51
Rest of the economy 145 157 176 192
Employment multiplier impact (number of jobs)
72,323 78,227 87,572 95,862
Air transport 9313 10,074 11,277 12,345
Petroleum & Chemicals 2658 2875 3219 3523
Manufacturing 10,133 10,960 12,269 13,431
Trade, Banking & Insurance 12,330 13,336 14,930 16,343
Rest of the economy 37,889 40,982 45,878 50,221
5.5 Benefit from Emirates’ Operation to Additional PointsEmirates’ operation to additional airports would benefi t the overall Indian economy as well as the towns/cities linked to the connecting points. We estimate the impact of Emirates’ operation to four additional points—Amritsar, Pune, Mangalore and Tiruchirapally. We use regression analysis to estimate direct contribution based on socioeconomic indicators of regional points like population, education, GDP (industry and service). Indirect contribution is calculated us-ing multiplier from Input–Output model. Table 5.5 provides the direct benefi t from Emirates’ operation to additional points:
Table 5.5: Direct Impact from Expansion to Four Additional Points (US$ million)
Direct impact from expansion to 4 additional points (US$ million)
Amritsar Pune Mangalore Tiruchirapally Total
15 13 8 13 49
Emirates’ direct contribution would provide an impetus to the economic growth of these small cities. Amritsar, Mangalore and Tiruchirapally are cities with a population of less than three million. The marginal benefi t from Emirates’ contribution to these cities would be much higher than that to India’s larger cities.
Operations to these four points would bring in an additional US $49 million to the Indian Economy. We estimate that this expansion would further benefi t wider economy by an output of US$ 106 million and generation of 13,011 jobs.

53
Expansion of Emirates’ Operations in India
Table 5.6 shows the distribution of output and employment multiplier impacts across different sectors of the economy. Out of the total output multiplier impact due to the expansion to four additional points of call, an income of US$ 49 million is generated in air transport sector. The income effect on petroleum and chemicals; manufacturing; and trade, banking, and insurance sectors are US$ 14 million, US$ 11 million, and US$ 7 million, respectively. A total income of US$26 million is generated in the rest of the economy.
Table 5.6: Output and Employment Multiplier Impacts at the Four Additional Points
Impact Air trans-port
Petroleum and chemi-
cals
Manufac-turing
Trade, banking
and insur-ance
Rest of the economy
Total
Output multi-plier impact (million US$)
49 14 11 7 26 106
Employ-ment multi-plier impact (number of jobs)
1676 478 1823 2218 6816 13,011
In sum, a total of 1676 jobs would be created in the air transport sector. The number of jobs sup-ported by the expansion of Emirates’ operation to four additional points for the petroleum and chemicals, manufacturing and trade, banking and insurance sectors are 478, 1823 and 2218, re-spectively. The rest of economy would be benefi ted and a further 8816 jobs would also be created in other sectors.
5.6 ConclusionThe NCAER report observed that Emirates makes an important contribution to the Indian air transport sector in terms of passenger and freight traffi c, connectivity and coverage to points not directly served by other carriers. The airline’s economic contribution to the air transport sector mag-nifi es to the wider economy through multiplier effect. The benefi t to non-hub points appears to be signifi cant in regional economies. Income, employment and tourism impact highlights the potential of Emirates’ contribution to regional economic development.
The study predicts further economic benefi t for Indian economy in scenarios of Emirates’ expan-sion in India. They are quantifi ed as direct economic contribution, multiplier effect on output and employment, induced effect on tourism. Apart from quantifi ed benefi ts from Emirates’ Operations in India, the identifi ed qualitative benefi ts highlight the need for an expansion of air transportation capacities in India.

54
Emirates in India

55
Appendix
An Input–Output table is a systematic description of the interdependence among different sectors of an economy. It shows the flow of goods and services from one sector of the economy to other sectors over a period of time—usually a year. For producing the output of any sector of the economy, different types of raw material inputs and capital equipment along with labour are required. The output produced may be utilised both for intermediate and final use. A part of the total output by each sector of the economy goes to other sectors as they use it as inputs into their production process. The rest goes to the final consumers.
In the Input–Output table the economy is divided into a number of homogenous sectors, each of which is represented by a row and a column in the Input–Output table. The row correspond-ing to a sector gives the use pattern of total output of the sector. And the column gives details
of inputs absorbed by the sector. The entry into the cell of the i th row and j th column is the
quantity of output of sector i consumed as input by sector j and is generally denoted by ijX .
The output of sector j is denoted by jX (Table A1).
Table A1: Input–Output Table
Producing sectors
Consuming Sectors Final demand
Output
1 2 . . . n
111X 12X
. . .nX1 1F 1X
221X 21X
nX 2 2F 2X
. . . . . .
. . . . . .
. . . . . .
n1nX 2nX
. . .nnX nF nX
(Contd.)

56
Emirates in India
Table A1: (Contd...)
Primary inputs
11V 12V. . .
nV1 11 +nV
21V 22V. . .
nV2 12 +nV. . . .
1kV 2kV. . .
knV 1+knV
Output1X 2X
. . .nX
Table A1 shows the supply and absorption patterns of a sector by row and column, respectively.
jF denotes the final demand for the output of sector j . and jV stands for k different primary
inputs used by sector j . Primary inputs consist of factor payments to labour and capital, indi-rect taxes, non-competing imports, depreciation, and so on.
The Input–Output model, a set of simultaneous equations, provides a link between final de-mands and the output level of different sectors. Formal structure of the model can be written as
∑ =+=j
iiji niFXX ,..,2,1 ..... (1)
Equation (1) means that the output of any sector is equal to the total of the output consumed
by different sectors (∑i
ijX ) and the final demand ( iF ). Assuming Leontief type production function (fixed proportion inputs), intermediate input requirements can be written as
jijij XaX = (2)
where ija is the requirement of the output of sector i used as input for a unit level production of
sector j . Now the input-output model becomes
∑ +=j
ijiji FXaX (3)
In matrix notation the model is written as
FXAI =− )( (4)
where A is a nn× matrix of coefficients, X the vector of outputs, F the vectors of final de-
mand and I an identity matrix.

57
Appendix
Solving the system of equations gives
RFFAIX
=−= −
)( 1
(5)
The matrix R is known as the Leontief inverse or the matrix multiplier. A cell in R , say ijr, gives the amount of output of sector i required directly and indirectly to produce one unit of
final demand for sector j .
The summation,∑j
ijr , represents the amount of output required directly and indirectly from
different sectors to produce one unit final demand for sector j . When the model is expressed in value terms, this amount represents the multiplier impact of the sector on the whole economy.
Input–Output Transaction Table of India is maintained by the Central Statistical Organisation (CSO) of the Ministry of Statistics and Programme Implementation. The table is periodically updated by the organisation. The latest table corresponds to the year 2006–07. The table con-sists of absorption and supply pattern of 130 sectors of Indian economy. In the present study, Input–Output is aggregated to a table of 33×33 sectors for the sake of computational tractabil-ity. The selection of 33 sectors is determined by input patterns of the air transport sector, i.e. sectors that supply a significant portion of input to air transport sector are retained and the rest are aggregated to create a broader group of sectors. Table A2 presents the mapping of the aggregation from 130×130 sectors table of the Indian Input–Output model to 33×33 sectors model used in this study.
Table A2: Mapping of Sectors from 130×130 to 33×33 Table
Sl. No.
Broad sectors Sectors included (Sl. No. from Input–Output table
of India, 130×130)
Number of sectors in-cluded
1. Agriculture 1–26 26
2. Mining and Quarrying 27–37 11
3. Food Beverage and Tobacco 38–45 8
4. Textiles and RMG 46–54 9
5. Wood and Wood Products, Fur-niture and Fixtures
55–56 2
6. Paper and Paper Products 57 1
7. Printing and Publishing 58 1
8. Leather and Plastic, and their Products
59–62 4
9. Petroleum Products 63 1
10. Paints, Varnishes, Lacquers 69 1
11. Other Chemicals 64–68, 70–73 9
(Contd.)

58
Emirates in India
Table A2: (Contd...)
12. Non-Metallic Mineral Products 74–76 3
13. Basic Metal and Metal Products 77–82 6
14. Non-Electrical Machinery and Parts
83–87 5
15. Electrical Machinery 88–94 7
16. Transport Equipment and Parts 95–100 6
17. Other Miscellaneous Manufac-turing
101–105 5
18. Construction 106 1
19. Electricity 107 1
20. Water 108 1
21. Railway 109 1
22. Land Transport 110 1
23. Water Transport 111 1
24. Air Transport 112 1
25. Supporting and Auxiliary Trans-port Activities
113 1
26. Storage and Warehousing 114 1
27. Communication 115 1
28. Trade 116 1
29. Hotels and Restaurants 117 1
30. Banking 118 1
31. Insurance 119 1
32. Computer Related 124 1
33. Rest of the Services 120–123, 125–130 10
The Input–Output table is also used to quantify the employment multiplier. This involves calculat-ing the employment–output ratio for different sectors using National Sample Survey Organisation’s labour input data. They are numbers of jobs comprising workers with Usual Status, Principal Status, and Subsidiary Status and workers with multiple jobs.
Limitations of the Input–Output MethodologyThough the Input–Output model is at the forefront of methodologies to identify wider economic benefits of an economic activity in a sector, it has some limitations.
l It assumes constant returns to scale in the production process.
l In India, the Input–Output table is periodically updated. Hence, the table available at a point in time may represent a technological landscape slightly different from the prevail-ing one.