Crop modelling applications in climatic risk...
24
Crop modelling applications in climatic risk management Pramod Aggarwal CGIAR Research Program on Climate Change, Agriculture and Food Security, International Water Management Institute
-
Upload
truongkhuong -
Category
Documents
-
view
216 -
download
1
Transcript of Crop modelling applications in climatic risk...

Crop modelling applications in climatic risk management
Pramod Aggarwal
CGIAR Research Program on Climate Change, Agriculture and Food Security,International Water Management Institute
Weather derivatives based insurance
1. Yield loss due to weather deviation (vulnerability)
2. Probability of weather deviation (frequency)
3. Weather risk = vulnerability * frequency
4. Financial aspects: converting weather risk to payouts and premiums
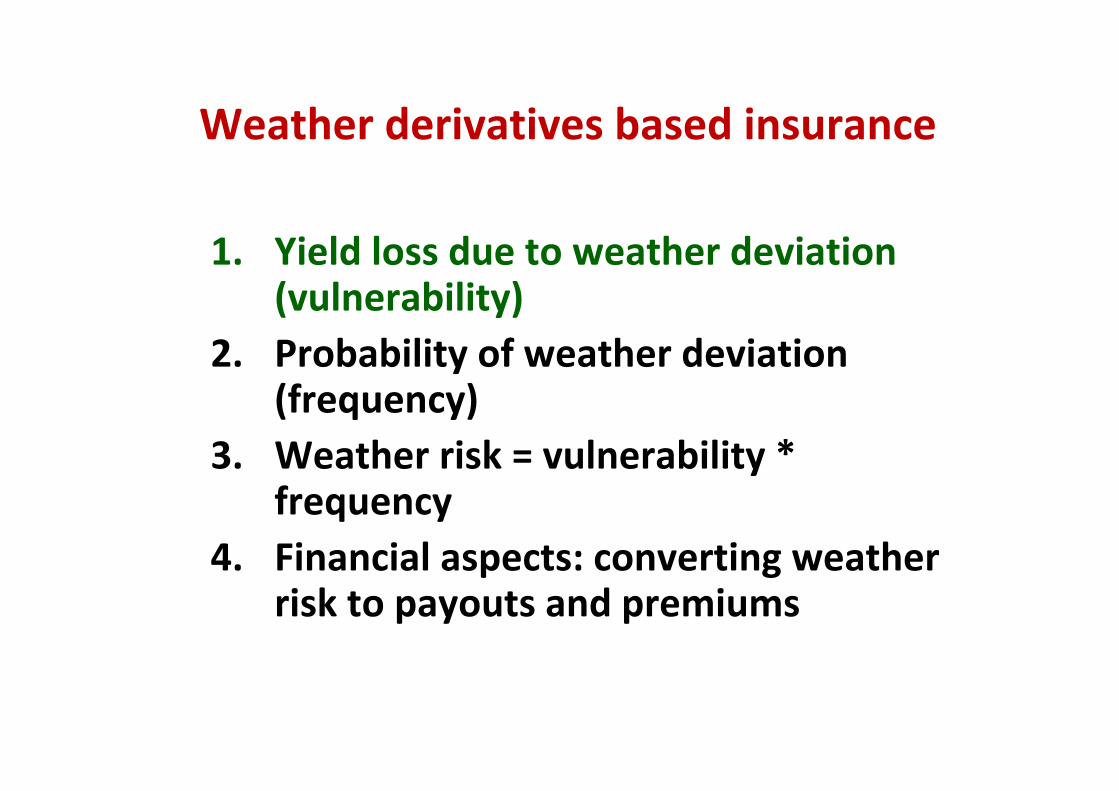
Agronomic inputs
seeds, FYM, irrigation, fertilizers
WeatherRainfall, temperature, frost, solar radiation, wind, vapor pressure
Peststype, population/
severity
Crop growth
and yield
Crop/VarietyPhysiology, phenology,
morphology
ManagementDates of planting,
fertilization, irrigation
Soiltexture, pH,
depth, fertility
Crop-weather relationship:Need to understand all major crop yield regulating factors
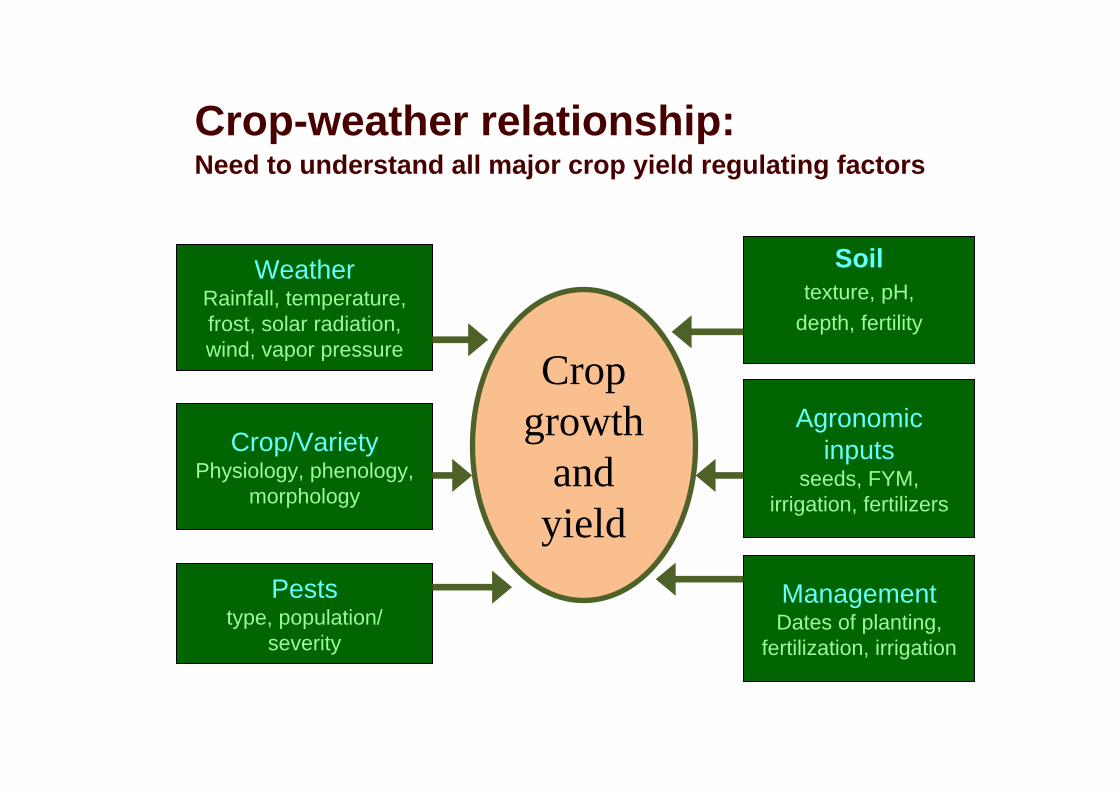
Methods to understanding the impact of weather on crops
–Observations in farmers’ fields– Experiments on research farm–Controlled environment experiments– Statistical relationships–Analogues–Crop growth simulation models
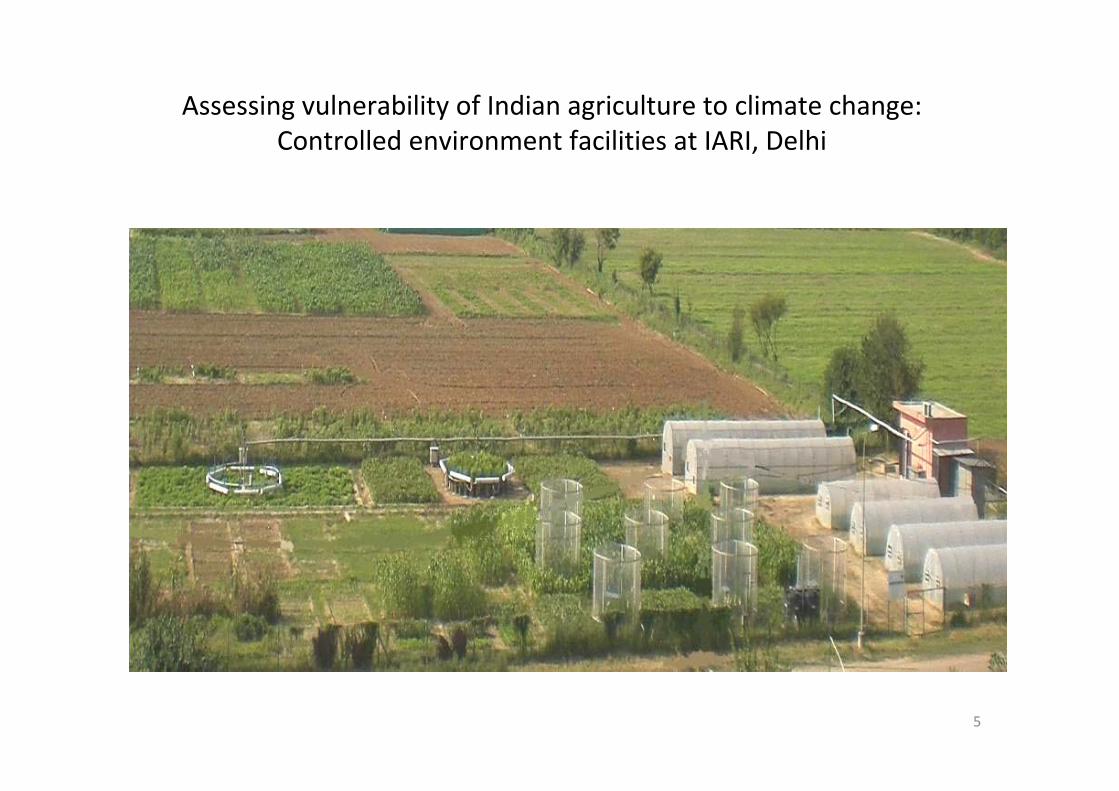
Assessing vulnerability of Indian agriculture to climate change:Controlled environment facilities at IARI, Delhi
5
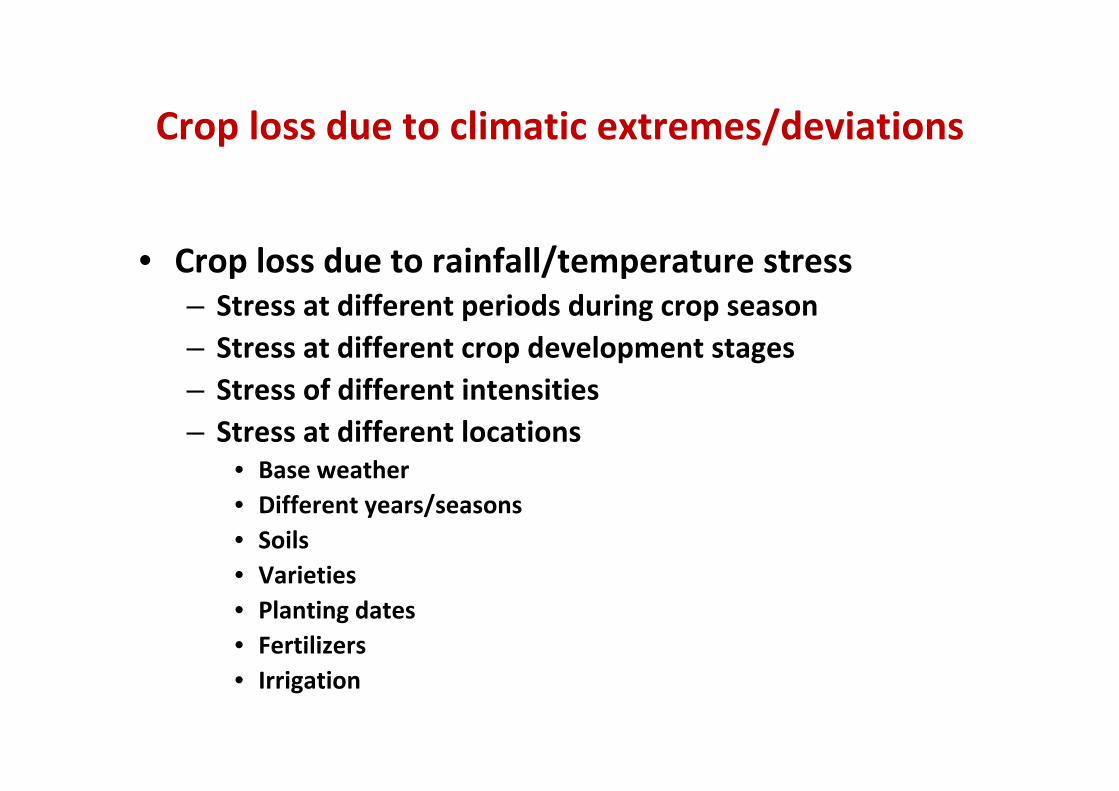
Crop loss due to climatic extremes/deviations
• Crop loss due to rainfall/temperature stress– Stress at different periods during crop season– Stress at different crop development stages– Stress of different intensities– Stress at different locations
• Base weather• Different years/seasons• Soils• Varieties• Planting dates• Fertilizers• Irrigation
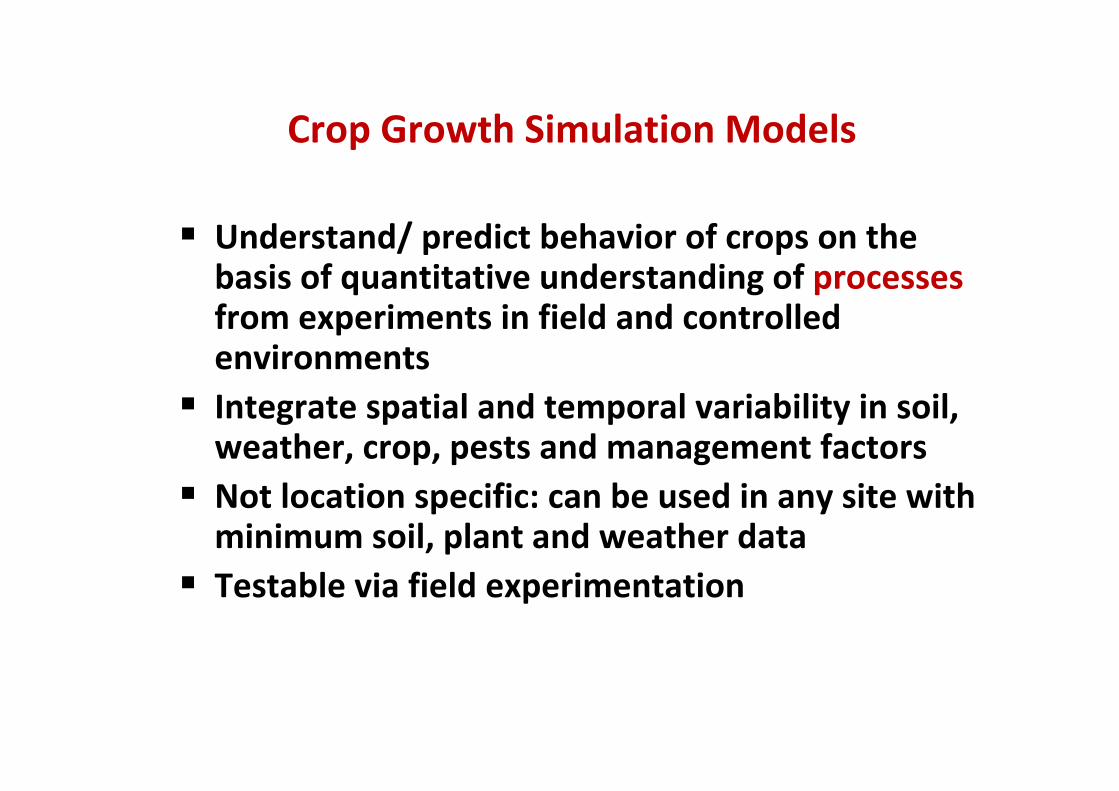
Crop Growth Simulation Models
Understand/ predict behavior of crops on the basis of quantitative understanding of processes from experiments in field and controlled environmentsIntegrate spatial and temporal variability in soil, weather, crop, pests and management factorsNot location specific: can be used in any site with minimum soil, plant and weather dataTestable via field experimentation
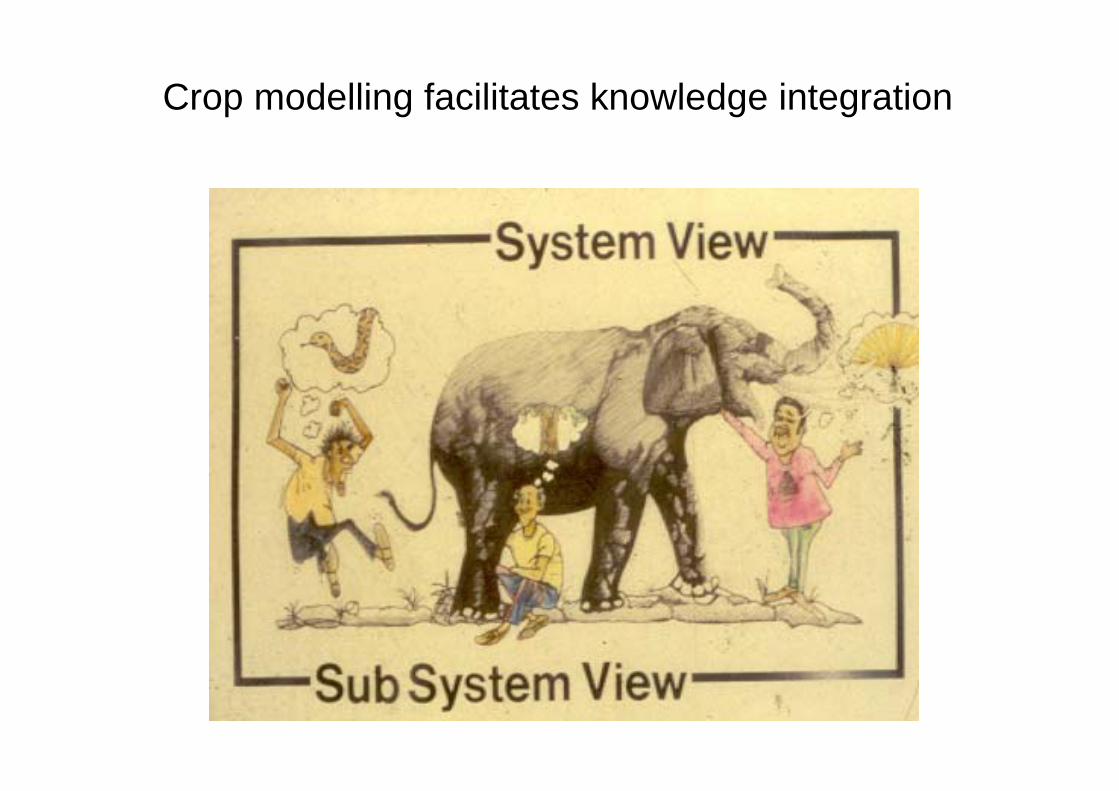
Crop modelling facilitates knowledge integration
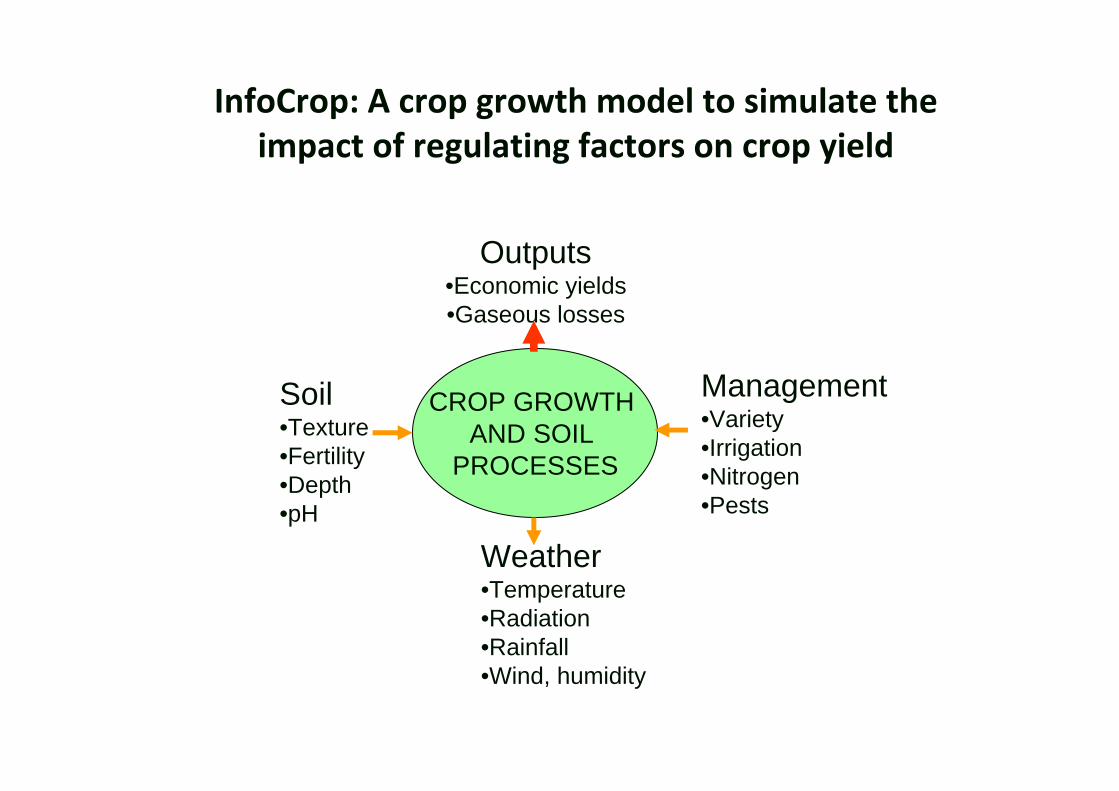
Weather•Temperature•Radiation•Rainfall•Wind, humidity
CROP GROWTH AND SOIL
PROCESSES
Soil•Texture•Fertility•Depth•pH
Management•Variety•Irrigation•Nitrogen•Pests
Outputs•Economic yields•Gaseous losses
InfoCrop: A crop growth model to simulate the impact of regulating factors on crop yield
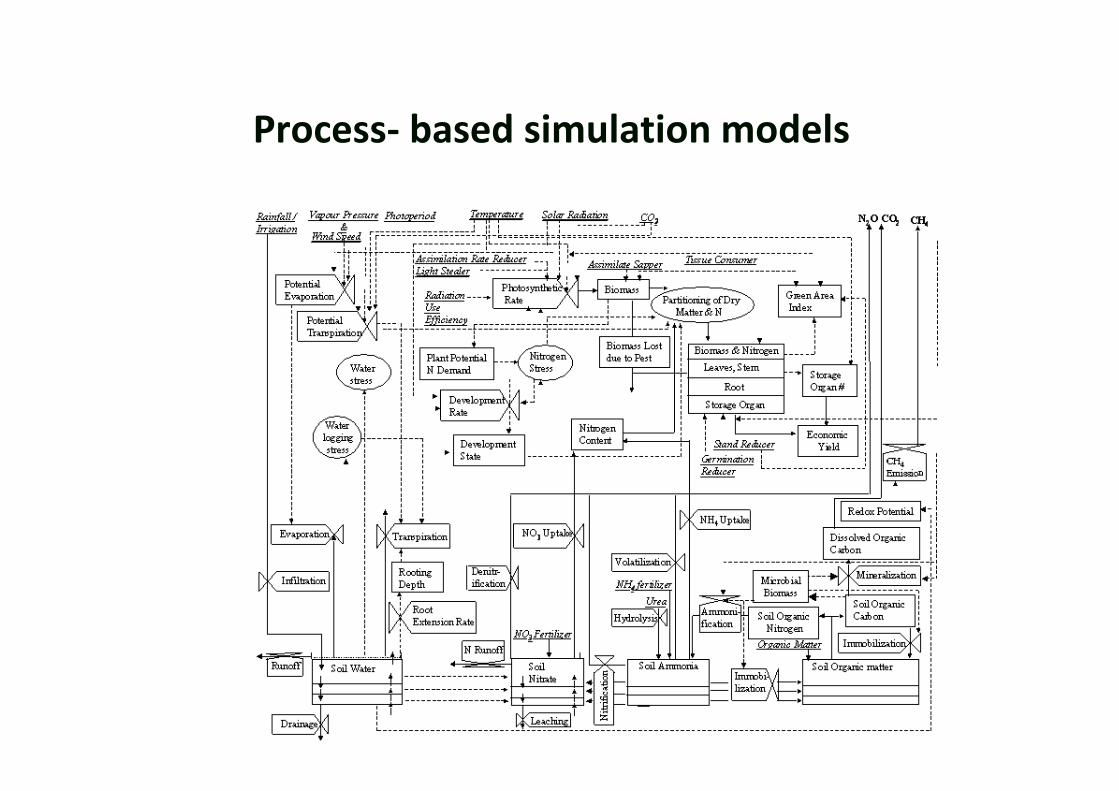
Process‐ based simulation models
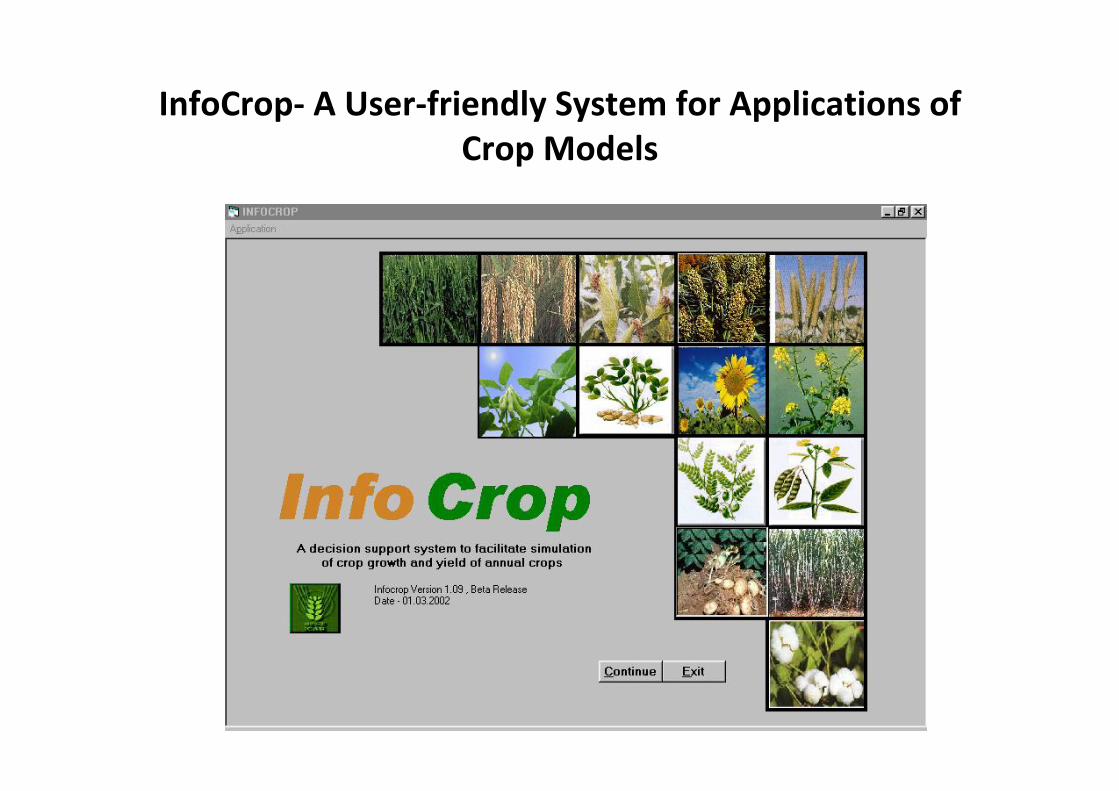
InfoCrop‐ A User‐friendly System for Applications of Crop Models
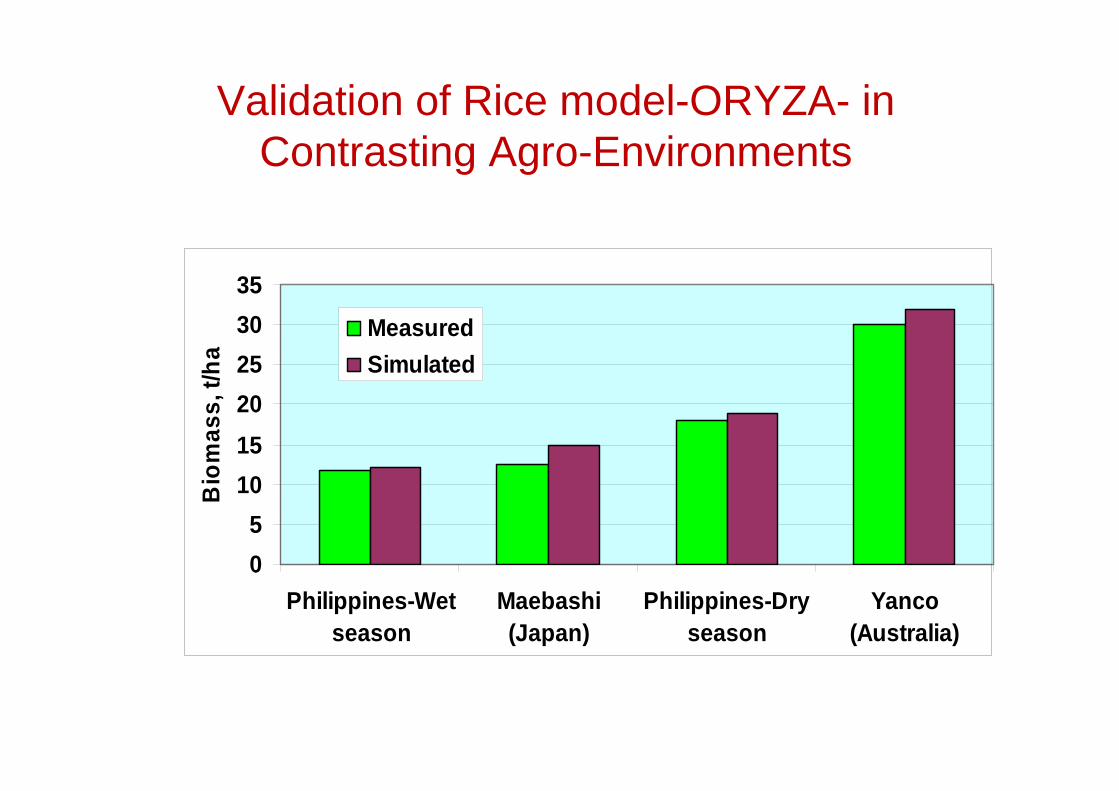
Validation of Rice model-ORYZA- in Contrasting Agro-Environments
05
101520253035
Philippines-Wetseason
Maebashi(Japan)
Philippines-Dryseason
Yanco(Australia)
Bio
mas
s, t/
ha
MeasuredSimulated
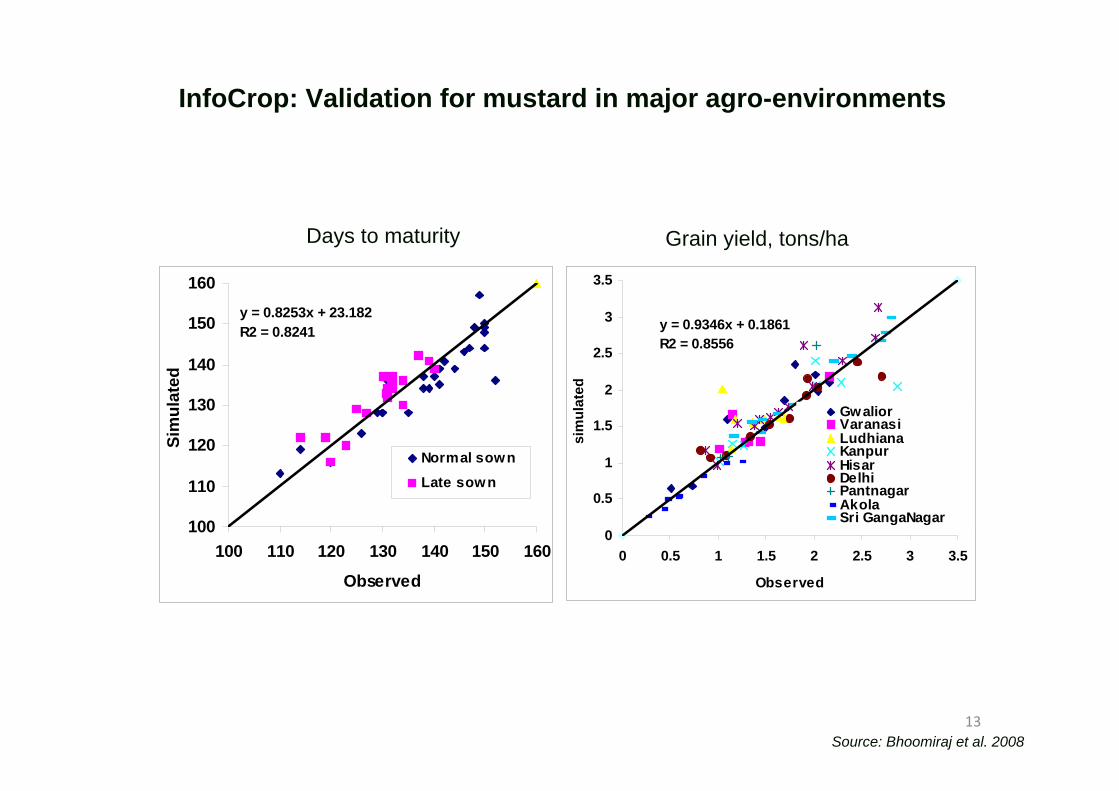
100
110
120
130
140
150
160
100 110 120 130 140 150 160
Observed
Sim
ulat
ed
Normal sownLate sown
y = 0.8253x + 23.182R2 = 0.8241
0
0.5
1
1.5
2
2.5
3
3.5
0 0.5 1 1.5 2 2.5 3 3.5
Observedsi
mul
ated
GwaliorVaranasiLudhianaKanpurHisarDelhiPantnagarAkolaSri GangaNagar
y = 0.9346x + 0.1861R2 = 0.8556
Days to maturity Grain yield, tons/ha
Source: Bhoomiraj et al. 2008
InfoCrop: Validation for mustard in major agro-environments
13
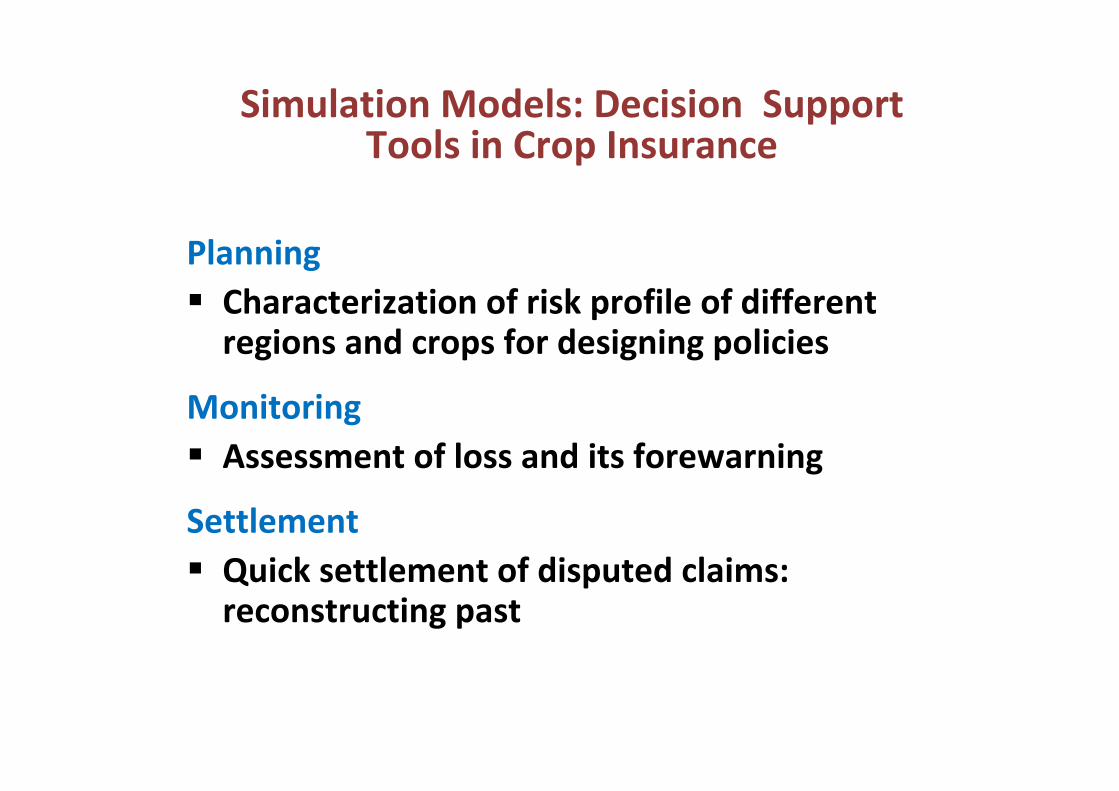
PlanningCharacterization of risk profile of different regions and crops for designing policies
MonitoringAssessment of loss and its forewarning
SettlementQuick settlement of disputed claims: reconstructing past
Simulation Models: Decision Support Tools in Crop Insurance
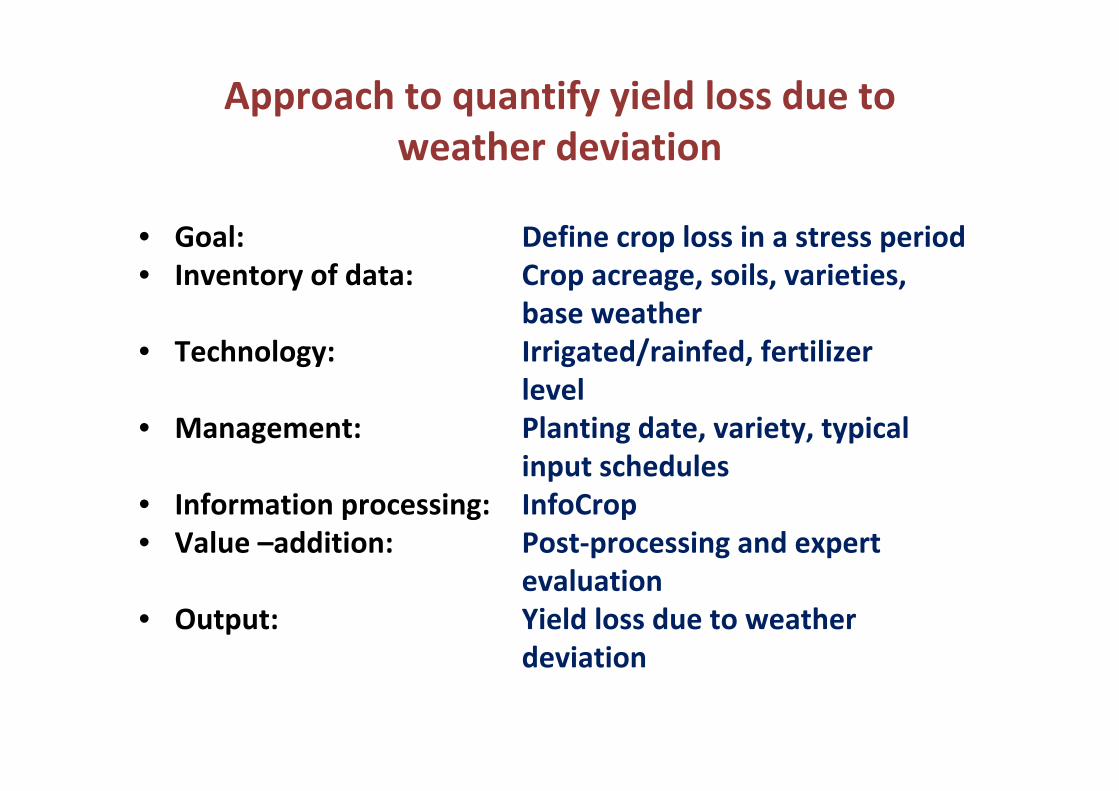
• Goal: Define crop loss in a stress period• Inventory of data: Crop acreage, soils, varieties,
base weather• Technology: Irrigated/rainfed, fertilizer
level• Management: Planting date, variety, typical
input schedules• Information processing: InfoCrop• Value –addition: Post‐processing and expert
evaluation• Output: Yield loss due to weather
deviation
Approach to quantify yield loss due to weather deviation
Indices to characterize temperature stress
• Mean temperature deviation• Cumulative temperature deviation• Canopy temperatures• Plant water stress• Thermal images of canopies• NDVI
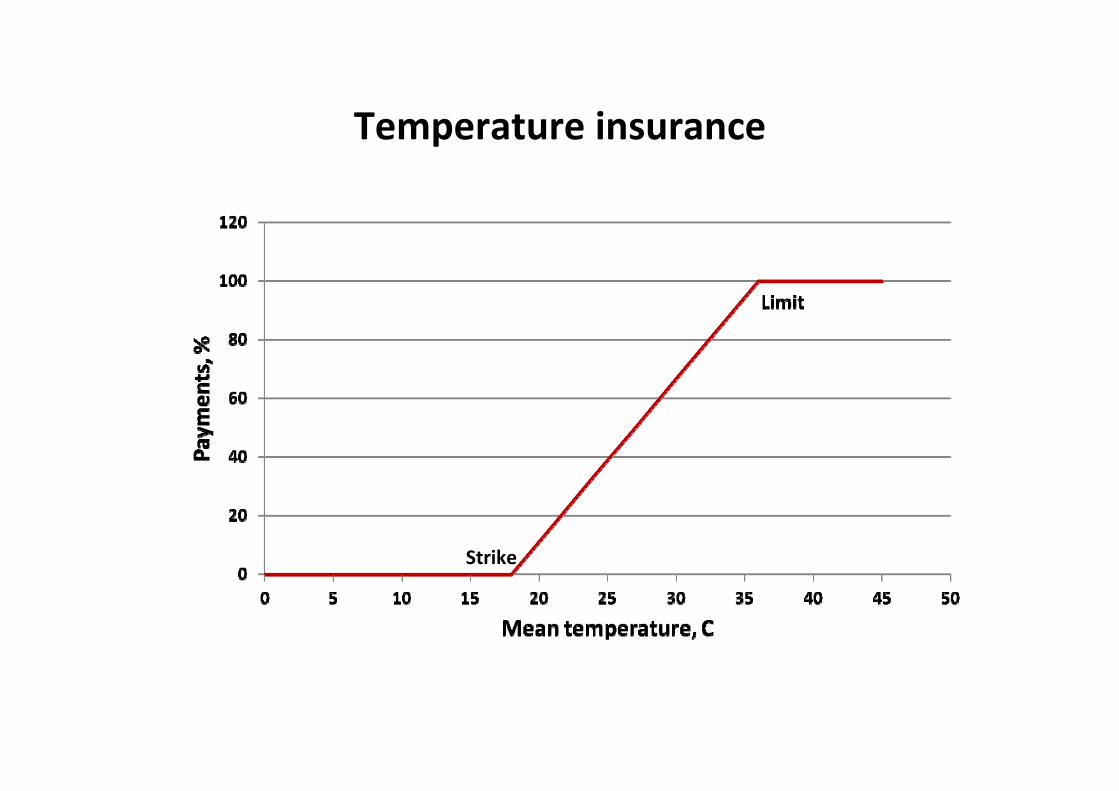
Temperature insurance
Strike
0
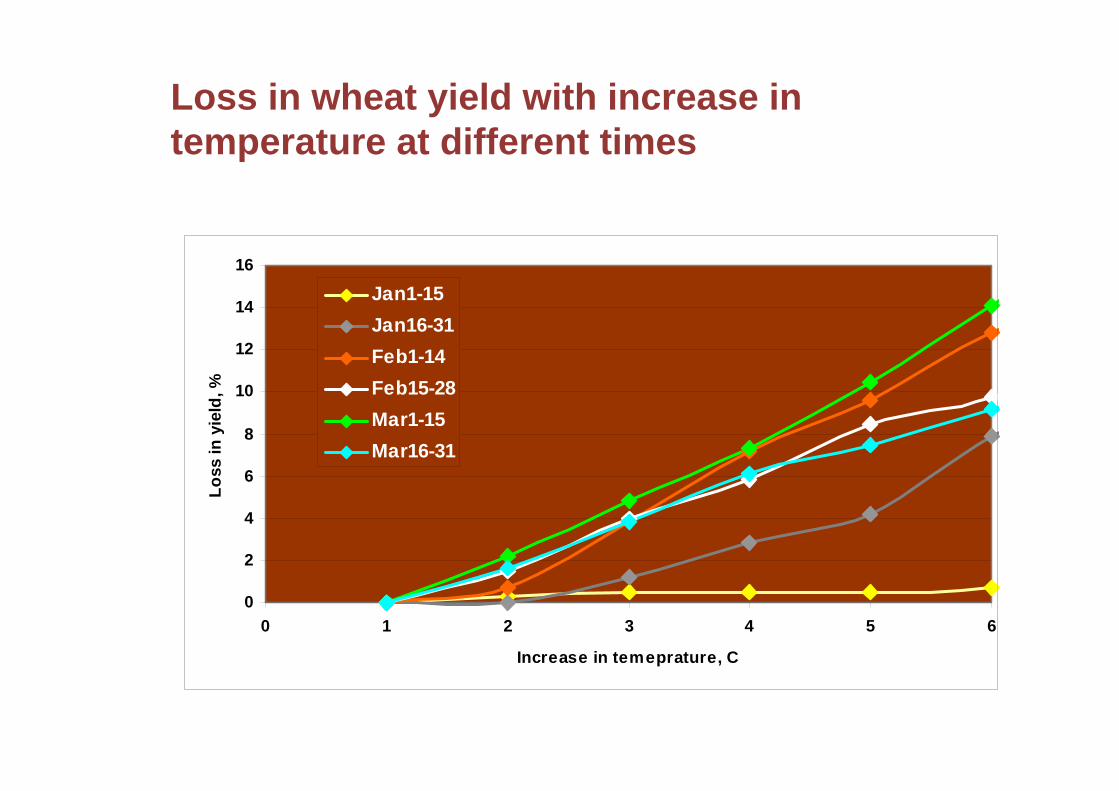
2
4
6
8
10
12
14
16
0 1 2 3 4 5 6
Increase in temeprature, C
Loss
in y
ield
, %
Jan1-15Jan16-31Feb1-14Feb15-28Mar1-15Mar16-31
Loss in wheat yield with increase in temperature at different times
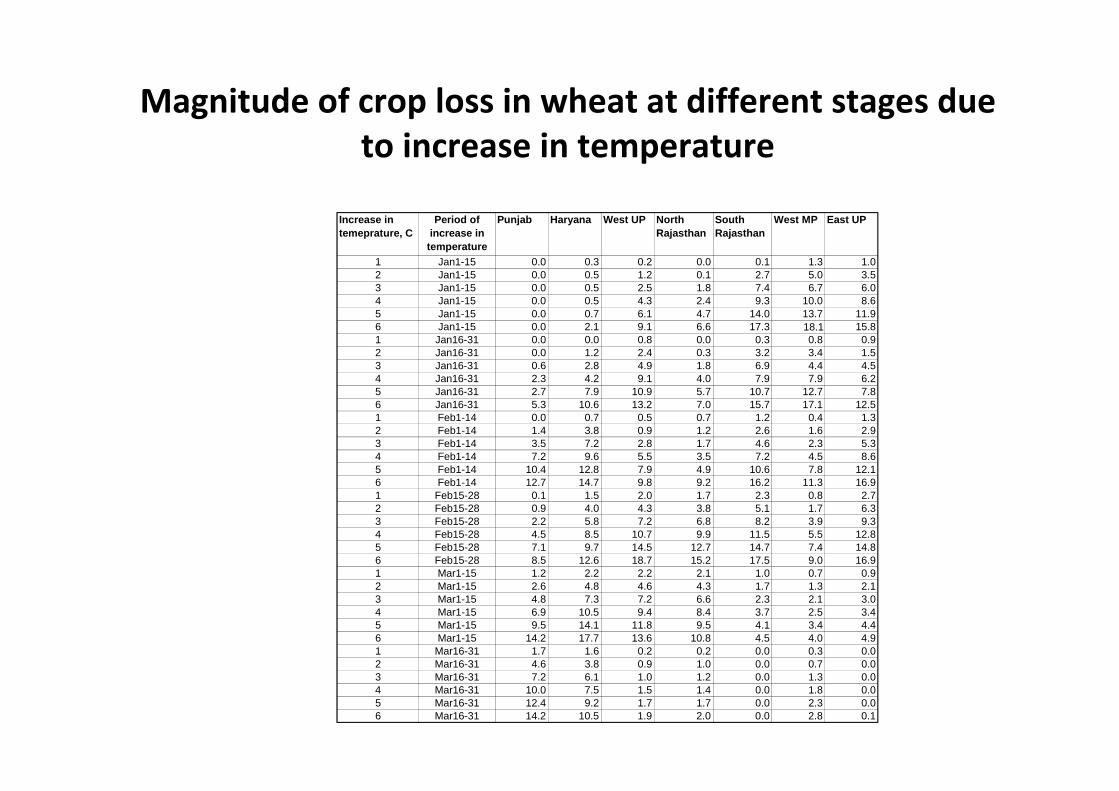
Magnitude of crop loss in wheat at different stages due to increase in temperature
Increase in temeprature, C
Period of increase in
temperature
Punjab Haryana West UP North Rajasthan
South Rajasthan
West MP East UP
1 Jan1-15 0.0 0.3 0.2 0.0 0.1 1.3 1.02 Jan1-15 0.0 0.5 1.2 0.1 2.7 5.0 3.53 Jan1-15 0.0 0.5 2.5 1.8 7.4 6.7 6.04 Jan1-15 0.0 0.5 4.3 2.4 9.3 10.0 8.65 Jan1-15 0.0 0.7 6.1 4.7 14.0 13.7 11.96 Jan1-15 0.0 2.1 9.1 6.6 17.3 18.1 15.81 Jan16-31 0.0 0.0 0.8 0.0 0.3 0.8 0.92 Jan16-31 0.0 1.2 2.4 0.3 3.2 3.4 1.53 Jan16-31 0.6 2.8 4.9 1.8 6.9 4.4 4.54 Jan16-31 2.3 4.2 9.1 4.0 7.9 7.9 6.25 Jan16-31 2.7 7.9 10.9 5.7 10.7 12.7 7.86 Jan16-31 5.3 10.6 13.2 7.0 15.7 17.1 12.51 Feb1-14 0.0 0.7 0.5 0.7 1.2 0.4 1.32 Feb1-14 1.4 3.8 0.9 1.2 2.6 1.6 2.93 Feb1-14 3.5 7.2 2.8 1.7 4.6 2.3 5.34 Feb1-14 7.2 9.6 5.5 3.5 7.2 4.5 8.65 Feb1-14 10.4 12.8 7.9 4.9 10.6 7.8 12.16 Feb1-14 12.7 14.7 9.8 9.2 16.2 11.3 16.91 Feb15-28 0.1 1.5 2.0 1.7 2.3 0.8 2.72 Feb15-28 0.9 4.0 4.3 3.8 5.1 1.7 6.33 Feb15-28 2.2 5.8 7.2 6.8 8.2 3.9 9.34 Feb15-28 4.5 8.5 10.7 9.9 11.5 5.5 12.85 Feb15-28 7.1 9.7 14.5 12.7 14.7 7.4 14.86 Feb15-28 8.5 12.6 18.7 15.2 17.5 9.0 16.91 Mar1-15 1.2 2.2 2.2 2.1 1.0 0.7 0.92 Mar1-15 2.6 4.8 4.6 4.3 1.7 1.3 2.13 Mar1-15 4.8 7.3 7.2 6.6 2.3 2.1 3.04 Mar1-15 6.9 10.5 9.4 8.4 3.7 2.5 3.45 Mar1-15 9.5 14.1 11.8 9.5 4.1 3.4 4.46 Mar1-15 14.2 17.7 13.6 10.8 4.5 4.0 4.91 Mar16-31 1.7 1.6 0.2 0.2 0.0 0.3 0.02 Mar16-31 4.6 3.8 0.9 1.0 0.0 0.7 0.03 Mar16-31 7.2 6.1 1.0 1.2 0.0 1.3 0.04 Mar16-31 10.0 7.5 1.5 1.4 0.0 1.8 0.05 Mar16-31 12.4 9.2 1.7 1.7 0.0 2.3 0.06 Mar16-31 14.2 10.5 1.9 2.0 0.0 2.8 0.1
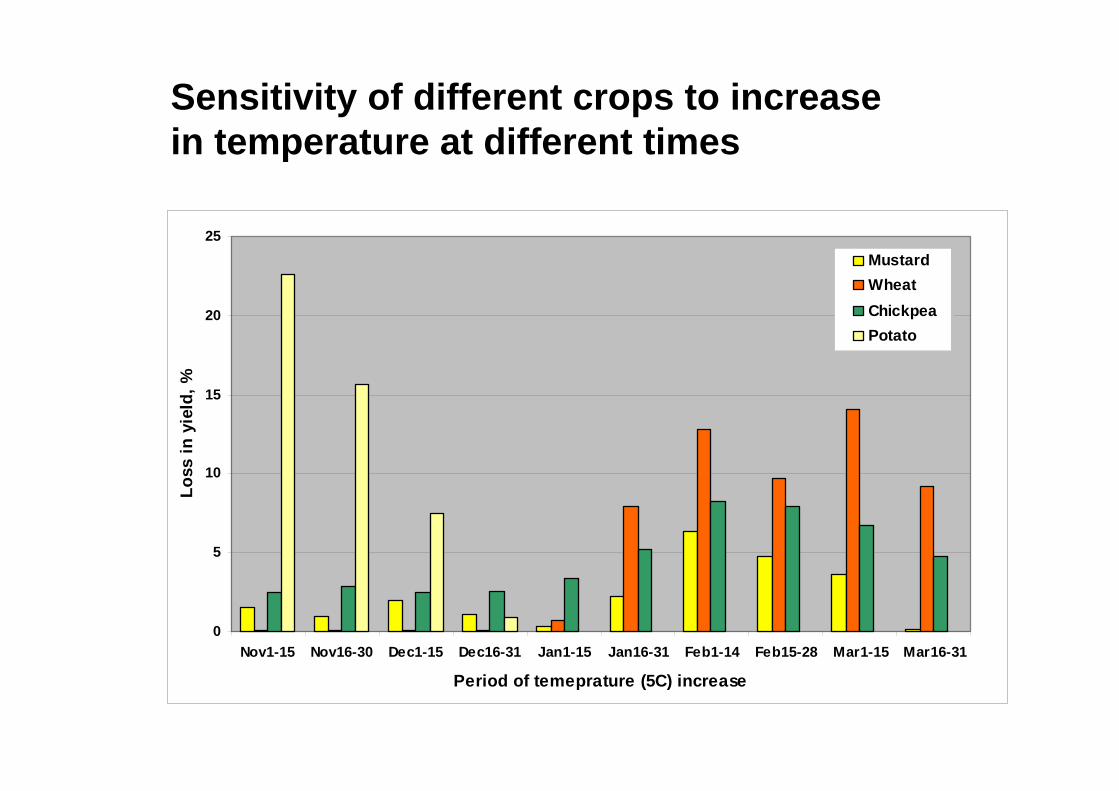
0
5
10
15
20
25
Nov1-15 Nov16-30 Dec1-15 Dec16-31 Jan1-15 Jan16-31 Feb1-14 Feb15-28 Mar1-15 Mar16-31
Period of temeprature (5C) increase
Loss
in y
ield
, %
MustardWheatChickpeaPotato
Sensitivity of different crops to increase in temperature at different times
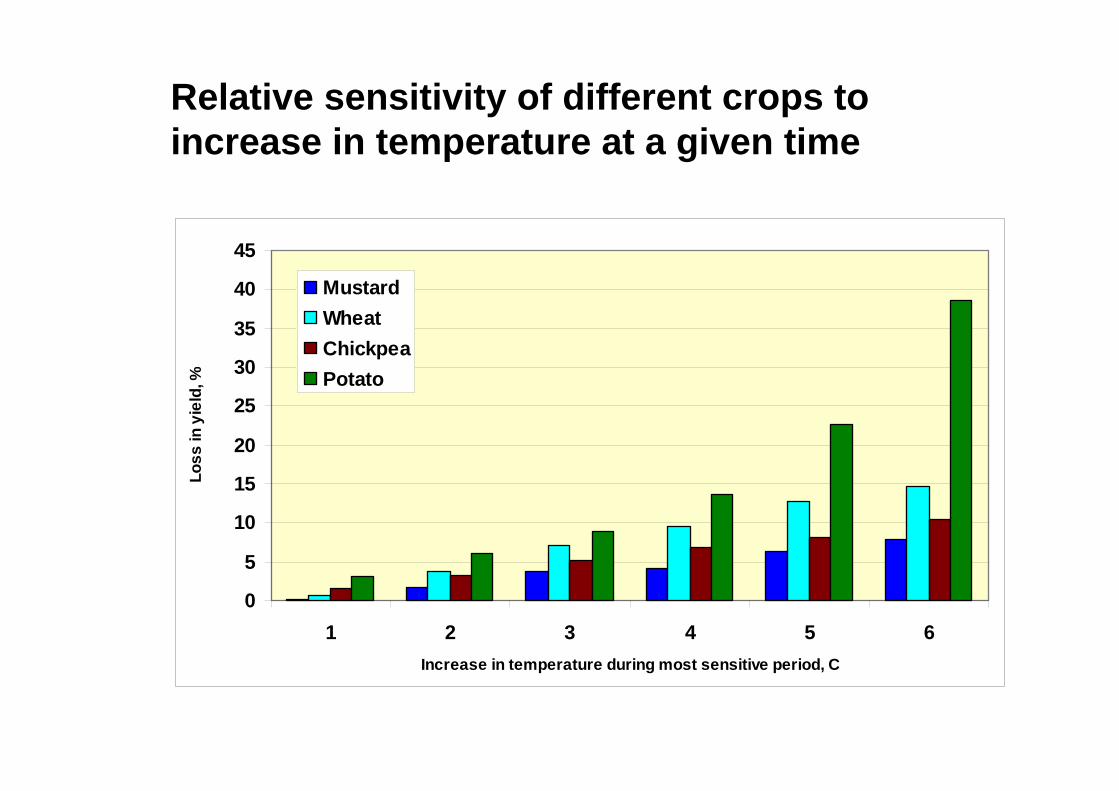
0
5
10
15
20
25
30
35
40
45
1 2 3 4 5 6Increase in temperature during most sensitive period, C
Loss
in y
ield
, %
MustardWheatChickpeaPotato
Relative sensitivity of different crops to increase in temperature at a given time
Yield loss due to adverse weather
• High temperature• Frost• Fog• Deficit/Excessive/un‐seasonal rainfall
Applications of crop‐climate models in agriculture
Real‐time• Regional estimates of anticipated crop production• Farm agro‐advisoriesStrategic Planning• Climatic risk assessment for crop insurance• Impact assessment of climate change• Strategic planning for development• Hybrid seed production
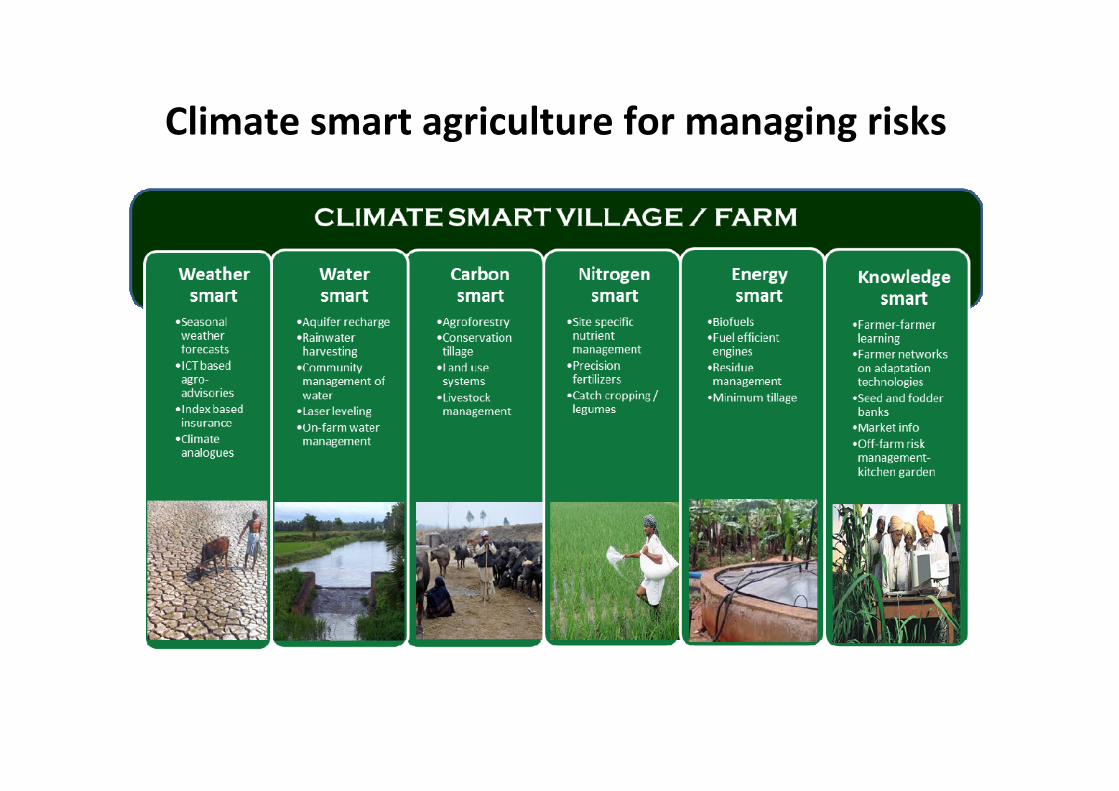
Climate smart agriculture for managing risks