AAL
37
American Airlines Group (AAL) Bankruptcy Hides Transition to a “New American” LONG, TP $46 (+30%) RESEARCH TEAM Parker Kim, Senior Director Mark Albin, Senior Analyst Charlene Shu, Junior Analyst Christopher Boyd, Analyst Daniel Chen, Analyst Karsic Ma, Analyst
-
Upload
usittech -
Category
Presentations & Public Speaking
-
view
2.448 -
download
1
Transcript of AAL
American Airlines Group (AAL)Bankruptcy Hides Transition to a “New American”LONG, TP $46 (+30%)RESEARCH TEAMParker Kim, Senior DirectorMark Albin, Senior AnalystCharlene Shu, Junior AnalystChristopher Boyd, AnalystDaniel Chen, AnalystKarsic Ma, Analyst

September 2014
Table of Contents
Investment ThesisParker Kim
Company OverviewDaniel Chen
Industry OverviewChristopher Boyd
Competitive OverviewKarsic Ma
Financial OverviewMark Albin
Risk OverviewCharlene Shu

Investment Thesis

September 2014
Investment ThesisInvestors Need More Evidence to be Convinced
AAL P/E Shows Underappreciation
Despite Becoming a Dominant Player
Why does AAL trade at discount to its peers despite having superior market
share and profitability?
We believe the market is holding American back
because they can’t let go of its turbulent
past and are waiting for merger execution.

September 2014
Investment ThesisThe “New American” Isn’t Just a Slogan
AAL Yields Have Grown the Most
Margins Closing in on “Best-in-Class”
Despite negative investor sentiment, we believe that
Network Quality+
Yield Growth+
Profitability GainsIndicate AAL both has
been and will continue to be successful in executing
the US Airways merger

Company Overview
September 2014
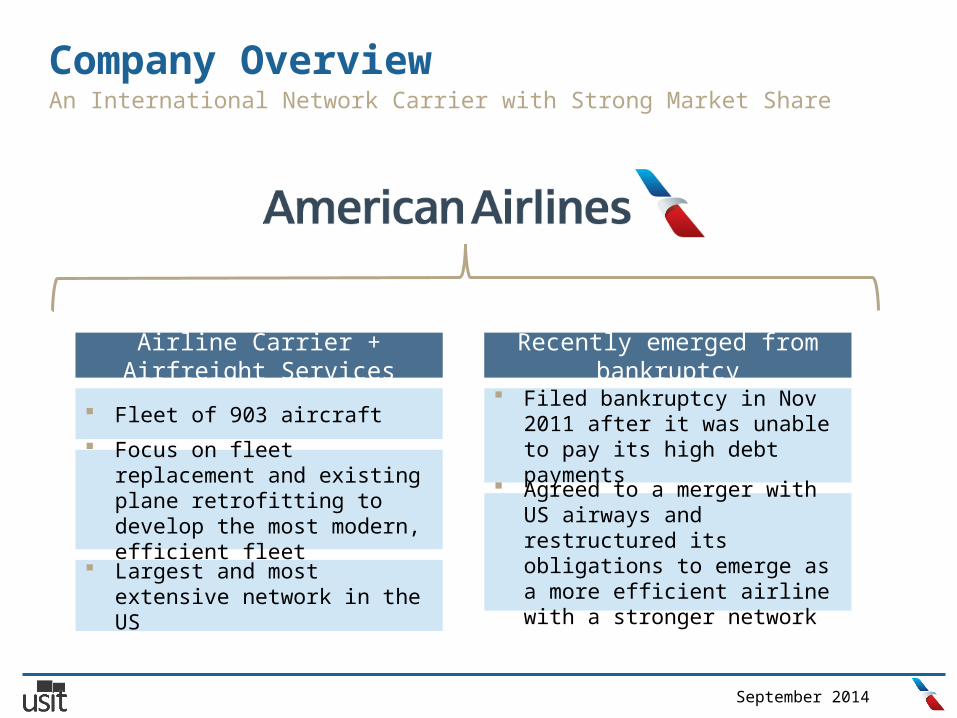
Company OverviewAn International Network Carrier with Strong Market Share
Airline Carrier + Airfreight Services
Recently emerged from bankruptcy
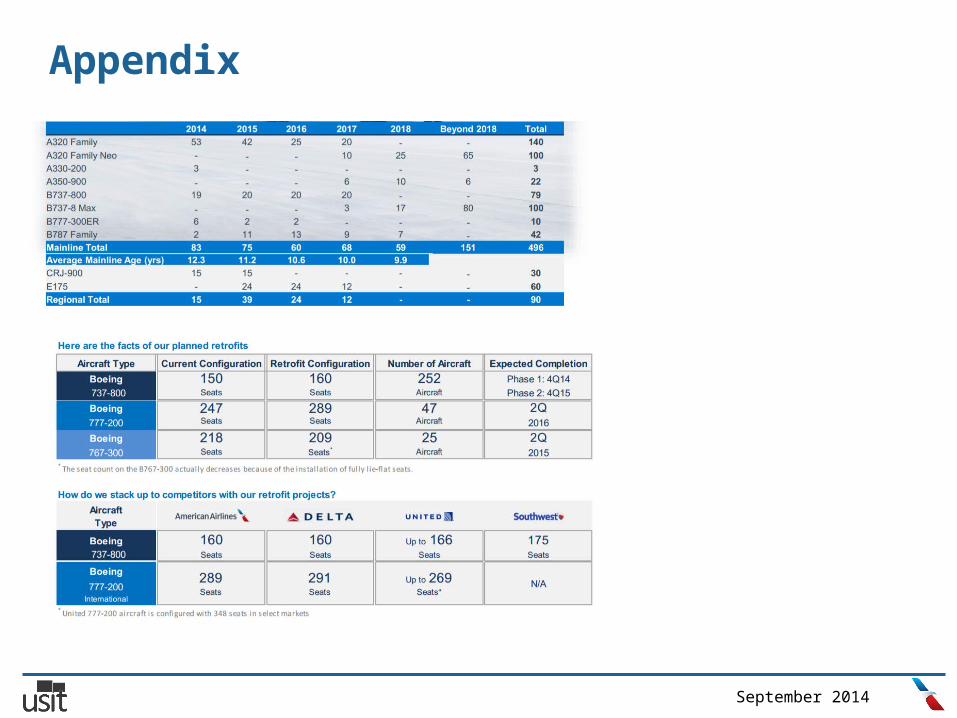
Fleet of 903 aircraft Focus on fleet replacement
and existing plane retrofitting to develop the most modern, efficient fleet
Largest and most extensive network in the US
Filed bankruptcy in Nov 2011 after it was unable to pay its high debt payments
Agreed to a merger with US airways and restructured its obligations to emerge as a more efficient airline with a stronger network
September 2014
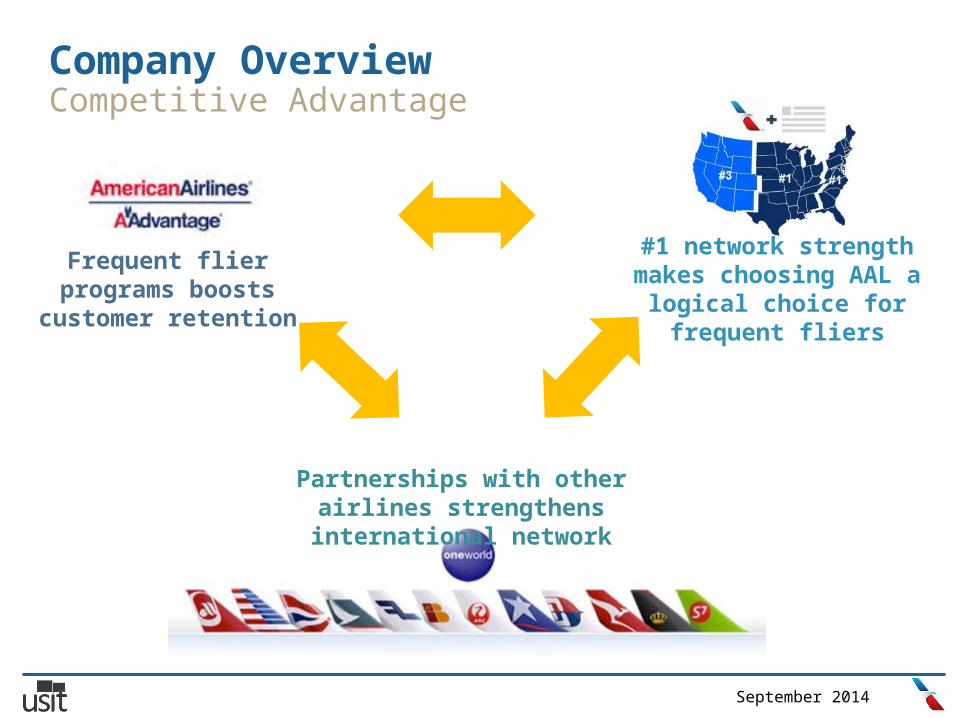
Company OverviewCompetitive Advantage
Partnerships with other airlines strengthens
international network
Frequent flier programs boosts
customer retention
#1 network strength makes choosing AAL a logical choice for
frequent fliers

September 2014
Company OverviewPost-Merger, US Airways Management Poised to Launch AAL
Doug ParkerChairman & CEO
Scott KirbyPresident
Derek KerrCFO
Experienced US Airways management team is key to executing on merger benefits
Synergy Targets: $1.4bn PwC Study: cost-cutting, increased efficiency, stronger
network Every performance metric has improved – approaching
#1 rank

September 2014
Company OverviewSWOT Analysis Indicates Opportunity in Pacific Markets
Strengths
Largest network Largest frequent flier
program Experienced management
team Excellent profitability
margins
Merger execution risk High leverage risk from
fleet improvements
Continued growth in disposable income
Increased business travel aligns with strong business traveler exposure
Increased demand for Pacific travel
Technology-based disruptions in business travel (ie. Skype)
Frequent-flier stealing programs
Opportunities
Weaknesses
Threats

Industry Overview

September 2014
Industry OverviewMarket Forces Make Airlines a Tough but Feasible Play
Large start up costs to purchase planes discourage new entrants
Regulatory issues and airport leasing process make the startup path difficult
Low switching costs and few variations between AAL/DAL/UAL make customer retention difficult
However, frequent flier programs offset this
Competition is based on price which forces razor-thin profit margins
Differentiation difficult, focus is on frequent flier programs + comprehensive network
Leisure carriers are the most susceptible to alternatives in domestic travel
Only 2 major suppliers: Airbus + Boeing Recently, AAL has begun purchasing planes
from Airbus (previously only Boeing) Despite duopoly, pricing power remains fair
HIGH
MODERATE
HIGH
LOW
MODERATE
Porter’s Assessment
Industry Dynamic Rationale
Barriers to Entry
Bargaining Power of Buyers
Intensity of Rivalry
Threat of Substitutes
Bargaining Power of Suppliers

September 2014
Industry OverviewPost-Consolidation, Pricing Power Should Improve
Favorable Industry Environment
The major US carriers should continue to benefit from a landscape where consolidation has optimized load factors.
Strong demand is producing record load factors. Revenue optimization initiatives combined with structural cost reductions should drive industry profitability up.
September 2014
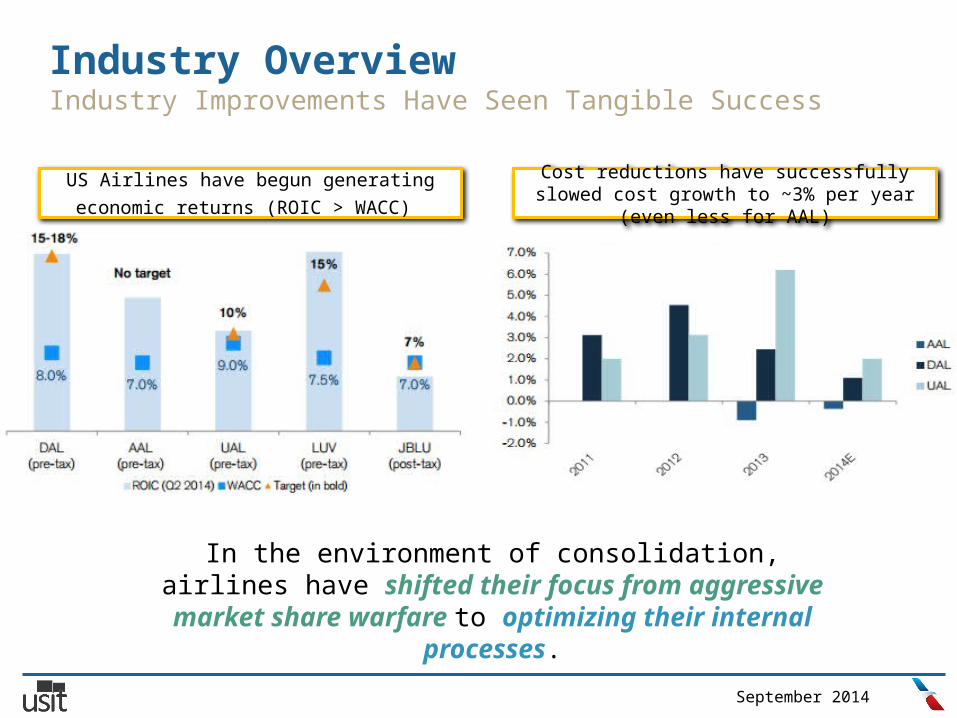
Industry OverviewIndustry Improvements Have Seen Tangible Success
US Airlines have begun generating economic returns (ROIC > WACC)
Cost reductions have successfully slowed cost growth to ~3% per year (even less for
AAL)
In the environment of consolidation, airlines have shifted their focus from aggressive market share warfare to optimizing their internal
processes.
Competitive Overview

September 2014
Competitive OverviewCompetitive Advantage leads to Revenue Success
AAL revenue per mile is continually growing and has recently moved to #2 in the
industry.
While its cost per mile has run in line with network operators.
American holds the most market share in the largest
market segment

September 2014
Competitive OverviewTarget Market
Who American targets relative to network, leisure

September 2014
Competitive OverviewAAL’s Network Leads in Market Share

Financial Overview

September 2014
Financial OverviewSeemingly Riskier Balance Sheet is not as Bad as Perceived
We project AAL’s total liquidity position ex-RCF to be between $10-12bn for 2014-2016
...but we forecast Debt / EBITDAR levels to normalize as cash flows mature and debt is
paid down.
Liquidity as a % of LTM Revenue has topped the industry for the last year
AAL does have the largest debt position of its network peers…

September 2014
Financial OverviewSeemingly Riskier Balance Sheet is not as Bad as Perceived
Free cash flow levels should begin to normalize to begin funding capital structure changes.

September 2014
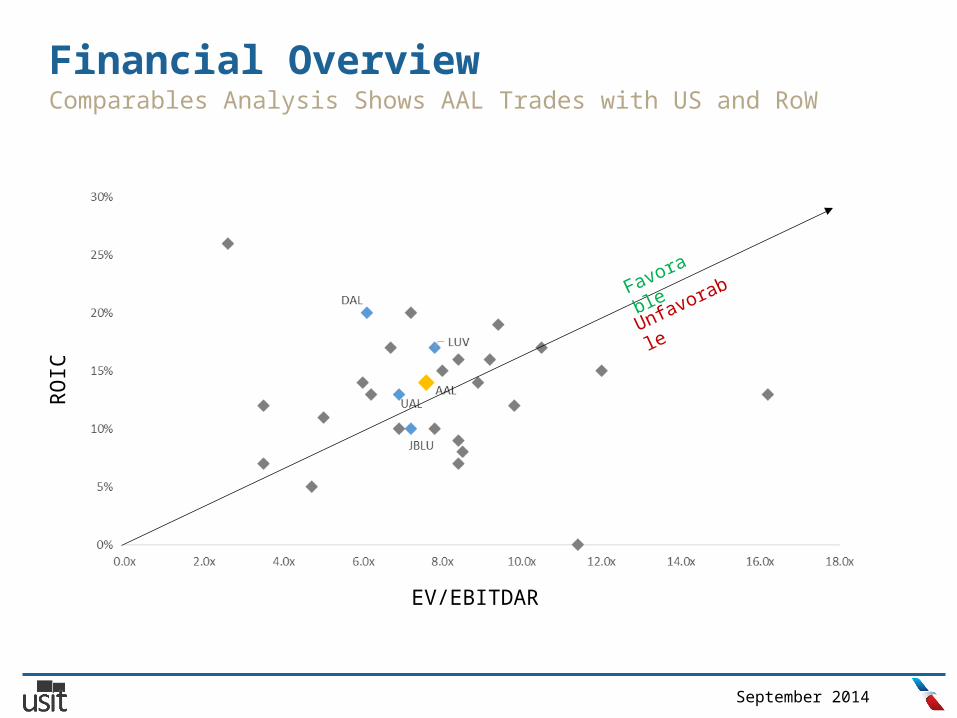
Financial OverviewComparables Analysis Shows AAL Trades with US and RoW
Global Average: 7.8x
US Average: 7.1x
AAL7.6x
September 2014
Financial OverviewComparables Analysis Shows AAL Trades with US and RoW
EV/EBITDAR
ROIC
Favorab
leUnfavorabl
e

September 2014
Financial OverviewAAL Represents Strong Upside Despite Negative Sentiment
2013A 2014E 2015E 2016EEBITDAR, adj 5,744 7395 8779 9678
% Margin 14.2% 17.2% 19.4% 20.4%
Taxes -107 363 20 25NOPAT 5,851 7,032 8,759 9,653
Capex -2,143 -2,813 -3,438D&A 1,132 1,272 1,307 1,344Change in NWC -150 -200 -300Unlevered FCF 6,011 7,053 7,259
PVFCF 5,869 6,261 5,858
Projected Period EV 17,988Terminal EV @ 4.7x 36,707Enterprise Value 54,695
Less: Debt 22627Plus: Cash 1140Equity Value 33,208Fully Diluted Shares Outstanding 720.5
Share Price $46.09
Blended UAL/DAL 2015E EV/EBITDAR, current EV/EBITDAR: 7.1x
Consensus estimates for EBITDAR
+30% upside
September 2014
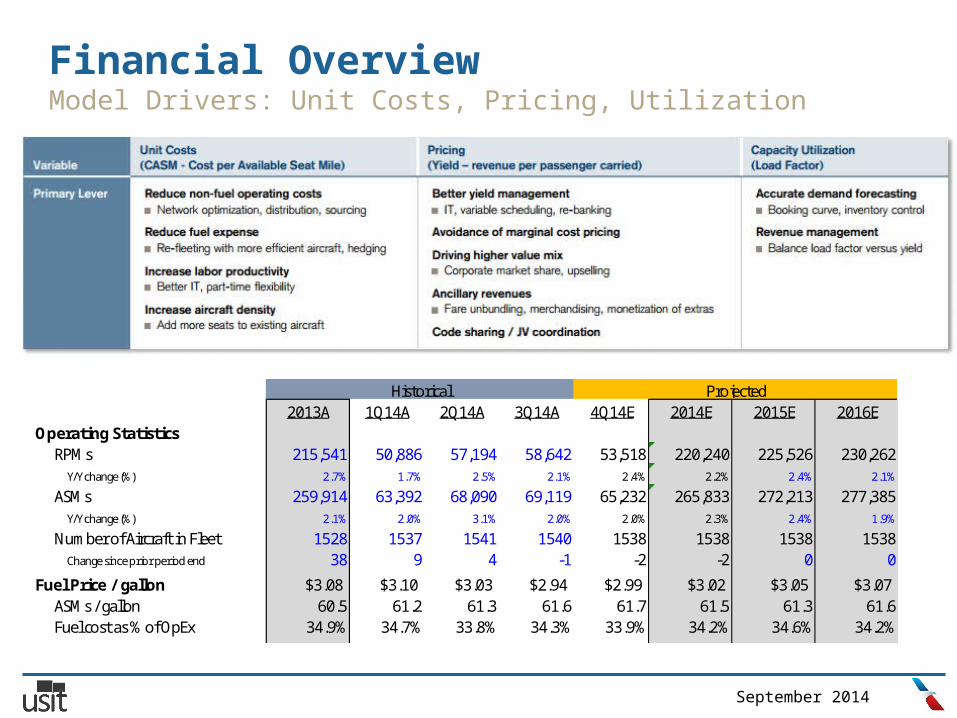
Financial OverviewModel Drivers: Unit Costs, Pricing, Utilization
2013A 1Q14A 2Q14A 3Q14A 4Q14E 2014E 2015E 2016EOperating Statistics
RPMs 215,541 50,886 57,194 58,642 53,518 220,240 225,526 230,262Y/Y change (%) 2.7% 1.7% 2.5% 2.1% 2.4% 2.2% 2.4% 2.1%
ASMs 259,914 63,392 68,090 69,119 65,232 265,833 272,213 277,385Y/Y change (%) 2.1% 2.0% 3.1% 2.0% 2.0% 2.3% 2.4% 1.9%
Number of Aircraft in Fleet 1528 1537 1541 1540 1538 1538 1538 1538Change since prior period end 38 9 4 -1 -2 -2 0 0
Fuel Price / gallon $3.08 $3.10 $3.03 $2.94 $2.99 $3.02 $3.05 $3.07ASMs / gallon 60.5 61.2 61.3 61.6 61.7 61.5 61.3 61.6Fuel cost as % of OpEx 34.9% 34.7% 33.8% 34.3% 33.9% 34.2% 34.6% 34.2%
Revenue & Costs / ASMYield (cents) 16.49 17.03 17.34 16.84 17 17.05 17.53 18.02
Y/Y change (%) 2.0% 3.2% 6.5% 2.0% 1.9% 3.4% 2.8% 2.8%PRASM (cents) 13.67 13.67 14.57 14.28 13.95 14.13 14.53 14.96
Y/Y change (%) 2.6% 2.9% 5.9% 2.2% 2.3% 3.3% 2.8% 3.0%CASM (cents) 9.13 9.75 9.31 9.15 9.46 9.46 9.38 9.57
Y/Y change (%) -2.5% 3.7% 2.4% 2.1% 2.1% 3.6% -0.8% 2.0%Margins
8.1% 5.9% 14.5% 14.3% 10.6% 11.3% 13.8% 15.0%Y/Y change (bps) 443bps 294bps 456bps 327bps 274bps 274bps 250bps 120bps
EBITDAR Margin 14.2% 12.2% 20.1% 20.0% 16.9% 17.2% 19.4% 20.4%Y/Y change (bps) 459bps 294bps 415bps 305bps 266bps 298bps 218bps 103bps
Historical Projected

Risk Overview

September 2014
Risk OverviewExecution Risk Limited- AAL Already Outpaces UAL and DAL

September 2014
Risk OverviewGeneral Risk Overview
Union Integration Fuel Price Risk Labor Cost Control
Association of Professional Flight Attendants voted last Wednesday and reached a 5-year agreement with AAL.
Integration issues between LCC-AMR unions resolved with this.
AAL has invested in newer and more comfortable planes to keep up with competition and lower fuel consumption.
Fuel costs represent ~35% of OpEx but should approach 32-33% by 2016.
Contract lasting through 2019 to be signed in December- includes modest 2% pay raises and shortening of pay ladder.
Overall should improve quality of life for personnel.

September 2014
ConclusionInvestors aren’t Seeing the “New American”
Low Valuation
Strong operational
success
Profitability gains
Investors are waiting to buy
AAL because they are afraid its
recent merger will fail.
In reality, AAL has already begun to exhibit signs of merger success and could end up being the star of
the industry.

American Airlines Group (AAL)AppendixSeptember 30, 2014Research TeamParker Kim, Senior DirectorMark Albin, Senior AnalystCharlene Shu, Junior AnalystChristopher Boyd, AnalystDaniel Chen, AnalystKarsic Ma, Analyst
September 2014
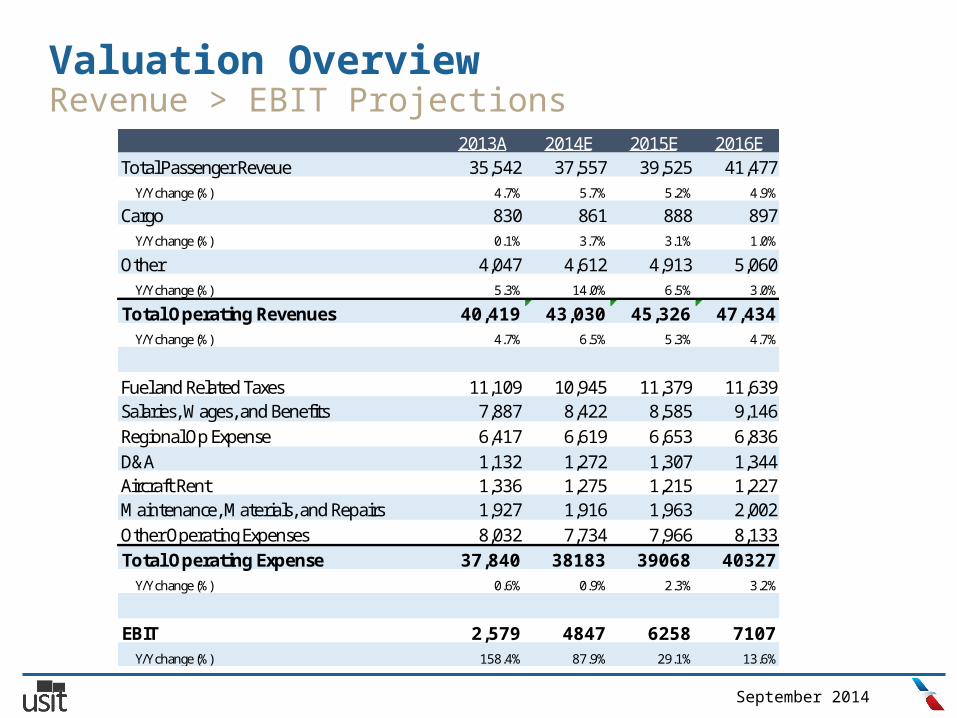
Valuation OverviewRevenue > EBIT Projections
2013A 2014E 2015E 2016ETotal Passenger Reveue 35,542 37,557 39,525 41,477
Y/Y change (%) 4.7% 5.7% 5.2% 4.9%Cargo 830 861 888 897
Y/Y change (%) 0.1% 3.7% 3.1% 1.0%Other 4,047 4,612 4,913 5,060
Y/Y change (%) 5.3% 14.0% 6.5% 3.0%Total Operating Revenues 40,419 43,030 45,326 47,434
Y/Y change (%) 4.7% 6.5% 5.3% 4.7%
Fuel and Related Taxes 11,109 10,945 11,379 11,639Salaries, Wages, and Benefits 7,887 8,422 8,585 9,146Regional Op Expense 6,417 6,619 6,653 6,836D&A 1,132 1,272 1,307 1,344Aircraft Rent 1,336 1,275 1,215 1,227Maintenance, Materials, and Repairs 1,927 1,916 1,963 2,002Other Operating Expenses 8,032 7,734 7,966 8,133Total Operating Expense 37,840 38183 39068 40327
Y/Y change (%) 0.6% 0.9% 2.3% 3.2%
EBIT 2,579 4847 6258 7107Y/Y change (%) 158.4% 87.9% 29.1% 13.6%

September 2014
Valuation OverviewRevenue > EBIT Projections
2013A 1Q14A 2Q14A 3Q14A 4Q14E 2014E 2015E 2016EOperating Statistics
RPMs 215,541 50,886 57,194 58,642 53,518 220,240 225,526 230,262Y/Y change (%) 2.7% 1.7% 2.5% 2.1% 2.4% 2.2% 2.4% 2.1%
ASMs 259,914 63,392 68,090 69,119 65,232 265,833 272,213 277,385Y/Y change (%) 2.1% 2.0% 3.1% 2.0% 2.0% 2.3% 2.4% 1.9%
Number of Aircraft in Fleet 1528 1537 1541 1540 1538 1538 1538 1538Change since prior period end 38 9 4 -1 -2 -2 0 0
Fuel Price / gallon $3.08 $3.10 $3.03 $2.94 $2.99 $3.02 $3.05 $3.07ASMs / gallon 60.5 61.2 61.3 61.6 61.7 61.5 61.3 61.6Fuel cost as % of OpEx 34.9% 34.7% 33.8% 34.3% 33.9% 34.2% 34.6% 34.2%
Revenue & Costs / ASMYield (cents) 16.49 17.03 17.34 16.84 17 17.05 17.53 18.02
Y/Y change (%) 2.0% 3.2% 6.5% 2.0% 1.9% 3.4% 2.8% 2.8%PRASM (cents) 13.67 13.67 14.57 14.28 13.95 14.13 14.53 14.96
Y/Y change (%) 2.6% 2.9% 5.9% 2.2% 2.3% 3.3% 2.8% 3.0%CASM (cents) 9.13 9.75 9.31 9.15 9.46 9.46 9.38 9.57
Y/Y change (%) -2.5% 3.7% 2.4% 2.1% 2.1% 3.6% -0.8% 2.0%Margins
EBIT Margin 8.1% 5.9% 14.5% 14.3% 10.6% 11.3% 13.8% 15.0%Y/Y change (bps) 443bps 294bps 456bps 327bps 274bps 274bps 250bps 120bps
EBITDAR Margin 14.2% 12.2% 20.1% 20.0% 16.9% 17.2% 19.4% 20.4%Y/Y change (bps) 459bps 294bps 415bps 305bps 266bps 298bps 218bps 103bps
Historical Projected

September 2014
Appendix http://
online.wsj.com/articles/american-airlines-flight-attendants-reach-tentative-agreement-1411164253 http://
www.dallasnews.com/business/airline-industry/20140919-american-airlines-reaches-tentative-agreement-with-flight-attendants-union.ece
https://www.iata.org/pressroom/facts_figures/fact_sheets/Documents/fuel-fact-sheet.pdf http://marketrealist.com/2014/07/why-american-us-airways-merger-was-conditional/ http://www.aa.com/i18n/amrcorp/corporateInformation/facts/measurements.jsp http://
phx.corporate-ir.net/External.File?item=UGFyZW50SUQ9MjI0MDU2fENoaWxkSUQ9LTF8VHlwZT0z&t=1 http://phx.corporate-ir.net/External.File?item=UGFyZW50SUQ9NTQyODc4fENoaWxkSUQ9MjMzMjk3fFR
5cGU9MQ==&t=1
http://phx.corporate-ir.net/External.File?item=UGFyZW50SUQ9NTQ2NTEwfENoaWxkSUQ9MjM4MDU0fFR5cGU9MQ==&t=1
http://phx.corporate-ir.net/External.File?item=UGFyZW50SUQ9NTU1MzM4fENoaWxkSUQ9MjUyMDU1fFR5cGU9MQ==&t=1
http://phx.corporate-ir.net/External.File?item=UGFyZW50SUQ9NTU1MzY0fENoaWxkSUQ9MjUyMDg4fFR5cGU9MQ==&t=1
http://aviationblog.dallasnews.com/2013/03/ceos-american-airlines-us-airways-will-bring-nothing-but-good-things.html/
September 2014
Appendix

September 2014
Appendix

September 2014
Appendix

September 2014
DO NOT WRITE OVER, TEMPLATE SLIDEDON’T EVEN THINK ABOUT IT MISTER