AA stable Banco Santander, S.A. · UK and in Brazil, Santander is the largest foreign private bank....
16
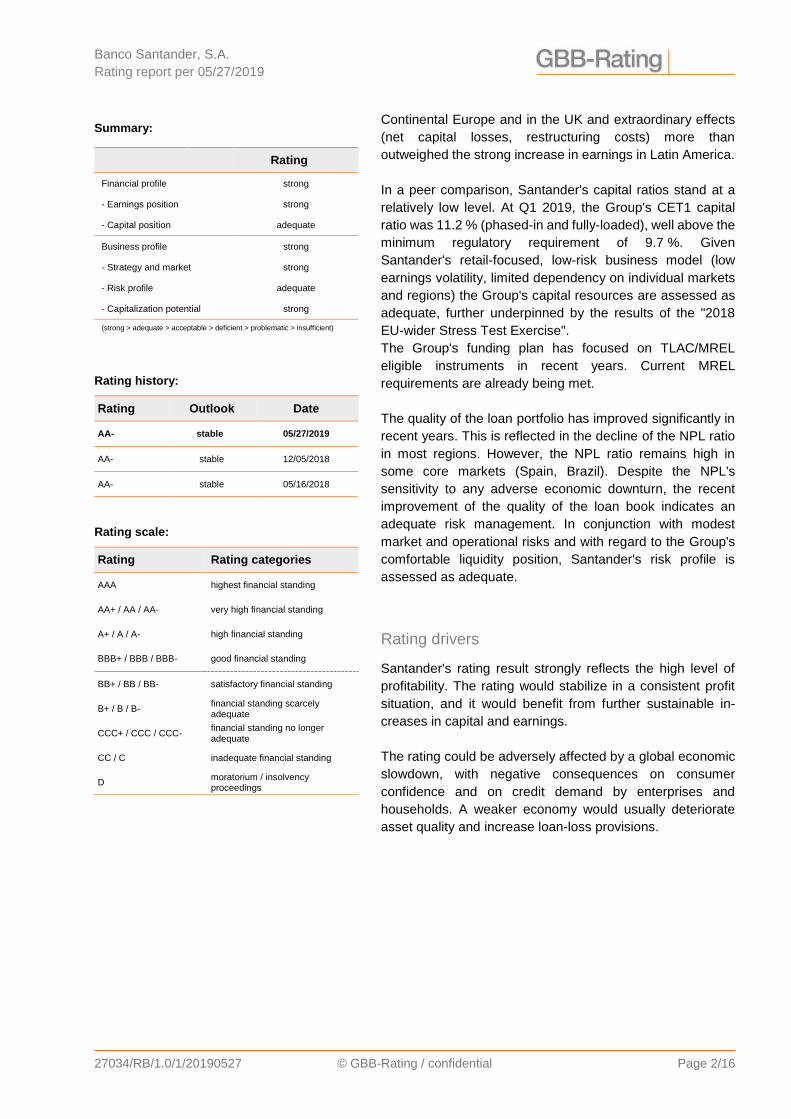
27034/RB/1.0/1/20190527 © GBB-Rating / confidential Page 1/16 Based on the information available, the financial standing of Banco Santander, S.A. (hereinafter referred to as "Santander" or "Group") is again evaluated as high. GBB- Rating confirms the rating result of AA- as well as the stable outlook. The rating reflects Santander's very high financial standing, which is underpinned by its high level of profitability and the low risk business profile focused on retail and commercial banking. The Group's broad geographical diversification is a major advantage over most competitors, as its strong presence in Latin America (especially in Brazil) provides access to markets with comparatively high interest rates and sufficient growth potential. Santander has a leading market position in retail lending in most of its core markets. The marked increase in client numbers in recent years (144 million at year-end, 2017: 133 million) is partly due to the acquisition and integration of Banco Popular (Spain, Portugal), but it also stems from substantial investments in digitalization and the expansion of online services. According to the updated mid-term plan, Santander plans to invest about EUR 20 billion in digitalization and technology over the next four years. Furthermore, the Group plans to cut EUR 1.2 billion of annual costs, largely in Europe. Overall, Santander has a sound and sustainable business model. In 2018, Santander reported an operating profit before tax of EUR 14.2 billion compared to EUR 12.1 billion in 2017. The main reason for the increase in profit was the significant decline in provisions and impairments on non-financial assets, in particular on intangible assets (EUR 0.1 billion, 2017: EUR 1.1 billion). The Group's net interest income as the main source of earnings remained almost at prior year's level (EUR 34.3 billion) whilst net commission income slightly decreased (-1 %). Administrative expenses (EUR 20.4 billion) remained stable. Consequently, Santander's earnings indicators remain at a high level. Based on GBB-Rating's profitability ratios, return on equity improved to 13.3 %, compared to 11.5 % in 2017. The cost income ratio (without provisions for credit risks) remains on an exceptionally low level of 49.6 % (2017: 51.9 %). In Q1 2019, attributable profit to the parent declined by 10.4 % compared to Q1 2018 as lower earnings in AA- stable Rating Committee: 05/27/2019 Strengths/Opportunities: High profitability and efficiency in a peer group comparison; strategic targets set in 2015 were met Sound and sustainable strategy Updated mid-term plan: focus on substantial investments in digitalization and cost savings Strong position in its core markets Broad geographical diversification Resilient structure of financially autonomous subsidiaries Balanced funding profile and comfortable liquidity position Weaknesses/Threats: CET1 ratio (fully loaded) remains on a comparatively low level NPL ratio declining, yet elevated in some regions (e. g. Brazil, Spain, Portugal) Ongoing low interest rate environment in advanced economies Deteriorating economic outlook particularly in Europe Financial data: (in EUR m) 2018 2017 Adjusted gross profit 45,966 44,325 Operating result 14,201 12,091 Net income 9,315 8,207 Total assets 1,459,271 1,444,305 CET1 capital ratio* 11.5 % 12.3 % Total capital ratio* 15.0 % 15.0 % Leverage Ratio* 5.2 % 5.3 % LCR 158 % 133 % NSFR 114 % 105 % * phased-in Analysts: Daniel Sebastian Bittner + 49 221 912 897 254 [email protected] Angelika Komenda + 49 221 912 897 248 [email protected] Banco Santander, S.A. Rating result
Transcript of AA stable Banco Santander, S.A. · UK and in Brazil, Santander is the largest foreign private bank....

27034/RB/1.0/1/20190527 © GBB-Rating / confidential Page 1/16
Based on the information available, the financial standing of
Banco Santander, S.A. (hereinafter referred to as
"Santander" or "Group") is again evaluated as high. GBB-
Rating confirms the rating result of AA- as well as the stable
outlook.
The rating reflects Santander's very high financial standing,
which is underpinned by its high level of profitability and the
low risk business profile focused on retail and commercial
banking. The Group's broad geographical diversification is a
major advantage over most competitors, as its strong
presence in Latin America (especially in Brazil) provides
access to markets with comparatively high interest rates and
sufficient growth potential. Santander has a leading market
position in retail lending in most of its core markets. The
marked increase in client numbers in recent years (144
million at year-end, 2017: 133 million) is partly due to the
acquisition and integration of Banco Popular (Spain,
Portugal), but it also stems from substantial investments in
digitalization and the expansion of online services. According
to the updated mid-term plan, Santander plans to invest
about EUR 20 billion in digitalization and technology over the
next four years. Furthermore, the Group plans to cut EUR 1.2
billion of annual costs, largely in Europe. Overall, Santander
has a sound and sustainable business model.
In 2018, Santander reported an operating profit before tax of
EUR 14.2 billion compared to EUR 12.1 billion in 2017. The
main reason for the increase in profit was the significant
decline in provisions and impairments on non-financial
assets, in particular on intangible assets (EUR 0.1 billion,
2017: EUR 1.1 billion). The Group's net interest income as
the main source of earnings remained almost at prior year's
level (EUR 34.3 billion) whilst net commission income slightly
decreased (-1 %). Administrative expenses (EUR 20.4
billion) remained stable.
Consequently, Santander's earnings indicators remain at a
high level. Based on GBB-Rating's profitability ratios, return
on equity improved to 13.3 %, compared to 11.5 % in 2017.
The cost income ratio (without provisions for credit risks)
remains on an exceptionally low level of 49.6 % (2017:
51.9 %).
In Q1 2019, attributable profit to the parent declined by
10.4 % compared to Q1 2018 as lower earnings in
AA-
stable Rating Committee: 05/27/2019
Strengths/Opportunities:
High profitability and efficiency in a peer group comparison; strategic targets set in 2015 were met
Sound and sustainable strategy
Updated mid-term plan: focus on substantial investments in digitalization and cost savings
Strong position in its core markets
Broad geographical diversification
Resilient structure of financially autonomous subsidiaries
Balanced funding profile and comfortable liquidity position
Weaknesses/Threats:
CET1 ratio (fully loaded) remains on a comparatively low level
NPL ratio declining, yet elevated in some regions (e. g. Brazil, Spain, Portugal)
Ongoing low interest rate environment in advanced economies
Deteriorating economic outlook particularly in Europe
Financial data:
(in EUR m) 2018 2017
Adjusted gross profit 45,966 44,325
Operating result 14,201 12,091
Net income 9,315 8,207
Total assets 1,459,271 1,444,305
CET1 capital ratio* 11.5 % 12.3 %
Total capital ratio* 15.0 % 15.0 %
Leverage Ratio* 5.2 % 5.3 %
LCR 158 % 133 %
NSFR 114 % 105 %
* phased-in
Analysts:
Daniel Sebastian Bittner + 49 221 912 897 254 [email protected]
Angelika Komenda + 49 221 912 897 248 [email protected]
Banco Santander, S.A.
Rating result
Banco Santander, S.A.
Rating report per 05/27/2019
27034/RB/1.0/1/20190527 © GBB-Rating / confidential Page 2/16
Continental Europe and in the UK and extraordinary effects
(net capital losses, restructuring costs) more than
outweighed the strong increase in earnings in Latin America.
In a peer comparison, Santander's capital ratios stand at a
relatively low level. At Q1 2019, the Group's CET1 capital
ratio was 11.2 % (phased-in and fully-loaded), well above the
minimum regulatory requirement of 9.7 %. Given
Santander's retail-focused, low-risk business model (low
earnings volatility, limited dependency on individual markets
and regions) the Group's capital resources are assessed as
adequate, further underpinned by the results of the "2018
EU-wider Stress Test Exercise".
The Group's funding plan has focused on TLAC/MREL
eligible instruments in recent years. Current MREL
requirements are already being met.
The quality of the loan portfolio has improved significantly in
recent years. This is reflected in the decline of the NPL ratio
in most regions. However, the NPL ratio remains high in
some core markets (Spain, Brazil). Despite the NPL's
sensitivity to any adverse economic downturn, the recent
improvement of the quality of the loan book indicates an
adequate risk management. In conjunction with modest
market and operational risks and with regard to the Group's
comfortable liquidity position, Santander's risk profile is
assessed as adequate.
Rating drivers
Santander's rating result strongly reflects the high level of
profitability. The rating would stabilize in a consistent profit
situation, and it would benefit from further sustainable in-
creases in capital and earnings.
The rating could be adversely affected by a global economic
slowdown, with negative consequences on consumer
confidence and on credit demand by enterprises and
households. A weaker economy would usually deteriorate
asset quality and increase loan-loss provisions.
Summary:
Rating
Financial profile strong
- Earnings position strong
- Capital position adequate
Business profile strong
- Strategy and market strong
- Risk profile adequate
- Capitalization potential strong
(strong > adequate > acceptable > deficient > problematic > insufficient)
Rating history:
Rating Outlook Date
AA- stable 05/27/2019
AA- stable 12/05/2018
AA- stable 05/16/2018
Rating scale:
Rating Rating categories
AAA highest financial standing
AA+ / AA / AA- very high financial standing
A+ / A / A- high financial standing
BBB+ / BBB / BBB- good financial standing
BB+ / BB / BB- satisfactory financial standing
B+ / B / B- financial standing scarcely adequate
CCC+ / CCC / CCC- financial standing no longer adequate
CC / C inadequate financial standing
D moratorium / insolvency proceedings
Banco Santander, S.A.
Rating report per 05/27/2019
27034/RB/1.0/1/20190527 © GBB-Rating / confidential Page 3/16
Strategy and market
Strategy
Santander has a sound and sustainable strategy, focused on retail and commercial banking. The
Group's retail banking, which accounts for 88 % of total gross income in 2018, comprises a
comprehensive range of lending and deposit products, including residential mortgages, vehicle
financing and SME finance. Further business activities include wealth management (private banking,
asset management) and corporate & investment banking (wholesale banking business), which have
been established in recent years. Measured by their profit contribution, both divisions are of minor
importance.
The Group's business approach is characterized by broad geographical diversification and its model
of autonomous subsidiaries. Santander's core markets as measured by attributable profits and the
number of customers are Brazil, Spain, the United Kingdom (UK) as well as Central and Northern
Europe (Santander Consumer Finance). The geographical reach in both developed, generally low
interest rate markets and in emerging, relatively high interest rate markets helps to reduce
Santander's sensitivity to economic downturns in individual regions.
Santander defined a number of main strategic targets, comprising qualitative as well as quantitative
objectives (e. g. increase in customer satisfaction, growth in customer numbers, target ranges for
profitability and efficiency). GBB-Rating attests an efficient strategic management with view to the
following objectives:
The medium-term targets set in 2015 were all met in 2018.
The return on tangible equity (RoTE) increased to 11.7 % in 2018 from 10.0 % in 2015. The cost-
to-income ratio remained below 50 % during this period, considerably lower than the sector
average.
In 2018, the number of customers grew in all target markets (144 million, 2017: 133 million). The
rise was particularly pronounced in Spain, Brazil and Mexico. Furthermore, the number of clients
who consider Santander their main bank ("loyal customers") increased by 15 %. Since 2015, the
number of "digital" customers (commercial banking customers who used online/mobile banking
in the last 30 days) rose by 93 %.
Santander has a leading market position in retail lending in nearly all of its core markets. In the
UK and in Brazil, Santander is the largest foreign private bank. In Brazil, the Group's subsidiary
is the only foreign bank with a significant market share (about 9 %). In Spain and in Portugal,
Santander benefited from the takeover of Banco Popular Español S.A. (Banco Popular) in 2017
(lending share of 18 % in both markets).
Santander's management updated the mid-term plan and strategic targets in April 2019. Over the
next four years, Santander plans to invest about EUR 20 billion in digitalization and technology, in
particular in digital global payment solutions. The growth in digital offerings includes the launch of
open market apps for international payments in European core markets. It also includes the
expansion of "GetNet", a subsidiary of Santander Brazil which provides payment transactions with
cards and terminals, in Latin America and Europe. Santander plans to cut roughly EUR 1.2 billion of
Banco Santander, S.A.
Rating report per 05/27/2019
27034/RB/1.0/1/20190527 © GBB-Rating / confidential Page 4/16
annual costs, largely in Europe. The updated target range for the underlying RoTE (13-15 %)
appears to be ambitious but achievable.
Market
The macroeconomic environment deteriorated in 2018 in view of downward revisions of growth
forecasts for advanced economies, the economic slowdown in the Eurozone, and the (post-) Brexit
uncertainty. Global trade volumes plummeted in Q4 2018 and industrial production sharply
decreased in advanced economies and in China except for the USA. Nevertheless, consumer
confidence remains on a very high level on a worldwide scale.
In 2018, GDP of the Eurozone rose by 1.8 % (2017: 2.4 %). In response to the slowdown, the
European Central Bank adjusted its forward guidance and is likely to maintain the low level of interest
rates until at least 2020. The OECD and IMF revised growth forecasts for the Eurozone down to just
over 1 % in 2019. For the USA, the IMF also lowered the expected 2019 growth rate to 2.3 % (2018:
2.9 %).
Growth will remain considerably higher in emerging and developing economies than in advanced
economies. According to current forecasts, growth in Latin America is projected to recover in 2019
and 2020, mainly driven by Brazil and Mexico.
Albeit Brazil's GDP increased by 1.1 % in 2018, it fell short of forecasts (about 2 %), and grew only
marginally in Q4 2018. 2019 and 2020 forecasts predict some moderate growth of around 2 % and
2.5 %, respectively. The unemployment rate remains elevated and volatile, standing at 12.7 % in
March 2019. The weaker than expected labor market and the rising inflation (March 2019: 4.6 %)
may impede the recovery in purchasing power. On the other hand, the Brazilian banking system is
highly profitable with a double-digit average return on equity. As in other Latin American countries,
the financial system in Brazil is quite resilient to external shocks due to its experience in managing
volatility (economic development, foreign exchange risks) during the past decades. It should also be
noted that the number of problem assets of private banks have decreased considerably in the past
years, and the reduction of the loan-loss provision was a main driver for the increase in profitability.
The implementation of the pension reform remains uncertain but is likely to have a positive impact
on the economy.
In 2018, real GDP in Spain grew by 2.5 % (2017: 3.0 %) and above the Eurozone average (1.8 %),
driven by consumer spending and investment. In the wake of the positive economic environment in
recent years, the unemployment rate fell to 14.5 % in Q4 2018, the lowest level since the beginning
of the 2008 Financial Crisis. According to current predictions, growth momentum will slightly fade to
2.2 % in 2019 with view to potential impacts from a slowing global economic environment, the UK's
withdrawal from the EU and increasing protectionism. The NPL ratio in Spain developed favorably
in recent years to 3.7 % in Q4 2018, however, it still remains above the EU average (3.2 %). Demand
for consumer credits should be supported by robust growth of the Spanish economy and should
remain at high levels, despite a dip in Q1 2019 and tightened credit standards.
The economic development in the United Kingdom is strongly influenced by political uncertainty on
the withdrawal from the European Union. At this stage, the EU delayed Brexit until the end of October
2019. In the past two years, investment fell behind the OECD average and consumer confidence

Banco Santander, S.A.
Rating report per 05/27/2019
27034/RB/1.0/1/20190527 © GBB-Rating / confidential Page 5/16
declined. The short-term projection for GDP growth stands at 1.0 % to 1.5 %, primarily based on the
stable inflation, the robust labor market and growing wages. The fundamental data of the UK's
banking sector are sound with historically low NPL ratios and an average CET 1 ratio (fully loaded)
of 15.1 % as of Q4 2018, close to the EU average. According to recent stress test results conducted
by the British banking supervision (assumptions: "hard" Brexit, recession lasting several years), the
long-term fundamental position of British banks may worsen, however, they show a high level of
resilience and have sufficient leeway in an adverse economic scenario. Retail Banking is dominated
by four large domestic banks (Lloyds, Barclays, RBS, HSBC) and Santander UK. Consumer lending
grew strongly in recent years, albeit credit growth slowed down to about 8 % between Q3 2017 and
Q3 2018. Positively, mortgage lending increased at about 3 % in the same period. Growth rates are
expected to remain at this level in 2019.
Strong long-term earnings position
Santander's long-term earnings position is assessed as strong. The Group's profitability, which is
already at a very high level, continued to improve in 2018. According to GBB-Rating's calculation
method (see appendix), the return on equity rose to 13.3 % compared to 11.5 % in 2017. The cost
income ratio remains at a remarkably low level in comparison to peers and stood at 49.6 % in 2018
(2017: 51.9 %). Taking into account impairment losses ("cost-income ratio I", see appendix), the
ratio also improved to 66.4 % from 67.8 %.
The improvement in the profitability and cost indicators stems mainly from the increase in adjusted
gross profit and operating profit which are primarily due to the significant decline in impairment losses
on intangible assets to EUR 0.1 billion (2017: EUR 1.1 billion) and lower provisions of EUR 2.2 billion
(2017: EUR 3.1 billion). The Group's net interest income as the main source of earnings was virtually
unchanged (EUR 34.3 billion). The net commission income slightly decreased (-1 %), mainly due to
higher commission expenses. The result from categories of financial instruments rose by EUR 0.9
billion to EUR 2.8 billion, partly due to higher gains on financial assets and liabilities held for trading.
The positive developments in provisions and impairments and in the result from categories of
financial instruments more than outweighed the losses on exchange differences of EUR 0.7 billion
(2017: gain of EUR 0.1 billion) and the sharp decline in gains on non-financial assets to EUR 0.0
billion from EUR 0.5 billion due to the sale of Allfunds Bank in 2007. Overall, the adjusted gross profit
rose by nearly 4 %.
Administration costs remained almost unchanged at EUR 20.4 billion as the decrease in staff costs
was offset by the rise in IT expenditures. Impairment of financial assets measured at amortized costs
further decreased by nearly 3 % to EUR 9.0 billion. As a result, profit before tax grew by EUR 2.1
billion to EUR 14.2 billion.

Banco Santander, S.A.
Rating report per 05/27/2019
27034/RB/1.0/1/20190527 © GBB-Rating / confidential Page 6/16
Interim result as of 31 March 2019
In comparison to Q1 2018, total income declined by 0.5 %. Whilst net interest income increased by
2.7 %, it was offset by lower gains on financial transactions and exchange differences, primarily due
to higher costs of foreign currency hedging. Compared to Q4 2018, total income was 3.6 % lower,
mainly due to weaker net interest income (-4.2 %) from the impact of the revised IFRS 16 and fewer
days in the quarter.
Operating expenses stayed flat in comparison to Q1 2018 and declined by 3.0 % compared to Q4
2018.
Falling total income was compensated by a further decline in loan-loss provisions (-4.8 % compared
to Q1 2018). As a result, underlying profit before tax was just 0.1 % below the level of Q1 2018, and
higher than in Q4 2018 (+3.9 %).
The attributable profit to the parent (-11.0 % compared to Q4 2018; -10.4 % compared to Q1 2018)
was negatively affected by a higher tax on profit, restructuring costs (Poland, UK) and capital losses
due to property sales.
In Continental Europe, underlying profit before tax fell by 3.4 % compared to Q1 2018, with a marked
decline in Spain (-10.5 %, mainly due to lower gains in financial transactions). In the UK, profit before
tax declined sharply by 16.8 % since total income was negatively impacted by competitive pressure,
lower mortgage margins and lower gains on financial transactions; the attributable profit was even
36.0 % lower than in Q1 2018 because of restructuring costs (branch closures). In contrast, profit
before tax rose by 5.5 % in Latin America, with substantial profit growth in Brazil (+8.4 %) and Mexico
(+20.0 %).
0
5,000
10,000
15,000
20,000
25,000
30,000
35,000
40,000
45,000
50,000
2018 2017 2016
Adjusted gross profit
Administration costs
Development of adjusted gross profit and administration costs (EUR m)
7%
8%
9%
10%
11%
12%
13%
14%
15%
2018 2017 2016
Return on equity (%)

Banco Santander, S.A.
Rating report per 05/27/2019
27034/RB/1.0/1/20190527 © GBB-Rating / confidential Page 7/16
Interim Results* (EUR m) Q1 2019 Q4 2018 Q1 2018
Net interest income 8,682 9,061 8,454
Net fee income 2,931 2,956 2,955
Total income 12,085 12,542 12,151
Operating expenses -5,758 -5,936 -5,764
Net operating income 6,327 6,606 6,387
Net loan-loss provisions -2,172 -2,455 -2,282
Underlying profit before tax 3,684 3,546 3,689
Underlying profit from continuing operations 2,358 2,369 2,409
Attributable profit to the parent 1,840 2,068 2,054
* Based on Santander's interim accounts without GBB-Rating adjustments
In consequence of the lower attributable profit, the Group's RoTE dropped by 0.8 percentage points
to 11.3 % compared to Q4 2018 but remains on a high level. The cost-to-income ratio maintains a
comparatively low level (47.6 % in Q1 2019).
Adequate sustained capital position
As of 31 March 2019, Santander's CET1 ratio stood at 11.3 %, both on a phased-in and on a fully-
loaded basis; the leverage ratio was 5.1 %. The Group targets a CET 1 capital ratio (fully-loaded)
between 11 % and 12 % in the medium term. On a fully-loaded basis, total capital increased to EUR
90.0 billion in Q1 2019 (compared to EUR 87.5 billion as of 31 December 2018). The Group applies
the transitional arrangements of IFRS 9 according to Article 473a of the CRR, mitigating the impact
of the new impairment regime. According to Santander, the fully loaded CET1 ratio would decrease
to 11.0 % with full implementation of IFRS 9 (as of March 2019).
Santander's capital ratios clearly exceed the regulatory minimum requirements of 13.2 % for the total
capital ratio and 9.7 % for the CET 1 capital ratio (as of March 2019), with a Pillar 2 requirement of
1.5 % and a combined buffer requirement of 3.7 %. In Q1 2019, the buffer to the Maximum
Distributable Amount (MDA) was 1.6 percentage points and therefore quite comfortable.
Selected data: Capital structure (EUR m) 03/31/2019 Phased-in
03/31/2019 Fully-loaded
12/31/2018 Phased-in
12/31/2018 Fully-loaded
Common equity tier 1 capital 68,230 68,230 67,962 66,904
Tier 1 capital 77,705 75,826 77,716 75,838
Total capital 90,141 89,983 88,725 87,506
Risk-weighted assets 606,300 606,300 592,319 592,319
CET1 capital ratio 11.25 % 11.25 % 11.47 % 11.30 %
Tier 1 capital ratio 13.05 % 12.91 % 13.12 % 12.80 %
Total capital ratio 14.87 % 14.84 % 14.98 % 14.77 %
Compared to its peers, Santander's capital ratios are on a comparatively low level. This is also
reflected in the results of the "2018 EU-wide Stress Test" which ranks Santander's fully-loaded CET1

Banco Santander, S.A.
Rating report per 05/27/2019
27034/RB/1.0/1/20190527 © GBB-Rating / confidential Page 8/16
capital ratio lower than those of all other 47 participants. However, the stress test indicated that the
adverse scenario resulted in one of the exercise's most contained negative impacts on the fully-
loaded CET1 capital ratio between 2017 and 2020, reflecting the Group's sound risk profile.
Santander was also one of few participants that were able to generate a cumulative profit in a three-
year adverse scenario.
MREL/TLAC
In recent years, Santander's funding plan has focused on MREL/TLAC eligible instruments as part
of the resolution strategy. Since the TLAC requirement is requested at each resolution entity,
Santander's operating model of legally independent subsidiaries renders multiple points of entry. In
consideration of Santander's minimum TLAC requirement of 16.0 % of resolution group RWAs, the
G-SIB buffer (1.0 %) and the capital conversation buffer (2.5 %), the Group's TLAC requirement is
19.5 % of RWA as of January 2019.
Santander received formal notification of the MREL requirement in May 2018 for the Banco
Santander S.A. Resolution Group at a sub-consolidated level; the minimum required eligible liabilities
were set at EUR 114.5 billion, representing 24.35 % of the Resolution Group’s risk-weighted assets.
These current requirements are met by Santander.
In order to comply with the TLAC/MREL requirements, on a Euro-basis, the Group issued EUR 13.5
billion of eligible instruments (2017: EUR 19.8 billion). This issue volume is dominated by senior non-
preferred and other senior debt (EUR 10.3 billion). In Q1 2019, Santander issued TLAC eligible
preferred debt in the amount of EUR 1.1 billion.
Strong capitalization potential
In light of Santander's strong earnings position, the Group has a strong and sustainable internal
financing capacity. Since 2009, the Group's net operating income never fell below EUR 20 billion,
illustrating the sustainability of the bank's profits and its relatively low susceptibility to earnings
volatility.
Santander's ability to strengthen its capital resources by way of capital market issues is assessed
as strong (see "sustained capital position"). In order to strengthen AT1 capital, the bank recently
issued CoCo bonds (February 2019: USD 1.2 billion; March 2018: EUR 1.5 billion).
By market capitalization, Banco Santander is the largest bank in the Eurozone, although the bank's
share price fell by more than 27 % in 2018 (market capitalization: EUR 64.5 billion as of 31 December
2018; 2017: EUR 88.4 billion). The decline was in line with the poor general market trend in 2018.
At the end of 2018, Santander had about 4.1 million shareholders. Institutional investors held about
59 % (2017: 61 %) of the share capital; nearly 40 % (2017: 38 %) of Santander's share capital were
in the hands of retail investors. The majority of the share capital (> 75 %) is located within Europe.
As in previous years, no shareholder (with the exception of custodians) had an ownership interest
greater than 3 %. Due to the diversified ownership structure, a shareholder's support in case of need
is considered unlikely.
Banco Santander, S.A.
Rating report per 05/27/2019
27034/RB/1.0/1/20190527 © GBB-Rating / confidential Page 9/16
Risk profile
Credit and counterparty risk
The main geographical markets in terms of total lending are Spain, the UK, Brazil and the United
States. More than half of the lending volume accounts for secured loans (e. g. mortgage loans).
Over the past few years, the credit quality improved to a significant extent as reflected in the steady
decline of the NPL ratio in most markets. As of Q1 2019, the overall NPL ratio amounted to 3.6 %
(Q1 2018: 4.0 %). In the same period, the volume of non-performing loans fell by 4.9 % to EUR 35.6
billion. In line with the overall trend, the NPL ratio continuously decreased in Continental Europe in
recent years (Q1 2019: 5.2 %; Q1 2018: 5.8 %). However, it remains elevated in Spain (Q1 2019:
6.2 %; Q1 2018: 6.3 %) due to the acquisition of Banco Popular in 2017 and despite the sale of
Banco Popular's real estate business; excluding Popular's portfolio, the NPL ratio stood at just 4.7 %
at the end of 2017. In the UK, the NPL ratio remains on a considerably lower level (Q1 2019: 1.1 %).
Until now, negative impacts on the NPL of the impending Brexit have not been discernible. In the
United States, the NPL ratio stayed on an acceptable level (Q1 2019: 2.4 %; Q1 2018: 2.9 %). In
Brazil, which is the Group's key market in Latin America, the NPL ratio remains high (Q1 2019: 5.3 %,
at previous year's level). The same applies to the cost of credit which dropped to 3.9 % in Q1 2019
(Q1 2018: 4.4 %), but remains high compared to the Group level.
As to the coverage ratio, there was a downward trend in Continental Europe over the past years (Q1
2019: 52.1 %; 2015: 64.2 %), whereas it increased in Latin America (Q1 2019: 97.7 %). In the USA,
the ratio remained well above 100 %. In Spain and in the UK, the coverage ratio remains low (44.1 %
and 31.0 %, respectively) as a result of the dominant mortgage portfolios. In this context, it should
be noted that more than 80 % of the residential mortgage portfolio in Spain has an LTV below 80 %;
in the UK, the average LTV is about 40 %.
In view of the bank's progress in credit risk mitigation, GBB-Rating evaluates the risk management
and risk monitoring systems to be appropriate and effective. Nevertheless, it remains to be monitored
how a possible economic downturn may effect credit quality.
Market risk
The Group faces limited interest and exchange rate risks arising from the banking book; market risks
resulting from trading activities are of minor importance.
In line with the BCBS standards for Interest Rate Risks in the Banking Book (IRRBB), Santander
conducts six interest rate scenarios, measuring the interest rate risk on both economic values (EVE)
and earnings (NII). As in the previous year, a parallel downward shock would have the most severe
impact on the change in economic value of equity (EUR 8.0 billion as of 31 December 2018);
however, the "early warning signal" according to the IRRBB guidelines released by EBA (threshold:
decline in economic value greater than 15 % of Tier 1 capital) is not exceeded.
A rise in interest rates would have opposite effects in the Group's core markets: in Europe and in the
USA, where interest rates are at a very low level, a rise in interest rates would positively affect net
interest income and the economic value of equity; in Latin America, earnings and economic values
would decrease.
Banco Santander, S.A.
Rating report per 05/27/2019
27034/RB/1.0/1/20190527 © GBB-Rating / confidential Page 10/16
Since the structural VaR was considerably higher than the trading risk VaR (EUR 568.5 million vs
EUR 9.7 million as of 31 December 2018), the main drivers for market risks derive from the banking
book. Regarding Santander's capital base and its profitability, market risks are deemed manageable.
Funding and liquidity
The majority of Santander's total assets account for net loans to customers with a long-term maturity;
the Group's funding is based on predominantly short-term customer deposits and, to a lesser extent,
medium- and long-term financial instruments. Due to the high extent of retail and commercial
banking, the Group has a sufficiently large and stable base of customer deposits.
As of 31 December 2018, the LTD ratio was at 113 % (2017: 109 %; target: below 120 %), well in
line with the European average1.
The regulatory liquidity ratios indicate a comfortable liquidity position. As of end-2018, the Group's
LCR stood at 158 % and the NSFR was at 114 %. In all legal entities, both ratios were above 100 %.
In view of the sound balance sheet structure, the diversified funding structure and the robust liquidity
ratios, the Group has in place a sound and effective liquidity risk mitigation.
Operational and legal risks
The provisions for customer remediation account for 12 % of total provisions for taxes and other
legal contingencies and mainly include the estimated redress payments relating to the sale of
Payment Protection Insurance (PPI) policies in the UK. The deadline for PPI complaints is 29 August
2019. With respect to the mis-selling of PPI, Santander UK plc raised provisions of EUR 275 million
for PPI and EUR 406 million for related costs.
Provisions for employment-related proceedings in Brazil amount to EUR 859 million at year-end
2018. These legal proceedings have been mainly initiated by trade unions, associations and former
employees to claim overtime pay, retirement benefits and compensation associated with other
employment rights. Such proceedings are common practice in Brazil, and provisions are similarly
high as in previous years.
Further legal risks may arise from the acquisition of Banco Popular, which had concluded a high
number of transactions with floor clauses ("Clausula Suelo"). In the past years, resulting from several
rulings of the EU Court of Justice and of Spanish courts, borrowers have been able to lodge
complaints for overpaid amounts due to the floor clauses. Provisions used for refunds in 2017 and
2018 amounted to EUR 357 million. As of end-2018, provisions amount to EUR 104 million.
As the successor entity to Banco Popular, Santander is exposed to legal risks resulting from claims
of investors of Banco Popular against the EU’s Single Resolution Board (SRB) decision (resolution
of Banco Popular, redemption and conversion of capital instruments). Santander estimates
compensation payments to shareholders at EUR 680 million.
1 According to EBA, the EU average for the LTD ratio for households and non-financial corporations was 117 % (Dec. 18)

Banco Santander, S.A.
Rating report per 05/27/2019
27034/RB/1.0/1/20190527 © GBB-Rating / confidential Page 11/16
In 2018, about 60 % of net losses resulting from operational risks refer to the risk category "practices
with customers, products and business practices", which include customer complaints for improper
marketing and inaccurate information on products. In addition, external fraud, in particular the
fraudulent use of debit and credit cards and incidents related to the execution, delivery and process
management are of relevance. By geographical distribution Brazil accounts for 45 % of net losses,
employee litigation not included.

Banco Santander, S.A.
Rating report per 05/27/2019
27034/RB/1.0/1/20190527 © GBB-Rating / confidential Page 12/16
Appendix
Assets – selected data (EUR m) 12/31/2018 12/31/2017 12/31/2016
Cash and cash balances at central banks 113,663 110,995 76,454
Financial assets held for trading 92,879 125,458 148,187
Financial assets at fair value through profit or loss 68,190 34,782 31,609
Financial assets at fair value through other comprehensive income
121,091
Financial assets available-for-sale 133,271 116,774
Financial assets at amortized cost 946,099
Loans and receivables 903,013 840,004
Investments held-to-maturity 13,491 14,468
Hedging derivatives 8,607 8,537 10,377
Fair value changes of the hedged items in portfolio 1,088 1,287 1,481
Investments accounted at equity / in associates 7,588 6,184 4,836
Intangible assets 3,094 2,914 2,697
Goodwill 25,466 25,769 26,724
Tangible assets 26,157 22,974 23,286
Assets held for sale 5,426 15,280 5,772
Tax assets 30,251 30,243 27,678
Other assets 9,672 10,107 8,778
Total assets 1,459,271 1,444,305 1,339,125
Liabilities – selected data (EUR m) 12/31/2018 12/31/2017 12/31/2016
Financial liabilities held for trading 70,343 107,624 108,765
Financial liabilities designated at fair value through profit or loss
68,058 59,616 40,263
Financial liabilities at amortized cost 1,171,630 1,126,069 1,044,240
Hedging derivatives 6,363 8,044 8,156
Fair value changes of the hedged items in portfolio 303 330 448
Provisions 13,225 14,489 14,459
Tax liabilities 8,135 7,592 8,373
Other liabilities 13,853 13,708 11,722
Equity 107,361 106,833 102,699
Total liabilities and equity 1,459,271 1,444,305 1,339,125
Banco Santander, S.A.
Rating report per 05/27/2019
27034/RB/1.0/1/20190527 © GBB-Rating / confidential Page 13/16
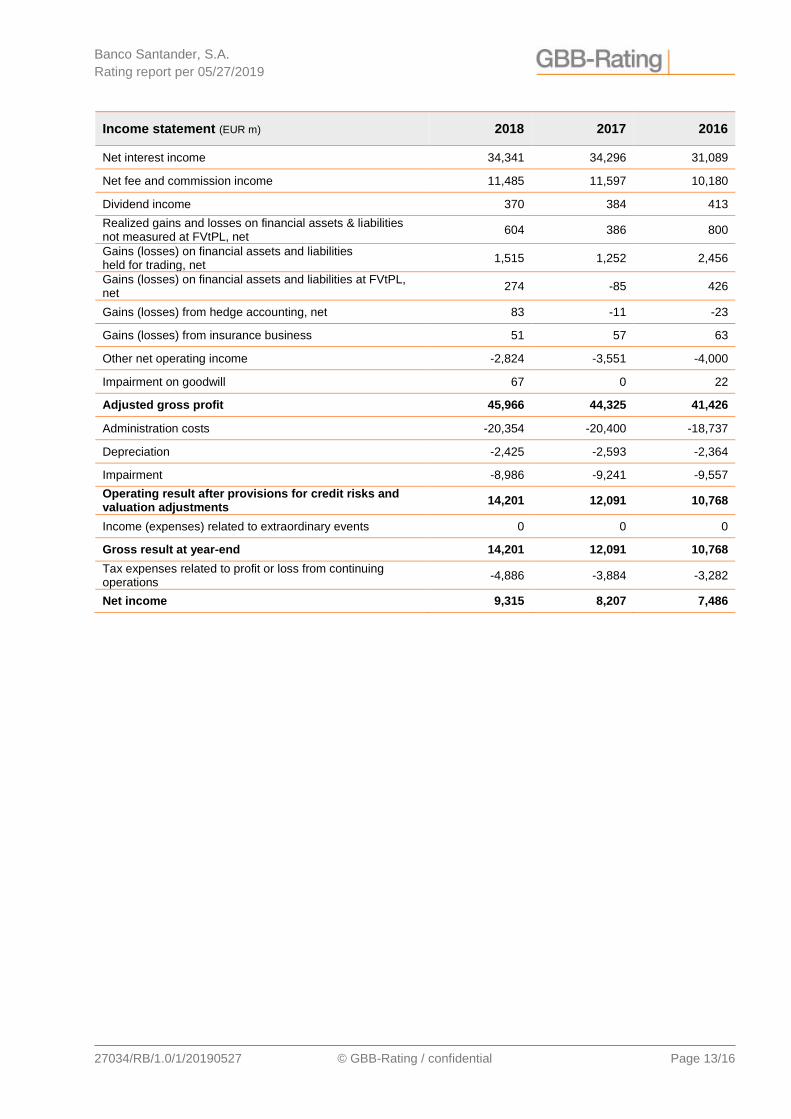
Income statement (EUR m) 2018 2017 2016
Net interest income 34,341 34,296 31,089
Net fee and commission income 11,485 11,597 10,180
Dividend income 370 384 413
Realized gains and losses on financial assets & liabilities not measured at FVtPL, net
604 386 800
Gains (losses) on financial assets and liabilities held for trading, net
1,515 1,252 2,456
Gains (losses) on financial assets and liabilities at FVtPL, net
274 -85 426
Gains (losses) from hedge accounting, net 83 -11 -23
Gains (losses) from insurance business 51 57 63
Other net operating income -2,824 -3,551 -4,000
Impairment on goodwill 67 0 22
Adjusted gross profit 45,966 44,325 41,426
Administration costs -20,354 -20,400 -18,737
Depreciation -2,425 -2,593 -2,364
Impairment -8,986 -9,241 -9,557
Operating result after provisions for credit risks and valuation adjustments
14,201 12,091 10,768
Income (expenses) related to extraordinary events 0 0 0
Gross result at year-end 14,201 12,091 10,768
Tax expenses related to profit or loss from continuing operations
-4,886 -3,884 -3,282
Net income 9,315 8,207 7,486

Banco Santander, S.A.
Rating report per 05/27/2019
27034/RB/1.0/1/20190527 © GBB-Rating / confidential Page 14/16
Credit and Counterparty risk cluster 2018 2017 2016
Gross profitability 1 Adjusted gross profit / Average Total assets
3.2 % 3.2 % 3.1 %
Gross profitability 2 Net interest income and net credit risk provisions / Average risk-weighted exposure amounts 1)
5.0 % 4.8 % 4.4 %
Net profitability 1 Operating result after provisions for credit and valuation adjustments / Average total risk exposure amount
2.4 % 2.0 % 1.9 %
Net profitability 2 Gross annual profit / Average adjusted total assets 2)
0.9 % 0.8 % 0.8 %
Return on equity 1 Operating result after provisions for credit risks and valuation adjustments / Average total capital
13.3 % 11.5 % 10.7 %
Return on equity 2 Gross annual profit / Average total capital
13.3 % 11.5 % 10.7 %
Cost income ratio 1 Administration costs and provisions for credit risks / Gross profit
66.4 % 67.8 % 69.4 %
Cost income ratio 2 Administration costs / Adjusted gross profit
49.6 % 51.9 % 50.9 %
Financial data (EUR m) 12/31/2018 12/31/2017 12/31/2016
Net interest income 34,341 34,296 31,089
Net interest income and net provisions for credit risks 25,355 25,055 21,532
Gross profit 47,845 47,575 44,178
Adjusted gross profit 45,966 44,325 41,426
Administration costs -22,779 -22,993 -21,101
Administration costs and provisions for credit risks -31,765 -32,234 -30,658
Operating result after provisions for credit risks and valuation adjustments
14,201 12,091 10,768
Gross annual profit 14,201 12,091 10,768
Average risk-weighted exposure amounts1) 509,390 525,926 493,548
Average total risk exposure amount 593,822 613,714 581,748
Average total assets 1,451,788 1,391,715 1,339,693
Average adjusted total assets2) 1,616,153 1,463,661 1,407,942
Average total capital 107,097 104,766 100,726
1) Risk weighted exposure amount for credit, counterparty credit and dilution risks and free deliveries 2) Comprises on-balance sheet total assets, contingent liabilities and loan-loss allowances

Banco Santander, S.A.
Rating report per 05/27/2019
27034/RB/1.0/1/20190527 © GBB-Rating / confidential Page 15/16
Indicators of sustained capital position 12/31/2018 12/31/2017 12/31/2016
Total capital ratio Own funds / Total risk exposure amount
15.0% 15.0% 14.7%
Tier 1 capital ratio Tier 1 capital / Total risk exposure amount
13.1% 12.8% 12.5%
Common equity Tier 1 ratio Common equity tier 1 capital / Total risk exposure amount
11.5% 12.3% 12.5%
Financial data (EUR m) 12/31/2018 12/31/2017 12/31/2016
Own funds 88,725 90,706 86,337
Tier 1 capital 77,716 77,283 73,709
Common equity Tier 1 capital 67,962 74,173 73,709
Total risk exposure amount 592,319 605,064 588,088

Banco Santander, S.A.
Rating report per 05/27/2019
27034/RB/1.0/1/20190527 © GBB-Rating / confidential Page 16/16
Regulatory disclosure requirements
Name and function of the analysts:
Daniel Sebastian Bittner, Lead Rating Analyst GBB-Rating, Cologne Angelika Komenda, Rating Analyst GBB-Rating, Cologne
Company address:
GBB-Rating Gesellschaft für Bonitätsbeurteilung mbH, Kattenbug 1, 50667 Cologne
Members of the Rating Committee:
Stefan Koll, Manager GBB-Rating, Cologne Christina Weymann, Senior Manager GBB-Rating, Cologne Volker Jindra, Senior Manager GBB-Rating, Cologne
Date Rating Commitee Notification Issue
First rating 12/19/2013 12/20/2013 02/26/2014 Current rating 05/27/2019 05/27/2019
Validity:
Rating: 12 months Outlook: 24 months
Subsequent rating changes after notification to client:
Major sources of information for the rating:
Annual report as at 12/31/2018 Quarterly Report Q1 2019 Conference calls Further disclosures and company specific information
Statement about the quality of information available (including potential restrictions):
The quality and extent of information (interviews and documents) were suitable to obtain a comprehensive picture of the bank and to assign an objective, transparent and professional credit rating
Applicable rating methodology, rating type and release:
Solicited rating Methodology for Rating 3.0.03 Banks – credit and counterparty credit risk (CCR) www.gbb-rating.eu/de/presse/eu-veroeffentlichungen/Seiten/default.aspx
Meaning of the rating category:
www.gbb-rating.eu/en/ratings/ratingskala/Pages/default.aspx
Business relationship:
Besides the rating mandate there are further business relationships within the group
Legal remarks
GBB-Rating Gesellschaft für Bonitätsbeurteilung mbH does not make any guarantees regarding the accuracy, completeness or timeliness
of the present rating or the data, values and other information presented (including ERI) or the eligibility of this information for specific
purposes nor for losses arising from the use of the information or in confidence in the information. The current rating report is not an
investment recommendation.
Future events are uncertain. Ratings are based on predictions of these and thus inevitably rely upon estimates. Therefore they solely
represent statements of opinion rather than statements of fact or investment advice.
Credit ratings are performed with proficiency and due professional care. Ratings are based on the data and
information provided by the applicant. This information is used in reaching an opinion about the future viability as
well as the strengths and weaknesses of the rated company as of the date of rating issuance.
GBB-Rating puts focus on sustainability and is a signatory of the UN Global Compact since 2018. We
support the 10 principles of the UN Global Compact relating to human rights, labor standards, the
environment and anti-corruption.