Presentación de PowerPoint · Helping people and businesses prosper 2 Banco Santander, S.A....
23
Rami Aboukhair Country Head Spain
Transcript of Presentación de PowerPoint · Helping people and businesses prosper 2 Banco Santander, S.A....
Rami Aboukhair
Country Head Spain
2 Helping people and businesses prosper
Banco Santander, S.A. ("Santander"), Santander UK Group Holdings (“Santander UK”) and Banco Santander (Brasil) S.A. (“Santander Brasil”) all caution that this presentation and
other written or oral statements made from time to time by Santander, Santander UK and Santander Brasil contain forward-looking statements. These forward-looking statements are
found in various places throughout this presentation and include, without limitation, statements concerning our future business development and economic performance. While these
forward-looking statements represent our judgment and future expectations concerning the development of our business, a number of risks, uncertainties and other important factors
could cause actual developments and results to differ materially from our expectations. These factors include, but are not limited to: (1) general market, macro-economic,
governmental, political and regulatory trends; (2) movements in local and international securities markets, currency exchange rates and interest rates; (3) competitive pressures; (4)
technological developments; (5) transaction, commercial and operating factors; and (6) changes in the financial position or credit worthiness of our customers, obligors and
counterparties. The risk factors that we have indicated in our past and future filings and reports, including those with the Securities and Exchange Commission of the United States of
America (the “SEC”) could adversely affect our business and financial performance and should be considered in evaluating any forward-looking statements contained herein. Other
unknown or unpredictable factors could cause actual results to differ materially from those in the forward-looking statements.
Forward-looking statements speak only as of the date on which they are made and are based on the knowledge, information available and views taken on the date on which they are
made; such knowledge, information and views may change at any time. These statements are only predictions and are not guarantees of future performance, results, actions or
events. Santander, Santander UK and Santander Brasil do not undertake any obligation to update or revise any forward-looking statement, whether as a result of new information,
future events or otherwise.
The information contained in this presentation is subject to, and must be read in conjunction with, all other publicly available information, including, where relevant, any fuller
disclosure document published by Santander, Santander UK nor Santander Brasil. Any person at any time acquiring securities must do so only on the basis of such person's own
judgment as to the merits or the suitability of the securities for its purpose and only on such information as is contained in such public information having taken all such professional
or other advice as it considers necessary or appropriate in the circumstances and not in reliance on the information contained in the presentation. In making this presentation
available, Santander, Santander UK and Santander Brasil are not giving advice nor making any recommendation to buy, sell or otherwise deal in shares in Santander or in any other
securities or investments whatsoever.
Neither this presentation nor any of the information contained therein constitutes an offer to sell or the solicitation of an offer to buy any securities. No offering of securities shall be
made in the United States except pursuant to registration under the U.S. Securities Act of 1933, as amended, or an exemption therefrom. Nothing contained in this presentation is
intended to constitute an invitation or inducement to engage in investment activity for the purposes of the prohibition on financial promotion in the U.K. Financial Services and
Markets Act 2000.
Note: Statements as to historical performance, share price or financial accretion are not intended to mean that future performance, share price or future earnings (including earnings
per share) for any period will necessarily match or exceed those of any prior year. Nothing in this presentation should be construed as a profit forecast.
Note: The businesses included in each of our geographical segments and the accounting principles under which their results are presented here may differ from the businesses
included in our public subsidiaries in such geographies and the accounting principles applied locally. Accordingly, the results of operations and trends shown for our geographical
segments may differ materially from those disclosed locally by such subsidiaries.
3 Helping people and businesses prosper
Content
Market and financial system 1
Update on our 2015-18 strategy 3
Strengths and opportunities 2
Looking forward and key takeaways 4
4 Helping people and businesses prosper
Market and financial system
1
5 Helping people and businesses prosper
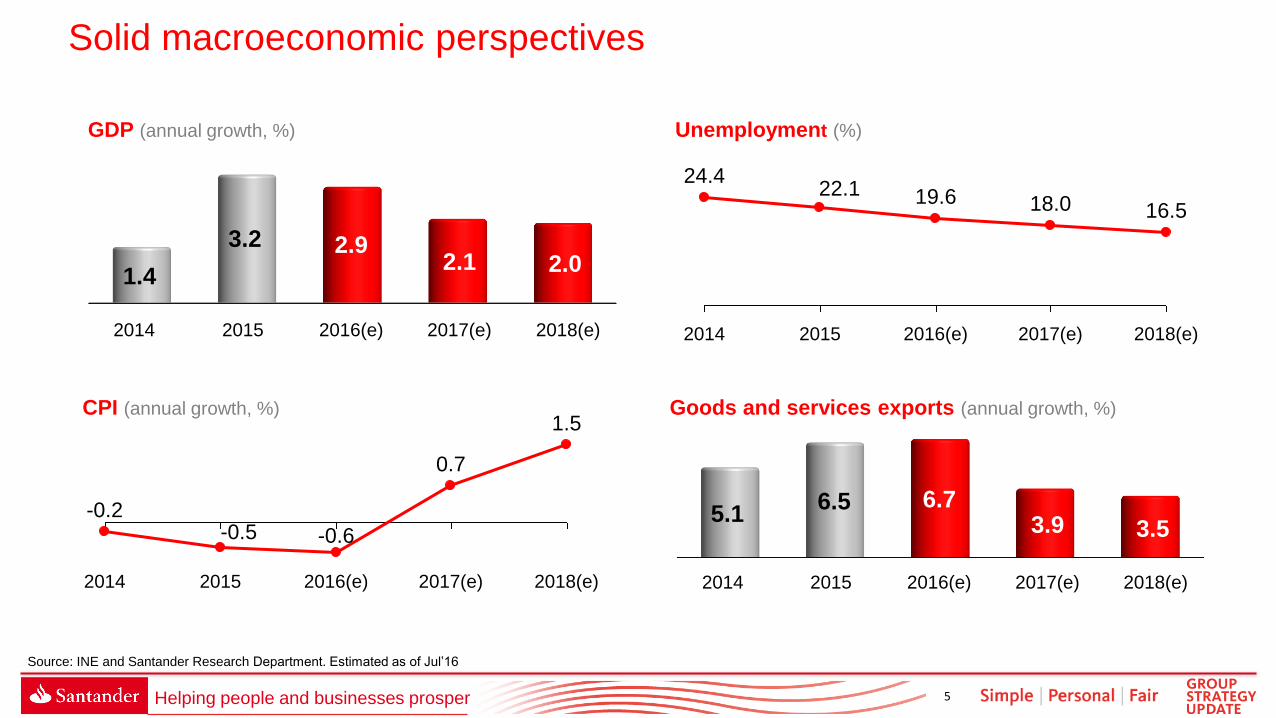
Solid macroeconomic perspectives
GDP (annual growth, %)
CPI (annual growth, %)
Unemployment (%)
Goods and services exports (annual growth, %)
3.2
2014
1.4
2.9
2015 2018(e) 2016(e) 2017(e)
2.1 2.0
2014
5.1 6.5
3.9
2016(e)
3.5
2017(e) 2018(e) 2015
6.7
2018(e)
1.5
2017(e)
0.7
2016(e)
-0.6
2015
-0.5
2014
-0.2
2018(e)
16.5
2017(e)
18.0
2016(e)
19.6
2015
22.1
2014
24.4
Source: INE and Santander Research Department. Estimated as of Jul’16
6 Helping people and businesses prosper
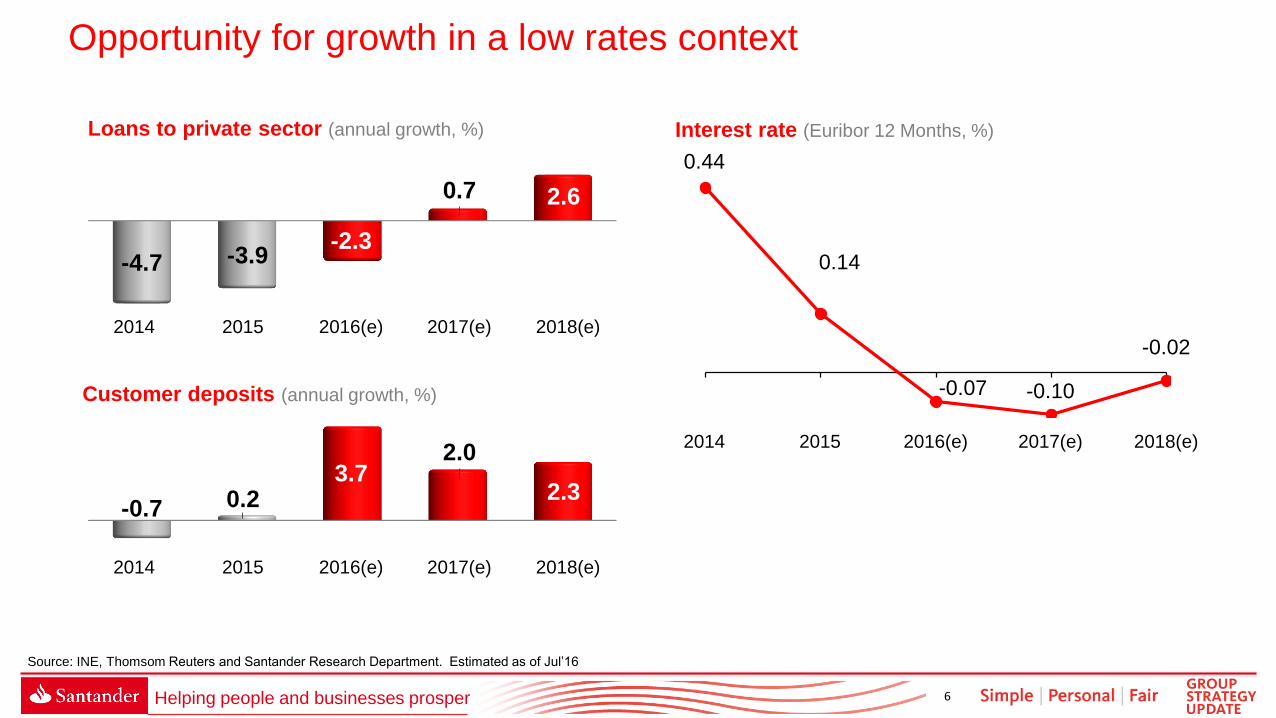
Opportunity for growth in a low rates context
Loans to private sector (annual growth, %)
Customer deposits (annual growth, %)
Interest rate (Euribor 12 Months, %)
2018(e)
2.6
2017(e)
0.7
2016(e)
-2.3
2015
-3.9
2014
-4.7
0.44
0.14
2015 2014 2016(e)
-0.07
2017(e)
-0.10
2018(e)
-0.02
2018(e)
2.3
2014 2017(e)
2.0
2016(e)
3.7
2015
0.2 -0.7
Source: INE, Thomsom Reuters and Santander Research Department. Estimated as of Jul’16
7 Helping people and businesses prosper
Strengths and opportunities
2
8 Helping people and businesses prosper
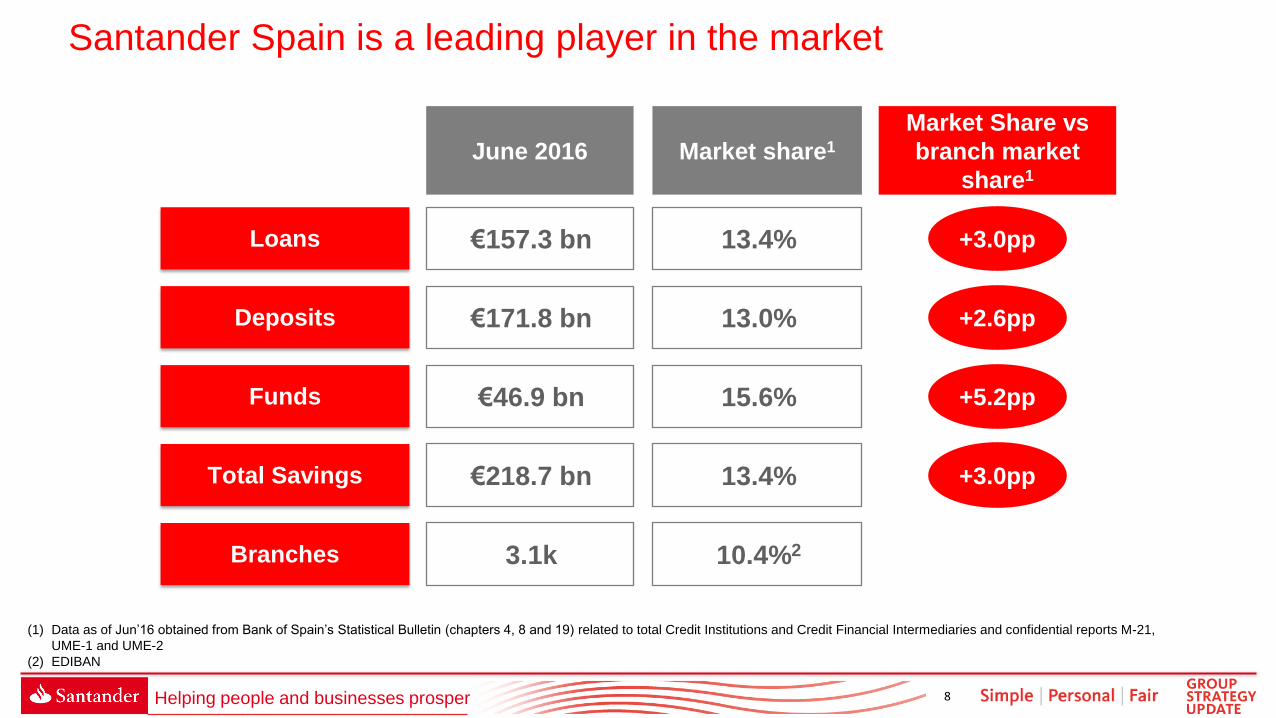
Santander Spain is a leading player in the market
(1) Data as of Jun’16 obtained from Bank of Spain’s Statistical Bulletin (chapters 4, 8 and 19) related to total Credit Institutions and Credit Financial Intermediaries and confidential reports M-21,
UME-1 and UME-2
(2) EDIBAN
Loans
Deposits
Funds
Total Savings
Market Share vs
branch market
share1
€157.3 bn
€171.8 bn
€46.9 bn
€218.7 bn
June 2016
Branches 3.1k
13.4%
13.0%
15.6%
13.4%
Market share1
10.4%2
+3.0pp
+2.6pp
+5.2pp
+3.0pp
9 Helping people and businesses prosper
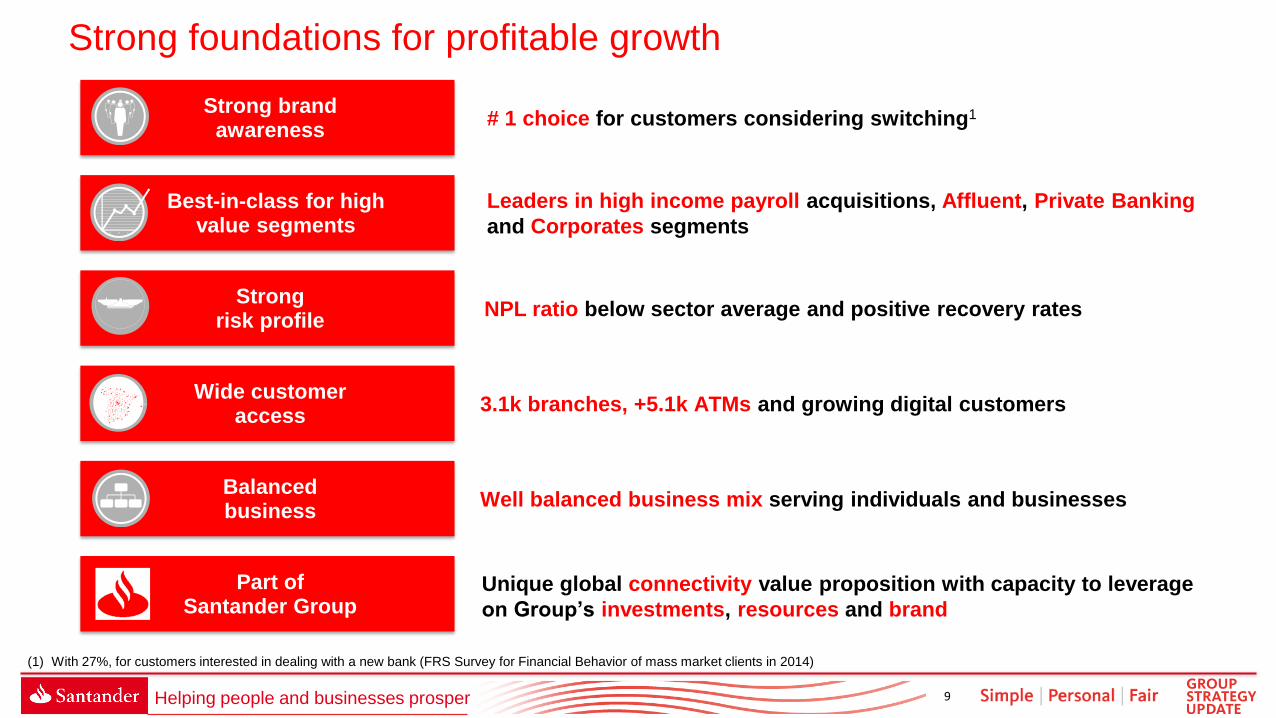
Strong foundations for profitable growth
Balanced business
Well balanced business mix serving individuals and businesses
NPL ratio below sector average and positive recovery rates Strong
risk profile
Leaders in high income payroll acquisitions, Affluent, Private Banking
and Corporates segments
Best-in-class for high value segments
# 1 choice for customers considering switching1 Strong brand
awareness
3.1k branches, +5.1k ATMs and growing digital customers Wide customer access
(1) With 27%, for customers interested in dealing with a new bank (FRS Survey for Financial Behavior of mass market clients in 2014)
Part of Santander Group
Unique global connectivity value proposition with capacity to leverage
on Group’s investments, resources and brand
10 Helping people and businesses prosper
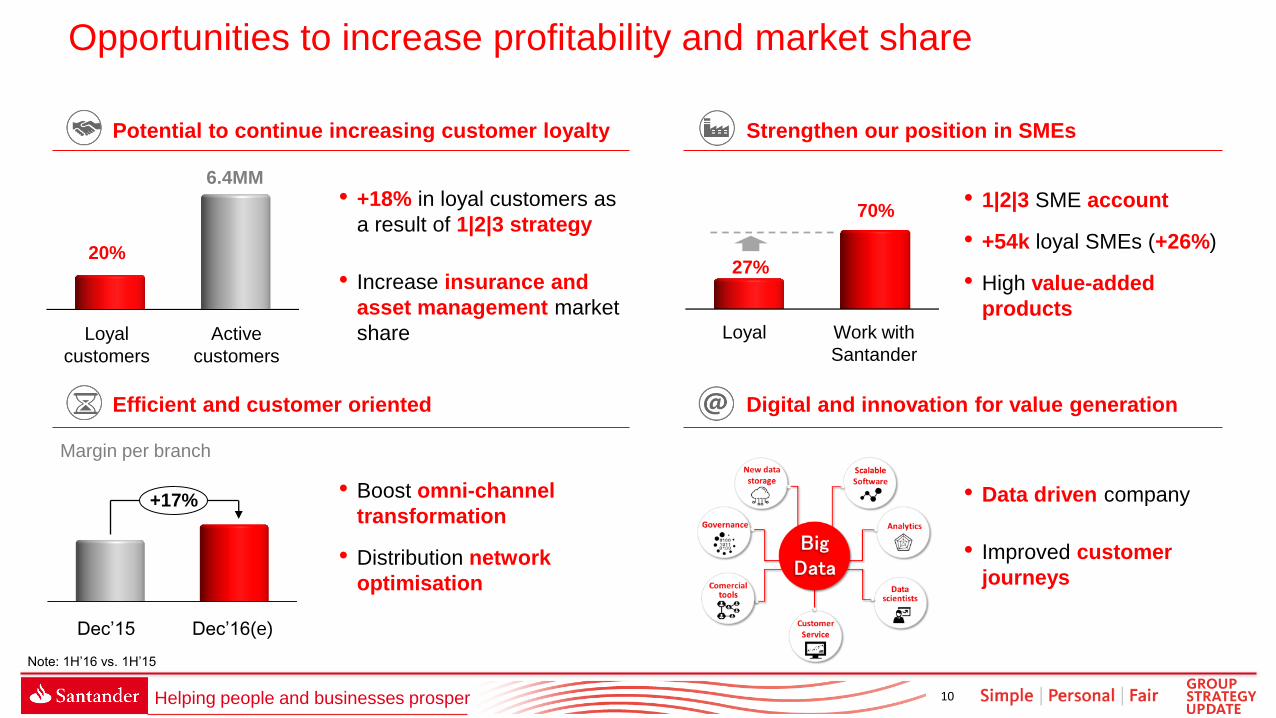
Opportunities to increase profitability and market share
Potential to continue increasing customer loyalty Strengthen our position in SMEs
Efficient and customer oriented Digital and innovation for value generation
• Boost omni-channel
transformation
• Distribution network
optimisation
• 1|2|3 SME account
• +54k loyal SMEs (+26%)
• High value-added
products
• Data driven company
• Improved customer
journeys
• +18% in loyal customers as
a result of 1|2|3 strategy
• Increase insurance and
asset management market
share
6.4MM
20%
Active
customers
Loyal
customers
Loyal Work with
Santander
27%
70%
Margin per branch
+17%
Dec’16(e) Dec’15
Note: 1H’16 vs. 1H’15
11 Helping people and businesses prosper
Update on our 2015-18
strategy
3
12 Helping people and businesses prosper
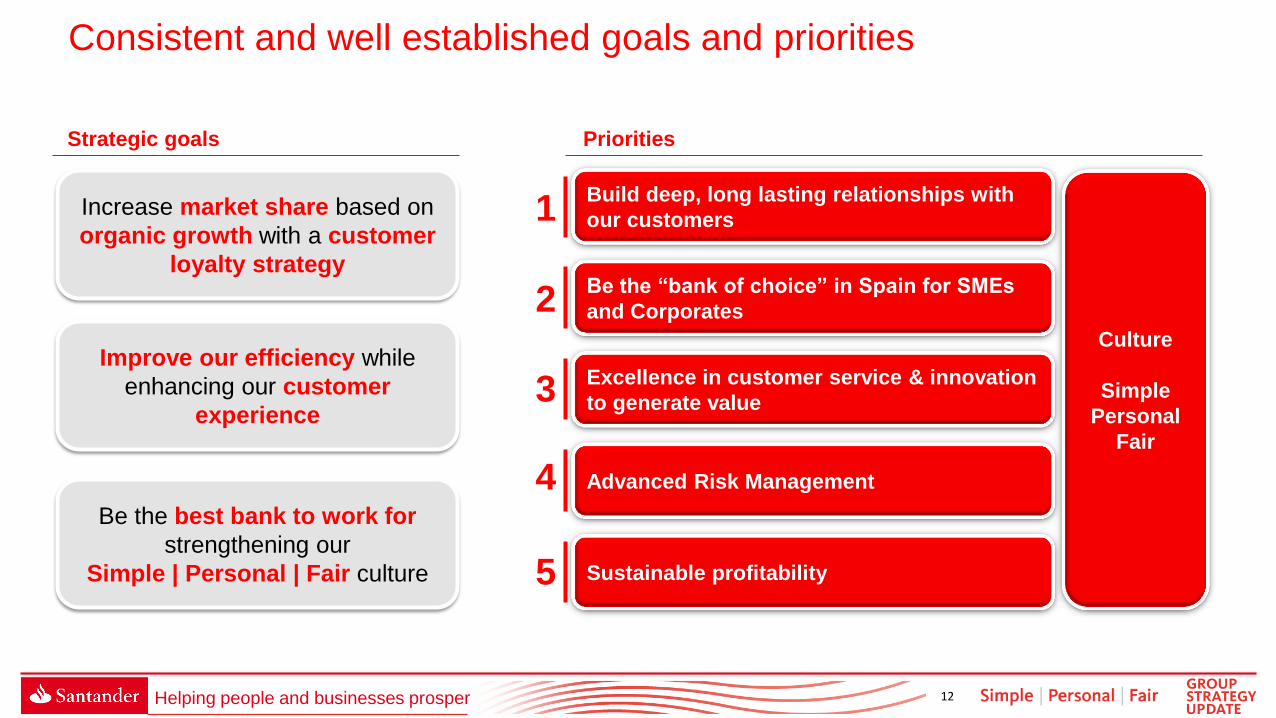
Consistent and well established goals and priorities
Increase market share based on
organic growth with a customer
loyalty strategy
Improve our efficiency while
enhancing our customer
experience
Be the best bank to work for
strengthening our
Simple | Personal | Fair culture
Culture
Simple
Personal
Fair
Build deep, long lasting relationships with
our customers 1
Be the “bank of choice” in Spain for SMEs
and Corporates 2
Excellence in customer service & innovation
to generate value 3
Advanced Risk Management 4
Sustainable profitability 5
Priorities Strategic goals
13 Helping people and businesses prosper
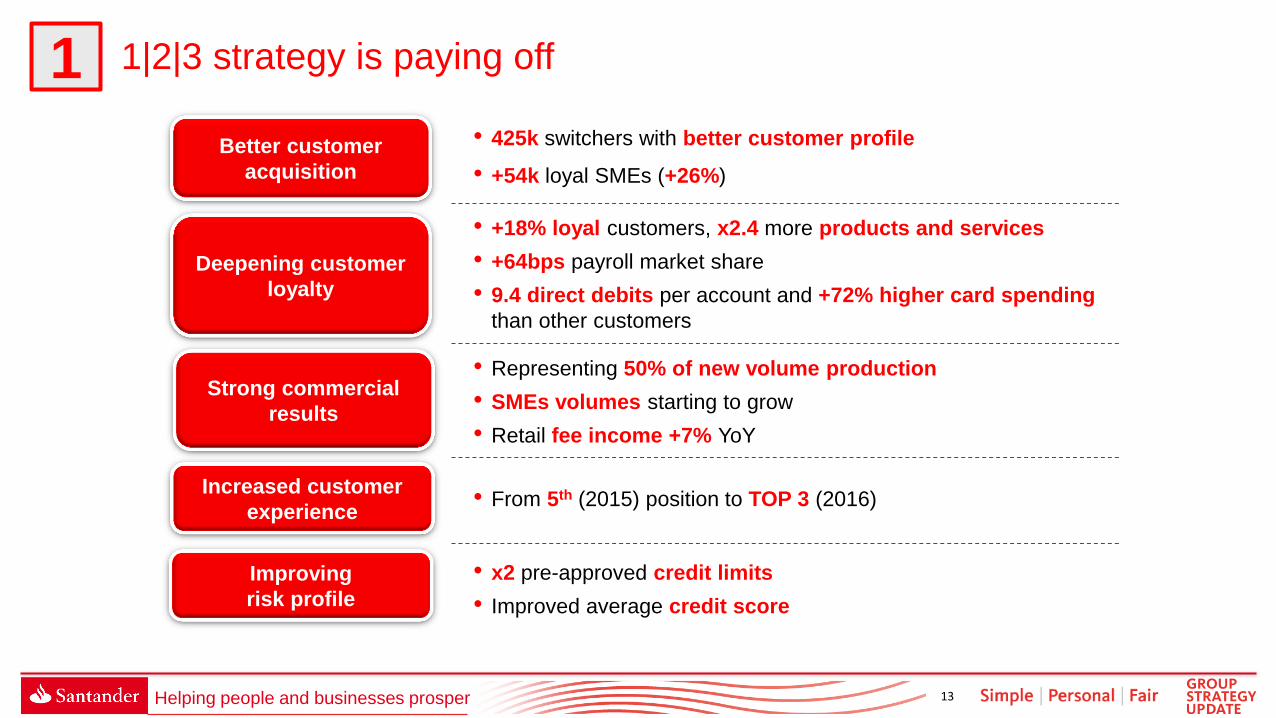
1 1|2|3 strategy is paying off
• +18% loyal customers, x2.4 more products and services
• +64bps payroll market share
• 9.4 direct debits per account and +72% higher card spending
than other customers
• 425k switchers with better customer profile
• +54k loyal SMEs (+26%)
Improving
risk profile
• x2 pre-approved credit limits
• Improved average credit score
Increased customer
experience • From 5th (2015) position to TOP 3 (2016)
• Representing 50% of new volume production
• SMEs volumes starting to grow
• Retail fee income +7% YoY
Deepening customer
loyalty
Better customer
acquisition
Strong commercial
results
14 Helping people and businesses prosper
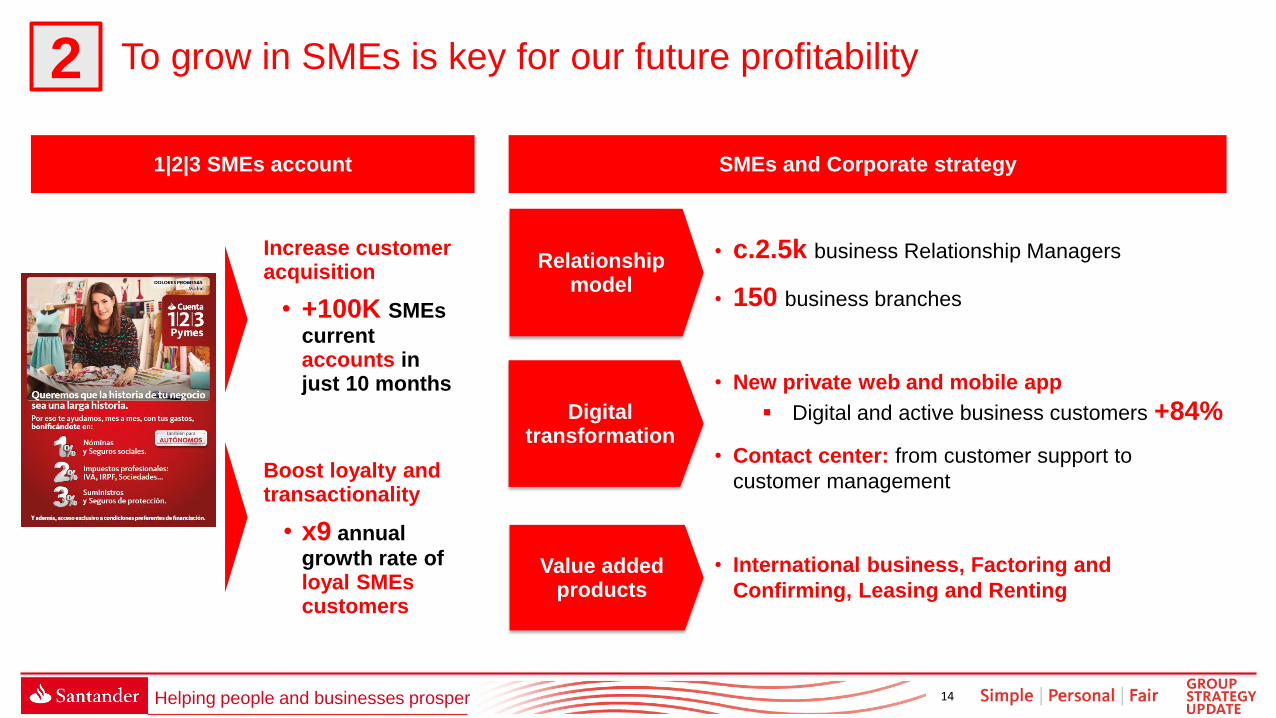
2 To grow in SMEs is key for our future profitability
1|2|3 SMEs account
• c.2.5k business Relationship Managers
• 150 business branches
• New private web and mobile app
Digital and active business customers +84%
• Contact center: from customer support to
customer management
• International business, Factoring and
Confirming, Leasing and Renting
Increase customer acquisition
• +100K SMEs
current accounts in just 10 months
Boost loyalty and transactionality
• x9 annual
growth rate of loyal SMEs customers
Relationship model
Digital transformation
Value added products
SMEs and Corporate strategy

15 Helping people and businesses prosper
1-2 Customer loyalty driving growth in lending...
UPLs new volumes Mortgages new volumes Credit Cards spend
market share International business
lending
• +300bps market share • New production pricing > stock • >65% cards from 1|2|3
customers
• +25% in international
business approved limits
1H’15 1H’16
+128%
1Q’15 1Q’16
+88bps
1H’15 1H’16
+38%
1H’15 1H’16
+10%1
(1) Data as of May ‘16
16 Helping people and businesses prosper
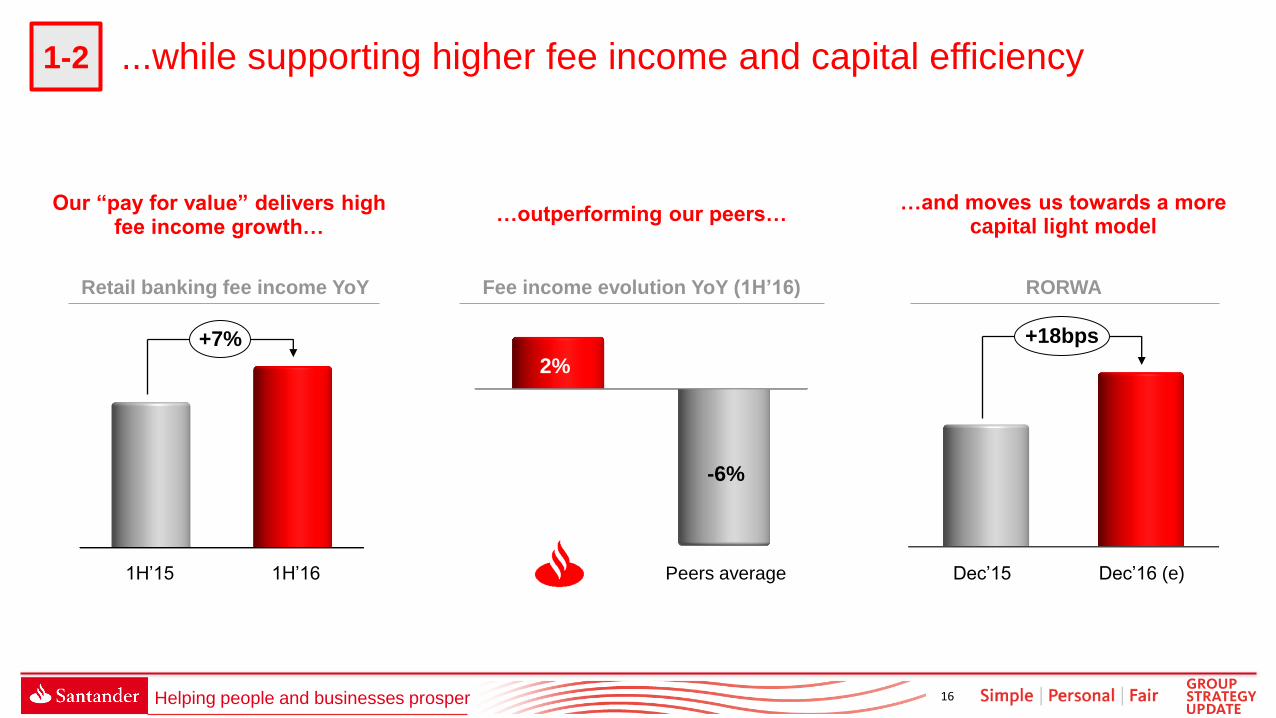
1-2 ...while supporting higher fee income and capital efficiency
…outperforming our peers…
Fee income evolution YoY (1H’16)
…and moves us towards a more capital light model
RORWA
Our “pay for value” delivers high fee income growth…
+18bps
Dec’16 (e) Dec’15
-6%
2%
Peers average 1H’15 1H’16
Retail banking fee income YoY
+7%
17 Helping people and businesses prosper
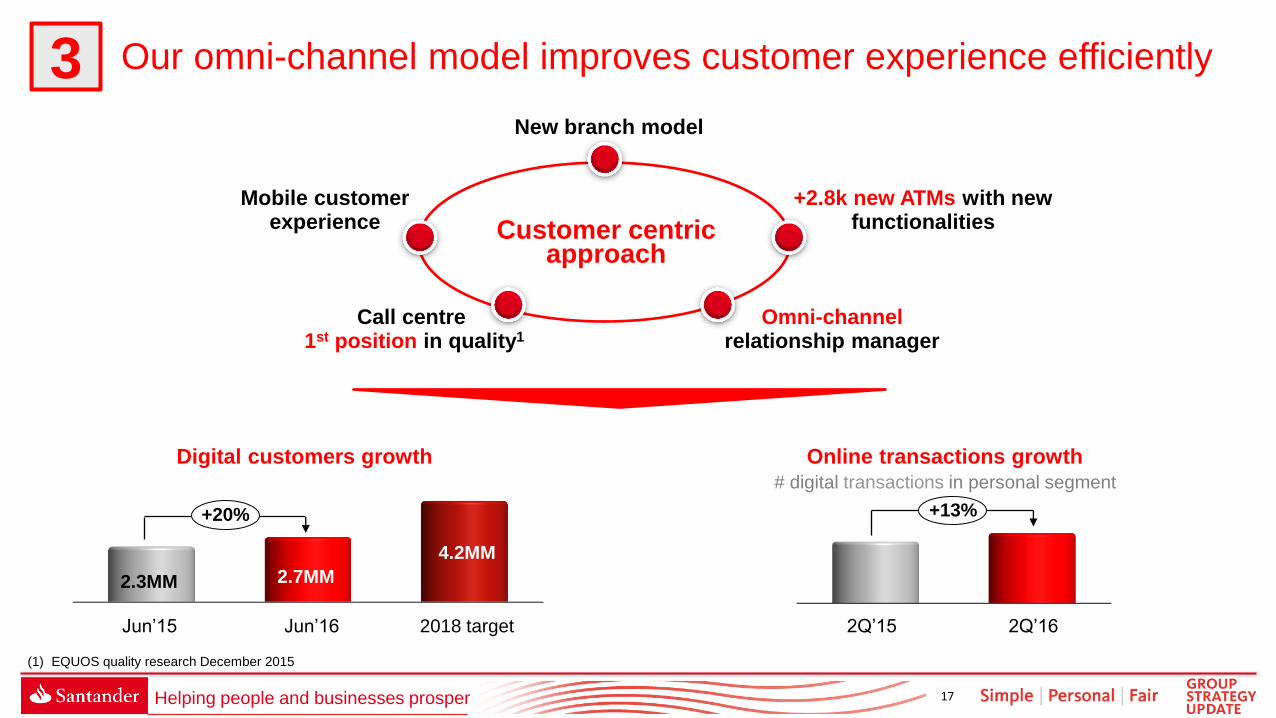
3 Our omni-channel model improves customer experience efficiently
Digital customers growth Online transactions growth
4.2MM
2018 target
+20%
Jun’16
2.7MM
Jun’15
2.3MM
+13%
2Q’16 2Q’15
# digital transactions in personal segment
Mobile customer experience
Call centre 1st position in quality1
+2.8k new ATMs with new functionalities
New branch model
Customer centric approach
Omni-channel relationship manager
(1) EQUOS quality research December 2015
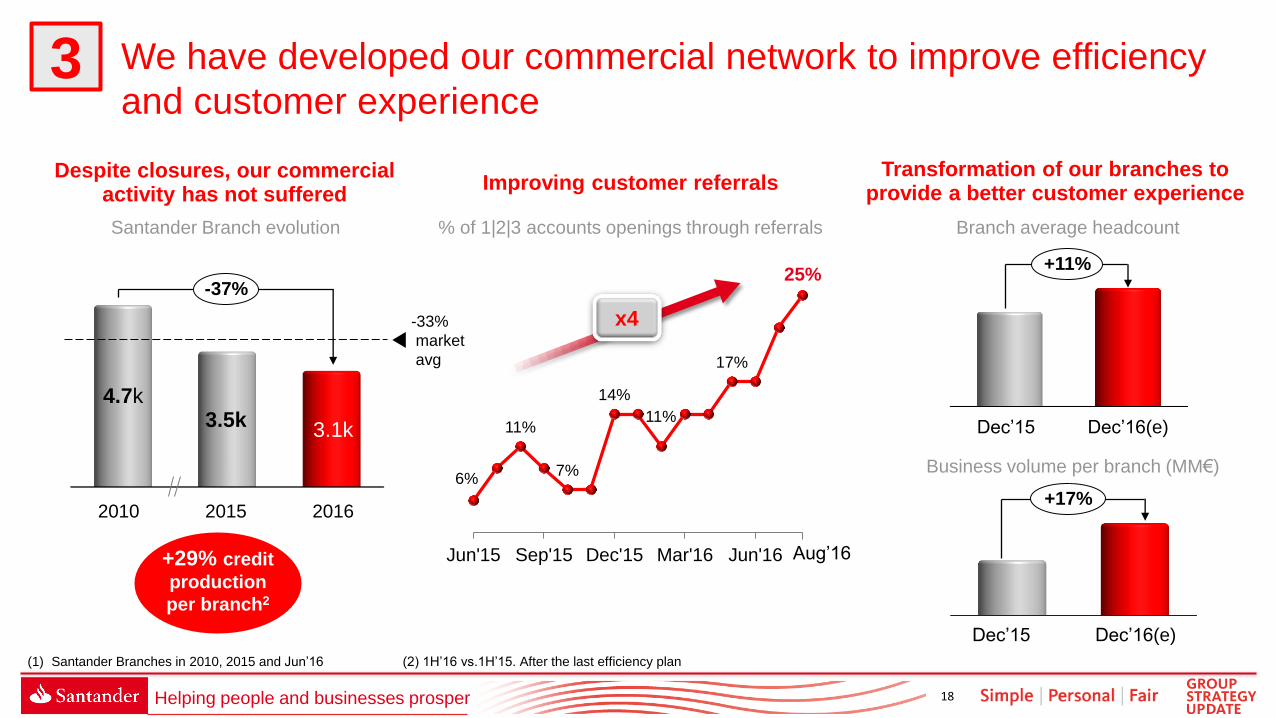
18 Helping people and businesses prosper
3
Despite closures, our commercial activity has not suffered
Transformation of our branches to provide a better customer experience
Santander Branch evolution Branch average headcount
Dec’15 Dec’16(e)
+11%
Business volume per branch (MM€)
+17%
Dec’16(e) Dec’15
Improving customer referrals
x4
6%
11%
7%
14%
11%
17%
25%
Jun'15 Sep'15 Dec'15 Mar'16 Jun'16 Aug’16
% of 1|2|3 accounts openings through referrals
We have developed our commercial network to improve efficiency
and customer experience
+29% credit
production
per branch2
(1) Santander Branches in 2010, 2015 and Jun’16 (2) 1H’16 vs.1H’15. After the last efficiency plan
2015
3.5k
2016
3.1k
-37%
2010
-33%
market
avg
4.7k
19 Helping people and businesses prosper
Looking forward and key
takeaways
4
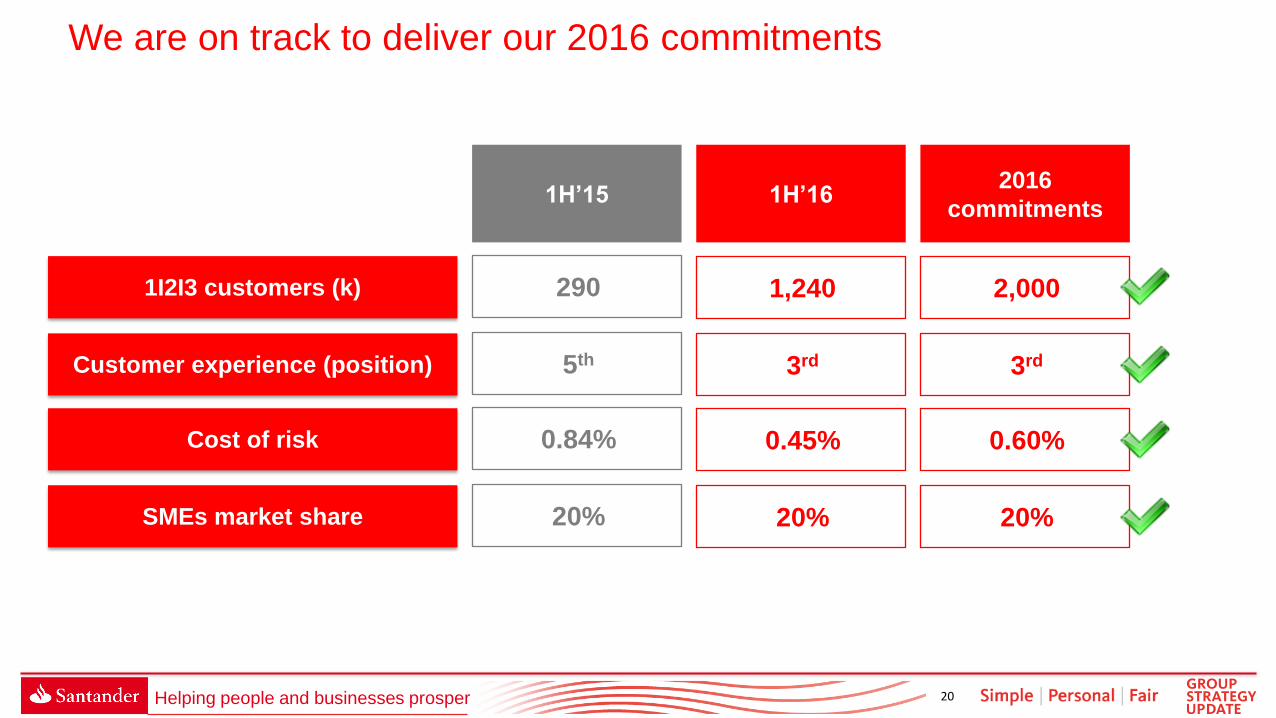
20 Helping people and businesses prosper
We are on track to deliver our 2016 commitments
1I2I3 customers (k)
Customer experience (position)
Cost of risk
1,240
3rd
0.45%
1H’16
SMEs market share 20%
2,000
3rd
0.60%
20%
2016
commitments 1H’15
290
5th
0.84%
20%
21 Helping people and businesses prosper
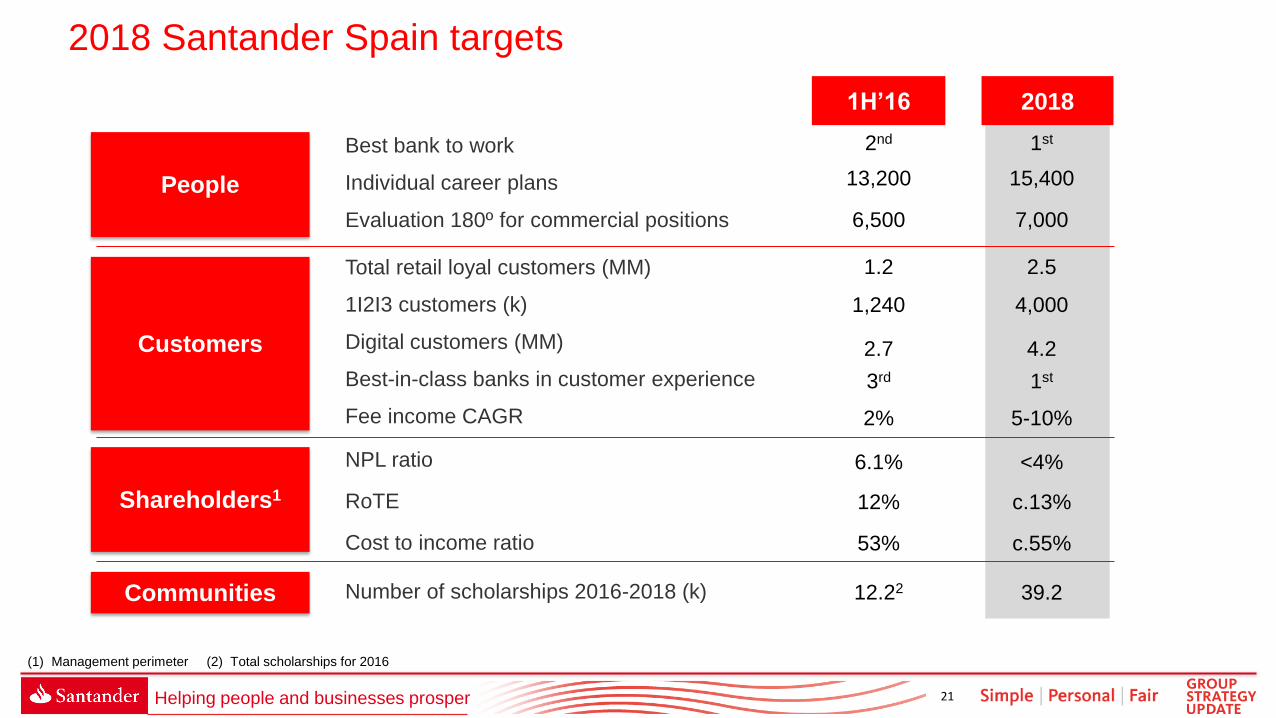
2018 Santander Spain targets
39.2
<4%
c.13%
1st
15,400
7,000
4.2
1st
2.5
c.55%
4,000
5-10%
Number of scholarships 2016-2018 (k)
Total retail loyal customers (MM)
1I2I3 customers (k)
Digital customers (MM)
Best-in-class banks in customer experience
Fee income CAGR
NPL ratio
RoTE
Cost to income ratio
Best bank to work
Individual career plans
Evaluation 180º for commercial positions
People
Customers
Communities
Shareholders1
2nd
13,200
6,500
1.2
1,240
2.7
3rd
2%
6.1%
12%
53%
12.22
1H’16 2018
(1) Management perimeter (2) Total scholarships for 2016
22 Helping people and businesses prosper
We are uniquely positioned to grow further by challenging the retail and
SMEs market with our 1|2|3 strategy, and continue leading in Affluent, Private
Banking and Corporate Banking
Our model ensures predictable, sustainable and profitable organic
growth with less capital consumption and a best-in-class risk profile
A commercial transformation in place to favour customer loyalty
and customer service and efficiency improvement