
A Weekly Update from SMC 2013: Issue 387, Week: …...Ph.: +91-11- 43035012, 43035014, Email:...
20
Brand smc 210 2013: Issue 387, Week: 9th - 12th September A Weekly Update from SMC (For private circulation only)
Transcript of A Weekly Update from SMC 2013: Issue 387, Week: …...Ph.: +91-11- 43035012, 43035014, Email:...

Bra
nd
sm
c 2
10
2013: Issue 387, Week: 9th - 12th SeptemberA Weekly Update from SMC(For private circulation only)


(Saurabh Jain)
Contents
Equity 4-7
Derivatives 8-9
Commodity 10-13
Currency 14
IPO 15
Fixed Deposit 16
Mutual Fund 17-18
EDITORIAL STAFF
Editor Saurabh Jain
Executive Editor Jagannadham Thunuguntla
+Editorial Team
Dr. R.P. Singh Nitin Murarka
Vandana Bharti Tejas Seth
Sandeep Joon Dinesh Joshi
Vineet Sood Shitij Gandhi
Dhirender Singh Bisht Subhranil Dey
Parminder Chauhan Ajay Lakra
Mudit Goyal
Content Editor Kamla Devi
Graphic Designer Pramod Chhimwal
REGISTERED OFFICES:
11 / 6B, Shanti Chamber, Pusa Road, New Delhi 110005.
Tel: 91-11-30111000, Fax: 91-11-25754365
MUMBAI OFFICE:
Dheeraj Sagar, 1st Floor, Opp. Goregaon sports Club, Link Road
Malad (West), Mumbai 400064
Tel: 91-22-67341600, Fax: 91-22-28805606
KOLKATA OFFICE:
18,Rabindra Sarani, Poddar Court, Gate No-4, 4th & 5th Floor,
Kolkata-700001
Tel : 91-33-39847000/39801300, Fax No : 91-33-39847004
AHMEDABAD OFFICE :
10/A, 4th Floor, Kalapurnam Building, Near Municipal Market,
C G Road, Ahmedabad-380009, Gujarat
Tel : 91-79-26424801 - 05, 40049801 - 03
CHENNAI OFFICE:
2nd Floor, Mookambika Complex, 4, Lady Desikachari Road,
Mylapore, Chennai-600004
Tel: 91- 44 - 39109100 Fax: 91- 44 - 39109111
SECUNDERABAD OFFICE:
206, 3rd Floor, above CMR Exclusive, Bhuvana Towers, S.D.Road,
Secunderabad - 500003
Tel: 91-40-30780298/99, 39109536
DUBAI OFFICE:
312, Belshalat Building, Al Karama, Dubai, P.O. Box 117210, U.A.E.
Tel: 97143963120, Mobile : 971502612483
Fax : 9714 3963122
Email ID : [email protected]
Printed and Published on behalf of
Mr. Saurabh Jain @ Publication Address
11/6B, Shanti Chamber, Pusa Road, New Delhi-110005
Website: www.smcindiaonline.com
Investor Grievance : [email protected]
Printed at: S&S MARKETING
102, Mahavirji Complex LSC-3, Rishabh Vihar, New Delhi - 110092 (India)
Ph.: +91-11- 43035012, 43035014, Email: [email protected]
lobal stock markets largely strengthened in the week gone by with developed
countries benchmarks making the lead. Economic data out of U.S. like Gunemployment benefits, non-farm payroll, service sector, etc suggests that
the economic is right on growth path. The BRIC nations, suffering from flight of capital
and currency depreciation on the anticipation of U.S. Federal Reserve may lower bond
purchase program have joined hands to create $100 billion fund to protect themselves
from financial shocks. U.S. president Obama told on the sidelines of G20 meeting that
any rollback of bond purchases would be gradual. The countries also discussed the
repercussions on the economic growth in case of U.S. attack on the Syria as it would
give rise to crude oil prices.
Meanwhile, the European Central Bank (ECB) in the monetary policy review once
again reiterated that the policies would remain accommodative as long as it is
required.
Back at home, Indian economy saw just 4.4% expansion in the first quarter of current
fiscal. With industrial activity and services sector feeling the heat, many international
agencies have cut down the Indian economic growth target to sub 5%. Indian stock
market cheered on some smart and bold announcements made by the new Reserve
Bank of India (RBI) governor Dr. Raghuram Rajan. Raising limits for Indian banks for
overseas borrowing and relaxing limits for exporters and importers in forward
exchange market together with giving assurance to bring monetary stability and
confidence in the value of currency boosted the sentiments. In the monsoon session of
the parliament that got extended two times, the government secured the consensus
on Pension Fund Regulatory and Development Authority (PFRDA) Bill. All in all the
confidence that has come in the markets is expected to stay for a while and may get
extended if government together with RBI delivers something that can reinforce
further confidence in the economy and currency.
While commodities outperformed equities, bonds and the dollar in August with a surge
in metals and oil prices whereas it took some correction in the first week of September
as the rally was overstretched and there was ambiguity in the market regarding Syria
issue. Syria issue is still the major trigger for the commodities market. Apart from this,
Federal Reserve meet on 17-18 September is the major focus in which there is an
expectation that it may taper the stimulus. Commodities may trade in a range with
some downside bias. If rupee appreciates further then we can see further correction
in metals and energy and some agri counters viz spices and edible oils. Traders may
keep an eye on some important economic releases such as New Yuan Loans and
consumer price index of China, Reserve Bank of New Zealand rate decision,
employment change and unemployment rate of Australia, advance retail sales and U.
of Michigan Confidence of US while investing in commodities.
From The Desk Of Editor
4
NOTES:
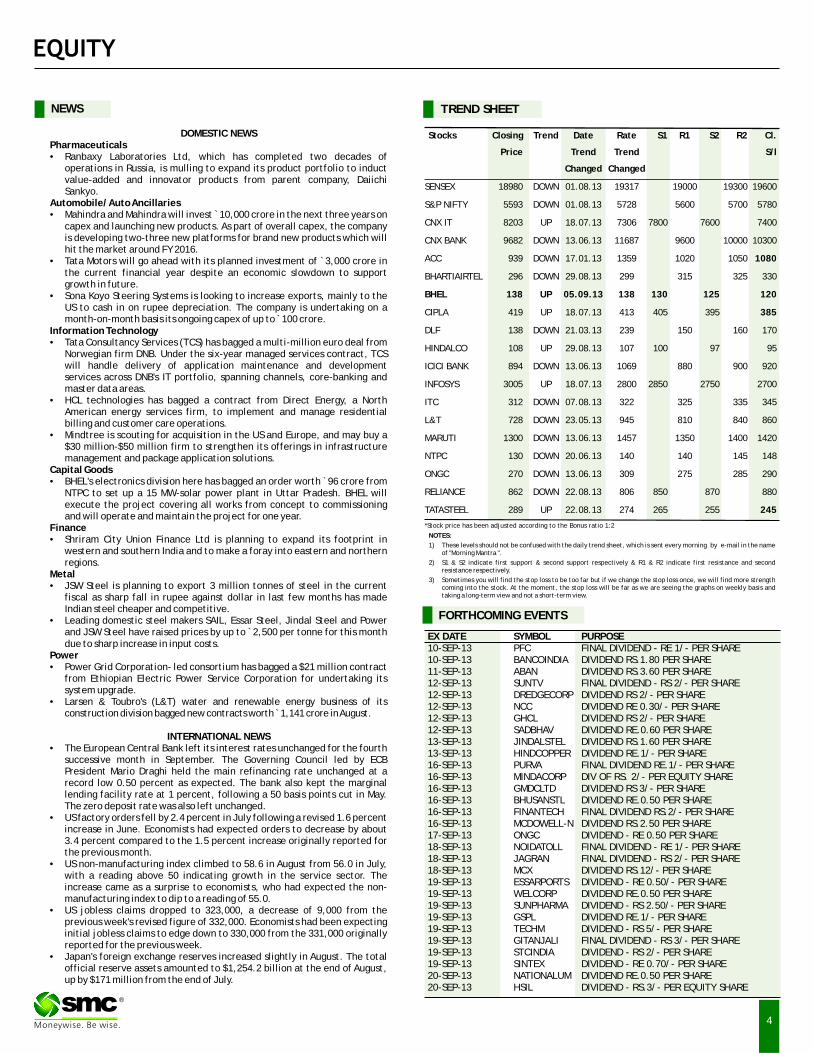
1) These levels should not be confused with the daily trend sheet, which is sent every morning by e-mail in the name of "Morning Mantra ".
2) S1 & S2 indicate first support & second support respectively & R1 & R2 indicate first resistance and second resistance respectively.
3) Sometimes you will find the stop loss to be too far but if we change the stop loss once, we will find more strength coming into the stock. At the moment, the stop loss will be far as we are seeing the graphs on weekly basis and taking a long-term view and not a short-term view.
TREND SHEET
Stocks Closing Trend Date Rate S1 R1 S2 R2 Cl.
Price Trend Trend S/l
Changed Changed
SENSEX 18980 DOWN 01.08.13 19317 19000 19300 19600
S&P NIFTY 5593 DOWN 01.08.13 5728 5600 5700 5780
CNX IT 8203 UP 18.07.13 7306 7800 7600 7400
CNX BANK 9682 DOWN 13.06.13 11687 9600 10000 10300
ACC 939 DOWN 17.01.13 1359 1020 1050 1080
BHARTIAIRTEL 296 DOWN 29.08.13 299 315 325 330
BHEL 138 UP 05.09.13 138 130 125 120
CIPLA 419 UP 18.07.13 413 405 395 385
DLF 138 DOWN 21.03.13 239 150 160 170
HINDALCO 108 UP 29.08.13 107 100 97 95
ICICI BANK 894 DOWN 13.06.13 1069 880 900 920
INFOSYS 3005 UP 18.07.13 2800 2850 2750 2700
ITC 312 DOWN 07.08.13 322 325 335 345
L&T 728 DOWN 23.05.13 945 810 840 860
MARUTI 1300 DOWN 13.06.13 1457 1350 1400 1420
NTPC 130 DOWN 20.06.13 140 140 145 148
ONGC 270 DOWN 13.06.13 309 275 285 290
RELIANCE 862 DOWN 22.08.13 806 850 870 880
TATASTEEL 289 UP 22.08.13 274 265 255 245
NEWS
EX DATE SYMBOL PURPOSE10-SEP-13 PFC FINAL DIVIDEND - RE 1/- PER SHARE10-SEP-13 BANCOINDIA DIVIDEND RS.1.80 PER SHARE11-SEP-13 ABAN DIVIDEND RS.3.60 PER SHARE12-SEP-13 SUNTV FINAL DIVIDEND - RS 2/- PER SHARE12-SEP-13 DREDGECORP DIVIDEND RS 2/- PER SHARE12-SEP-13 NCC DIVIDEND RE 0.30/- PER SHARE12-SEP-13 GHCL DIVIDEND RS 2/- PER SHARE12-SEP-13 SADBHAV DIVIDEND RE.0.60 PER SHARE13-SEP-13 JINDALSTEL DIVIDEND RS.1.60 PER SHARE13-SEP-13 HINDCOPPER DIVIDEND RE.1/- PER SHARE16-SEP-13 PURVA FINAL DIVIDEND RE.1/- PER SHARE16-SEP-13 MINDACORP DIV OF RS. 2/- PER EQUITY SHARE16-SEP-13 GMDCLTD DIVIDEND RS 3/- PER SHARE16-SEP-13 BHUSANSTL DIVIDEND RE.0.50 PER SHARE16-SEP-13 FINANTECH FINAL DIVIDEND RS.2/- PER SHARE16-SEP-13 MCDOWELL-N DIVIDEND RS.2.50 PER SHARE17-SEP-13 ONGC DIVIDEND - RE 0.50 PER SHARE18-SEP-13 NOIDATOLL FINAL DIVIDEND - RE 1/- PER SHARE18-SEP-13 JAGRAN FINAL DIVIDEND - RS 2/- PER SHARE18-SEP-13 MCX DIVIDEND RS.12/- PER SHARE19-SEP-13 ESSARPORTS DIVIDEND - RE 0.50/- PER SHARE19-SEP-13 WELCORP DIVIDEND RE.0.50 PER SHARE19-SEP-13 SUNPHARMA DIVIDEND - RS 2.50/- PER SHARE19-SEP-13 GSPL DIVIDEND RE.1/- PER SHARE19-SEP-13 TECHM DIVIDEND - RS 5/- PER SHARE19-SEP-13 GITANJALI FINAL DIVIDEND - RS 3/- PER SHARE19-SEP-13 STCINDIA DIVIDEND - RS 2/- PER SHARE19-SEP-13 SINTEX DIVIDEND - RE 0.70/- PER SHARE20-SEP-13 NATIONALUM DIVIDEND RE.0.50 PER SHARE20-SEP-13 HSIL DIVIDEND - RS.3/- PER EQUITY SHARE
FORTHCOMING EVENTS
DOMESTIC NEWSPharmaceuticals• Ranbaxy Laboratories Ltd, which has completed two decades of
operations in Russia, is mulling to expand its product portfolio to induct value-added and innovator products from parent company, Daiichi Sankyo.
Automobile/ Auto Ancillaries• Mahindra and Mahindra will invest ̀ 10,000 crore in the next three years on
capex and launching new products. As part of overall capex, the company is developing two-three new platforms for brand new products which will hit the market around FY 2016.
• Tata Motors will go ahead with its planned investment of `3,000 crore in the current financial year despite an economic slowdown to support growth in future.
• Sona Koyo Steering Systems is looking to increase exports, mainly to the US to cash in on rupee depreciation. The company is undertaking on a month-on-month basis its ongoing capex of up to ̀ 100 crore.
Information Technology• Tata Consultancy Services (TCS) has bagged a multi-million euro deal from
Norwegian firm DNB. Under the six-year managed services contract, TCS will handle delivery of application maintenance and development services across DNB's IT portfolio, spanning channels, core-banking and master data areas.
• HCL technologies has bagged a contract from Direct Energy, a North American energy services firm, to implement and manage residential billing and customer care operations.
• Mindtree is scouting for acquisition in the US and Europe, and may buy a $30 million-$50 million firm to strengthen its offerings in infrastructure management and package application solutions.
Capital Goods• BHEL's electronics division here has bagged an order worth ̀ 96 crore from
NTPC to set up a 15 MW-solar power plant in Uttar Pradesh. BHEL will execute the project covering all works from concept to commissioning and will operate and maintain the project for one year.
Finance• Shriram City Union Finance Ltd is planning to expand its footprint in
western and southern India and to make a foray into eastern and northern regions.
Metal• JSW Steel is planning to export 3 million tonnes of steel in the current
fiscal as sharp fall in rupee against dollar in last few months has made Indian steel cheaper and competitive.
• Leading domestic steel makers SAIL, Essar Steel, Jindal Steel and Power and JSW Steel have raised prices by up to ̀ 2,500 per tonne for this month due to sharp increase in input costs.
Power• Power Grid Corporation- led consortium has bagged a $21 million contract
from Ethiopian Electric Power Service Corporation for undertaking its system upgrade.
• Larsen & Toubro's (L&T) water and renewable energy business of its construction division bagged new contracts worth ̀ 1,141 crore in August.
INTERNATIONAL NEWS• The European Central Bank left its interest rates unchanged for the fourth
successive month in September. The Governing Council led by ECB President Mario Draghi held the main refinancing rate unchanged at a record low 0.50 percent as expected. The bank also kept the marginal lending facility rate at 1 percent, following a 50 basis points cut in May. The zero deposit rate was also left unchanged.
• US factory orders fell by 2.4 percent in July following a revised 1.6 percent increase in June. Economists had expected orders to decrease by about 3.4 percent compared to the 1.5 percent increase originally reported for the previous month.
• US non-manufacturing index climbed to 58.6 in August from 56.0 in July, with a reading above 50 indicating growth in the service sector. The increase came as a surprise to economists, who had expected the non-manufacturing index to dip to a reading of 55.0.
• US jobless claims dropped to 323,000, a decrease of 9,000 from the previous week's revised figure of 332,000. Economists had been expecting initial jobless claims to edge down to 330,000 from the 331,000 originally reported for the previous week.
• Japan's foreign exchange reserves increased slightly in August. The total official reserve assets amounted to $1,254.2 billion at the end of August, up by $171 million from the end of July.
*Stock price has been adjusted according to the Bonus ratio 1:2
®

5
BSE SENSEX GAINERS & LOSERS TOP (% Change) NSE NIFTY GAINERS TOP & LOSERS (% Change)
SECTORAL INDICES (% Change)
SMC Trend
SMC Trend
FMCGHealthcare
FTSE 100CAC 40
Auto BankRealty
Cap GoodsCons Durable
Oil & GasPower
NasdaqDow jonesS&P 500
NikkeiStrait times
Hang SengShanghai
INSTITUTIONAL ACTIVITY (Equity) (` Crore)
ITMetal
Down SidewaysUp
SMC Trend
Nifty BSE Midcap Nifty JuniorSensex BSE Smallcap S&P CNX 500
GLOBAL INDICES (% Change)
INDIAN INDICES (% Change)
®
2.21
1.93
2.262.29
2.04
2.11
1.70
1.80
1.90
2.00
2.10
2.20
2.30
2.40
Nifty Sensex BSE Midcap BSE Smallcap
Nifty Junior S&P CNX 500
-2.12
2.12
6.90
2.222.42
2.00
0.95
4.27
2.93
1.77
3.38
-3.00
-2.00
-1.00
0.00
1.00
2.00
3.00
4.00
5.00
6.00
7.00
8.00
Auto Index Bankex Cap Goods Index
Cons Durable Index
FMCG Index Healthcare Index
IT Index Metal Index Oil & Gas Index
Power Index Realty Index
1.92
0.86
1.35
5.05
0.35
3.99
1.15
1.86 1.86
0.00
1.00
2.00
3.00
4.00
5.00
6.00
Nasdaq Comp. Dow Jones S&P 500 Nikkei Strait Times Hang Seng Shanghai Comp.
FTSE 100 CAC 40
-100.10
-726.30
-203.60
-137.10
501.80
102.60
257.10
90.30
-800.00
-600.00
-400.00
-200.00
0.00
200.00
400.00
600.00
Friday Monday Tuesday Wednesday Thursday
FII Activity MF Activity
15.54
13.15
11.05
8.22 8.05
-4.51 -4.25 -3.96-3.21 -3.15
-10.00
-5.00
0.00
5.00
10.00
15.00
20.00
B H E L Coal India ICICI Bank O N G C St Bk of India Sesa Goa Hero Motocorp
Tata Power Co.
Wipro Infosys
16.01
13.4412.73
11.42 11.35
-5.35-4.54 -4.35
-3.65 -3.25
-10.00
-5.00
0.00
5.00
10.00
15.00
20.00
B H E L JP Associates Coal India IndusInd Bank
Axis Bank Sesa Goa Hero Motocorp
Tata Power Co.
Asian Paints Infosys

Beat the street - Fundamental Analysis
6
® Above calls are recommended with a time horizon of 1 year. Source: Company Website Reuters Capitaline
Face Value (`) 10.00
52 Week High/Low 276.70/198.10
M.Cap (` Cr.) 1168.39
EPS (`) 15.73
P/E Ratio (times) 15.58
P/B Ratio (times) 2.33
Dividend Yield (%) 0.41
Stock Exchange BSE
VALUE PARAMETERS
% OF SHARE HOLDING
ENTERTAINMENT NETWORK (INDIA) LIMITED CMP: 245.10 Upside: 27%Target Price: 312
Investment Rationale inventory available for Q2, but for Q3 and Q4 it is full. As a result, there will be price hike from Q3 FY14. •Entertainment Network (India) Limited (ENIL)
•The company has added two new online radio operates FM radio broadcasting stations through stations during the quarter ended June 2013, the brand Radio Mirchi in 32 Indian cities. Retained taking total count to 6. The new stations launched market leadership with approximately 33%-35% are in English genre.share of private FM radio industry.
•The management said that in Q1 FY14 private FM •The Union cabinet has approved the Phase 3 Radio industry reported strong growth of 20% - auction process and the auction for 839 new radio 22%, better than TV and print media segments. stations will begin soon. The margin of existing
stations is to be expanded by combination of higher Valuationinventory and higher rate. Also, new licenses in
The coming election season normally favors the radio new cities will result in new revenue. New revenue
i n d u s t r y s t a t e e l e c t i o n s t o g e t h e r opportunities on digital and other platforms are
with general election in May 2014 will result in higher being expanded. There are plans to expand Radio
volume in FY 2014. Hence, FY 2014 should be a good Mirchi brand globally.
year. We expect the stock to see a price target of ̀ 312 •During the quarter ended June 2013, Volume
in one year time frame, based on estimated FY14E growth for 24 growing stations was 40% and for top
EPS of 15.93 on the two year average P/Ex of 19.61.8 stations was 26%. Overall, volume grew by 34%. The sectors which showed a strong volume growth during quarter are Real Estate with 42% growth, Government by 102%, BFSI by 74%, Jewellery by 53% and Travel and Tourism by 54%, while Media and Entertainment, organized retail and auto de-grew by 21%.
•The utilization level increased to 92% in Q1 FY14 from 68% in Q1 FY13. Utilization in top 8 stations was at 108%, while for remaining 24 stations it was 87%. The management said that as utilization levels is above 100% for top 8 station, have peaked, an ad rate hike is inevitable. There is some
` in cr
Particular Mar 2013 2014(E) 2015
Revenue 334.23 381.06 424.00
EBITDA 104.43 118.73 133.24
EBIT 72.70 91.33 106.58
Pre-Tax Profit 90.10 107.41 120.56
Net Profit 68.32 76.01 85.12
EPS 14.33 15.93 17.87
BVPS 105.35 121.01 137.21
ROE 14.53 14.17 13.88
Mar Mar (E)
P/BV Chart
Face Value ( ) 10.00
52 Week High/Low 66.20 / 35.70
M.Cap (` Cr.) 2510.32
EPS (`) 13.38
P/E Ratio (times) 2.84
P/B Ratio (times) 0.54
Stock Exchange BSE
`
` in cr
Particular Mar 2013 Mar 2014 Mar 2015
Revenue 3,945.35 4,688.03 5,281.69
EBIT 2,148.71 2,695.50 3,081.43
Pre-Tax Profit 1,342.19 1,629.12 1,912.07
Net Profit 759.52 1,035.91 1,258.26
EPS 11.88 15.42 18.77
BVPS 67.10 85.22 106.54
ROE 17.26 18.12 18.32
(E) (E)
VALUE PARAMETERS
% OF SHARE HOLDING
Investment Rationale •· Net profit of the Bank rose 89.61% to `266.33 crore in the quarter ended June 2013 as against Rs •The Bank's network has spread across 6,868 140.46 crore during the previous quarter ended functional units spread across 28 States and 2 June 2012. Total Operating Income rose 34.86% to Union territories. It has 1756 branches, 802 ATMs `2749.21 crore in the quarter ended June 2013 as & 107 MahaGram Seva Kendra. During the quarter against `2038.50 crore during the previous ended June 2013, the Bank opened 28 Branches quarter ended June 2012. Net Interest Margin across the country. It has plans to open 225 new (NIM) increased by 11 bps to 3.02%.branches during the current fiscal
Valuation•The total business of the bank grew by 37% to `188457.09 crore as on June 2013 as compared to Over the last few years, the bank has delivered `137684.56 crore during the same period last steady growth in its operational performance. During year. The total deposit increased by 32% to the quarter ended June 2013 the bank has reported `105446.65 crore while the total advances healthy business growth backed by robust growth increased by 43.6% to ̀ 83010.44 crore. both in terms of deposits and advances. Going
forward new branch addition would further boost the •The share of Current & Saving (CASA) deposits to business growth of the bank. Meanwhile new capital total deposits stood at 35.32% as on June 2013.addition would also help raise its core Capital •The %GNPA as well as %NNPA improved sharply Adequacy Ratio (CAR) further. We expect the stock to during the quarter ended June 2013 on YoY basis. see a price target of `46 in one year time frame on a The bank's gross NPA ratio improved by 44 basis current P/B of 0.54x and FY14 (E) book value per points (bps) to 1.8 per cent, while the net NPA share of ̀ 85.22.improved by 17 bps lower at 0.8 per cent. During
FY13, %GNPA stood at 1.49 and %NNPA stood at 0.52.
•Capital adequacy ratio stood at 11.83% at the end of June 2013 as compared to 12.46 end of June 2012. The NPA provision coverage ratio stood at 76.50 % as at June 2013.
•The bank has announced that the base rate of the bank is revised by 25 bps from 10.00% p.a. to 10.25% p.a. on monthly compounding basis, with effect from 26 August 2013.
•The bank had asked the Centre for a capital infusion of `2,200 crore this year. Further the bank has also asked permission for Qualified Institutional Placements (QIPs), which is pending with the Government. It plans to raise ̀ 200 crore through QIP.
P/E Chart
BANK OF MAHARASHTRA LIMITED CMP: 37.95 Upside: 21%Target Price: 46
16.320.49
6.33
71.15
5.71 Foreign
Institutions
Non Promoter Corporate Holding
Promoters
Public & Others
0.87
10.180.82
81.24
6.89
Foreign
Institutions
Non Promoter Corporate Holding
Promoters
Public & Others
Charts by Spider Software India Ltd
7
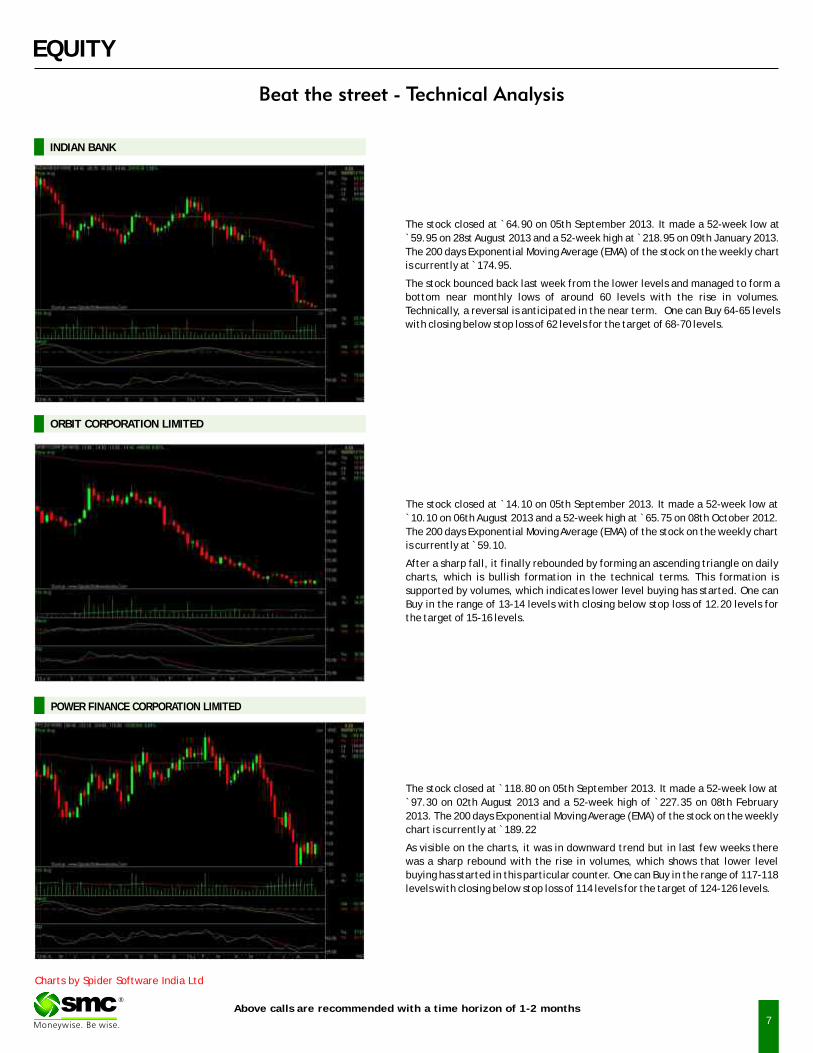
The stock closed at 64.90 on 05th September 2013. It made a 52-week low at
`59.95 on 28st August 2013 and a 52-week high at ̀ 218.95 on 09th January 2013.
The 200 days Exponential Moving Average (EMA) of the stock on the weekly chart
is currently at ̀ 174.95.
The stock bounced back last week from the lower levels and managed to form a
bottom near monthly lows of around 60 levels with the rise in volumes.
Technically, a reversal is anticipated in the near term. One can Buy 64-65 levels
with closing below stop loss of 62 levels for the target of 68-70 levels.
`
EQUITY
Above calls are recommended with a time horizon of 1-2 months
The stock closed at 14.10 on 05th September 2013. It made a 52-week low at
`10.10 on 06th August 2013 and a 52-week high at ̀ 65.75 on 08th October 2012.
The 200 days Exponential Moving Average (EMA) of the stock on the weekly chart
is currently at ̀ 59.10.
After a sharp fall, it finally rebounded by forming an ascending triangle on daily
charts, which is bullish formation in the technical terms. This formation is
supported by volumes, which indicates lower level buying has started. One can
Buy in the range of 13-14 levels with closing below stop loss of 12.20 levels for
the target of 15-16 levels.
`
The stock closed at 118.80 on 05th September 2013. It made a 52-week low at
`97.30 on 02th August 2013 and a 52-week high of `227.35 on 08th February
2013. The 200 days Exponential Moving Average (EMA) of the stock on the weekly
chart is currently at ̀ 189.22
As visible on the charts, it was in downward trend but in last few weeks there
was a sharp rebound with the rise in volumes, which shows that lower level
buying has started in this particular counter. One can Buy in the range of 117-118
levels with closing below stop loss of 114 levels for the target of 124-126 levels.
`
INDIAN BANK
POWER FINANCE CORPORATION LIMITED
ORBIT CORPORATION LIMITED
®

DERIVATIVES
BASIS GAP IN NIFTY
The overall market cost-of-carry ended positive. Nifty future closed at a premium of 15 points indicating long carry forward. Nifty is expected to remain in the range of 5500-5800 levels this week with positive bias. The options concentration continues to be at 5300-strike put option with an open interest of above 65 lakh shares. This is followed by the 5700-strike call option with above 40 lakh shares. Above discussed option data indicates put writing at 5300 strikes. On the call side data indicates call writing in 5700 strike. The PCR OI increased by the weekend to close at 1.49.The implied volatility (IV) of call options closed at 26.25% while the average IV of put options ended at 27.20%. The Nifty VIX increased during the week and closed at 28.65%. It is expected to consolidate around current levels. It has a strong support around 23 levels. As long as the Index holds the support of 5500 level, a range bound trade action is likely with the upside potential of up to 5800 level in the near-term. However, owing to the recovery tone from the recent low of 5320 level, the Index is likely to extend its gain. But, an immediate close below 5500 level shall drag the Index towards 5300 level. Trade long in the nifty above 5700 level or on any dip to 5650 with the stop loss of 5600 for the target of 5800 and 5980 levels. Alternatively, trade short if the Nifty slips below 5600 levels targeting 5500 support levels.
WEEKLY VIEW OF THE MARKET
NIFTY TOTAL OPEN INTEREST (in share)
FIIs ACTIVITY IN INDEX FUTURE (F&O) IN LAST WEEK
(Derivative segment)
®
FIIs ACTIVITY IN F&O IN LAST TEN SESSIONS
(Derivative segment) `(Cr)
BUY LICHSGFIN (SEP FUTURE)
Buy: Above `176
Target: `184
Stop loss: `172
RPOWERBuy SEP 70 CALL 2.80Buy SEP 65 PUT 1.60
Lot size: 4000Upside BEP: 74.40Downside BEP: 60.60Max. Profit: UnlimitedMax. Loss: 17600.00 (4.40*4000)
OPTIONSTRATEGY
FUTURESTRATEGY
LTBuy SEP. 760. CALL 27.00Sell SEP. 780. CALL 20.00
Lot size: 375BEP: 767.00Max. Profit: 4875.00 (13.00*375)Max. Loss: 2625.00 ( 7.00*375)
SELL TECHM (SEP FUTURE)
Sell: `1345
Target: `1312
Stop loss: `1362
Below
BHARTIARTL
Buy SEP. 320. CALL 12.50
Sell SEP. 340. CALL 5.00
Lot size: 1000
BEP: 327.50
Max. Profit: 12500.00 (12.50*1000)
Max. Loss: 7500.00 ( 7.50*1000)
BULLISH STRATEGY
DERIVATIVE STRATEGIES
BUY RELINFRA (SEP FUTURE)
Buy: `370
Target: `382
Stop loss: `363
Above
VOLATILITY BASED STRATEGY
BUY47.7%
SELL52.3%
-20
-15
-10
-5
0
5
10
15
20
22-Aug 23-Aug 26-Aug 27-Aug 28-Aug 29-Aug 30-Aug 02-Sep 03-Sep 04-Sep 05-Sep
81450 132350
7903501119700
1194500
1589000
2767600
4014200
3355050
4099350
3287350
2653300
3375150
4710200
3738300
4645450
6624100
3997000
3609500
1467700
805950455600
0
1000000
2000000
3000000
4000000
5000000
6000000
7000000
4800 4900 5000 5100 5200 5300 5400 5500 5600 5700 5800
Call Put
-1316.70
-285.26
-602.23
723.22 783.99
1262.671345.12
996.42
780.65577.29
-1500.00
-1000.00
-500.00
0.00
500.00
1000.00
1500.00
23-Aug 26-Aug 27-Aug 28-Aug 29-Aug 30-Aug 02-Sep 03-Sep 04-Sep 05-Sep
8
9
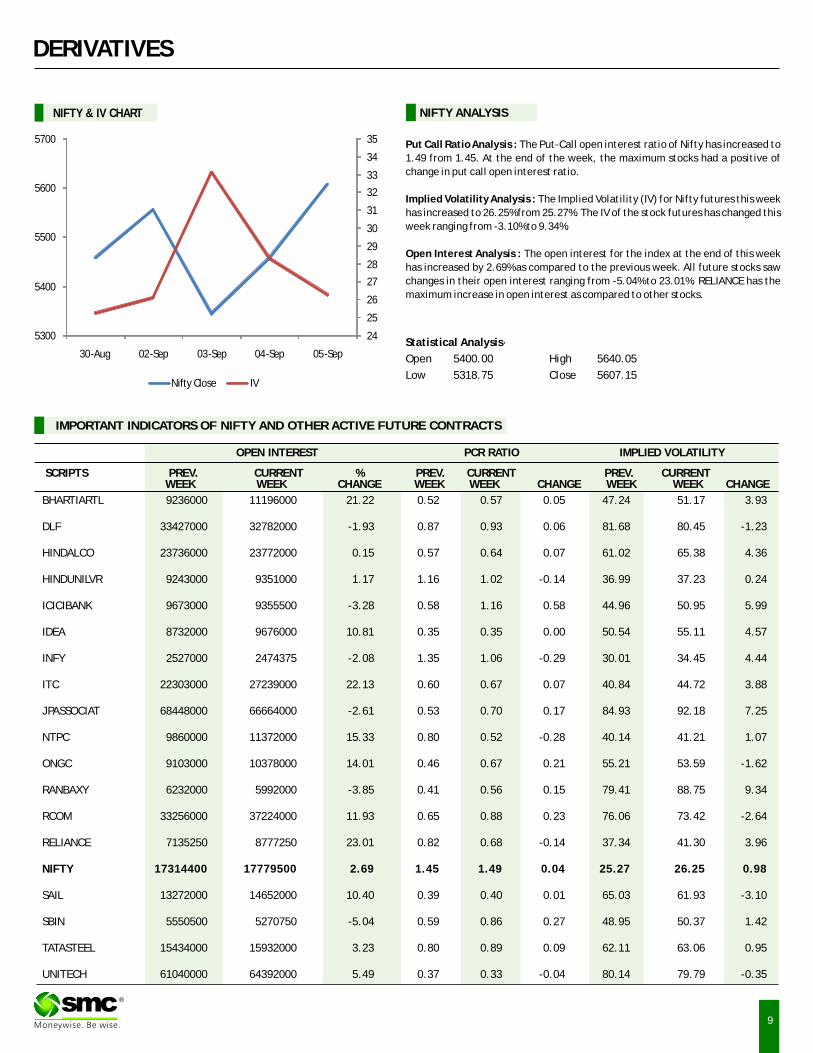
BHARTIARTL 9236000 11196000 21.22 0.52 0.57 0.05 47.24 51.17 3.93
DLF 33427000 32782000 -1.93 0.87 0.93 0.06 81.68 80.45 -1.23
HINDALCO 23736000 23772000 0.15 0.57 0.64 0.07 61.02 65.38 4.36
HINDUNILVR 9243000 9351000 1.17 1.16 1.02 -0.14 36.99 37.23 0.24
ICICIBANK 9673000 9355500 -3.28 0.58 1.16 0.58 44.96 50.95 5.99
IDEA 8732000 9676000 10.81 0.35 0.35 0.00 50.54 55.11 4.57
INFY 2527000 2474375 -2.08 1.35 1.06 -0.29 30.01 34.45 4.44
ITC 22303000 27239000 22.13 0.60 0.67 0.07 40.84 44.72 3.88
JPASSOCIAT 68448000 66664000 -2.61 0.53 0.70 0.17 84.93 92.18 7.25
NTPC 9860000 11372000 15.33 0.80 0.52 -0.28 40.14 41.21 1.07
ONGC 9103000 10378000 14.01 0.46 0.67 0.21 55.21 53.59 -1.62
RANBAXY 6232000 5992000 -3.85 0.41 0.56 0.15 79.41 88.75 9.34
RCOM 33256000 37224000 11.93 0.65 0.88 0.23 76.06 73.42 -2.64
RELIANCE 7135250 8777250 23.01 0.82 0.68 -0.14 37.34 41.30 3.96
NIFTY 17314400 17779500 2.69 1.45 1.49 0.04 25.27 26.25 0.98
SAIL 13272000 14652000 10.40 0.39 0.40 0.01 65.03 61.93 -3.10
SBIN 5550500 5270750 -5.04 0.59 0.86 0.27 48.95 50.37 1.42
TATASTEEL 15434000 15932000 3.23 0.80 0.89 0.09 62.11 63.06 0.95
UNITECH 61040000 64392000 5.49 0.37 0.33 -0.04 80.14 79.79 -0.35
IMPORTANT INDICATORS OF NIFTY AND OTHER ACTIVE FUTURE CONTRACTS
OPEN INTEREST PCR RATIO IMPLIED VOLATILITY
SCRIPTS PREV. CURRENT % PREV. CURRENT PREV. CURRENT WEEK WEEK CHANGE WEEK WEEK CHANGE WEEK WEEK CHANGE
DERIVATIVES
Put Call Ratio Analysis : The Put-Call open interest ratio of Nifty has increased to
1.49 from 1.45. At the end of the week, the maximum stocks had a positive of
change in put call open interest ratio.
Implied Volatility Analysis : The Implied Volatility (IV) for Nifty futures this week
has increased to 26.25% from 25.27%. The IV of the stock futures has changed this
week ranging from -3.10% to 9.34%.
Open Interest Analysis : The open interest for the index at the end of this week
has increased by 2.69% as compared to the previous week. All future stocks saw
changes in their open interest ranging from -5.04% to 23.01%. RELIANCE has the
maximum increase in open interest as compared to other stocks.
Statistical Analysis·
Open 5400.00 High 5640.05
Low 5318.75 Close 5607.15
NIFTY & IV CHART NIFTY ANALYSIS
®
24
25
26
27
28
29
30
31
32
33
34
35
5300
5400
5500
5600
5700
30-Aug 02-Sep 03-Sep 04-Sep 05-Sep
Nifty Close IV

10
®
Bullion counter is expected to trade sideways in near term. On the domestic bourses, strong local currency rupee may keep the upside capped. Recently lots of steps are taken by RBI to curb the fall of local currency. Furthermore investors will keep close eye on the FOMC meeting on September 18 in which decision on tapering of quantitative easing can be taken. Gold may trade in the range of $1320-1450 in COMEX and 30500-33500 in MCX. White metal silver can also trade in the range of 52000-58000 in near term. Signs of an improving U.S. economy and possibility of a U.S. strike against Syria are the key factors, which will affect the prices in near term. COMEX Gold has lost 18 percent this year amid expectations the Federal Reserve will pare asset purchases as early as this month. Holdings in the SPDR Gold Trust, the biggest exchange traded product backed by bullion are hovering at 919.23 metric tons. There are signs of improvement of US economy as indicated by the last week numbers as U.S. ISM non manufacturing reading for August came in at 58.6 versus 56.0 in July, which beat expectations. The market place is still concerned regarding the U.S. threat to attack Syria after the Assad regime allegedly used chemical weapons against Syrian citizens. A heavy monsoon this year will bring a bounty to India's rural population and a much needed boost to a struggling economy, increasing domestic demand for gold.
BULLIONS
Tensions in Middle East especially in Syria will keep the crude oil prices on volatile path. Overall it can move in the range of 6700-7700 in MCX and $104-112 in NYMEX. Possibility of US attack on Syria will keep crude oil investors on the edge in this week. Meanwhile, President Barack Obama is searching for diplomatic backing for a military strike on Syria. Obama will seek approval from Congress before taking action as against Syria after the Senate Foreign Relations Committee voted for a restricted operation. U.S. lawmakers are scheduled to reconvene on Sept. 9 after a five-week break. Russian President Putin has said any military intervention against Syria with the consent of the United Nations would be an act of "aggression." According to the EIA” U.S. crude production rose 0.2 percent to 7.62 million barrels a day”. Output has surged to the highest level since October 1989. Crude inventories at Cushing, the largest U.S. oil storage hub, fell by 1.83 million barrels to 34.8 million in the week ended Aug. 30, according to the Energy Information Administration. That's the lowest level since February 2012. Natural gas may remain on weaker path on increased inventories as it can trade in the range of 220-250 in MCX. Recently Energy Information Administration stated that inventories expanded by 58 billion cubic feet in the week ended Aug. 30 to 3.188 trillion cubic feet. Commodity Weather Group LLC in Bethesda, Maryland, predicted normal or lower-than-average temperatures in the eastern U.S. through Sept. 9.
ENERGY COMPLEX
Base metals complex may witness some decline in prices as fear of tapering of QE3 by Fed on 18 September meeting coupled with some strengthening of local rupee will keep the prices on weaker side. Red metal copper can trade in the range of 450-500. Recently China planned to reduce copper production as some 654,000 tonnes of production may be closed, which is insignificant when compared with the existing idle capacity of more than 7 million tonnes. Zinc prices can hover in the range of 119-132 in MCX. Global demand for refined zinc metal forecasted to rise by 5.2% to 12.98 million tonne in 2013. Main market for zinc is from steel galvanizing sector, which accounts for almost half its modern-day demand, is growing at sluggish pace amid demand contraction. Rise in demand is primarily due growth in China, India, Indonesia, Taiwan (China), Thailand and Turkey. Nickel prices can trade in the range of 880-945 in MCX. According to International Nickel Study Group (INSG) the global nickel market was in surplus by 74,200 tonnes in the first six months of the year. Battery metal, Lead can move in the range of 136-148. Global refined lead metal production increased 5.8% YoY to 4.37 million tonnes during the first five months of 2013 on consequence of higher production in China. Aluminum prices may move in the range of 114-124 levels .China's oversupply of aluminium is likely to escalate in the second half of 2013 as more new capacity is set to come on stream.
BASE METALS
Turmeric futures (Oct) is likely to consolidate in the range of 5150-5500
levels. The counter is lacking fresh cues from the spot market as the
demand for the yellow spice is waning. The bulk buyers and exporters are
buying only to meet their local demand and not buying any bulk stock as
they have not yet received any upcountry orders. It is being reported that
there are sufficient stocks with traders in North India and also local masala
firms. Jeera futures (Oct) is expected to hold above 13500 levels. There is
an anticipation that demand is likely to improve in the coming days. For
Singapore, Indian cumin seed with an allowance for 1% foreign matter was
offered at $2,300/tonne free on board Mumbai. Cumin seed 1% for Europe
was offered at $2,400/tonne on cost and freight basis. Cardamom futures
(Oct) will possibly manage to remain above 780 levels. There are reports
that the major growing regions in Kerala and Karnataka have reported
heavy rainfall this year affecting the capsules. The market participants are
expecting a 30% drop in the production of the spice in 2013-14. A downside
bias may be seen in chilli futures owing to the selling pressure. There are
around 35 lakh bags (40 kg each) in cold storages in Guntur. This year a good
crop yield is expected from Madhya Pradesh & area under sowing is likely to
increase by 20–25%.
SPICES
OTHER COMMODITIES
Maize futures (Oct) is likely to remain stable taking support above 1270 levels. In the current scenario, Malaysian feed millers are looking to cover 120,000 tonnes of corn for arrival in November-December as a depreciating Indian rupee has made grain shipments from the South Asian country competitive. India's new-crop corn is quoted around $235 a tonne for December arrival, compared with $245 a few weeks ago. Whereas, Argentine corn being offered around $245-$250 a tonne, including cost and freight (C&F), in Southeast Asia, compared with $275 a tonne being quoted for U.S. new-crop cargoes for December shipment. Wheat futures (Oct) is likely to edge up higher surpassing 1605 levels. The Indian wheat quoted around $285 a tonne, C&F, in the Middle East; down from $320-$325 a tonne offered last month, now it is almost at par with cargoes from the Black Sea region, which has been a stiff competition to India since entering the market in August. Kapas futures (Apr'14) will perhaps consolidate in the range of 1010-1050 levels as exports are expected to drop 22% this year on account of a slump in purchases by top cotton consumer China and higher domestic prices. Furthermore, the rival supplies from Pakistan and South Africa are available at 86-90 U.S. cents per lb against Indian parity at 93-94 cents per lb. However, any steep downside may remain capped as the domestic supplies are expected to remain tight until fresh arrivals start coming into the market in October.
Soybean futures (Oct) is seen to trade in the range of 3400-3700 levels. A
strong rupee makes trimming the returns of oilmeal exporters. However,
domestic demand is likely to persist in the coming days due to good soy meal
exports buying enquiries and steady demand from domestic feed industry.
U.S soybean futures (Nov) will possibly maintain its consolidation in the
range of 1340-1410 levels. The weather and yield potential remain highly
debated by the market participants. Yield estimates are mostly coming in
between 39.5-41.5 bushels per acre, down from the USDA forecast of 42.6
bushels per acre. The uptrend in Mustard futures (Oct) is likely to remain
capped near 3700 levels. The counter at the spot market is sluggish at
`4,000-4,100 a quintal (down `200 from last week). Plant deliveries of
mustard seeds for Jaipur line were quoted at ̀ 3,680-3,700. The mustard oil
is witnessing sluggish trend in Indore and elsewhere in Madhya Pradesh and
neighbouring mandis of Rajasthan and Gujarat. CPO futures (Sept) will
probably witness an extended downside towards 530 levels. The inventories
of palm oil in Malaysia at end of August is likely rose to 1.73 million tonnes,
its highest level in three months, a Reuters survey showed. Market
participants would keep a close watch on the Malaysian Palm oil board data
coming in next week, along with the world agricultural supply and demand
estimates report from U.S. Department of Agriculture.
OIL AND OILSEEDS

Closing as on 05.09.2013
11
NOTES : 1) Buy / Sell 25% of Commodity at S1/R1 respectively & rest 75% at S2/R2 respectively.2) S1 & S2 indicate first support & second support & R1 & R 2 indicate first resistance & second resistance. 3) Sometimes you will find the stop loss to be too far but if we change the stop loss once, we will find more strength coming into the commodity. At the moment, the stop loss will be far as we are seeing the graphs on weekly
basis and taking a long-term view and not a short-term view.4) These levels should not be confused with the daily trend sheet, which is sent every morning by e-mail in the name of Daily report- commodities.
TECHNICAL RECOMMENDATIONS
EXCHANGE CONTRACT CLOSING DATE TREND
PRICE CHANGED CHANGED STOP/LOSS
NCDEX SOYABEAN (OCT) 3535.00 29.08.13 SIDEWAYS
NCDEX JEERA (SEP) 13722.00 11.04.13 UP 13795.00 12400.00 - 12000.00 - 11500.00
NCDEX RED CHILLI (SEP) 5312.00 17.04.13 DOWN 6362.00 - 5800.00 6000.00 6100.00
NCDEX RM SEEDS (SEP) 3580.00 25.07.13 DOWN 3099.00 - 3600.00 3700.00 3800.00
MCX MENTHA OIL (SEP) 931.20 13.06.13 SIDEWAYS
MCX CARDAMOM (SEP) 755.90 28.02.13 DOWN 965.00 - 820.00 850.00 900.00
MCX SILVER (DEC) 54695.00 14.08.13 UP 46573.00 50000.00 - 48000.00 - 46000.00
MCX GOLD (OCT ) 32218.00 14.08.13 UP 29186.00 31000.00 - 30000.00 - 29000.00
MCX COPPER (NOV) 483.50 30.05.13 UP 414.55 475.00 - 465.00 - 455.00
MCX LEAD (SEP) 141.20 30.05.13 UP 122.90 138.00 - 132.00 - 127.00
MCX ZINC (SEP) 123.50 30.05.13 UP 107.55 120.00 - 115.00 - 110.00
MCX NICKEL (SEP) 919.30 14.08.13 UP 909.30 900.00 - 870.00 - 840.00
MCX ALUMINUM (SEP) 118.15 14.08.13 UP 114.00 114.00 - 108.00 - 104.00
MCX CRUDE OIL (SEP) 7201.00 06.06.13 UP 5404.00 7000.00 - 6800.00 - 6500.00
MCX NATURAL GAS (SEP) 239.40 22.08.13 UP 231.30 230.00 - 220.00 - 210.00
TREND RATE TREND S1 R1 S2 R2 CLOSING
*
TREND SHEET
COMMODITY
COPPER MCX (NOVEMBER) contract closed at Rs on 483.50 on 5th September '13. The contract made its
high of `523.40 on 28th August '13 and a low of `453.10 on 13th August '13. The 18-day Exponential
Moving Average of the commodity is currently at ̀ 481. On the daily chart, the commodity has Relative Strength Index (14-day) value of 53. One can sell 485-
488 the range with the stop loss of ̀ 492 for a target of ̀ 472.
NICKEL MCX (SEPTEMBER) contract closed at 919.30 on 5th September '13. The contract made its high
of ̀ 1018.00 on 28th August '13 and a low of ̀ 899.00 on 5th September '13.The 18-day Exponential Moving
Average of the Commodity is currently at ̀ 926.
On the daily chart, the commodity has Relative Strength Index (14-day) value of 49.One can sell in the
range 925-935 with the stop loss of ̀ 950 for target of ̀ 890.
`
NATURAL GAS MCX (SEPTEMBER) contract closed at 239.40 on 5th September '13.The contract made
its high of ̀ 257.10 on 4th September '13 and a low of ̀ 203.40 on 13th August '13.The 18-day Exponential
Moving Average of the Commodity is currently at ̀ 234.
On the daily chart, the commodity has Relative Strength Index (14-day) value of 53. One can sell in the
range 238-241 with the stop loss of ̀ 245 for a target of ̀ 225.
`
®
COPPER MCX (NOVEMBER)
NICKEL MCX (SEPTEMBER)
NATURAL GAS MCX (SEPTEMBER)

COMMODITY
NEWS DIGEST
In the week gone by Commodities tried to trade high but couldn't sustain at the higher levels as
traders preferred profit booking at higher levels. High volatility was witnessed in rupee after new
RBI chief took oath. It appreciated to some extent and injected selling pressure in commodities in
later part of the week. Gold extended the biggest drop in a month, on expectations for reduced
stimulus in the U.S. and limited military strikes against Syria. Silver prices also melt down on
profit booking though sales of American Eagle silver coins by the U.S. Mint this year surpassed the
total for all of 2012. Russia's objections also took some premium out of gold as it has become
increasingly clear that U.S. will face opposition. In energy counter, crude witnessed seesaw
momentum whereas natural gas prices propped up. Natural gas advanced to a five-week high in
New York on speculation that lingering U.S. heat may bolster demand for the power-plant fuel.
Natural gas prices spiraled after forecasts showed above-normal temperatures across the lower
48 states from Sept. 9 through Sept. 13. As per Energy Information Administration, power
generation accounts for 32% of U.S. gas demand. Base metals prices surrendered some of their
previous gain. Red metal, copper futures tumbled the most in five weeks on mounting speculation
that the Federal Reserve will ease economic stimulus and on concern the U.S. is moving closer to a
military strike on Syria. Rest of the metals of base counter viz; nickel, lead, zinc and aluminium
also witnessed downside despite better than expected jobless and non farm payroll data from US.
Firm sentiment featured in cardamom owing to good export inquiries. Lean season supply in the
middle of expectations of lower production in Turkey and the supply stop from Syria would make
India the sole major exporter of jeera in coming day's added bulls in jeera futures. However, on
Wednesday, it saw steep fall on profit booking and the closed the week on the negative note.
Chilli and turmeric also closed down. Recent weakness in Rupee opened an opportunity for the
foreign buyers to buy the guargum at cheap rates. It reflected in the price movements and
commodities traded in upper circuits on renewed demand. Around 45000 tonnes of guar gum
(Splits and powder) exported to various countries in July month 2013 as reported. Soyabean
prices featured gains on lower domestic supplies and fluctuations in the currency. Mustard seed
traded firm while crude palm oil took some corrections.
WEEKLY COMMENTARY
WEEKLY STOCK POSITIONS IN WAREHOUSE (NCDEX)
COMMODITY UNIT 28.08.13 04.09.13 DIFFERENCEQTY.
BARLEY MT 23453 23173 -280
CASTOR SEED MT 111352 112226 874
CHANA MT 114194 110433 -3761
CHILLI MT 4618 4468 -150
COTTONSEED OILCAKE MT 28450 21989 -6461
JEERA MT 4256 4028 -228
MAIZE MT 6916 6661 -255
RAPE MUSTARD SEED MT 54885 48283 -6602
SOYA BEAN SEEDS MT 10 0 -10
SUGAR M MT 6824 5396 -1428
WHEAT MT 14022 12923 -1099
COMMODITY UNIT 29.08.13 05.09.13 DIFFERENCE
QTY. QTY.
CARDAMOM MT 57.80 54.70 -3.10
COTTON BALES 0.00 0.00 0.00
GOLD KGS 287.00 408.00 121.00
GOLD MINI KGS 29.20 36.50 7.30
GOLD GUINEA KGS 22.76 26.68 3.92
MENTHA OIL KGS 2720595.45 2744344.65 23749.20
MILD STEEL MT 985.86 952.95 -32.91
SILVER (30 KG Bar) KGS 762.00 33795.71 33033.71
•During the second quarter of 2013, global demand for
gold bullion coins and bars used for investment
purposes increased by 78%, compared to the same
quarter in 2012.
•China has overtaken Russia as the main consumer of
natural gas from Central Asia.
•China's official PMI for the non-manufacturing sector
dipped slightly to 53.9 in August from July's 54.1.
•Rainfall was 30% below average in the week ending
Sept. 4 compared with 29% below the previous week.
•Farmers in Rajasthan had sown guar on 3.5 million
hectares as of Aug. 26 as against 2.9 million hectares
in the same period a year earlier
•Futures contracts in Guar Seed 10MT expiring in the
months of October 2013, November 2013, December
2013 and January 2014 would be available for trading
from September 05, 2013.
•The Centre has raised tariff value for import of crude
palm oil and RBD palmolein by $25 to $833 and $882
respectively while for crude soya oil it raised by $23
to $951 a tonne.
•As stated by the Solvent Extractors' Association of
India India's oilmeal exports rose to 307,733 tonnes in
August from 125,780 tonnes a year earlier.
WEEKLY STOCK POSITIONS IN WAREHOUSE (MCX)
12
®
NCDEX TOP GAINERS & LOSERS (% Change) MCX TOP GAINERS & LOSERS (% Change)
QTY.
19.5418.62
5.46
4.053.32
-5.61 -5.21
-3.08 -3.03-2.42
-10.00
-5.00
0.00
5.00
10.00
15.00
20.00
25.00
GUAR SEED GUAR GUM CASTOR SEED NEW
CORIANDER BARLEY SOYAMEAL RED CHILLI GUR NEW SHANKARKAPAS GOLD NEW
22.51
19.79
4.97
2.492.08
-3.99-3.26
-2.35 -2.22-1.76
-10.00
-5.00
0.00
5.00
10.00
15.00
20.00
25.00
GUARGUM GUARSEED CARDAMOM POTATO SILVER 1000 GOLD M COTTON STEEL RPR ZINC SILVER M

Rupee Depreciation … “ Economy Losing Confidence”
13
SPOT PRICES (% change)
COMMODITY
WEEKLY STOCK POSITIONS IN LME (IN TONNES)
COMMODITY STOCK POSITION STOCK POSITION DIFFERENCE
29.08.13 05.09.13
ALUMINIUM 5412975 5386625 -26350
COPPER 574825 603900 29075
NICKEL 212328 213804 1476
LEAD 185950 185350 -600
ZINC 1014825 992600 -22225
INTERNATIONAL COMMODITY PRICES
COMMODITY EXCHANGE CONTRACT UNIT 30.08.13 05.09.13 CHANGE(%)
Soya CBOT NOV Cent per Bushel 1357.50 1367.50 0.74
Maize CBOT SEPT Cent per Bushel 495.00 489.50 -1.11
CPO BMD NOV MYR per MT 2404.00 2412.00 0.33
Sugar LIFFE OCT 10 cents per MT 477.90 484.90 1.46
COMMODITY EXCHANGE CONTRACT 30.08.13 05.09.13 CHANGE%
ALUMINIUM LME 3 MONTHS 1814.00 1798.00 -0.88
COPPER LME 3 MONTHS 7100.00 7108.00 0.11
LEAD LME 3 MONTHS 2152.00 2124.00 -1.30
NICKEL LME 3 MONTHS 13800.00 13725.00 -0.54
ZINC LME 3 MONTHS 1905.00 1869.50 -1.86
GOLD COMEX DEC 1396.10 1373.00 -1.65
SILVER COMEX SEPT 23.51 23.26 -1.10
LIGHT CRUDE OIL NYMEX OCT 107.65 108.37 0.67
NATURAL GAS NYMEX OCT 3.58 3.58 -0.17
PRICES OF METALS IN LME/ COMEX/ NYMEX (in US $)
Strong demand for US currency from importers and banks, continuous capital
outflows, widening current account deficit and dollar's strength against other
currencies amid expectation that the Federal Reserve will soon taper its bond-
buying programme have put enormous pressure on the Indian rupee and rupee hit a
historic record low of near to 69.00 against a dollar on Aug 28, 2013 . The falling
rupee will affect the Indian economy and at last the common man.
• India's economic confidence collapsed sharply due to continuous depreciation
of rupee, hitting an all-time low and high Current Account Deficit.
• If the fall of rupee continues, the foreign investment will dry in India thereby
strongly impacting economic growth.
• Slowdown of foreign investment as well as domestic investment will not only
impact the creation of jobs; it also has potential to create job losses.
• A falling rupee will add fuel to the rising import bill of the country and thereby
increasing its Current Account Deficit (CAD). A widening CAD is bound to pose a
threat to the growth of overall economy.
• India is dependent mostly on imports to meet the requirement of crude oil,
coal, edible oil, pulses etc. The cost of imports of these commodities increases
due to falling rupee which has a direct bearing on the inflation. Buying
imported stuff will become a very costly affair. For instance if you bought a
product valued USD 1, you paid around ̀ 54 (month ago) but you will now have to
pay close to ̀ 65-69 for the same product.
• A weak rupee will increase the burden of Oil Marketing Companies (OMCs) and
this will surely be passed on to the consumers. If the OMCs increase fuel prices,
there will be a substantial increase in overall cost of transportation which will
stoke up inflation.
• If rupee continues to slide, RBI will have no option but to raise repo rate. Banks
will have to face the shortage of liquidity and banks will not hesitate to pass it
on the customers. So depreciating rupee can cause loan rates to go up.
• Students who are studying abroad will bear most due to depreciating rupee.
Expenses incurred towards the university/college fee as well as that of living
will shoot up. It may also hurt many India based students who wish to acquire
international qualifications based in India which requires payment of money in
dollar terms.
• The depreciating rupee will dampen your plan of visit abroad as all the
expenses require payment of money in dollar terms.
• On the contrary, a feeble rupee will bring delight to the exporters as goods
exported abroad will fetch dollars which in return will translate into more
rupees. Also, a weak rupee will make Indian produce more competitive in
global markets which will be fruitful for India's exports.
• Depreciation of rupee is also good news for the overseas working Indians who
can gain more on remitting money to their homeland.
Conclusively inflation led by depreciating rupee potentially can hit our pockets
directly which in turn we have to manage our day-to-day expenses and the
financial planning process. So the Indians need to be ready to face the inflation
pinch if positive policy measures are not initiated by the Indian government.
®
-7.49
-4.49
-3.48
-3.08
-2.83
-2.13
-1.64
-0.18
-0.06
0.00
0.00
0.05
0.38
0.92
1.01
1.06
1.12
1.19
1.26
1.29
5.42
-10.00 -8.00 -6.00 -4.00 -2.00 0.00 2.00 4.00 6.00 8.00
SOYABEAN (INDORE)
GOLD KG (MUMBAI)
MASOOR (INDORE)
CHANA (DELHI)
REFINED SOYA OIL (INDORE)
SILVER (DELHI)
CRUDE PALM OIL (KANDLA)
GUR (MUZAFFARNGR.)
MUSTARD (JAIPUR)
MILD STEEL INGOTS (GHAZIABAD)
WHEAT (DELHI)
CORIANDER (KOTA)
RUBBER (KOCHI)
CHILLI (GUNTUR)
CARDAMOM (VANDANMEDU)
MENTHA OIL (CHANDAUSI)
JEERA (UNJHA)
PEPPER MALABAR GAR (KOCHI)
BARLEY (JAIPUR)
TURMERIC (NIZAMABAD)
RAW JUTE (KOLKATA)
CURRENCY
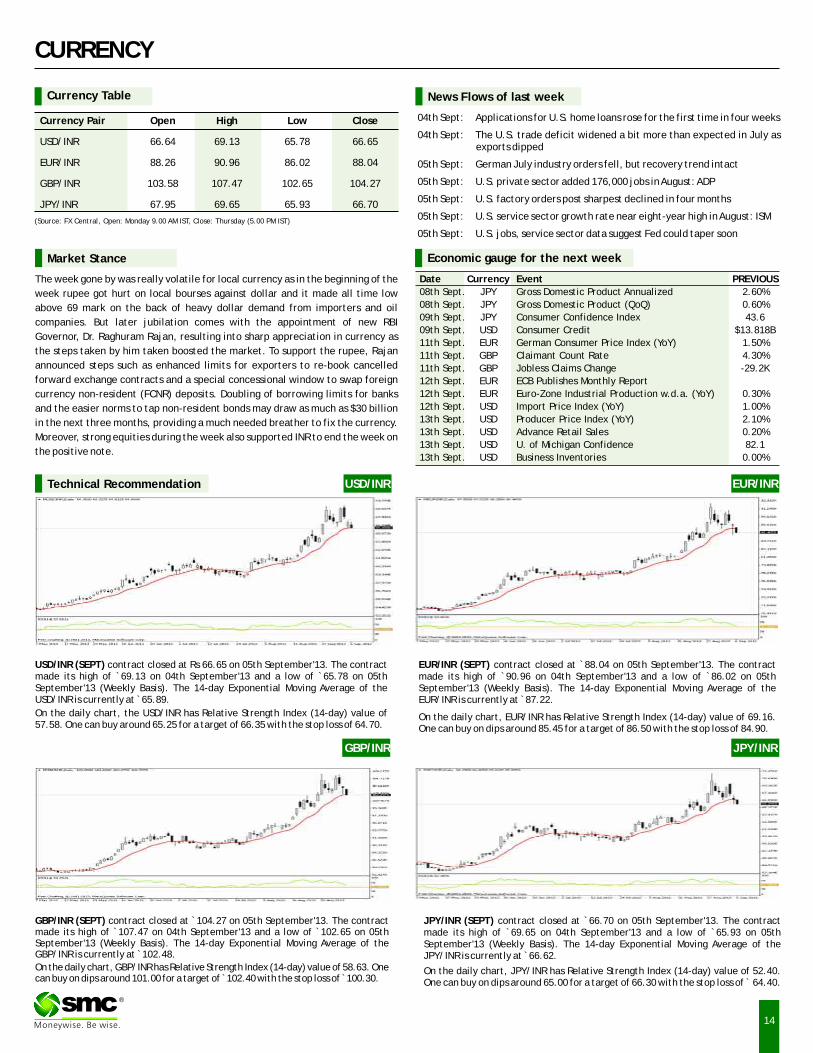
Currency Table
Currency Pair Open High Low Close
USD/INR 66.64 69.13 65.78 66.65
EUR/INR 88.26 90.96 86.02 88.04
GBP/INR 103.58 107.47 102.65 104.27
JPY/INR 67.95 69.65 65.93 66.70
(Source: FX Central, Open: Monday 9.00 AM IST, Close: Thursday (5.00 PM IST)
News Flows of last week
04th Sept: Applications for U.S. home loans rose for the first time in four weeks
04th Sept: The U.S. trade deficit widened a bit more than expected in July as exports dipped
05th Sept: German July industry orders fell, but recovery trend intact
05th Sept: U.S. private sector added 176,000 jobs in August: ADP
05th Sept: U.S. factory orders post sharpest declined in four months
05th Sept: U.S. service sector growth rate near eight-year high in August: ISM
05th Sept: U.S. jobs, service sector data suggest Fed could taper soon
EUR/INR (SEPT) contract closed at 88.04 on 05th September'13. The contract made its high of `90.96 on 04th September'13 and a low of `86.02 on 05th September'13 (Weekly Basis). The 14-day Exponential Moving Average of the EUR/INR is currently at ̀ 87.22.
On the daily chart, EUR/INR has Relative Strength Index (14-day) value of 69.16. One can buy on dips around 85.45 for a target of 86.50 with the stop loss of 84.90.
`
JPY/INR (SEPT) contract closed at 66.70 on 05th September'13. The contract made its high of `69.65 on 04th September'13 and a low of `65.93 on 05th September'13 (Weekly Basis). The 14-day Exponential Moving Average of the JPY/INR is currently at ̀ 66.62.
On the daily chart, JPY/INR has Relative Strength Index (14-day) value of 52.40. One can buy on dips around 65.00 for a target of 66.30 with the stop loss of ̀ 64.40.
`
Market Stance
The week gone by was really volatile for local currency as in the beginning of the
week rupee got hurt on local bourses against dollar and it made all time low
above 69 mark on the back of heavy dollar demand from importers and oil
companies. But later jubilation comes with the appointment of new RBI
Governor, Dr. Raghuram Rajan, resulting into sharp appreciation in currency as
the steps taken by him taken boosted the market. To support the rupee, Rajan
announced steps such as enhanced limits for exporters to re-book cancelled
forward exchange contracts and a special concessional window to swap foreign
currency non-resident (FCNR) deposits. Doubling of borrowing limits for banks
and the easier norms to tap non-resident bonds may draw as much as $30 billion
in the next three months, providing a much needed breather to fix the currency.
Moreover, strong equities during the week also supported INR to end the week on
the positive note.
EUR/INR
USD/INR (SEPT) contract closed at Rs 66.65 on 05th September'13. The contract made its high of `69.13 on 04th September'13 and a low of `65.78 on 05th September'13 (Weekly Basis). The 14-day Exponential Moving Average of the USD/INR is currently at ̀ 65.89.
On the daily chart, the USD/INR has Relative Strength Index (14-day) value of 57.58. One can buy around 65.25 for a target of 66.35 with the stop loss of 64.70.
GBP/INR (SEPT) contract closed at 104.27 on 05th September'13. The contract made its high of `107.47 on 04th September'13 and a low of `102.65 on 05th September'13 (Weekly Basis). The 14-day Exponential Moving Average of the GBP/INR is currently at ̀ 102.48.
On the daily chart, GBP/INR has Relative Strength Index (14-day) value of 58.63. One can buy on dips around 101.00 for a target of ̀ 102.40 with the stop loss of ̀ 100.30.
`
USD/INRTechnical Recommendation
GBP/INR JPY/INR
14
®
Economic gauge for the next week
Date Currency Event PREVIOUS
08th Sept. JPY Gross Domestic Product Annualized 2.60%
08th Sept. JPY Gross Domestic Product (QoQ) 0.60%
09th Sept. JPY Consumer Confidence Index 43.6
09th Sept. USD Consumer Credit $13.818B
11th Sept. EUR German Consumer Price Index (YoY) 1.50%
11th Sept. GBP Claimant Count Rate 4.30%
11th Sept. GBP Jobless Claims Change -29.2K
12th Sept. EUR ECB Publishes Monthly Report
12th Sept. EUR Euro-Zone Industrial Production w.d.a. (YoY) 0.30%
12th Sept. USD Import Price Index (YoY) 1.00%
13th Sept. USD Producer Price Index (YoY) 2.10%
13th Sept. USD Advance Retail Sales 0.20%
13th Sept. USD U. of Michigan Confidence 82.1
13th Sept. USD Business Inventories 0.00%
IPOIPO
INDIAN IPO NEWS
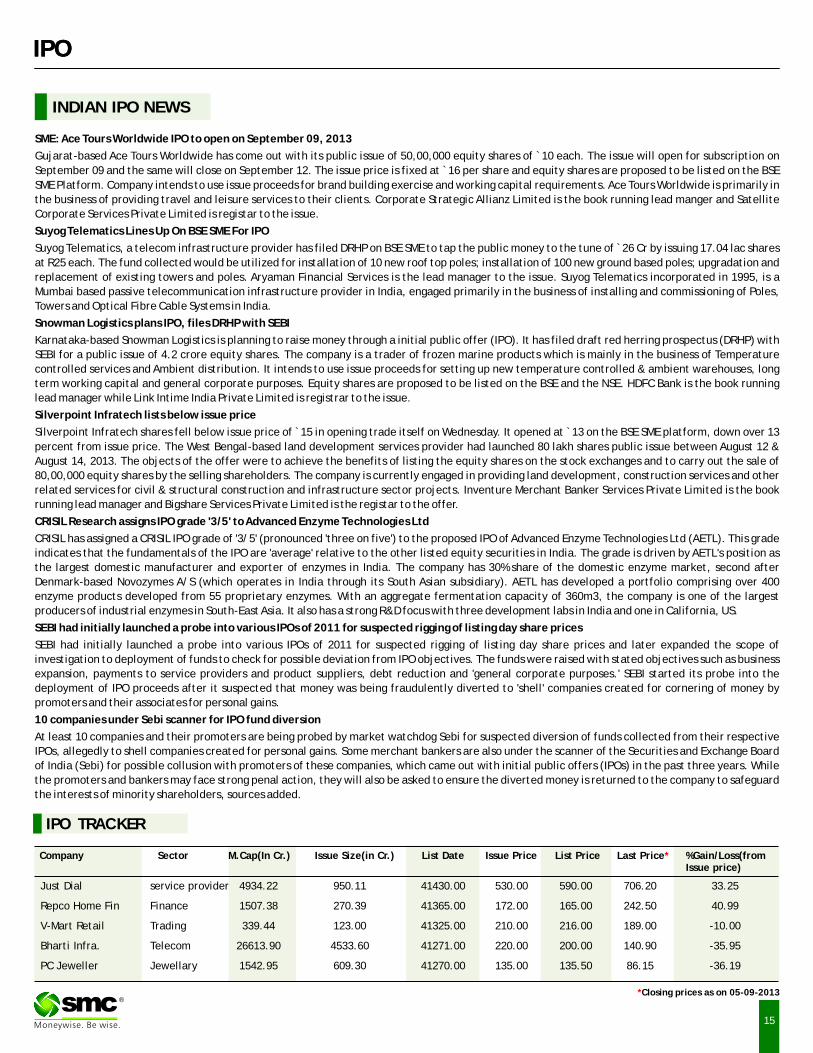
SME: Ace Tours Worldwide IPO to open on September 09, 2013
Gujarat-based Ace Tours Worldwide has come out with its public issue of 50,00,000 equity shares of `10 each. The issue will open for subscription on
September 09 and the same will close on September 12. The issue price is fixed at ̀ 16 per share and equity shares are proposed to be listed on the BSE
SME Platform. Company intends to use issue proceeds for brand building exercise and working capital requirements. Ace Tours Worldwide is primarily in
the business of providing travel and leisure services to their clients. Corporate Strategic Allianz Limited is the book running lead manger and Satellite
Corporate Services Private Limited is registar to the issue.
Suyog Telematics Lines Up On BSE SME For IPO
Suyog Telematics, a telecom infrastructure provider has filed DRHP on BSE SME to tap the public money to the tune of ̀ 26 Cr by issuing 17.04 lac shares
at R25 each. The fund collected would be utilized for installation of 10 new roof top poles; installation of 100 new ground based poles; upgradation and
replacement of existing towers and poles. Aryaman Financial Services is the lead manager to the issue. Suyog Telematics incorporated in 1995, is a
Mumbai based passive telecommunication infrastructure provider in India, engaged primarily in the business of installing and commissioning of Poles,
Towers and Optical Fibre Cable Systems in India.
Snowman Logistics plans IPO, files DRHP with SEBI
Karnataka-based Snowman Logistics is planning to raise money through a initial public offer (IPO). It has filed draft red herring prospectus (DRHP) with
SEBI for a public issue of 4.2 crore equity shares. The company is a trader of frozen marine products which is mainly in the business of Temperature
controlled services and Ambient distribution. It intends to use issue proceeds for setting up new temperature controlled & ambient warehouses, long
term working capital and general corporate purposes. Equity shares are proposed to be listed on the BSE and the NSE. HDFC Bank is the book running
lead manager while Link Intime India Private Limited is registrar to the issue.
Silverpoint Infratech lists below issue price
Silverpoint Infratech shares fell below issue price of ̀ 15 in opening trade itself on Wednesday. It opened at ̀ 13 on the BSE SME platform, down over 13
percent from issue price. The West Bengal-based land development services provider had launched 80 lakh shares public issue between August 12 &
August 14, 2013. The objects of the offer were to achieve the benefits of listing the equity shares on the stock exchanges and to carry out the sale of
80,00,000 equity shares by the selling shareholders. The company is currently engaged in providing land development, construction services and other
related services for civil & structural construction and infrastructure sector projects. Inventure Merchant Banker Services Private Limited is the book
running lead manager and Bigshare Services Private Limited is the registar to the offer.
CRISIL Research assigns IPO grade '3/5' to Advanced Enzyme Technologies Ltd
CRISIL has assigned a CRISIL IPO grade of '3/5' (pronounced 'three on five') to the proposed IPO of Advanced Enzyme Technologies Ltd (AETL). This grade
indicates that the fundamentals of the IPO are 'average' relative to the other listed equity securities in India. The grade is driven by AETL's position as
the largest domestic manufacturer and exporter of enzymes in India. The company has 30% share of the domestic enzyme market, second after
Denmark-based Novozymes A/S (which operates in India through its South Asian subsidiary). AETL has developed a portfolio comprising over 400
enzyme products developed from 55 proprietary enzymes. With an aggregate fermentation capacity of 360m3, the company is one of the largest
producers of industrial enzymes in South-East Asia. It also has a strong R&D focus with three development labs in India and one in California, US.
SEBI had initially launched a probe into various IPOs of 2011 for suspected rigging of listing day share prices
SEBI had initially launched a probe into various IPOs of 2011 for suspected rigging of listing day share prices and later expanded the scope of
investigation to deployment of funds to check for possible deviation from IPO objectives. The funds were raised with stated objectives such as business
expansion, payments to service providers and product suppliers, debt reduction and 'general corporate purposes.' SEBI started its probe into the
deployment of IPO proceeds after it suspected that money was being fraudulently diverted to 'shell' companies created for cornering of money by
promoters and their associates for personal gains.
10 companies under Sebi scanner for IPO fund diversion
At least 10 companies and their promoters are being probed by market watchdog Sebi for suspected diversion of funds collected from their respective
IPOs, allegedly to shell companies created for personal gains. Some merchant bankers are also under the scanner of the Securities and Exchange Board
of India (Sebi) for possible collusion with promoters of these companies, which came out with initial public offers (IPOs) in the past three years. While
the promoters and bankers may face strong penal action, they will also be asked to ensure the diverted money is returned to the company to safeguard
the interests of minority shareholders, sources added.
®
Just Dial service provider 4934.22 950.11 41430.00 530.00 590.00 706.20 33.25
Repco Home Fin Finance 1507.38 270.39 41365.00 172.00 165.00 242.50 40.99
V-Mart Retail Trading 339.44 123.00 41325.00 210.00 216.00 189.00 -10.00
Bharti Infra. Telecom 26613.90 4533.60 41271.00 220.00 200.00 140.90 -35.95
PC Jeweller Jewellary 1542.95 609.30 41270.00 135.00 135.50 86.15 -36.19
Company Sector M.Cap(In Cr.) Issue Size(in Cr.) List Date Issue Price List Price Last Price %Gain/Loss(from Issue price)
*
IPO TRACKER
*Closing prices as on 05-09-2013
15
FIXED DEPOSIT MONITOR
16
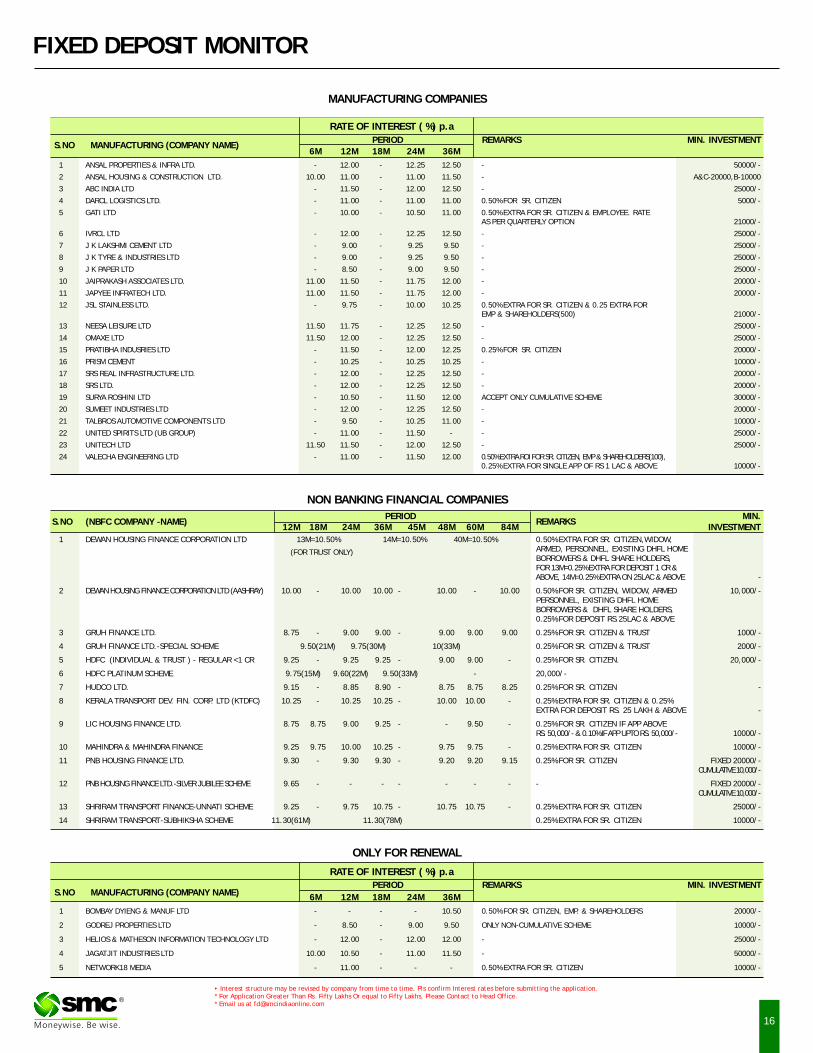
PERIOD REMARKS MIN. INVESTMENTS.NO MANUFACTURING (COMPANY NAME)
6M 12M 18M 24M 36M
1 ANSAL PROPERTIES & INFRA LTD. - 12.00 - 12.25 12.50 - 50000/-
2 ANSAL HOUSING & CONSTRUCTION LTD. 10.00 11.00 - 11.00 11.50 - A&C-20000,B-10000
3 ABC INDIA LTD - 11.50 - 12.00 12.50 - 25000/-
4 DARCL LOGISTICS LTD. - 11.00 - 11.00 11.00 0.50% FOR SR. CITIZEN 5000/-
5 GATI LTD - 10.00 - 10.50 11.00 0.50% EXTRA FOR SR. CITIZEN & EMPLOYEE. RATE AS PER QUARTERLY OPTION 21000/-
6 IVRCL LTD - 12.00 - 12.25 12.50 - 25000/-
7 J K LAKSHMI CEMENT LTD - 9.00 - 9.25 9.50 - 25000/-
8 J K TYRE & INDUSTRIES LTD - 9.00 - 9.25 9.50 - 25000/-
9 J K PAPER LTD - 8.50 - 9.00 9.50 - 25000/-
10 JAIPRAKASH ASSOCIATES LTD. 11.00 11.50 - 11.75 12.00 - 20000/-
11 JAPYEE INFRATECH LTD. 11.00 11.50 - 11.75 12.00 - 20000/-
12 JSL STAINLESS LTD. - 9.75 - 10.00 10.25 0.50% EXTRA FOR SR. CITIZEN & 0.25 EXTRA FOR EMP & SHAREHOLDERS(500) 21000/-
13 NEESA LEISURE LTD 11.50 11.75 - 12.25 12.50 - 25000/-
14 OMAXE LTD 11.50 12.00 - 12.25 12.50 - 25000/-
15 PRATIBHA INDUSRIES LTD - 11.50 - 12.00 12.25 0.25% FOR SR. CITIZEN 20000/-
16 PRISM CEMENT - 10.25 - 10.25 10.25 - 10000/-
17 SRS REAL INFRASTRUCTURE LTD. - 12.00 - 12.25 12.50 - 20000/-
18 SRS LTD. - 12.00 - 12.25 12.50 - 20000/-
19 SURYA ROSHINI LTD - 10.50 - 11.50 12.00 ACCEPT ONLY CUMULATIVE SCHEME 30000/-
20 SUMEET INDUSTRIES LTD - 12.00 - 12.25 12.50 - 20000/-
21 TALBROS AUTOMOTIVE COMPONENTS LTD - 9.50 - 10.25 11.00 - 10000/-
22 UNITED SPIRITS LTD (UB GROUP) - 11.00 - 11.50 - - 25000/-
23 UNITECH LTD 11.50 11.50 - 12.00 12.50 - 25000/-
24 VALECHA ENGINEERING LTD - 11.00 - 11.50 12.00 0.50% EXTRA ROI FOR SR. CITIZEN, EMP & SHAREHOLDERS(100), 0.25% EXTRA FOR SINGLE APP OF RS 1 LAC & ABOVE 10000/-
RATE OF INTEREST ( %) p.a
MANUFACTURING COMPANIES
• Interest structure may be revised by company from time to time. Pls confirm Interest rates before submitting the application. * For Application Greater Than Rs. Fifty Lakhs Or equal to Fifty Lakhs, Please Contact to Head Office.* Email us at [email protected]
ONLY FOR RENEWAL
PERIOD REMARKS MIN. INVESTMENTS.NO MANUFACTURING (COMPANY NAME)
6M 12M 18M 24M 36M
1 BOMBAY DYIENG & MANUF LTD - - - - 10.50 0.50% FOR SR. CITIZEN, EMP. & SHAREHOLDERS 20000/-
2 GODREJ PROPERTIES LTD - 8.50 - 9.00 9.50 ONLY NON-CUMULATIVE SCHEME 10000/-
3 HELIOS & MATHESON INFORMATION TECHNOLOGY LTD - 12.00 - 12.00 12.00 - 25000/-
4 JAGATJIT INDUSTRIES LTD 10.00 10.50 - 11.00 11.50 - 50000/-
5 NETWORK18 MEDIA - 11.00 - - - 0.50% EXTRA FOR SR. CITIZEN 10000/-
RATE OF INTEREST ( %) p.a
NON BANKING FINANCIAL COMPANIES
PERIOD MIN.S.NO (NBFC COMPANY -NAME) REMARKS
12M 18M 24M 36M 45M 48M 60M 84M INVESTMENT
1 DEWAN HOUSING FINANCE CORPORATION LTD 13M=10.50% 14M=10.50% 40M=10.50% 0.50% EXTRA FOR SR. CITIZEN,WIDOW, ARMED, PERSONNEL, EXISTING DHFL HOME BORROWERS & DHFL SHARE HOLDERS, FOR 13M=0.25% EXTRA FOR DEPOSIT 1 CR & ABOVE, 14M=0.25% EXTRA ON 25LAC & ABOVE -
2 DEWAN HOUSING FINANCE CORPORATION LTD (AASHRAY) 10.00 - 10.00 10.00 - 10.00 - 10.00 0.50% FOR SR. CITIZEN, WIDOW, ARMED 10,000/-PERSONNEL, EXISTING DHFL HOME BORROWERS & DHFL SHARE HOLDERS, 0.25% FOR DEPOSIT RS.25LAC & ABOVE
3 GRUH FINANCE LTD. 8.75 - 9.00 9.00 - 9.00 9.00 9.00 0.25% FOR SR. CITIZEN & TRUST 1000/-
4 GRUH FINANCE LTD.-SPECIAL SCHEME 9.50(21M) 9.75(30M) 10(33M) 0.25% FOR SR. CITIZEN & TRUST 2000/-
5 HDFC (INDIVIDUAL & TRUST ) - REGULAR <1 CR 9.25 - 9.25 9.25 - 9.00 9.00 - 0.25% FOR SR. CITIZEN. 20,000/-
6 HDFC PLATINUM SCHEME 9.75(15M) 9.60(22M) 9.50(33M) - 20,000/-
7 HUDCO LTD. 9.15 - 8.85 8.90 - 8.75 8.75 8.25 0.25% FOR SR. CITIZEN -
8 KERALA TRANSPORT DEV. FIN. CORP. LTD (KTDFC) 10.25 - 10.25 10.25 - 10.00 10.00 - 0.25% EXTRA FOR SR. CITIZEN & 0.25% EXTRA FOR DEPOSIT RS. 25 LAKH & ABOVE -
9 LIC HOUSING FINANCE LTD. 8.75 8.75 9.00 9.25 - - 9.50 - 0.25% FOR SR. CITIZEN IF APP ABOVE RS. 50,000/- & 0.10% IF APP UPTO RS. 50,000/- 10000/-
10 MAHINDRA & MAHINDRA FINANCE 9.25 9.75 10.00 10.25 - 9.75 9.75 - 0.25% EXTRA FOR SR. CITIZEN 10000/-
11 PNB HOUSING FINANCE LTD. 9.30 - 9.30 9.30 - 9.20 9.20 9.15 0.25% FOR SR. CITIZEN FIXED 20000/- CUMULATIVE 10,000/-
12 PNB HOUSING FINANCE LTD.-SILVER JUBILEE SCHEME 9.65 - - - - - - - - FIXED 20000/- CUMULATIVE 10,000/-
13 SHRIRAM TRANSPORT FINANCE-UNNATI SCHEME 9.25 - 9.75 10.75 - 10.75 10.75 - 0.25% EXTRA FOR SR. CITIZEN 25000/-
14 SHRIRAM TRANSPORT-SUBHIKSHA SCHEME 11.30(61M) 11.30(78M) 0.25% EXTRA FOR SR. CITIZEN 10000/-
(FOR TRUST ONLY)
®

MUTUAL FUND
NEWS
Sundaram MF introduces Fixed Term Plan -DW (366 days)
Sundaram Mutual Fund has launched the New Fund Offer (NFO) Sundaram Fixed Term Plan -DW (366 days), a Close Ended income scheme. The NFO opens for
subscription on Sep 5, 2013, and closes on Sep 10, 2013. The investment objective of the scheme is to generate income with minimum volatility by investing in
debt and money market securities, which mature on or before the maturity of the scheme.
ICICI Prudential MF introduces Multiple Yield Fund - Series 5 - 1100 Days - Plan A
ICICI Prudential Mutual Fund has launched the New Fund Offer (NFO) of ICICI Prudential Multiple Yield Fund - Series 5 - 1100 Days - Plan A, a Close Ended income
scheme. The NFO opens for subscription on Sep 5, 2013, and closes on Sep 19, 2013. The investment objective of the scheme is to generate returns by investing in
a portfolio of fixed income securities/ debt instruments. The secondary objective of the Scheme is to generate long term capital appreciation by investing a
portion of the Scheme's assets in equity and equity related instruments. However, there can be no assurance that the investment objective of the under the
Scheme will be realized.
ICICI Prudential MF introduces Fixed Maturity Plan-Series 70-369 Days Plan E
ICICI Prudential Mutual Fund has launched the New Fund Offer (NFO) of ICICI Prudential Fixed Maturity Plan-Series 70-369 Days Plan E, a close ended income
scheme. The NFO opens for subscription on Sep 4, 2013, and closes on Sep 11, 2013. The investment objective of the scheme is to generate income by investing in
a portfolio of fixed income securities/debt instruments maturing on or before the maturity of the Scheme. However, there can be no assurance that the
investment objective of the Scheme will be realized.
ICICI Prudential MF introduces Fixed Maturity Plan-Series 69-1092 Days Plan L
ICICI Prudential Mutual Fund has launched the New Fund Offer (NFO) of ICICI Prudential Fixed Maturity Plan-Series 69-1092 Days Plan L, a close ended income
scheme. The NFO opens for subscription on Sep 4, 2013, and closes on Sep 12, 2013. The investment objective of the scheme is to generate income by investing in
a portfolio of fixed income securities/debt instruments maturing on or before the maturity of the Scheme. However, there can be no assurance that the
investment objective of the Scheme will be realized.
Tata MF introduces Fixed Maturity Plan Series 44 - Scheme A (370 days maturity)
Tata Mutual Fund has launched the New Fund Offer (NFO) of Tata Fixed Maturity Plan Series 44 - Scheme A (370 days maturity), a close ended income scheme. The
NFO opens for subscription on Sep 2, 2013, and closes on Sep 10, 2013. The investment objective of the scheme is to generate income and / or capital
appreciation by investing in wide range of Fixed Income Instruments having maturity in line with the maturity of the scheme. The maturity of all investments
shall be equal to or less than the maturity of a scheme.
Kotak Mahindra MF introduces FMP Series 118 (370 Days)
Kotak Mahindra Mutual Fund has launched the New Fund Offer (NFO) of Kotak FMP Series 118 (370 Days), a Close Ended income scheme. The NFO opens for
subscription on Sep 5, 2013, and closes on Sep 10, 2013. The investment objective of the scheme is to generate returns through investments in debt and money
market instruments with a view to reduce the interest rate risk. The Scheme will invest in debt and money market securities, maturing on or before maturity of
the scheme. There is no assurance that the investment objective of the Scheme will be achieved.
Deutsche MF introduces DWS Fixed Maturity Plan- Series 36(DFMP-36)
Deutsche Mutual Fund has launched the New Fund Offer (NFO) of DWS Fixed Maturity Plan- Series 36(DFMP-36), a close ended income scheme. The NFO opens for
subscription on Sep 3, 2013, and closes on Sep 10, 2013. The investment objective of the scheme is to generate income by investing in debt and money market
instruments maturing on or before the date of the maturity of the Scheme.
17
®
NFOs WATCH
Fund Name NFO NFO Scheme Objective Fund Type Fund Class Fund Manager MinimumOpens on Closes on Amount
10-Sep-2013 11-Sep-2013 Open-Ended Growth `5000/-DSP BlackRock Banking & PSU Debt Fund - Regular Plan (G)
Dhawal Dalalto seek to generate income and capital appreciation by primarily investing in a portfolio of high quality debt and money market securities that are issued by banks and public sector entities/undertakings.
27-Aug-2013 10-Sep-2013 Open-Ended Growth `5000/-ICICI Prudential Global Stable Equity Fund - Regular Plan (G)
Atul Patel / Avnish Jain
to provide adequate returns by investing in the units of one or more overseas mutual fund schemes, which have the mandate to invest globally.
18
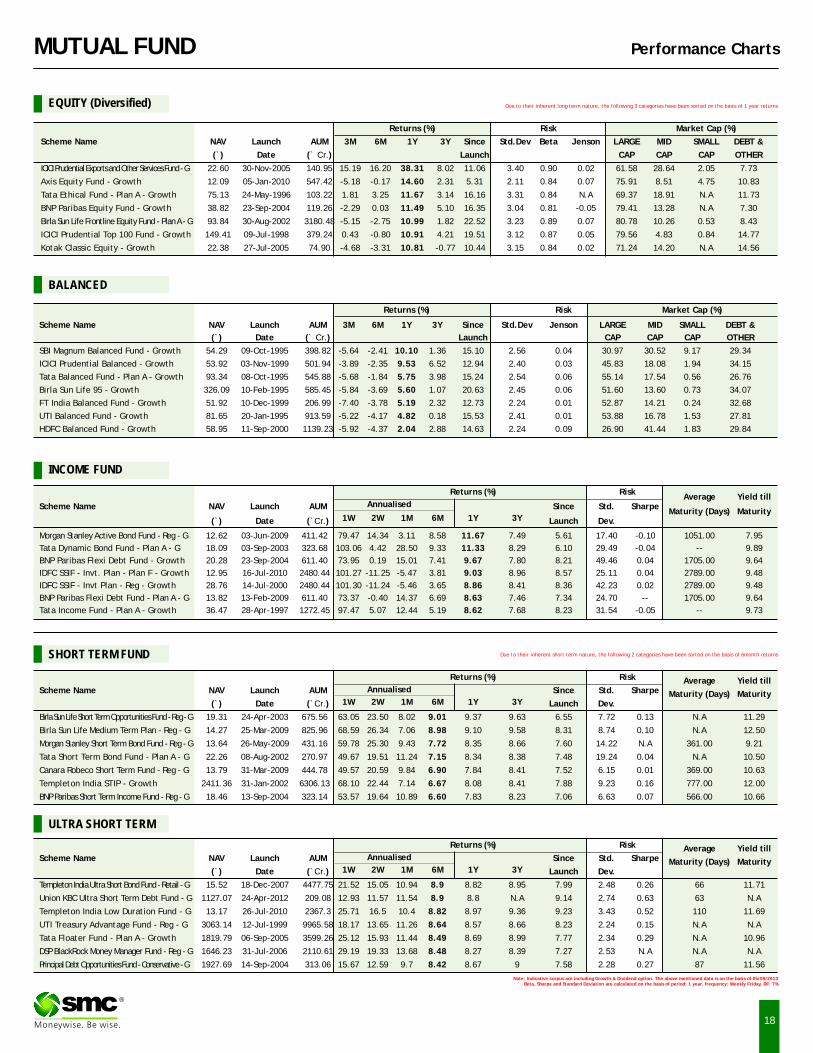
MUTUAL FUND Performance Charts
Returns (%) Risk Market Cap (%)
Scheme Name NAV Launch AUM 3M 6M 1Y 3Y Since Std.Dev Beta Jenson LARGE MID SMALL DEBT &
(`) Date (` Cr.) Launch CAP CAP CAP OTHER
ICICI Prudential Exports and Other Services Fund - G 22.60 30-Nov-2005 140.95 15.19 16.20 38.31 8.02 11.06 3.40 0.90 0.02 61.58 28.64 2.05 7.73
Axis Equity Fund - Growth 12.09 05-Jan-2010 547.42 -5.18 -0.17 14.60 2.31 5.31 2.11 0.84 0.07 75.91 8.51 4.75 10.83
Tata Ethical Fund - Plan A - Growth 75.13 24-May-1996 103.22 1.81 3.25 11.67 3.14 16.16 3.31 0.84 N.A 69.37 18.91 N.A 11.73
BNP Paribas Equity Fund - Growth 38.82 23-Sep-2004 119.26 -2.29 0.03 11.49 5.10 16.35 3.04 0.81 -0.05 79.41 13.28 N.A 7.30
Birla Sun Life Frontline Equity Fund - Plan A - G 93.84 30-Aug-2002 3180.48 -5.15 -2.75 10.99 1.82 22.52 3.23 0.89 0.07 80.78 10.26 0.53 8.43
ICICI Prudential Top 100 Fund - Growth 149.41 09-Jul-1998 379.24 0.43 -0.80 10.91 4.21 19.51 3.12 0.87 0.05 79.56 4.83 0.84 14.77
Kotak Classic Equity - Growth 22.38 27-Jul-2005 74.90 -4.68 -3.31 10.81 -0.77 10.44 3.15 0.84 0.02 71.24 14.20 N.A 14.56
EQUITY (Diversified)
BALANCED
INCOME FUND
Note: Indicative corpus are including Growth & Dividend option. The above mentioned data is on the basis of 05/09/2013Beta, Sharpe and Standard Deviation are calculated on the basis of period: 1 year, frequency: Weekly Friday, RF: 7%
ULTRA SHORT TERM
SHORT TERM FUND
Due to their inherent long term nature, the following 3 categories have been sorted on the basis of 1 year returns
Due to their inherent short term nature, the following 2 categories have been sorted on the basis of 6month returns
Returns (%) Risk Market Cap (%)
Scheme Name NAV Launch AUM 3M 6M 1Y 3Y Since Std.Dev Jenson LARGE MID SMALL DEBT &
(`) Date (` Cr.) Launch CAP CAP CAP OTHER
SBI Magnum Balanced Fund - Growth 54.29 09-Oct-1995 398.82 -5.64 -2.41 10.10 1.36 15.10 2.56 0.04 30.97 30.52 9.17 29.34
ICICI Prudential Balanced - Growth 53.92 03-Nov-1999 501.94 -3.89 -2.35 9.53 6.52 12.94 2.40 0.03 45.83 18.08 1.94 34.15
Tata Balanced Fund - Plan A - Growth 93.34 08-Oct-1995 545.88 -5.68 -1.84 5.75 3.98 15.24 2.54 0.06 55.14 17.54 0.56 26.76
Birla Sun Life 95 - Growth 326.09 10-Feb-1995 585.45 -5.84 -3.69 5.60 1.07 20.63 2.45 0.06 51.60 13.60 0.73 34.07
FT India Balanced Fund - Growth 51.92 10-Dec-1999 206.99 -7.40 -3.78 5.19 2.32 12.73 2.24 0.01 52.87 14.21 0.24 32.68
UTI Balanced Fund - Growth 81.65 20-Jan-1995 913.59 -5.22 -4.17 4.82 0.18 15.53 2.41 0.01 53.88 16.78 1.53 27.81
HDFC Balanced Fund - Growth 58.95 11-Sep-2000 1139.23 -5.92 -4.37 2.04 2.88 14.63 2.24 0.09 26.90 41.44 1.83 29.84
Returns (%) RiskAverage Yield till
Scheme Name NAV Launch AUM Since Std. SharpeMaturity (Days) Maturity
1W 2W 1M 6M 1Y 3Y(`) Date (`Cr.) Launch Dev.
Morgan Stanley Active Bond Fund - Reg - G 12.62 03-Jun-2009 411.42 79.47 14.34 3.11 8.58 11.67 7.49 5.61 17.40 -0.10 1051.00 7.95
Tata Dynamic Bond Fund - Plan A - G 18.09 03-Sep-2003 323.68 103.06 4.42 28.50 9.33 11.33 8.29 6.10 29.49 -0.04 -- 9.89
BNP Paribas Flexi Debt Fund - Growth 20.28 23-Sep-2004 611.40 73.95 0.19 15.01 7.41 9.67 7.80 8.21 49.46 0.04 1705.00 9.64
IDFC SSIF - Invt. Plan - Plan F - Growth 12.95 16-Jul-2010 2480.44 101.27 -11.25 -5.47 3.81 9.03 8.96 8.57 25.11 0.04 2789.00 9.48
IDFC SSIF - Invt Plan - Reg - Growth 28.76 14-Jul-2000 2480.44 101.30 -11.24 -5.46 3.65 8.86 8.41 8.36 42.23 0.02 2789.00 9.48
BNP Paribas Flexi Debt Fund - Plan A - G 13.82 13-Feb-2009 611.40 73.37 -0.40 14.37 6.69 8.63 7.46 7.34 24.70 -- 1705.00 9.64
Tata Income Fund - Plan A - Growth 36.47 28-Apr-1997 1272.45 97.47 5.07 12.44 5.19 8.62 7.68 8.23 31.54 -0.05 -- 9.73
Annualised
Returns (%) Risk Average Yield tillScheme Name NAV Launch AUM Since Std. Sharpe Maturity (Days) Maturity
1W 2W 1M 6M 1Y 3Y(`) Date (`Cr.) Launch Dev.
Birla Sun Life Short Term Opportunities Fund - Reg - G 19.31 24-Apr-2003 675.56 63.05 23.50 8.02 9.01 9.37 9.63 6.55 7.72 0.13 N.A 11.29
Birla Sun Life Medium Term Plan - Reg - G 14.27 25-Mar-2009 825.96 68.59 26.34 7.06 8.98 9.10 9.58 8.31 8.74 0.10 N.A 12.50
Morgan Stanley Short Term Bond Fund - Reg - G 13.64 26-May-2009 431.16 59.78 25.30 9.43 7.72 8.35 8.66 7.60 14.22 N.A 361.00 9.21
Tata Short Term Bond Fund - Plan A - G 22.26 08-Aug-2002 270.97 49.67 19.51 11.24 7.15 8.34 8.38 7.48 19.24 0.04 N.A 10.50
Canara Robeco Short Term Fund - Reg - G 13.79 31-Mar-2009 444.78 49.57 20.59 9.84 6.90 7.84 8.41 7.52 6.15 0.01 369.00 10.63
Templeton India STIP - Growth 2411.36 31-Jan-2002 6306.13 68.10 22.44 7.14 6.67 8.08 8.41 7.88 9.23 0.16 777.00 12.00
BNP Paribas Short Term Income Fund - Reg - G 18.46 13-Sep-2004 323.14 53.57 19.64 10.89 6.60 7.83 8.23 7.06 6.63 0.07 566.00 10.66
Annualised
Returns (%) Risk Average Yield tillScheme Name NAV Launch AUM Since Std. Sharpe Maturity (Days) Maturity
1W 2W 1M 6M 1Y 3Y(`) Date (`Cr.) Launch Dev.
Templeton India Ultra Short Bond Fund - Retail - G 15.52 18-Dec-2007 4477.75 21.52 15.05 10.94 8.9 8.82 8.95 7.99 2.48 0.26 66 11.71
Union KBC Ultra Short Term Debt Fund - G 1127.07 24-Apr-2012 209.08 12.93 11.57 11.54 8.9 8.8 N.A 9.14 2.74 0.63 63 N.A
Templeton India Low Duration Fund - G 13.17 26-Jul-2010 2367.3 25.71 16.5 10.4 8.82 8.97 9.36 9.23 3.43 0.52 110 11.69
UTI Treasury Advantage Fund - Reg - G 3063.14 12-Jul-1999 9965.58 18.17 13.65 11.26 8.64 8.57 8.66 8.23 2.24 0.15 N.A N.A
Tata Floater Fund - Plan A - Growth 1819.79 06-Sep-2005 3599.26 25.12 15.93 11.44 8.49 8.69 8.99 7.77 2.34 0.29 N.A 10.96
DSP BlackRock Money Manager Fund - Reg - G 1646.23 31-Jul-2006 2110.61 29.19 19.33 13.68 8.48 8.27 8.39 7.27 2.53 N.A N.A N.A
Principal Debt Opportunities Fund - Conservative - G 1927.69 14-Sep-2004 313.06 15.67 12.59 9.7 8.42 8.67 9 7.58 2.28 0.27 87 11.56
Annualised
®

'Ladoo Gopal Decoration' activity organised at SMC to celebrate the occasion of Janmasthmi.