A sustainable & secure transition to a low carbon future sustainable & secure transition to a low...
22
© OECD/IEA 2017 A sustainable & secure transition to a low carbon future Dr. Fatih Birol The Round Table for Studying Energy Situations, METI , Tokyo, 27 February 2018 IEA Executive Director, International Energy Agency Document 5
Transcript of A sustainable & secure transition to a low carbon future sustainable & secure transition to a low...
© OECD/IEA 2017
A sustainable & secure transition to
a low carbon future
Dr. Fatih Birol
The Round Table for Studying Energy Situations, METI , Tokyo, 27 February 2018
IEA
Executive Director, International Energy Agency
Document 5
© OECD/IEA 2017
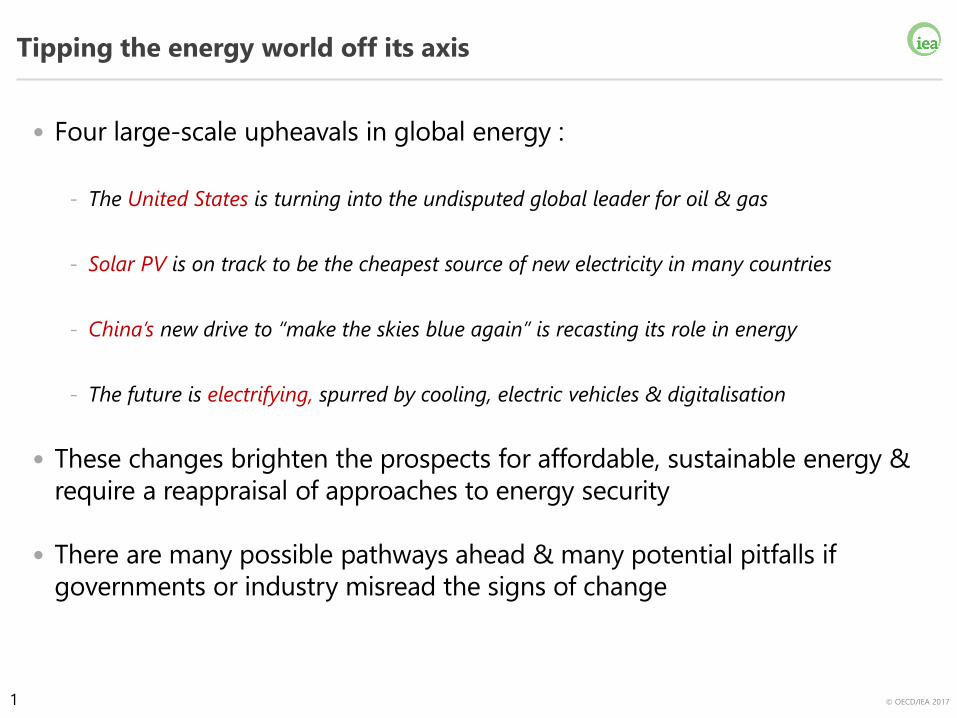
Tipping the energy world off its axis
• Four large-scale upheavals in global energy :
- The United States is turning into the undisputed global leader for oil & gas
- Solar PV is on track to be the cheapest source of new electricity in many countries
- China’s new drive to “make the skies blue again” is recasting its role in energy
- The future is electrifying, spurred by cooling, electric vehicles & digitalisation
• These changes brighten the prospects for affordable, sustainable energy &
require a reappraisal of approaches to energy security
• There are many possible pathways ahead & many potential pitfalls if
governments or industry misread the signs of change
1
© OECD/IEA 2017
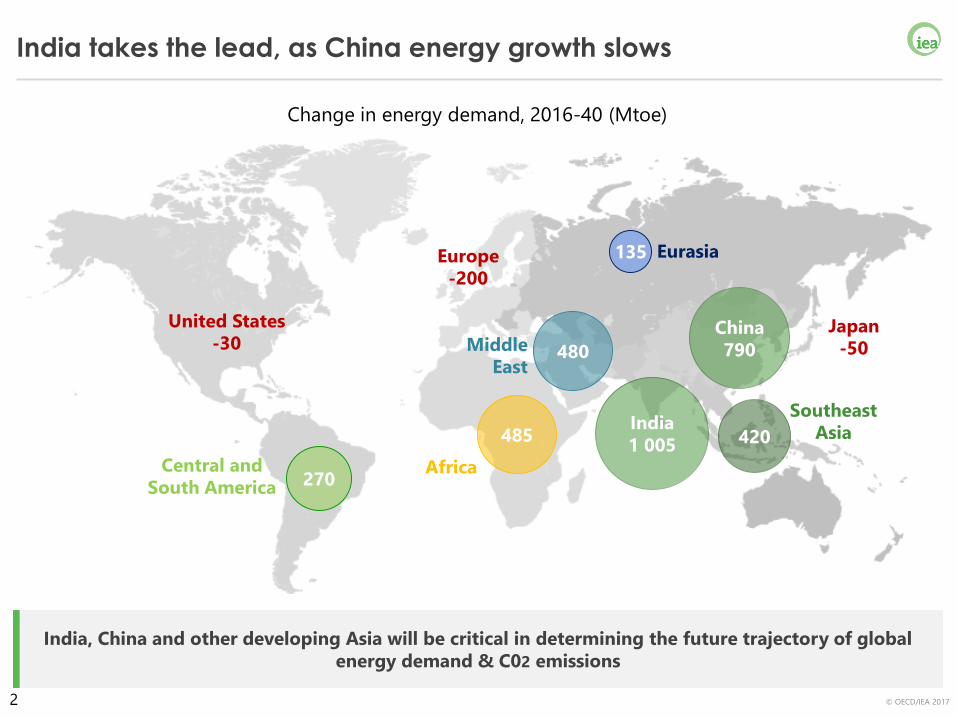
India takes the lead, as China energy growth slows
India, China and other developing Asia will be critical in determining the future trajectory of global
energy demand & C02 emissions
Change in energy demand, 2016-40 (Mtoe)
India
1 005 420
Southeast
Asia
China
790
United States
-30Japan
-50
Europe
-200
270Central and
South America
485
Africa
135 Eurasia
480Middle
East
2
© OECD/IEA 2017
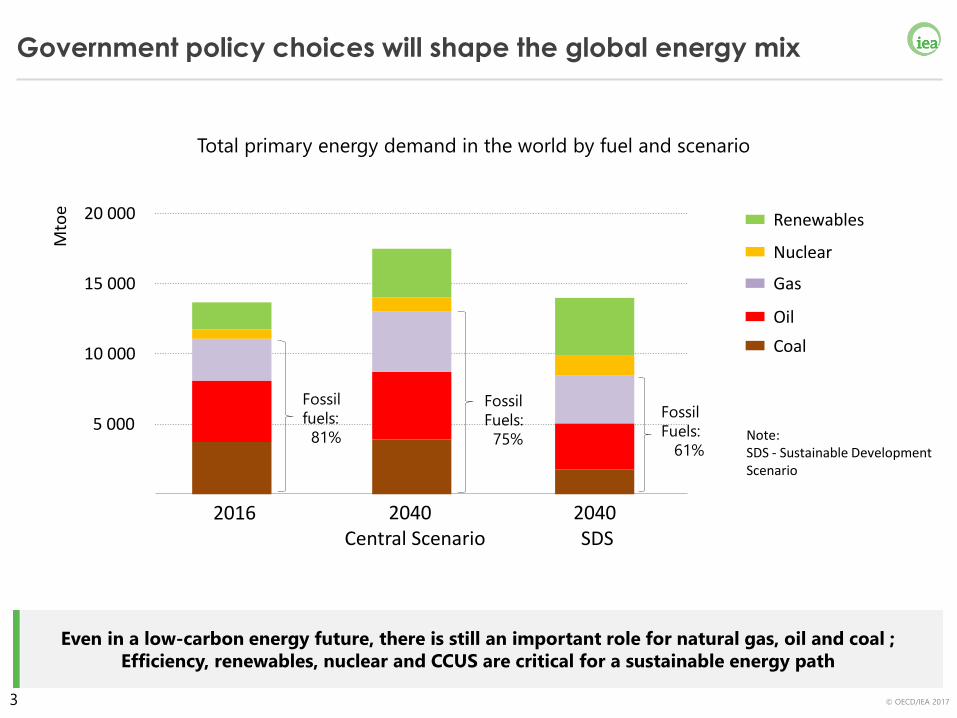
Government policy choices will shape the global energy mix
Even in a low-carbon energy future, there is still an important role for natural gas, oil and coal ;
Efficiency, renewables, nuclear and CCUS are critical for a sustainable energy path
Total primary energy demand in the world by fuel and scenario
5 000
10 000
15 000
20 000
2016 2040 Central Scenario
2040 SDS
Mto
e
Renewables
Nuclear
Gas
Oil
Coal
Note:SDS - Sustainable DevelopmentScenario
Fossil
fuels:
81%
Fossil
Fuels:
75%
Fossil
Fuels:
61%
3
© OECD/IEA 2017
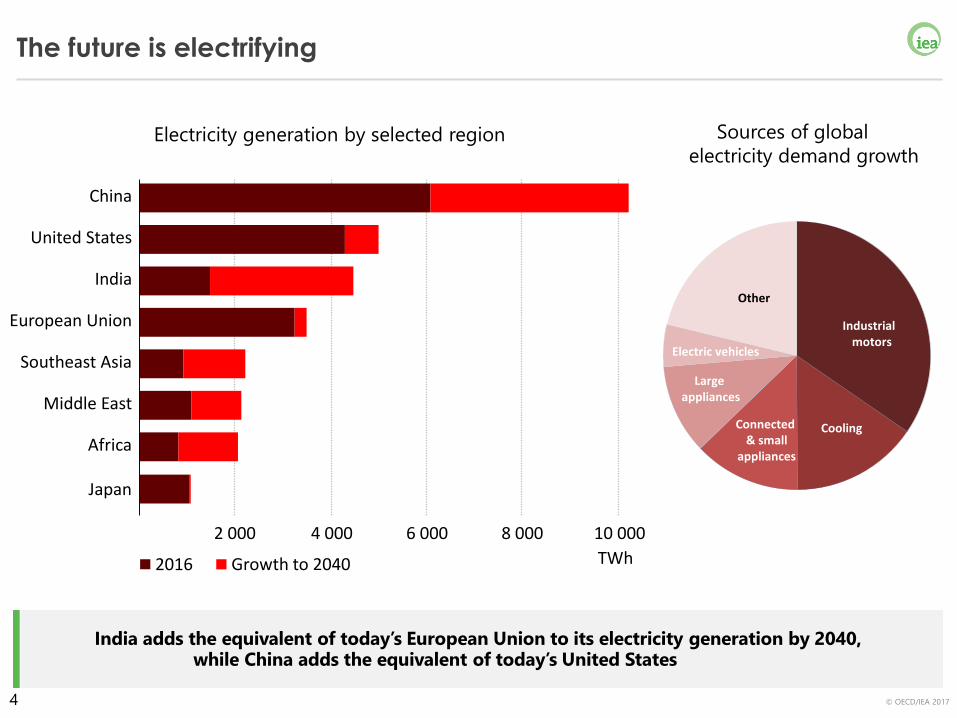
The future is electrifying
India adds the equivalent of today’s European Union to its electricity generation by 2040, while China adds the equivalent of today’s United States
Electricity generation by selected region
Middle East
2 000 4 000 6 000 8 000 10 000
Africa
Southeast Asia
European Union
India
United States
China
TWh2016 Growth to 2040
Sources of global
electricity demand growth
Industrial motors
Cooling
Large appliances
Connected & small
appliances
Electric vehicles
Other
Japan
4
© OECD/IEA 2017
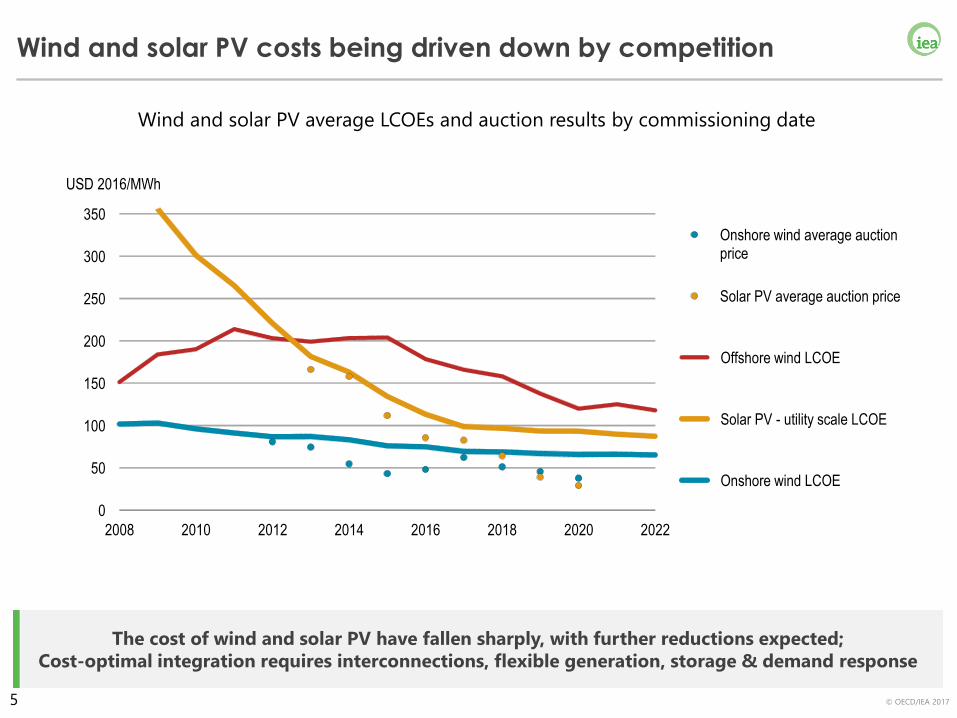
The cost of wind and solar PV have fallen sharply, with further reductions expected;
Cost-optimal integration requires interconnections, flexible generation, storage & demand response
Wind and solar PV average LCOEs and auction results by commissioning date
Wind and solar PV costs being driven down by competition
0
50
100
150
200
250
300
350
2008 2010 2012 2014 2016 2018 2020 2022
USD 2016/MWh
Onshore wind average auctionprice
Solar PV average auction price
Offshore wind LCOE
Solar PV - utility scale LCOE
Onshore wind LCOE
5
© OECD/IEA 2017
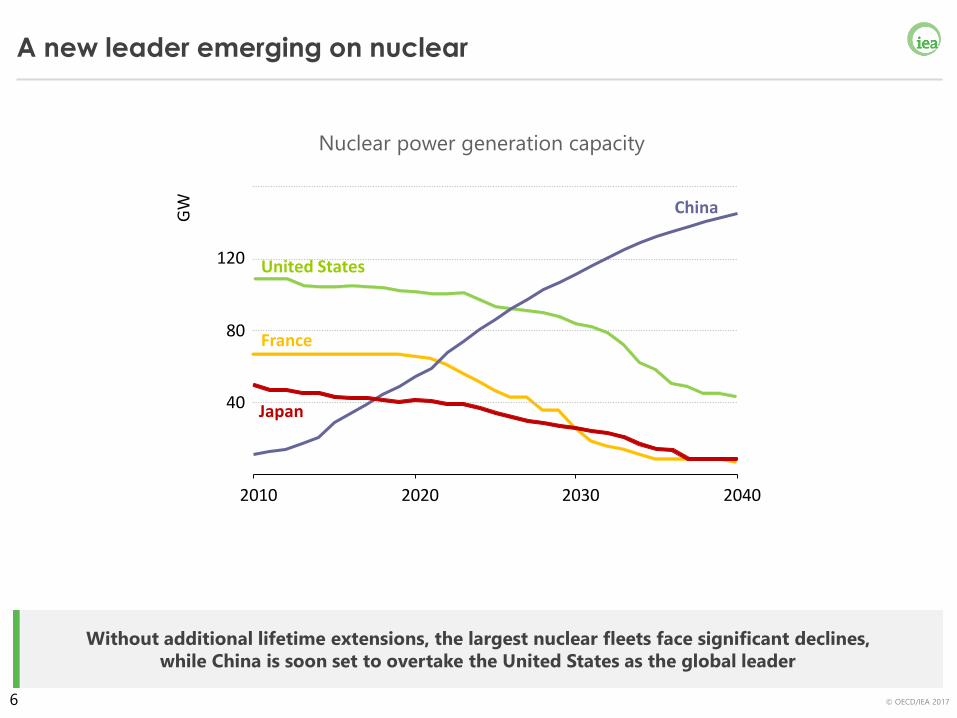
A new leader emerging on nuclear
Without additional lifetime extensions, the largest nuclear fleets face significant declines,
while China is soon set to overtake the United States as the global leader
Nuclear power generation capacity
40
80
120
2010 2020 2030 2040
GW
United States
China
France
Japan
6

© OECD/IEA 2017
The potential of clean energy technology remains under-utilised
Despite good progress in some areas, many technologies still need a strong push to achieve their full
potential and deliver a sustainable energy future
Energy storage Solar PV and onshore wind
Electric vehicles
●Not on track ●Accelerated improvement needed ●On track
Building energy efficiency Transport biofuels
Carbon capture and storage More efficient coal-fired power
Nuclear Transport – Fuel economy of light-duty vehicles
Lighting, appliances and building equipment Energy efficiency in industry
Hydrogen and Fuel Cells
7
© OECD/IEA 2017
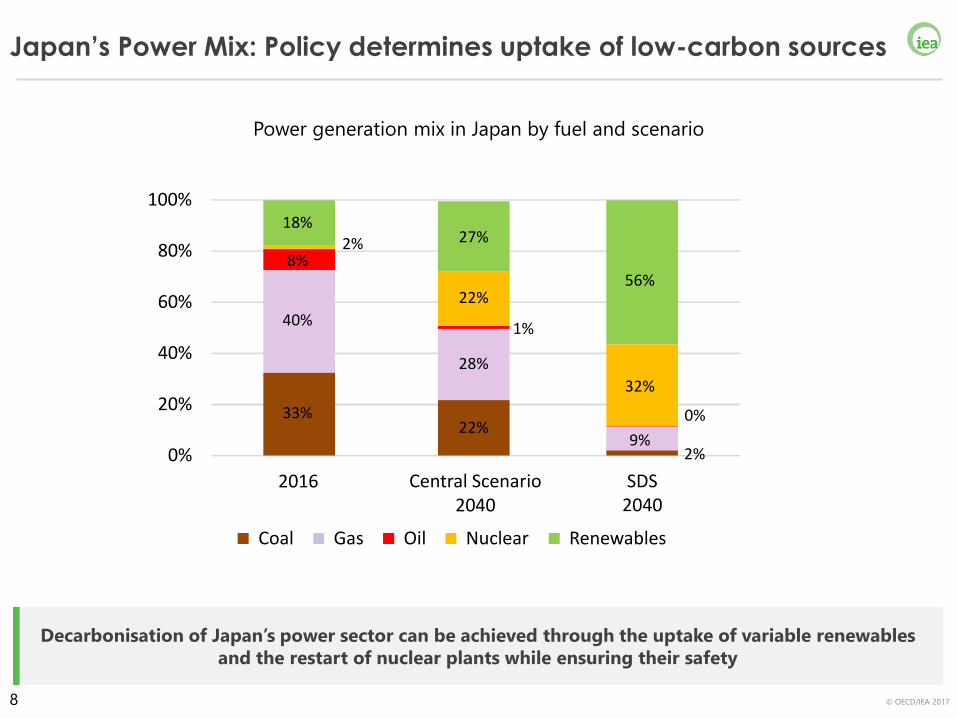
Japan’s Power Mix: Policy determines uptake of low-carbon sources
Decarbonisation of Japan’s power sector can be achieved through the uptake of variable renewables
and the restart of nuclear plants while ensuring their safety
Power generation mix in Japan by fuel and scenario
0%
20%
40%
60%
80%
100%
2016 Central Scenario2040
SDS2040
Coal Gas Oil Nuclear Renewables
33%
40%
8%2%
18%
22%
28%
1%
22%
27%
2%9%
0%
32%
56%
8
© OECD/IEA 2017
Recommendations for Japan
• Enhance energy security and resilience by taking an “all fuel” and “all technology“
approach to energy policy
• Continue to adjust renewable support policies in line with falling costs & ensure
there is adequate system flexibility including interconnections
• Pursue all low carbon options, including efficiency, renewables, nuclear (with
maximum safety), to decrease emissions in a cost-optimal way
• Continue to be a leader in global energy technology R&D and innovation
• Take advantage of the opportunities that digitalization is creating in the energy
sector, while being mindful of the associated risks
• The IEA stands ready to support the clean and secure energy transition in providing
cutting-edge technical advice to governments
9
© OECD/IEA 2017
www.iea.org
IEA
10

© OECD/IEA 2017
低炭素社会への持続的かつ確実な転換
ファティ・ビロル
エネルギー情勢懇談会 経済産業省(東京) 2018年2月27日
IEA
IEA 事務局長
仮訳資料5
© OECD/IEA 2017
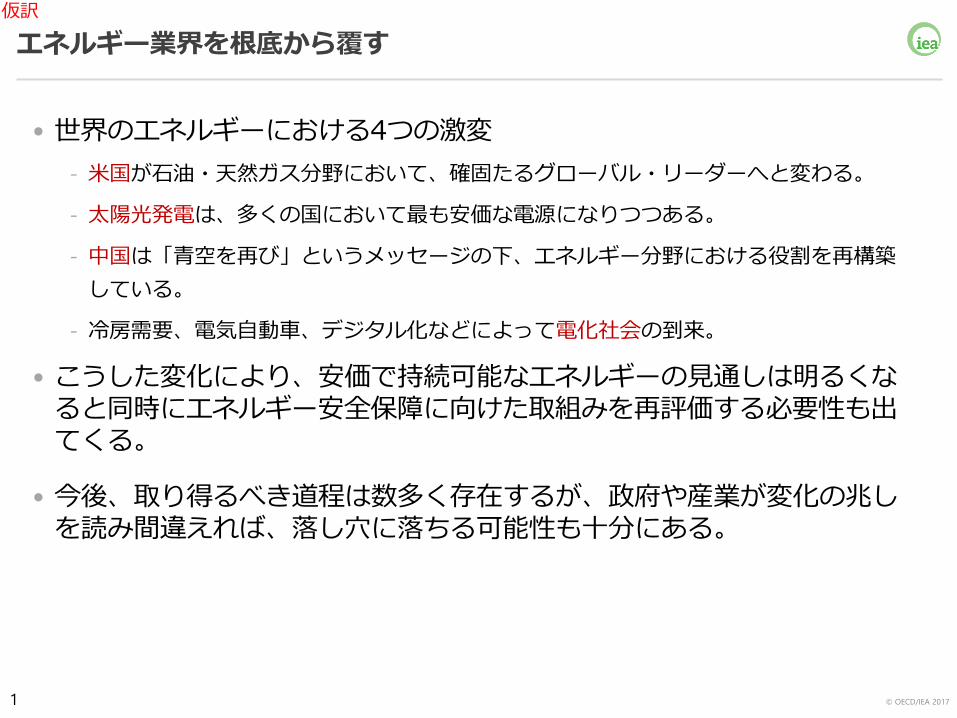
エネルギー業界を根底から覆す
• 世界のエネルギーにおける4つの激変
- 米国が石油・天然ガス分野において、確固たるグローバル・リーダーへと変わる。
- 太陽光発電は、多くの国において最も安価な電源になりつつある。
- 中国は「青空を再び」というメッセージの下、エネルギー分野における役割を再構築
している。
- 冷房需要、電気自動車、デジタル化などによって電化社会の到来。
• こうした変化により、安価で持続可能なエネルギーの見通しは明るくなると同時にエネルギー安全保障に向けた取組みを再評価する必要性も出てくる。
• 今後、取り得るべき道程は数多く存在するが、政府や産業が変化の兆しを読み間違えれば、落し穴に落ちる可能性も十分にある。
1
仮訳
© OECD/IEA 2017
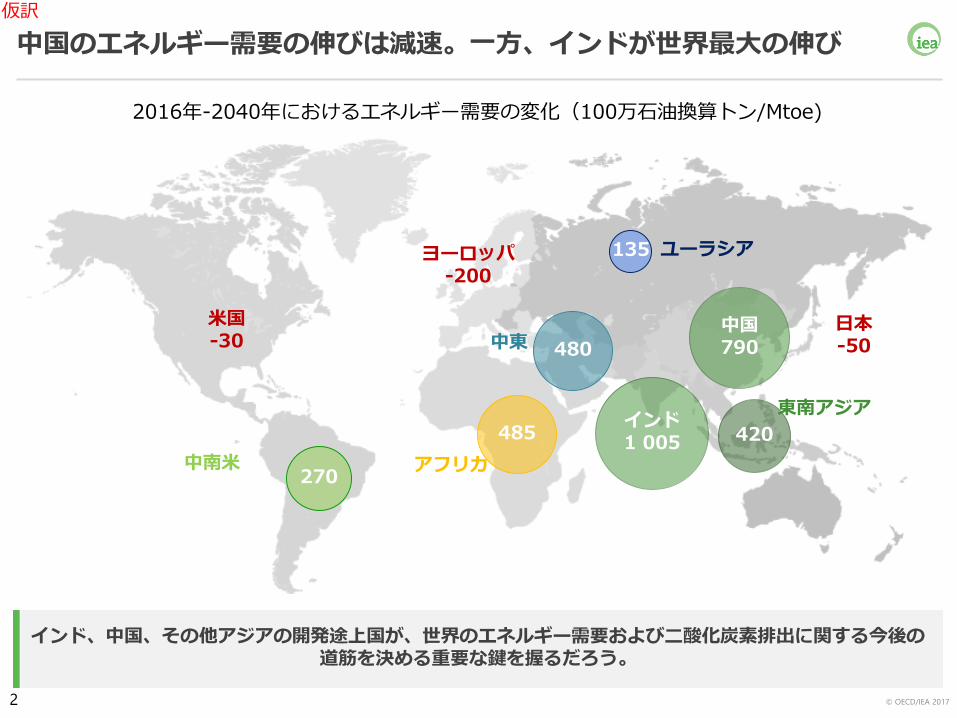
中国のエネルギー需要の伸びは減速。一方、インドが世界最大の伸び
インド、中国、その他アジアの開発途上国が、世界のエネルギー需要および二酸化炭素排出に関する今後の道筋を決める重要な鍵を握るだろう。
2016年-2040年におけるエネルギー需要の変化(100万石油換算トン/Mtoe)
インド1 005 420
東南アジア
中国790
米国-30
日本-50
ヨーロッパ-200
270中南米
485
アフリカ
135 ユーラシア
480中東
2
仮訳
© OECD/IEA 2017
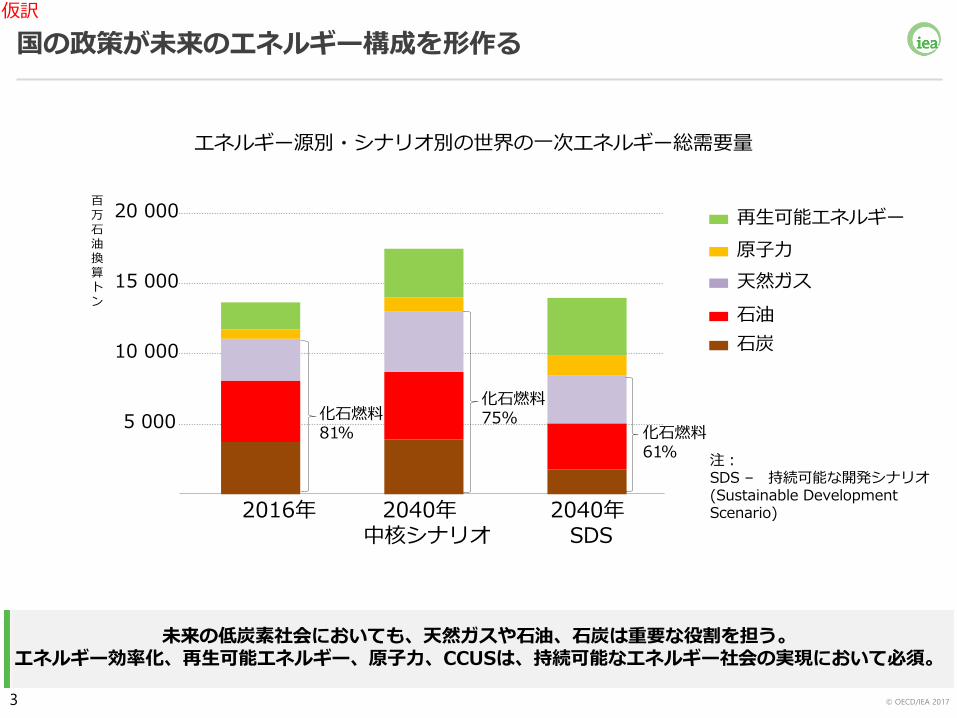
国の政策が未来のエネルギー構成を形作る
未来の低炭素社会においても、天然ガスや石油、石炭は重要な役割を担う。エネルギー効率化、再生可能エネルギー、原子力、CCUSは、持続可能なエネルギー社会の実現において必須。
エネルギー源別・シナリオ別の世界の一次エネルギー総需要量
5 000
10 000
15 000
20 000
2016年 2040年中核シナリオ
2040年SDS
百万石油換算トン
再生可能エネルギー
原子力
天然ガス
石油
石炭
注:SDS – 持続可能な開発シナリオ(Sustainable DevelopmentScenario)
化石燃料81%
化石燃料75%
化石燃料61%
3
仮訳
© OECD/IEA 2017
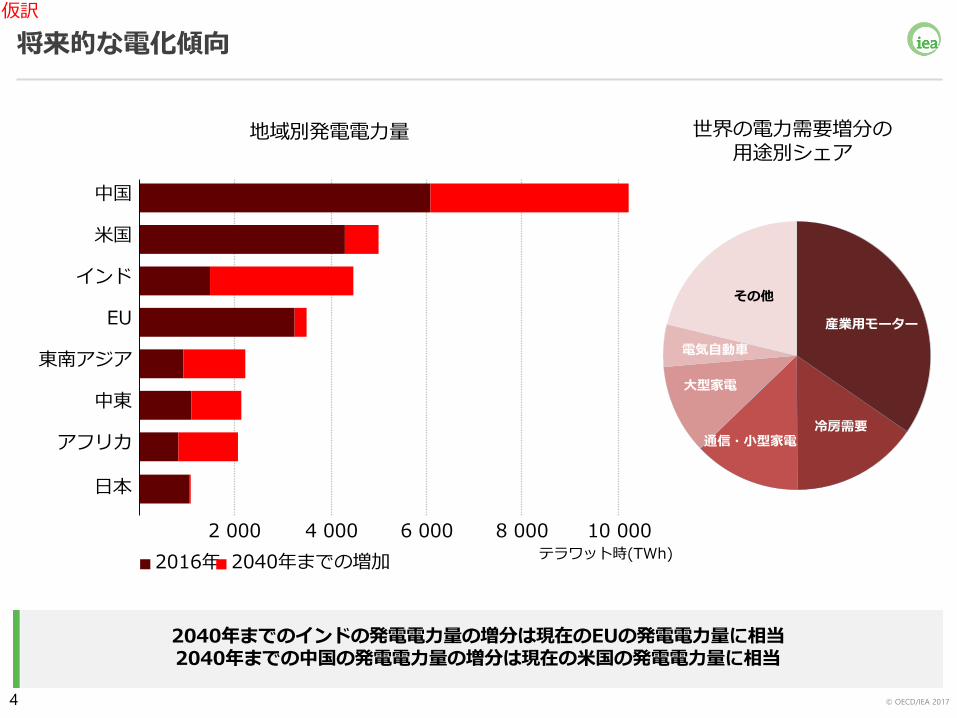
将来的な電化傾向
2040年までのインドの発電電力量の増分は現在のEUの発電電力量に相当2040年までの中国の発電電力量の増分は現在の米国の発電電力量に相当
地域別発電電力量
中東
2 000 4 000 6 000 8 000 10 000
アフリカ
東南アジア
EU
インド
米国
中国
テラワット時(TWh)2016年 2040年までの増加
世界の電力需要増分の用途別シェア
産業用モーター
冷房需要
大型家電
通信・小型家電
電気自動車
その他
日本
4
仮訳
© OECD/IEA 2017
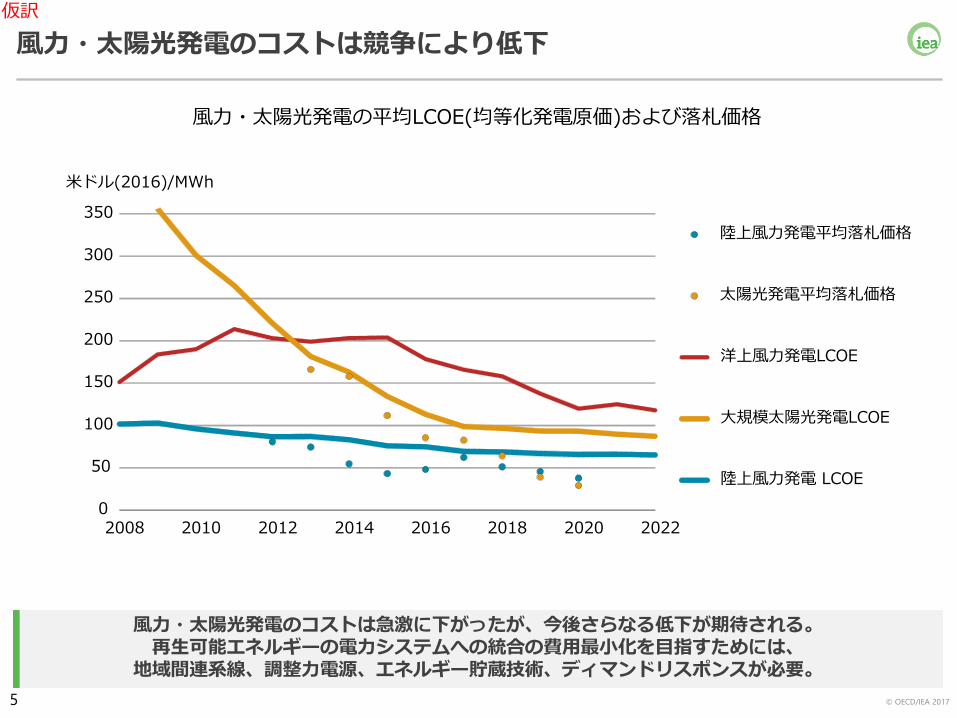
風力・太陽光発電のコストは急激に下がったが、今後さらなる低下が期待される。再生可能エネルギーの電力システムへの統合の費用最小化を目指すためには、
地域間連系線、調整力電源、エネルギー貯蔵技術、ディマンドリスポンスが必要。
風力・太陽光発電の平均LCOE(均等化発電原価)および落札価格
風力・太陽光発電のコストは競争により低下
0
50
100
150
200
250
300
350
2008 2010 2012 2014 2016 2018 2020 2022
米ドル(2016)/MWh
陸上風力発電平均落札価格
太陽光発電平均落札価格
洋上風力発電LCOE
大規模太陽光発電LCOE
陸上風力発電 LCOE
5
仮訳

© OECD/IEA 2017
原子力における新リーダー出現
既設炉の運転延長が行われない場合、原発大国の発電量は大幅に減少する一方で、中国が近い将来、業界のリーダーとして米国に取って代わる。
原子力発電所発電量
40
80
120
160
2010年 2020年 2030年 2040年
GW
(ギガワット)
米国
中国
フランス
日本
6
仮訳

© OECD/IEA 2017
クリーンエネルギー技術は、さらなる活用が可能
進展した分野がある一方、多くの技術では、そのポテンシャルを最大限に活かし、持続可能なエネルギー社会を達成するための継続的かつ強力な後押しが必要である。
エネルギー貯蔵
太陽光・陸上風力発電
電気自動車
●不調 ● 更なる改善が必要 ●好調
民生部門のエネルギー効率化(省エネ)輸送用バイオ燃料
二酸化炭素回収・貯留
高効率石炭火力発電
原子力
運輸部門 – 普通乗用車の燃費
照明、家電、業務用機器
産業部門におけるエネルギー効率化(省エネ)
水素・燃料電池
7
仮訳
© OECD/IEA 2017
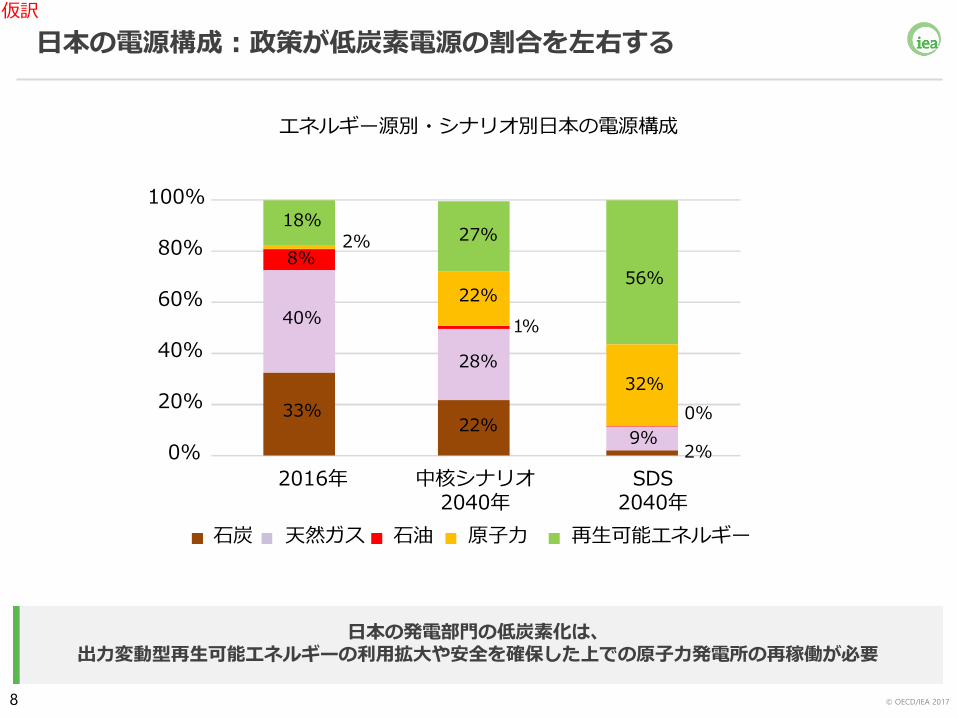
日本の電源構成:政策が低炭素電源の割合を左右する
日本の発電部門の低炭素化は、出力変動型再生可能エネルギーの利用拡大や安全を確保した上での原子力発電所の再稼働が必要
エネルギー源別・シナリオ別日本の電源構成
0%
20%
40%
60%
80%
100%
2016年 中核シナリオ2040年
SDS2040年
石炭 天然ガス 石油 原子力 再生可能エネルギー
33%
40%
8%2%
18%
22%
28%
1%
22%
27%
2%9%
0%
32%
56%
8
仮訳
© OECD/IEA 2017
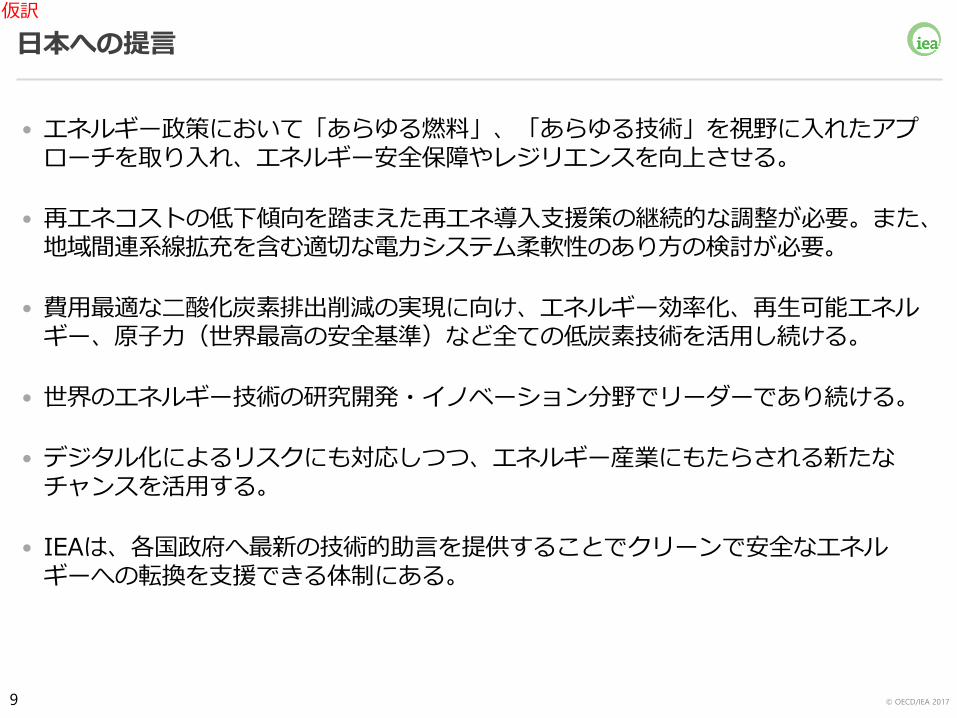
日本への提言
• エネルギー政策において「あらゆる燃料」、「あらゆる技術」を視野に入れたアプローチを取り入れ、エネルギー安全保障やレジリエンスを向上させる。
• 再エネコストの低下傾向を踏まえた再エネ導入支援策の継続的な調整が必要。また、地域間連系線拡充を含む適切な電力システム柔軟性のあり方の検討が必要。
• 費用最適な二酸化炭素排出削減の実現に向け、エネルギー効率化、再生可能エネルギー、原子力(世界最高の安全基準)など全ての低炭素技術を活用し続ける。
• 世界のエネルギー技術の研究開発・イノベーション分野でリーダーであり続ける。
• デジタル化によるリスクにも対応しつつ、エネルギー産業にもたらされる新たなチャンスを活用する。
• IEAは、各国政府へ最新の技術的助言を提供することでクリーンで安全なエネルギーへの転換を支援できる体制にある。
9
仮訳

© OECD/IEA 2017
www.iea.org
IEA
10
仮訳