A Study of Public Acceptance of Autonomous Cars Study of Public Acceptance of Autonomous Cars ......
155
A Study of Public Acceptance of Autonomous Cars Interactive Qualifying Project Submitted to the faculty of the WORCESTER POLYTECHNIC INSTITUTE In partial fulfillment of the requirements of the Degree of Bachelor of Science By _______________________ Sean V. Casley – Robotics Engineering _______________________ Adam S. Jardim – Robotics Engineering ______________________ Alex M. Quartulli – Computer Science/IMGD Submitted: April 30, 2013 _______________________ Dr. David C. Brown, Advisor Computer Science Department
Transcript of A Study of Public Acceptance of Autonomous Cars Study of Public Acceptance of Autonomous Cars ......
A Study of Public Acceptance of
Autonomous Cars
Interactive Qualifying Project
Submitted to the faculty of the WORCESTER POLYTECHNIC INSTITUTE
In partial fulfillment of the requirements of the Degree of Bachelor of Science
By
_______________________
Sean V. Casley – Robotics Engineering
_______________________ Adam S. Jardim – Robotics Engineering
______________________
Alex M. Quartulli – Computer Science/IMGD
Submitted: April 30, 2013
_______________________
Dr. David C. Brown, Advisor
Computer Science Department

ii
Abstract
Autonomous cars are a developing technology which may prove to be the next big
evolution in personal transportation. As of now, several major companies including Toyota,
Lexus, Audi, and Google are developing and testing their own prototype vehicles with plans to
eventually release the technology to market. Autonomous cars are no longer just a fanciful staple
element of futuristic science-fiction writing; they are real and they are coming. But how much do
people want them?
That question was the inspiration for this study to determine the appeal of autonomous
cars to the general public. Through background research our team determined six key influences
which might impact the desirability of autonomous cars. These six influences were comprised of
three primary influences and three secondary influences. The primary influences included how
safe people believe autonomous car technology is; how much people anticipate it to cost; and
how comfortable people are with the current legal structure regarding the development, sale, and
use of autonomous cars. The secondary influences included how productive people believed they
could be in an average day with the aid of an autonomous car, how the efficiency of autonomous
cars would affect their decision to buy one, and how the environmental impact of autonomous
cars would affect their decision to buy one.
The study was conducted using an anonymous survey, resulting in over 450 responses.
Data was collected regarding the participants’ feelings and beliefs towards the technology, as
well as their expectations and predictions. Demographic information was also collected to help

iii
determine if there was any significant difference in the appeal of autonomous technology
amongst these groups.
After the data was collected and analyzed we determined that although the secondary
traits of autonomous cars - productivity, efficiency, and environmental impact were quite
appealing to our participants, the primary influences safety, cost, and legal structure - were not
acceptable. For this reason we concluded that the technology and the laws regarding it must be
further developed before the public is willing to accept autonomous car technology.

iv
Chapter 1 Table of Contents Table of Figures .......................................................................................................................................... vii
Chapter 1 : Introduction ............................................................................................................................. 1
Chapter 2 : Literature Review ..................................................................................................................... 4
2.1 Introduction ...................................................................................................................................... 4
2.2 Safety ................................................................................................................................................ 4
2.3 Cost ................................................................................................................................................... 7
2.4 Productivity ....................................................................................................................................... 8
2.5 Environment ................................................................................................................................... 10
2.6 Legality ............................................................................................................................................ 11
2.7 Public Opinion ................................................................................................................................. 16
2.8 Conclusion ....................................................................................................................................... 21
Chapter 3 : Methodology .......................................................................................................................... 22
3.1 Introduction .................................................................................................................................... 22
3.2 Research ......................................................................................................................................... 23
3.3 Hypothesis ...................................................................................................................................... 24
3.4 Experiment ...................................................................................................................................... 26
3.5 Analysis ........................................................................................................................................... 28
Chapter 4 : Results .................................................................................................................................... 30
4.1 Introduction .................................................................................................................................... 30
4.2 Groupings ........................................................................................................................................ 30
Efficiency ........................................................................................................................................... 30
Law .................................................................................................................................................... 31
Productivity ....................................................................................................................................... 31
Safety ................................................................................................................................................ 32
4.3 Demographics ................................................................................................................................. 32
Gender .............................................................................................................................................. 33
Age .................................................................................................................................................... 33
Ethnicity ............................................................................................................................................ 34
Education .......................................................................................................................................... 35
Income .............................................................................................................................................. 36
Disability ........................................................................................................................................... 37

v
Accident History ................................................................................................................................ 38
Employment ...................................................................................................................................... 39
Primary Mode of Transportation ...................................................................................................... 40
4.4 Individual Questions ....................................................................................................................... 41
4.5 Grouped Questions ......................................................................................................................... 54
Efficiency Grouped ............................................................................................................................ 54
Safety Grouped ................................................................................................................................. 56
Productivity Grouped ........................................................................................................................ 58
Law Grouped ..................................................................................................................................... 59
4.6 Conclusion ....................................................................................................................................... 61
Chapter 5 : Analysis and Discussion .......................................................................................................... 62
5.1 Introduction .................................................................................................................................... 62
5.2 Ranking ........................................................................................................................................... 62
Our Approach .................................................................................................................................. 62
The Results ...................................................................................................................................... 62
Our Hypothesis ................................................................................................................................ 63
Meaning............................................................................................................................................ 63
5.3 Primary Influences ........................................................................................................................ 64
Our Approach .................................................................................................................................. 64
The Results ...................................................................................................................................... 65
Our Hypothesis ................................................................................................................................ 69
Meaning............................................................................................................................................ 69
5.4 Secondary Influences .................................................................................................................... 70
Our Approach .................................................................................................................................. 70
The Results ...................................................................................................................................... 70
Hypothesis ....................................................................................................................................... 73
Meaning............................................................................................................................................ 74
5.5 Demographics ................................................................................................................................ 74
Age .................................................................................................................................................... 74
Education ......................................................................................................................................... 76
Gender .............................................................................................................................................. 79
Income ............................................................................................................................................. 83

vi
5.6 Conclusion ..................................................................................................................................... 85
Chapter 6 : Conclusion .............................................................................................................................. 87
6.1 Overview ......................................................................................................................................... 87
6.2 What We Learned ........................................................................................................................... 88
6.3 Future Work .................................................................................................................................... 89
Acknowledgements .................................................................................................................................. 91
Bibliography .............................................................................................................................................. 92
Appendix A: Survey ................................................................................................................................... 94
Appendix B: Data Summary .................................................................................................................... 100

vii
Table of Figures
Figure 2-1: Image 1: Sec. 16, Bill AB511 Nevada Legislature ..................................................................... 16
Figure 4-1: Gender Distribution ................................................................................................................ 33
Figure 4-2: Age Distribution ...................................................................................................................... 34
Figure 4-3: Ethnicity Distribution .............................................................................................................. 35
Figure 4-4: Education Distribution ............................................................................................................ 36
Figure 4-5: Income Distribution ................................................................................................................ 37
Figure 4-6: Disability Distribution ............................................................................................................. 38
Figure 4-7: Accident Distribution .............................................................................................................. 39
Figure 4-8: Employment Distribution ........................................................................................................ 40
Figure 4-9 : Primary Mode of Transportation Distribution ....................................................................... 41
Figure 4-10: Expected Cost of Automated Driving System ........................................................................ 42
Figure 4-11: Amount of Money One is Willing to Spend on an Autonomous Driving System ................... 43
Figure 4-12: Waiting Period Before Buying an Autonomous Driving System ............................................ 44
Figure 4-13: Number of Concerns Regarding Autonomous Cars ............................................................... 45
Figure 4-14: Influence of Autonomous Cars Being Less Environmentally Harmful ................................... 46
Figure 4-15: Familiarity with Laws Regarding Autonomous Cars .............................................................. 47
Figure 4-16: Agreement That an Individual Should Be Licensed to Operate an Autonomous Car ............ 48
Figure 4-17: Influence of Safety on Purchasing an Autonomous Car ........................................................ 49
Figure 4-18: Influence of Cost on Purchasing an Autonomous Car ........................................................... 50
Figure 4-19: Influence of Law in Purchasing an Autonomous Car ............................................................. 51
Figure 4-20: Distribution of Law Ranking .................................................................................................. 52
Figure 4-21: Distribution of Cost Ranking ................................................................................................. 53
Figure 4-22: Distribution of Safety Ranking .............................................................................................. 54
Figure 4-23: Efficiency Group Split ............................................................................................................ 56
Figure 4-24: Safety Group Split ................................................................................................................. 57
Figure 4-25: Productivity Group Split ........................................................................................................ 59
Figure 4-26: Law Group Split ..................................................................................................................... 60
Figure 5-1: Distribution of Opinions on Safety of Autonomous Cars Grouped ......................................... 65
Figure 5-2: Distribution of Opinions on Laws of Autonomous Cars Grouped ........................................... 66
Figure 5-3: Distribution of Opinions on Liability of Autonomous Cars ...................................................... 67
Figure 5-4: Distributions of how much participants expect an autonomous driving system to cost ........ 68
Figure 5-5: Distributions of how much participants are willing to pay...................................................... 68
Figure 5-6: Distributions of opinions on productivity while using an autonomous car ............................. 71
Figure 5-7: Distributions of opinions on the efficiency of autonomous cars ............................................. 72
Figure 5-8: Distribution of opinions on the environmental impact of autonomous cars .......................... 73
Figure 5-9: Relationship between age and the influence of safety on autonomous cars ......................... 75
Figure 5-10: Relationship between age and influence of cost on autonomous cars ................................. 76
Figure 5-11: Relationship between highest education level and the rank of cost..................................... 77
Figure 5-12: Relationship between highest education level and the rank of safety ................................. 78

viii
Figure 5-13: Relationship between gender and the rank of cost when compared to safety and law ....... 79
Figure 5-14: Relationship between gender and the participant's number of concerns ............................ 80
Figure 5-15: Relationship between gender and productivity while using an autonomous car ................. 80
Figure 5-16: Relationship between gender and opinions of the safety of autonomous car ..................... 81
Figure 5-17: Relationship between gender and influence of safety on autonomous cars ........................ 81
Figure 5-18: Relationship between gender and the number of years to purchase ................................... 82
Figure 5-19: Relationship between personal yearly income and the rank of law ..................................... 84
Figure 5-20: Relationship between personal yearly income and the influence of cost ............................. 85
Figure Appendix B-1: Relationship between age and comfort traveling in a tight cluster ...................... 100
Figure Appendix B-2: Relationship between highest level of education and influence of cost ............... 101
Figure Appendix B-3: Relationship between efficiency opinions and the time it takes to purchase ....... 102
Figure Appendix B-4: Relationship between the number of concerns and influence of safety .............. 103
Figure Appendix B-5: Relationship between safety and comfort traveling in a tight cluster .................. 104
Figure Appendix B-6: Relationship between gender and liability concerns ............................................ 105
Figure Appendix B-7: Relationship between opinions on the safety and number of years to purchase . 106
Figure Appendix B-8: Relationship between safety and how much a participant would spend ............. 107
Figure Appendix B-9: Relationship between number of concerns and opinions on safety ..................... 108
Figure Appendix B-10: Relationship between gender and enjoyability of driving .................................. 109
Figure Appendix B-11: Relationship between highest education level and opinions of safety ............... 110
Figure Appendix B-12: Survey Question #1 ............................................................................................. 111
Figure Appendix B-13: Survey Question #2 ............................................................................................. 112
Figure Appendix B-14: Survey Question #3 ............................................................................................. 113
Figure Appendix B-15: Survey Question #6 ............................................................................................. 114
Figure Appendix B-16: Survey Question #7 ............................................................................................. 115
Figure Appendix B-17: Survey Question #8 ............................................................................................. 116
Figure Appendix B-18: Survey Question #10 ........................................................................................... 117
Figure Appendix B-19: Survey Question #11 ........................................................................................... 118
Figure Appendix B-20: Survey Question #12 ........................................................................................... 119
Figure Appendix B-21: Survey Question #13 ........................................................................................... 120
Figure Appendix B-22: Survey Question #14 ........................................................................................... 121
Figure Appendix B-23: Survey Question #15 ........................................................................................... 122
Figure Appendix B-24: Survey Question #16 ........................................................................................... 123
Figure Appendix B-25: Survey Question #17 ........................................................................................... 124
Figure Appendix B-26: Survey Question #18 ........................................................................................... 125
Figure Appendix B-27: Survey Question #19 ........................................................................................... 126
Figure Appendix B-28: Survey Question #20 ........................................................................................... 127
Figure Appendix B-29: Survey Question #21 ........................................................................................... 128
Figure Appendix B-30: Survey Question #22 ........................................................................................... 129
Figure Appendix B-31: Survey Question #23 ........................................................................................... 130
Figure Appendix B-32: Survey Question #24 ........................................................................................... 131
Figure Appendix B-33: Survey Question #25 ........................................................................................... 132
Figure Appendix B-34: Survey Question #26: Ranking for laws regarding autonomous cars .................. 133

ix
Figure Appendix B-35: Survey Question #26: Ranking for cost of autonomous cars .............................. 134
Figure Appendix B-36: Survey Question #26: Ranking for safety of autonomous cars ........................... 135
Figure Appendix B-37: Survey Question #27 ........................................................................................... 136
Figure Appendix B-38: Survey Question #28 ........................................................................................... 137
Figure Appendix B-39: Survey Question #29 ........................................................................................... 138
Figure Appendix B-40: Survey Question #30 ........................................................................................... 139
Figure Appendix B-41: Survey Question #31 ........................................................................................... 140
Figure Appendix B-42: Survey Question #32 ........................................................................................... 141
Figure Appendix B-43: Survey Question #33 ........................................................................................... 142
Figure Appendix B-44: Survey Question #34 ........................................................................................... 143
Figure Appendix B-45: Survey Question #35 ........................................................................................... 144
Figure Appendix B-46: Survey Question #36 ........................................................................................... 145
Figure Appendix B-47: Survey Question #37 ........................................................................................... 146

1
Chapter 1 : Introduction
In 1941, Robert A. Heinlein began publishing a series of science fiction stories he later
dubbed Methuselah’s Children. In them, he described a future completely foreign to the people
of his time. In this futuristic world, he described a society of long-living people with advanced
technologies. And while many of the technologies described in his stories are far from fruition, a
few are closer than many might think. One such technology is the autonomous car. In
Heinlein’s stories, these cars would drive themselves to the passenger’s desired location. Cars
that drive themselves are on the verge of entering the common market in the very near future.
Autonomous cars are being researched by several major car companies as well as Google.
Ford, General Motors, and Volvo all have developed prototypes of an autonomous vehicle with
many of the qualities similar to Heinlein’s cars of the future. However, it is Google who has the
most developed system, capable of driving with very little input from the operator. These
companies are heavily researching and developing these technologies with the hopes of
introducing them to the public market. Because this is a rapidly developing technology that has
the possibility of substantially changing the way society operates, we found this area to be
particularly interesting.
However, not all technologies predicted by popular media are immediately welcomed
into society, and autonomous cars are one such technology. As is typical with many advances,
many people will oppose them and the changes that they will bring. Opponents of autonomous
cars argue over issues ranging from safety, personal freedom, technology dependence, and laws.
They see the introduction of these cars to the market as a threat to their safety on the roads.
There is no doubt that with the arrival of a new technology brings new challenges and problems.

2
But what do the people think of these new self-driving cars? Are they an affront to our freedom?
Do they endanger the lives of the driver and those around them?
The way the public perceives autonomous cars will very directly affect the way they will
be introduced to the market and how quickly we’ll be seeing them on the streets. The public’s
willingness to accept this technology will determine how car manufacturers develop and market
them. Simply put, if the public is not accepting of certain aspects of the technology, car
manufacturers will not develop these aspects. Conversely, if the public is more favorable in
another way, the market will promote this aspect more than the others. In order to determine
their likely development and possible areas of improvement, we set out to gauge this public
perception. Because we believe that the public’s opinion is strong indicator of how this new
technology will develop, we predict the analyzing this opinion will allow us to gain insight into
how the technology will be likely to progress.
In order to determine the interest in autonomous cars, we examined current research into
the technology and the areas that may be of concern to the public. By determining the areas of
possible concern, we were able to articulate these concerns back to the public in an easy to
understand way in order to judge their opinion on them. To do this, we developed and
distributed a survey to gather these opinions. For the scope of this study the term “autonomous
car” was defined as follows;
A car with the ability to drive itself independently from human control. In many cases this
feature can be manually turned on or off by the user of the vehicle.

3
The data we gathered can be used by autonomous car developers to investigate what areas the
public perceive are the areas of weakness and strength and how the appeal of their product can
be used to influence its development.
Starting with chapter 2, the following report will first present the questions we want to
solve in a clear and concise manner, why we ask these questions, and why this experiment is
beneficial. It contains comprehensive background research on the safety of autonomous cars, the
cost of the technology, the current legal structure related to the vehicles, the impact the
technology may have on the users productivity, the environmental impact of the cars, and the
efficiency of the technology as well as a look into current research regarding the public’s
perception of the technology. The report, in chapter 3, also contains a description of our
methodology and how we moved our research forward into experimentation. From there, a
summary of the data collected including demographic distributions and responses will be
provided in chapter 7. The approach described in the methodology will be applied at a more
specific level, identifying what questions need to be asked and answered along with the process
used to analyze the data (chapter 8).
The following section, chapter 9, will give an evaluation of the survey results describing
the possible significances, correlations, and relationships between the important data sets
described in the previous chapter. Finally, the report will conclude in chapter 5 with a summary
of the analyzed data, recommendations for further research, and a list of predictions for car
manufacturer’s development of autonomous cars for the public market.
4
Chapter 2 : Literature Review
2.1 Introduction
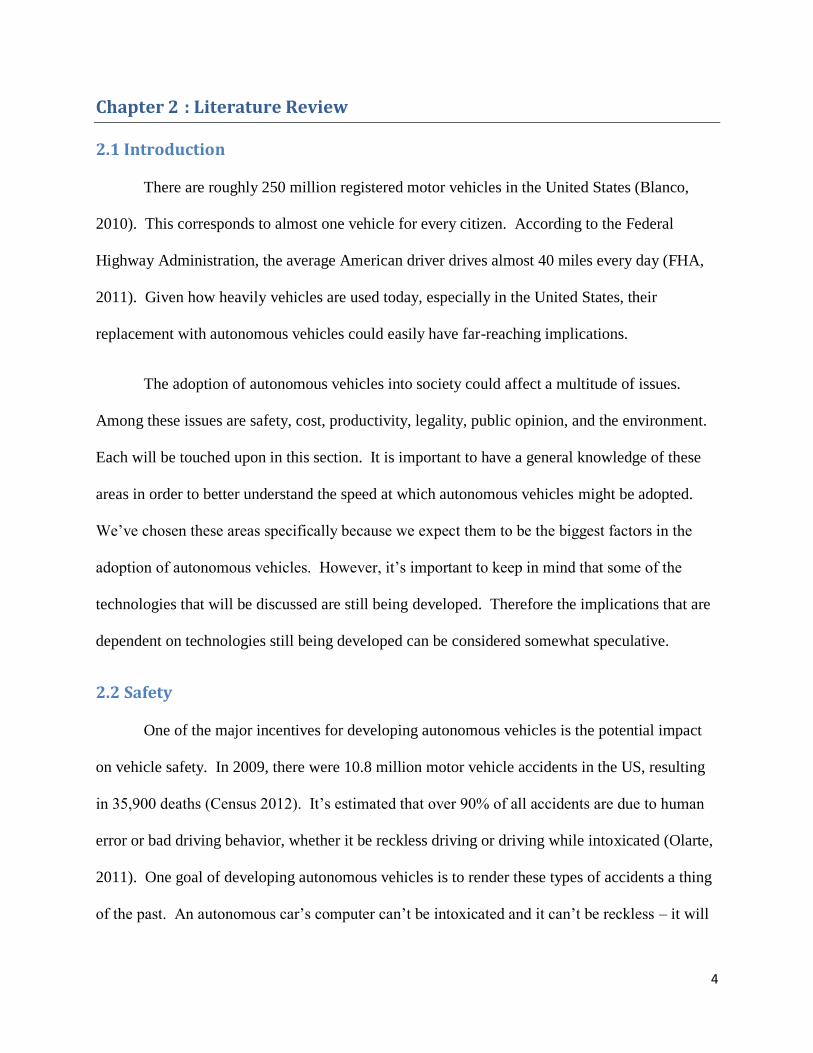
There are roughly 250 million registered motor vehicles in the United States (Blanco,
2010). This corresponds to almost one vehicle for every citizen. According to the Federal
Highway Administration, the average American driver drives almost 40 miles every day (FHA,
2011). Given how heavily vehicles are used today, especially in the United States, their
replacement with autonomous vehicles could easily have far-reaching implications.
The adoption of autonomous vehicles into society could affect a multitude of issues.
Among these issues are safety, cost, productivity, legality, public opinion, and the environment.
Each will be touched upon in this section. It is important to have a general knowledge of these
areas in order to better understand the speed at which autonomous vehicles might be adopted.
We’ve chosen these areas specifically because we expect them to be the biggest factors in the
adoption of autonomous vehicles. However, it’s important to keep in mind that some of the
technologies that will be discussed are still being developed. Therefore the implications that are
dependent on technologies still being developed can be considered somewhat speculative.
2.2 Safety
One of the major incentives for developing autonomous vehicles is the potential impact
on vehicle safety. In 2009, there were 10.8 million motor vehicle accidents in the US, resulting
in 35,900 deaths (Census 2012). It’s estimated that over 90% of all accidents are due to human
error or bad driving behavior, whether it be reckless driving or driving while intoxicated (Olarte,
2011). One goal of developing autonomous vehicles is to render these types of accidents a thing
of the past. An autonomous car’s computer can’t be intoxicated and it can’t be reckless – it will

5
do only what it’s programmed to do, and that’s to get the passenger safely from point A to point
B.
Can a computer really drive more safely than a human though? Current technologies
utilize sensor arrays (LIDAR is used to a large extent) to create a 3-dimensional model of the
space all around the car (Connor, 2011). With a constant view of everything around the car, the
car’s computer already has access to more information than a human driver could have.
However, the computer needs to make sense of all of that information. Consumer cars already
do this today to some extent. Collision avoidance systems, for example, can sense when the
driver is in danger by checking if any objects (like other cars) are too close. If needed, the car
can even intervene. These safety systems can be extremely effective. According to a study
conducted by the National Highway Traffic Safety Administration, Electronic Stability Control
systems have reduced fatal rollovers in light trucks and vans by 88% (NHTSA, 2007). A fully
autonomous vehicle is just the extension – albeit a large extension – of such existing
technologies.
Two of the more powerful technologies that are currently being researched are called
Vehicle-to-Vehicle (V2V) and Vehicle-to-Infrastructure communications (V2I) (Newcomb,
2012). V2V communications are communications between nearby vehicles in which data about
a car’s position and velocity are transmitted. Nearby cars can utilize that information to, among
other things, coordinate movements safely while passing through intersections and driving on
highways. Similarly, V2I communications are communications between vehicles and nearby
infrastructural objects, such as a computer serving as an intersection manager. In such a
scenario, the intersection manager is the coordinator for the intersection that it governs, guiding

6
vehicles through the intersection safely and efficiently (Newcomb, 2012). However, V2V and
V2I communications are still in the early stages of research and development.
Communicating data to and from cars comes with a risk, though. As with any computer
network, there are security issues that could put drivers in danger if the network is attacked by
hackers. Current networked car technologies, a popular one being OnStar, are already targets.
So far, there has only ever been one real-life example where a car’s networked technology was
attacked. “In 2010, a former car dealership employee in Austin, Texas, was arrested for
allegedly using a password stolen from a former coworker to hack into a remote immobilizer
system and disable about 100 already-purchased cars” (Lawton, 2011). Attacks like this could
become more frequent and significant in a world filled with autonomous vehicles where the cars
are not only supplemented by V2V and V2I communications, but potentially dependent on them.
Luckily (or unluckily depending on your point of view) the problem of communications
and network security is nothing new and the same principles can be applied to vehicular
communications. For example, in a three year long research project by the National Highway
Traffic Safety Administration, the researchers used a digital signature – a common method used
in cryptography to guarantee the identity of a message’s sender – in their communications
system (NHTSA, 2011). So even in proof-of-concept research, the problem of network security
is already being addressed.
Even without communications systems like V2V and V2I to help keep the car and driver
safe, autonomous vehicles have a great track record. After 300,000 miles of driving between all
of the cars in Google’s fleet, only one car has been involved in one minor accident (Kelly, 2012).
Ironically, the car was under manual control at the time. In 2010, Dr. Alberto Broggi and his

7
team at the University of Parma in Italy went on an 8,000 mile road trip from Parma, Italy to
Shanghai, China in their own version of an autonomous car (Newcomb, 2012). If future versions
of autonomous vehicles adhere to current trends, then the 90% of car accidents due to human
error could indeed become a thing of the past.
2.3 Cost
There is no doubt that the development and utilization of autonomous cars has a cost.
The cost of the parts for the car, the cost of the research, the cost of manufacturing, and the cost
to the eventual customer have to balance if autonomous cars are going to become popular. But
what are the purchasing and costs of owning an autonomous car? For a field of research that is
relatively new, the numbers aren’t obvious or immediately apparent. But one thing is certain for
now: it will cost more than $30,303, the average price of a car (Nickel, 2012).
The Google Car, the most heavily tested and advanced autonomous car system in
development, has a very expensive price. The car itself costs about $150,000 in all. The most
expensive portion of the equipment is the $70,000 LIDAR system (Priddle and Woodyard,
2012). This alone is far above what the average consumer is willing or able to pay. However,
Google remains hopeful. Chris Urmson, an engineer from Carnegie Mellon who is working with
the Google Car system, says that “reasonably priced LIDAR systems are coming relatively soon”
(Priddle and Woodyard, 2012). Even if this is true, this cost will have to drop dramatically to
fall into a reasonable price range. Currently, the cost of the LIDAR system costs about as much
as a 2012 Cadillac Escalade ($66k – $74k), a car far out of reach for the every-man.
A survey posed by J.D. Powers and Associates recently polled public interest in
autonomous cars (J.D. Power and Associates, 2012). The survey found that one out of every five

8
people were interested in purchasing an autonomous car after learning how much extra the
feature would cost. This extra cost was a mere $3,000 more. While this is expensive as far as
features go, the current additional costs of an autonomous car will be hard-pressed to meet that
3,000 dollar benchmark. However, the director of marketing and sales at Ibeo Automotive
Systems, a manufacturer of LIDAR systems in Germany, has said that it hopes to develop
LIDAR systems for autonomous cars for as low as $250 (Priddle and Woodyard, 2012).
If this is true, the remarkably low cost of LIDAR that the Google Car paid ($70,000)
could potentially drop the price of the car from $150,000 to $80,250. And if similar sensors and
equipment in the car also follow price drops as technology advances, then meeting the goal of an
only additional $3,000 for an autonomous car might not seem entirely impossible.
2.4 Productivity
Since autonomous vehicles are still not fully developed it is difficult to predict their
effects on productivity. Yet many people seem to believe that the efficiency of road systems and
an individual’s productivity are both are likely to increase once autonomous vehicle become
heavily used.
A fully autonomous vehicle could eliminate the need to transport those with restrictions
on operating a vehicle due to age or physical ability. Elderly individuals, or those with
disabilities that make them unable to transport themselves, would have more independence. This
would allow them to do errands, visit friends and relatives, and go to work without the aid of a
driver. Children and teens below the age of 16 would be able to travel independently, sparing
their parents the time it would take to transport the child back and forth. The core benefit of an
9
autonomous vehicle in terms of productivity is that it frees up the time you would otherwise
spend driving or being stuck in traffic to instead be devoted to other, more productive tasks.
Eliminating the need for an actively focused driver would allow for a user to redirect
their attention from the road to something more productive. They could go on their computer and
get some work done, or just rest. The user would also be able to interact more attentively with
their fellow passengers, whether they are talking with friends or preparing for a meeting with
coworkers.
A system built around autonomous vehicles would allow for more efficient parking
organization. The vehicle could drop the passenger off at their destination, and then go to a mass
parking facility some distance away. Later, when summoned, it would return to pick up the user.
These facilities could be made more space efficient than today’s parking garages because they
won’t need to include the room for people to move around.
Another two beneficial outcomes of an autonomous system would be increased roadway
capacity and reduced traffic congestion. Due to the high reaction speed of the electronics, as
well as the ability to better regulate speed, cars could travel much closer together while moving
more quickly. This high reaction speed of the electronics could reduce the chance of accidents,
providing not only safer travel but fewer delays due to traffic accidents. A system of vehicles all
communicating with each other (using the V2V system mentioned in the safety section) could
organize itself so that each vehicle travels an optimized route to its destination. The optimization
of routing would prevent traffic congestion from forming on any road. As a result, people would
get to their destination much more quickly.

10
Looking further into the future, it is not hard to imagine that an autonomous vehicle could
even go off and do chores without you. Given more time and money to develop, these vehicles
may get to the point where they could go pick children from school or drop them off at soccer
practice while their parents are still at the office. If companies adapt to the new technology, a
user may even be able to send their car to a local food market where it would be filled with pre-
ordered groceries and sent right back home to be unpacked. In industry, vehicles that can travel
without a driver could allow companies to have large fleets of self-driving trucks, effectively
lowering the cost and duration of shipping.
Autonomous cars have the potential to not only free up time otherwise spent driving both
one’s self and others around, but also the potential to travel faster. They also enable the operator
to do more productive tasks while traveling, and maybe one day they will do chores for their
owners while their owners do other work.
2.5 Environment
The widespread adoption of autonomous vehicles has the potential to impact the
environment. Autonomous cars offer more efficient use of roads than manual controlled cars do.
Since computers have more precise control than humans have, the density at which cars can be
packed into a given highway space is much higher for autonomous cars than for manually
controlled cars (Coldewey, 2012). In other words, the computer controls allow autonomous cars
to thrive in congested areas where cars are tightly packed, greatly reducing the quantity and
severity of traffic jams.
Each year drivers in the United States waste about 3.9 billion gallons of gas sitting still in
traffic (Max, 2012). This equates to around 16 million tons of CO2 that are emitted into the
11
atmosphere each year without anything to show for it. Greenhouse gases like CO2 are a problem
for the environment because they trap heat in the atmosphere. Autonomous vehicles can help to
reduce the amount of time spent sitting still in traffic, and thus reduce the amount of CO2
needlessly emitted into the atmosphere.
Another outcome of having cars more tightly packed is that roads and parking areas can
be smaller. Cities aren’t forced into widening congested highways since packing the cars closer
together accomplishes the same goal in a more efficient manner (however, they could keep the
wide highways and have the best of both worlds). Likewise, parking lots and parking garages
can be scaled down, reducing their footprints. The concrete and asphalt used in infrastructure
contributes to what’s called the Urban Heat Island Effect (EPA, 2012), which is when urban
areas are considerably hotter than the surrounding area. This is due to the replacement of
vegetation, which acts as natural coolant, with man-made surfaces that absorb and then re-radiate
heat. Reducing the amount overall area that man-made surfaces cover by requiring less
infrastructure will reduce the Urban Heat Island Effect (EPA, 2012).
Although these environmental impacts aren’t a direct goal of autonomous vehicles they
are still a positive side effect. Climate change due to greenhouse gases has been a major concern
in recent years. Switching to autonomous cars is a step in the right direction to combat climate
change. Perhaps more noticeably, reducing the surface area of the infrastructure that’s dedicated
to cars can make hot summers a little bit more comfortable in urban environments.
2.6 Legality
Though the development of autonomous vehicles is still in its infancy, some states are
already revising their traffic legislation in preparation of this new technology. In June of 2011

12
Nevada became the first state to approve regulations regarding the operation of autonomous
vehicles on designated roads. This was due in part by Google, who had been quietly lobbying
for over a year with the hope of one day being able to legally conduct further testing of their
driverless car project on public streets (Markoff, 2011). Prior to these new regulations, Google
could only test their vehicles on public roads in California, getting around the state’s reckless
driving law by having two attentive researchers in the vehicle who could take back control at any
time. More recently, in 2012, Florida and California passed their own bills which require their
respective DMVs to adopt rules and regulations intended to promote the safe operation of
autonomous vehicles on public streets. These regulations, though still in development, are very
similar to those already in place in Nevada.
The state of Nevada defines an autonomous vehicle as “a motor vehicle that uses
artificial intelligence, sensors, and global positioning system coordinates to drive itself without
the active intervention of a human operator.” (Bill AB511 Nevada Legislature, 2011)The key
component of the autonomous functionality is its artificial intelligence, which Nevada defines as
“the use of computers and related equipment to enable a machine to duplicate or mimic the
behavior of human beings.” (Bill AB511 Nevada Legislature, 2011)
Nevada does not consider driver assistance systems such as blind spot detection, crash
avoidance, emergency braking, parking assistance, adaptive control, lane keeping assistance, and
so on as autonomous features. Therefore, a vehicle with any of these features is not subject to
the autonomous vehicle laws unless the vehicle is also enabled with artificial intelligence and
technology that allows it to carry out all the mechanical operations of driving without the active
control or continuous monitoring of a natural person. In the definition of an autonomous vehicle
the term “sensors” refers to, without limitation, cameras, lasers, and radar. A “global positioning
13
system”, also called a GPS, is a device that communicates with a network of satellites to pinpoint
its current location. Most people are fairly familiar with this technology due to its common
integration into electronic vehicle navigation systems and smartphones (Bill AB511 Nevada
Legislature, 2011).
In order for someone to test their vehicle’s autonomous technology on Nevada’s public
roads the vehicle must first be registered in the state. An individual who already possesses a
valid driver’s license can apply through the Nevada department of motor vehicles (NDMV) for
an endorsement to test the vehicle. To apply, the candidate must submit an application to the
NDMV on which they must confirm, to the best of their ability, that the vehicle is safe to operate
on the highway. An autonomous vehicle is required to have an easily accessible switch that
allows the user to engage or disengage the autonomous mode. The vehicle must also be
equipped with a separate mechanism which can capture and store data from the various sensors
for at least 30 seconds before a collision in autonomous mode. This data could be used to help
determine why the accident occurred. A proper warning system should also be installed which
can safely alert the operator to take back control of the vehicle in the case of a technical failure.
The developer of the vehicle must also be careful that no autonomous technology adversely
affect any other safety feature on the vehicle and that the vehicle can still be operated in
compliance with the applicable traffic laws of the state (Bill AB511 Nevada Legislature, 2011).
If the applicant wishes to operate a business to test autonomous vehicles they must
provide proof to the NDMV that one or more of the same vehicle model has been driven for a
minimum of 10,000 miles in autonomous mode, in various weather conditions, on various types
of roads, and during various times of day. The applicant must also demonstrate the artificial
intelligence and technology used in its autonomous vehicles to the NDMV for approval. For the
14
vehicle to be approved for testing in any of the proposed geographic locations the Department
must be convinced that the vehicle is capable of operating in compliance with the traffic laws of
the area (Bill AB511 Nevada Legislature, 2011).
Nevada requires that, unless otherwise approved in advance by the NDMV, the licensee
ensure that when the autonomous technology is being tested there are at least two people in the
vehicle who will monitor for any aberrations in the functioning of the technology. One of these
individuals must be seated in a position that allows them to take complete control of the vehicle
at any time. Both individuals must each hold a valid driver’s license but are not required to have
a driver’s license endorsement to operate the vehicle in autonomous mode. The individual who
engages the autonomous mode is considered the operator of the vehicle while it is in autonomous
mode regardless of whether or not they are in the vehicle. Both individuals in the vehicle must
be trained in the operation of the autonomous vehicle and have received instruction regarding its
capabilities and limitations. The vehicle may only be operated in geographical locations that
have been approved by the department and designated on a certificate given to the licensee upon
receiving the license endorsement. If the vehicle is ever in an accident or an operator is issued a
citation for any violation of traffic laws during the course of testing, the licensee must submit a
report of the accident to the Department within 10 business days (Bill AB511 Nevada
Legislature, 2011).
An autonomous vehicle may be sold by a licensed vehicle dealer in the state of Nevada as
long as a certificate of compliance is issued for the autonomous technology by the manufacturer
of the vehicle or another facility capable of providing autonomous technology certification. To
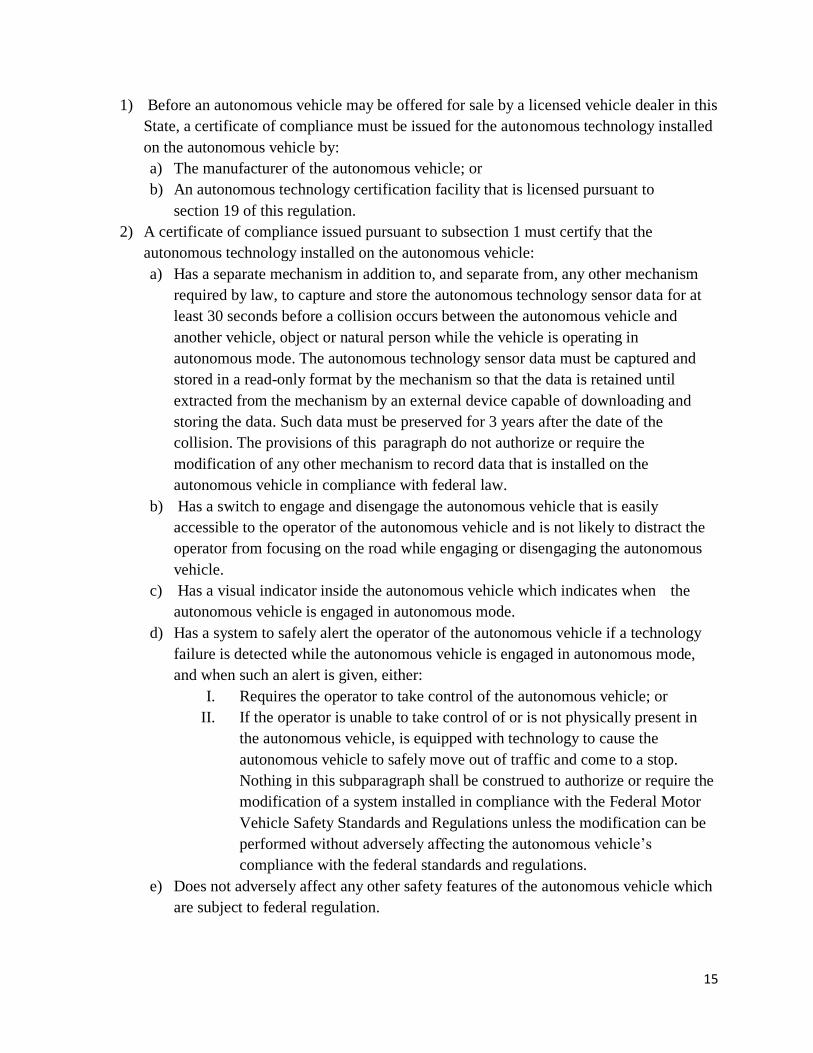
receive certification, the vehicle must adhere to the following regulations:
15
1) Before an autonomous vehicle may be offered for sale by a licensed vehicle dealer in this
State, a certificate of compliance must be issued for the autonomous technology installed
on the autonomous vehicle by:
a) The manufacturer of the autonomous vehicle; or
b) An autonomous technology certification facility that is licensed pursuant to
section 19 of this regulation.
2) A certificate of compliance issued pursuant to subsection 1 must certify that the
autonomous technology installed on the autonomous vehicle:
a) Has a separate mechanism in addition to, and separate from, any other mechanism
required by law, to capture and store the autonomous technology sensor data for at
least 30 seconds before a collision occurs between the autonomous vehicle and
another vehicle, object or natural person while the vehicle is operating in
autonomous mode. The autonomous technology sensor data must be captured and
stored in a read-only format by the mechanism so that the data is retained until
extracted from the mechanism by an external device capable of downloading and
storing the data. Such data must be preserved for 3 years after the date of the
collision. The provisions of this paragraph do not authorize or require the
modification of any other mechanism to record data that is installed on the
autonomous vehicle in compliance with federal law.
b) Has a switch to engage and disengage the autonomous vehicle that is easily
accessible to the operator of the autonomous vehicle and is not likely to distract the
operator from focusing on the road while engaging or disengaging the autonomous
vehicle.
c) Has a visual indicator inside the autonomous vehicle which indicates when the
autonomous vehicle is engaged in autonomous mode.
d) Has a system to safely alert the operator of the autonomous vehicle if a technology
failure is detected while the autonomous vehicle is engaged in autonomous mode,
and when such an alert is given, either:
I. Requires the operator to take control of the autonomous vehicle; or
II. If the operator is unable to take control of or is not physically present in
the autonomous vehicle, is equipped with technology to cause the
autonomous vehicle to safely move out of traffic and come to a stop.
Nothing in this subparagraph shall be construed to authorize or require the
modification of a system installed in compliance with the Federal Motor
Vehicle Safety Standards and Regulations unless the modification can be
performed without adversely affecting the autonomous vehicle’s
compliance with the federal standards and regulations.
e) Does not adversely affect any other safety features of the autonomous vehicle which
are subject to federal regulation.

16
f) Is capable of being operated in compliance with the applicable traffic laws of this
State and must indicate whether the autonomous vehicle may be operated with or
without the physical presence of an operator.
g) If it is necessary for the operator of the autonomous vehicle to be physically present
in the autonomous vehicle when it is engaged, allows the operator to take control of
the autonomous vehicle in multiple manners, including, without limitation, through
the use of the brake, the accelerator pedal and the steering wheel and alerts the
operator that the autonomous mode has been disengaged.
3) In addition to the requirements set forth in subsection 2, the certificate of compliance
must certify that an owner’s manual has been prepared for the autonomous vehicle which
describes any limitations and capabilities of the autonomous vehicle, including, without
limitation, whether the operator of the autonomous vehicle must be physically present in
the autonomous vehicle while the vehicle is engaged in autonomous mode. A licensed
vehicle dealer or a licensed autonomous technology certification facility shall ensure that
a copy of such a manual is provided to the purchaser of an autonomous vehicle.
4) As used in this section, “vehicle dealer” has the meaning ascribed to it in NRS 482.020.
Figure 2-1: Image 1: Sec. 16, Bill AB511 Nevada Legislature
Regulations for autonomous vehicles are still in development in both California and
Florida. Florida has tasked its Department of Highway Safety and Motor Vehicles to submit a
report to the President of the Senate and the Speaker of the House of Representatives
recommending additional legislative or regulatory action that may be required for the safe testing
and operation of motor vehicles equipped with autonomous technology no later than February
12, 2014 ("Bill AB511 Nevada Legislature", 2011). Similarly, California has tasked its
Department of Motor Vehicles to adopt regulations as soon as practicable, but no later than
January 1, 2015 ("Senate Bill No. 1298, 2012"). Both states have some differences in their
legislation but each seems to be primarily following Nevada’s example.
2.7 Public Opinion
Autonomous vehicles, while technologically possible and very likely to be utilized in the
near future, have a major roadblock. Despite the growing precision of sensors, awareness of

17
their surroundings, and navigational control these test vehicles have demonstrated recently, the
public and its perception of this technology will truly define how soon it will arrive on the
market. The public has demonstrated a certain level of distrust concerning the ability of
autonomous vehicles to safely operate on public roads. Many automotive providers and
researchers agree that this distrust, warranted or not, is a major factor in determining the success
of these autonomous vehicles (Newcomb, 2012).
Public concern is the core obstacle for autonomous vehicles. Many people find the lack
of control unsettling, believing the technology to be unreliable and the programming to be
incapable of proper control, worrying about the risk of computer malfunction (Klayman, 2012).
They find the lack of control to be limiting, seeing the autonomous car as a risk to the freedom to
drive, some going as far as to say that the autonomous car is leading to a slow brainwashing and
desensitization to man’s need to explore (Robinson, 2012). And they find the autonomous nature
of the car itself to be threat to their security, tracking their every movement and allowing the
government to spy on them. These skeptics believe these concerns are paramount. Scouring the
Internet reveals blogs, magazines, forums all dedicated to how the automation of driving will
push an already weak society to further technological dependence.
However, professional surveys show that opinions are split in the total population. A
survey posed by J.D. Power and Associates compared the attitudes surrounding these
autonomous vehicles (J.D. Power and Associates, 2012). Supporters of the technology see
relieving the driver of their control as a safety benefit, believing that the car can drive safer and
more efficiently than an inattentive human operator. And even more so see that the time gained
from removing the driver’s attention can allow them to do other, more productive activities while
riding in the autonomous car (J.D. Power and Associates, 2012).
18
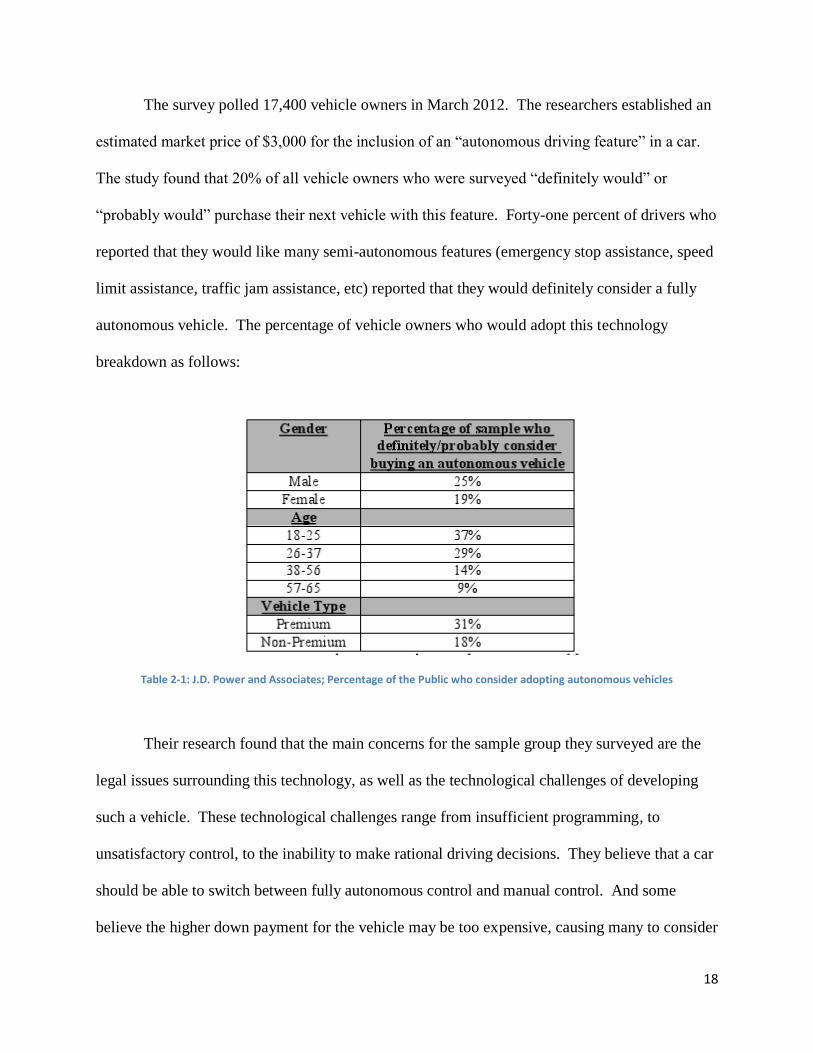
The survey polled 17,400 vehicle owners in March 2012. The researchers established an
estimated market price of $3,000 for the inclusion of an “autonomous driving feature” in a car.
The study found that 20% of all vehicle owners who were surveyed “definitely would” or
“probably would” purchase their next vehicle with this feature. Forty-one percent of drivers who
reported that they would like many semi-autonomous features (emergency stop assistance, speed
limit assistance, traffic jam assistance, etc) reported that they would definitely consider a fully
autonomous vehicle. The percentage of vehicle owners who would adopt this technology
breakdown as follows:
Table 2-1: J.D. Power and Associates; Percentage of the Public who consider adopting autonomous vehicles
Their research found that the main concerns for the sample group they surveyed are the
legal issues surrounding this technology, as well as the technological challenges of developing
such a vehicle. These technological challenges range from insufficient programming, to
unsatisfactory control, to the inability to make rational driving decisions. They believe that a car
should be able to switch between fully autonomous control and manual control. And some
believe the higher down payment for the vehicle may be too expensive, causing many to consider

19
alternative methods of affording payments. These include carpooling and neighborhood vehicle
sharing.
Despite the generally positive opinion of autonomous vehicles shown by this survey,
public acceptance is still the limiting factor for the autonomous personal vehicle. IEEE, as
reported by CNN (Newcomb, 2012a), predicts that the…
“biggest barrier to pervasive adoption of driverless cars may have nothing to do with
technology, but will be general public acceptance. While the average driver may grasp the basic
benefits of autonomous cars – increased fuel efficiency and safety, along with a reduction in
traffic – it may not be enough to get them to let go of the steering wheel.”
This is made even more apparent when a study performed by the Virginia Tech
Transportation Institute (VTTI) gauged “how drivers react when a car takes over primary tasks
they’re used to performing” (Newcomb, 2012b). They reported that “though most drivers
typically have some understanding of the capabilities of ADAS (advanced driver assistance
systems) technology, most don’t grasp the systems’ limitations.” The study, reported by Wired
Magazine, explains that for the full implementation of autonomous cars to be utilized, drivers
must first maintain a level of attention to the autonomous vehicle in order to operate it. They
explain that the driver must understand that this system has its flaws and must be controlled in
the event of a computer malfunction or software error. Until the technology is proven to be
successful, the required human attention is what many automotive companies working towards
autonomous vehicles consider to be the most important deterrent against accidents (Newcomb,
2012b).

20
But with the issues of safety aside, there still remains the belief that autonomous cars rob
people of their freedom. People want to be able to manually drive when they can. Autonomous
driving is “see[n] as [a] loss of status” (J.D. Power and Associates, 2012) for auto enthusiasts. In
the United States, the country of origin for the first mass produced automobiles, one might think
these driving enthusiasts, who tend to the purchase high-end sports and luxury cars, would be the
most outspoken opponent to autonomous vehicles. However, researchers at Ford find the
opposite is true (Fitchard, 2012).
These people want to “have that freedom whenever [they] want it, but if drivers spend 53
minutes of their day in traffic, they get tired,” reports Jim McBride, a Ford Research and
Innovation technical expert. They want the thrill of driving when it’s available and the
automation of steering and control when it’s not (i.e. in dead-locked traffic). Ford is working to
include more and more semi-autonomous driving assistance features in their vehicles. They plan
to “alter the average consumer’s perception of automated driving.” McBride notes that
“customers can elect to turn off those automation features whenever they choose.” Many
hesitant proponents of autonomous cars would look favorably towards the ability to control the
autonomy (J.D. Power and Associates, 2012). This is a way of improving public perception of
this technology, which is somewhat based on the freedom to control the vehicle.
Despite all this, what if the computer has a malfunction? For technology skeptics, there is
a general distrust of all computer-related technologies. For some people, computer malfunctions
are the norm. Bryan Reimer, a research scientist at Massachusetts Institute of Technology, has
said, "My mental model of trust in technology is a Windows blue screen of death. That's how
much faith I have in PCs and computer systems.” (Klayman, 2012) This may seem extreme for
many computer literate people, but a distrust of computers is very prevalent in today’s society,
21
particularly among the older generation (J.D. Power and Associates, 2012). This level of
hesitancy to trust a computer, especially to drive, is supported by the evidence in the J.D. Powers
and Associates survey, where the oldest age groups described their desire for autonomous
vehicles with less and less enthusiasm.
2.8 Conclusion
Each of the sections above give an introduction to the potential implications and barriers
related to autonomous vehicles. It’s important to keep in mind that this is just an introduction,
not an exhaustive discussion of all of the issues and implications.
However, from what we’ve described it is fairly easy to see that the non-technological
issues are more likely to be a barrier toward the adoption of autonomous vehicles than the
technological ones. While autonomous car makers have proven that their cars work and are
reasonably safe – at least for prototypes – the potential consumers are not so convinced. And
while the legal issues behind owning and operating autonomous vehicles are being addressed by
some states, the legal system of the United States is largely unprepared to handle autonomous
vehicles. Finally, the issue of cost is a big factor. Thus public opinion, legality, and cost are the
specific issues that we view as the biggest deterrents to the adoption of autonomous vehicles.

22
Chapter 3 : Methodology
3.1 Introduction
The goal of this chapter is to provide a descriptive outline of how this experiment was
conducted. As the goal of this study was to estimate the appeal of an autonomous driving feature
in cars, we first had to decide what aspects of an autonomous system were most influential in
determining its overall desirability. Based on preliminary research, we established that the
following three topics are the most influential in determining the appeal of an autonomous
driving feature.
Cost of the system
Overall safety of the system
Extent of relevant legislation to protect users and civilians
We also recognized the following three topics as lesser influences:
Effect on the productivity of the user
Fuel efficiency of the car
Environmental impact of the car
These latter three topics, though possibly very influential in the final sale of an autonomous car,
have not yet been extensively studied by researchers, and most of the available data is just
speculative. We felt this would make it difficult for us to provide accurate information to our
survey group about these topics, and therefore make it difficult to get useful data back. It is for
this reason that we decided to classify these topics as lesser influences, simply meaning that
these topics will be focused on less than the major topics of this study.

23
This chapter will further discuss the strategies used in determining these key influences,
as well as how data was collected and analyzed. Our methodology adhered to the steps outlined
in the traditional scientific method – conducting preliminary research/observations, developing a
hypothesis, performing background research, designing an experiment, conducting the
experiment, analyzing the results, and forming a conclusion based on the analysis. The
following sections of this chapter will summarize each of these steps in the order in which they
were performed.
3.2 Research
As briefly stated above, safety, legality, and cost were determined to have the most
influence on the appeal of autonomous cars. They therefore became the primary focus of this
study. Unfortunately the information we were able to gather regarding user productivity, fuel
efficiency, and environmental impact of autonomous cars was all highly speculative. This is
believed to be due to a lack of research on the performance of the cars due to the newness of the
technology, and the scarcity of prototypes.
Background research revealed that the primary safety concern regarding autonomous cars
was a lack of trust in the artificial intelligence of the technology, despite high level of success in
safety testing. Research has also shown that there is currently very little legislation pertaining to
autonomous cars, and most of which does exist has not yet been fully developed. For cost, we
found that the price tag on an autonomous car is expected to be orders of magnitude higher than
the J.D. Powers and Associates survey suggested. These three topics were believed to be the
deciding factors on whether or not autonomous car technology will take root in the near future.
Although less important, some concern was found regarding productivity, efficiency, and
environmental impact. The speculative implications relevant to these areas were reasonable

24
assumptions, so it was determined it would be worth gauging how those implications might
affect the public. These secondary topics were not expected to have as strong of an impact on
the appeal of autonomous cars as that of safety, legality, and cost.
3.3 Hypothesis
We hypothesized that the appeal of autonomous cars to the average consumer would be
most influenced by the overall safety of the vehicle. We expected that, although existing
autonomous cars have great safety records, the public would not trust the cars as being safe
because the technology is so new and unfamiliar.
Cost was hypothesized to be the second most influential aspect on the appeal of an
autonomous car. The extremely high prices of sensors used in the cars autonomous system are
much more than the average consumer is willing to bear. If autonomous car manufacturers wish
to sell their cars to more than just the wealthy or high tech enthusiasts then they need to find a
way to develop these cars at a lower cost.
Legality was hypothesized to have the least significant impact of the main three on the
appeal of an autonomous car. However, we still expected that the majority of people would be
generally pleased with the current laws regarding autonomous cars. Even though the laws
haven’t been fully developed, they are a step in the right direction and are generally aimed at
guaranteeing the safety of the car operators. If legislators continue to advance the development
of laws regarding the use and development of autonomous cars in the same way that they are
now we believe that the market for autonomous cars will only improve.
25
As far as the lesser influences are concerned, we expected that people would be more
inclined to buy autonomous cars if they were able to spend the time they would have spent
driving on other tasks. However, if the autonomous car requires the user to remain in the
driver’s seat and pay constant attention to the system while it is in use, they will most likely find
the autonomous feature less desirable than if it required no attention at all.
We expected the influence of driving efficiency to positively influence the appeal of an
autonomous car if the car were more efficient, but have no effect if the car was no more efficient
than a manually operated version.
In regards to the influence of the environmental impact of the car, we didn’t expect it to
have much of an effect one way or the other. Historically, environmental concerns have not
strongly impacted the sales of a product in the U.SA, and we didn’t expect this to be any
different in our test.
We were also interested in the variation in level of appeal to different demographics,
specifically those based on age, income, and education. We expected to see that the younger
subjects would be more trusting of autonomous cars due to their acceptance of modern
technology and computers in general. As age increases, we expected to see fewer people finding
autonomous cars desirable. This is most likely due to the lack of familiarity amongst older
generations with high end computing and more modern technologies. They would be less willing
to undergo such an extreme transition as the change from manually driven to autonomously
driven cars.
With regards to income, we were curious to see if those with higher income would find
autonomous cars more desirable. We hypothesized that subjects with higher incomes would be

26
willing to spend more on autonomous cars, and therefore find them more desirable. Subjects that
had incomes on the lower end of the scale would have may find autonomous cars a little less
desirable. However, since cost is only one of the six topics our subjects were surveyed on, the
resulting influence is expected to be fairly minimal.
For our last demographic group, based on education, we expected to see a minor variation
in our subject responses. We belied that people who had obtained a higher level of education,
especially those within in the sciences, would better understand how the technology worked and
therefore be more trusting of it, whereas the technology might be too foreign to those with lower
educations. Thus we believed that highly educated subjects would not find safety to be as much
of a concern.
Overall, we thought that autonomous cars would be considered desirable. Like every
new technology its acceptance may start out slow but once the technology has proven itself in a
public environment, and as component costs go down we expect autonomous cars to be adapted
fairly quickly.
3.4 Experiment
In order to test our hypothesis we developed a survey. We chose a survey because it
allowed us to obtain people’s opinions of autonomous cars without requiring them to have
actually used the cars. We also chose to use a survey format over an interview format because it
allowed us to obtain a larger sample size. A survey would take up less time for the subjects and
require a smaller, more reasonable budget. Finally, since autonomous cars have not been
introduced to the market there is not much existing data on the public’s opinion. A survey
allows us to gather a relatively large amount of data for a topic where little data exists.
27
The survey consists of questions pertaining to each area of interest – safety, legality, cost,
productivity, fuel efficiency, and environmental impact. More questions were asked about
safety, cost, and legality since they were our primary concerns. We included questions intended
to gauge how participants felt about specific aspects of autonomous cars, along with questions
asking how the subjects felt about a topic overall. Once the surveys were collected the data
would be analyzed to try and determine desirability levels associated with autonomous cars, as
well as what makes the more or less desirable.
To develop a non-bias sample group we had to distribute our survey using several
different media. In and attempt to reach newer drivers, roughly ages 16 to 18, we printed out
surveys and sent them to a nearby high school for the juniors and seniors to physically fill out.
Prior to sending the survey we talked to the school staff and acquired the proper permissions to
conduct the survey on the students. We also ensured that the students were aware that the survey
was both anonymous and voluntary.
In order to gather data on older age groups, and a wider variety of participants than are
available in a local high school we utilized the services of two websites, SurveyMonkey.com and
MechanicalTurk.com. Both allowed us to post a survey online and gather the responses in a
useful Excel format which could be exported to other statistical analysis software. We sent out a
link to our survey on SurveyMonkey.com to students at Worcester Polytechnic Institute via
email, and posted links to it on Facebook.com. MechanicalTurk.com attracts participants by
offering financial compensation for taking the surveys. In addition to a $15 user fee, we gave $50
to the site and offered a rate of $0.50 per survey for a total of 100 potential responses. We did not
post links to this survey to friends or local communities to avoid repeat survey takers. We also

28
hoped that not posting the link to any local community would help increase variety in our sample
group. Between these different media we expected to get 400- 600 responses.
3.5 Analysis
In order to more easily analyze our results, we needed to first get the data into a common
format. SurveyMonkey automatically exported the data it collected from participants into a
useful Excel format which could be easily imported into SPSS, the software with which we
planned to do our statistical analysis. We developed a program to translate the paper surveys
from the high school to the same Excel format that SurveyMonkey used. Unfortunately we
received very few responses from the MechanicalTurk service, and those that we did we receive
were mostly incomplete. Due to this, we decided to discard that data.
Next we had to determine how strongly cost, safety, and law influenced an individual’s
decision to purchase an autonomous car. We decided to group like questions together, such as all
questions pertaining to safety, into a single variable By running a factor analysis test we found
questions that could be meaningfully grouped together. We then formed the grouping by
averaging the answers to each component question together. This allowed us to create us to
create overall means for the topics that could be grouped together. The value of these means
allowed us to estimate how influential each topic was in determining an average person’s desire
to potentially purchase a car with autonomous driving features.
The same technique was performed to estimate the influence of improved individual
productivity, improved driving efficiency, and lighter environmental impact. However, our
background research lead us to believe that any detailed data gathered about productivity,
efficiency, and environmental impact would be inaccurate due to the speculative nature of the

29
topics. Therefore, any conclusions regarding their influence would require further testing in
order produce a more definite conclusion.
Our second objective was to determine how the appeal of autonomous cars differed
amongst different demographic groups separated by age, income, gender, accident history,
education, disability, and preference towards driving. To do this we needed to first determine the
mean of each topic of interest for each demographic respectively. We then compared the groups
to each other using ANOVA tests to determine if there was any statistically significant difference
in how much an autonomous car driving system appealed to each group. We used SPSS
software to perform these tests.
30
Chapter 4 : Results
4.1 Introduction
This chapter reports the most relevant results from our study that relate to our hypotheses.
A complete description of the results can be found in Appendix B. We ran our survey for this
study from February 22, 2013 to March 20, 2013. During this time period we obtained a total of
467 responses from grades 10 through 12 of Foxborough Regional Charter School and from
SurveyMonkey.com. The statistics to be reported are split into three categories: groupings,
demographics, and individual questions.
4.2 Groupings
The first thing we did was compile the responses to each question to obtain their
averages. From these averages, we were able to perform factor analyses on questions that we
thought we could group together. Based on the results of these factor analyses, we could
determine which responses could be meaningfully grouped into a single variable. Categories we
were able to successfully group together were related to efficiency, law, productivity, and safety.
The resulting factor analyses are detailed below.
Efficiency
We wanted to group together the responses of two questions relating to efficiency in
order to represent the topic of efficiency as a whole. The questions were:
How much more or less likely would you be to purchase an autonomous car if it had
better fuel efficiency than a similar, but manually operated car?
How much more or less likely would you be to purchase an autonomous car if it could get
you to your destination faster?

31
The resulting factor analysis showed that the responses to these questions could be
meaningfully grouped together into a single component (Eigenvalue = 1.578, percent variance =
78.922%, factor loadings = 0.888). The statistics of this variable will be reported in detail along
with the other individual questions in section 4.5.
Law
Again, the factor analysis test showed that the responses for two questions pertaining to
the topic of law could be meaningfully grouped together. The two questions were:
By law, if a car’s autonomous system fails the car is required to alert the driver and
either give the driver control or pull over and come to a stop. I am comfortable knowing that
this is required by law.
I would be comfortable sending my car out on an errand by itself knowing that I am
liable if it gets into an accident.
The participants answered how much they agreed or disagreed with the above statements.
The factor analysis showed that the responses to these questions resulted in a single component
(Eigenvalue = 1.229, percent variance = 61.430%, factor loading = 0.784). The statistics of this
variable will be reported in detail in section 4.5.
Productivity
The survey contained two questions pertaining to productivity. The two questions were:
I would be more productive during an average week if my vehicle could drive itself to
places of interest while I stayed home.
If I had an autonomous vehicle then I could be more productive on other tasks while
traveling even though I would be required to remain in the driver’s seat.

32
Just as above, the participants answered how much they agreed or disagreed with the two
statements. The factor analysis showed the responses to the questions could be meaningfully
grouped together (Eigenvalue = 1.483, percent variance = 74.150%, factor loadings = 0.861).
The statistics of this variable will be reported in detail in section 4.5.
Safety
The last factor analysis that showed a meaningful grouping was run on the responses to
the questions pertaining to safety. The three questions were:
I trust that a computer can drive my car with no assistance from me.
I believe a computer-operated car would drive on populated streets better than the
average human driver.
I would be comfortable entrusting the safety of a close family member to an autonomous
car.
Participants answered the questions based on how much they agreed or disagreed with
the above statements. The factor analysis showed the responses to the questions could be
meaningfully grouped together (Eigenvalue = 2.355, percent variance = 78.507%, factor loadings
ranging from 0.858 to 0.900). The statistics of this variable will be reported in detail in section
4.5.
4.3 Demographics
We considered nine different demographic groups. The demographics included gender,
age, ethnicity, education, income, disability, accident history, employment, and mode of
transportation.

33
Gender
Our participants were split fairly evenly in terms of gender. Of the 413 people that
answered the question 53.8%, were male, 42.9% were female, 0.5% answered other, and 2.9%
chose not to disclose their gender. The distribution is shown graphically in Figure 4-1.
Figure 4-1: Gender Distribution
Age
Of the 413 people that provided their age 4.6% were below 16 years old, 63.7% were
between the ages of 16 and 20, 20.3% were between the ages of 21 and 25, 2.4% were between
the ages of 26 and 30, 3.1% were between the ages of 31 and 40, 1.7% were between the ages of
41 and 50, 2.4% were between the ages of 51 and 60, and 1.7% were above the age of 60. The
distribution is shown graphically in Figure 4-2.

34
Figure 4-2: Age Distribution
Ethnicity
Of the 412 participants that answered their ethnicity 0.7% were American Indian/Native
American, 4.9% were Asian, 8.3% were Black/African American, 3.2% were Hispanic/Latino,
76.7% were White/Caucasian, 1.0% answered Pacific Islander, 2.9% answered other, and 2.4%
chose not to disclose their ethnicity. The distribution is shown graphically in Figure 4-3.
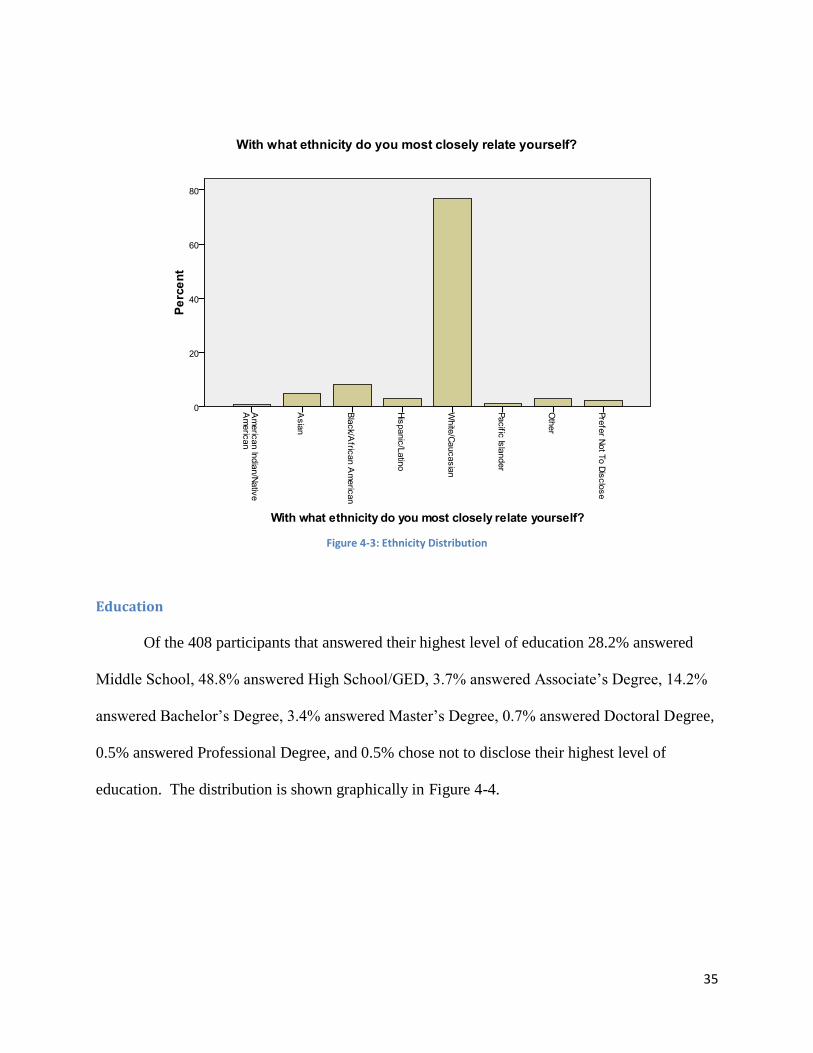
35
Figure 4-3: Ethnicity Distribution
Education
Of the 408 participants that answered their highest level of education 28.2% answered
Middle School, 48.8% answered High School/GED, 3.7% answered Associate’s Degree, 14.2%
answered Bachelor’s Degree, 3.4% answered Master’s Degree, 0.7% answered Doctoral Degree,
0.5% answered Professional Degree, and 0.5% chose not to disclose their highest level of
education. The distribution is shown graphically in Figure 4-4.
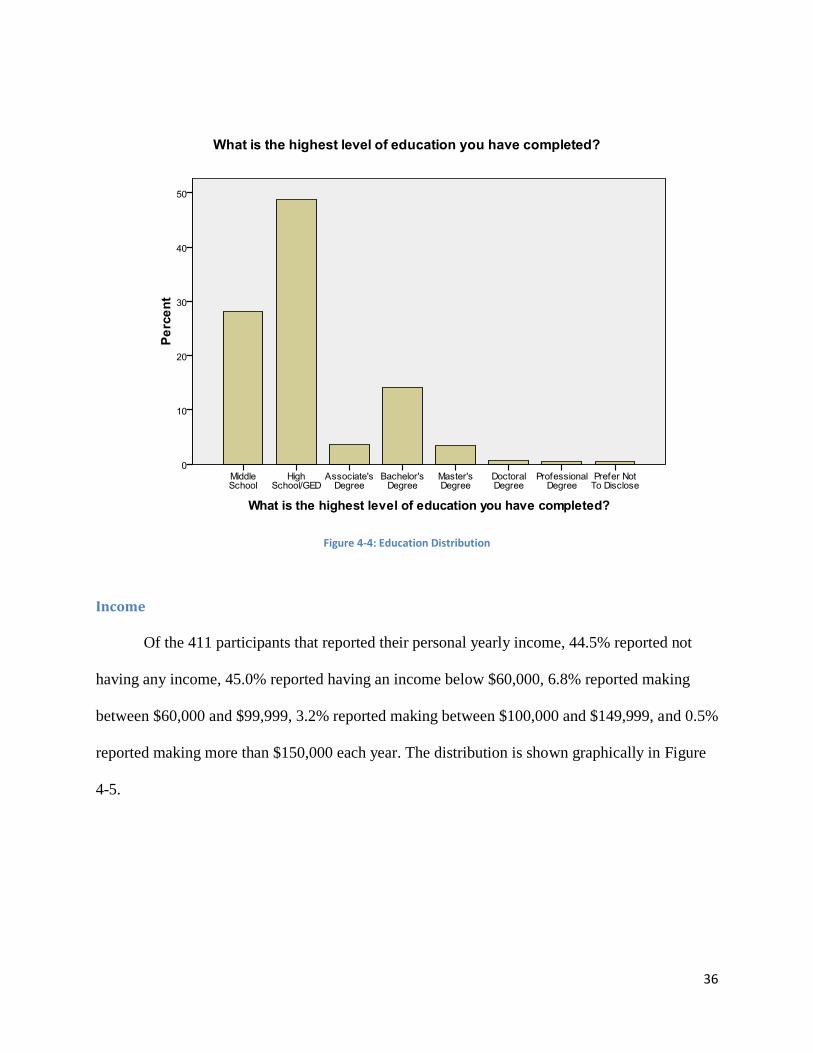
36
Figure 4-4: Education Distribution
Income
Of the 411 participants that reported their personal yearly income, 44.5% reported not
having any income, 45.0% reported having an income below $60,000, 6.8% reported making
between $60,000 and $99,999, 3.2% reported making between $100,000 and $149,999, and 0.5%
reported making more than $150,000 each year. The distribution is shown graphically in Figure
4-5.
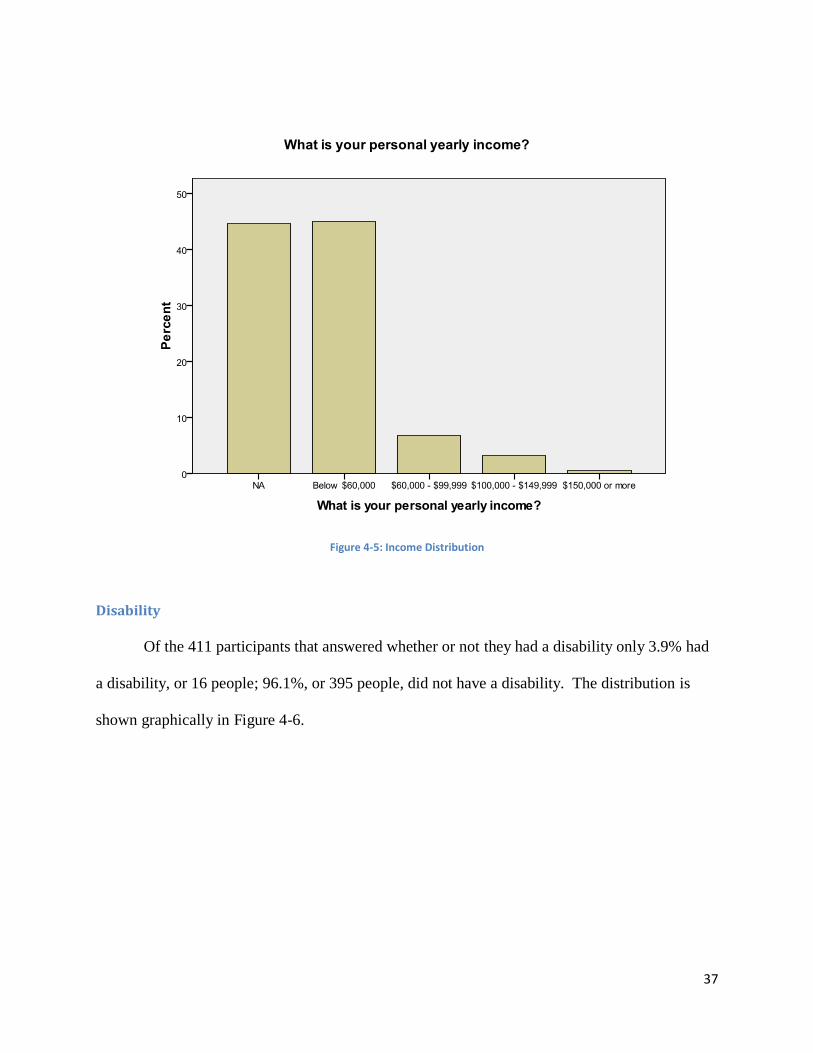
37
Figure 4-5: Income Distribution
Disability
Of the 411 participants that answered whether or not they had a disability only 3.9% had
a disability, or 16 people; 96.1%, or 395 people, did not have a disability. The distribution is
shown graphically in Figure 4-6.

38
Figure 4-6: Disability Distribution
Accident History
Of the 413 people that answered how many accidents they had been in within the last five
years, 68.8% had not been in any accidents, 24.0% had been in one accident, 4.6% had been in
two accidents, 1.5% had been in three accidents, and 1.2% had been in more than three
accidents. The distribution is shown graphically in Figure 4-7.

39
Figure 4-7: Accident Distribution
Employment
Of the 412 participants that answered their level of employment, 8.7% were employed
full time, 7.8% were employed part time, 1.5% were self employed, 1.9% were unemployed or
looking for work, 0.2% were homemakers, 78.2% were students, 1.2% were retired, and 0.5%
chose not to disclose their level of employment. The distribution is shown graphically in Figure
4-8.

40
Figure 4-8: Employment Distribution
Primary Mode of Transportation
Of the 462 participants that answered what their primary method of transportation was
63.2% answered Personal Automobile, 5.6% answered Public Transportation, 30.3% answered
Walking/Biking, and 0.9% answered other. The distribution is shown graphically in Figure 4-9.

41
Figure 4-9 : Primary Mode of Transportation Distribution
4.4 Individual Questions
This section will cover the results of a number of specific questions. A complete
reference of responses to all questions can be found along with the rest of the report in Appendix
B. These questions were chosen because they relate the most to our hypothesis.
How much would you expect a fully automated driving system for your car to cost beyond its
original price?
A total of 451 participants responded to this question. 1.77% of participants expected a
fully automated driving system to cost below $1,000, 13.97% expected the cost to be $1,000 -
$4,999, 39.91% expected the cost to be $5,000 - $9,999, 21.29% expected the cost to be $10,000
- $14,999, and 23.06% expected the cost to exceed $15,000. The average response was 3.50

42
where 3 represents the $5,000 to $9,999 range and 4 represents the $10,000 - $14,999 range. The
standard deviation was 1.049. The distribution is shown graphically in Figure 4-10.
Figure 4-10: Expected Cost of Automated Driving System
How much money would you be willing to spend to have an autonomous driving system
installed in your next car?
A total of 448 participants responded to this question. 30.4% of participants were willing
to spend at most $1,000, 40.2% were willing to pay $1,000 - $4,999, 20.8% were willing to pay
$5,000 - $9,999, 4.9% were willing to pay $10,000 - $14,999, and 3.8% were willing to pay over
$15,000. The average response was 2.12 where 2 represents the $1,000 to $4,999 range and 3

43
represents the $5,000 to $9,999 range. The standard deviation was 1.019. The distribution is
shown graphically in Figure 4-11.
Figure 4-11: Amount of Money One is Willing to Spend on an Autonomous Driving System
How many years after the technology is introduced to the market would you feel comfortable
purchasing a car with an autonomous driving system?
A total of 456 participants responded to this question. 4.4% answered that they would
feel comfortable purchasing an autonomous car immediately, 7.7% would feel comfortable
within a year, 25.9% would feel comfortable in 1 to 2 years, 31.6% would feel comfortable in 3
to 4 years, and 30.5% would feel comfortable in more than 4 years. The average response was
3.76 where 3 represents the 1 to 2 year range and 4 represents to 3 to 4 year range. The standard
deviation was 1.100. The distribution is shown graphically in Figure 4-12.

44
Figure 4-12: Waiting Period Before Buying an Autonomous Driving System
Do you share any of the following concerns regarding autonomously driven cars?
56.96% of participants were concerned that an autonomous car would have poor
awareness of its surroundings. 51.39% of participants were concerned that an autonomous car
would suffer from poor programming. 49.68% of participants were concerned that an
autonomous car would have poor control (steering, braking, acceleration). 73.23% of
participants were concerned that an autonomous car would be prone to malfunction. 48.18%
were concerned that an autonomous car would be prone to software hacking. Lastly, 13.70%
claimed that there was another concern that was not listed. Only 6.85% of participants did not
show any concern regarding autonomously driven cars. The average participant had 2.93
concerns regarding an autonomously driven car and the standard deviation was 1.622. The most
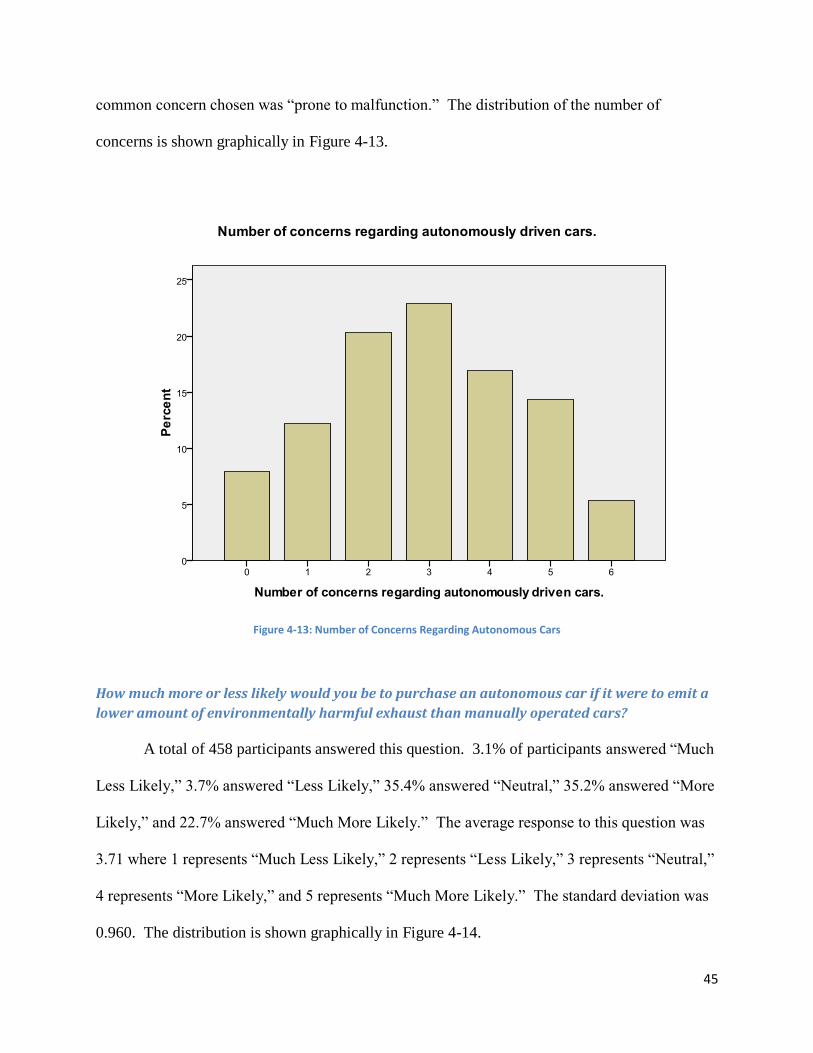
45
common concern chosen was “prone to malfunction.” The distribution of the number of
concerns is shown graphically in Figure 4-13.
Figure 4-13: Number of Concerns Regarding Autonomous Cars
How much more or less likely would you be to purchase an autonomous car if it were to emit a
lower amount of environmentally harmful exhaust than manually operated cars?
A total of 458 participants answered this question. 3.1% of participants answered “Much
Less Likely,” 3.7% answered “Less Likely,” 35.4% answered “Neutral,” 35.2% answered “More
Likely,” and 22.7% answered “Much More Likely.” The average response to this question was
3.71 where 1 represents “Much Less Likely,” 2 represents “Less Likely,” 3 represents “Neutral,”
4 represents “More Likely,” and 5 represents “Much More Likely.” The standard deviation was
0.960. The distribution is shown graphically in Figure 4-14.
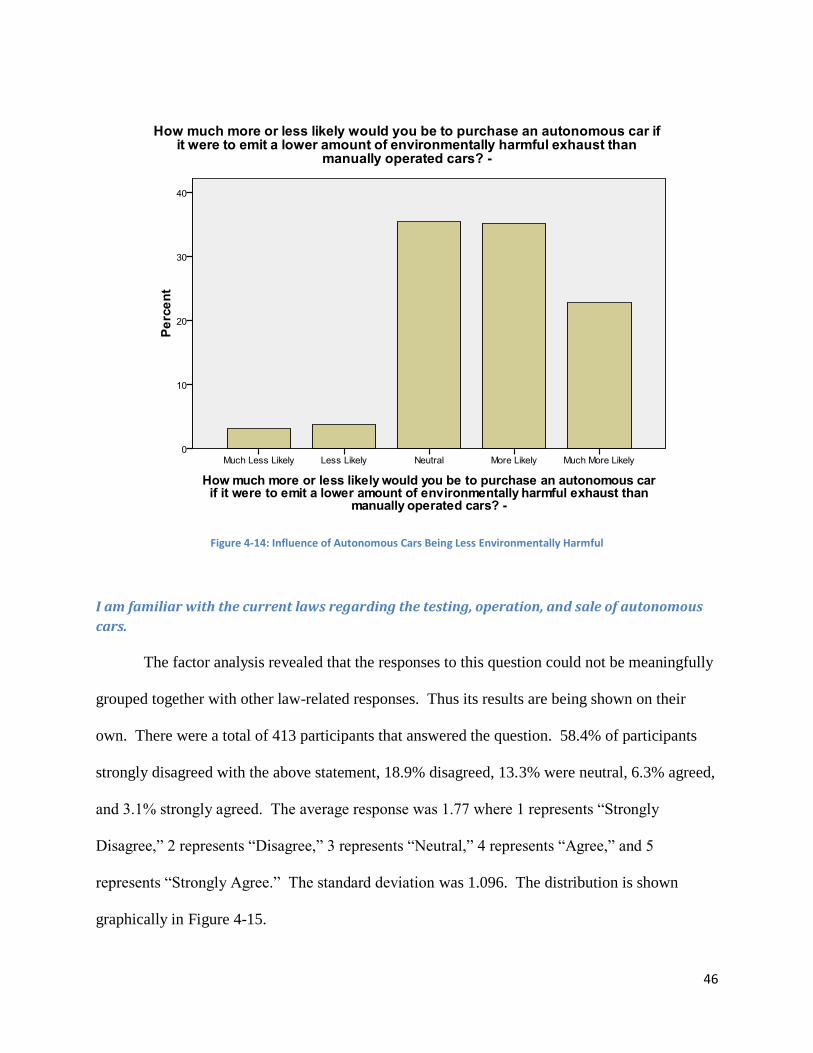
46
Figure 4-14: Influence of Autonomous Cars Being Less Environmentally Harmful
I am familiar with the current laws regarding the testing, operation, and sale of autonomous
cars.
The factor analysis revealed that the responses to this question could not be meaningfully
grouped together with other law-related responses. Thus its results are being shown on their
own. There were a total of 413 participants that answered the question. 58.4% of participants
strongly disagreed with the above statement, 18.9% disagreed, 13.3% were neutral, 6.3% agreed,
and 3.1% strongly agreed. The average response was 1.77 where 1 represents “Strongly
Disagree,” 2 represents “Disagree,” 3 represents “Neutral,” 4 represents “Agree,” and 5
represents “Strongly Agree.” The standard deviation was 1.096. The distribution is shown
graphically in Figure 4-15.

47
Figure 4-15: Familiarity with Laws Regarding Autonomous Cars
I believe that an individual should be required to attain a proper license endorsement, through
the Department of Motor Vehicles, in order to legally operate an autonomous car.
As was the case with the previous question, the factor analysis revealed that the responses
to this question could not be meaningfully grouped together with other law-related responses.
Thus its results are also being shown on their own. There were a total of 412 participants that
answered the question. 4.9% of participants strongly disagreed with the above statement, 4.9%
disagreed, 10.7% were neutral, 23.1% agreed, and 56.6% strongly agreed. The average response
was 4.22 where 1 represents “Strongly Disagree,” 2 represents “Disagree,” 3 represents
“Neutral,” 4 represents “Agree,” and 5 represents “Strongly Agree.” The standard deviation was
1.122. The distribution is shown graphically in Figure 4-16.
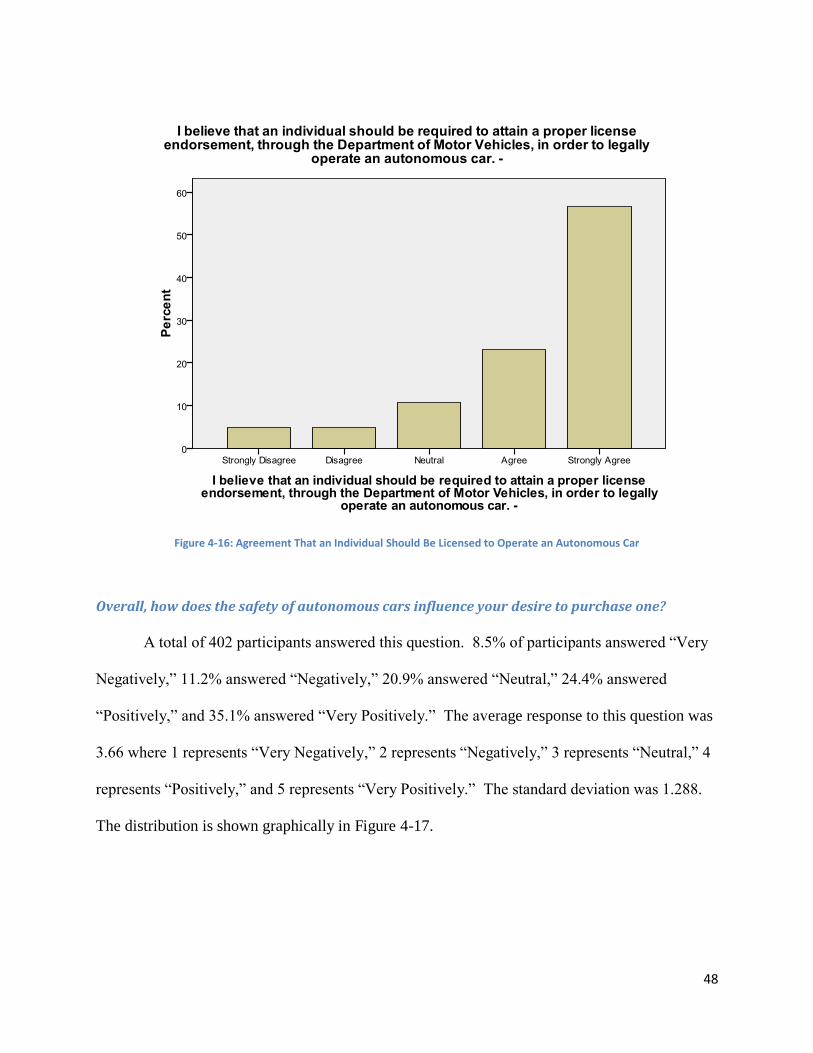
48
Figure 4-16: Agreement That an Individual Should Be Licensed to Operate an Autonomous Car
Overall, how does the safety of autonomous cars influence your desire to purchase one?
A total of 402 participants answered this question. 8.5% of participants answered “Very
Negatively,” 11.2% answered “Negatively,” 20.9% answered “Neutral,” 24.4% answered
“Positively,” and 35.1% answered “Very Positively.” The average response to this question was
3.66 where 1 represents “Very Negatively,” 2 represents “Negatively,” 3 represents “Neutral,” 4
represents “Positively,” and 5 represents “Very Positively.” The standard deviation was 1.288.
The distribution is shown graphically in Figure 4-17.
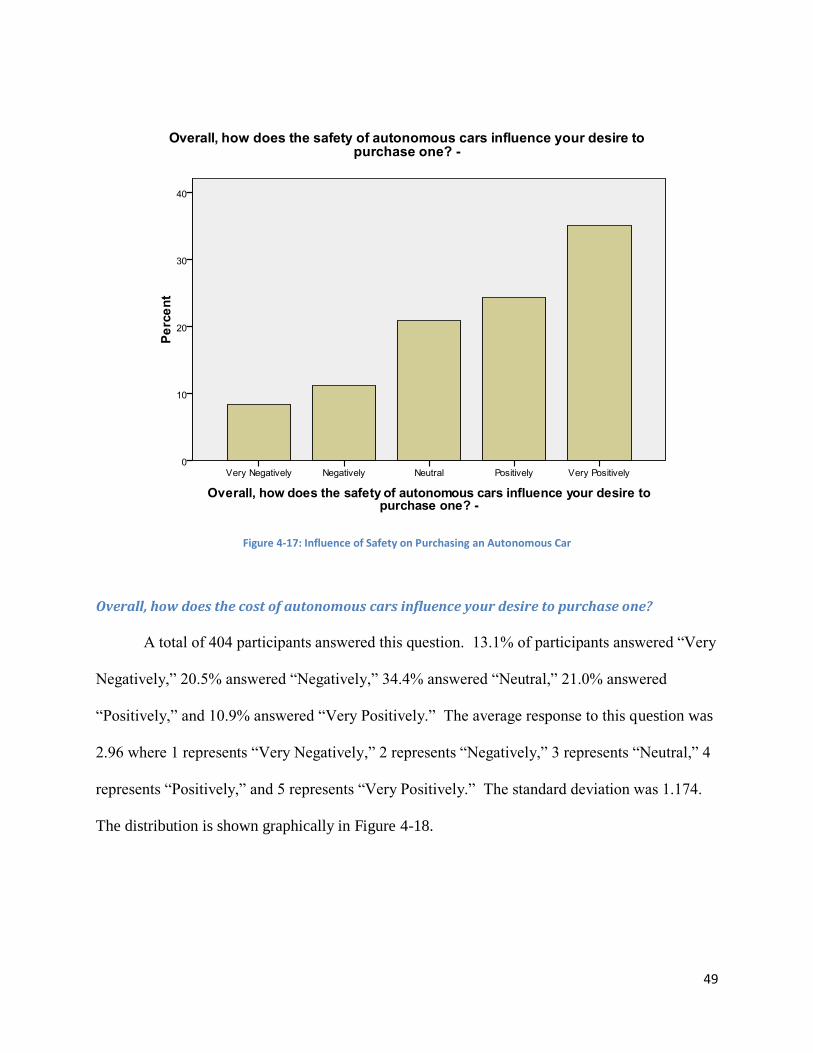
49
Figure 4-17: Influence of Safety on Purchasing an Autonomous Car
Overall, how does the cost of autonomous cars influence your desire to purchase one?
A total of 404 participants answered this question. 13.1% of participants answered “Very
Negatively,” 20.5% answered “Negatively,” 34.4% answered “Neutral,” 21.0% answered
“Positively,” and 10.9% answered “Very Positively.” The average response to this question was
2.96 where 1 represents “Very Negatively,” 2 represents “Negatively,” 3 represents “Neutral,” 4
represents “Positively,” and 5 represents “Very Positively.” The standard deviation was 1.174.
The distribution is shown graphically in Figure 4-18.
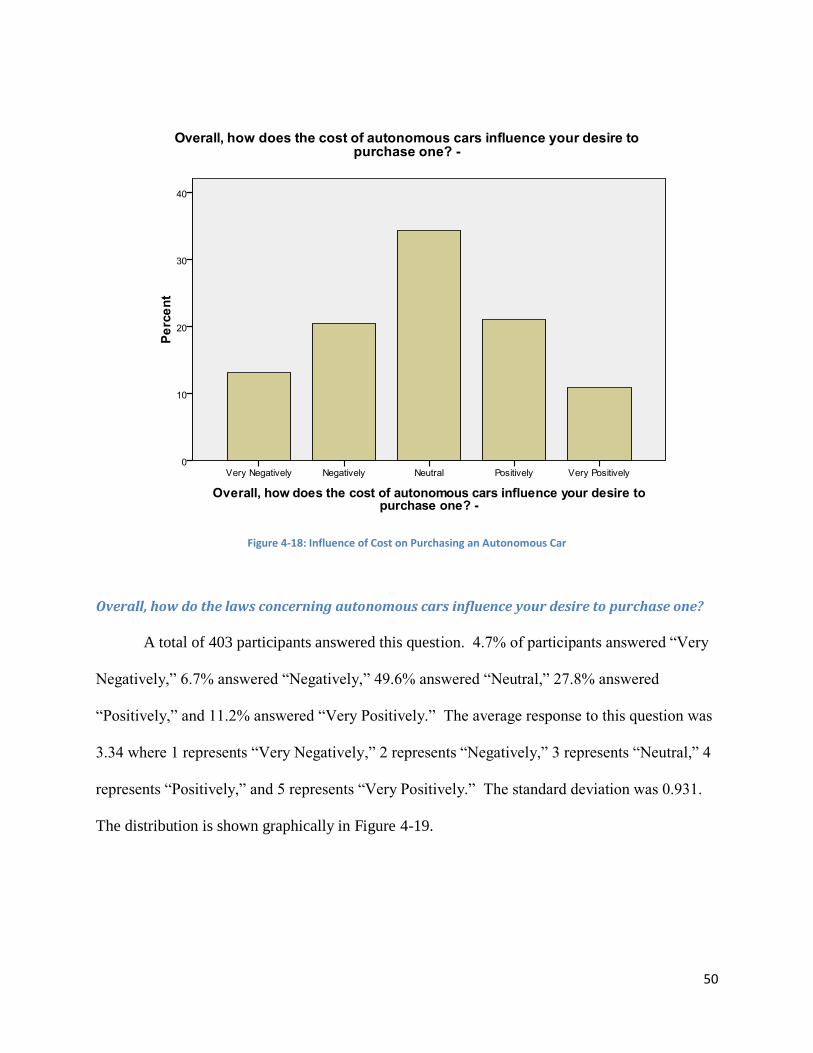
50
Figure 4-18: Influence of Cost on Purchasing an Autonomous Car
Overall, how do the laws concerning autonomous cars influence your desire to purchase one?
A total of 403 participants answered this question. 4.7% of participants answered “Very
Negatively,” 6.7% answered “Negatively,” 49.6% answered “Neutral,” 27.8% answered
“Positively,” and 11.2% answered “Very Positively.” The average response to this question was
3.34 where 1 represents “Very Negatively,” 2 represents “Negatively,” 3 represents “Neutral,” 4
represents “Positively,” and 5 represents “Very Positively.” The standard deviation was 0.931.
The distribution is shown graphically in Figure 4-19.

51
Figure 4-19: Influence of Law in Purchasing an Autonomous Car
Of the following, which are more important to you? Rank them in order from 1 (most
important) to 3 (least important).
The three options that the participants were asked to rank were the following:
Well-developed laws for the development, sale, and use of autonomous cars
Affordable cost for an autonomous car
Personal safety and the safety of those around you while operating an autonomous car
As you can see, these statements relate directly to the laws, cost, and safety of
autonomous cars.

52
The average ranking that law received was 2.1328. 11.72% of participants ranked law as
the most important topic, 63.28% ranked law as the second most important topic, and 25%
ranked law as the least important topic. The distribution is shown graphically in Figure 4-20.
Figure 4-20: Distribution of Law Ranking
The average ranking that cost received was 2.6122. 6.89% of participants ranked cost as
the most important topic, 25% ranked cost as the second most important topic, and 68.11%
ranked cost as the least important topic. The distribution is shown graphically in Figure 4-21.
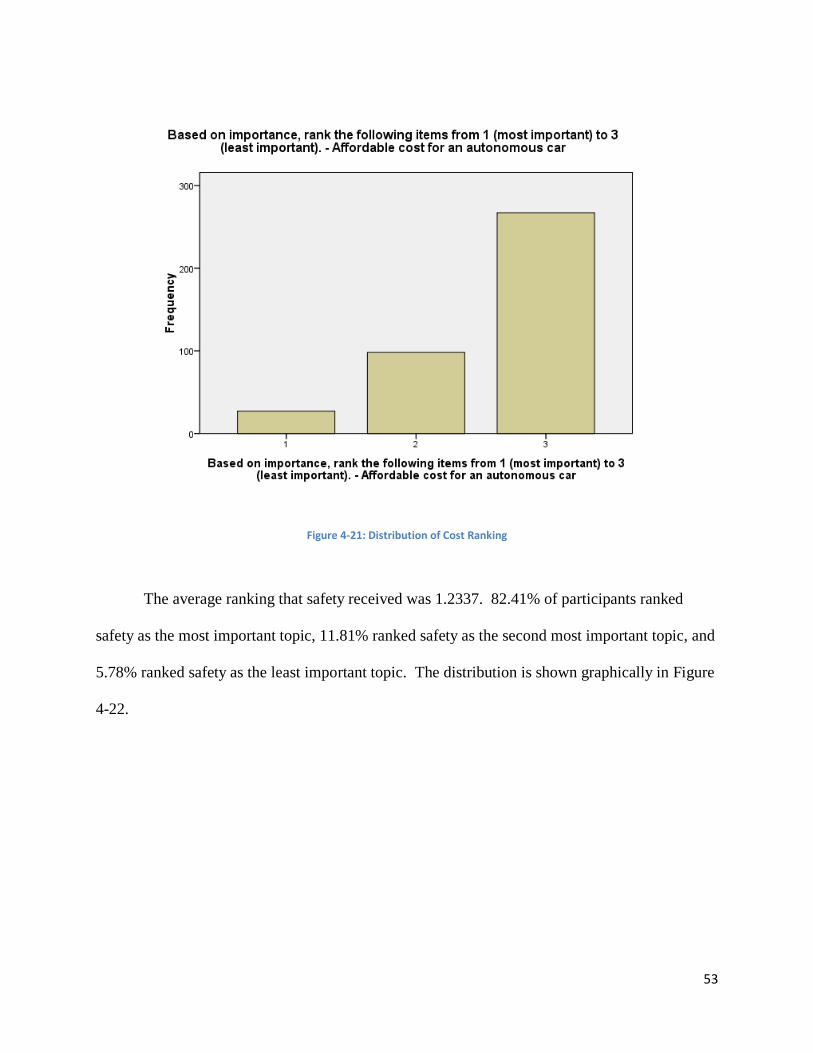
53
Figure 4-21: Distribution of Cost Ranking
The average ranking that safety received was 1.2337. 82.41% of participants ranked
safety as the most important topic, 11.81% ranked safety as the second most important topic, and
5.78% ranked safety as the least important topic. The distribution is shown graphically in Figure
4-22.
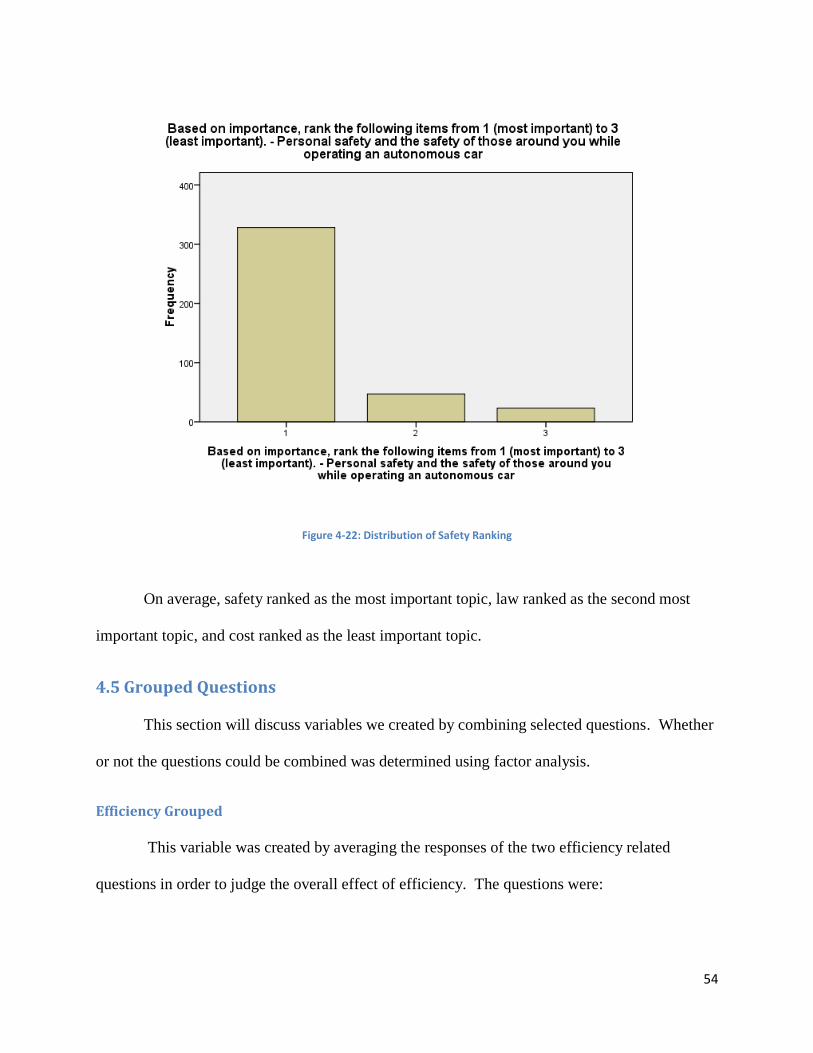
54
Figure 4-22: Distribution of Safety Ranking
On average, safety ranked as the most important topic, law ranked as the second most
important topic, and cost ranked as the least important topic.
4.5 Grouped Questions
This section will discuss variables we created by combining selected questions. Whether
or not the questions could be combined was determined using factor analysis.
Efficiency Grouped
This variable was created by averaging the responses of the two efficiency related
questions in order to judge the overall effect of efficiency. The questions were:

55
How much more or less likely would you be to purchase an autonomous car if it had
better fuel efficiency than a similar, but manually operated car?
How much more or less likely would you be to purchase an autonomous car if it could get
you to your destination faster?
There were a total of 463 participants that answered both of the above questions. The
resulting responses were split into three groups. Participants whose averaged responses fell
between the values 1 and 2.49 were labeled as “Negatively.” Responses between 2.50 and 3.49
were labeled as “Neutral.” Responses between 3.50 and 5 were labeled as “Positively.”
4.3% of participants indicated an overall negative influence due to the efficiency of
autonomous cars, 17.1% fell within the neutral range, and 78.6% of participants indicated an
overall positive influence due to the efficiency of autonomous cars. The average response was
2.74 where 1 represents “Negatively,” 2 represents “Neutral,” and 3 represents “Positively.” The
standard deviation was 0.52721. The distribution is shown graphically in Figure 4-23.
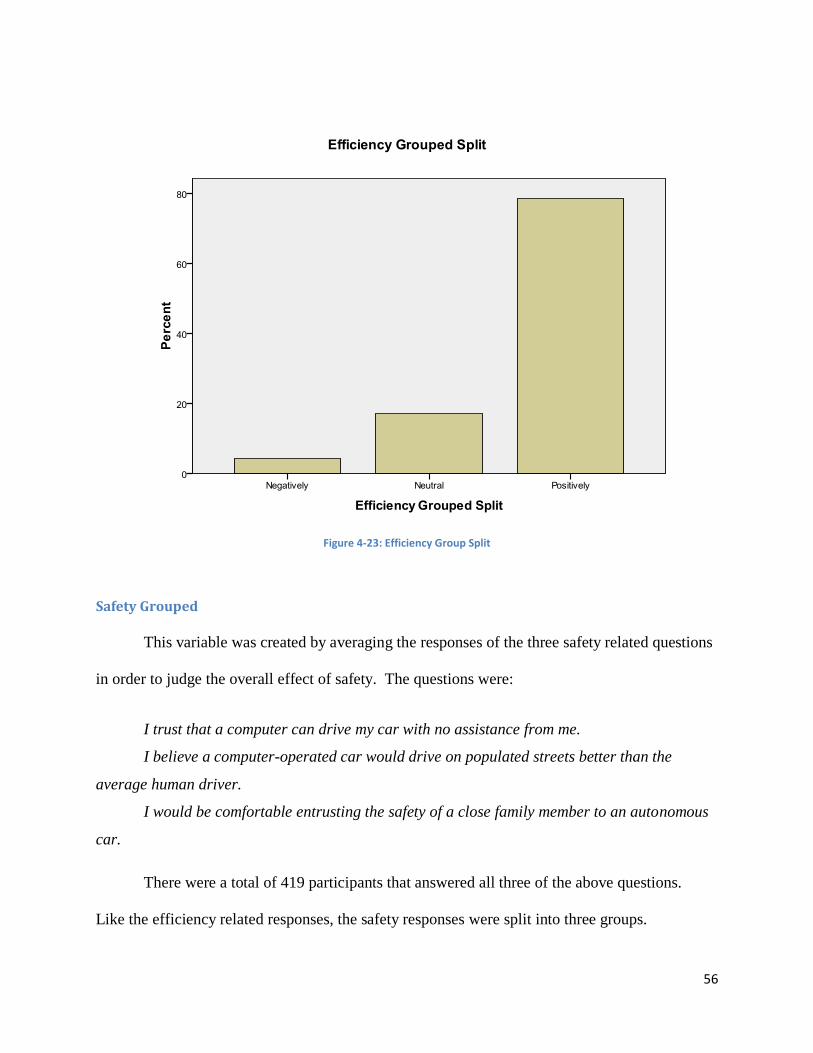
56
Figure 4-23: Efficiency Group Split
Safety Grouped
This variable was created by averaging the responses of the three safety related questions
in order to judge the overall effect of safety. The questions were:
I trust that a computer can drive my car with no assistance from me.
I believe a computer-operated car would drive on populated streets better than the
average human driver.
I would be comfortable entrusting the safety of a close family member to an autonomous
car.
There were a total of 419 participants that answered all three of the above questions.
Like the efficiency related responses, the safety responses were split into three groups.
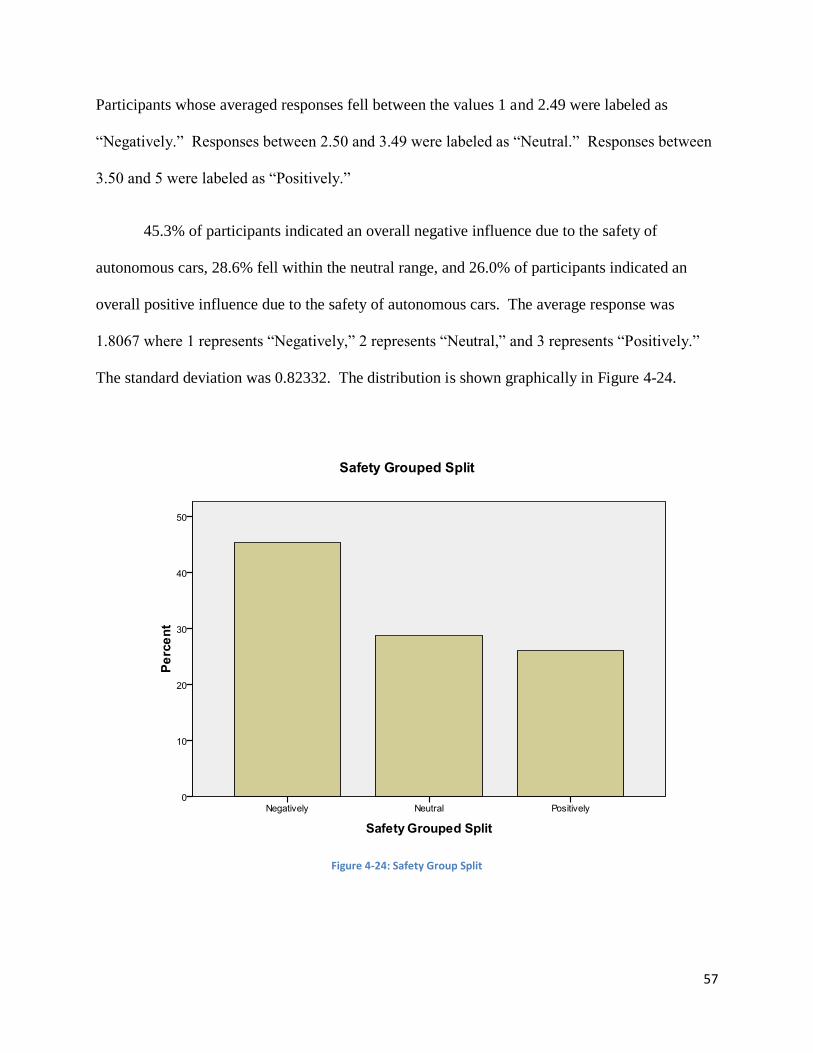
57
Participants whose averaged responses fell between the values 1 and 2.49 were labeled as
“Negatively.” Responses between 2.50 and 3.49 were labeled as “Neutral.” Responses between
3.50 and 5 were labeled as “Positively.”
45.3% of participants indicated an overall negative influence due to the safety of
autonomous cars, 28.6% fell within the neutral range, and 26.0% of participants indicated an
overall positive influence due to the safety of autonomous cars. The average response was
1.8067 where 1 represents “Negatively,” 2 represents “Neutral,” and 3 represents “Positively.”
The standard deviation was 0.82332. The distribution is shown graphically in Figure 4-24.
Figure 4-24: Safety Group Split

58
Productivity Grouped
This variable was created by averaging the responses of the two productivity related
questions in order to judge the overall effect of productivity. The questions were:
I would be more productive during an average week if my vehicle could drive itself to
places of interest while I stayed home.
If I had an autonomous vehicle then I could be more productive on other tasks while
traveling even though I would be required to remain in the driver’s seat.
There were a total of 414 participants that answered both of the above questions. Similar
to the other grouped responses, the productivity responses were split into three groups.
Participants whose averaged responses fell between the values 1 and 2.49 were labeled as
“Negatively.” Responses between 2.50 and 3.49 were labeled as “Neutral.” Responses between
3.50 and 5 were labeled as “Positively.”
28.0% of participants indicated an overall negative influence due to the productivity of
autonomous cars, 32.1% fell within the neutral range, and 39.9% of participants indicated an
overall positive influence due to the productivity of autonomous cars. The average response was
2.1184 where 1 represents “Negatively,” 2 represents “Neutral,” and 3 represents “Positively.”
The standard deviation was 0.81630. The distribution is shown graphically in Figure 4-25.

59
Figure 4-25: Productivity Group Split
Law Grouped
This variable was created by averaging the responses of two of the law related questions
in order to judge a greater portion of the overall effect of law than either set of responses would
judge on its own. The questions were:
By law, if a car’s autonomous system fails, the car is required to alert the driver and
either give the driver control or pull over and come to a stop. I am comfortable knowing that
this is required by law.
I would be comfortable sending my car out on an errand by itself knowing that I am
liable if it gets into an accident.

60
There were a total of 416 participants that answered both of the above questions. Similar
to the other grouped responses, the law responses were split into three groups. Participants
whose averaged responses fell between the values 1 and 2.49 were labeled as “Negatively.”
Responses between 2.50 and 3.49 were labeled as “Neutral.” Responses between 3.50 and 5
were labeled as “Positively.”
19.7% of participants indicated an overall negative influence due to the laws regarding
autonomous cars, 46.6% fell within the neutral range, and 33.7% of participants indicated an
overall positive influence due to the laws regarding autonomous cars. The average response was
2.1394 where 1 represents “Negatively,” 2 represents “Neutral,” and 3 represents “Positively.”
The standard deviation was 0.71795. The distribution is shown graphically in Figure 4-26.
Figure 4-26: Law Group Split

61
4.6 Conclusion
As was mentioned at the beginning of this chapter, a full description of the results can be
found in Appendix B. Now that the most relevant results have been reported we will provide an
analysis in the following chapter.
62
Chapter 5 : Analysis and Discussion
5.1 Introduction Now that our results are compiled, we need to find the answers to our original questions.
How does the public perceive each of these primary influences? Are the secondary influences of
productivity, efficiency, and environmental impact truly influential? How do people’s opinions
differ between different demographics? And finally, are autonomous cars desirable to the
public? The following section will describe the way we approached each of these questions,
their answers, whether or not they supported our hypothesis, their significance to the desirability
of autonomous cars, and any other significant information we found outside of our hypothesis.
5.2 Ranking
Our Approach
We asked our survey participants to rank safety, cost, and law from one to three where
one is the most influential, and three is the least influential. Once we compiled all of these
rankings, we averaged the responses to questions relating to a common influence together to get
an average ranking. For example, we average the responses to questions relating to the safety of
autonomous cars together to get a common “safety” variable. By this average, we were able to
determine how our survey participants ranked safety, cost, and law relative to each other.
The Results
As briefly covered in the previous chapter, the ranking of safety, cost, and law as
influences showed safety as the most influential, law as the second most influential, and cost as
the third. When we asked how survey participants how they ranked these influences the
following details emerged:

63
Influence % of participants
that ranked as most
influential
% of participants that
ranked as second most
influential
% of participants
that ranked as the
least influential
Average
ranking
Safety 82.41% 11.81% 5.78% 1.2337
Law 11.72% 63.28% 25% 2.1328
Cost 6.89% 25% 68.11% 2.6122
Table 5-1: Percentage Rankings of Safety, Law, and Cost
Our Hypothesis
Our hypothesis stated that safety would be ranked the highest, cost ranked second, and
law ranked third. As you can see from the above table, we correctly predicted the rank of safety
as the most influential. However, we incorrectly predicted the rank of cost and law.
Meaning
From the responses, we saw that law ranked more important than cost. This may mean
that the public finds the need for a reasonable and well-structured legal system more important
than an affordable price. The public may be able to afford the car, but will they purchase it if
there aren’t satisfactory rules and regulations surrounding the development, sale, and operation
of autonomous cars? The responses to our survey provide some evidence that they will not.
However, our hypothesis for safety is supported by our survey. Simply put, the safety of
autonomous cars is paramount. If the cars are not safe, they are significantly less desirable,
regardless of their benefits. The perceived safety, or rather the perceived lack of safety of
autonomous cars, is what will truly sway the opinions of potential buyers.
Given this, autonomous car manufacturers should emphasize the safety of autonomous
cars and prove to the public that operating an autonomous car is not a risky endeavor. These

64
manufacturers must also push to have thorough and reasonable laws for autonomous cars
developed. Only when the cars have been made safe and the laws surrounding them made
legally satisfactory will the people judge the cost of these cars to be affordable or not. Until
these concerns are met, the price of the vehicle is inconsequential to the purchase of the vehicle.
5.3 Primary Influences
Our Approach
One of our major interests for this study was to determine how the public perceived the
safety, cost, and laws of autonomous cars. Depending on how they rank when compared to each
other, their perception could have profound impacts on the desirability of autonomous cars. In
order to understand the public’s perception, we developed our survey around collecting
information about the participants’ comfort and attitude towards these influences. Once the
responses were obtained, we wanted to see if the questions we asked pertaining to the safety of
autonomous cars, the cost of the car, and law surrounding the cars were strong indicators of
desirability.
To do this, we first grouped responses together. By performing a factor analysis on the
responses to questions relating to each influence, we were able to determine the quality of these
groups. As mentioned in the previous chapter, questions related to safety could be grouped
together. The responses to two questions relating to law were also grouped together to provide a
more general view of the laws surrounding autonomous cars.
Once our variables were simplified as much as possible, we analyzed the distributions
and averages for each primary influence. By understanding the questions and groupings, we
were able to determine many key facts surrounding safety, cost, and laws of these cars.
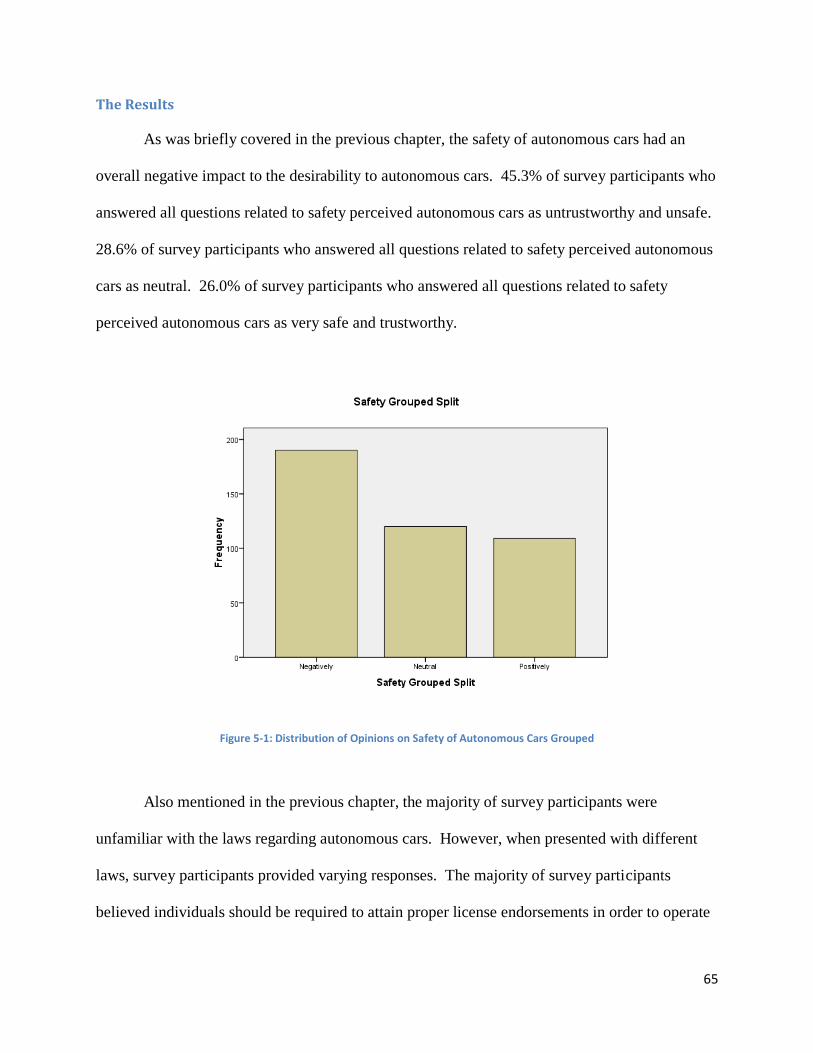
65
The Results
As was briefly covered in the previous chapter, the safety of autonomous cars had an
overall negative impact to the desirability to autonomous cars. 45.3% of survey participants who
answered all questions related to safety perceived autonomous cars as untrustworthy and unsafe.
28.6% of survey participants who answered all questions related to safety perceived autonomous
cars as neutral. 26.0% of survey participants who answered all questions related to safety
perceived autonomous cars as very safe and trustworthy.
Figure 5-1: Distribution of Opinions on Safety of Autonomous Cars Grouped
Also mentioned in the previous chapter, the majority of survey participants were
unfamiliar with the laws regarding autonomous cars. However, when presented with different
laws, survey participants provided varying responses. The majority of survey participants
believed individuals should be required to attain proper license endorsements in order to operate

66
an autonomous car. The majority of people were not comfortable with being liable for any
accident the car gets in if they weren’t driving it. The majority of people were comfortable
knowing that the car will alert the driver, pull over and stop if the autonomous system fails.
However, as a whole, the majority of survey participants were positively affected by the laws
regarding autonomous cars.
Figure 5-2: Distribution of Opinions on Laws of Autonomous Cars Grouped

67
Figure 5-3: Distribution of Opinions on Liability of Autonomous Cars
As for cost, people believed autonomous cars would cost significantly more than they
were willing to pay. Participants on average believed that an autonomous driving feature would
cost more than $5,000. However, survey participants were on average only willing to pay close
to $1,000 for such a feature

68
Figure 5-4: Distributions of how much participants expect an autonomous driving system to cost
Figure 5-5: Distributions of how much participants are willing to pay
69
Our Hypothesis
We hypothesized that public would not trust the safety of autonomous cars, that their
high price would be too expensive for many potential buyers, and that the laws regarding
autonomous cars, while still new, would be an overall positive influence to autonomous cars.
Our hypothesis was correct on all three accounts.
Meaning
As stated previously, our study shows that the safety of autonomous cars is the most
influential aspect about them. Because of this and the perceived lack of safety, the overall
negative influence safety has on autonomous cars may have a very damaging impact on the
desirability of autonomous cars. Manufacturers of this technology must greatly emphasize and
prove the safety of these cars. Otherwise, the market will not find the technology desirable. This
is what we predicted. On average, our participants did not trust a computer to drive them or trust
the computer to drive their close family members. On average, they believed that a computer
was incapable of driving better than a human driver.
While the laws regarding autonomous cars are the second most influential aspect of
desirability, very few people are familiar with them. However, the laws presented to the
participants of our survey did provide an overall positive influence on the desirability of
autonomous cars. Many found the liability issue to be troubling, but this was expected as well.
Car manufacturers of this technology should push to have these laws more defined, better-
known, and more customer-oriented in terms of liability. This should increase the desirability of
autonomous cars.
As expected, the cost of an autonomous car may be more than the public is willing to
spend. Our study shows that people are not willing to pay more than $5,000 for an autonomous

70
driving feature. Manufacturers should work to greatly reduce the cost of autonomous cars. If
they do not, the public may be reluctant and unable to buy this technology.
5.4 Secondary Influences
Our Approach
In order to determine the influences of productivity, efficiency, and environmental
impact, we asked survey participants questions relating these areas. As we did with safety, cost,
and law, we attempted to group the responses to these secondary influences into meaningful
groups to simplify our results. Responses to questions relating to efficiency were able to be
grouped together into a single efficiency variable. Similarly, responses to questions relating to
productivity were able to be grouped together. There was only one questions relating to
environmental impact, however.
We then analyzed the distributions and averages for each of these groups. From this, we
were able to determine the opinions of our survey participants towards these secondary
influences.
The Results
Efficiency and environmental impacts were both positive influences towards the
desirability of autonomous cars. Productivity had very little influence towards desirability as
responses were largely neutral.
More specifically, the responses to questions relating to productivity while operating an
autonomous car were fairly neutral. These questions pertained to the productivity of the driver
when in the car as a passenger as well as outside the car during its operation. The average

71
response was 2.9795, very close to the neutral value of 3. In effect, productivity was not
influential to their decision to buy an autonomous car.
Figure 5-6: Distributions of opinions on productivity while using an autonomous car
When asked questions about the efficiency of the vehicle, as defined by fuel efficiency
and time to destination, our sample group were overwhelmingly positive about its influence. The
average response to these questions was 3.8834, strongly favoring a positive influence. In other
words, if the autonomous car were more fuel efficient and could get the passengers to their
destination faster, the majority of survey participants claimed this would improve their likelihood
of purchasing one.
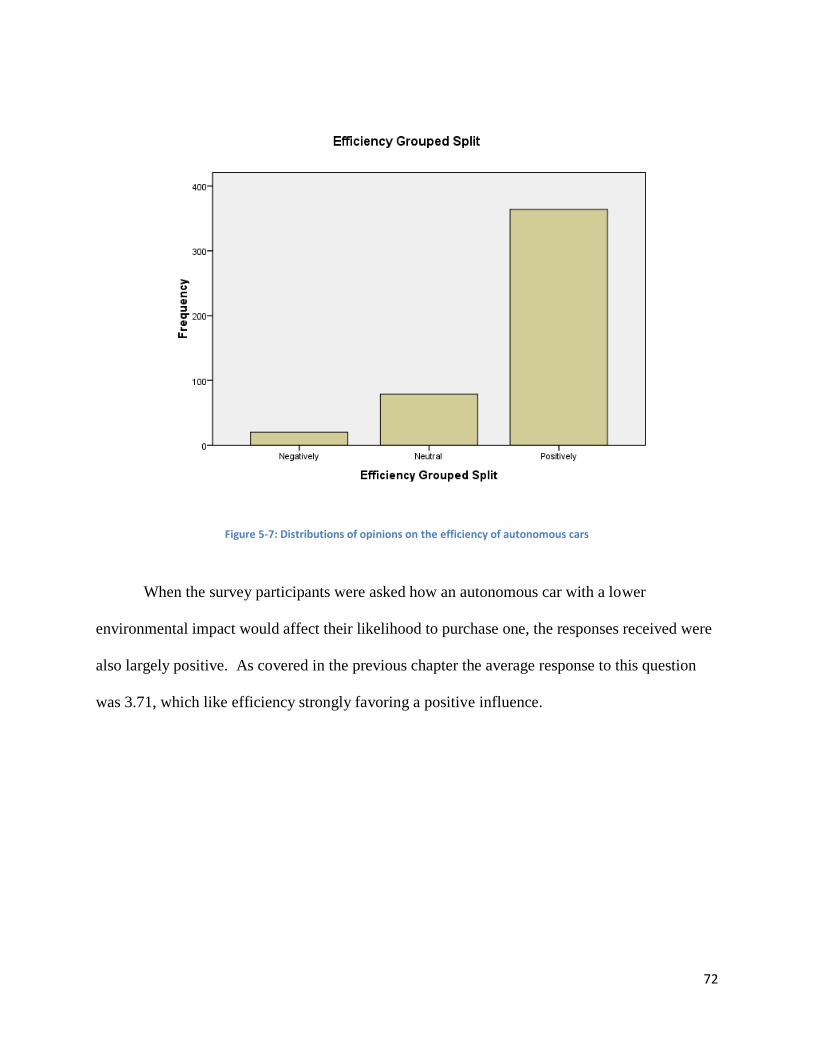
72
Figure 5-7: Distributions of opinions on the efficiency of autonomous cars
When the survey participants were asked how an autonomous car with a lower
environmental impact would affect their likelihood to purchase one, the responses received were
also largely positive. As covered in the previous chapter the average response to this question
was 3.71, which like efficiency strongly favoring a positive influence.

73
Figure 5-8: Distribution of opinions on the environmental impact of autonomous cars
Hypothesis
We hypothesized that productivity and efficiency would have the greatest influence
towards the desirability of autonomous cars. We believed that the environmental impact would
have the least influence to desirability. Our hypothesis correctly identified the positive influence
of efficiency on desirability. However, we did not accurately predict the minor influence of
productivity. We believed people would find the ability to perform other tasks while in the car
very useful and beneficial. This was not the case with our sample group, who saw the time spent
free of driving as less useful than we predicted. In contrast, we saw a much greater response for
an environmentally friendly autonomous car than we originally believed.

74
Meaning
As is the growing trend with many cars these days, environmentally friendly and fuel
efficient autonomous cars are more desirable than one that is not. This may mean that the newer
generations of drivers are more environmentally conscious than in the past and autonomous cars
are likely to conform to this ideal. However, the one aspect that separates an autonomous car
from a manually-driven car is its autonomous nature. Because our survey participants believed
this time spent not driving to not be useful, it had a significantly lower impact on desirability. If
autonomous car manufacturers wish to improve sales, they may want to prove that the time away
from the wheel can be more beneficial than most people believe. As there was only a single
question on environmental impact on our survey, our data also calls for a better investigation into
the influence an environmentally friendly autonomous car might have.
5.5 Demographics
There were several key demographics that had significant changes in our study. These
demographics included age, education, gender, and income. Within each of these groups, people
of the same demographic tended to answer in similar ways.
Age
Age was a significant factor in how people judged safety and cost overall. When we
compared survey participants’ ages with their responses to the overall safety question, younger
participants tended to rank safety as a less positive aspect of autonomous cars than older
participants. Younger participants also seemed to see cost less positively than older participants.
The youngest survey participants, individuals under the age of 20, reported on average
that, overall, they rated the safety of autonomous cars as 3.55 out of 5, where 3 is neutral and 5 is

75
very positively. Individuals between the ages of 21 and 25 ranked safety a 3.84 out 5, and
individuals over the age of 26 ranked safety a 4.04 out of 5. In the following graphs, the
“estimated marginal means” represent the response of those in the specified demographics.
Figure 5-9: Relationship between age and the influence of safety on autonomous cars
These younger individuals said cost was 2.92 out 5 where 3 is neutral and 5 is very
positively. Participants between the ages of 21 – 25 gave cost 2.79 out 5, slightly lower than the
youngest participants. However, the older survey takers ranked cost 3.48 out of 5.
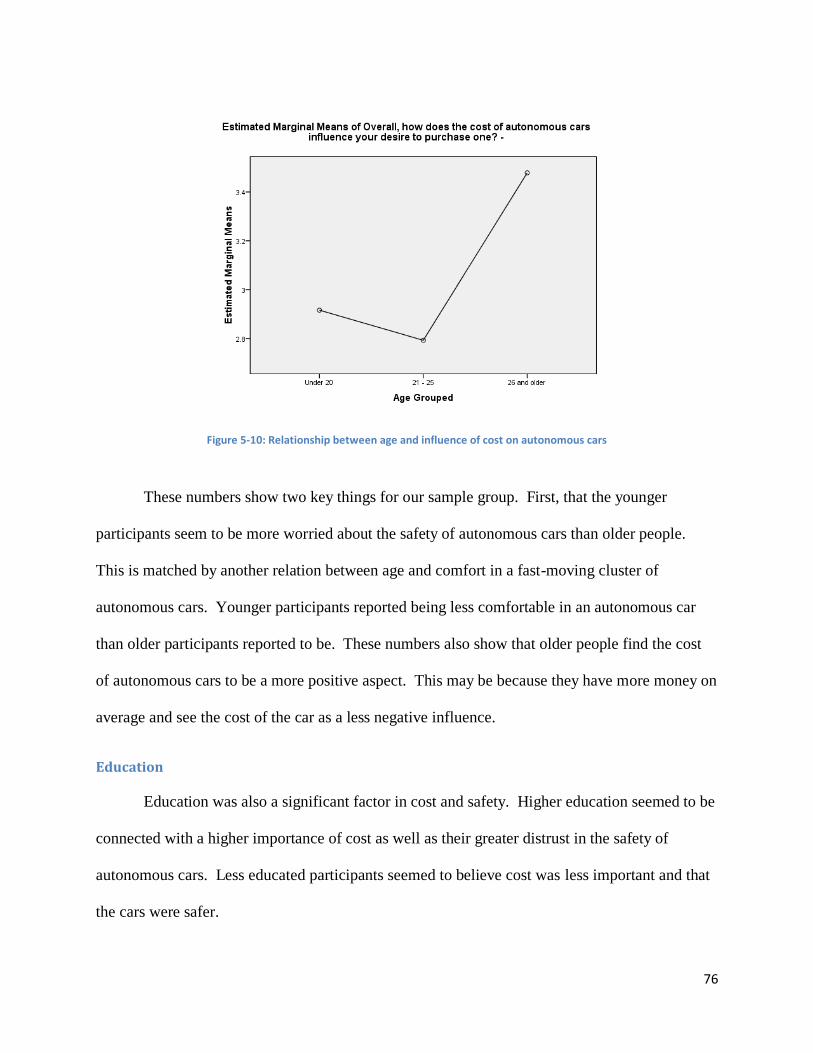
76
Figure 5-10: Relationship between age and influence of cost on autonomous cars
These numbers show two key things for our sample group. First, that the younger
participants seem to be more worried about the safety of autonomous cars than older people.
This is matched by another relation between age and comfort in a fast-moving cluster of
autonomous cars. Younger participants reported being less comfortable in an autonomous car
than older participants reported to be. These numbers also show that older people find the cost
of autonomous cars to be a more positive aspect. This may be because they have more money on
average and see the cost of the car as a less negative influence.
Education
Education was also a significant factor in cost and safety. Higher education seemed to be
connected with a higher importance of cost as well as their greater distrust in the safety of
autonomous cars. Less educated participants seemed to believe cost was less important and that
the cars were safer.

77
Responses showed that the more educated the person was, the more likely they were to
rank cost as important (where 1 is the most important and 3 is the least important). Responses
from participants who have completed high school or their associate’s degree tended to rank cost
closer to 3. This means that less educated individuals ranked cost of autonomous cars to be less
important than the safety of the vehicle and the laws surrounding their sale and operation. More
educated individuals tended to rank cost closer to 2.5. This means that more educated people
thought the cost of autonomous cars were more important than less educated people. Strangely,
participants who have only completed middle school ranked cost similarly to those who a
bachelor’s degree or higher.
Figure 5-11: Relationship between highest education level and the rank of cost
This difference may be because more educated people are more conscious of their
money. More educated people did show a greater likelihood for a higher income in our study.

78
Because they had more money and were possibly more educated buyers, perhaps they were more
aware of where their money would be going, thus they gave cost a higher rank.
For safety, those people who were more educated seemed more doubtful of the safety of
autonomous cars. For example, participants who either had their high school diploma, their
associates degree, or bachelor’s degree believed in the safety of autonomous cars more (giving it
a score of 1.9 out of 3) than people with a master’s degree, doctoral degree, or professional
degree (who gave it a score of less than 1.7 out of 3).
Figure 5-12: Relationship between highest education level and the rank of safety
More educated participants may be less trusting of autonomous cars because they
understand more of the potential risks than less educated participants are. Perhaps education has
made them more skeptical of newer technologies because they have not been proven yet.

79
Gender
Gender seemed the most divisive trait amongst our participants, showing significant
connections to the cost, number of concerns, productivity, and safety of autonomous cars. Men
on average reported, in contrast to women, that:
- Cost was more important
- There are fewer concerns with autonomous car technology
- They would be more productive in an autonomous car
- Autonomous cars are safer
- Safety is a more positive trait for autonomous cars
- They were more likely to buy the car earlier
Figure 5-13: Relationship between gender and the rank of cost when compared to safety and law

80
Figure 5-14: Relationship between gender and the participant's number of concerns
Figure 5-15: Relationship between gender and productivity while using an autonomous car

81
Figure 5-16: Relationship between gender and opinions of the safety of autonomous car
Figure 5-17: Relationship between gender and influence of safety on autonomous cars
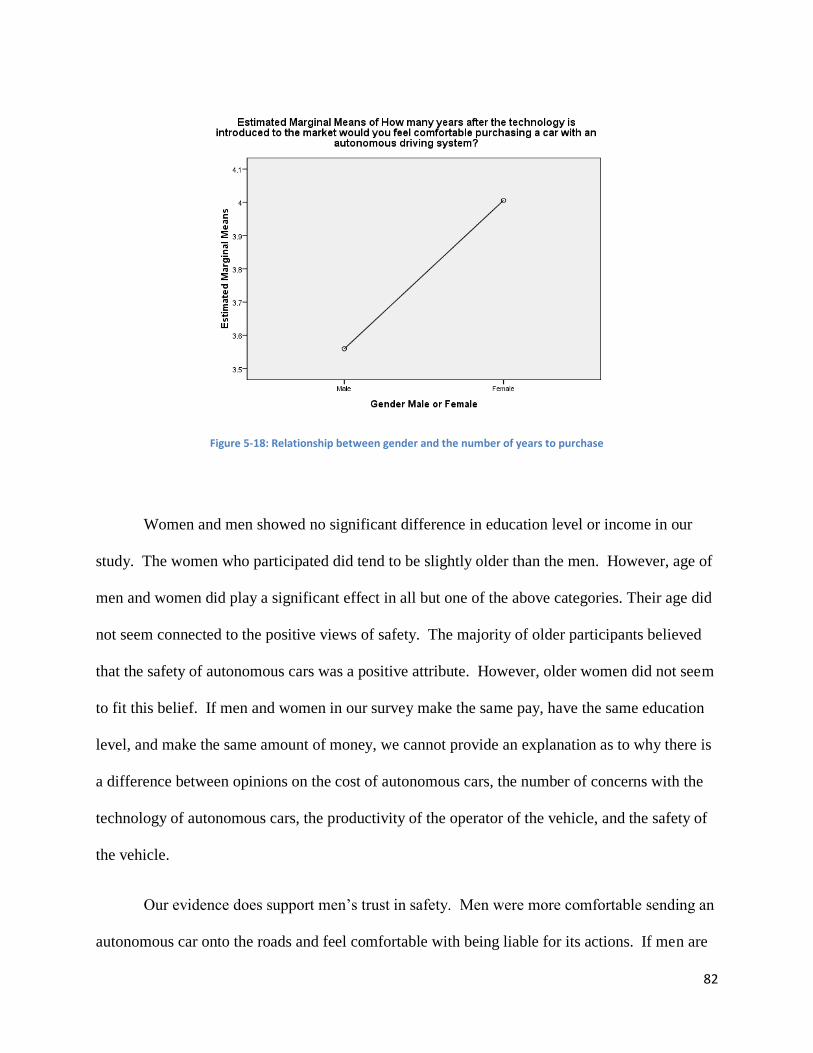
82
Figure 5-18: Relationship between gender and the number of years to purchase
Women and men showed no significant difference in education level or income in our
study. The women who participated did tend to be slightly older than the men. However, age of
men and women did play a significant effect in all but one of the above categories. Their age did
not seem connected to the positive views of safety. The majority of older participants believed
that the safety of autonomous cars was a positive attribute. However, older women did not seem
to fit this belief. If men and women in our survey make the same pay, have the same education
level, and make the same amount of money, we cannot provide an explanation as to why there is
a difference between opinions on the cost of autonomous cars, the number of concerns with the
technology of autonomous cars, the productivity of the operator of the vehicle, and the safety of
the vehicle.
Our evidence does support men’s trust in safety. Men were more comfortable sending an
autonomous car onto the roads and feel comfortable with being liable for its actions. If men are

83
more comfortable being liable, it supports the belief that they believe autonomous cars are safer.
Men in our study reported enjoying driving more than women reported. This may connect with
how likely they are to buy the car sooner. Men may be more enthusiastic car owners, which may
make them more interested in new car technologies.
Income
Income seemed to be connected to the opinions on cost and law. Participants with higher
incomes reported that laws were less important than participants of lower incomes. Participants
with higher incomes also reported that cost was a greater positive aspect for autonomous cars.
Participants of a lower income were more likely to say that the laws were important to
them. This may be because they have less money to spend in the event of an accident. While
income apparently had no effect on perceived safety or trust in autonomous cars, perhaps people
with lower income were conscious of insurance payments or costs of repairs. A proper legal
structure would protect them more in the event of an accident that isn’t their fault. However, this
is unsupported by data in our study, which suggests that there is no significant connection
between income and liability concern.

84
Figure 5-19: Relationship between personal yearly income and the rank of law
Participants of a lower income are more likely to look at cost negatively when compared
with participants of a higher income. This may be because people with less money see the price
of autonomous cars as being less agreeable. The expected price, while the same for individuals
of a higher pay grade, may just be too much for our less wealthy participants to bear happily.
Though, both poor and rich participants claimed that they would pay the same amount on
average.

85
Figure 5-20: Relationship between personal yearly income and the influence of cost
5.6 Conclusion
The question still remains: are autonomous cars desirable? If our original assumptions
are as correct as our survey data has lead us to believe, autonomous cars are not entirely
desirable. The perceived lack of safety, high cost, and perceived uselessness of an autonomous
driving system are all strong deterrents for any potential customer. While still acceptable to the
public at the moment, the laws in place are a work in progress, leading many to be unsure of
their influence. The greater efficiency of the vehicle and roadways, and the reduced
environmental impact, are all very positive traits for autonomous cars. However, because of the
deficiencies in what we saw as two of the most important influences, the safety and cost of the
vehicle, we do not believe autonomous cars are desirable at the moment. However, their
perceived benefits do hint that the technology may rapidly become accepted in the near future. If
autonomous car manufacturers want to improve the desirability of this product, our data suggests

86
proving the safety of these autonomous vehicles as well as reducing the price. Once these have
become accepted by the public, advertising the benefits of a computerized chauffeur could
increase the desirability further.
87
Chapter 6 : Conclusion
6.1 Overview
To begin our study we looked at how the public perceived autonomous cars. Through
background research we obtained three primary key influences – safety, law, and cost – and three
secondary key influences – productivity, efficiency, and environmental impact. In order to study
the effects of these six influences we developed a survey and distributed it to the students and
faculty at Worcester Polytechnic Institute, as well as the students at Foxborough Regional
Charter School. The survey showed that the three secondary influences were all positive, but the
three primary influences were all negative.
A future with autonomous cars could be right around the corner, but that all depends on
whether or not the potential customers will see the cars as safe and be satisfied with the relevant
laws and with the cost of the cars. The secondary concerns – productivity, efficiency, and
environmental impact – all showed a positive influence on people’s desire to purchase an
autonomous car. This means they could all be big selling points when the technology is ready to
be sold, but unless a high enough standard of safety, law, and cost are met then it won’t matter
how attractive the autonomous cars are.
That being said, a world of autonomous cars does look inevitable. Documented tests of
the cars’ driving abilities show that the cars are safe, regardless of what perception the public
has. And as time goes on and the technology progresses they will only become safer. While
laws regarding the development and use of autonomous cars are still being developed, the fact
that some states are already adopting the laws demonstrates how strongly they believe that these
cars will soon be on the streets. Once the cars enter the manufacturing stage then they will only
get cheaper as time goes on. Each of those primary concerns for consumers is also a primary
88
concern for developers and they’re all actively being addressed. It will take time, of course, but
eventually autonomous cars will become economically viable for developers to manufacture and
sell.
If autonomous cars become adopted, we could see their influence permeate across
society. With the reaction time and networked communications of computerized systems
accidents might become a thing of the past, or, at the very least, be significantly reduced. The
autonomous cars could use less fuel and require less infrastructure due to their ability to operate
safely in tightly packed groups. Commutes could take less time and errands could be done
without having to leave the home. With less time spent travelling, people might be able to enjoy
more leisure time. The adoption of autonomous cars could change society as we know it, so long
as people are willing to accept it.
6.2 What We Learned
This project granted us a number of useful skills. The most useful skill that we learned
was time management. Without a pre-planned schedule we as a team were forced to create our
own goals and deadlines and stick to them. After three terms of creating our own schedule we
can confidently depend on ourselves to get things done in a timely fashion. But before we could
schedule the work, we needed to determine what tasks needed to be done, in what order they
needed to be done, and how long the task would take. The ability to evaluate a task like this was
arguably the most useful skill that we developed, although it was a skill we had all previously
acquired through previous project work.
The most obvious skill we learned was how to create a survey. Since creating a survey
was core to the study we needed to ensure that it was understandable and would result in useful
data. Had we not spent the time to create a proper survey the data we obtained ran the risk of not
89
providing us with the answers we were looking for. Along with the skill of creating a survey we
learned how to analyze our data through statistical analysis. Although the ability to statistically
analyze data is a skill that can learned in a formal class, statistically analyzing data we had
obtained ourselves gave us real world experience.
Since the major requirement of the IQP was to summarize the project in a large report we
learned how to write, format, and organize a large paper.
Of course, we also learned soft skills, like working in a team – working to people’s skills
and habits, the ability to compromise, and the ability to communicate. Since we were one of the
groups that presented their project to the Robotics Engineering department on project
presentation day we also furthered our experience presenting in front of an audience. These are
skills that will be useful in any project or job that we will work on later in life.
There were other valuable skills that we picked up as well, but we felt that the above
skills were the most significant. They are the skills that will be the most useful later in the
professional world.
6.3 Future Work
Our survey results showed us people’s perception of autonomous cars. We found that
there was a lack of trust even though our background research showed that the cars were safe.
Further projects might study what exactly causes this mistrust, as well as how to gain the trust of
potential autonomous car customers. Likewise, we also found that the laws regarding
autonomous cars are already well developed in some states and being developed in others.
Future projects might also study what course the laws regarding autonomous cars could take in
order to satisfy public desires.
90
Another interesting project might be to delve deeper into the topics we considered
secondary – productivity, efficiency, and environmental impact. Our analysis showed that all
three of these topics positively influenced people’s desire to purchase an autonomous car. As
was mentioned in the methodology chapter, these topics were fairly speculative. However, as
time passes and autonomous car technology is further developed then our secondary implications
may become more defined. Gaining an understanding of productivity, efficiency, and
environmental impact when they’re more well-defined could be crucial in pinpointing the selling
points of autonomous cars.

91
Acknowledgements
Throughout our project Professor Jeanine Skorinko met with us in order to teach us how
to collect and analyze data. She offered us references, gave us examples, and provided general
guidance. We would like to extend a special thank you to Professor Skorinko for all of her help.
Of course, we would also like to thank our advisor, Professor David Brown. He kept the
team on track and made sure we produced quality work. Without his help we would not have
been able to complete this project. So to Professor Brown, thank you.

92
Bibliography
“Bill AB511 Nevada Legislature”. Nevada Legislature. Retrieved 25 June 2011.
Blanco. “Report: Number of Cars in the U.S. Dropped by Four Million in 2009 - Is America’s
Love Affair Ending?” Autoblog.com. N.p., 14 Jan. 2010. Web. 3 Dec. 2012. <http://
green.autoblog.com/2010/01/04/report-number-of-cars-in-the-u-s-dropped-by-four-
million-in-20/>.
Census, “The 2012 Statistical Abstract.” Motor Vehicle Accidents and Fatalities. Web.
19 Nov. 2012. <http://www.census.gov/compendia/statab/cats/transportation/
motor_vehicle_accidents_and_fatalities.html>.
Coldewey. “Robot Cars Could Increase Highway Efficiency 273 Percent: Study.”FutureTech.
N.p., n.d. Web. 26 Nov. 2012.<http://www.nbcnews.com/technology/futureoftech/robot-
cars-could-increase-highway-efficiency-273-percent-study-978760>.
Connor. “Automobile Sensors May Usher in Self-driving Cars.” Ed. Margery Connor. N.p.,
26 May 2011. Web. 19 Nov. 2012. <http://www.edn.com/design/automotive/4368069/
Automobile-sensors-may-usher-in-self-driving-cars>.
EPA. “Heat Island Effect | U.S. EPA.” EPA. Environmental Protection Agency, n.d. Web. 10 Dec. 2012.
FHA. Federal Highway Administration. Department of Transportation. Average Annual
Miles per Driver by Age Group. N.p., 4 Apr. 2011. Web. 3 Dec. 2012. <http://
www.fhwa.dot.gov/ohim/onh00/bar8.htm>.
Fitchard. “Ford is ready for the Autonomous Car. Are you?.” GIGAOM. N.p., 09 2012. Web. 9 Dec 2012.
<http://gigaom.com/mobile/ford-is-ready-for-the-autonomous-car-are-drivers/>.
J.D. Power and Associates “2012 U.S. Automotive Emerging Technologies Study.” The McGraw-Hill
Companies, 25 2012. Web. 4 Dec 2012. <http://autos.jdpower.com/content/press-
release/gGOwCnW/2012-u-s-automotive-emerging-technologies-study.htm>.
Kelly. “Self-driving Cars Now Legal in California - CNN.com.” CNN. Cable News Network, 30 Oct.
2012. Web. 19 Nov. 2012. <http://www.cnn.com/2012/09/25/tech/innovation/self-driving-car-
california/index.html>.
Klayman, Ben. “Self-Driving Cars Coming Our Way, But Don’t Throw Out Your License Just
Yet.”Huffington Post. N.p., 15 2012. Web. 9 Dec 2012.
<http://www.huffingtonpost.com/2012/08/15/self-driving-cars_n_1777714.html>.
Lawton. “Could Hackers Take Your Car for a Ride?” IEEE Computer Society. N.p., n.d. Web. 25 Nov.
2012. <http://www.computer.org/portal/web/computingnow/news/could-hackers-take-your-car-
for-a-ride>.
Markoff. “Google Lobbies Nevada To Allow Driverless Cars.” The New York Times. The New York
Times, 11 May 2011. Web. 11 Dec. 2012

93
Max, Josh. “Traffic Jams Waste 1.9 Billion Gallons of Gas per Year.” New York Daily News. N.p., 27
Mar. 2012. Web. 26 Nov. 2012. <http://articles.nydailynews.com/2012-03-
27/news/31246168_1_new-report-federal-highway-roads>.
Newcomb. “You Won't Need a Driver's License by 2040 - CNN.com.” CNN. Cable News Network, 18
Sept. 2012. Web. 19 Nov. 2012. <http://www.cnn.com/2012/09/18/tech/innovation/ieee-2040-
cars/index.html>.
Newcomb. “Learning to Let the Car Drive.” Wired Magazine. N.p., 17 2012. Web. 4 Dec 2012.
<http://www.wired.com/autopia/2012/06/learning-to-let-the-car-drive/>.
Nickel, “Average Price of a New Car.” Five Cent Nickel(2012): n.pag. Web. 4 Dec 2012.
<http://www.fivecentnickel.com/2012/05/07/average-price-of-a-new-car/?WT.qs_osrc=FBS-
112003310>.
“NRS: CHAPTER 482A - AUTONOMOUS VEHICLES.” Nevada Legislature. N.p., 1 Mar. 2012. Web.
11 Dec. 2012. <http://www.leg.state.nv.us/NRS/NRS-482A.html>.
Olarte. “Human Error Accounts for 90% of Road Accidents.” Driver Risk Management Solutions. Web.
19 Nov. 2012. <http://www.alertdriving.com/home/fleet-alert-magazine/international/human-
error-accounts-90-road-accidents>.
Priddle and Woodyard. “Google discloses costs of its driverless car tests.” USA Today(2012): n.pag.
Web. 4 Dec 2012. <http://content.usatoday.com/communities/driveon/post/2012/06/google-
discloses-costs-of-its-driverless-car-tests/1
Robinson. “Google is My Co-Pilot. What Can go Wrong?.” Car and Driver. Hearst Magazines, n.d. Web.
4 Dec 2012. <http://www.caranddriver.com/columns/aaron-robinson-autonomous-cars-are-upon-
us-thanks-to-google-what-can-go-wrong>.
“Senate Bill No. 1298.” California Legislative Information. N.p. 2012. Web. 11 Dec. 2012.
<http://leginfo.legislature.ca.gov/faces/billNavClient.xhtml?bill_id=201120120SB1298>.
United State of America. National Highway Traffic Safety Administration. Statistical Analysis of the
Effectiveness of Electronic Stability Control (ESC) Systems – Final Report. N.p., July 2007.
Web. 19 Nov. 2012. <http://www-nrd.nhtsa.dot.gov/Pubs/810794.pdf>.
United States of America. National Highway Traffic Safety Administration. Vehicle Safety
Communications – Applications (VSC-A) Second Annual Report. By F. Ahmed-Zaid et al. N.p.,
Aug. 2011. Web. 25 Nov. 2012.
<www.nhtsa.gov/DOT/NHTSA/NVS/Crash%20Avoidance/Technical%20Publications/2011/811
466.pdf >.

94
Appendix A: Survey
Autonomous Car Survey
Directions: Please answer the following questions as honestly as possible. Your responses will be
anonymous. This means that your responses cannot be linked with your name.
Autonomous Car: An autonomous car is a car that uses sensors and artificial intelligence to perform all
of the tasks that driving requires without the need for a human driver.
Background: A well-established car manufacturer is considering developing a new technology that
would enable drivers to flip a switch, which would allow the car’s computer to take control of all driving
operations including breaking, acceleration, and steering. This survey aims to gauge consumers’ interest
and reactions to this new technology.
Questions:
Please circle one response for each question unless the question specifies otherwise.
1) What is your primary mode of transportation?
Personal automobile Public transportation Walking/ Biking Other
2) How many hours do you estimate you spend driving each week?
0 hrs 1 – 5 hrs 6 – 10 hrs 11 – 15 hrs 16 – 20 hrs More than 20 hrs
3) How much did you pay for your last car?
Below $10,000 $10,000 – $29,999 $30,000 – $49,999 $50,000 – $69,999 Above $70,000
NA
4) How enjoyable do you find driving?
1 2 3 4 5
Not Enjoyable Very Enjoyable
5) Does your car have any of the following semi-autonomous features? Circle all that apply.
a) Anti-lock brakes
b) Electronic stability control
c) Adaptive cruise control
d) Obstacle detection
e) Traction control
f) Lane departure warning

95
g) Automatic braking
h) Automatic parking
i) Other
g) None of the above
6) How much would you expect a fully automated driving system for your car to cost beyond its original
price?
Below $1,000 $1,000 – 4,999 $5,000 – 9,999 $10,000 – 14,999 Above
$15,000
7) How much money would you be willing to spend to have an autonomous driving system installed in
your next car?
Below $1,000 $1,000 – 4,999 $5,000 – 9,999 $10,000 – 14,999 Above
$15,000
8) How many years after the technology is introduced to the market would you feel comfortable
purchasing a car with an autonomous driving system?
Immediately Within a year 1 – 2 years 3 – 4 years More than 4 years
9) Do you share any of the following concerns regarding autonomously driven cars? Choose all that
apply:
a) Poor awareness of its surrounding
b) Poor programming
c) Poor control (steering, braking, acceleration)
d) Prone to malfunction
e) Prone to software hacking
f) Other
g) None of the above
10) How much more or less likely would you be to purchase an autonomous car if it were required by law
to allow the driver to manually take control of the car at any time?
1 2 3 4 5
Much Less Likely Much More Likely

96
11) How much more or less likely would you be to purchase an autonomous car if it were to emit a lower
amount of environmentally harmful exhaust than manually operated cars?
1 2 3 4 5
Much Less Likely Much More Likely
12) How much more or less likely would you be to purchase an autonomous car if it had better fuel
efficiency than a similar, but manually operated car?
1 2 3 4 5
Much Less Likely Much More Likely
13) How much more or less likely would you be to purchase an autonomous car if it could get you to your
destination faster?
1 2 3 4 5
Much Less Likely Much More Likely
14) Are you aware that Nevada, California, and Florida already have laws regarding the testing,
operation, and sale of autonomous vehicles within the respective states?
Yes No
Please indicate your level of agreement with the following statements.
15) I trust that a computer can drive my car with no assistance from me.
1 2 3 4 5
Strongly Disagree Strongly Agree
16) I believe a computer-operated car would drive on populated streets better than the average human
driver.
1 2 3 4 5
Strongly Disagree Strongly Agree
17) I would be comfortable entrusting the safety of a close family member to an autonomous car.
1 2 3 4 5
Strongly Disagree Strongly Agree
18) I would be comfortable allowing my car to transmit encrypted data, such as its current location and
velocity, to surrounding cars in order to better coordinate its path with those cars and keep me safe.
1 2 3 4 5
Strongly Disagree Strongly Agree

97
19) I am familiar with the current laws regarding the testing, operation, and sale of autonomous cars.
1 2 3 4 5
Strongly Disagree Strongly Agree
20) By law, if a car’s autonomous system fails, the car is required to alert the driver and either give the
driver control or pull over and come to a stop. I am comfortable knowing that this is required by law.
1 2 3 4 5
Strongly Disagree Strongly Agree
21) I would be comfortable sending my car out on an errand by itself knowing that I am liable if it gets
into an accident.
1 2 3 4 5
Strongly Disagree Strongly Agree
22) I believe that an individual should be required to attain a proper license endorsement, through the
Department of Motor Vehicles, in order to legally operate an autonomous car.
1 2 3 4 5
Strongly Disagree Strongly Agree
23) I would be more comfortable traveling in a tight cluster of fast moving autonomous cars if the
autonomous cars could constantly communicate and coordinate their positions with other cars around
them.
1 2 3 4 5
Strongly Disagree Strongly Agree
24) I would be more productive during an average week if my vehicle could drive itself to places of
interest while I stayed home.
1 2 3 4 5
Strongly Disagree Strongly Agree
25) If I had an autonomous vehicle then I could be more productive on other tasks while traveling even
though I would be required to remain in the driver’s seat
1 2 3 4 5
Strongly Disagree Strongly Agree

98
Please provide the following demographic information.
26) Please specify your gender.
Male Female Other Prefer Not to Disclose
27) What is your age?
Below 16 16-20 21-25 26-30 31-40 41-50 51-60 61 or over
28) What is your personal yearly income?
NA Below $60,000 $60,000 - $99,999 $100,000 - $149,999 $150,000 or higher
29) Do you now have, or have you ever had, a disability that prevented you from manually operating a
vehicle?
Yes No
30) How many car accidents have you been involved in within the last five years?
Zero One Two Three More than three
31) With what ethnicity do you most closely relate yourself?
a) American Indian/Native American
b) Asian
c) Black/African American
d) Hispanic/Latino
e) White/Caucasian
f) Pacific Islander
g) Other
32) What is your current level of employment?
a) Employed full time
b) Employed part time
c) Self employed
d) Unemployed/ Looking for work
e) Homemaker
f) Student
g) Retired

99
33) What is the highest level of education you have completed?
a) Less Than Middle School/No Education
b) Middle School
c) High School/GED
d) Associate’s Degree
e) Bachelor’s Degree
f) Master’s Degree
g) Doctoral Degree
h) Professional Degree
34) Of the following, which are more important to you? Rank them in order from 1 (most important) to 3
(least important).
____ Well-developed laws for the development, sale, and use of autonomous cars
____ Affordable cost for an autonomous car
____ Personal safety and the safety of those around you while operating an autonomous car
35) Overall, how does the safety of autonomous cars influence your desire to purchase one?
1 2 3 4 5
Very negatively Very Positively
36) Overall, how does the cost of autonomous cars influence your desire to purchase one?
1 2 3 4 5
Very negatively Very Positively
37) Overall, how do the laws concerning autonomous cars influence your desire to purchase one?
1 2 3 4 5
Very negatively Very Positively
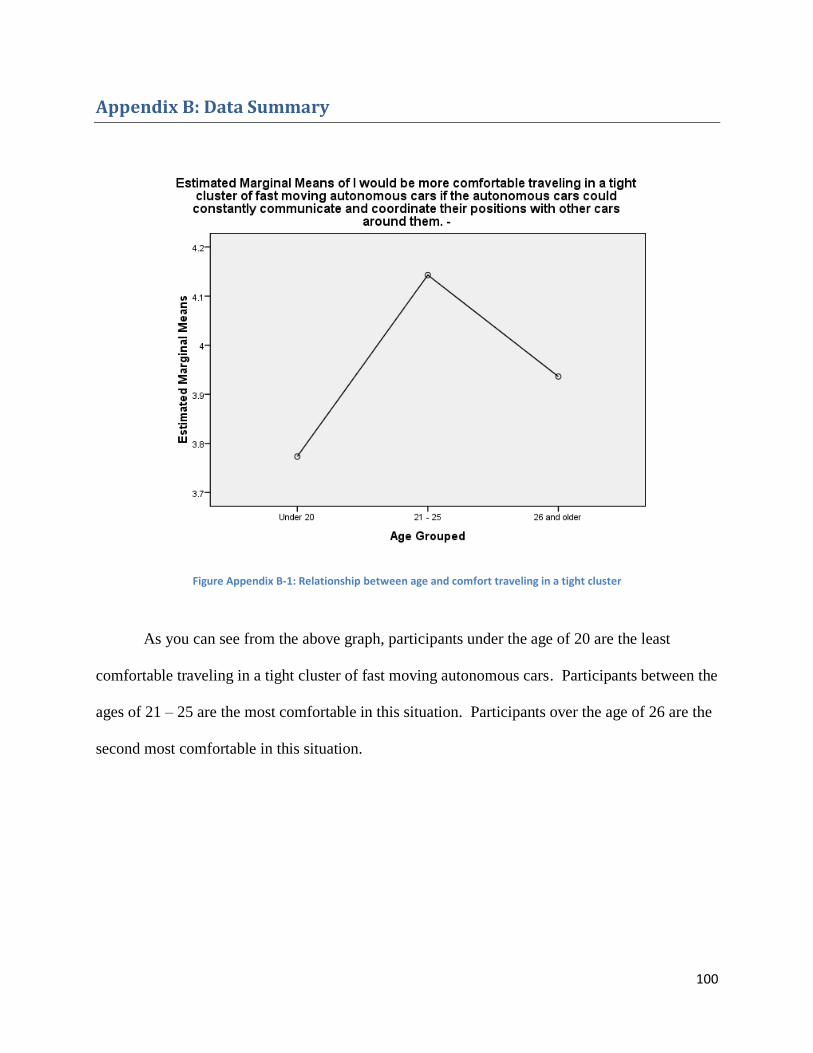
100
Appendix B: Data Summary
Figure Appendix B-1: Relationship between age and comfort traveling in a tight cluster
As you can see from the above graph, participants under the age of 20 are the least
comfortable traveling in a tight cluster of fast moving autonomous cars. Participants between the
ages of 21 – 25 are the most comfortable in this situation. Participants over the age of 26 are the
second most comfortable in this situation.

101
Figure Appendix B-2: Relationship between highest level of education and influence of cost
As you can see from the above graph, participants with associate’s degrees see the cost of
autonomous cars more negatively than anyone else. Participants with master’s degrees see the
cost of autonomous more positively than anyone else.

102
Figure Appendix B-3: Relationship between efficiency opinions and the time it takes to purchase
As you can see from the above graph, participants who valued efficiency more positively
also claimed that they would buy autonomous cars sooner. Participants who valued efficiency
more negatively claimed they would wait longer to purchase an autonomous car.

103
Figure Appendix B-4: Relationship between the number of concerns and influence of safety
As you can see from the above graph, people who had between one and two concerns
with the technology of autonomous cars were more positively influenced with the safety of
autonomous cars. Participants who had 3 or more concerns with autonomous cars were more
negatively influenced by the safety of autonomous cars.

104
Figure Appendix B-5: Relationship between safety and comfort traveling in a tight cluster
As you can see from the above graph, participants who rated the safety of autonomous
cars more positively were also more comfortable with traveling in a tight cluster of fast moving
cars. Participants who believed autonomous cars were unsafe were less comfortable in this
situation.

105
Figure Appendix B-6: Relationship between gender and liability concerns
As you can see from the above graph, male participants were far more comfortable
sending autonomous cars out on their own knowing that they are liable if it gets into an accident.
Female participants were far less comfortable with this law.

106
Figure Appendix B-7: Relationship between opinions on the safety and number of years to purchase
As you can see from the above graph, participants who trusted the safety of autonomous
cars more positively also claimed they would purchase an autonomous car sooner. Participants
who believed autonomous cars to be unsafe were more likely to wait longer to purchase an
autonomous car.
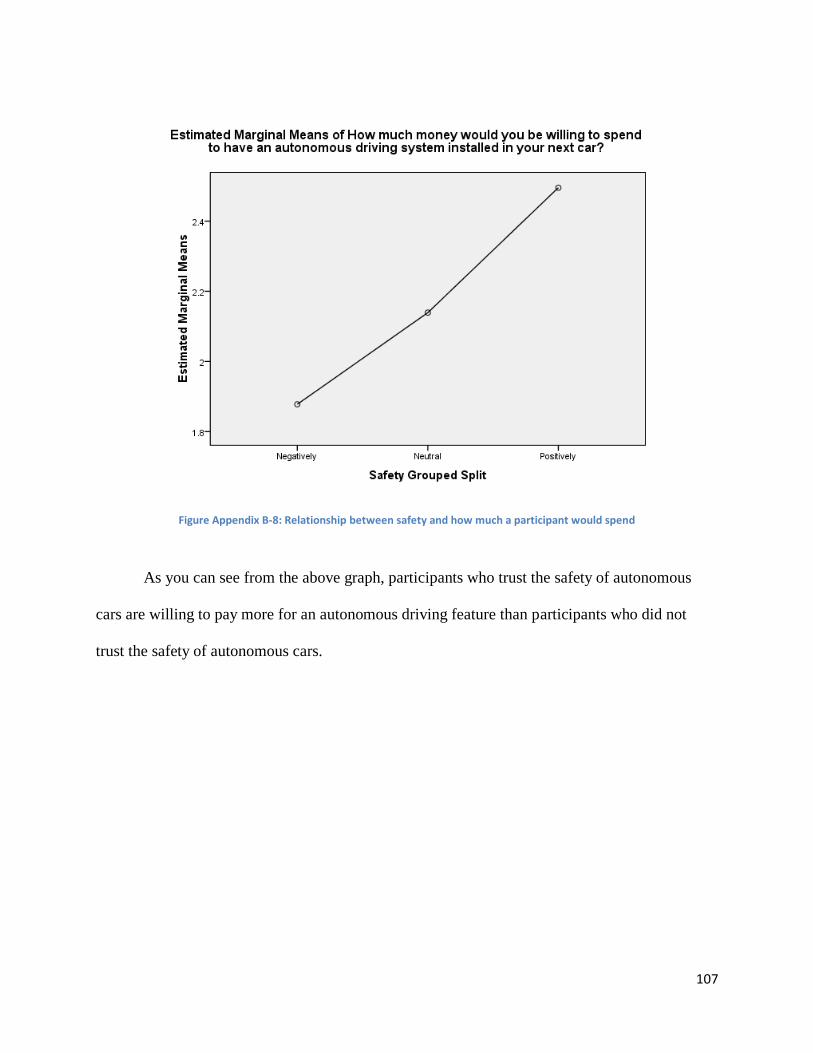
107
Figure Appendix B-8: Relationship between safety and how much a participant would spend
As you can see from the above graph, participants who trust the safety of autonomous
cars are willing to pay more for an autonomous driving feature than participants who did not
trust the safety of autonomous cars.

108
Figure Appendix B-9: Relationship between number of concerns and opinions on safety
As you can see from the above graph, participants who had between one and two
concerns with the technology of autonomous cars rated the safety of autonomous cars more
positively. Participants who found issue with 3 or more concerns of autonomous cars were the
more likely to rate the safety of autonomous cars negatively.

109
Figure Appendix B-10: Relationship between gender and enjoyability of driving
As you can see from the above graph, male participants enjoyed driving more than
female participants.

110
Figure Appendix B-11: Relationship between highest education level and opinions of safety
As you can see from the above graph, participants who have completed high school, their
associate’s degree, or bachelor’s degree rate safety more positively than any group of
participants. Participants with their professional degree rated the safety the least positively.

111
Figure Appendix B-12: Survey Question #1
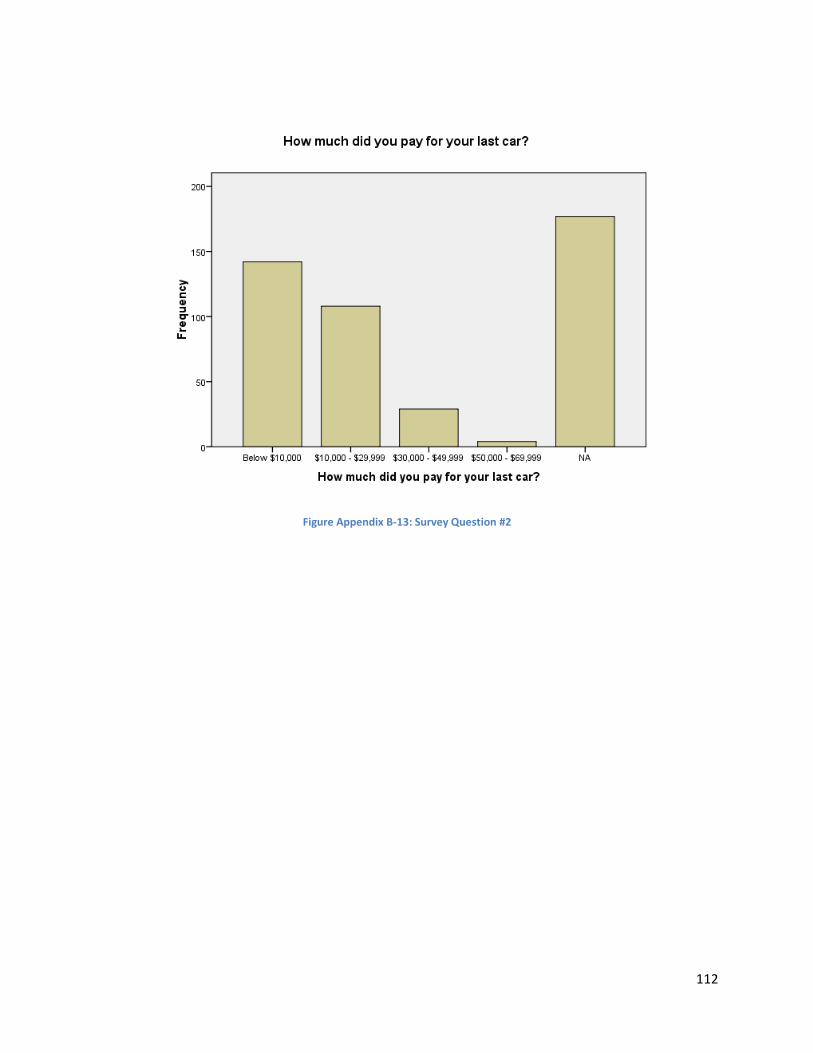
112
Figure Appendix B-13: Survey Question #2

113
Figure Appendix B-14: Survey Question #3

114
Figure Appendix B-15: Survey Question #6

115
Figure Appendix B-16: Survey Question #7

116
Figure Appendix B-17: Survey Question #8

117
Figure Appendix B-18: Survey Question #10
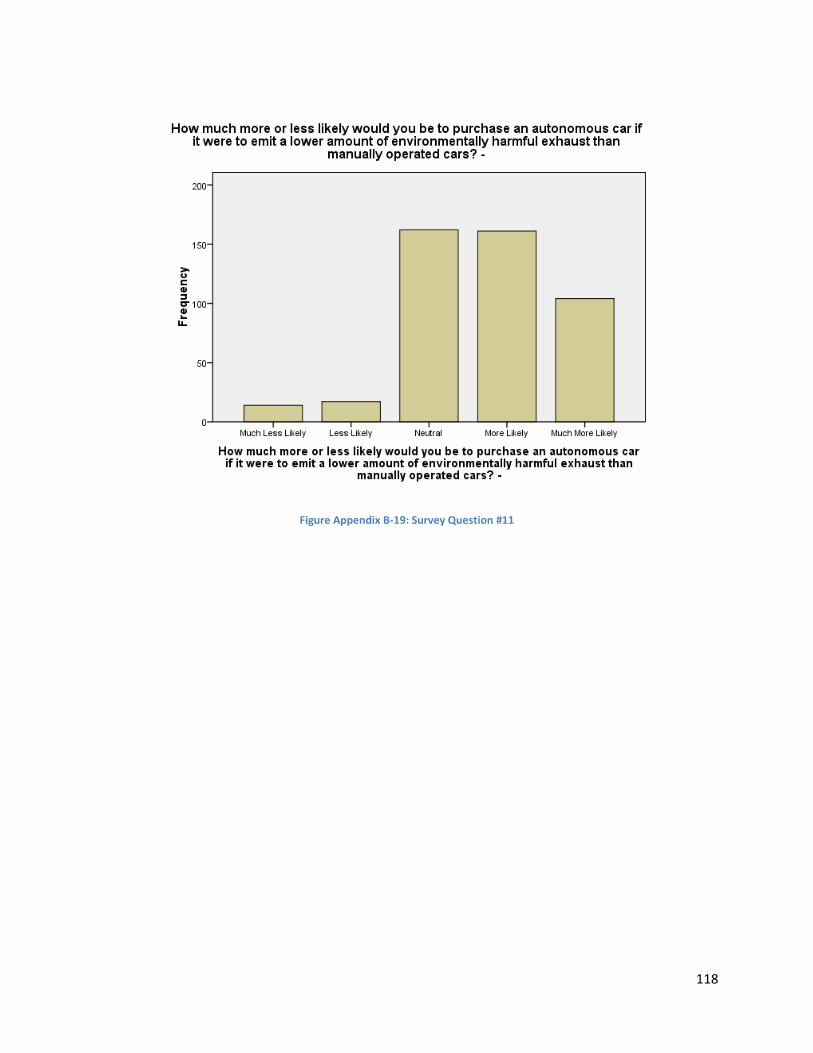
118
Figure Appendix B-19: Survey Question #11
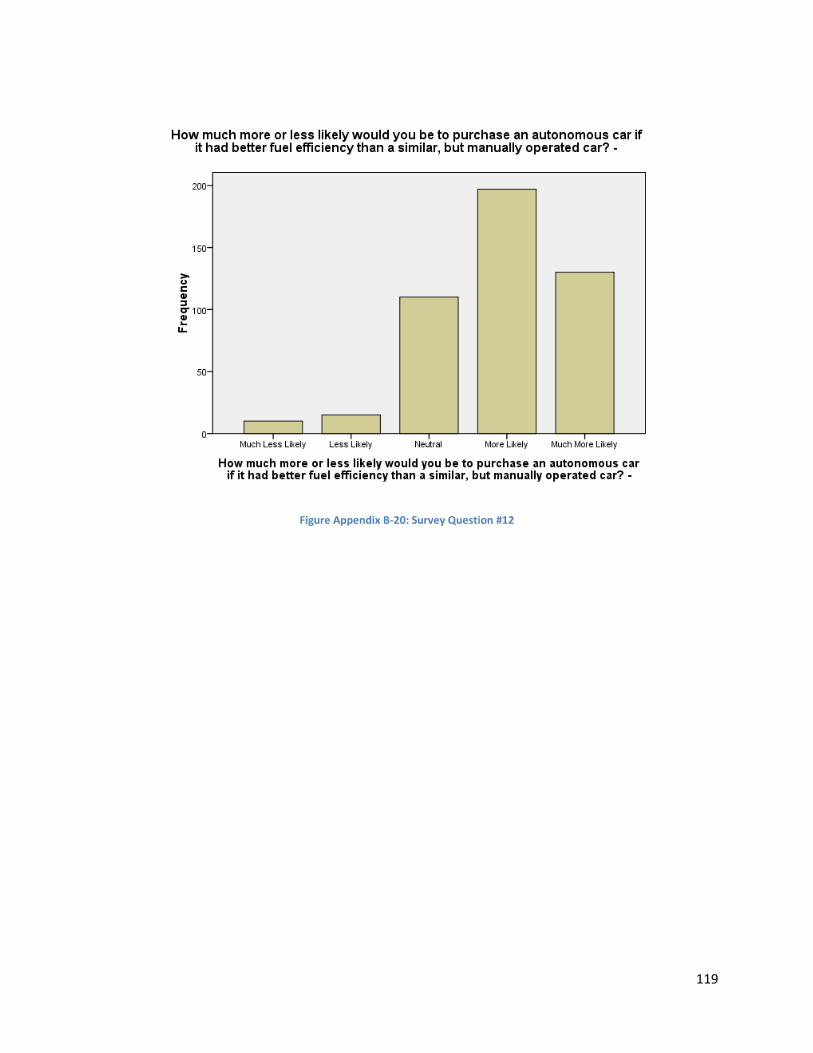
119
Figure Appendix B-20: Survey Question #12

120
Figure Appendix B-21: Survey Question #13

121
Figure Appendix B-22: Survey Question #14

122
Figure Appendix B-23: Survey Question #15

123
Figure Appendix B-24: Survey Question #16

124
Figure Appendix B-25: Survey Question #17

125
Figure Appendix B-26: Survey Question #18

126
Figure Appendix B-27: Survey Question #19
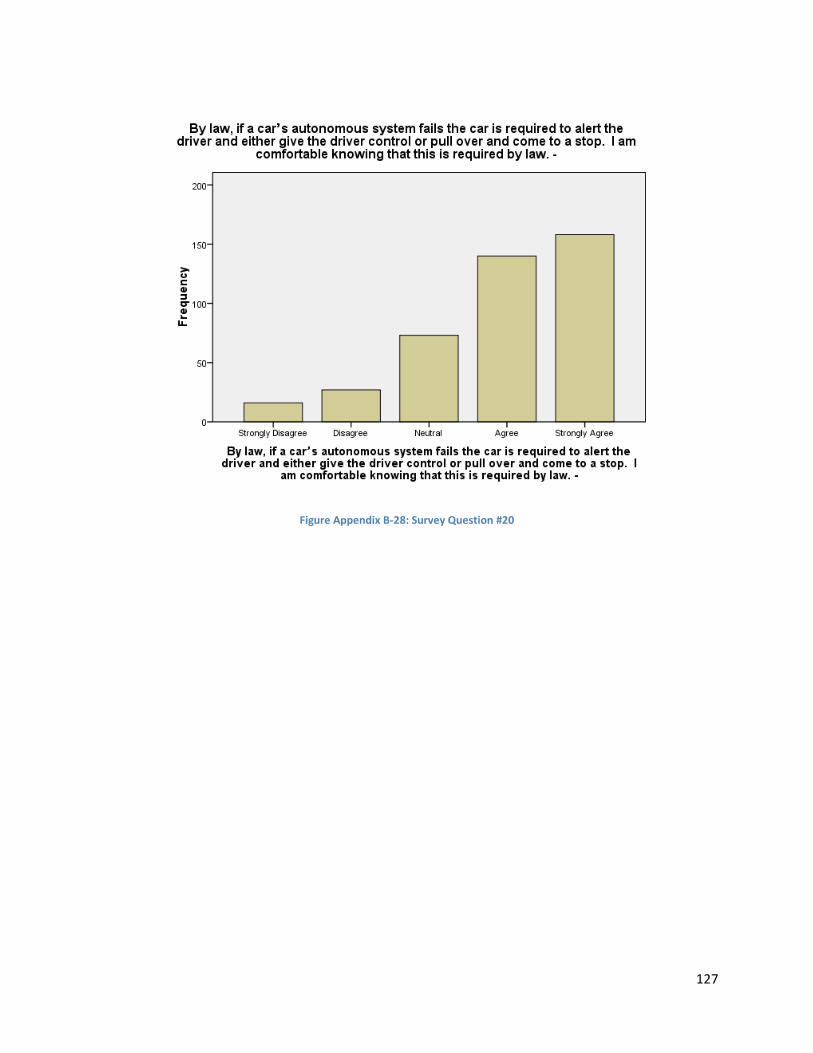
127
Figure Appendix B-28: Survey Question #20

128
Figure Appendix B-29: Survey Question #21

129
Figure Appendix B-30: Survey Question #22

130
Figure Appendix B-31: Survey Question #23

131
Figure Appendix B-32: Survey Question #24

132
Figure Appendix B-33: Survey Question #25

133
Figure Appendix B-34: Survey Question #26: Ranking for laws regarding autonomous cars

134
Figure Appendix B-35: Survey Question #26: Ranking for cost of autonomous cars

135
Figure Appendix B-36: Survey Question #26: Ranking for safety of autonomous cars

136
Figure Appendix B-37: Survey Question #27
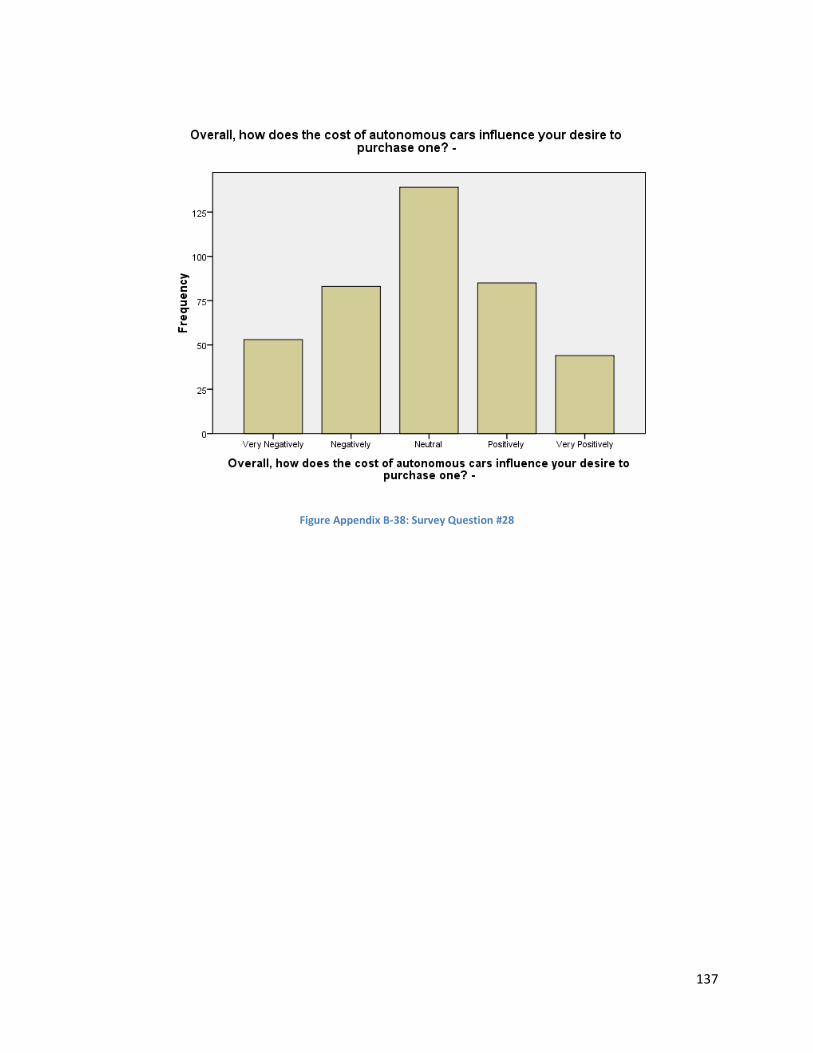
137
Figure Appendix B-38: Survey Question #28

138
Figure Appendix B-39: Survey Question #29

139
Figure Appendix B-40: Survey Question #30

140
Figure Appendix B-41: Survey Question #31
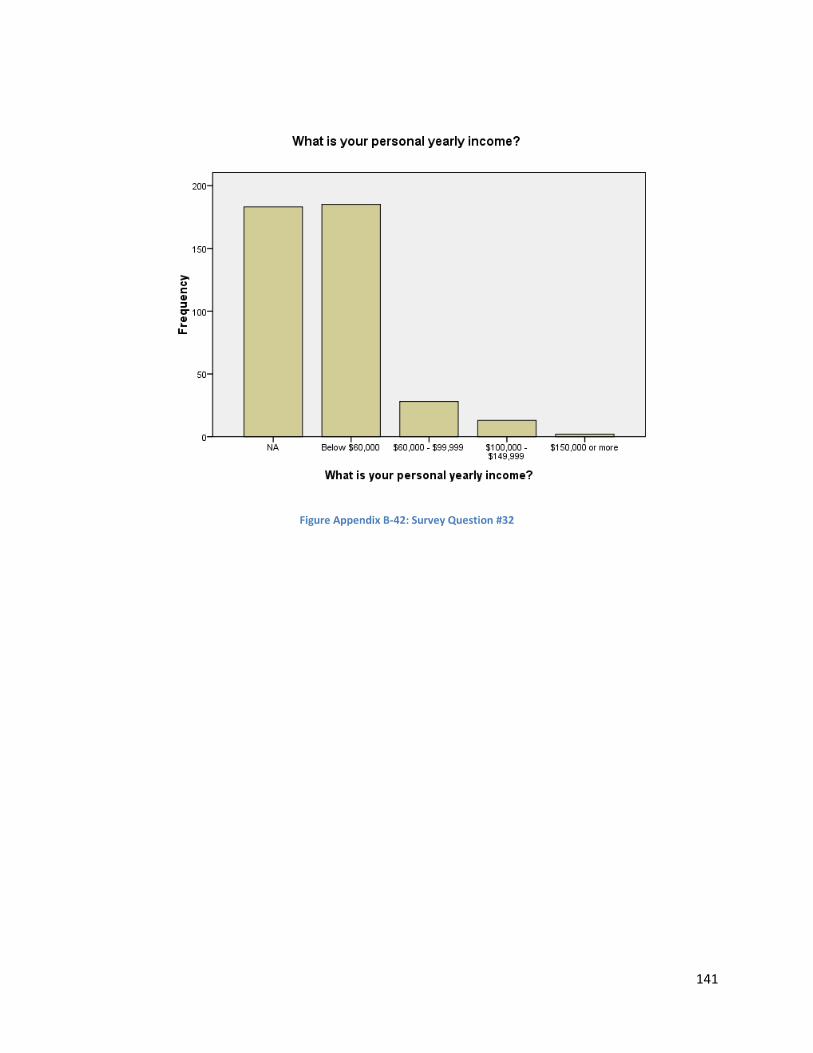
141
Figure Appendix B-42: Survey Question #32

142
Figure Appendix B-43: Survey Question #33

143
Figure Appendix B-44: Survey Question #34
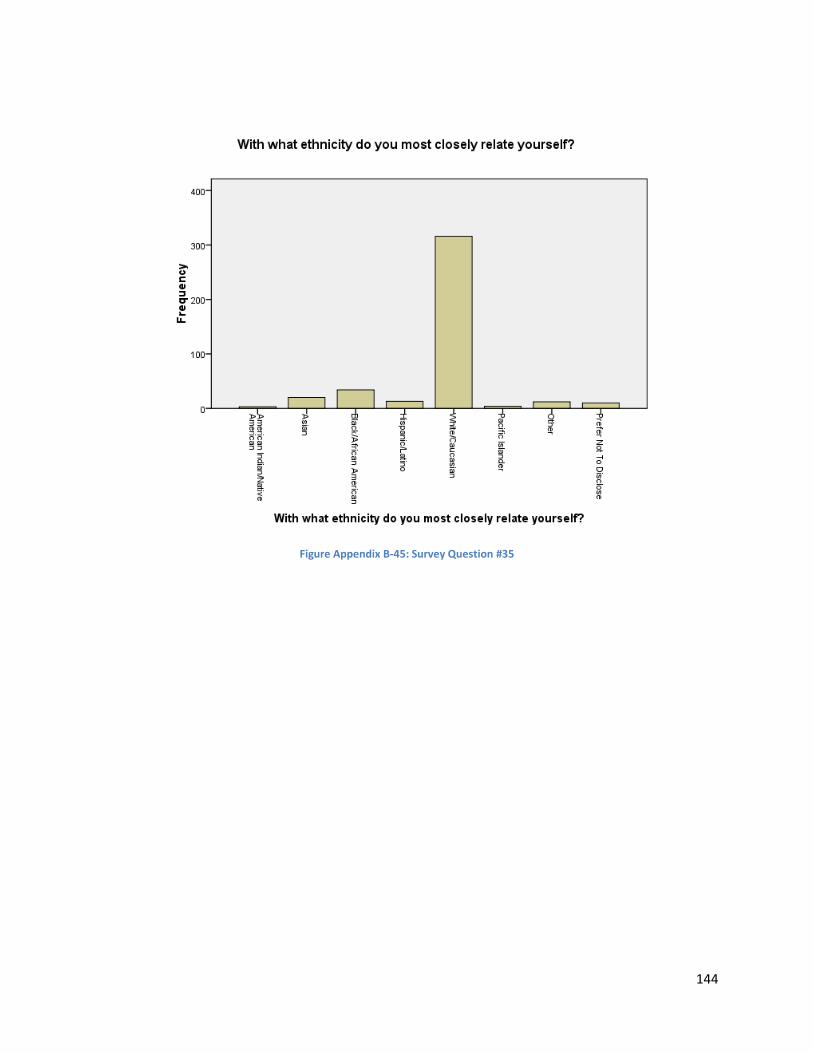
144
Figure Appendix B-45: Survey Question #35

145
Figure Appendix B-46: Survey Question #36
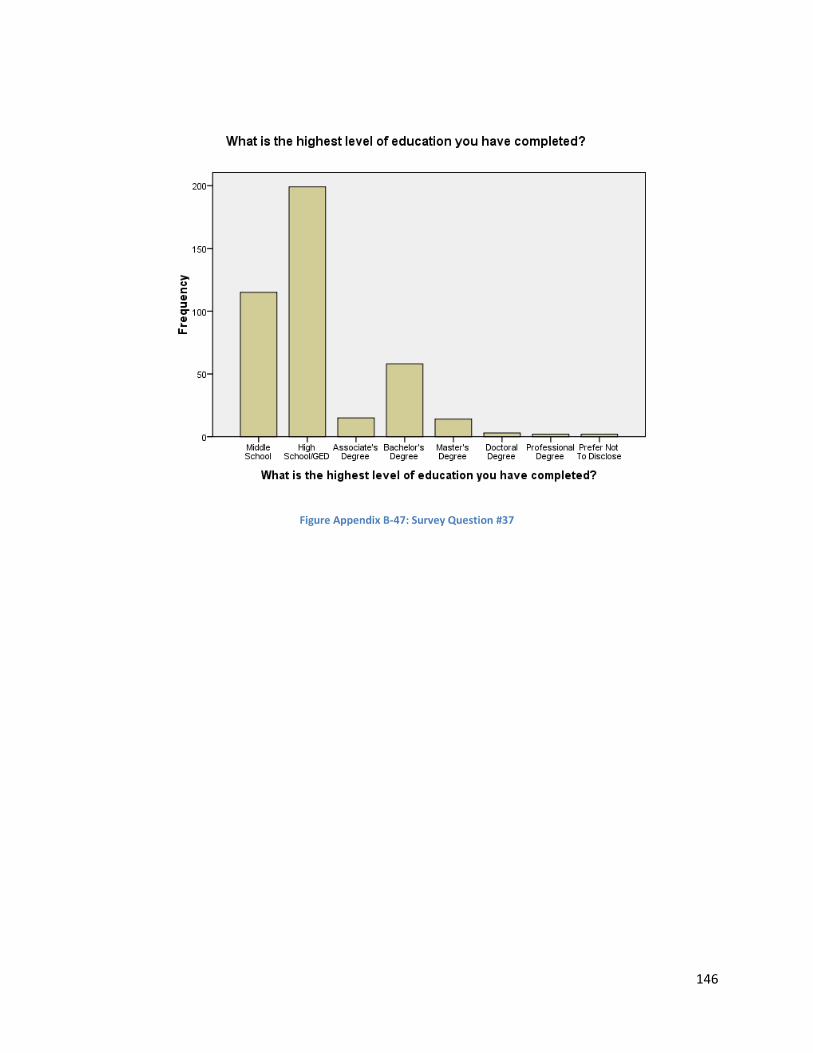
146
Figure Appendix B-47: Survey Question #37