Community consultation on Green Collar Job creation in the inner-city

A STUDY OF GREEN HUMAN RESOURCE MANAGEMENT
PRACTICES AND ITS RELATIONSHIP WITH EMPLOYEE
MOTIVATION, JOB SATISFACTION AND
ORGANIZATIONAL COMMITMENT
UGC MAJOR RESEARCH PROJECT
F. No: 5-264/2014 (HRP) dated 27th
January 2016
MRP-MAJOR-MANA-2013-34840 (GENERAL)
Final Report
Submitted
by
Dr. Vikas Nath Dr. Ankit Goel
Principal Investigator Co-Principal Investigator
Bharati Vidyapeeth (Deemed to be university), Pune
Institute of Management & Research
A-4, Paschim Vihar, Rohtak Road, New Delhi – 110063
TO
UNIVERSITY GRANTS COMMISSION
BAHADUR ZAFAR MARG
NEW DELHI -110002
July 2015 – June 2018

PREFACE
The work presented in this research project is concerned with presenting a systematic
view of Green HRM. The major questions, which prompted the researcher to
undertake the present research to accomplish these theoretical and practical objectives
included:
1. To identify the various Green HRM practices adopted by Indian industries under
study 2. To identify the relationship between Green HRM practices with Employee
Motivation, Job Satisfaction and Organizational Commitment. 3. To develop the
model based on these factors and test goodness of fit for the same. The study has
been divided in to five chapters. Chapter 1 deals with introduction of Human
resource management, Corporate social Responsibility and GHRM. Chapter covers
basic concepts of GHRM, GHRM practices adopted by Indian Firms and also why
firms are adopting GHRM Practices. Basically chapter one is concept and growth
oriented.
Chapter 2 provides a detail context and relevance to the problem briefly discussing
the findings of other related studies. Review of literature is an important step in the
process of research. No scientific research can start abruptly. All scientific study
stems out as a result of the consolidation of a host of knowledge already gathered by
various pioneers in this field. In the light of the earlier researches the problem can be
viewed in different perspectives. Keeping this in mind, the investigator has collected
relevant research done on the topic under investigation. An attempt is made to
highlight the procedure and findings of researchers conducted earlier that have a
bearing on the present study. It also compares various studies done by different
researchers and ultimately establishes the fact that Indian research literature suffers
from a distinct big gap relating to a lack of in – depth studies. It further emphasizes on
the fact that foreign researchers have been exploratory in nature whereas Indian
researchers have been mainly the review of literature as far as management discipline
is concerned.

Chapter 3 presents a statement of the problem, indicating objectives and shows why
it is worth studying Green HRM in Indian context and why it is important for the
Indian organizations future to think about. It further presents methods of data
collection and techniques of data analysis used in studying the problem and consists
of description about the population of Delhi NCR; how the samples were selected
from the populations, indicates the procedure followed in collecting the data,
describes design and pre testing of the questionnaires / schedule, editing and
codification of data and finally gives a brief account of the statistical techniques used
to analyzed the data.
Chapter 4 comprehensively discusses about the methodology, research design and data
collection instruments employed to carry out this research work. This chapter examines
the primary data collected from the personal interviews and survey. It also presents
facts about in what manner the results derived from the surveys have been utilized in
the process of refining the research model as proposed by the researcher in the literature
review section by substantiating the traits of each variable, and then identifying them
into constructs.
Chapter 5 has been exclusively devoted to finding and analysis of data. In view of
the outcome of this research work, a detailed discussion of the theoretical and
practical implication is represented in this chapter. The results have been presented in
different tables and relationships have been tested by formulating various hypotheses.
Additionally, the researcher has also given some recommendations that can be
adopted by the organizations. This chapter includes the conclusion drawn by the
researcher from the findings and analysis, limitations of the study and also makes
suggestions for industry and academia.
Dr. Vikas Nath
Professor & Director (I/c)
(Principal Investigator)
ACKNOWLEDGEMENTS
One of the most pleasant aspects of writing an acknowledgement is the opportunity to
thank all those who have contributed to it. Unfortunately, the list of expression of
gratitude – no matter how extensive – is always incomplete and inadequate. This
acknowledgement is no exception.
First of all, I wish to express my sincere gratitude to our Late Honourable Dr.
Patangrao Kadam, founder Bharati Vidyapeeth for giving me opportunity to work
at Bharati Vidyapeeth (Deemed to be University) Institute of Management and
Research, New Delhi. Because of his inspiring guidance, motivation, and continuous
encouragement this work could be brought to its present shape. His persistent efforts,
kind-hearted guidance has been a mental boost up, which was required to carry out
this piece of research.
I would like to express my deep sense of gratitude to Honourable Prof. Dr.
Shivajirao Kadam, Chancellor, Honourable Vice chancellor Dr. Manikrao
Salunkhe and Honourable Pro Vice Chancellor Dr. Vishwajeet Kadam, Bharati
Vidyapeeth University, Pune. I could not have started and completed my research
work without their unbridled support and encouragement. I am greatly indented to our
registrar Mr. G. Jay Kumar, who had always given an unconditional support
regarding all administrative matter related to this project. I express my gratitude to
Mr. C.B. Sawant, Regional Director, Bharati Vidyapeeth Complex New Delhi for his
unconditional support during thos project work.
It is my privilege to thank my research assistant Dr. Ankit Goel for providing the
necessary cooperation for carrying out this piece of work with full dedication and
hard work. I wish to thank my colleagues and research scholar Dr. Nancy Goel, Dr.
Naveen Nandal for the necessary support related to data analysis carried out by them
in this Major Research Project.
My sincere thanks are also due to the all members of the administrative staff of
institute of management and research, New Delhi for extending necessary help. I am
greatly indented to the faculty members and non-teaching staff of Bharati Vidyapeeth
(Deemed to be university) Institute of Management and Research, New Delhi for
providing me moral support and necessary environment during this study.
I wish to acknowledge the inspiration and moral support of my father Prof. Prem Nath
(Retired), Department of Mathematics, University of Delhi, my mother, my wife, Dr.
Vandana Nath and my son for their patience, endurance and moral support.
I would like to thank all of them who in one way or the other have helped me.
Dr. Vikas Nath
Professor & Director (I/c)
(Principal Investigator)

CONTENTS
Title Page No.
List of Abbreviations i-iv
List of Figures v-vi
List of Tables vii-x
CHAPTER 1: INTRODUCTION 1-29
1.1 Introduction 1
1.2 The emergence of green HRM 3
1.2.1 The „Green Movement‟ 3
1.2.2 Corporate Social Responsibility 4
1.2.3 Human Resource Management 6
1.3 Defining green HRM 9
1.4 Existing Sustainability Frameworks 12
1.4.1 The United Nations Global Compact 12
1.4.2 The Organisation for Economic Co-operation and
Development (OECD) Guidelines for Multinational
Enterprises 13
1.4.3 International Standard ISO 26000 13
1.4.4 SA8000 13
1.5 Benefits of Adopting Green HRM Practices to firms 14
1.6 Green HRM Practices 15
1.6.1 Green Recruitment and selection 15
1.6.2 Green Training and Development 16
1.6.3 Green health and safety management: 16
1.6.4 Green employee discipline management: 17
1.6.5 Green Performance Appraisal 17
1.6.6 Green Compensation and Reward Management 18

Title Page No.
1.6.7 Green Employee Relations 18
1.6.8 Green job design and Job analysis 19
1.7 Advantages of Green Human Resource Management practice 20
1.8 Green HRM in India: Top 10 Indian Companies 21
1.9 Employee motivation 24
1.9.1 Significance of Employee Motivation 25
1.10 Job satisfaction 26
1.10.1 Significance of Job Satisfaction 26
1.11 Organizational Commitment 27
1.11.1 Significance of organizational commitment 28
CHAPTER 2: REVIEW OF LITERATURE 30-66
2.1 Introduction 30
2.2 The role of Human Resource Management in Greening the Firm 34
2.3 Green HRM practices 38
2.3.1 Green Recruitment and Selection 42
2.3.2 Green Training and development 44
2.3.3 Green Reward Management 46
2.3.4 Green Employee involvement 49
2.4 Theories and Models of HRM 51
2.4.1 Sustainability in Human Resources Management 52
2.4.2 The sociological approach to SHRM as exemplified by
Diversity Management 52
2.4.3 The psychological approach to SHRM as exemplified by
Work-Life Balance 55
2.4.4 The strategic approach to SHRM as a source of sustained
competitive advantage 57
2.5 Green Human Resource Management, Employee Motivation, Job
Satisfaction and Organizational Commitment 59

Title Page No.
2.5.1 GHRM and Employee Motivation 59
2.5.2 GHRM and Job Satisfaction 60
2.5.3 GHRM and Organizational Commitment 64
2.6 Conclusion 65
CHAPTER 3: RESEARCH METHODOLOGY 67-99
3.1 The Problem 67
3.2 Statement of the Problem 67
3.3 Objectives and Purpose of the Study 68
3.4 Significance of the Study 68
3.5 Delimitation of the Study 70
3.6 The Sampling Design 70
3.7 The Population 71
3.7.1 Background of these industries. 72
Automobile Industry 72
Electronics Industry 73
Food Industry 75
Plastic Industry 79
3.7.2 Sample Size 81
3.8 Data Collection Methods 85
3.8.1 Primary Data 85
3.8.2 Secondary Data 85
3.9 Research Model and Development of Hypotheses 85
3.9.1 Hypotheses formulation 86
3.10 Research Design 87
3.11 The Schedule/Questionnaire 88
3.11.1 Designing the Questionnaire 88
3.12 Questionnaire finalization process 90
Title Page No.
3.12.1 Pilot testing 91
3.12.2 Research Quality 91
3.12.3 Minimizing Errors 91
3.12.4 Reliability Test 91
3.12.5 Validity of the Questionnaire 92
3.13 Techniques of Data Analysis 97
3.13.1 Missing Data Analysis 97
3.13.2 Multivariate Outliers 97
3.13.3 Test of Normality 97
3.13.4 Multicollinearity 97
3.13.5 Reliability Test: Cronbach‟s Alpha 97
3.13.6 Factor Analysis 98
3.13.7 Structural Equation Modeling 98
3.14 Concluding Remarks 99
CHAPTER 4: DATA ANALYSIS AND FINDINGS 100-163
4.1 Preliminary Data Analysis 100
4.2 Findings and analysis of Part B 101
4.2.1 Awareness of the term „Green Human Resource
Management Practices. 101
4.2.2 Awareness of ISO 14000 series issued on environmental
management system, which includes a broad range of
environmental disciplines? 102
4.2.3 Is your company ISO 14000 Certified? 102
4.2.4 Do you think Green Human Resource Management
Practices should be applied in your industry {1) strongest
reason 4) weakest reason 103
4.3 overall Industry and industry wise analysis of Green HRM
Practices 105

Title Page No.
4.3.1 Overall Industry analysis of Green HRM Practices 106
Green Recruitment and selection 106
Green Training and Development 107
Green Reward Management 107
Green Employee Involvement 107
Employee Motivation 108
Job Satisfaction 108
Organizational Commitment 109
4.3.2 Industry wise analysis of Green HRM Practices 109
Green Recruitment and selection 109
Green Training and Development 110
Green Reward Management 111
Green Employee Involvement 112
Employee Motivation 113
Job Satisfaction 115
Organizational Commitment 116
4.4 Data Analysis 117
4.4.1 Data Screening 117
4.4.2 Reliability 117
4.5 Data Suitability 119
4.5.1 Kaiser-Meyer-Olkin (KMO) and Bartlett‟s Test of
Sphericity 119
4.6 Exploratory Factor Analysis 119
4.6.1 Communalities 120
4.7 Exploratory Factors Extraction Model 122
4.7.1 Loadings of Items on Latent Factors 122
4.8 Interpretation of Factors 124
Title Page No.
4.8.1 Green Recruitment and Selection 124
4.8.2 Green Training and Development 125
4.8.3 Green Reward Management 126
4.8.4 Green Employee Involvement 127
4.8.5 Employee Motivation 128
4.8.6 Job Satisfaction 129
4.8.7 Organizational Commitment 130
4.9 Statistical Analysis- Structural Equation Modelling 130
4.9.1 Measurement Model 134
4.9.2 Reliability 134
4.9.3 Validity 134
4.9.3.1 Convergent Validity 134
4.9.3.2 Discriminant Validity 135
4.9.4 Goodness of Fit Indices 136
4.10 Model Estimates 137
4.10.1 Individual Construct SEM Models – Measurement Models 138
Green Recruitment and Selection 138
Green Training and Development 141
Green Reward Management 143
Green Employee Involvement 145
Employee Motivation 147
Job Satisfaction 149
Organizational Commitment 151
4.10.2 First Order Model 153
4.11 Evaluation of Structural Model and Hypothesis Testing 155
4.11.1 Summary of Hypotheses Testing by doing Path Analysis 156

Title Page No.
CHAPTER 5: INTERPRETATION OF FINDINGS, CONCLUSIONS,
LIMITATIONS AND SUGGESTIONS 164-179
5.1 Interpretation of Findings of Main Variables of Study 164
5.1.1 Green Recruitment and Selection and Job Satisfaction 164
5.1.2 Green Training and Development and Job Satisfaction 165
5.1.3 Green Reward Management and Job Satisfaction 165
5.1.4 Green Employee Involvement and Job Satisfaction 166
5.1.5 Green Recruitment and Selection and Employee
Motivation 166
5.1.6 Green Training and Development and Employee Motivation 166
5.1.7 Green Reward Management and Employee Motivation 167
5.1.8 Green Employee Involvement and Employee Motivation 167
5.1.9 Employee Motivation and Organizational Commitment 168
5.1.10 Job Satisfaction and Organizational Commitment. 169
5.2 Conclusions 169
5.3 Limitations 171
5.4 Suggestions 172
5.5 Future Scope of Research 178
BIBLIOGRAPHY 180-211
APPENDIX A 212-215
APPENDIX B 216-221
APPENDIX C 220-254
PLAGIARISM REPORT

i
LIST OF ABBREVIATIONS
Following are the abbreviations which have been frequently used throughout the
thesis while discussing, explaining, and analysing and interpretation of data.
Abbreviations Used Full Form
AGFI Adjusted Goodness-Of-Fit Index
AMO Ability-Motivation-Opportunity
AMOS Analysis of Moment Structures
ATMs Automated Teller Machine
AVE Average Variance Extracted
CAGR Compound Annual Growth Rate
CEO Chief Executive Officer
CFA Confirmatory Factor Analysis
CFI Comparative Fit Index
CII Confederation of Indian Industry
CIPD Chartered Institute of Personnel and Development
CR Construct Reliability
CRT Cathode Ray Tube
CSR Corporate social responsibility
DIPP Department of Industrial Policy and Promotion
DV Dependent variable
EFA Exploratory factor Analysis
EHPK Electronic Hardware Technology Parks
E-HRM Electronic Human Resource Management
EM Environmental Management
EMS Environmental Management system

ii
EM Employee Motivation
EP Environmental Policy
EU European Union
EV Electric Vehicles
FDI Foreign Direct Investment
FMCG Fast Moving Consumer Goods
GDP Gross Domestic Product
GEI Green Employee Involvement
GFI Goodness Of Fit Index
GHP Good Hygienic Practices
GHRM Green Human Resource Management
GMP Good Manufacturing Practices
GMV Gross Merchandise Value
GOF Goodness of Fit
GR Green Reward Management
GRS Green Recruitment and Selection
GTD Green Training and Development
GVA Gross Value Added
HACCP Hazard Analysis and Critical Control Points
HR Human Resource
HRM Human Resource Management
IBM-SPSS International Business Machines- Statistical Package for
the Social Science
IDV Independent variable
ISO International Standard FOR ORGANISATION
IT Information Technologies

iii
JS Job Satisfaction
KMO Kaiser-Meyer-Olkin
KPI Key Performance Indicators
LCD Liquid Crystal Display
MLE Maximum Likelihood Estimation
MSV Maximum Shared variance
NASSCOM National Association of Software and Services
Companies
NCR National Capital Region
NFC Near Field Communication
NFI Normed Fit Index
NGOs Non-government organizations
OC Organizational Commitment
OECD Organisation for Economic Co-operation and
Development
ONGC Oil and Natural Gas Company
PCA Principal Components Analysis
PLEXCONCIL Plastics Export Promotion Council
PVC polyvinyl chloride
RBI Reserve Bank of India
RMSEA Root Mean Square Error of Approximation
RoHS Restriction of Hazardous Substances
SEM Structural Equation Modelling
SEZs Special Economic Zones
SHRM Sustainable Human Resource Management
SIC Squared Interconstruct Correlations
iv
SMEs Small and Medium-Sized Enterprises
SRHRM socially responsible HRM
SRHRM Socially Responsible Human Resource Management
TQM Total Quality Management
TUC Trade Union Congress
VIF Variable Inflation Factor
WCED World Commission on Environment and Development
WLB Work-life Balance

v
LIST OF FIGURES
Figure No. Page No.
Figure 3.1 Electronic exports from India 75
Figure 3.2 Percentage of the respondents from different
industries 83
Figure 3.3 Profile of the respondents 84
Figure 3.4 Age of the respondents 84
Figure 3.5 Proposed Research Model 85
Figure 4.1 Awareness about Green HRM 101
Figure 4.2 Awareness about ISO 14000 series 102
Figure 4.3 ISO 14000 certification 102
Figure 4.4 Cost factor 103
Figure 4.5 Moral obligation to be more socially responsible 103
Figure 4.6 Pressure from regulatory bodies 104
Figure 4.7 Pressure from competitors 104
Figure 4.8 “Zero Order CFA of Green Recruitment and
Selection and its Measured Variables” 138
Figure 4.9 “Zero Order CFA of Green Training and
Development and its Measured Variables” 141
Figure 4.10 “Zero Order CFA of Green Reward Management
and its Measured Variables” 143
Figure 4.11 “Zero Order CFA of Green Employee Involvement
and its Measured Variables” 145
Figure 4.12 “Zero Order CFA of Employee Motivation and its
Measured Variables” 147
Figure 4.13 “Zero Order CFA of Job Satisfaction and its
Measured Variables” 149
Figure 4.14 “Zero Order CFA of Organizational Commitment
and its Measured Variables” 151

vi
Figure No. Page No.
Figure 4.15 First Order Model 154
Figure 4.16 Path-Analysis Model 156
Figure 4.17 Employee Management as Mediator 160
Figure 4.18 Job Satisfaction as Mediator 161

vii
LIST OF TABLES
Table No. Page No.
Table 2.1 Some HRM functions and ways of making them green 41
Table 3.1 Sample Size Determination Criteria 82
Table 3.2 Number of respondents have been taken for conducting
survey 83
Table 3.3 Initial Scale for Pilot Testing 93
Table 3.4 Final Scale for Study 95
Table 3.5 Variable and their Corresponding Items in the
Questionnaire 96
Table 4.1 Top Ranking statements for Green Recruitment and
Selection 106
Table 4.2 Top Ranking statements for Green Training and
Development 107
Table 4.3 Top Ranking statements for Green Reward
Management 107
Table 4.4 Top Ranking statements for Green Employee
Involvement 108
Table 4.5 Top Ranking statements for Employee Motivation 108
Table 4.6 Top Ranking statements for Job Satisfaction 108
Table 4.7 Top Ranking statements for Organizational
Commitment 109
Table 4.8 Top Ranking statements for Green Recruitment and
Selection 109
Table 4.9 Top Ranking statements for Green Training and
Development 111
Table 4.10 Top Ranking statements for Green Reward
Management 112
Table 4.11 Top Ranking statements for Green Employee
Involvement 113

viii
Table No. Page No.
Table 4.12 Top Ranking statements for Employee Motivation 114
Table 4.13 Top Ranking statements for Job Satisfaction 115
Table 4.14 Top Ranking statements for Organizational
Commitment 116
Table 4.15 Name of the Factors and their Codes 118
Table 4.16 Summary of Reliability Analysis 118
Table 4.17 KMO and Bartlett‟s Test 119
Table 4.18 Communalities 120
Table 4.19 Total Variance Explained 122
Table 4.20 Rotated Component Matrix 123
Table 4.21 “Summary of Factor Loadings, Percentage of Total
Variance Explained and Reliability of Green
Recruitment and Selection” 124
Table 4.22 “Summary of Factor Loadings, Percentage of Total
Variance Explained and Reliability of Green Training
and Development” 125
Table 4.23 “Summary of Factor Loadings, Percentage of Total
Variance Explained and Reliability of Green Reward
Management” 126
Table 4.24 “Summary of Factor Loadings, Percentage of Total
Variance Explained and Reliability of Green Employee
Involvement” 127
Table 4.25 “Summary of Factor Loadings, Percentage of Total
Variance Explained and Reliability of Employee
Motivation” 128
Table 4.26 “Summary of Factor Loadings, Percentage of Total
Variance Explained and Reliability of Job Satisfaction” 129
Table 4.27 “Summary of Factor Loadings, Percentage of Total
Variance Explained and Reliability of Organizational
Commitment” 130

ix
Table No. Page No.
Table 4.28 Exhibits the Code, Latent Variables and Observed
Variables for the Research 132
Table 4.29 Indices of Convergent Validity for the Constructs 135
Table 4.30 Indices of Discriminant Validity for the Constructs 135
Table 4.31 Statistics of Goodness of Fit used in SEM 136
Table 4.32 Terminology Referred for GRS 139
Table 4.33 Unstandardized Regression Coefficients of Green
Recruitment and Selection 140
Table 4.34 Standardized Regression Weights and Model Fit Indices of
Green Recruitment and Selection 140
Table 4.35 Terminology Referred for GTD 142
Table 4.36 Unstandardized Regression Coefficients of Green
Training and Development 142
Table 4.37 Standardized Regression Weights and Model Fit Indices of
Green Training and Development 143
Table 4.38 Terminology Referred for GR 144
Table 4.39 Unstandardized Regression Coefficients of Green
Reward Management 144
Table 4.40 Standardized Regression Weights and Model Fit Indices
of Green Reward Management 145
Table 4.41 Terminology Referred for GEI 146
Table 4.42 Unstandardized Regression Coefficients of Green
Employee Involvement 146
Table 4.43 Standardized Regression Weights and Model Fit Indices of
Green Employee Involvement 147
Table 4.44 Terminology Referred for EM 148
Table 4.45 Unstandardized Regression Coefficients of Employee
Motivation 148
Table 4.46 Standardized Regression Weights and Model Fit Indices of
Employee Motivation 149

x
Table No. Page No.
Table 4.47 Terminology Referred for JS 150
Table 4.48 Unstandardized Regression Coefficients of Job
Satisfaction 150
Table 4.49 Standardized Regression Weights and Model Fit Indices
of Job Satisfaction 151
Table 4.50 Terminology Referred for OC 152
Table 4.51 Unstandardized Regression Coefficients of
Organizational Commitment 152
Table 4.52 Standardized Regression Weights and Model Fit Indices
of Organizational Commitment 153
Table 4.53 Model Fit Indices 154
Table 4.54 Path-Analysis Model Fit Indices 156
Table 4.55 Standardized Direct Effect 157
Table 4.56 Regression Weights: (Group number 1 - Default Model)
(Direct Effect) 160
Table 4.57 Standardized Indirect Effect 160
Table 4.58 Standardized Indirect Effect 161
Chapter 1 Introduction
1
CHAPTER 1
INTRODUCTION
Today everyone is concerned with environmental issues as they influence all human
activities. One business area where environmental issues have received a great deal of
discussion is training of human resource for green organisations with the natural
environment management and employees have already begun to modify their
behaviour in an attempt to address society‘s new concerns.
This chapter deals with introduction of Human resource management, Corporate
social Responsibility and Green Human Resource Management (GHRM). GHRM is a
novel concept and indeed has a great potential to serve the individual, society and
business. This Chapter seeks to provide a theoretical framework concerning
environmental management and its evolution and the ‗greening‘ of the functional and
competitive dimensions of human resource management.
1.1 Introduction
The United Nation‘s World Commission on Environment and Development (WCED)
called for a report in the 1990‘s to investigate the condition of the world‘s resources.
The report by Brundtland highlighted the importance of HRM to build a sustainable
competitive advantage. It is acknowledged within the report that it is difficult to
transform traditional policies, processes and practices without developing and
converting the attitudes of an organization‘s workforce (Brundtland, 1987). The
Brundtland report defines sustainable development as –―development that meets the
needs of the present without compromising the ability of future generations to meet
their own needs‖ (Brundtland, 1987). This definition has become one of the most cited
sustainability definitions within current environmental literature. The emotive sentiment
generated from the findings of the report has motivated a number of contemporaneous
interpretations of sustainability, as well as significantly influencing the emergence of
contemporary management constructs within the green management domain (Dubois
and Dubois, 2012; Johnson, 2006; Lis, 2012; Ones and Dilchert, 2012b).

Chapter 1 Introduction
2
Green HRM began its journey through the milieu of green management applications,
in order to address the growing concern from corporate stakeholders (Roberts, 1992),
in response to the negative impacts of organizational operations on the environment
(Waddock, 2004). By embracing green management policies and strategies, and
Green HRM practices and processes, firms are expected to receive direct and
peripheral gains such as improved sales, productivity gains and competitive
advantages (Wee and Quazi, 2005). In addition, advantageous employee behaviors
(Shultz and Holbrook, 1999; Vandermerwe and Oliff, 1990) and increases in
corporate efficiencies including improvements in water and energy usage and waste
reduction (Klassen and McLaughlin, 1996), are likely to occur.
As it is employees who are the agents that implement organizational green policies, it
is necessary for organizations to promote and ultimately seek to manage and change
employee behavior so that they are aligned with organizational green goals (Anderton
and Jack, 2011; Daily, Bishop and Govindarajulu, 2009; Ones and Dilchert, 2012a).
Increasingly, organizations are considering the adoption of Green HRM practices, i.e.
‗HRM aspects of green management‘, to promote employee green behavior in the
workplace (Renwick et al., 2013). However, despite increasing levels of academic
literature conceptualizing the anticipated correlations between Green HRM and
employee green workplace behavior (e.g. Jackson and Seo, 2010; Kumari, 2012;
Renwick et al., 2013), this linkage has not yet been sufficiently empirically explored.
A number of studies, such as Jabbour and his colleagues (e.g. Jabbour and Santos,
2008; Jabbour, Santos and Nagano, 2008), along with papers published in a special
issue of Human Resource Management Journal, 51(6), 2012, have examined the
contributions of HRM practices to organizational environmental performance. A
small number of empirical studies, such as Harvey et al. (2013) and Paillé et al.
(2014), have revealed that Green HRM and HRM policies and practices are related to
individual-level employee pro-environmental behavior. However, the Harvey et al.
(2013) research is an undersized case study, with the extent of the sample limited in
its ability to adequately validate the effect of Green HRM on employee green
workplace behavior. The Paillé et al. (2014) study focused on general HRM, rather
than Green HRM, so again it does not increase our understanding of the effects of

Chapter 1 Introduction
3
Green HRM on employee green workplace outcomes. Therefore, our understanding of
the what, how, why and when of "Green HRM" influences employee green (or non-
green) workplace behavior, remains largely unknown.
As highlighted by Dubois and Dubois (2012), the need for firms to engage with
environmental sustainability strategies is due to three key pressures: declining
resources, increasing pressures and expectations from multiple stakeholders and radical
transparency from media, activists and NGOs. Dubois and Dubois (2012) add that when
environmental sustainability policies, processes and practices are fully embedded in an
organization ―it pervades the thinking and behavior of employees who then choose to go
beyond compliance with new rules and norms to participate in innovating job-related
changes in work processes, set-up, and product and service design‖.
However, the challenge for organizations is to get all employees on the same ‗green
bandwagon‘. Without a more targeted facilitation of HR policies, processes and
practices, firms will most likely struggle to achieve their green goals and targets as
highlighted within organizational sustainability agendas.
1.2 The Emergence of Green HRM
This section deals with the emergence of Green HRM by describing the history of
Green Movement, Corporate Social Responsibility and evolution of Human Resource
Management.
1.2.1 The ‘Green Movement’
From the early 1960‘s through to the mid 1970‘s, the social movement and a public
advocacy agenda (i.e. civil rights, women‘s rights and the environmental movement)
were comprehensively established (Carroll and Shabana, 2010). This movement was
spawned from social activists and scholars in response to the perception of corporate
manipulation within the domains of environmental recklessness and political
engagement (Waddock, 2004). From the advent of these socially motivated movements,
arose an increased awareness by the public of the effects of environmental degradation
caused by corporate operations. In addition, the establishment of a politically motivated

Chapter 1 Introduction
4
lobby group that began to counteract the perceived power that companies were exerting
over public interest agendas (Jabbour and Santos, 2008; Vandermerwe and Oliff, 1990;
Waddock, 2004). It is plausible to assume that it was these socially driven movements
and ensuing environmental agendas that influenced multinational companies and
domestic firms‘ willingness to respond with policies and practices designed to protect
the environment, employees, consumers and the public. Since the emergence of these
socially motivated factions, corporations have progressively responded by espousing
environmentally targeted corporate policies that are integral to commercial planning.
These revised agendas ultimately reflect business visions, strategies, policies and
decisions (Waddock, 2004).
Despite observable progress in corporate attitudes toward environmental policy
implementation due to the aforementioned activism, organizations are under constant
pressure from a range of stakeholders both internal and external to the firm (Berry and
Rondinelli, 1998; Jackson, Renwick, Jabbour and Muller-Camen, 2011; Teixeira,
Jabbour and Jabbour, 2012). As a result, not only are firms seeking ways to reduce the
direct impacts of their operational activities (example - excessive waste, energy
usage) but also alternative ways of managing and building the capabilities of their
human capital, encouraging and implementing corporate best practices and further
improving operational efficiencies.
1.2.2 Corporate Social Responsibility
Berry and Rondinelli (1998) and Lee (2009) claimed that by the late 1990‘s, firms had
begun initiating pro-active and voluntary, socially responsible and environmentally
sustainable related standards. The pursuance and development of these standards in both
academic research and corporate policy agendas began emerging in response to the calls
from social activist groups and the growing awareness and attitudes of the public toward
corporate irresponsibility (Jabbour and Santos, 2008; Wilcox, 2006). As such, CSR was
created. Corporate social responsibility is a multi-aspect construct that encompasses
economic and non-economic (e.g. diversity) concerns (Lis, 2012; Ones and Dilchert,
2012b) and is defined by McWilliams, Siegel and Wright (2006) as ―‗situations where a

Chapter 1 Introduction
5
firm goes beyond compliance and engages in actions that appear to further some social
good, beyond the interests of the firm and that which is required by law‖.
Mozes, Josman and Yaniv (2011) further defined CSR as ―acknowledging the importance
of economic performance, as well as the broad range of stakeholders, while also
highlighting the need for balancing these factors with societal responsibility‖.
Corporate social responsibility is now recognized as a vital conduit between corporate
strategy and social responsibility outcomes. It overtly demonstrates to employees,
governments, stakeholders and communities, what are the firm‘s values and policies
and the organization‘s strategic agenda (Garavan and McGuire, 2010; Manika, Wells,
Gregory-Smith and Gentry, 2013; Rangarajan and Rahm, 2011).
While there have been a growing number of studies conducted on the effects of CSR
policies on the financial performance of the firm (McGuire, Sundgren and
Schneeweis, 1988; Pava and Krausz, 1996; Tsoutsoura, 2004), corporate
competitiveness and sustainability (Marin, Rubio and Maya, 2012; Vilanova, Lozano
and Arenas, 2009), according to Turker (2008) few studies had determined the effects
of CSR on employee workplace outcomes. Consequently, Turker (2008) conducted a
study on CSR and Organisational Commitment and identified that employees have a
preference to work for organizations that are socially responsible. Corporate social
responsibility was identified as a factor that shapes a company‘s public image. As
such, the level of an employee‘s commitment to an organization was found to be
dependent upon the perception and strength of the firm‘s CSR policies that are aimed
at supporting society, the environment and employees (Turker, 2008). Turker‘s (2008)
argument, which was later supported by Friedman (2009) and more recently by De
Roeck and Delobbe (2012), states that an employee‘s self-esteem and subsequent
commitment is affected by the prestige and reputation of the firm, and community
perceptions of what the organisation stands for. These employee perceptions are
largely driven by the firm‘s observable commitment to CSR and associated
environmental and socially directed initiatives.
A study by Ellis (2008) attempted to establish a link between an employee‘s social
behavior and how they identify with their organisation. It was suggested that employee
Chapter 1 Introduction
6
values, social bonds and exchanges in the workplace, and individual attitudes toward
CSR are likely to be key predictors of socially related behaviors. Therefore, Ellis (2008)
concluded that management should encourage employees to actively participate and
contribute to policy development and the execution of green programs.
A pro-active CSR platform positively contributes to building a strong corporate image
because it demonstrates to employees and the community, the firm‘s commitment to
socially responsible and environmentally sound business practices (Zutshi and Sohal,
2003) without the need for excessive regulatory impositions. As a result of this corporate
pro-activism, stakeholders are expected to explicitly demonstrate their support via their
individual purchasing power of company products and services. (Torugsa, O‘Donohue
and Hecker, 2013; Vaccaro and Echeverri, 2010; Zhang et al., 2008).
1.2.3 Human Resource Management
Employees are being progressively recognised as valuable assets in organisations,
through their contributions to firm performance (Luthans and Youssef, 2004; Zutshi
and Sohal, 2003). Organisations need to diversify their strategies and invest in the
people management side of their company, in order to tap into a value adding
resource to boost a firm‘s competitive advantage (Luthans and Youssef, 2004).
Leading executives Carly Fiorina, (former) Senior Executive of Hewlett-Packard, and
Bill Gates of Microsoft (cited in Luthans and Youssef, 2004), claim that ―the most
magical and tangible and ultimately the most important ingredient in the transformed
landscape is people‘ and ‗our most important asset walks out the door every night‖.
Since the mid 2000‘s, key academics and psychologists have been actively calling for
pioneering research into how organisations can effectively promote and achieve pro-
environmental attitudes and employee green behaviors (Jabbour, 2011; Jackson and
Seo, 2010; Renwick, Redman and Maguire, 2008). Green HRM has been identified as
a likely emancipator of such employee level outcomes. Despite these calls for studies
into this newly established HRM related concept, there is still an absence of
formalised HRM research that targets the role of HR and its latent influence over
employee green related behaviors and attitudes aimed at achieving corporate
Chapter 1 Introduction
7
sustainability targets (Ehnert and Harry, 2012; Jabbour, 2011; Robertson and Barling,
2013). Human resource management is defined as ―a set of distinct but interrelated
activities, functions and processes that are directed at attracting, developing, and
maintaining (or disposing of) a firm‘s human resources‖ (Lado and Wilson, 1994).
It is widely accepted in the literature that a positive correlation exists between HRM
practices and organizational performance (Ahmad and Schroeder, 2003; Chartered
Institute of Personnel and Development (CIPD), 2001; Huselid, 1995). Buchan (2004)
suggests for firms to achieve organizational objectives and desirable employee
outcomes, that there needs to be a distinctive ‗fit‘ and congruence between a
corporation‘s HRM approach and the characteristics of the organisation, as well as its
values, ethics and priorities. The effectiveness of this association plays a key role in
the implementation and accomplishment of CSR and EM directives (Carmona-
Moreno, Cespedes-Lorente and Martinez-del-Rio, 2012; Govindarajulu and Daily,
2004; Jackson and Seo, 2010).
Jabbour and Santos (2008) claim that the value of HRM in the application of
organizational sustainability policy is because:
1) The general functions of HR have the potential to advance sustainability within
the scope of an organisation and its policies
2) Contemporary HRM and organisations pursuing sustainable operations, require
the implementation of long term strategies and programs that extrapolate
economic performance objectives
3) Sustainability is considered a ‗current‘ paradigm of HRM and
4) Present day HRM needs to have effective processes in order to meet the
demands of multiple stakeholders.
Renwick et al. (2008) support Jabbour and Santos‘s (2008) claims that HRM and HR
practitioners are best placed to lead and co-ordinate the introduction of green policies
in organisations, because they are proficient in communicating with employees and
expertly equipped in implementing cultural change processes. Cohen et al. (2010)
state that there are few areas of organizational functionality that have the capabilities

Chapter 1 Introduction
8
to deliver the necessary people management outcomes of sustainability and
environmentally friendly agendas than that of HRM.
Lee (2009) claims that HRM and green management initiatives and objectives require
employees to be environmentally aware and highly trained in both technical and
management skills, as corporations will be developing innovative environmental
processes that will have considerable management implications. The role of HRM is
to ensure that targeted training programs are developed and designed to increase the
awareness of employees to the importance of environmental initiatives, as well as
conducting training programs that develop technical, operational and management
competencies (Daily and Huang, 2001). According to Lee (2009), implementing these
developmental programs is essential if firms are to successfully cultivate
environmental innovations.
Green HRM therefore, could be considered to be a component of green management, in
that its policies, processes and activities are constructed from within a management
strategy designed to achieve environmentally related outcomes. Lee (2009) suggests that
the initiation of Green HRM was to address ways that firms can both improve
environmental outcomes related to EM and CSR, but at the same time consider the
financial and strategic opportunities that Green HRM offers (Lee, 2009). Human resource
management‘s distinct approach to people management and the anticipated influence that
people management strategies are likely to exert over general employee workplace
behaviors (Daily and Huang, 2001; Ellis, 2008), are likely to be similarly experienced by
organisations that implement Green HRM practices. Siegel (2009) supports this assertion
and suggests that espousing green management and Green HRM provides firms with
opportunities to maximise profits and implement practices that arouse employee
engagement and encourage behavior that are placatory toward the environment.
Based on existing literature, a green management-based policy and related green
processes and practices such as what would be advocated from within a Green HRM
platform, is expected to increase the engagement of employees to embrace green
initiatives. It could also potentially modify employee behavior and attitudes to
recognise the significance and consequences of socially responsible and
environmentally sustainable policies, processes and practices. Unfortunately,

Chapter 1 Introduction
9
notwithstanding the potential advantages and benefits of implementing Green HRM,
its legitimate influence is still being debated (Harvey et al., 2013; Milliman, 2013;
Steg, Bolderdijk, Keizer and Perlaviciute, 2014).
1.3 Defining Green HRM
Yusliza Mohd Yusoff (2015) emphasized that since the concept of Green HRM is still
unclear and needs to be developed, the study has done Qualitative-based research to
gain deeper insights and understandings in this regard to developed broad
conceptualizations of Green HRM. These broad conceptualizations were then
categorized in to a narrower conceptualization by grouping the activities which entail
shared concepts and result in the formation of only five parent conceptualizations -
the E-HRM, Work-life Balance (WLB), Corporate Social Responsibility (CSR),
Green Policies, and Extra Care Program.
According to Gill Mandip (2012) the focus on civilizing the operational efficiencies
combined with up-gradation of technology have led ITC to be the only company in
the world, of its size and variety, to achieve the milestone of being carbon positive,
water positive and achieving almost 100% solid waste recycling. The ―Three Leaves‖
rating awarded by Centre for Science and Environment, Green Tech Environment
Excellence award, ―Golden Peacock‖ award and ―Solid Waste Recycling Positive‖,
―Excellent Water Efficient Unit‖ awards to name a few are testimonies to these efforts
and achievement. The future of Green HRM appears promising for all the
stakeholders of HRM. The employers and practitioners can establish the usefulness of
linking employee involvement and contribution in environmental management
programmes to improved organizational environmental performance, like with a
specific focus on waste management recycling, creating green products. Unions and
employees can help Employers to adopt Green HRM policies and practices that help
safeguard and enhance worker health and well-being. The academicians can
contribute by carrying further research in this area revealing additional data that can
build a knowledge base on Green Management in general.
Aravamudha (2012) said Green HRM involves addressing the company carbon footprint
by cutting down on usage of papers, reducing un-wanted travel. Green HRM is about the

Chapter 1 Introduction
10
holistic application of the concept of sustainability to organization and its workforce. It
has been found out in various researches that HR department in many companies are
increasingly greening their processes to gain competitive advantage over others.
As per Suhaimi Sudin (2011), research shows that green management initiatives has
become an important factor in forward thing businesses around the world. Researchers
argued that employees must be inspired empowered and environmentally aware of
greening in or-der to carryout green management initiatives. The paper focuses on
development of a new model of strategic Green HRM which includes relationship
between assessments based HR interventions, environmental management system, Green
intellectual capital and corporate environmental citizenship.
According to Liu, (2010) business organizations play a key role in the problems of
environmental management since they are part of our society and cannot be isolated from
the environment, and in fact, they contribute most of the carbon footprints in the past
As per the survey done by Buck Consultants (2009), Greening of HR Survey examines
the Types of environmentally friendly ―green‖ initiatives that companies are utilizing
involving their Workforce and human resource practices. The results confirm that
companies are in-corporation And working towards integrating a number of green
practices. While the study‘s questions and Results are broad, they hint at several areas for
HR practitioners to consider in the green space. Over half of the companies surveyed
have incorporated environmental management into business operations and have a formal
green pro-gram in place or plan to implement one in the next twelve months.
According to Candice Harris and Dr. Helen Tregidga (2008), many organizations
have quickly to Jump onboard the Sustainability bandwagon, little appears to have
been done to consider the role of, and effect on, the HR function and managers. How
are HR managers defining and enacting Corporate Sustainability? All participants felt
that HR function has a role in fostering environmental practices within an
organization due to their role as stewards of value, and as skilled communicators in
the organization. Findings indicated the HR man-agers espouse private moral

Chapter 1 Introduction
11
positions around concern for the environment; however environmental action in their
personal lives appears limited.
According to Justin Victor (2008), one half of HR professionals indicated that their
organization have a formal or informal environmental responsibility policy. Top
Three green practices reported by HR professionals were encouraging employees to
work more environment friendly, offering recycling programs and donating /
discounting used furniture supplies.
John R. Rathgeber (2007) has said in his research that many business leaders are
embracing Corporate Sustainability and Green Business practices as a way to improve
their operations and enhance their competitiveness.
Stephen King (2004) stated that the future of HRM will be built on innovation and
creativity, in nutshell innovation and creativity approaches were needed towards
quality of life, environmental improvements through the healthy, sustainable, vibrant
community theme. In summary it was said that money and support of employees can
put HRM on the road to environmental Sustainability.
In summary, green management refers to the management of corporate interaction
with, and impact upon, the environment (Lee and Ball, 2003), and it has gone beyond
regulatory compliance and needs to include conceptual tools such as pollution
prevention, product stewardship and corporate social responsibility (Hart, 2005;
Pullman et al., 2009; Siegel, 2009).
According to Chad Holliday (2001), CEO DuPont says shrinking your environmental
footprint is more than just the right thing to do, it also generates tremendous business
value. This is the challenge of Sustainable growth and to meet it, the primary
motivation for any company should be improved business performance of course,
environmental societal benefits will follow.
Application of new technology could improve the environmental de-cline by
developing, for example, the biotech products and by searching for alternative energy
to reduce the use of finite natural resources. Therefore, organizations should put more
effort into the research on new technology to minimize the impacts of environmental

Chapter 1 Introduction
12
destruction by creating products that are harmless and less pollution to environment
(Liu, 2010; Ozen and Kusku, 2008).
Callenbach et al. (1993) argued that in order to take out green management, employee
must be motivated, empowered and environmentally responsive of greening to be
successful. To effectively implement green management initiatives and development
environmental innovations, corporations require a high level of technical and
management skills (Callenbach et. al., 1993; Renwick et al., 2008).
1.4 Existing Sustainability Frameworks
Many frameworks are available to support sustainable workplaces in developing a
sustainability strategy. Each organization should examine specific issues related to its
industry, sector or geography to establish the optimum sustainability strategy. This
section examines the characteristics of leading global frameworks for business
sustainability, which have a direct connection to sustainable HRM, and distills these
frameworks into common themes and performance requirements.
Most of these frameworks rest on a core set of principles and practices, which provide
a foundation for the development of sustainable HRM (Hassel, A. (2008).
1.4.1 The United Nations Global Compact
The United Nations Global Compact is a non-binding United Nations pact created by
the United Nations in 1999, the Global Compact is a policy initiative that asks
organizations to adhere to 10 universal principles underpinning responsible business
practices. The principles cover human rights, labor standards, environmental
stewardship and anticorruption. In committing to uphold these principles,
organizations also commit to report annually on their progress in doing so. Using
these principles as an umbrella framework of a corporate sustainability policy, HRM
can develop a set of policies and processes that align with the principles and ensure
they are manifested in the practices of the organization.

Chapter 1 Introduction
13
1.4.2 The Organisation for Economic Co-operation and Development (OECD)
Guidelines for Multinational Enterprises
Designed to ensure that the operations of large organizations are in harmony with
government policies and to enhance their contribution to sustainable development, the
OECD guidelines are a comprehensive set of tools covering human rights, employment
standards, bribery and corruption, environmental practices, community interaction, and
more. The guidelines set out clear frameworks in which HR policies and practices can be
developed ( OECD (2011). OECD guidelines for multinational enterprises.
1.4.3 International Standard ISO 26000
ISO 26000 is a quality standard, though not for certification, that provides guidance
on key themes of social responsibility across the broad spectrum of topics. It is
intended for use by organizations of all sizes anywhere in the world, with particular
attraction for small and medium-sized enterprises (SMEs), which may find other
frameworks too cumbersome.
It contains principles of social and environmental responsibility as well as guidance
for action and expectations for implementation (International Standard for
Organization).
1.4.4 SA8000
SA8000 is a certifiable standard focusing on the aspects of human rights and labor
standards of business operations and prescribes both process and performance criteria.
One of the earliest certification standards, used as early as 1998, it has been adopted by
close to 2,500 facilities around the world with almost 1.5 million employees. SA8000 is
often used as a tool for ensuring human rights in extended supply chains rather than being
limited to direct employees. An important part of this standard is its focus not only on
standards of performance but also on management systems that need to be put in place to
ensure the proper outcomes (Social Accountability International. (2010).

Chapter 1 Introduction
14
1.5 Benefits of Adopting Green HRM Practices to Firms
Even though initially it may be difficult to initiate and implement the Green HRM
practices at the first level, it can fulfil the prime objectives of an organization such are
cost control, ensuring corporate social responsibility, talent acquisition and gaining
competitive advantage over the rivals through environment consciousness and
preservation of natural and ethical values. The usual reasons why a firm should adopt
Green HRM practices are noted down below:
1. Preservation of natural environment: The elements of the environment which
are not created by human beings are called the elements of natural environment
like trees, forests, rivers, animals etc. Green HRM practices such as online
advertising and recruitment which uses less paper, creating less carbon emission
on the office space, training through electronic sources to reduce paper waste
can keep the environment form loss or negatively affected.
2. Ensure healthy working environment and raise employee morale: Making
the corporate space green with trees and plants, forbidding smoking on the
office premises, using less paperwork (which makes an employee hectic),
providing natural fruits and vegetables on HR meetings- all these can create a
healthy and habitable working environment which in turn, can raise the speed
and morale of the workers.
3. Gain competitive advantage through ensuring corporate social
responsibility (CSR): Corporate social responsibility is now-a-days a part of
company‘s core responsibilities which no company can ignore. Therefore, a firm
can gain competitive advantage over its rivals by ensuring green management
practices in a well-performed manner.
4. Save cost: Creating a sound working environment can reduce employee fatigue,
abseentism and turnover. The result is reduced cost. Again using less paper and
disseminating and recording the information via online can reduce wastage and
cost.

Chapter 1 Introduction
15
5. Increase company image: It is obvious that a company which has green
management/HRM practices will have a higher image than a company which
has not.
6. Reduce intervention from the government and other law enforcing
agencies: Adoption of proper green management/HRM practices can reduce the
chance of intervention by the central/local govt. and other law enforcing
agencies.
7. Develop eco-friendliness and environmental learning among the employees:
Adoption of Green HRM practices make the employees environment conscious
and make them eco-friendly which makes them a good corporate citizen in
environmental perspective.
8. Stimulate innovation and growth: Green HRM practices encourages new
innovative ideas and practices that facilitates growth in quality and enhancement
of methods and processes.
1.6 Green HRM Practices
In this section researcher has tried to describe various Green HRM Practices.|
1.6.1 Green Recruitment and Selection
Green recruitment means paper free recruitment process with minimal environment
impact. Green recruiting is a system where the focus is given on importance of the
environment and making it a major element within the organization. According to
(Wehrmeyer, 1996) recruitment practices can support effective environmental
management by making sure that new entrants are familiar with an organization
environmental culture and are capable of maintaining its environmental values. The
green recruiting is a system where the focus is given on importance of the
environment and making it a major element within the organization. Complementing
this the recruits are also enthusiastic and to some extent passionate about working for
an environment friendly green company. Recruiting candidates with green bend of
mind make it easy for firms to induct professionals who are aware with sustainable

Chapter 1 Introduction
16
processes and are already familiar with basics like recycling, conservation and
creating more logical world. Through the statements we can conclude that green
recruitment provides the employer with an opportunity to stand ahead of the crowd
and further increase their chance of attracting the candidates and retain them after
induction. Recently the green trend makes the recruitment as environmental friendly
issues. The recruiting makes the employee green in achieving the environmental goals
and how they perceive the job and parameters of sustainability as claimed. For
example the recruiting can be done as paper less interviews, eco-friendly locations
and also other practices in the recruitment portfolio. The recruiters can carry out the
green policies as well as the corporate policies in the management in establishing
green policies to achieve the goals of the company.
1.6.2 Green Training and Development
The Green Training and Development is a practice that focuses on development of
employee‘s skills, knowledge and attitudes. The Green Training and Development
educate employees about environmental management and training should be given for the
employees to educate also about energy, reduce waste, and diffuse environmental
awareness in the organization. This Green Training and Development helps employees to
provide opportunity to engage employees in environmental problem solving. The green
training embrace different methods of conservation including waste management within
an organization. Through this training session, it develops the eco-friendly mangers so
that employees under supervision can contact them without any hesitation.
1.6.3 Green Health and Safety Management
The green health and safety management is really beyond the scope of traditional
health and safety management function of HRM. It not only includes the traditional
health and safety management but also some more aspects of environmental
management of an organization. That is why nowadays many organizations are
redesigning post of ―health and safety manager‖ as ―health, safety and environmental
manager‖. This includes a wider job scope when compared with traditional post of
health and safety manager in an organization. For example, it includes biodiversity

Chapter 1 Introduction
17
protection and community support initiatives etc. that include local environment and
people. The key role of green health and safety management is to ensure a green
workplace for all. Green workplace is defined as a workplace that is environmentally
sensitive, resource efficient and socially responsible. At present there are companies
where traditional health and safety function was extended to include environmental
management/protection. These companies have continually endowed to create various
environmental related initiatives to reduce employee stress and occupational disease
caused by hazardous work environment.
1.6.4 Green Employee Discipline Management
Wehrmeyer (1996) stated explicitly that green discipline management is a pre-requisite in
corporate environmental management. In ensuring green employee behavior in the
workplace, organizations may need green discipline management practices to achieve the
environmental management objectives and strategies of the organization. In this context,
some companies have realized ―discipline management‖ as a tool to self-regulate employees
in environmental protection activities of the organization. These firms have developed a
clear set of rules and regulations which imposes/regulates employees to be concerned with
environmental protection in line with environmental policy of the organizations. In such
companies, if an employee violates environmental rules and regulations, disciplinary actions
(warning, fining, suspension, etc.) are taken against him/her.
1.6.5 Green Performance Appraisal
Green human resource management ensures that the environmental targets set by the
organizations are met. Performance management is an on-going process of
communication between supervisor and an employee that occurs throughout the year
in support of accomplishing the strategic objectives of the organization. Green
performance management includes the issues related to policies of the organization
and environmental responsibilities. Integration of environmental management into
performance management system improves the quality and value of environmental
performances. It acts as a safeguard to protect environmental management against any
damage. Green performance management plays a very important role in the
effectiveness of green management work over passage of time because they guide

Chapter 1 Introduction
18
employee performance to the environmental performances needed by the organization
(Jabbour and Santos, 2008).
1.6.6 Green Compensation and Reward Management
Compensation and reward management should recognize contributions in green
management. Compensation packages should be customized to reward green skills
acquisition and achievements by employees (Deshwal, 2015). Monetary- based, non
monetary based and recognition- based rewards can be used for green achievements of
employees. Monetary-based rewards for contributions in environment management can
be allocated in the forms of salary increase, cash incentives and bonuses while non-
monetary rewards may include sabbaticals, special leave and gifts to employees and their
family members. Recognition-based awards can highlight green contributions of
employees through wide publicity and public praise and appreciation of green efforts by
CEO or top management executives.
1.6.7 Green Employee Relations
Employee participation in Green initiatives increases the chances of better green
management as it aligns employees‘ goals, capabilities, motivations, and perceptions
with green management practices and systems. Involving employees in EM has been
reported as improving EM systems such as efficient resource usage (Florida and
Davison, 2001); reducing waste (May and Flannery, 1995); and reducing pollution
from workplaces (Kitazawa and Sarkis, 2000). Several workers in their study
concluded that individual empowerment positively influences productivity and
performance, and facilitates self-control, individual thinking, and problem-solving
skills (Renwick, 2008; Wee and Quazi, 2005). An important way in which employee
involvement and participation can be encouraged within the organization is to seek
entrepreneurs within the company who are socially or ecologically oriented known as
eco-entrepreneurs (Mandip, 2012). Eco-friendly ideas should be welcomed from all
employees irrespective of their designation which will encourage their interest in
environmental issues and make best use of applying their skills. The HR staff needs to
pressurize the management to create a participative work environment where the
Chapter 1 Introduction
19
employees are free to put up their ideas on green issues since they are the ones who in
reality are responsible for implementing ethical corporate behavior in the day-to-day
life of the organization. This means the achievement of green outcomes will largely
depend on employees‘ willingness to collaborate (Collier and Esteban, 2007), as
often, the best ideas come from the employees who work in that particular area
(Casler, Gundlach, Persons, and Zivnuska, 2010).
1.6.8 Green Job Design and Analysis
In general, job descriptions can be used to specify a number of environmental
protection related task, duties and responsibilities (Wehrmeyer, 1996; Renwick et al,
2008 and 2013). These days, some companies have incorporated environmental and
social tasks, duties and responsibilities as far as possible in each job in order to protect
the environment. In some companies, each job description includes at least one duty
related to environmental protection and also specifically includes environmental
responsibilities whenever and wherever applicable. Job descriptions and person (job)
specifications may include environmental, social, personal, and technical
requirements of the organizations as far as possible. For example, environmental
protection duties should be included, along with the allocation of environmental
reporting roles and health and safety tasks (Crosbie and Knight, 1995; Wehrmeyer,
1996; North, 1997; Revill, 2000). In addition, some companies use teamwork and
cross-functional teams as job design techniques to successfully manage the
environmental issues of the company. Nowadays many companies have designed
environmental concerned new jobs or positions in order to focus exclusively on
environmental management aspects of the organizations. From the perspective of
HRM, it is really a valuable initiation and practice to protect the environment.
Moreover, some companies have involved in designing their existing jobs in a more
environmentally friendly manner by incorporating environmental centered duties and
responsibilities. These are some of the best Green HRM practices which can figure
out under the functions called green job design and green job analysis.
Grievance and Discipline: In general terms, grievance and discipline in firms
encourages internal environmental breaches. The need to raise grievances is seen in
high risk operations (for their safety record), and in such cases disciplinary procedures
are attached to environmental rules and duties where noncompliance occurs. Indeed,

Chapter 1 Introduction
20
expert legal opinion is that some firms may eventually move to ensure that
environmental obligations are secured by including clauses in staff contracts to do so,
i.e. that environmentally unfriendly behavior may constitute a breach of contract and
therefore possible grounds for dismissal.
1.7 Advantages of Green Human Resource Management Practice
Green business decisions: Employing a green workforce or employees who
understand and practice environment-friendly practices helps the organization
take business decisions that have a wider perspective and thereby adopting
innovative strategies and techniques to arrive at an optimal solution solve
environmental related issues.
Preferred employer of choice: Green organizations are the most desired
employers and any potential hire would like to be associated with such an
employer so as to learn and add value to their profile. A Green workforce is a
win-win situation for both the employer and the employee as it gives a
competitive edge to both in the market.
Higher retention of employees: A survey by SHRM (Society for Human
Resources Management) Green Workplace Survey found out that green
organizations have lesser attrition rates as compared to their non-sustainable
counterparts. In the survey about 61% of the respondents working for an
organization known to be an advocate for green human resource management
practices said that they were "likely" or "very likely" to continue working in the
present organization because of their green policy and practices
Better Sales: Cone Communications, marketing, and public relations company
in the year 2013 conducted a survey on the Green Gap Trend where about 71 %
of Americans shoppers said they are conscious of the environment impact when
they purchase a product. This survey finding is critical to the belief that
companies that adhere to green practices can improve their sales and cut costs
by achieving higher volume of sales

Chapter 1 Introduction
21
Today many organizations are bringing GHRM practices to their business and day-to-
day operations in the global context and landscape. The innovations and research that
organizations strive in achieving a sustainable green human resource management
practice in their business would significantly contribute to the field of Human
resources management (HRM) field in both academic and business sense.
1.8 Green HRM in India: Top 10 Indian Companies
Following are the Indian companies exhibiting green GRM practices in India.
Wipro Technologies
There was a time when the Karnataka State Pollution Control Board indicted the
IT solutions arm of Wipro Limited for dumping huge volumes of hazardous
electronic waste in illegal recycling units in Bangalore.
They extended their green mission to physical infrastructure and substitute CRT
monitors with LCD monitors.
The company also had a green testing lab, practiced a Carbon Disclosure
Project (to report the internal carbon footprint), and reduced employee travel.
Wipro was the first IT Company in India to launch eco-friendly desktops and
notebook computers that adhered to the RoHS (restriction of hazardous
substances) regulation specified by the European Union (EU).
Suzlon Energy:
The ―Green Banking‖ initiative- Suzlon Energy has become the first Indian bank
to take lead in harnessing wind energy by having a tie up with State Bank of
India.
The Suzlon One Earth Campus, the corporate headquarter of Suzlon at
Hadapsar, Pune, India is the most energy efficient building built ever in India
with insulated green roof, energy efficient – lighting system, construction time,
renewable energy based hot water system, reduced landscape and building water
requirement, recycle, reuse and recharge of water, waste management and waste

Chapter 1 Introduction
22
water treatment, health and energy of occupants, carpooling, zero waste
management, green education etc. are policies practiced by the companies.
ITC Limited
ITC Ltd Sustainable Initiatives at ITC Green Products are Premium Business
Paper. For the first time in India ITC has launched an environment friendly
multipurpose paper ‗Paperkraft Premium Business Paper‘, for office and home
use using a new technology 'Ozone Treated Elemental Chlorine Free
Technology' replacing Elemental Chlorine which was conventionally used in the
bleaching process during paper manufacture.
ITC's Green Leaf Threshing plant in Chirala is the first in India and among the first
10 units in the world to bag the Social Accountability (SA 8000) certification.
HCL Technologies
HCL Technologies initiated the following practices:-
―Go Green‖- a multi-layered corporate program running campaigns to initiate
individual action towards environmental issues. It has designed and developed a
comprehensive Green Edge sustainability framework that caters to the specific
needs of manufacturing industries.
They are active members of India Council for Sustainable Development.
First company in India to launch an Antimony and Beryllium Free laptop.
The company extends its take-back service to customers for disposing off their
equipment through HCL Green Bag Campaign, and recycling collected E-waste
in an environment-friendly manner.
Tata Consultancy Services
TCS has been spotted 11th under Newsweek‘s annual rankings of the ―World‘s
Greenest Companies‖ with a Green Score of 80.4 globally.
Its 16 facilities do composting, some have bio-digesters turning waste into
kitchen fuel.
Chapter 1 Introduction
23
Oil and Natural Gas Company (ONGC)
ONGC has been ranked 39th among the world's 105 largest listed companies in
'transparency in corporate reporting' by Transparency International making it the
most transparent company in India. Project of Landscaping, designing of garden
and greening of area in the campus of Jollygrant Airport, Dehradun is started.
ONGC has many such initiatives towards Green HRM. Another one is Vadodara
Movement with Indian Express.
Idea Cellular
Idea Cellular initiated the following practices:-
‗Use Mobile, Save Paper‘ campaign
Green Pledge campaign was initiated by Idea at various Indian cities, where
thousands came forward and pledged to save paper and trees.
IndusInd Bank
Following practices have been initiated by IndusInd Bank:-
The bank is running ATMs on solar power and has pioneered an eco-savvy
change in the Indian banking sector.
The bank is planning for more such initiatives in addressing the challenges of
climate change.
Tamil Nadu Newsprint and Papers Limited (TNPL)
TNPL has installed its own power generating facility to make it 100% self-
sufficient through the installation of 61.18 MW Power Generating equipment,
viz. TG Sets, installed at the paper mill site. The surplus power generated is
being exported to the State Grid. TNPL also generates green power through the
18 MW wind farm installed at Devarkulam and Perungudi of Tirunelveli
district. The entire power generated at the wind farm is being exported to the
State Grid.

Chapter 1 Introduction
24
The innovative bio – methanation project: This project contributes to the
sustainable development in terms of generating in-house renewable energy and
reducing green – house gases.
Tata Metaliks Limited
Tata Metaliks Limited initiated the following practices:-
Every day is Environment Day
According to the company‘s policy, working on Saturdays at the corporate
office is discouraged.
Lights are also switched off during the day with the entire office depending on
sunlight.
1.9 Employee Motivation
The term motivation has its origins in the Latin word movere, which means
movement (Steers, Mowday & Shapiro, 2004). In general, motivation can be
described as something intangible, a trigger/drive inside a person that stimulates that
person to specific actions or to certain behaviour. This indicates a constant movement,
thus motivation is always directed towards something or away from something. So
employees continually seek or/and are encouraged to become better, faster etc. This
implies that there is no final goal in motivation, making it a moving target that is
never reached. This might be good for the productivity at a workplace, but in a long-
term perspective, it can be difficult to motivate employees as their demands for
‗reward/motivation‘ continuously grow.
Despite a long history and strong research traditions in the field of work motivation, a
more generally agreed and coherent definition of motivation is lacking to this day (Pinder,
1984). As the literature review reveals, there are almost as many definitions of motivation
present as the number of researchers that conducted research within the field. Pinder
(1984) points out possible reasons for the variance in definitions of motivation. Since
motivation is a complex and multifaceted subject there are many definitions present that
reflect different aspects of motivation. Furthermore, there is are a number of different
Chapter 1 Introduction
25
philosophical orientations regarding the nature of human beings and this contributes to
further variance in perception and definition of motivation.
1.9.1 Significance of Employee Motivation
The performance of any organization and its continuity depends on their key assets,
employees, as well as the capabilities of the managers to be able to create a
motivating environment for their people. On the other hand, it is a challenge for the
managers to keep their people and employees motivated and satisfied. Thus, why
every manager has to be aware about the needs and requirements their employee and
what they are looking for.
The main objective and concern of most of the organizations is to make the benefit
from people who are feeling positively toward the work and motivate unsatisfied
employees in order to end up with a win–win situation for both the company and
workers.
Urichuck (2002) stated that motivated employee will increase the capability of the
organization to achieve its mission, goals and objectives. It will also engage all to
build a strong organizational culture. Also, motivated employees will feel as having a
strategic partnership with the organization and their commitments and loyalty will
increase from day to day (Anne, 1994). Also, Buttner and Moore (1997), based on
their research about ―Happy Employees Make Productive Employees‖ found that
when employee attitudes improved by 5%, customer satisfaction jumped by 1.3%, and
the revenue increased by 5%. So, motivated employees usually produce more than
others and hence the customer satisfaction increases.
Motivated employees can impact a company‘s bottom line and make the workplace
somewhere employees look forward to interact with instead of just a place to ―pick up
a paycheck‖ (Nandanwar , Surnis, Nandanwar 2010). Furthermore, A well-motivated
organization for sure will have more motivated employees and hence they will be
more productive and this will lead to extreme cost savings (Urichuck, 2002). In
addition, satisfied employees positively impact corporate culture, resulting in many
intangible but equally important returns (Yongsun, Barbara, Christy, 2002). They also
Chapter 1 Introduction
26
sees that people, who were motivated by sending them to foreign countries in order to
live and work, are seen as valuable resource as they give more than usual when they
return.
Mansoor (2008) also sees that motivation is about creating the environment where
employees will be motivated and hence work with their full effort. So, organizations
should motivate their employees to enhance competitive advantages and reach the
firms vision and mission (Philip, Yu-Fang, Liang-Chih, 2007).
1.10 Job Satisfaction
Job Satisfaction or Employee satisfaction is utmost important in any organization be it
small or large. It plays a significant role in defining organizational success. Every
organization develops strategies that strengthen the work environment and increase
the employees' morale to enhance employees' performance and productivity, which
ultimately results in high profits, customer satisfaction as well as customer retention.
The reason behind having satisfied employees is somewhat elementary. Satisfied
employees are preferred because they simply make a work environment and
organizational climate better (Rue & Byars, 1989). There are many different practices
that an organization can perform to create a better and more effective work
environment; these practices can directly affect employee satisfaction. Some ideas
that managers are the most concerned about, are: attracting the most qualified workers
and utilizing the human capital within the organization (Hoerr, 1989). The following
points will show the importance of employee satisfaction.
1.10.1 Significance of Job Satisfaction
There is little doubt that great employees are an organization‘s number one resource.
Keeping workers happy helps strengthen a company in many ways. Employee
Satisfaction has a great impact upon the performance of an employee. (Judge,
Thoresan, Bono., & Patton, 2001) conducted an extensive meta-analysis about the
relationship between these two critical organizational factors and concluded true
correlation between employee satisfaction and employee performance. Performance
of the job by an employee also requires that his expectations and aspirations in terms
of rewards, consideration and fulfilment of his needs etc. can be met. If these are
Chapter 1 Introduction
27
fulfilled, he/she will be satisfied with the outcome of job performance and greater
employee satisfaction would generally motivate the employees in performing their
tasks more efficiently and that results in increasing company‘s productivity.
There is a casual relationship between employee satisfaction and employee morale.
Michigan Psychologist Norman R. F. Maier states that ―Job Satisfaction was shown to be
important by demonstrating that morale index was definitely higher among employees
who were satisfied than among those who were dissatisfied‖ (Norman, 1925).
Satisfied employees cultivate positive mental attitude which is beneficial to the
society as a whole. A happy human on the job is also happy away from the job.
Dissatisfaction with one‘s job may have especially volatile spill over effect on many
other things such as family life, leisure activities etc. Happiness is after all the heart of
human life which spins off to the society in general. The dissatisfied employees take
more ―Mental health days off i.e. days off not due to illness or personal reason.‖ The
time thus being a non-renewal resource, the ultimate sufferer is the organization
(Breaugh, 1981).
Employee satisfaction plays a very vital role on the performance of an organization. It
is essential to know as to how employees can be retained through making them
satisfied and motivated to achieve extraordinary results. Target and achievement
depend on employee satisfaction and in turn contribute for organizational success and
growth enhances the productivity and increases the quality of work (Johns, 2002).
1.11 Organisational Commitment
According to Mowday, Steers and Porter‘s (1979) definition, Organisational
Commitment entails three factors: 1) a strong belief in and acceptance of the
organisation‘s goals and values, 2) a willingness to exert considerable effort on behalf
of the organisation and 3) a strong desire to maintain membership in the organisation.
Meyer and Allen (1991) defined Organisational Commitment as reflecting three broad
themes: Affective, Continuance, and Normative. Thus, commitment is viewed as
reflecting an affective orientation toward the organisation, recognition of the costs

Chapter 1 Introduction
28
associated with leaving the organisation, and a moral obligation to remain with the
organisation.
Subsequently, many definitions have been proposed for the commitment concept, but
a recurring strand seems to be the idea of a psychological bond - an intrinsic
attachment or identification of a person with something outside of oneself (Firestone
& Pennell, 1993).
O‘Reilly (1989) defines Organisational Commitment as ―an individual‘s
psychological bond to the organisation, including a sense of job involvement, loyalty
and belief in the values of the organisation‖. Organisational Commitment from this
point of view is characterised by employee‘s acceptance of organisational goals and
their willingness to exert effort on behalf of the organisation (Miller & Lee, 2001).
Chow (1994) defined Organisational Commitment as the degree to which employees
identify with their organisation and the managerial goals, and show a willingness to
invest effort, participate in decision making and internalise organisational values.
According to Meyer and Herscovitch (2001) Organisational Commitment can be
conceived as a binding force that is experienced as a mindset or as a psychological
state that leads an individual towards a particular course of action, while according to
Zangaro (2001), employees are regarded as committed to an organisation if they
willingly continue their association with the organisation and devote considerable
effort to achieving organisational goals.
Cohen (2003) states that commitment is a force that binds an individual to a course of
action of relevance to one or more targets. This general description of commitment
relates to the definition of Organisational Commitment by Arnold (2005) namely that
it is ―the relative strength of an individual‘s identification with and involvement in the
organisation‖.
1.11.1 Significance of Organisational Commitment
When the employee is committed to an organization, there can be seen many positive
outcomes for individual as well as for the organization itself. One benefit that it has
for the employee is that it has potential to influence employee‘s well-being (Meyer
Chapter 1 Introduction
29
and Herscovitch 2001). In addition, it has shown to increase employee‘s Job
Satisfaction (Vandenberg and Lance 1992 in Shahid and Azhar 2013). Organization
can benefit of committed employees in variety of ways. In a wide scale they have the
potential to influence organization‘s effectiveness (Meyer and Herscovitch 2001).
Employees are less likely to leave the organization reducing the turnover (Allen and
Meyer 1990). Equally important, Shahid and Azhar (2013) state that committed
employees can often make things work even without very good systems and are key
for higher productivity in the organizations.
Organisational Commitment should result in improved relationships and performance
of the organization (Rylander 2003). Especially affective Organisational Commitment
has been shown to correlate positively with the measures of organizational
performance (Wright, Gardner, Moynihan and Allen 2005). In their study Wright et
al. used six 21 measures of performance. Those were workers compensation, quality,
shrinkage, productivity, operating expenses and profitability. There was strong
correlation between all of these measures of organizational performance and affective
Organisational Commitment. (Wright et al. 2005) However, there has to be more
research conducted to be certain about the causality of these two. In other words, there
are some doubts about which one is causing the other one to happen (Mayer 2012).
After conducting meta-analysis of the studies conducted on Organisational
Commitment Mathieu and Zajac (1990) found consequences of Organisational
Commitment to be related to job performance and withdrawal behavior, such as
intention to search for alternatives, intention to leave and turnover (Mathieu and Zajac
1990). Therefore, not only employees will manage their work better but also they are
less likely to leave the organization.
Chapter one provides the introduction to Green HRM its practices, Employee
Motivation, Job Satisfaction, and employee commitment. Chapter one also presents
the benefits of adopting Green Human Resource Management practices. The
following chapter discusses the literature review on Green HRM practices and various
theories proposed by the researchers on Employee Motivation, Job Satisfaction, and
employee commitment.

Chapter 2 Review of Literature
30
CHAPTER 2
REVIEW OF LITERATURE
Review of literature is an important step in the process of research. No scientific
research can start abruptly. All scientific study stems out as a result of the
consolidation of a host of knowledge already gathered by various pioneers in that
field. In the light of the earlier researches the problem can be viewed in different
perspectives. Keeping this in mind, the investigator has collected relevant research
done on the topic under study. An attempt is made to highlight the procedure and
findings of researches conducted earlier that have a bearing on the present study.
2.1 Introduction
Despite a growing body of research, which has added to the nomological net of GHRM,
the concept and its defining idiom remains somewhat vague. Different terms have been
used to discuss the environmental consequences of HRM, with Green HRM examined
as part of a strategic HRM focus that targets employees green behaviors. However, to
date the fundamental task of evaluating and clearly defining the contemporary
management construct it has been neglected, and it remains rather ambiguous as to how
GHRM fits into the broad concepts of EM, CSR and strategic HRM, or how GHRM
differs from sustainable HRM or socially responsible HRM (SRHRM). Moreover,
current literature has thus far failed to clarify the motivation, impact and consequences
of implementing GHRM.
Scholars have sought to clarify and define GHRM by reviewing and applying
analogous constructs from contemporary literature such as EM, HRM, Sustainable
HRM (Cohen et al., 2010; Ehnert, 2009), SRHRM (Shen, 2011; Shen and Benson,
2014), and CSR (Jackson et al., 2011; Kramar, 2014; Renwick et al., 2013). Exactly
what constitutes GHRM is still in dispute, although there is a generalizability clearly
identified within the literature, with environmental sustainability found to be a key
component of the construct (Dubois and Dubois, 2012; Kramar, 2013).
Chapter 2 Review of Literature
31
While the environmental implications of HRM have been widely discussed in the
literature (Daily and Huang, 2001), there is no clear-cut definition of the term GHRM.
Some researchers have used the term without explicitly defining the concept (see for
example Jackson et al., 2011) with other researchers using it interchangeably with
sustainable and strategic HRM (Jackson and Seo, 2010; Lis, 2012). Among those
scholars that have sought to explicitly define the term, the definitions range from
general,‗HRM aspects of environmental management‘ (Renwick et al., 2013), to more
specific interpretations such as ―use of HRM policies, philosophies and practices to
promote the sustainable use of resources and prevent harm arising from
environmental concerns within business organizations‖ (Zoogah, 2011).
GHRM is unlike other contemporary management constructs. Human resource
management focuses on general people management strategies (Shen, 2011), CSR
focuses on the moral and ethical basis of corporate social policy (Dahlsrud, 2006) and
EM‘s key goal is to reduce environmental impacts through integrating business and
environmental practices (Cramer, 1998; Ormazabal and Sarriegi, 2012). However, the
application of GHRM is aimed at developing processes and activities designed to
influence employee skills, knowledge, motivations and behaviors to achieve
organizational environmental objectives and green goals (Prathima. M and Misra,
2012; Renwick et al., 2013).
The definition from Zoogah (2011) restricts the application of GHRM to business
organizations, which limits the scope of the concept and its potential application. In
order to effectively define GHRM, there are several things that should be considered
such as what, how, and why. Specifically, what are the attributes that make up GHRM
how do organizations aim to achieve desirable outcomes through the application of
GHRM, and why would organizations engage with green strategies, and adopt
GHRM?
The literature acknowledges that GHRM falls somewhere between sustainable and
strategic HRM, with Ehnert and Harry (2012) claiming there are two arguments that
support the importance of sustainability to HRM. Firstly, the relationship of an
organization to both its economic and social environment is inextricably linked to the
Chapter 2 Review of Literature
32
macro level societal and ecological sustainability debate. As such, the role of HR is to
develop the social discourse on the importance of sustainability, in order to contribute
to corporate sustainability policy and strategic development (Ehnert and Harry, 2012).
Secondly, from a micro perspective, HRM is conjointly linked to individual and
internal organizational elements such as scarce resources, employee behaviors, aging
workforces and work-related health issues. Having a HRM system that fosters
sustainability, allows firms to address the aforementioned issues while retaining a
high quality workforce (Ehnert and Harry, 2012).
In addition to the academic literature, Taj (2011) offers subjective opinions of how
GHRM is definitively viewed from a business executive‘s perspective. Ashok
Ramachandran, HR Director of Vodafone Essar Ltd. claims that ‗Green human
resources could very well imply using every employee touch point/interface to
promote sustainable practices and increase employee awareness. GHRM reflects the
way an organisation chooses to drive and increase employee commitments and
awareness on the issues of sustainability‘ (Taj, 2011).
Anjana Nath, Regional Head of HR in Fortis Healthcare Ltd. suggests that ―GHRM can
be defined as environmentally friendly HR initiatives resulting in greater efficiencies,
lower costs and better employee engagement. Human resources plays a key role as it
creates awareness amongst employees and builds engagement, which in turn, helps
organisations to operate in an environmentally sustainable fashion‖ (Taj, 2011).
Jyorden T. Misra, Managing Director Spearhead InterSearch, believes that ‗Eco-
consciousness or the colour ‗green‘ is rapidly emerging in every dimension of our
lives and workplaces are increasingly displaying an organised response to this
challenge by bringing in ‗professional consciousness‘ at an institutional level as well
as individual employee level. Green HRM is one, which involves two essential
elements: environmentally friendly HR practices and the preservation of knowledge
capital. The HR of the organisation plays a major role in making environmental
responsibility a part of an organisation‘s mission statement‘ (Taj, 2011).

Chapter 2 Review of Literature
33
Business perspectives provide a pragmatic view of the role of the GHRM concept in
today‘s corporate world, with these perspectives not considered formal definitions of
GHRM. Instead, these corporate worldviews on GHRM adds to the body of
knowledge regarding the existence, acceptance and role of GHRM in today‘s
workplace. The above perspectives encompass the key components of current
academic definitions, including sustainability, preserving knowledge capital,
employee commitment and organizational and individual level engagement.
Analogous concepts that are synergistically linked to GHRM are sustainable HRM
and Socially Responsible Human Resource Management (SRHRM) (Kramar, 2014;
Shen and Benson, 2014). Kramar (2014) states that the term ‗sustainable HRM‘ has
not been clearly defined, but encompasses several terms that link sustainability with
HRM. The terms exploited within the sustainable HRM construct are: sustainable
work systems; HR sustainability; sustainable management of HR; sustainable
leadership and sustainable organizations (Kramar, 2014). The overriding
correlations between these sustainability terms, according to Kramar (2014), is that
they acknowledge both explicitly and implicitly the social and human outcomes of a
sustainable approach to HRM. A key outcome of sustainable HRM is that it should
contribute to developing an organization‘s human and social capital. Using this
dialogue, the clear delineation between GHRM and sustainable HRM, is that GHRM
specifically targets green organizational outcomes including encouraging employee
green behaviors and attitudes rather than general employee developmental outcomes
as highlighted in sustainable HRM.
While the SRHRM concept is not explicitly seeking to promote employee green
workplace behavior, SRHRM does have some concordance with the GHRM concept.
Shen and Benson (2014) define SRHRM quite simply as: ―corporate social
responsibility (CSR) directed at employees‖.
Socially responsible human resource management promotes above average salaries
and working conditions, specific CSR training, and performance and appraisal, and
remuneration should consider the social contributions made by employees (Shen and
Benson, 2014). Comparing both GHRM and SRHRM, the key differences between

Chapter 2 Review of Literature
34
the two constructs, is that GHRM has specific environmental and green targeted
objectives, whereas SRHRM has socially responsible outcomes including workplace
equality and pollution prevention without an exclusive employee green behavioral or
green goal focus (Royle, 2005).
As Renwick et al. (2013) have established, GHRM has been augmented to enhance
the green behaviors, attitudes and capabilities of employees, to motivate workers to
think green, and to provide opportunities for employees to build knowledge and skills
associated with environmental sustainability. Taking into consideration the previous
discourse, as well as current definitions of GHRM and analogous concepts, this thesis
defines GHRM as ‗HRM strategies, policies, processes and activities that aim at
generating positive environmentally associated outcomes for an organisation‘.
The underlying goals of GHRM using existing definitions, is to identify and
implement appropriate green associated practices designed to change the way
companies‘ actions and decisions affect the environment. This can be done by way of
increasing operational efficiencies, using energy and water resources responsibly and
changing employee attitudes to understand, embrace and acknowledge the importance
of responsible green related behaviors. However, based on the above discussions, and
the current undefined nature of the GHRM construct, the extent literature is
considered to be somewhat inconclusive. Ongoing debates on how best to define
GHRM continue, with little clarity in regards to its actual application or veritable
workplace consequences.
2.2 The Role of Human Resource Management in Greening the Firm
Today, ―being green‖ has become a norm (Margaretha and Saragih, 2013); greening is
a holistic process aimed at smarter energy usage, low costs, low wastage using
sustainable resources or recyclable materials for end results that are products, targets,
etc. (Jafri, 2012). A Green Workplace is environmentally sensitive, resource efficient
and socially responsible (Sathyapriya et al., 2013). In addition, it incorporates a
virtual workplace and green buildings. A Green Workplace could have one or more of
the following components: written environmental policy, specific targets for

Chapter 2 Review of Literature
35
improving EP, publication of environmental reports, EMS, environmental purchasing
policy, environmental training and education, fossil fuel use reducing policy and
policy of reducing the use of the unsustainable product (Ramus, 2002). Google is
leading the way publicizing their environmental record and in its environmental
practices (Kaur, 2013).
Over the last three decades, organization‘s relationship with the environment has been
largely defined by environmental regulations. How organizations, primarily in
developed countries, respond to the demands of environmental law has determined
their relationship with the environment (Aragon-Correa and Sharma, 2003). Past
research had developed various classifications for the relationship between business
and the natural environment (Jabbour and Santos, 2006; Aragon-Correa and Sharma,
2003; Staffelbach et al., 2012). In general, ―corporate strategies for managing the
natural environment can be classified along a continuum that ranges from reactive to
proactive‖ (Aragon-Correa and Sharma, 2003).
Jabbour and Santos (2006) classified environmental strategies into three types:
(1) Functional specialization of environmental dimension (or reactive stage); occurs
when the area of EM created is strongly linked to the need of meeting legislative
demands and with an isolated position within an organization;
(2) Internal integration of environmental dimension (or preventive stage); occurs
when the organizational areas‘ involvement in EM increases; however, the
environmental dimension is not considered systematically strategic;
(3) External integration of the environmental variable (or proactive stage); occurs
when all the areas of a company are designed to explore competitive advantages
systematically by using principles and tools of EM.
The evolution of EM throughout these stages depends on the contributions of HRM
(Ferna´ndez et al., 2003). Obviously, proactive stage requires a huge amount of effort
for training and restructuring the employees through HRM function involvement, since
the company aims for a better and deeper understanding of the environmental issues.

Chapter 2 Review of Literature
36
Staffelbach et al. (2012) described the HR functions roles that can support the
organization greening. These are:
(1) Strategic partner who understands the business model and gather the relevant
stakeholders (including employees, customers, shareholders, and society)
together and encourage the dialogue between them, also shares with the
managers‘ strategies, the value of human resources and the consequences of
managing people effectively.
(2) Innovator who enables the organization to develop the learning culture, guiding
and directing people and does not just copy what others are doing and
contributes special knowledge on environmental aspects to the initiative;
(3) Collaborator who brings specific competencies of each function together to
make a win-win situation understands how to build win-win situations,
cooperates and supports and works task-oriented across internal and external
organizational constraints.
(4) Change Facilitator who manage and supervises the implementation of the
initiative and is aware of the need for change and creates favorable conditions in
the organization for it, helps leading changes in strategy and energizes others for
the desired change.
Opatha and Arulrajah (2014) mentioned four roles for an employee to become a green
employee; which are: a preservationist, conservationist, non-polluter, and maker. The
preservationist is the one who protect the natural environment from harm loss, or
negative change and keep it in its original; Conservationist is the one who treat natural
environment very carefully and use it at the minimum level in order to let it last as
long as possible so that future generations will be able to utilize it.
Non-polluter, is the guardian who stops any behaviors and outcomes that could
endanger the planet/earth where humans and non-humans are living through
preventing from (or minimizing) contaminating the water, air, atmosphere, etc.
through unpleasant and poisonous substances and wastes. Maker is the employee who

Chapter 2 Review of Literature
37
intentionally builds parks and places which have plants, trees, and grass. A Green
employee is a nature-lover or an eco-activist (Opatha and Arulrajah, 2014).
In the area of environmental affairs, HRM practices can aid in balancing corporate
values, financial goals and environmental strategy and in ensuring that employees
implement this balanced strategy consistently across the organization (Cohen et al.,
2012). The responsibility of the present generations, HR managers is to create
awareness amongst the youngsters and among the people working for the organization
about the GHRM (Shaikh, 2012). Through being an advocator; HR managers should
initiate the environmental sustainability concept and employee‘s involvement in
environmental-friendly activities in the organization, and guidelines to managers in
terms of gaining full staff co-operation towards implementing environmental policies
which means HR needs to nurture supporters and create networks of problem-solvers
willing to act to change the current status quo (Mandip, 2012).
It‘s important to include greener activities in every step of HRM activities; once it
becomes a daily activity then it will be treated as a culture. Similarly, Jabbour and
Santos (2008b) also stated that superior Environmental Policy (EP) outcome requires
HRM practices that support the whole implementation and maintenance of
Environmental Management System (EMS) in the organizations, where supportive
HRM practices such as top management support, environmental training,
empowerment, and rewards are likely to be critical to the successful implementation
of policies and initiatives associated with an EMS (Daily and Huang, 2001;
Govindarajulu and Daily, 2004). The development of products with lower
environmental impact requires the support of HRM (Govindarajulu and Daily, 2004;
Jabbour et al., 2008); many research support the idea that companies which pay
attention to the greening of human factors may be more productive, thus gaining a
competitive advantage (Jackson and Seo, 2010; Paille et al., 2013b), in contrast with
other organization that is not using full range of GHRM will have potential limitation
in the effectiveness of total environmental improvement (Renwick et al., 2012).

Chapter 2 Review of Literature
38
To build a green organization, the organization, and HRM must increase efficiencies
in organizational hierarchies, perform more virtualized work or eliminate unnecessary
time spent in the office and optimizing the use of company resources, including
travel, etc. Also, companies that are supporting greener options include
telecommuting, flexible work schedules (Sathyapriya et al., 2013). In GHRM,
researchers have asserted the importance through all the functions of HRM ranging
from of staffing, job analysis, environmental training and communication,
participation, empowerment, recognition and compensation, the performance of EM
programs, performance appraisal and use of technology (Paille et al., 2014; Kapil,
2015a; Renwick et al., 2008).
Against this backdrop, it can be assumed that GHRM is all about the holistic
application of the concept of sustainability to the organization and its workforce. It
involves green actions focused on increasing efficiency within processes, reducing
and eliminating environmental waste, and revamping HR products, tools, and
procedures resulting in greater efficiency and lower costs. The results included:
electronic filing, ride sharing, job sharing, teleconferencing and virtual interviews,
recycling, telecommuting, online training, and developing more energy-efficient
office spaces (Sharma, 2015). In fact, GHRM promotes various Green processes and
practices in different HR functions. Some of the practices concerning Green
management in which HR is actively involved have been described below.
2.3 Green HRM practices
To meet the demands and environmental objectives of company executives and other
stakeholders, HR managers need to ensure that the firm‘s proposed GHRM strategies
and programs address key environmental objectives by:
• Positively responding to emerging societal and social trends
• Delivering on its sustainable targets
• Developing a process whereby an employee‘s green performance can be
accurately assessed

Chapter 2 Review of Literature
39
• Keeping abreast of constantly changing environmentally related government
policies, programs and legislation
• Promptly responding to regulatory requirements and stakeholder concerns
• Influencing corporate and public policy agendas (where possible) and
• Meeting organizational sustainability goals (Garavan and McGuire, 2010;
Jackson and Seo, 2010; Renwick et al., 2013).
Despite the claims of the importance of employees to a firm‘s performance and
organizational outcomes, most organizations have ignored the contributions and the
potential of key HRM practices to achieve a firm‘s green goals (Carmona-Moreno et
al., 2012; Luthans and Youssef, 2004). According to Muster and Schrader (2011), it is
important for organizations to transform green aspirations and mere good intentions to
genuine organizational policy and workplace behavior reform, if organizations expect
to improve the firm‘s environmental performance. Put succinctly, Wehrmeyer (1996)
states that, ‗if a company is to adopt an environmentally-aware approach to its
activities, the employees are the key to its success or failure‘.
Hallahan (2000) suggests that the Ability-Motivation-Opportunity (AMO) framework
can explain how the objectives of HRM and potentially GHRM, are derived through
the implementation of HR activities and practices. The AMO framework suggests that
individual‘s process information through three specific factors: ability, motivation and
opportunity (Boselie, Dietz and Boon, 2005). Ability refers to the skills that an
individual uses to process the message; motivation serves to heighten the interest of
the individual to process a particular message, and opportunity focuses on the
executional factors of the message being broadcast from the organization (Halllahan,
2000). Put simply, HR practitioners must make the GHRM message:
1) Simple enough to tap into individual cognitive abilities
2) Attractive enough to encourage individualEmployee Motivation and
3) Unmistakably structured so that the message optimizes the likelihood of the
message being successfully processed (Hallahan, 2000).
A study by Lee (2009) was conducted to explore the process of green management
adoption by firms, with some interesting findings in regards to how employees
perceived the effects of organizational green initiatives on workplace related tasks.

Chapter 2 Review of Literature
40
Lee‘s study of some Korean small-medium enterprises (SME) in the manufacturing
sector, found that employees had negative attitudes toward green management
initiatives. This was largely due to the perception that green initiatives would be a
higher impost on their time and result in higher personal workloads. To address
these perceptions, management responded by introducing a number of HRM
processes and practices involving specific environmental training and knowledge
building activities that highlighted the importance of green programs and their
benefits to the firm, as well as demonstrating that employee workloads would not be
adversely affected (Lee, 2009). At the completion of the environmentally related
workplace training, results showed a significant improvement in employee attitudes
and behavior toward green management initiatives.
Lee (2009) study goes some way to demonstrate what Hallahan (2000) highlighted in
an earlier study. Using targeted GHRM training, firms could overtly demonstrate that
there would be no increase to workloads or personal time and succinctly explain the
benefits of green strategies. This approach can transform the mindsets of the
employees resulting in positive engagement and improvements in employee behaviors
and attitudes toward the firm‘s green agenda. However, further empirical evidence is
needed to validate these findings across industries, nations and cultures. In addition,
researchers need to explicitly explore the application and effects of GHRM processes,
practices and activities on organizational outcomes.
Dubois and Dubois (2012) also support the argument that HRM is key to implementing a
successful GHRM agenda. Embedding environmental sustainability programs into an
organization requires HR managers to be ―design architects for the varied HRM systems,
policies and activities that are needed to prepare employees to engage and contribute
meaningfully to the accomplishment of environmental sustainability goals‖.
Carmona-Moreno et al. (2012) support Dubois and Dubois (2012) and suggest that
HRM facilitates the achievement of environmental objectives through targeted
GHRM practices and activities including appropriate rewards systems, targeted
recruitment and training and promotional opportunities. Essentially, these claims
support the AMO framework as put forward by Hallahan (2000).
Renwick et al. (2013) analyzed the separate literatures of EM and HRM and
constructed a list of GHRM activities (see Table 2.2). However, this list of GHRM

Chapter 2 Review of Literature
41
activities and practices is not considered exhaustive. This recent list did not include
exploring the reasons why employees exit the firm, as first highlighted by Renwick et
al. (2008). Understanding if employees exit the firm because the firm is ‗not green
enough‘, as an example, could facilitate organizations to embrace green management
and GHRM so as to maintain a high quality and highly skilled workforce. The
Renwick et al. (2013) list includes the HR activities discussed in this study:
recruitment and selection; training and development; performance management and
rewards and compensation, which are considered to be the key HRM practices most
likely to advance employee green workplace behaviors.
Opatha and Arulrajha (2014) summarized the basic Green HR functions. See Table 2.1.
Table 2.1: Some HRM Functions and Ways of Making them Green
HRM function Green policies, procedures, or practices
Job Analysis
To include environmental dimension as a duty in job description.
To include green competencies as a special component in job specification.
To include environmental dimension as a duty in job description.
To include green competencies as a special component in job specification.
To include environmental dimension as a duty in job description.
To include green competencies as a special component in job specification.
Recruitment
To include environmental criteria in the recruitment messages.
To communicate the employer‘s concern about greening through recruitment
efforts.
Selection
To select applicants who are sufficiently aware of greening to fill job vacancies.
To select applicants who have been engaging in greening as consumers under
their private life domain.
Induction
To make new employees familiar with greening efforts of the organization
To develop induction programs showing green citizenship behaviour of current
employees.
Training
To impart right knowledge and skills about greening (the four green roles) to
each employee through a training program exclusively designed for greening.
To do training needs analyses to identify green training needs of employees.
Performance
evaluation
To evaluate employee‘s job performance according to green-related criteria.
To include a separate component for progress on greening in the performance
feedback interview
Rewards
management
To give financial incentives to employees for their good green performance of
job.
To give non-financial rewards such as praises and recognitions to employees for
their greening.
Discipline
management
To formulate and publish rules of conduct relating to greening.
To develop a progressive disciplinary system to punish employees who violate
the rules of green conduct.
Source: Opatha and Arulrajha (2014)

Chapter 2 Review of Literature
42
To formulate and publish rules of conduct relating to greening.
To develop a progressive disciplinary system to punish employees who violate the
rules of green conduct
In order to implement an effective green corporate culture, it is important to promote a
great deal of technical and management skills among all employees of the organization.
It would be ideal to have effective human resource management practices including
stringent recruitment strategies, appraisal and reward systems which include
environmental awareness and implementation in their evaluation process and training
and empowerment programs, which will enable the development of relevant set of skills
and competencies amongst the employees of ―pro green‖ firms.
2.3.1 Green Recruitment and Selection
In general, environment concerned companies have their own environmental policy
framework. In materializing the established environmental policies, companies need
environmentally oriented workforce. In creating environmental oriented workforce,
companies have two options: First is focusing on green recruitment. Second is
providing required environmental protection related awareness, education, training
and development to the existing workforce. The first option is more proactive and cost
effective than the second option. Hence, searching best green recruitment practices is
important to organizations. In the recruitment context, what some companies are
doing is that they integrate corporate environmental policy and strategies with the
recruitment policy of the company. A survey by the British Carbon Trust confirms
that most of the employees (more than 75%) considering working for an organisation
perceived it as important that they have an active environmental policy to reduce
carbon emissions (Clarke, 2006).
On the other hand, potential employees also search and want to work in the
environmental concerned organizations. In United Kingdom environmental issues
have an impact on organizations‟ recruitment efforts, and according to a survey high-
achieving graduates judge the environmental performance and reputation of a
company as a criterion for decision-making when applying for job vacancies

Chapter 2 Review of Literature
43
(Wehrmeyer, 1996; Oates, 1996). The Chartered Institute of Personnel and
Development (CIPD) believe in that becoming a green employer may improve
employer branding, company image and is a useful way to attract potential employees
who have environmental orientation (CIPD, 2007).
Attracting environmentally aware talent might be facilitated by pro-active branding of
the organization as a high-quality ―green employer of choice‖ (Renwick et al, 2008;
Jackson et al, 2011). Increasingly, firms are beginning to recognize that gaining a
reputation as a green employer is an effective way to attract new talent (Phillips,
2007; Stringer, 2009). Really, environmentally responsible employers can attract
talent that they needed to implement corporate environmental management initiatives
and ultimately it contributes to achieve organization's environmental goals.
As already established, few studies exist that have empirically tested HRM practices
within the parameters of GHRM. However, to provide some level of perspective,
there are a few available EM and CSR related studies, which suggest that employees
are attracted to firms who have a strong environmental and CSR image (Backhaus,
Stone and Heiner, 2002; Jones, Willness and Madey, 2013). In addition, organisations
that have a green strategic focus and a strong CSR reputation are able to use this as a
form of organizational leverage during recruitment and selection processes. Bansal
and Roth (2000), Kane (2011) and Renwick et al. (2013) support this assumption and
claim that firms can procure a competitive advantage by using their socially
responsible green reputations. This is because employees with high levels of skills,
abilities and education are unambiguously attracted to working for ethically diligent
and environmentally responsible organisations.
In the selection context, when making selection for the job vacancies some companies
consider candidates‟ environmental concern and interest as selection criteria. When
interviewing candidates or evaluating them for selection, environmental-related
questions are asked by those companies (Crosbie and Knight, 1995; Wehrmeyer, 1996;
North, 1997; Revill, 2000). Really, these are some of the good green selection practices
any organisation can adopt to select environmental friendly people in addition to the
normal selection criteria relating to the specific duties of the job being concerned. Table
4 shows a list of the existing HRM practices under the green selection.

Chapter 2 Review of Literature
44
2.3.2 Green Training and Development
Of all the HRM and GHRM activities highlighted in the literature so far, training has
been identified as a crucial factor to achieving organizational green outcomes (Cantor,
Morrow and Montabon, 2012; Madsen and Ulhoi, 2001; Teixeira et al., 2012). Lee
(2009), Renwick et al. (2013) and the Trade Union Congress (TUC) (2014) suggest
that Green Training and Development programs are likely to:
Increase knowledge, expertise and skills
Induce an employee‘s emotional involvement in green initiatives through
increased awareness of the effects of poor behavior and attitudes toward the
environment
Develop high level skills and attitudes for managers and supervisors and
Tap into an employee‘s implied environmental knowledge.
Training and development is related with improvement or advancement of the job or job
holder‘s responsibility. Training is the best way of getting something new and new idea,
concept and Knowledge. Training is the provision of getting the skilled knowledge and
skills whatever to increase the level of responsibility. Training provides the general
guidelines to employees for doing the work or accomplishing the organizational
objectives. Training is a systematic process of changing the behavior, knowledge and/or
motivation of present employees to improve the match between employee characteristics
and employment requirement. Training is the process by which employees learn skills,
techniques, information and behaviors needed to do their specific tasks or jobs. According
to M. Armstrong- "Training is the systematic development of knowledge, skill and
attitudes required by an individual to perform adequately a given task or job". Training is
socialize the workers to the introduction of the organization and objectives of the
organization. There is positive relationship between the employee's performance
recognize and evaluation and training and motivation.
Training is focusing on fixing a specific issue (Doyle, 1997). Training is anything
offering learning experience highly related with motivation and Motivation is highly
related with the production and productivity of the organization. When the workers

Chapter 2 Review of Literature
45
get the training and the potentiality of worker is getting increased day by day.
Training is related with the production and productivity and Organisational
Commitment. Human resource management regards training and development as a
function concerned with organizational activity aimed at bettering the job
performance of individuals and groups in organizational settings. Training and
development can be described as "an educational process which involves the
sharpening of skills, concepts, changing of attitude and gaining more knowledge to
enhance the performance of employees" (Kashmir Observer. Retrieved 2016).
The field has gone by several names, including "Human Resource Development",
"Human Capital Development" and "Learning and Development". And when the
training is provided to the employees the ultimate benefits goes the employers or the
organization such as increasing the production and productivity, less supervision,
More Job Satisfaction and less turnover with low abestieesm and also it helps the skill
development of the employees.
No studies have implicitly explored the effects of GHRM training and development
practices on employee workplace outcomes. However, there are notable papers that
highlight the importance of training to organizational green outcomes (Paillé et al.,
2014; Renwick et al., 2013; Teixeira et al., 2012). A recent study by Cantor et al.
(2012) confirmed the findings by Sarkis, Gonzalez-Torre and Adenso-Diaz (2010),
which found that organisations that support targeted HR training programs encourage
employees to engage with EM initiatives. To support these claims, Cantor et al.
(2012) suggests that POS increases an employee‘s perception of the firm‘s
commitment to their individual development, which then results in the exhibition of
employee green behaviors.
In step with EM and green management (Dwyer, 2009; Lee, 2009), employee training
and development related studies, Huffman et al. (2009) and Paillé et al. (2014) claim
that organisations need to have specialised environmental training and development
programs to achieve desirable green outcomes. Govindarajulu and Daily (2004) state
that insufficient or unsatisfactory training will likely result in employees who are
unwilling and/or unable to participate in organizational environmental efforts. Firms
Chapter 2 Review of Literature
46
need to provide adequate resources and technical assistance necessary to implement
green programs and initiatives. Despite the optimistic conjecture of the anticipated
effects of green training, surprisingly, these claims have not been empirically tested
within the GHRM domain.
Consistent with the literature (Lawrence and Morell, 1995; Lee, 2009; Paillé et al.,
2014) and the GHRM practices as highlighted by Renwick et al. (2013), it is
concluded that for firms to benefit from GHRM, organizational training and
development processes should be designed to:
Develop programs that build the technical and management capabilities and skills
of employees associated with green management
Ensure that employees acknowledge their ability (or inability) to undertake
required tasks. If the employee is adequately trained, this should positively affect
individual motivation, engagement and drive to achieve organizational green
goals. Conversely, if an employee has not received adequate training they are less
likely to be motivated to achieve the organisation‘s green goals
Develop employee knowledge about the effects of individual behavior on the
environment to induce an employee‘s emotional involvement, engagement and
contribution to organizational green initiatives
Increase the green knowledge of leaders, managers and supervisors as they are
effective messengers of organizational policies to frontline employees and by
having managers and supervisors overtly display green behaviors, this
demonstrates to employees what are the behaviors and attitudes desired by the
organisation, and what is expected of employees in the workplace.
2.3.3 Green Reward Management
Renwick et al. (2013) have identified a range of GHRM activities related to employee
rewards and compensation that are expected to positively contribute toward the
achievement of green goals. In particular, Renwick et al. (2013) claim that firms need to:
Reward employees for making suggestions for environmental improvements
Encourage skills development and reward employees with skills-based pay

Chapter 2 Review of Literature
47
Monetarily reward managers for meeting EM based KPIs and
Recognise employee efforts with monetary and/or non-monetary awards including
incentives such as gifts and time off work.
While no empirical research has been conducted on the effects of GHRM and rewards
and incentives, green management studies have edified researchers on the potential
benefits of pursuing such a strategy. Merriman and Sen (2012) suggest that pay
incentives increase a manager‘s propensity to enact environmental initiatives, with
direct incentives having more impact than indirect incentives that were associated
with complementarity. However, incentive effects were undermined by saliently held
social norms that managers expressed toward the environment. In other words, if
managers already held strong views for environmental protection, the less effect an
incentive would have on their decisions to display green behavior. Merriman and Sen
(2012) concluded that larger incentives could outweigh the value of social norms in
directing managers to behave more sustainably.
Ramus (2001) claims that despite evidence of praise and rewards positively influencing
green organizational outcomes, few organisations have managed to achieve
sustainability objectives, primarily due to a lack of motivation and support from
management and supervisors. Similar findings were established in a recent study by
Harvey et al. (2013), which found that pilots were dissuaded to achieve green goals
because of the lack of support from airport ground staff. Govindarajulu and Daily
(2004) suggest that rewards can be used to systematically motivate employees to
exhibit desirable green behaviors. However, organisations have failed to capitalise on
green performance opportunities because firms have not tailored reward systems that
fits the needs of individual employees, nor have they rewarded or recognised
employees for innovative green initiatives beyond formalised KPI requirements.
Cantor et al. (2012) found in their study of supply chain employees that employees did
not perceive merely the presence of rewards for environmental behavior as a signal that
the organisation was supportive of environmental initiatives. Rather, the study found
that if employees perceive there to be a lack of legitimacy from the firm to actually

Chapter 2 Review of Literature
48
reward employees for green behaviors, then this implies that the organisation does not
appreciate nor formally acknowledge the efforts of employees to achieve organizational
green goals or demonstrate green behaviors (Cantor et al., 2012). As such, until
organisations explicitly endorse rewards to employees for demonstrating green
behaviors, then rewards do not accurately signal the intent of the organisation.
The above studies have demonstrated that rewards and compensation can have a
positive effect on organizational green performance, under certain circumstances.
However, the literature is limited in its ability to apply these assumptions to frontline,
production or shop-floor workers. No identified studies were found that have explored
rewards and compensation outcomes specific to GHRM, to these particular groups of
employees. Frontline workers could provide a valuable insight and a measurable
pathway between corporate environmental strategies and green workplace outcomes,
as they often make up a large percentage of an organisation‘s workforce. In the future,
firms will need to be genuine and transparent and implement new approaches to
rewarding and compensating employees such as:
Managers providing subordinates with open and verbal feedback in regards to
successfully achieving individual employee green associated KPIs
Overtly demonstrating the firm‘s commitment to environmental initiatives
through the implementation of rewards and benefits
Rewarding employees with pay and promotional opportunities when they
undertake green skills-based development
Tailoring green rewards to fit the needs of the individual employee (i.e. non-
monetary or gifts)
Rewarding employees for innovative initiatives, such as having a company
‗green‘ suggestion box
Acknowledging, both publicly and privately, an employee‘s contribution to
improving environmental processes and

Chapter 2 Review of Literature
49
Ensuring that managers and supervisors are supportive of employee efforts to
improve the green performance of the firm and to achieve personal and
organizational green goals.
Existing green management, CSR and GHRM literature has established limited
empirical support for a relationship between GHRM and employee green workplace
behaviors (Cherian and Jacob, 2013; Harvey et al., 2013; Jabbour, 2011). However,
literature pertaining to GHRM and employee non-green workplace behaviors is
noticeably absent. The HRM behavioral (Jiang et al., 2012) literature suggests that
HRM practices are likely to influence employee behaviors through different social and
psychological processes using the Ability-Motivation-Opportunity (AMO) model. By
providing employees with the skills (abilities), motivation and opportunity to contribute
to organizational goals, which are initiated and developed through HR practices, this
maximises the likelihood that employees will perform tasks as desired by the
organisation. Using the logic as proposed by Jiang et al. (2012), GHRM will positively
influence employee workplace behaviors both within and beyond the parameters of the
green domain, through motivational social and psychological processes.
Given the potentiality these assumptions have for general and green management
research, and the practical applications and implications this has for GHRM, it is
surprising that few researchers have not sought to explore a range of organizational or
employee consequences of GHRM. Notwithstanding the assumptions of Jiang et al.
(2012), Bowen and Ostroff (2004) and other GHRM reviews such as Renwick et al.
(2013), whether GHRM does, in reality, influence green and non-green behavior
through mediating or moderating pathways, has not yet been confirmed. This is due to
a lack of supporting theory based empirical research to back up these speculative
assumptions. Exploring these links and tackling the deficiencies in the current GHRM
research as highlighted above, aims to be addressed during the course of this research.
2.3.4 Green Employee Involvement
Employee relations are that aspect of HRM which is concerned with establishing
amicable employer– employee relationship. The relationship facilitates motivation
and morale of the employees as well as, increases the productivity. Basically,
Chapter 2 Review of Literature
50
employee relations involve employee participation and empowerment activities. It
also helps prevent and resolve problems arisen at workplace that may affect the work.
In fact, positive employee relations are an intangible and enduring asset and a source
of competitive advantage for any organization.
Employee participation in Green initiatives increases the chances of better green
management as it aligns employees‘ goals, capabilities, motivations, and perceptions
with green management practices and systems. Involving employees in EM has been
reported as improving EM systems such as efficient resource usage (Florida and
Davison, 2001); reducing waste (May and Flannery, 1995); and reducing pollution
from workplaces (Kitazawa and Sarkis, 2000). Several workers in their study
concluded that individual empowerment positively influences productivity and
performance, and facilitates self-control, individual thinking, and problem-solving
skills (Renwick, 2008; Wee and Quazi, 2005).
An important way in which employee involvement and participation can be
encouraged within the organization is to seek entrepreneurs within the company who
are socially or ecologically oriented known as eco-entrepreneurs (Mandip, 2012).
Eco-friendly ideas should be welcomed from all employees irrespective of their
designation which will encourage their interest in environmental issues and make best
use of applying their skills. The HR staff needs to pressurize the management to
create a participative work environment where the employees are free to put up their
ideas on green issues since they are the ones who in reality are responsible for
implementing ethical corporate behavior in the day-to-day life of the organization.
This means the achievement of green outcomes will largely depend on employees‘
willingness to collaborate (Collier and Esteban, 2007), as often, the best ideas come
from the employees who work in that particular area (Casler, Gundlach, Persons, and
Zivnuska, 2010).
The scope of employee relations should be broadened by initiating a suggestion
scheme within the organization, wherein each and every employee from top most to
the lowest level gets an opportunity to contribute to the scheme. This practice will
help in creating greater awareness on green issues besides, new ideas for eco-friendly

Chapter 2 Review of Literature
51
practices my crop up from different sources. IBM UK has an action-team program.
This gives grants to encourage employees and their families to get involved in local
environmental project (Wehrmeyer, 1996). Other firm policies that support employee
eco-initiatives and supervisors who support employee environmental actions have
been seen in firm practice in the US and Europe, where at GE Plastics in the
Netherlands, Lucent Technologies in Pennsylvania, and Nestle Oy in Finland,
supportive behaviors from supervisors toward employees in EM are seen to encourage
employees to produce possible solutions to environmental problems (Ramus, 2001).
Other benefits of employee involvement are improvement in employee and
organizational health and safety, as well as development of eco-friendly staff. We
propose that keeping the policies in place, long-term trust among the management and
employees will be built which will provide an opportunity to the employees to express
their personal ideas at workplace and help to create climate conducive to green
management practices and systems.
Renwick et al, (2008 and 2013) suggested certain green employee relations and union
management practices. They include employee involvement and participation in green
suggestion schemes and problem-solving circles, staff independence to form and
experiment with green ideas, integrating employee involvement and participation into
maintenance (cleaning), employee help-line for guidance in green matters, tailoring Green
Employee Involvement schemes to industry/company standards, increasing
line/supervisory support behaviors in environmental management, union-management
negotiating to reach green workplace agreements, training of union representatives in
respect of environmental management aspects, encouraging employees to use green forms
of transport, set-up of low carbon chiefs (including CEO and Board) to increase action in
environmental management, and introducing green whistle-blowing and help-lines.
2.4 Theories and Models of HRM
This section discusses various models and theories of GHRM.

Chapter 2 Review of Literature
52
2.4.1 Sustainability in Human Resources Management
Today‘s approaches using the notion of sustainability in HRM and HR-related
literature deal with one or more origins of sustainability described previously. Prior
research linking sustainability and problems relevant for HRM can be traced in the
literature on Strategic HRM, Corporate Social Responsibility, Sustainable Work
Systems as well as Sustainable HRM (Mazur, 2013). The approaches identified in this
literature differ with regard to the origin of their understanding of sustainability, their
objectives, focus, and theoretical foundations (Ehnert, 2006). One of the most
interesting attempts to capture the complexity of the concept of Sustainable Human
Resource Management (SHRM) is De Prins‘ holistic model consisting of four
approaches to Sustainable HRM.
De Prins (2011) argues Sustainable HRM focuses on optimally utilizing and
respecting human workforces within the organization, in which an explicit
relationship is built between an organization‘s strategic policies and its environment.
Long-term vision and integration with an organization‘s strategy and CSR-policy are
key. Sustainability transported to the business level is referred to as Corporate
Sustainability. Even though Corporate Sustainability used to put most emphasis on the
effects businesses have on the environment, while Corporate Social Responsibility
also incorporated a social dimension, their separate paths have been noted to grow
into convergence.
De Prins distinguishes four approaches to the concept, of which the first, second and
fourth are exhibited in concrete policies; sociological, psychological, strategic human
resource management and green approaches.
2.4.2 The Sociological Approach to SHRM as Exemplified by Diversity Management
Diversity has been an evolving concept. Many writers define diversity as any
significant difference that distinguishes one individual from another description that
encompasses a broad range of overt and hidden qualities. Generally, researchers
organize diversity characteristics into four areas: personality (traits, skills and
abilities), internal (gender, race, ethnicity, I.Q., sexual orientation), external (culture,

Chapter 2 Review of Literature
53
nationality, religion, marital or parental status), and organizational (position,
department, union/non-union). The trend in defining diversity seems to favor a broad
definition, one that goes beyond the visible differences. One of the first researchers to
use this inclusive definition, R. Roosevelt Thomas, Jr., was crucial in moving
diversity thinking beyond narrow categories. He argued that to manage diversity
successfully, organizations must recognize that race and gender are only two of many
diversity factors. Managers and leaders must expand their perspective on diversity to
include a variety of other dimensions (Thomas, 1992). Workplace diversity
management, in his model, is also inclusive, defined as a ―comprehensive managerial
process for deve-loping an environment that works for all employees‖ (Thomas,
1992). This general definition also enables all staff to feel included, permitting them
to connect and fortify relationships that enable employees to deal with more
potentially volatile issues that may later arise.
Creating and applying effective diversity management concepts is one of the main
challenges in modern organizations (Mazur, 2009). Comprehensive diversity
management is a strategic approach and attitude towards understanding differences in
organizations and teams.
Diversity strategies use diversity as a strategic resource for complex problem solving
(Aretz, Hansen, 2003). By planning and implementing corporate organizational
practices in leadership and team work, potential advantages of diversity can be
maximized and disadvantages, like conflict potential, are minimized. This is achieved
by increasing ―the ability of all employees to contribute to organizational goals and to
achieve their full potential unhindered by group identities such as gender, race,
nationality, age, and departmental affiliation‖ (Cox, 1993). In light of this,
implementing strategy-oriented di-versity measures will not only raise the acceptance
towards diversity but also increase the acceptance and appreciation of new
perspectives (Aretz, Hansen, 2003). Strategic diversity measures act on various levels:
on a ―surface-level‖ (Harrison et al., 1998) and a ―deep-level‖. Aspects at the surface-
level-age, ethnicity, or physical abilities- are highly visible, easy to control, to
measure, and to explicate. In contrast, the deep-level characteristics ―values‖ or
―attitudes‖ are only expressed through behavior and behavioral patterns in

Chapter 2 Review of Literature
54
communication situations (Harrison et al., 2002). A more detailed category system
was developed by Aretz and Hansen (2003). They describe several diversity
dimensions and connected management measures based on four systems:
• The social system describes the aspects of ethnicity and gender. Connected
measures are aiming at building trust and strengthening equality;
• The organizational system provides measures for managing different age and
ability levels;
• The cultural system contains aspects like ideologies or persuasions which are
reflected in the corporate vision, mission, and values within a company. This
system level is best managed by clearly defining diversity management concepts
and actions which are communicated to all employees. Promoting a culture that
values critical dialogue, creating awareness for the connection between diversity
and complexity, or measures to overcome stereotypes may be included in such
concepts and actions; • the fourth system - the psychological system - is
characterized by aspects like education, personality as well as the work style and
mindset of people.
These characteristics can be directly linked to leadership practices within the
organization. Consequently, leading persons are responsible for implementing and
monitoring diversity processes, for clarifying requirements within this processes, and for
taking needed measures. Successful implementations of adequate diversity management
concepts can lead to higher creativity, better problem solving, and higher system
flexibility. Heterogeneous teams may generate more creative and innovative solutions and
higher employee satisfaction due to intense and effective collaboration. Still, inefficient
diversity management could trigger negative impacts and lead to manifestation of
stereotypes, communication issues, and consequently lower efficiency and effectiveness.
As organizations and teams are both systems that are depending on individuals working
towards a common vision or goal, diversity management should not only be a focus on a
management level but also on a project management level.
Diversity means dissimilarity, variety, and individuality that emerges from various
differences between people. Diversity of individual abilities, experiences,

Chapter 2 Review of Literature
55
competencies, and qualifications of human resources builds a success factor in
organizations, which enables entrepreneurial strategies of increasing flexibility and
continuous learning. Managing Diversity is more than a pro-gram. It is an attitude and
a new understanding of how enterprises function and how to manage human resources
in a sustainable way.
2.4.3 The Psychological Approach to SHRM as Exemplified by Work-Life Balance
Work-life balance is about creating and maintaining supportive and healthy work
environments, which will enable employees to keep balance between work and
personal responsibilities and thus strengthen employee loyalty and productivity.
Numerous studies have been conducted on work-life balance. According to a study
(Lowe, 2000; Lowe, Schellenberg, 2001), 1 in 4 employees experience high levels of
conflict between work and family, based on work-to-family interference and caregiver
strain. If role overload is included, then close to 60 percent of employees surveyed
experience work-family conflict. Of all the job factors that influence work-life
conflict, the amount of time spent at work seems to be the strongest and most
consistent predictor. The higher levels of work-to-family conflict reported by
managers or professionals often are a function of their longer work hours. Other
reasons include: job security, support from one‘s supervisor, support from coworkers,
work demands or overload, work-role conflict, work-role ambiguity, job
dissatisfaction, and extensive use of communication technology that blurs the
boundaries between home and work (Higgins, Duxbury, 2005). Today‘s workers have
many competing responsibilities such as work, children, housework, volunteering,
spouse and elderly parent care and this places stress on individuals, families and the
communities in which they reside. Work-life conflict is a serious problem that
impacts workers, their employers and communities. It seems that this problem is
increasing over time due to high female labor force participation rates, increasing
numbers of single parent families, the pre-dominance of the dual-earner family and
emerging trends such as elder care. It is further exasperated with globalization, aging
population, and historically low unemployment.
Long work hours and highly stressful jobs not only hamper employees‘ ability to
harmonize work and family life but also are associated with health risks, such as

Chapter 2 Review of Literature
56
increased smoking and alcohol consumption, weight gain and depression. Work-life
conflict has been associated with numerous physical and mental health implications.
Women are more likely than men to report high levels of role overload and caregiver
strain (Duxbury, Higgins, 2009). This is because women devote more hours per week
than men to non-work activities such as childcare, elder care and are more likely to
have primary responsibility for unpaid labour such as domestic work. Furthermore,
other studies show that women also experience less spousal support for their careers
than their male counterparts. Although women report higher levels of work-family
conflict than do men, the numbers of work-life conflict reported by men is increasing.
Work-life conflict has negative implications on family life. Employees, especially the
younger generation who are faced with long hours, the expectations of 24/7
connection and increasing pressure of globalization are beginning to demand changes
from their employers. Also, people in the elderly employee segment are working
longer now than in the past and are demanding different work arrangements to
accommodate their life style needs.
Employers are becoming progressively aware of the cost implications associated with
over-worked employees such as: operating and productivity costs, absenteeism,
punctuality, commitment and performance. There are five main reasons why
companies participate in work life balance programs: high return on investment,
recruitment and retention of employees, legislation, costs and union regulations.
There are a wide variety of practices currently being used to help employees achieve
work-life balance. Some work-life balance programs help employees handle stress
and otherwise cope more effectively while other programs help to reduce the absolute
stress levels by rebalancing work life. A growing number of employers have
implemented wellness programs or pay for their employees‘ gym membership as part
of a benefits package. Some companies invite fitness trainers or yoga instructors into
the office to hold lunchtime sessions. Some companies undertake initiatives to
improve employees‘ healthy eating habits. Others offer stress management programs
which include stretching, yoga, counseling, as well as bringing in Registered Massage
Therapists to work. Many employers are offering longer vacation times than the
mandatory 2 or 3 weeks per year imposed by legislation. Additionally, some

Chapter 2 Review of Literature
57
companies will offer ―flex‖ days. Interestingly, sick days tend to go down once some
is ―entitled‖ to three weeks or more a year of holidays. Human resources policies that
can be used to increase work-life balance include implementing time off in lieu of
overtime pay arrangements, providing a limited number of days of paid leave per year
for child care, elder care or personal problems, or having policies around weekend
and evening use of laptops.
There are some issues that arise when employees have flexible work hours such as
lack of facetime with other staff and not being as available to clients; these issues can
be solved by ensuring employees discuss scheduling with supervisor and let clients
and other employees know their hours of availability. Sometimes in order to
accommodate workers need for work life balance, firms may need to reduce the
amount of work given to each employee. To accomplish this, employers can hire new
people, reduce time spent in job-related travel, allow for job sharing, or reevaluate the
work itself and how it is structured and organized with work process improvements
and/or reengineering of work. Flexible scheduling is the benefit valued most by
employees. However, increased flexibility, if implemented without conditions and
used to facilitate business ends without provision for worker consent, could
compromise instead of enhance work life balance.
2.4.4 The Strategic Approach to SHRM as a Source of Sustained Competitive
Advantage
In Strategic HRM literature, attention centres on the resource-based view of the firm as a
means to explain how people (human resources), as well as HRM practices, can provide a
sustained competitive advantage. Organizations achieve a sustained competitive advantage
by implementing value-enhancing strategies that differentiate them from their competitors
and are difficult for competitors to duplicate. The resource-based view asserts that an
organization‘s competitive advantage and thus its success depends on its supply and
effective use of resources. If resources are valuable, rare, non-substitutable, and inimitable,
they are considered as important and strategic and enable the organization to gain a
sustained competitive advantage (Barney, 1991). Wright and McMahan (1992) thus argue
that human resources have the potential to be sources of sustained competitive advantage,
Chapter 2 Review of Literature
58
though they also note that to do so, the employees must be both highly skilled and
motivated - that is, a high-quality workforce.
Other research offers evidence that HRM can contribute to a sustained competitive
advantage by establishing suitable HRM practices to create and develop a high quality
workforce (Lado, Wilson, 1994; Delery, Doty, 1996). Although Wright et al. (1994)
posit that most HRM practices can be imitated and/or substituted, such that they might
not be a source of sustained competitive advantage, Lado and Wilson (1994) refute
this claim and assert instead that it is difficult to imitate HRM practices. Because they
often are firm specific and reflect the organization‘s particular circumstances, HRM
practices are not easily transferable from one organization to another.
This view seems well established in current Strategic HRM literature. Con-sequently,
human resources and their management by organizations likely are important sources
of competitive advantage, and it becomes crucial to identify ways to attract, develop,
and retain high-quality employees. Increasing employer attractiveness through
―Green‖ HRM
Potential employees‘ positive perceptions of an organization‘s reputation influence
their desire to pursue employment with the organization. Turban and Cable (2003)
shows that organizations with better reputations attracts a larger pool of job seekers
and then can select employees from an applicant pool that includes more high-quality
employees. Support for a prediction that Sustainable HRM positively influences
employer attractiveness also appears corporate social responsibility (CSR) literature.
CSR pertains to some organization‘s voluntary environmental activities in its business
operations and in interactions with stakeholders. A few studies note a positive
association between CSR and employer attractiveness; for example, Greening and
Turban (2000) show that applicants are more likely to seek employment with
environmentally responsible organizations.
Thus an employer brand contains multiple facets, all of which should express what the
organization, as an employer, represents. By establishing an employer brand,
organizations aim to provide a unique employment offering that positively
differentiates them from competitors. If they can create an image as a green place to

Chapter 2 Review of Literature
59
work, they likely can attract and retain a skilled and motivated workforce (Moroko,
Uncles, 2008). Turban and Cable (2003) shows that potential employees are willing to
accept lower salary to pursue employment with organizations that have an
environmentally positive reputation.
Finally, the organization‘s employer brand image reflects the perceptions of existing
and potential employees, so an employee perspective must be adopted to effectively
position an employer brand. As argued previously, a substance-oriented under-
standing of Sustainable HRM indicates that organizations themselves should secure
the long-term supply and ―reproduction‖ of their human resources and not rely on
supply from labor markets. From an employee‘s perspective, this securing involves
investments in the human resource base, to create value for existing and potential
employees, and there-fore enhances the organization‘s attractiveness as an employer.
Including Sustainable HRM in the employer brand thus might be a promising route to
employer attractiveness. Sustainable HRM also enhances the organization‘s ability to
attract and retain high-quality employees.
2.5 Green Human Resource Management, Employee Motivation, Job
Satisfaction and Organisational Commitment
This section attempts to review literature on GHRM, Employee Motivation, Job
Satisfaction and Organisational Commitment
2.5.1 GHRM and Employee Motivation
The term motivation represents "those psychological processes that cause the arousal,
direction and persistence of voluntary actions that are goal oriented" (Mitchell, 1982).
Motivation as defined by Robbins (1993) is the "willingness to exert high levels of
effort towards organizational goals, conditioned by effort's ability to satisfy some
individual need". The effectiveness of even highly skilled employees will be limited if
they are not motivated to perform, however, and HRM practices can affect Employee
Motivation by encouraging them to work both harder and smarter. HRM departments
use need theories that attempt to address those factors that increase motivation.
Chapter 2 Review of Literature
60
Jabbar and Abid (2014) investigated the factors that motivate employees towards
organizations environmental performance. By adopting Green human resource
management practices (GHRM), firms can play a pivotal role in promoting
environment related concerns. In this study, investigation has done on the factors that
trigger the employees to be involved in GHRM practices. The 178 respondents
(employees) of the firms that use GHRM practices have taken for research.
Convenient Sampling was used for data collection. The result of the study reveals that
HRM practices influence Employee Motivation to become involved in environmental
performance of the organization. The study also found that employees are more
motivated through monetary rewards rather than non-monetary. Supervisors support
also enhances the morale of employee to take initiatives towards environmental
sustainability. Furthermore, rewards have positive impact on employees‘ motivation
towards eco-initiatives.
2.5.2 GHRM and Job Satisfaction
The concept of employee satisfaction is a multi-dimensional and inter disciplinary
term that has been attracted the attention of researchers and practitioners from
different disciplines such as psychology, human resource management, organizational
behavior, TQM and so forth. In literature, there are a large number of studies that
analyse the term from many different perspectives and its relationship with various
organizational variables (Lund, 2003). However there is no universal definition of
employee satisfaction that exposes all these dimensions at the same time (Bernal, et.
al, 2005).Most of the definitions emphasize the importance of employees‘ job-related
perceptions that link the expectations of them and what they receive in return. Some
researchers focus on the overall Job Satisfaction or even life satisfaction of employees
(Judge, et. al, 2005) whereas some others underline a variety of satisfaction facets
such as satisfaction with pay, promotion, supervisor, or co-workers. For example,
Locke, et. al. (1969) describes Job Satisfaction a pleasurable or positive emotional
state resulting from the appraisal of one's job and job experiences. According to this,
employee satisfaction is a ―function of the perceived relationship between what one
wants from one‘s job and what one perceives it as offering‖ (Locke, 1969).
Chapter 2 Review of Literature
61
Judge, et. al, (1993), on the other hand, mentions that employee satisfaction is
positively correlated with motivation, job involvement, organizational citizenship
behavior, Organisational Commitment, life satisfaction, mental health, and job
performance, and negatively related to absenteeism, turnover, and perceived stress
and identify it as the degree to which a person feels satisfied by his/her job. Cranny,
et. al, (1992), suggests that employee satisfaction encompasses a lot of different
facets. Hence overall employee satisfaction describes a person‘s overall affective
reaction to the set of work and work-related factors whereas the facets of Job
Satisfaction involve workers‘ feelings toward different dimensions of the work and
work environment. In contrast, Rousseau (1978) identified three components of
employee satisfaction: they are characteristics of the organization, job task factors,
and personal characteristics.
According to Rousseau‘s identification the characterization of the organization and
the job task factors can be regarded as work factors in Job Satisfaction, while personal
characteristics can be regarded as non-work factors of Job Satisfaction (Hagihara, et.
al,1998).
HR practices and Job Satisfaction are studied widely in different parts of the world. It
is assumed that HR practices are closely associated with Job Satisfaction (Ting,
1997). Because many scholars and practitioners believe that sound HR practices result
in better level of Job Satisfaction which ultimately improves organizational
performance (Appelbaum, Bailey, Berg and Kalleberg, 2000). Steijn (2004) found
that HRM practices had positive effect on Job Satisfaction of the employees of Dutch
public sector whereas individual characteristics such as age, gender, and education
had insignificant effect on Job Satisfaction. Gould-William (2003) showed that use of
specific HR practices in local government organizations in the United Kingdom (UK)
was associated with a greater degree of Job Satisfaction, workplace trust,
commitment, effort, and perceived organizational performance.
Job Satisfaction is the content and commitment an employee has with his job and the
sense of accomplishment they receive from it (Kalleberg, 1997). Satisfied employees
are more willing and encouraged for playing an active role in green programs.

Chapter 2 Review of Literature
62
Satisfied employees feel responsible about the environment and show greater
commitment to green initiatives and help in enhancing environmental performance
(Ahmad, 2015). Satisfied employees tend to seek more interest in their tasks in
comparison to those who are less satisfied with the work they do. This states that Job
Satisfaction will force employees to involve in green policies and reduce the damages
made to the environment (Fernandez, Junquera and Ordiz, 2003). GHRM creates
platform where workforce experiences high Job Satisfaction and being better engaged
which will result in high productivity. GHRM can be used to reduce cost, better
efficiencies, to reduce carbon foot prints, to make green awareness among the
employees and initiate green work life balance. (Nijhawan, 2014) Responsibilities of
HR department are not limited to manage, develop and retaining employees in the
organization but also to recruit right person at right job, train them, retain and develop
them as per requirement and current trends in industry. GHRM has extended
boundaries of conventional HRM practices towards more sustainable and
environmental strategies.
2.5.2.1 Models of Job Satisfaction
Following section discusses various models of Job Satisfaction.
Affect Theory
Edwin A. Locke‘s Range of Affect Theory (1976) is arguably the most famous Job
Satisfaction model. The main premise of this theory is that satisfaction is determined
by a discrepancy between what one wants in a job and what one has in a job. Further,
the theory states that how much one values a given facet of work (e.g. the degree of
autonomy in a position) moderates how satisfied/dissatisfied one becomes when
expectations are/aren‘t met. When a person values a particular facet of a job, his
satisfaction is more greatly impacted both positively (when expectations are met) and
negatively (when expectations are not met), compared to one who doesn‘t value that
facet. To illustrate, if Employee A values autonomy in the workplace and Employee B
is indifferent about autonomy, then Employee A would be more satisfied in a position
that offers a high degree of autonomy and less satisfied in a position with little or no

Chapter 2 Review of Literature
63
autonomy compared to Employee B. This theory also states that too much of a
particular facet will produce stronger feelings of dissatisfaction the more a worker
values that facet.
Dispositional Theory
Another well-known Job Satisfaction theory is the Dispositional Theory.It is a very
general theory that suggests that people have innate dispositions that cause them to
have tendencies toward a certain level of satisfaction, regardless of one‘s job. This
approach became a notable explanation of Job Satisfaction in light of evidence that
Job Satisfaction tends to be stable over time and across careers and jobs. Research
also indicates that identical twins have similar levels of Job Satisfaction.
A significant model that narrowed the scope of the Dispositional Theory was the Core
Self-evaluations Model, proposed by Timothy A. Judge in 1998. Judge argued that
there are four Core Self-evaluations that determine one‘s disposition towards Job
Satisfaction: self-esteem, general self-efficacy, locus of control, and neuroticism. This
model states that higher levels of self-esteem (the value one places on his/her self) and
general self-efficacy (the belief in one‘s own competence) lead to higher work
satisfaction. Having an internal locus of control (believing one has control over
her\his own life, as opposed to outside forces having control) leads to higher Job
Satisfaction. Finally, lower levels of neuroticism lead to higher Job Satisfaction.
Two-Factor Theory (Motivator-Hygiene Theory)
Frederick Herzberg‘s two factor theory (also known as Motivator Hygiene Theory)
attempts to explain satisfaction and motivation in the workplace This theory states
that satisfaction and dissatisfaction are driven by different factors – motivation and
hygiene factors, respectively. An employee‘s motivation to work is continually related
to Job Satisfaction of a subordinate. Motivation can be seen as an inner force that
drives individuals to attain personal and organization goals (Hoskinson, Porter, and
Wrench). Motivating factors are those aspects of the job that make people want to
perform, and provide people with satisfaction, for example achievement in work,
recognition, promotion opportunities. These motivating factors are considered to be
intrinsic to the job, or the work carried out. Hygiene factors include aspects of the
Chapter 2 Review of Literature
64
working environment such as pay, company policies, supervisory practices, and other
working conditions. While Hertzberg's model has stimulated much research,
researchers have been unable to reliably empirically prove the model, with Hackman
and Oldham suggesting that Hertzberg's original formulation of the model may have
been a methodological artifact. Furthermore, the theory does not consider individual
differences, conversely predicting all employees will react in an identical manner to
changes in motivating/hygiene factors. Finally, the model has been criticised in that it
does not specify how motivating/hygiene factors are to be measured.
2.5.3 GHRM and Organisational Commitment
Commitment is defined generally as the relative strength of an individual‘s
identification with and involvement in a particular organization. It can be
characterized by at least three related dimensions: ―a strong belief in and acceptance
of the organization‘s goals and values; a willingness to exert considerable effort on
behalf of the organization; and a strong desire to maintain membership in the
organization‖ (Mowday et al., 1979). Further developing the concept, Meyer and
Allen (1984, 1991, and 1997) identified three salient dimensions of employee
commitment: affective, continuance and normative. Affective commitment describes
an individual‘s desire to stay with the organization given her/his emotional attachment
to, and identification with the organization (Meyer and Allen, 1984, 1991). A high
level of affective commitment has been found to be related to low employee turnover,
low absenteeism and improved job performance (Meyer et al., 2002). Continuance
commitment describes an individual‘s need to remain with the organization resulting
from her/his recognition of the costs (tenure, pay, benefits, vesting of pensions and
family commitment, etc.) associated with leaving the organization (Meyer and Allen,
1984, 1991). In contrast, normative commitment reflects an individual‘s feeling of
obligation to maintain organizational membership because he/she believes it is
morally right to be loyal to, and stay in, the organization.
Several researchers have examined the relationships between HRM practices and
Organisational Commitment. For example, in an individual-level analysis, Paul and
Anantharaman‘s (2004) study of software professionals showed that HRM practices
had a significant positive relationship with Organisational Commitment. HRM

Chapter 2 Review of Literature
65
systems have also been found to relate to commitment in samples of frontline
employees from car rental, retail, and hospitality organizations in South America
(Browning, 2006). Payne and Huffman (2005) found in a longitudinal study that
Organisational Commitment mediated the relationship between mentoring, an HRM
practice in the organization studied, and employee turnover over time. In a unit-level
study, Wright, Gardner, and Moynihan (2003) found a positive relationship between
HRM practices and Organisational Commitment in a study of 50 business units from
a large food service corporation.
Kim (2009) investigated how employees of the hotel industry perceived green
practices. The Data was collected from 220 employees working in eight green
certified hotels in Orlando where results found that performance levels of green
practices implemented by hotels were lower than the importance levels of those same
green practices as perceived by hotel employees. The study also reveals that there is
positive correlation between Organisational Commitment and green practices.
2.6 Conclusions
Many recent green management studies (see Jabbour, 2011; Kramar, 2014; Siegel, 2009)
have highlighted the importance of HRM to the achievement of green objectives, with
Angel del Brio et al. (2007) suggesting that management involvement and Employee
Motivation has a significant effect on the achievement of an environmental action-based
competitive advantage. However, current literary exploration of GHRM has thus far been
largely limited to conceptualisation. Scattered empirical studies have demonstrated some
positive effects of green management and HRM on a range of organizational areas
including encouraging desirable employee behaviors and improving attitudes and
motivations so that organisations can achieve organizational goals (Daily, Bishop and
Steiner, 2007; Jiang et al., 2012), including environmental goals (Daily et al., 2012; Daily
and Huang, 2001; Govindarajulu and Daily, 2004). It is expected that GHRM would
likely elicit similar organizational outcomes.
Upon reviewing the literature in relation to GHRM and associated concepts, it is clear
that several key authors and studies have considered the potentiality of GHRM to

Chapter 2 Review of Literature
66
positively impact a range of functions of HRM. However, a critical review of the
research reveals that while these studies provide insights, or identify potential links
between GHRM and functions of HRM, it remains unclear as to how and why GHRM
influences Green Recruitment and Selection, Green Training and Development, Green
Reward Management and Green Employee Involvement. Moreover, whether GHRM
policies and processes designed to encourage green behaviors have any impact on
these HRM Functions desired by the firm is yet to be established.
This study aims to empirically explore and determine the accuracy of these assertions,
with this literature review playing a pivotal role toward the development of a
conceptual model that will enable an exploration of how and why GHRM influences
other HRM Functions. The next chapter will outline the theoretical model developed
during the course of this research work, as well as incorporating the identified
mediating (Job Satisfaction and Employee Motivation) variables within the resulting
hypotheses.

Chapter 3 Research Methodology
67
CHAPTER 3
RESEARCH METHODOLOGY
This chapter discusses in detail the methodology used for research in this study. This
chapter starts by describing the problem, the nature of the population and sample
selected from it and questionnaire used, the procedure adopted for data collection and
statistical techniques that have been used to analyse the data.
3.1 The Problem
This chapter explicates the research methodology that has been used for conducting the
research and its application in seeking answers to the research questions that has been
raised by the researcher. In this chapter, an attempt has been made to outline the research
problem, the nature of the research problem, demographic profile of the population and the
sample taken for this study. Especially, efforts have been made to frame the general and
specific problems, state the objectives and the purposes, and indicate the theoretical and
practical significance of the problem and specify delimitations.
3.2 Statement of the Problem
Previous two chapters were a methodical attempt to provide an inclusive backdrop for
the study. This section is mainly devoted to the statement of the problem. Along with
objectives, indicating the importance of the problem, various theoretical, as well as
practical concerns have also been covered in this chapter.
The study seeks to answer the following questions:
1. What is the level of awareness of Green HRM Practices?
2. What type of Green HRM Practices are offered by various Organizations?
Chapter 3 Research Methodology
68
3. What are the problems faced by organizations while adopting Green HRM
Practices?
In order to study the above stated problem, following questions were raised for the
purpose of the study:
1. What are the Green HRM practices implemented at the firm level?
2. How are Green HRM practices implemented at the firm level?
3. Why are Green HRM practices implemented at the firm level?
4. What are the different factors that determine the adoption of Green HRM
practices by Indian firms?
5. How far Employee Motivation, Job Satisfaction and Organisational Commitment
as variables, influenced by Green HRM practices?
3.3 Objectives and Purpose of the Study
There are variables, like, Employee Motivation, Job Satisfaction and Organisational
Commitment which have not been studied in detail as an attribute in the research papers
in the Indian context, hence by taking this as a gap as discussed in chapter 2 various
objectives were framed as follows:-
1. To identify the various Green HRM practices adopted by Indian industries under
study;
2. To identify the relationship between Green HRM practices with Employee
Motivation, Job Satisfaction and Organisational Commitment;
3. To develop the model based on these factors and test goodness of fit for the same.
3.4 Significance of the Study
Green HRM began its journey through the milieu of green management applications,
in order to address the growing concern from corporate stakeholders (Roberts,
1992), in response to the negative impacts of organizational operations on the
environment (Waddock, 2004). By embracing green management policies and

Chapter 3 Research Methodology
69
strategies, and Green HRM practices and processes, firms are expected to receive
direct and peripheral gains such as improved sales, productivity gains and
competitive advantages (Wee and Quazi, 2005). In addition, advantageous employee
behaviors (Shultz and Holbrook, 1999; Vandermerwe and Oliff, 1990) and increases
in corporate efficiencies including improvements in water and energy usage and
waste reduction (Klassen and McLaughlin, 1996), are likely to occur.
As it is employees, who are the agents that implement organizational green policies,
it is necessary for organizations to promote and ultimately seek to manage and
change employee behavior so that they are aligned with organizational green goals
(Anderton and Jack, 2011; Daily, Bishop and Govindarajulu, 2009; Ones and
Dilchert, 2012a). Increasingly, organizations are considering the adoption of Green
HRM practices, i.e. ‗HRM aspects of green management‘, to promote employee
green behavior in the workplace (Renwick et al., 2013).
The present research work seeks to determine the Green HRM practices adopted
by firms in India and to identify the relationship between Green HRM practices
with Employee Motivation, Job Satisfaction and Organisational Commitment. This
study reviews the current situation of the GHRM practices. These practices will be
presented by a conceptual model that will provide a blueprint for these companies
to adopt GHRM practices. This study, in fact, will better define which HRM
practices or cluster of HRM practices could be more correlated with Employee
Motivation, Job Satisfaction and Organisational Commitment. So, by using this
study, companies would understand which actions to adopt and implement first
practices that have more impact on dependent variable Employee Motivation, Job
Satisfaction and Organisational Commitment. Eventually, for firms who have
already implemented GHRM practices, this study will be a guide in order to
improve their sustainability purposes.
At the end of the research there will be a few recommendations for future studies.
GHRM best practices model can be tested for green activities irrespective of
organization types and country context.

Chapter 3 Research Methodology
70
3.5 Delimitation of the Study
Notwithstanding its above significance, the methodology has the following major
limitations:
1. It is based on a very small sample of 110 companies randomly selected from 4
industries namely automobile industry, plastic industry, Electronics industry and
food industry. Therefore, the generalizations of results of the study to all the
industries in India are limited as defined by the size of this sample and findings to
other industrial organizations are unwarranted.
2. The present study is largely exploratory in nature. Despite its external validity, it
lacks internal validity. Thus, notwithstanding its richness of data, it lacks control
of variables (either through experimental design or through statistical techniques)
influencing the research results.
3. The study is based on two methods of data collection: questionnaires and personal
interview. Thus, the extent of reliability and validity of the findings of this study
depends on the reliability and validity of these methods of data collection.
3.6 The Sampling Design
According to Cavana et al. (2000) personal interviews and questionnaires are helpful and
robust for discovering responses to research questions but there‘s a flip side to this as well
as they can do more damage than good, if right population is not targeted.
Two most important methods for choosing the sample respondents are probability
sampling and non-probability sampling. Non probability sampling methodology was
deemed suitable for this research due to the focused and the scientific features of the
concerned research problems. The researcher used quota sampling and within the
strata‘s systematic random sampling was utilized for the purpose of personal interviews
as well as questionnaire filling. Well drafted questionnaire was used for the collection
of the data. . For the purpose of the study Delhi/NCR was bifurcated into four zones.
Each zone represents strata where the South Zone is the South Strata being represented
by zone 1, North Zone is North Strata being represented by zone 2, West zone is West
Strata being represented by zone 3 and East Zone is East Strata being represented by

Chapter 3 Research Methodology
71
zone 4. From each zone purposive sampling was done by selecting at least 70
respondents from each stratum.
3.7 The Population
In this section of the thesis, researcher has tried to describe the Sampling Design,
Population, Sample Frame, Location, Elements and Sampling Techniques, that have
been used to determine the sampling size of the respondents. According to Cooper and
Scindler (2001), the basic purpose of using the appropriate sampling design is to ensure
that the group of people that has been selected for the research work is the true
representation of the whole population of interest. According to Zikmund, 2003;
Sekaran, 2006, determination of the population and sample sizes are also entailed in the
sampling process.
The present study is concerned with selected Indian industries. It was decided that to
cover the companies mainly from North India region. The companies were selected
on the basis of number of employees in the company and turnover of the company.
Only the companies with more than 100 employees have been taken into the survey,
except couple of plastic manufacturing companies. The companies taken for the
survey have turnover of more than 100 crores. A list of companies‘ database has been
prepared for all four industry sectors. Industries taken into the survey were:
Automobile
Electronics
Food
Plastic
The reason for choosing these four industries is that all four industries contribute to
pollution. Automobile industry is limited to air pollution, food industry is limited to water,
soil and air pollution. Plastic industry is limited to soil pollution and electronic industry is
linked to e- waste which is becoming a big dumping problem and a source to soil pollution.
The following sections highlight more details about these four industries and justify
the choice of these specific industries.

Chapter 3 Research Methodology
72
3.7.1 Background of Industries.
The following section gives a brief description of the four industries under study.
Automobile Industry
The Indian auto industry is one of the largest in the world. The industry accounts for
7.1 per cent of the country's Gross Domestic Product (GDP). The Two Wheelers
segment with 80 per cent market share is the leader of the Indian Automobile market
owing to a growing middle class and a young population. Moreover, the growing
interest of the companies in exploring the rural markets further aided the growth of
the sector. The overall Passenger Vehicle (PV) segment has 14 per cent market share.
India is also a prominent auto exporter and has strong export growth expectations for
the near future. Overall automobile exports grew 15.81 per cent year-on-year between
April-February 2017-18. In addition, several initiatives by the Government of India
and the major automobile players in the Indian market are expected to make India a
leader in the 2W and Four Wheeler (4W) market in the world by 2020. Production of
passenger vehicles, commercial vehicles, three wheelers and two wheelers grew at
14.41 per cent year-on-year between April-February 2017-18 to 26,402,671 vehicles.
The auto industry is set to witness major changes in the form of electric vehicles
(EVs), shared mobility, Bharat Stage-VI emission and safety norms. Electric cars in
India are expected to get new green number plates and may also get free parking for
three years along with toll waivers. India's electric vehicle (EV) sales increased to
25,000 units during FY 2016-17 and are poised to rise further on the back of cheaper
energy storage costs and the Government of India‘s vision to see six million electric
and hybrid vehicles in India by 2020.
In order to keep up with the growing demand, several auto makers have started
investing heavily in various segments of the industry during the last few months. The
industry has attracted Foreign Direct Investment (FDI) worth US$ 18.413 billion
during the period April 2000 to December 2017, according to data released by
Department of Industrial Policy and Promotion (DIPP).

Chapter 3 Research Methodology
73
Some of the recent/planned investments and developments in the automobile sector in
India are as follows:
The only electric automaker in India, Mahindra and Mahindra Ltd, has partnered
with Uber for deploying its electric sedan e-Verito and hatchback e2o Plus on Uber
platforms in New Delhi and Hyderabad.
Mahindra and Mahindra (M and M) is planning to make an additional investment
of ` 500 crore (US$ 77.23 million) for expanding the capacity for electric vehicles
in its plant in Chakan. With the vision of government of India to shift to electric
vehicle by year 2030 to bring down pollution, automobile industry shall be
focusing more on green practices and hence it will be apt to study this industry.
The automobile industry is supported by various factors such as availability of skilled
labour at low cost, robust Research and Development centres and low cost steel
production. The industry also provides great opportunities for investment and direct
and indirect employment to skilled and unskilled labour. The Indian automotive
aftermarket is estimated to grow at around 10-15 per cent to reach US$ 16.5 billion by
2021 from around US$ 7 billion in 2016. It has the potential to generate up to US$
300 billion in annual revenue by 2026, create 65 million additional jobs and
contribute over 12 per cent to India‘s Gross Domestic Product.
(https://www.ibef.org/industry/india-automobiles.aspx)
Electronics Industry
The electronics market of India is one of the largest in the world and is anticipated to
reach US$ 400 billion in 2022 from US$ 69.6 billion in 2012. The market is projected
to grow at a compound annual growth rate (CAGR) of 24.4 per cent during 2012-
2020.Total production of electronics hardware goods in India is estimated to reach
US$ 104 billion by 2020. The communication and broadcasting equipment segment
constituted 31 per cent, which is the highest share of total production of electronic
goods in India in FY13, followed by consumer electronics at 23 per cent.
Since electronic equipment play a major role in energy conservation by way of saving
electricity and also contributes to environmental pollution by adding pollution in the

Chapter 3 Research Methodology
74
form of E- waste, it becomes all the more important to study green practices of
electronic industry. Electronic waste or E-waste is the collective name for discarded
electronic devices that enter the waste stream from various sources (Jain and Chawla,
2012). It includes items like PCs, telephones, notebook computers, TV set, mobile
Phones, electronic toys and electrical appliances like refrigerators, air-conditioners
etc. which have become obsolete due to:
• Advancement in Technology
• Change in fashion, style and status
• Nearing the end of their useful life.
The used and spoiled electronic appliances such as computers, laptops, game devices,
mobile phones, TV and video & audio players etc. which have disposed by their
original users come in the category of E-waste.
Electronics production in India has been growing at a rapid pace as can be seen from
the following facts:-
Total production of electronics hardware goods in India is estimated to reach
US$ 47.87 billion in FY17 and is expected to reach US$ 104 billion by 2020.
Production expanded at a CAGR of 12.60 per cent during FY07–17.
High production is majorly contributed by accelerating demand for advanced
TVs, mobile phones, computers and defence related electronic equipment during
FY07 to FY15.
During FY16, production of industrial electronics, mobile phones and LED was
recorded at USD6.89 billion, USD8.25 billion and USD0.55 billion, in value
terms, respectively.
In March 2017, Xiaomi announced its 2nd manufacturing plant along with
Taiwan based company Foxconn, in Andhra Pradesh. This will help create
employment in 100 nearby villages for at least 5,000 people.

Chapter 3 Research Methodology
75
Electronic exports from India reached USD5.7 billion in FY16, over FY07–16, exports
from the sector (CAGR: 8.22 per cent). Technological improvements and competitively
cost effectiveness are main drivers for demand of Indian electronics products abroad. The
Government of India has set up Electronic Hardware Technology Parks (EHTPs), Special
Economic Zones (SEZs) and a brought about a favourable climate for foreign direct
investment (FDI). It has also increased liberalisation and relaxed tariffs to promote growth
in the sector. In addition, the government gave its green signal to the Modified Special
Incentive Package (www.ibef.org).
Source: (www.ibef.org).
Figure 3.1: Electronic exports from India
Food Industry
The Indian food industry is poised for huge growth, increasing its contribution to
world food trade every year. In India, the food sector has emerged as a high-growth
and high-profit sector due to its immense potential for value addition, particularly
within the food processing industry. Accounting for about 32 per cent of the country‘s
total food market, The Government of India has been instrumental in the growth and
development of the food processing industry. The Indian food and grocery market is
the world‘s sixth largest, with retail contributing 70 per cent of the sales. The Indian
food processing industry accounts for 32 per cent of the country‘s total food market,
one of the largest industries in India and is ranked fifth in terms of production,
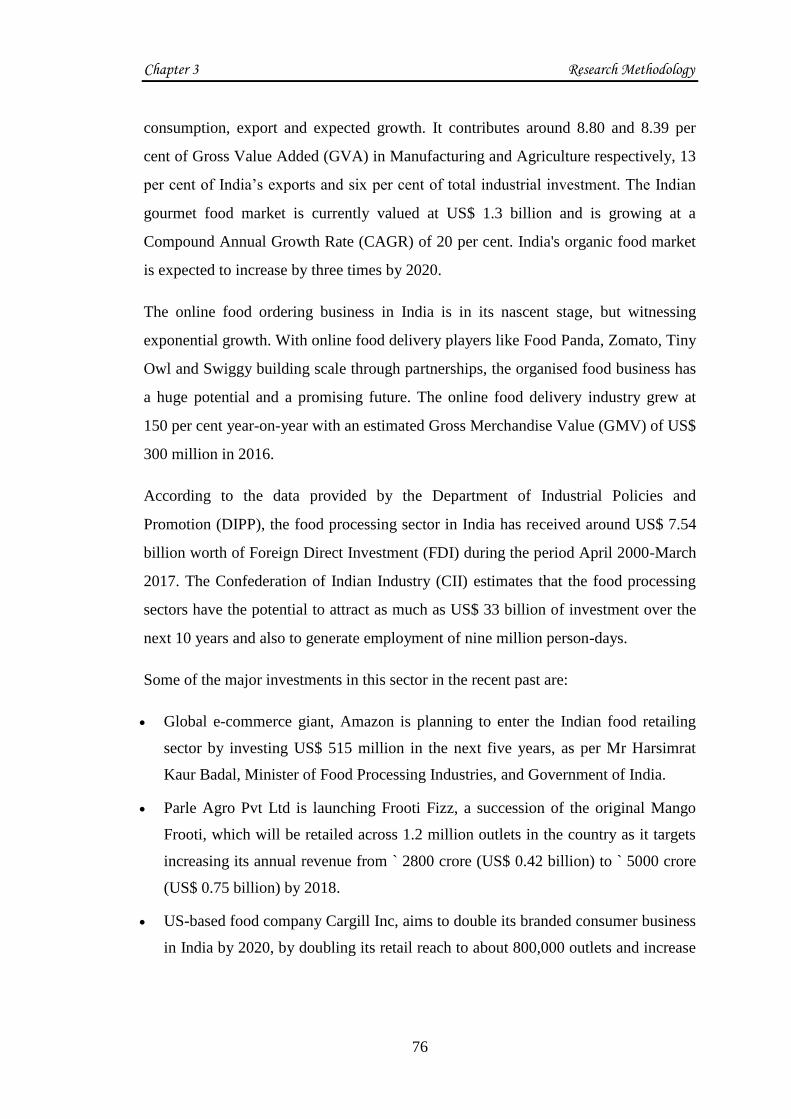
Chapter 3 Research Methodology
76
consumption, export and expected growth. It contributes around 8.80 and 8.39 per
cent of Gross Value Added (GVA) in Manufacturing and Agriculture respectively, 13
per cent of India‘s exports and six per cent of total industrial investment. The Indian
gourmet food market is currently valued at US$ 1.3 billion and is growing at a
Compound Annual Growth Rate (CAGR) of 20 per cent. India's organic food market
is expected to increase by three times by 2020.
The online food ordering business in India is in its nascent stage, but witnessing
exponential growth. With online food delivery players like Food Panda, Zomato, Tiny
Owl and Swiggy building scale through partnerships, the organised food business has
a huge potential and a promising future. The online food delivery industry grew at
150 per cent year-on-year with an estimated Gross Merchandise Value (GMV) of US$
300 million in 2016.
According to the data provided by the Department of Industrial Policies and
Promotion (DIPP), the food processing sector in India has received around US$ 7.54
billion worth of Foreign Direct Investment (FDI) during the period April 2000-March
2017. The Confederation of Indian Industry (CII) estimates that the food processing
sectors have the potential to attract as much as US$ 33 billion of investment over the
next 10 years and also to generate employment of nine million person-days.
Some of the major investments in this sector in the recent past are:
Global e-commerce giant, Amazon is planning to enter the Indian food retailing
sector by investing US$ 515 million in the next five years, as per Mr Harsimrat
Kaur Badal, Minister of Food Processing Industries, and Government of India.
Parle Agro Pvt Ltd is launching Frooti Fizz, a succession of the original Mango
Frooti, which will be retailed across 1.2 million outlets in the country as it targets
increasing its annual revenue from ` 2800 crore (US$ 0.42 billion) to ` 5000 crore
(US$ 0.75 billion) by 2018.
US-based food company Cargill Inc, aims to double its branded consumer business
in India by 2020, by doubling its retail reach to about 800,000 outlets and increase

Chapter 3 Research Methodology
77
market share to become national leader in the sunflower oil category which will
help the company be among the top three leading brands in India.
Mad over Donuts (MoD), outlined plans of expanding its operations in India by
opening nine new MOD stores by March 2017.
Danone SA plans to focus on nutrition business in India, its fastest growing market
in South Asia, by launching 10 new products in 2017, and aiming to double its
revenue in India by 2020.
Uber Technologies Inc plans to launch Uber EATS, its food delivery service to
India, with investments made across multiple cities and regions.
Going forward, the adoption of food safety and quality assurance mechanisms such as
Total Quality Management (TQM) including ISO 9000, ISO 22000, Hazard Analysis
and Critical Control Points (HACCP), Good Manufacturing Practices (GMP) and
Good Hygienic Practices (GHP) by the food processing industry offers several
benefits. It would enable adherence to stringent quality and hygiene norms and
thereby protect consumer health, prepare the industry to face global competition,
enhance product acceptance by overseas buyers and keep the industry technologically
abreast of international best practices.
(https://www.ibef.org/industry/indian-food-industry.aspx)
Environmentally Friendly Packaging
The Nielsen Global Survey on corporate social responsibility found 52% of
respondents across the world said their sustainable purchase decisions are influenced
by packaging. Of those who will pay extra for sustainable products and those who
check the packaging for sustainable labelling, over half are millennials (those born
between the early 1980s and late 1990s), the study showed.
As a result, manufacturers are looking to their packaging suppliers for cost-effective
solutions. But even where aims can be met to reduce weight, shrink volume or offer a
compostable alternative, can the product remain recognisable at the point of sale?
Mick Clark, managing director at We Pack, offers a few tips to strike the right
balance. (Sustainable packaging and socially responsible business, 2018).

Chapter 3 Research Methodology
78
World centric
World Centric‘s US-made line of compostable cutlery and packaging includes an
extensive list of biodegradable bags, dishware, and cutlery for household or corporate
use. These certified-compostable disposables are made out perennial plant fibres with
long roots that help store carbon underground. As an added bonus, 25 percent of their
profits are donated to worthy causes.
Papelyco
Plantable paper plates by Papelyco are just about the coolest green invention since the
internet was created. Use their plate, place it in the ground, and a plant will literally
grow out of it. They even include important minerals in the plate to provide your new
sappling with the nutrients it needs to grow.
Be Green Packaging
Be Green Packaging has it down when it comes to professionalism and precision.
They have partnered with companies such as Google, Gilette, Samsung, Whole
Foods, and Virgin America to bring compostable packaging to consumers.
Ecoware
New Zealand-based Eco Ware is a carbon neutral company, offsetting all of its energy
output by investing in clean technology. Aside from their biodegradable dishware,
they also sell bio plastic packaging that has an 80 percent lower carbon footprint than
regular plastic5.
Tipa
Tipa produces a line of biodegradable flexible plastics - think Ziplock bags, garbage
bags, etc. This type of plastic is heavily used by consumers, and can be a game-
changing technology moving forward into a more sustainable future.
As food components are natural and comes from environment, therefore, it looks
natural that food products won't harm the environment. However, various human
activities and the competition to provide fast food to people in today's busy life has
led to emergence of various efforts such as (i) packaging, (ii) advertising, (iii)
coloring of food, (iv) disposal of waste materials produced during production and

Chapter 3 Research Methodology
79
consumption lead to not only damaging of the environment but also its natural state;
which is ultimately becoming hazardous to health of human beings. So, it becomes all
the more important to study green practices of food industry.
Plastic Industry
Plastic industry makes significant contribution to the economic development and growth
of various key sectors in the country such as automotive, construction, electronics,
healthcare, textiles, and FMCG. Government initiatives such as Make in India, Skill India,
Digital India, Swachh Bharat Abhiyan, etc are opening up opportunities for accelerated
growth in the plastics industry, as the industry is contributing in a big way in the success of
these programs. For example, for Digital India program, plastic is one of the major
components required in the production of electronic gadgets, which are mostly imported at
present in the country. In the next 5 to 10 years, most of the products in the electronics
industry are proposed to be made in the country, thus reducing imports from China and
other countries – making India an emerging sourcing hub. The Indian plastics industry
made a promising beginning in 1957 with the production of polystyrene. Thereafter,
significant progress has been made, and the industry has grown and diversified rapidly.
The industry spans the country and hosts more than 2,000 exporters. It employs about 4
million people and comprises more than 30,000 processing units, 85-90 percent of which
are small and medium-sized enterprises.
Export of plastic products from India stood at US$ 7.64 billion in FY 2015-16.
During 2015-16, major importers of Indian plastic products were US (US$ 652.28
million), China (US$ 480.8 million), UAE (US$ 368.16 million), UK (US$ 271.67
million), Germany (US$ 256.2 million), Turkey (US$ 246.86 million), Italy (US$
208.29 million), Iran (US$ 194.5 million), Nepal (US$ 141.2 million) and
Bangladesh (US$ 136.27 million)
Domestic consumption of plastic is expected to touch 20 million Metric Tonnes by
2020.
The Indian plastics industry produces and exports a wide range of raw materials,
plastic-moulded extruded goods, polyester films, moulded / soft luggage items,
writing instruments, plastic woven sacks and bags, polyvinyl chloride (PVC),

Chapter 3 Research Methodology
80
leather cloth and sheeting, packaging, consumer goods, sanitary fittings, electrical
accessories, laboratory / medical surgical ware, tarpaulins, laminates, fishnets,
travelware, and others.
The Indian plastics industry offers excellent potential in terms of capacity,
infrastructure and skilled manpower. It is supported by a large number of polymer
producers, and plastic process machinery and mould manufacturers in the country.
Among the industry‘s major strengths is the availability of raw materials in the
country. Thus, plastic processors do not have to depend on imports. These raw
materials, including polypropylene, high-density polyethylene, low-density
polyethylene and PVC, are manufactured domestically.
Plastic industry has been selected for this research work because of the pollution and
waste it is creating and hence deteriorating the environment. Accumulation of plastic
wastes causes environmental pollution that can be manifested in number of ways such
as deterioration of the natural beauty of an environment (Andrady 2003), death and
entanglement of marine animals (Azzarello and Van Vleet 1987; Hofmeyr et al. 2006;
Lithner et al., 2009), blockage of sewerage systems of cities and towns in developing
countries (Adane and Muleta 2011) which in turn creates foul smells and favourable
habitats for mosquitoes and other vectors that could spread various diseases like
mosquitoes (Ellis et al. 2005), reduce percolation of water and proper aeration of
agricultural soils which in turn results in a reduction of productivities of such fields
(Njeru 2006).
Growing interest in Bio-Plastics
Growing interest in green products, healthier lifestyles and growing concern to protect
environment is leading to a shift towards bio-plastics. Bio-plastics are plastics that
contain bio-based content, are biodegradable or both. Many polymers like PLA (Poly
Lactic Acid), PHA (Poly Hydroxyalkanoates), Bio PTT (Poly Trimethyl
Terephthalate), Bio PDO (Propanediol) etc. are the part of this upcoming trend. These
plastics are significantly made of renewable materials like bio mass and save up to
40% energy in production as compared to their petrochemical counterparts. They play

Chapter 3 Research Methodology
81
a crucial role in further advancement of the plastic industry and as result businesses
are focusing on the adoption of such eco-friendly products. Large numbers of
companies are now looking for the development of alternative feedstock and make
use bio-based raw material for their production.
The market for this product is still in its infancy. High cost of bio-plastics, lack of
clear understanding and infrastructure, limited amount of funding available are acting
as constraint to the evolution of this segment. However, increasing stress on green
chemistry is expected to bring down the cost, also increasing environmental
awareness, positive attitude from government, continuous R&D efforts and shift in
consumer preference towards environmental friendly option will lead to the evolution
in demand of this industry.
The concept of sustainability, most vehicle and auto parts manufacturers have planned
actions to reduce the impact on the nature of both their products and their
manufacturing processes. Although initiatives in this sense already exist for some
decades, it was in the year 2000, and more markedly after 2005, that they began to be
part of the daily routine of companies (Autodata, 2011). The study of all the
companies that make this industrial complex up (automakers, plastic, Food and
electronic Industry) revealed that actions which aimed at environmental management
and social responsibility are generally treated in isolation. They are not integrated into
the corporate strategy. Most companies are still at an early stage when compared to
world-class standards. On the other hand, researcher observe, in the implementation
of new operating units, automakers are already trying to align production processes
with the requirements of cleaner production and eco-efficiency, with actions aimed to
material and energy savings and emphasizing the aspects of recycling.
3.7.2 Sample Size
This section involves description of population from which the sample of industries
have been selected and description of population from which the consumers have
been selected. Many researchers have discussed the appropriate procedures for

Chapter 3 Research Methodology
82
choosing the suitable sample size. A sample size of less than 30 persons is considered a
very small sample size and it is also too small to be useful for any research work, if the
population is large then the sample size of at least 100 or more is considered to be the
appropriate and minimum sample size for any study (Sekaran 2006). The sample size
taken in this research work is 300 respondents. As stated by Zikmund (2006) also,
sample size plays a vital role as; the smaller the size of the sample, the higher is the
chances of the margin of errors. The researcher has also claimed that, the large sample
size gives more accurate results in the research work. The cost of collecting the data is a
major consideration and, judgment must be made considering this factor. For
interpreting the results of Structural Equation Modelling (SEM), the size of sample
plays an important role as, it provides a base for the estimation of error due to sampling.
The following criteria (Table 3.2) were used for determining the sample size.
Table 3.1: Sample Size Determination Criteria
Stated by Criteria Suggested sample as per criteria
Hair et al,1999 Number of factors * 25 13X25= 325 Sample Size
General thumb-rule Number of statements *5 55 X5= 275 Sample Size
Hence, after finalizing the questionnaire, the researcher was able to gather data from
400 respondents and, out of total respondents, only 300 were the actual and usable
questionnaires
In Delhi there are 7060 companies covered under the four zones. It is not feasible to
cover all the units therefore for data collection. Database for the study has been
gathered for all four industries in Delhi. A sample of 110 companies, 27 companies
from automobile, 26 companies from food, 26 companies from electronics, 31
companies from plastic, each industry was randomly selected from the database( See
appendix A). Figure 3.2 connotes that out of 300 respondents, the respondent from
Automobile is 21.7%, Food (26.7%), Electronics (25.7%) and Plastic (26%).
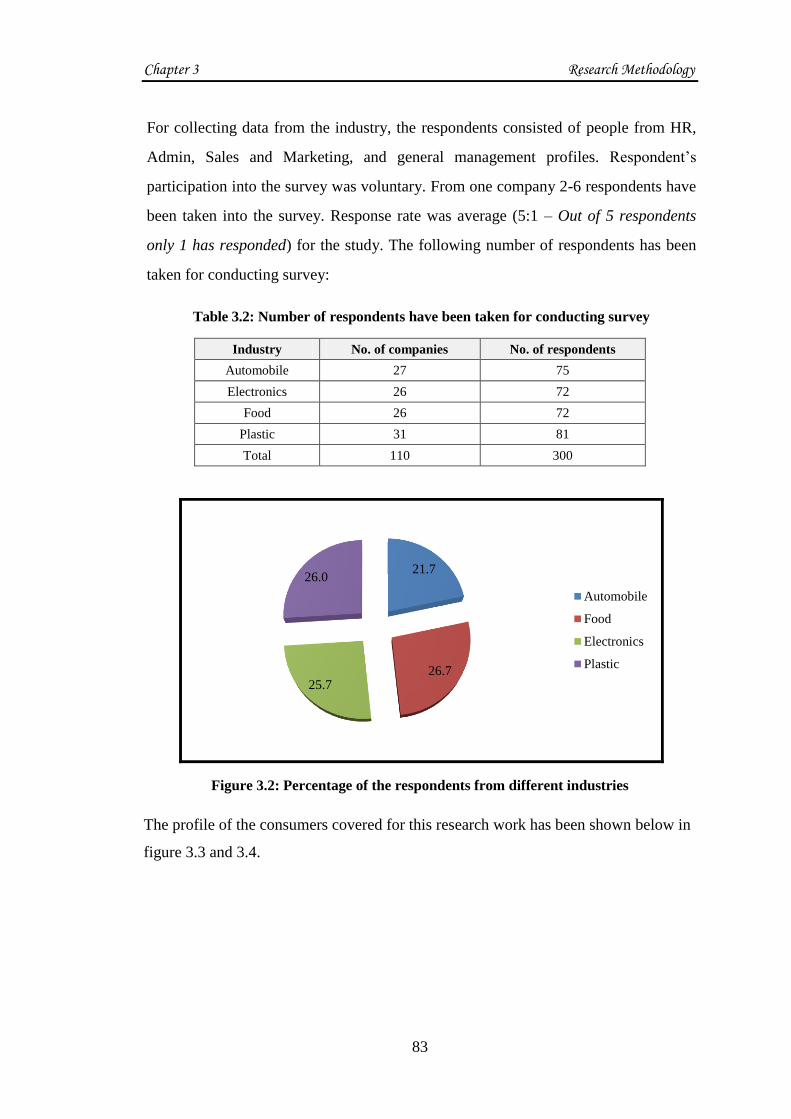
Chapter 3 Research Methodology
83
For collecting data from the industry, the respondents consisted of people from HR,
Admin, Sales and Marketing, and general management profiles. Respondent‘s
participation into the survey was voluntary. From one company 2-6 respondents have
been taken into the survey. Response rate was average (5:1 – Out of 5 respondents
only 1 has responded) for the study. The following number of respondents has been
taken for conducting survey:
Table 3.2: Number of respondents have been taken for conducting survey
Industry No. of companies No. of respondents
Automobile 27 75
Electronics 26 72
Food 26 72
Plastic 31 81
Total 110 300
Figure 3.2: Percentage of the respondents from different industries
The profile of the consumers covered for this research work has been shown below in
figure 3.3 and 3.4.
21.7
26.7 25.7
26.0
Automobile
Food
Electronics
Plastic
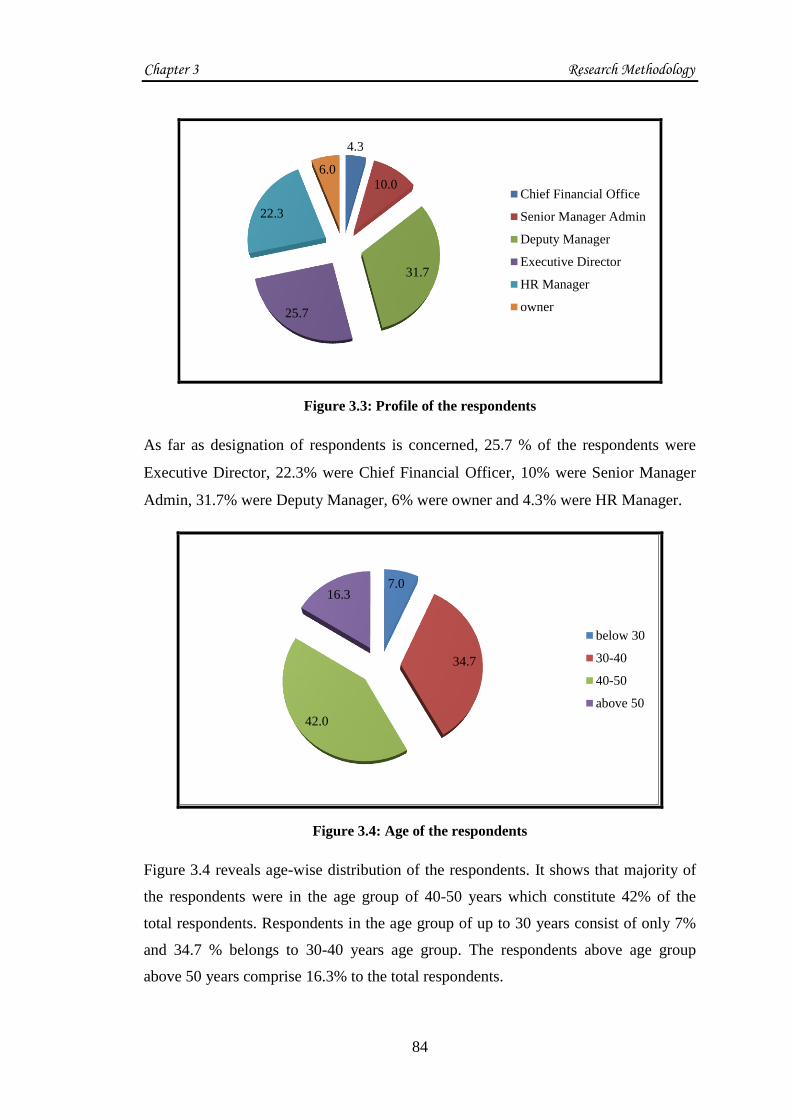
Chapter 3 Research Methodology
84
Figure 3.3: Profile of the respondents
As far as designation of respondents is concerned, 25.7 % of the respondents were
Executive Director, 22.3% were Chief Financial Officer, 10% were Senior Manager
Admin, 31.7% were Deputy Manager, 6% were owner and 4.3% were HR Manager.
Figure 3.4: Age of the respondents
Figure 3.4 reveals age-wise distribution of the respondents. It shows that majority of
the respondents were in the age group of 40-50 years which constitute 42% of the
total respondents. Respondents in the age group of up to 30 years consist of only 7%
and 34.7 % belongs to 30-40 years age group. The respondents above age group
above 50 years comprise 16.3% to the total respondents.
4.3
10.0
31.7
25.7
22.3
6.0
Chief Financial Office
Senior Manager Admin
Deputy Manager
Executive Director
HR Manager
owner
7.0
34.7
42.0
16.3
below 30
30-40
40-50
above 50

Chapter 3 Research Methodology
85
3.8 Data Collection Methods
This segment throws light on diverse sources of data and how the data was gathered in
order to carry out the work on objectives to be achieved and inferences to be drawn.
The selection of data gathering mechanism depended on the accessibility of amenities,
point in time, outlay, extent of precision entailed etc. (Sekaran, 2006). By and large
primary and secondary, both types of data had been employed with due consideration to
the intent of research.
3.8.1 Primary Data
The primary data in this research has been collected from two modes of information
namely: Personal Interview and Questionnaire. These modes of data collection were
well-organized, specific as well as time and cost saving. Self-administrated 350
questionnaires were distributed to respondents (including personal interview) during
personal interaction. Then, out of 350, 300 were used for the study purpose. That is in
totality 300 valid responses were collected during the study.
3.8.2 Secondary Data
Numerous academic journals, articles and books, were referred to collect the desired
information from various journals and online databases like Delnet, Proquest, emerald etc.
3.9 Research Model and Development of Hypotheses
Following research model as shown in Figure 3.5 was proposed for conducting the
study:
Figure 3.5: Proposed Research Model
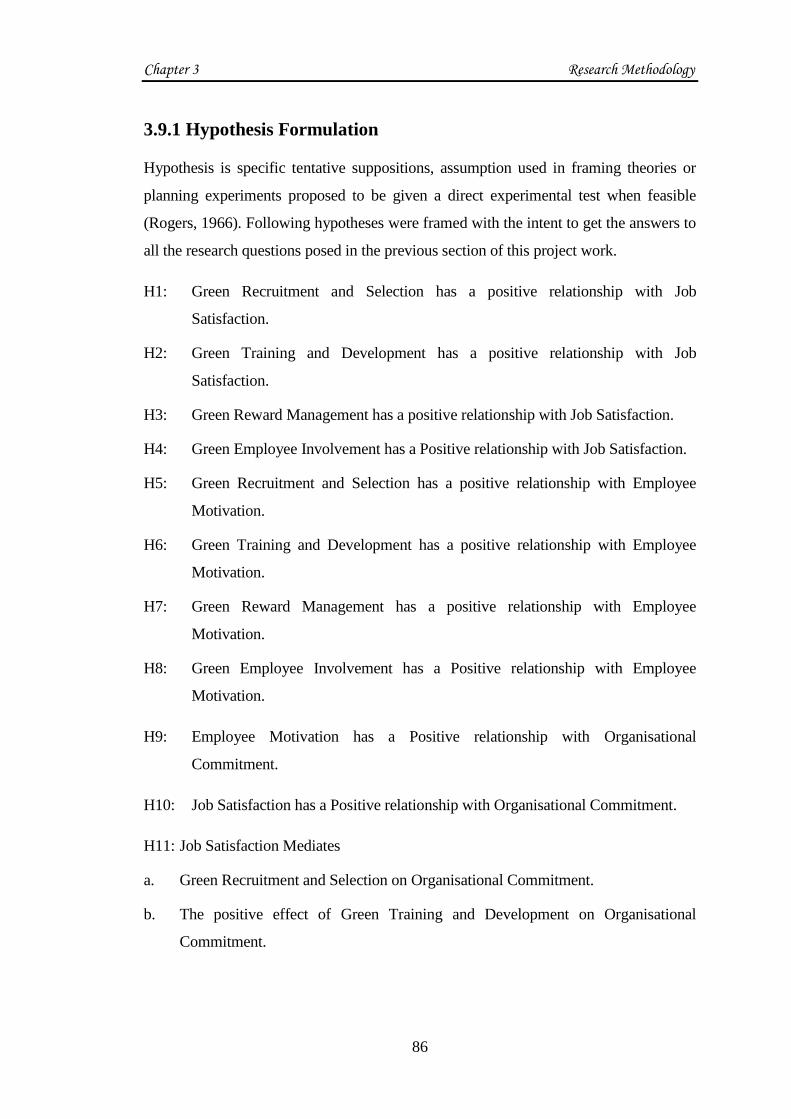
Chapter 3 Research Methodology
86
3.9.1 Hypothesis Formulation
Hypothesis is specific tentative suppositions, assumption used in framing theories or
planning experiments proposed to be given a direct experimental test when feasible
(Rogers, 1966). Following hypotheses were framed with the intent to get the answers to
all the research questions posed in the previous section of this project work.
H1: Green Recruitment and Selection has a positive relationship with Job
Satisfaction.
H2: Green Training and Development has a positive relationship with Job
Satisfaction.
H3: Green Reward Management has a positive relationship with Job Satisfaction.
H4: Green Employee Involvement has a Positive relationship with Job Satisfaction.
H5: Green Recruitment and Selection has a positive relationship with Employee
Motivation.
H6: Green Training and Development has a positive relationship with Employee
Motivation.
H7: Green Reward Management has a positive relationship with Employee
Motivation.
H8: Green Employee Involvement has a Positive relationship with Employee
Motivation.
H9: Employee Motivation has a Positive relationship with Organisational
Commitment.
H10: Job Satisfaction has a Positive relationship with Organisational Commitment.
H11: Job Satisfaction Mediates
a. Green Recruitment and Selection on Organisational Commitment.
b. The positive effect of Green Training and Development on Organisational
Commitment.

Chapter 3 Research Methodology
87
c. The positive effect of Green Reward Management on Organisational
Commitment.
d. The Positive effect of Green Employee Involvement on Organisational
Commitment.
H12: Employee Motivation Mediates
a. The positive effect of Green Recruitment and Selection on Organisational
Commitment.
b. The positive effect of Green Training and Development on Organisational
Commitment.
c. The positive effect of Green Reward Management on Organisational
Commitment.
d. The Positive effect of Green Employee Involvement on Organisational
Commitment.
3.10 Research Design
According to Berg (1989) ―a research design is the strategy on how the research study
will be administrated‖. In this research work, exploratory and descriptive research
designs have been used in combination. The exploratory stage acknowledged the
identified research disparities, framed the relevant research questions and a theoretical
model by means of an all-embracing literature analysis as mentioned in Chapter two.
The research concerns and the theoretical model both have been improvised to a great
extent from modifications based on the views expressed by various investors and
professionals through personal interviews. The second stage sanctioned the verification
of the acknowledged research model on aspects relevant to mutual fund performance
evaluation. With this intent, quantifiable data was gathered with the help of
questionnaires done majorly through various web portals and a structural equation
model was framed to assess the research model (Neuman, 2006). The present study
adopted descriptive as well as an empirical research design based on the questionnaire
mode of data collection. Here, the researcher exercises an inductive research approach

Chapter 3 Research Methodology
88
to frame a model based on the analysis. The main difference between inductive and
deductive approach to research is that whilst a deductive approach is aimed and testing
theory, an inductive approach is concerned with the generation of new theory emerging
from data.
The research design used in this research work was exploratory and descriptive in
nature. The pilot study was initiated with exploratory research design in order to have
the in-depth understanding of the Green HRM practices and the relationship between
Green HRM practices and Employee Motivation, Job Satisfaction and Organisational
Commitment. The exploratory and descriptive research design was used to first explore
the variables of GHRM and, then describing the association between various dependent
and independent variables, which were explored during the exploratory research study.
3.11 The Schedule/Questionnaire
The researcher has used questionnaire for conducting survey for this research. Hair,
Black, Anderson, Babin, and Tatham (2003) also suggested that a questionnaire is the
most effective way for a well-educated target population and, normally generates a
large amount of response rate. For collection of primary data, schedule/questionnaire
was an essential tool that was developed for reliable and first-hand data collection. The
researcher has used structured schedule/questionnaire for this purpose as shown in
Appendix B.
The development of questionnaire is important as it goes through various phases like, a
clear understanding of the topic, defining and identification of the research questions
and their association with the constructs. As stated by Yin (1994) for the framing of the
research questionnaire, the clear and systematic understanding is required to meet the
research goals. The proposed model that was presented in Figure 3.1 has been used as
the framework for designing the questionnaire for this research work.
3.11.1 Designing the Questionnaire
It is consequently imperative to cautiously draft a questionnaire which is according to
the purpose of the research (Malhotra, 1999). An effective questionnaire can also play
an effectual role in reducing research bias (Sekaran, 2003). To encounter these
Chapter 3 Research Methodology
89
prerequisites, the researcher accepted the questionnaire design procedure. Researcher
considered four crucial aspects when scheming the questionnaire for this research with
the intention to enhance the significance, trustworthiness and authenticity of the
research results.
(i) Relevance
―A questionnaire is only relevant when the end product is the compilation of the
requisite and relevant information. Therefore, the researcher should be precise and clear
about data requirements‖ (Zikmund, 2003). The questionnaire used in this research
work, incorporated statements which were associated to the research progression.
(ii) Accuracy
The vocabulary used in a questionnaire was effortlessly comprehended by each and
every respondent. Double-barreled questions have been totally circumvented. The
statements were kept simple and short. The statements were phrased to be as precise
and feasible to elude any kind of vagueness. In this research closed ended statements
have been framed to allow the respondent to select and bestow responses those were
similar to their personal opinions.
(iii) Sequencing
A superior questionnaire outlines an assimilated entire set of questions which flow
effortlessly. The researcher utilized a funnel arrangement in drafting the questionnaire.
A funnel arrangement is the process of systematizing questionnaire statements
proceeding from broad to precise (Neuman, 2006).
The questionnaire was designed in a manner that is able to convert research objectives
into precise research questions. It was also taken care that the designed questionnaire
enables the investigator to procure the required data. A thorough comprehension is
compulsory on the research topic for framing of these questions to meet the research
aims (Neuman, 2006). The conceptual model presented in chapter two, had been used
as the core for designing of the questionnaire. With the help of the variables found
suitable for the research purpose, which had been derived from the review of literature

Chapter 3 Research Methodology
90
were found to be evident through pilot survey. Structured questions were used with an
understandable and easy language so as to convey the intent of the questions.
In order to achieve the research rationale, each question was worded so as to bring forth
an answer, which precisely and completely reflected the status of Green HRM practices,
adopted by the employees and how employees think about these Green HRM practices.
The developed survey instrument was as a result of the statements that had been
derived from the literature review. To assess the structure of the scale, all the
items generated were factor analyzed using the principal component analysis. The
choice of principal component analysis instead of common factor analysis was
based on its appropriateness when the concern is about summarizing data in a
minimum number of factors (Hair et al. 1998). This was followed by varimax
rotation. According to Hair et al. (1998), quoted by Msweli (2011), the frequent
use of orthogonal rotational approaches necessitated by the limited development in
analytical procedures for performing oblique rotation.
Initial instrument was developed by generating items from the review of literature.
From the literature review, 43 items were found. Later on, the items were reduced
to 42 after application of reliability and correlation test. For pilot testing the draft
questionnaire was filled by a total of 100 respondent. Only minor changes were made from
the feedback. After the pilot study the items were reduced from 43 to 42. All the
measuring items were coded on the five-point Likert scale. The same has been
suggested by Brace (2004) that, five-point Likert scale is recommended for most of the
surveys, as it is very easy for the respondents to participate. For the calculation of the
items, the Likert scale has been used by the researcher in this thesis, where the
respondent has conveyed his/her opinion on the scale of measurement that includes 1=
strongly disagree to 5= strongly agree
3.12 Questionnaire finalization process
The following process was adopted to finalize the instrument.

Chapter 3 Research Methodology
91
3.12.1 Pilot testing
For superior research results, a questionnaire should gain from a pilot study as it can
reveal the flaws in its draft (Cooper and Schindler 1998). Pilot analysis was conducted
for this research in July 2017. The questionnaire was designed by using literature
review and to check the reliability data was collected from 100 respondents, For
finalization of questionnaire item correlation correction technique was used. The
items which were having reliability, value less than 0.7 and correlation value less than
0.5 are removed from the questionnaire. Only one item has been removed from the
questionnaire whose correlation value was .422.
3.12.2 Research Quality
The researcher integrated actions to enhance the reliability of the research (Cooper and
Schindler, 1998). Points summarized in the following sections incorporate measures to
curtail the inaccuracies and to make the findings more applicable and trustworthy (Cooper
and Schindler, 1998).
3.12.3 Minimizing Errors
Eminence of research work may be endangered by respondents‘ and by their biases
(Zikmund, 2003). According to Cooper and Schindler (2000) with the intention of
minimizing the risk of the respondent as an error cause, the questions or statements
were cautiously framed to evade vagueness.
3.12.4 Reliability Test
Reliability is ―the extent to which a list of scale items would produce consistent
results if data collection were repeated (Malhotra, 2007) and is assessed by
determining the proportion of systematic variation in a scale‖. Internal consistency is
obtained by the Cronbach Alpha coefficient (Pallant, 2007), the ideal value of the
Cronbach Alpha co-efficient should be above 0.7 (Hair et al. 2010). If the value of
Cronbach Alpha coefficient is below 0.7 then it indicates unsatisfactory internal
consistency reliability (Malhotra, 2007). The Cronbach Alpha co-efficient value is
above .9 for each construct which proves that the questionnaire is reliable.

Chapter 3 Research Methodology
92
3.12.5 Validity of the Questionnaire
The validity of a questionnaire measures the extent to which the items in the
questionnaire evaluate what the researcher wants to measure. In case the research
design is not competent enough to achieve what it is intended to do, it entails a research
error further signifying inadequate validity. Higher level of validity signifies precise
results to authentic values. Following types of validity were tested for this study.
Face Validity
Face validity signifies the degree of resemblance amid the notion of the variables and
the researcher‘s observation, which are analysed through the personal interview and
questionnaire. To obtain the face validity of the questionnaire, senior experienced
academicians, researchers, professionals were asked to mention their impressions
regarding the variables after duly examining the variables. Furthermore, they were also
asked to demonstrate whether the operational meanings of the variables relate to the
basic notion of research study. Subsequently, the language of the statements was
revised in the questionnaire as per the suggestions by the experts.
Criterion Related Validity
The senior experienced academicians/researchers/professionals were actively involved in
validating the questionnaire. Experts suggested certain up gradations and gave suggestions
which were taken into account while final consolidation of the instrument/questionnaire.
Apart from this the wordings and language of the instrument was altered wherever needed.
Content Validity
According to Haynes, Richard, and Kubany (1995), content validity is ―the degree to
which elements of an assessment instrument are relevant to and representative of the
targeted construct for a particular assessment purpose.‖ Note that this definition of
content validity is very similar to our original definition of validity. Content validity is
the content of the test valid for measuring what it claims to measure. Usually assessed
by expert judgement rather than statistical analysis. As senior experienced
academicians/researchers/professionals evaluated the questionnaire hence content
validity is checked.

Chapter 3 Research Methodology
93
Construct Validity
It alludes to ―the extent to which a test or other measure evaluates the fundamental
theoretical construct it is supposed to measure (i.e. the test measures what it is indicated
to quantify) (Kerlinger, 1973).‖ Thus, in this research work also, construct validity has
been tested by the researcher for the research items through convergent and
discriminant validity.
For the pilot testing and initial screening of questionnaire the Corrected Item-Total
Correlation and reliability of every item was calculated. The items which were
showing reliability less than 0.7 and correlation less than 0.5 had been deleted from
the scale before going for further analysis.
Initial Scale
Likert scale was used for this research work and initial scale (Table No. 3.3) was used
for pilot testing by the researcher.
Table 3.3: Initial Scale for Pilot Testing
S. No.
1 The employee promotes environment protection in the workplace.
2 My company has fair policy for performance appraisal and evaluation which leads to Job
Satisfaction.
3 My company includes environmental criteria in the recruitment messages.
4 My company provides training for green initiatives and therefore increase my Job
Satisfaction.
5 Everybody in this facility get the opportunities to get training on environmental management
aspects.
6 Employees have a sense of personal obligation to take action to stop wasting resources (eg.
saving water or using less electricity)
7 The employees follow the best practice of operating the machine in order to reduce paper
and energy consumption.
8 We have a system of joint consultations in solving environmental issues of the organization.
9 My company communicates the employer‘s concern about greening through recruitment
efforts.
10 The employee‘s behavior of saving paper and energy when operating the machine is beyond
the norm.
11 Company generally selects those candidates who are sufficiently aware of greening to fill job
vacancies.
12 My company provides training to the union representatives in environmental management.
13 We are rewarded financially or non- financially for good environmental performance.
14 Employees in this company are willing to sacrifice some of their self-interests for the benefit
of the environment (eg.turn off the Air- conditioner, lights if you do not need).
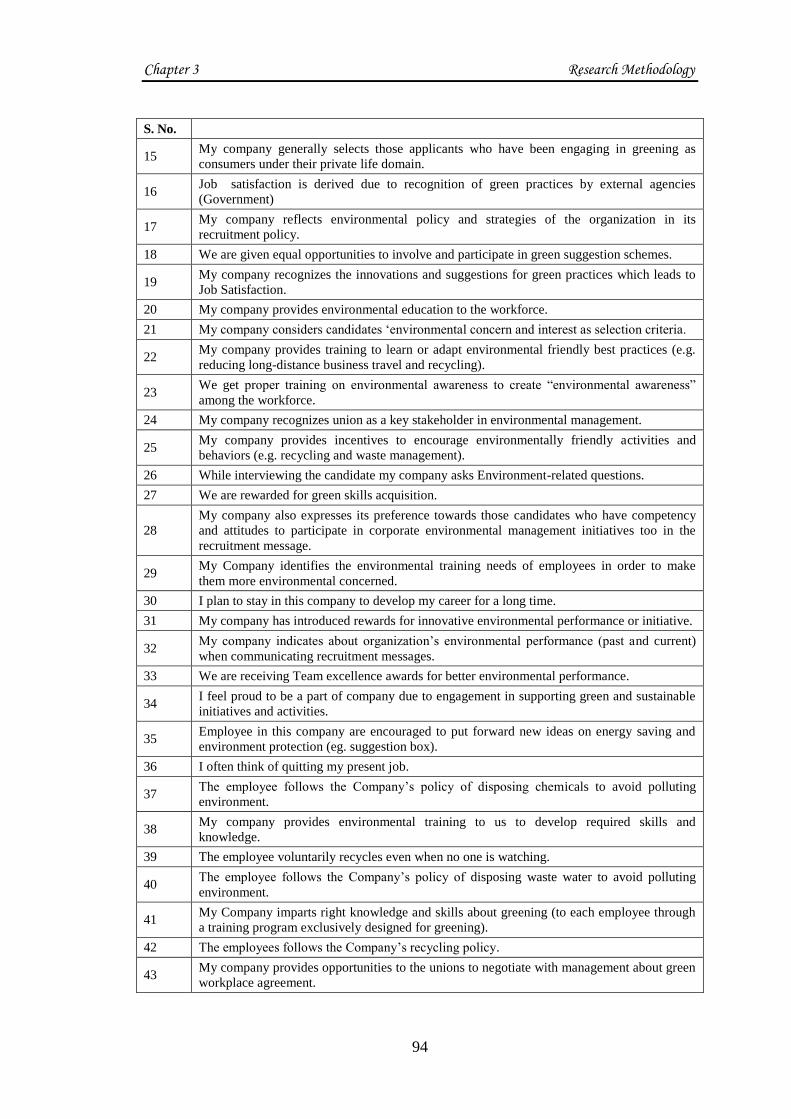
Chapter 3 Research Methodology
94
S. No.
15 My company generally selects those applicants who have been engaging in greening as
consumers under their private life domain.
16 Job satisfaction is derived due to recognition of green practices by external agencies
(Government)
17 My company reflects environmental policy and strategies of the organization in its
recruitment policy.
18 We are given equal opportunities to involve and participate in green suggestion schemes.
19 My company recognizes the innovations and suggestions for green practices which leads to
Job Satisfaction.
20 My company provides environmental education to the workforce.
21 My company considers candidates ‗environmental concern and interest as selection criteria.
22 My company provides training to learn or adapt environmental friendly best practices (e.g.
reducing long-distance business travel and recycling).
23 We get proper training on environmental awareness to create ―environmental awareness‖
among the workforce.
24 My company recognizes union as a key stakeholder in environmental management.
25 My company provides incentives to encourage environmentally friendly activities and
behaviors (e.g. recycling and waste management).
26 While interviewing the candidate my company asks Environment-related questions.
27 We are rewarded for green skills acquisition.
28
My company also expresses its preference towards those candidates who have competency
and attitudes to participate in corporate environmental management initiatives too in the
recruitment message.
29 My Company identifies the environmental training needs of employees in order to make
them more environmental concerned.
30 I plan to stay in this company to develop my career for a long time.
31 My company has introduced rewards for innovative environmental performance or initiative.
32 My company indicates about organization‘s environmental performance (past and current)
when communicating recruitment messages.
33 We are receiving Team excellence awards for better environmental performance.
34 I feel proud to be a part of company due to engagement in supporting green and sustainable
initiatives and activities.
35 Employee in this company are encouraged to put forward new ideas on energy saving and
environment protection (eg. suggestion box).
36 I often think of quitting my present job.
37 The employee follows the Company‘s policy of disposing chemicals to avoid polluting
environment.
38 My company provides environmental training to us to develop required skills and
knowledge.
39 The employee voluntarily recycles even when no one is watching.
40 The employee follows the Company‘s policy of disposing waste water to avoid polluting
environment.
41 My Company imparts right knowledge and skills about greening (to each employee through
a training program exclusively designed for greening).
42 The employees follows the Company‘s recycling policy.
43 My company provides opportunities to the unions to negotiate with management about green
workplace agreement.

Chapter 3 Research Methodology
95
Table 3.4: Final Scale for Study
S. No.
1 The employee promotes environment protection in the workplace.
2 My company has fair policy for performance appraisal and evaluation which leads to Job
Satisfaction.
3 My company includes environmental criteria in the recruitment messages.
4 My company provides training for green initiatives and therefore increase my Job Satisfaction.
5 Everybody in this facility get the opportunities to get training on environmental management
aspects.
6 Employees have a sense of personal obligation to take action to stop wasting resources (eg.
saving water or using less electricity)
7 The employees follow the best practice of operating the machine in order to reduce paper and
energy consumption.
8 We have a system of joint consultations in solving environmental issues of the organization.
9 My company communicates the employer‘s concern about greening through recruitment efforts.
10 The employee‘s behavior of saving paper and energy when operating the machine is beyond the
norm.
11 Company generally selects those candidates who are sufficiently aware of greening to fill job
vacancies.
12 My company provides training to the union representatives in environmental management.
13 We are rewarded financially or non- financially for good environmental performance.
14 Employees in this company are willing to sacrifice some of their self-interests for the benefit of
the environment (eg.turn off the Air- conditioner, lights if you do not need).
15 My company generally selects those applicants who have been engaging in greening as
consumers under their private life domain.
16 Job satisfaction is derived due to recognition of green practices by external agencies
(Government)
17 My company reflects environmental policy and strategies of the organization in its recruitment
policy.
18 We are given equal opportunities to involve and participate in green suggestion schemes.
19 My company recognizes the innovations and suggestions for green practices which leads to Job
Satisfaction.
20 My company provides environmental education to the workforce.
21 My company considers candidates ‗environmental concern and interest as selection criteria.
22 My company provides training to learn or adapt environmental friendly best practices (e.g.
reducing long-distance business travel and recycling).
23 We get proper training on environmental awareness to create ―environmental awareness‖ among
the workforce.
24 My company recognizes union as a key stakeholder in environmental management.
25 My company provides incentives to encourage environmentally friendly activities and behaviors
(e.g. recycling and waste management).
26 While interviewing the candidate my company asks Environment-related questions.
27 We are rewarded for green skills acquisition.

Chapter 3 Research Methodology
96
S. No.
28
My company also expresses its preference towards those candidates who have competency and
attitudes to participate in corporate environmental management initiatives too in the recruitment
message.
29 My Company identifies the environmental training needs of employees in order to make them
more environmental concerned.
30 I plan to stay in this company to develop my career for a long time.
31 My company has introduced rewards for innovative environmental performance or initiative.
32 My company indicates about organization‘s environmental performance (past and current) when
communicating recruitment messages.
33 We are receiving Team excellence awards for better environmental performance.
34 I feel proud to be a part of company due to engagement in supporting green and sustainable
initiatives and activities.
35 Employee in this company are encouraged to put forward new ideas on energy saving and
environment protection (eg. suggestion box).
36 I often think of quitting my present job.
37 The employee follows the Company‘s policy of disposing chemicals to avoid polluting
environment.
38 My company provides environmental training to us to develop required skills and knowledge.
39 The employee voluntarily recycles even when no one is watching.
40 The employee follows the Company‘s policy of disposing waste water to avoid polluting
environment.
41 My Company imparts right knowledge and skills about greening (to each employee through a
training program exclusively designed for greening).
42 The employees follow the Company‘s recycling policy.
Table 3.5 indicates variables, part of questionnaire and number of questions in various
sub-sections. In this research study, the questionnaire has 42 statements.
Table 3.5: Variable and their Corresponding Items in the Questionnaire
S.No. Study Variable Areas Number of Questions
1 Green Recruitment and Selection Statement 1-8
2 Green Training and Development Statement 9-15
3 Green Reward Management Statement 16- 20
4 Green Employee Involvement Statement 21-25
5 Job Satisfaction Statement 26-32
6 Employee Motivation Statement 33-37
7 Organisational Commitment Statement 38-42

Chapter 3 Research Methodology
97
3.13 Techniques of Data Analysis
Under mentioned analysis have been carried out on the data gathered by personal
interview and questionnaire:
3.13.1 Missing Data Analysis
Careful scrutiny of questionnaires has been done to eliminate missing data.
3.13.2 Multivariate Outliers
For detection of multivariate outliers squared Mahalanobis distance (D2) for each case
has been applied.
3.13.3 Test of Normality
Univariate kurtosis value and its critical ratio (i.e., z-value) has been considered to
check data normality. In this context, recommendation by West et al. (1995) regarding
β2 values equal to or greater than 7 have been considered. Along with this, Mardia‘s
normalized estimate of multivariate kurtosis to test the normality of each item has
been utilized.
3.13.4 Multicollinearity
In this research work, it has been checked by Variable Inflation Factor (VIF) for all the
independent variables by running a multivariate regression.
3.13.5 Reliability Test: Cronbach’s Alpha
In a scale, internal consistency refers to a check of each and every time so that when
scale is being assessed the same concept or construct transpires; provided that the
sample is not homogeneous. To test the reliability of the statements Cronbach‘s alpha
has been used.
After the data collection, questionnaire was subjected to editing, coding, hypothesis
testing and statistical analysis to derive meaningful information from the items. The
data collected from the survey were tested using SPSS version 19.0 and analyzed by
SEM using AMOS version 20. According to Malhotra (2007), SEM is generally used
to test the model, having many dependent links amongst different items.
Chapter 3 Research Methodology
98
As stated by Kerlinger (1973), factor analysis provides the researcher with the clear
understanding of the arrangement of the correlation table. In particular, it facilitates the
study of the inter-relationship among the huge set of correlated numeric items that are
correlated by splitting the various measurements into a set of new factors/ variables.
The items which are more correlated forms one construct.
Kerlinger (1973) also stated that PCA method i.e. principle component factor analysis
takes into consideration only the deviation that is linked within a set of measurements.
Usually, the first factor taken in this process, does not postulate meaningful factors.
Rotation by this method, makes higher loading larger and lesser loadings even smaller.
Thus, this process of rotation produces those variables, which can be labelled and
analyzed. As stated by Dhillon and Goldstein (1984), varimax rotation gives the
reasonable division of constructs and that is the reason it was used in this study. While
performing the construct verification, loading for overall factor has also been confirmed.
That is the reason of using the varimax rotation method in this research work.
3.13.6 Factor Analysis
It is a statistical procedure that is generally used to reduce data into some meaningful
information. In this research work, it has assisted the researcher in rearranging the co-
relational relationship between quantities of continuous variables. Exploratory Factor
Analysis (EFA) is a general name used for the step of the process to shrink the data and
further summarizing it into some meaningful information. Factor analysis also
supported this research work, by reducing the number of variables into a set of reduced,
the number of factors or components. Principle Component Analysis i.e. PCA, is a main
procedure in the Exploratory Factor Analysis i.e. EFA process, that was utilized to
investigate the basic structure of the factors.
3.13.7 Structural Equation Modelling
SEM is a mainly confirmatory method of analysing the data rather than exploratory
method. That is, it is normally used to find if a particular model is valid or not by using
SEM. It was used to determine a suitable model through SEM analysis frequently entail
a certain exploratory element. Factor analysis assisted in the development of a
conceptual model with the help of a set of relationships (correlation) between the
Chapter 3 Research Methodology
99
measured variables and the relationship was then expressed as a set of the probable
relationship developed through the model. The results were then finally drawn with the
help of overall indices along with the estimates, standard errors for each parameter.
3.14 Concluding Remarks
This chapter rationalized the use of mixed methodology and particularized the research
design. This chapter also outlined in detail about the different methodologies and
techniques utilized for carrying out the research incorporating the reasons of selecting
the methods, preparation of the questionnaire and its dispensation, checking of the
mechanism for validity and reliability, screening of the data and data analysis
procedure. The gathering of the data incorporated the populace, sample size, sample
size determination and sources of data collection. The method of sampling and its
procedure was talked about in background of the study. A pilot study was performed
with the intent to examine the questionnaire and ensure that the instrument was valid
and reliable. Additionally statistical techniques were used to scrutinize the data in detail.
The results of the data analysis are discussed in subsequent chapters.
Chapter 4 Data Analysis and Findings
100
CHAPTER 4
DATA ANALYSIS AND FINDINGS
The preceding section comprehensively discussed about the methodology, research
design and data collection instruments employed to carry out this research work. This
chapter examines the primary data collected from the personal interviews and survey. It
also presents facts and results derived from the surveys conducted in the process of
refining the research model as proposed by the researcher in the literature review
section by substantiating the traits of each variable, and then identifying them into
constructs.
4.1 Preliminary Data Analysis
Initially, the data was analysed to test and determine (1) instrument‘s reliability - which
was tested via Cronbach alpha; (2) Determinants of Green Human Resource
Management Practices (3) Impact of Green Human Resource Management Practices on
Job Satisfaction, Employee Motivation and Organisational Commitment. The data was
analysed by using various descriptive statistical techniques, such as, Exploratory Factor
Analysis i.e. EFA and Structural Equation modelling i.e. SEM. The data analysis
fulfilled the following objectives:
1. To study various corporate initiatives which help in development of Green
Human Resource Management in the organizations.
2. To examine whether Green Human Resource Management is positively related
with Employee Motivation and Job Satisfaction.
3. To analyse whether Green Human Resource Management is positively related
with Organisational Commitment.
The researcher has used the factor analysis to obtain the factors which influence the
Green Human Resource Management Practices and then SEM method was applied to
perform Confirmatory Factor Analysis (CFA) via measurement model and Model
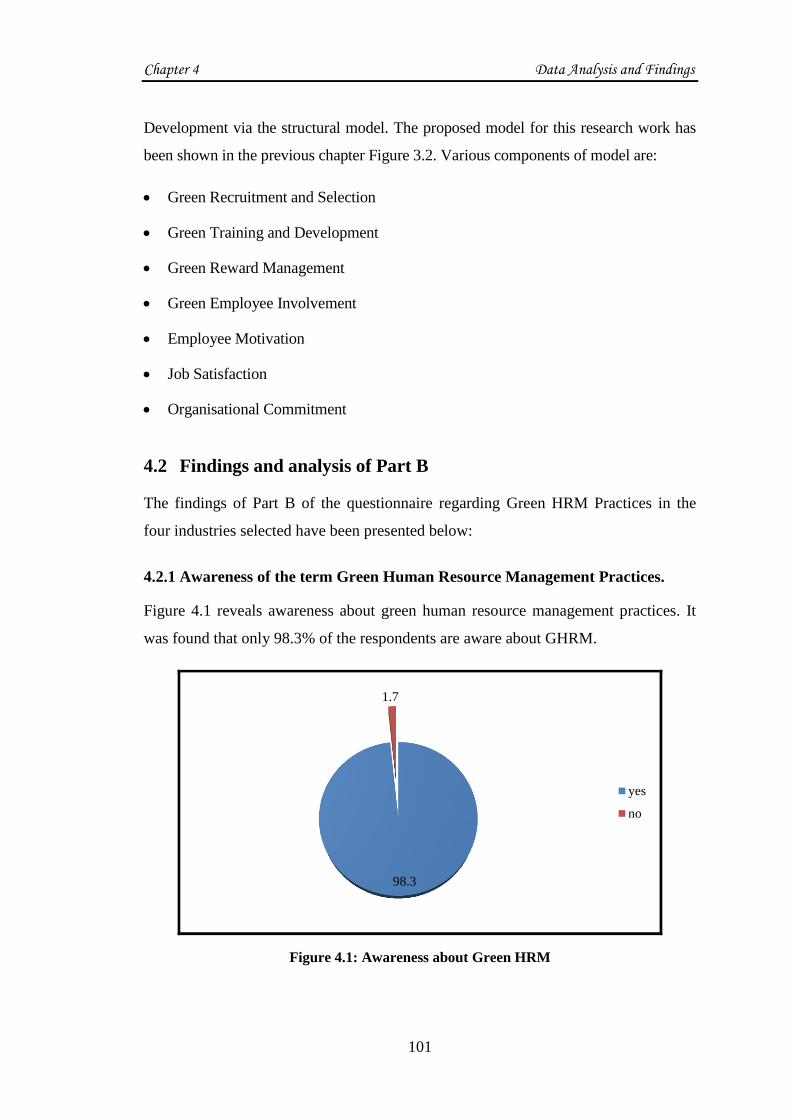
Chapter 4 Data Analysis and Findings
101
Development via the structural model. The proposed model for this research work has
been shown in the previous chapter Figure 3.2. Various components of model are:
Green Recruitment and Selection
Green Training and Development
Green Reward Management
Green Employee Involvement
Employee Motivation
Job Satisfaction
Organisational Commitment
4.2 Findings and analysis of Part B
The findings of Part B of the questionnaire regarding Green HRM Practices in the
four industries selected have been presented below:
4.2.1 Awareness of the term Green Human Resource Management Practices.
Figure 4.1 reveals awareness about green human resource management practices. It
was found that only 98.3% of the respondents are aware about GHRM.
Figure 4.1: Awareness about Green HRM
98.3
1.7
yes
no

Chapter 4 Data Analysis and Findings
102
4.2.2 Awareness of ISO 14000 series issued on environmental management
system including a broad range of environmental disciplines.
It is found that 98.3% of the respondents (Figure 4.2) are aware about ISO 14000 issued on
environmental management system, which includes a broad range of environmental
disciplines
Figure 4.2: Awareness about ISO 14000 series
4.2.3 ISO 14000 Certification
Figure 4.3 highlights that 65.7% companies under survey are ISO 14000 certified.
Figure 4.3: ISO 14000 certification
93.3
6.7
yes
no
34.3
65.7
yes
no

Chapter 4 Data Analysis and Findings
103
4.2.4 Application of Green Human Resource Management Practices
Cost factor associated with waste disposal
It was found that 42.7% of the respondents agreed that cost was the strongest
factor associated with disposal of waste in their company while 41.7% of the
respondents (Figure 4.4) consider it as second strongest reason.
Figure 4.4: Cost factor
Moral obligation to be more socially responsible
It was found that 37% of the respondents considered that the main reason behind the
application of GHRM practices in their organisation was moral obligation to be more
socially responsible while 47% respondent (Figure 4.5) considered it as second strongest
reason.
Figure 4.5: Moral obligation to be more socially responsible
42.7
41.7
6.7
9.0
first position
second position
third position
forth position
37.0
47.0
8.3
7.7
first position
second position
third position
forth position

Chapter 4 Data Analysis and Findings
104
Pressure from regulatory bodies
It was found that 36.3% of the respondents agreed that their company applied
GHRM practices due to pressure from regulatory bodies while 43.3% respondent
(Figure 4.6) considered it as second strongest reason.
Figure 4.6: Pressure from regulatory bodies
Pressure from competitors
It was found that only 17.7% of the respondents (Figure 4.7) agreed that their
company applied GHRM practices due to pressure from the competitors.
Figure 4.7: Pressure from competitors
36.3
43.3
15.7
4.7
first position
second position
third position
forth position
17.7
41.3
20.7
20.3
first position
second position
third position
forth position

Chapter 4 Data Analysis and Findings
105
There are few problems faced by the organizations while adopting Green HRM Practices.
It was observed that most of the companies are into green practices due to cost factor
associated with waste disposal, moral obligation to be more socially responsible, pressure
from regulatory bodies and pressure from competitors. It was observed that 42.7% of the
respondents agreed that cost was the main problem associated with the adopting Green
HRM Practices. 37% of the respondents considered that the main reason behind the
application of GHRM practices in their organisation was moral obligation to be more
socially responsible. 36.3% of the respondents agreed that their company applied GHRM
practices due to pressure from regulatory bodies. 17.7% of the respondents agreed that
their company applied GHRM practices only due to pressure from the competitors.
4.3 Overall Industry and Industry Wise Analysis of Green HRM
Practices
The findings of Green HRM Practices in the four industries selected have been
presented in this section. The respondents were asked to rank their preferences to
certain closed structured questions having various options. This provided ordinal
measurement, which does not possess the desirable qualities of equal intervals or
absolute zeros. The lack of real zero in this type of measurement is not as serious as
the lack of equal intervals. Theoretically, in the absence of interval equality, the
distances with the ordinal scale cannot be added without converting it into an interval
scale. However, as Kerlinger (1978) observes, ‗though most psychological scales are
basically ordinal, we can with considerable assurance often assume equality of
intervals, the point of view is a pragmatic one that the assumption of interval equality
works‘. The rank values were converted into scores as follows:
Ranks Scores
1 5
2 4
3 3
4 2
5 1

Chapter 4 Data Analysis and Findings
106
Accordingly, the scores were added and highest scores were associated with higher
preferences. The statements where opinions were considered; the scoring was done in
the following manner:
Opinion Scores
Strongly Disagree 1
Disagree 2
Neutral 3
Agree 4
Strongly Agree 5
4.3.1 Overall Industry Analysis of Green HRM Practices
Overall industry analysis of Green HRM Practices for different factors has been
discussed in this section below.
Green Recruitment and Selection
Industry wise analysis for Green Recruitment and Selection has been shown in the
Table 4.1 below.
Table 4.1: Top Ranking Statements for Green Recruitment and Selection
Ranks Overall Industry
I My company indicates about organization‘s environmental performance (past and current)
when communicating recruitment messages.
II Company generally selects those candidates who are sufficiently aware of greening to fill job
vacancies.
III My company considers candidates ‗environmental concern and interest as selection criteria.
For overall industry ―My Company indicates about organization‘s environmental
performance (past and current) when communicating recruitment messages‖ emerged
as the top ranking statement.

Chapter 4 Data Analysis and Findings
107
Green Training and Development
Industry wise analysis for Green Training and Development has been shown in the
Table 4.2 below.
Table 4.2: Top Ranking Statements for Green Training and Development
Ranks Overall Industry
I My company provides environmental education to the workforce
II My Company imparts right knowledge and skills about greening (to each employee through a
training program exclusively designed for greening)
III Everybody in this facility get the opportunities to get training on environmental management
aspects
For overall industry ―My Company provides environmental education to the
workforce‖ emerged as the top ranking statement.
Green Reward Management
Industry wise analysis for Green Reward Management has been shown in the Table
4.3 below.
Table 4.3: Top Ranking Statements for Green Reward Management
Ranks Overall Industry
I My company has introduced rewards for innovative environmental performance or
initiative.
II We are rewarded financially or non- financially for good environmental performance.
III We are receiving Team excellence awards for better environmental performance.
For overall industry ―My Company has introduced rewards for innovative
environmental performance or initiative‖ emerged as the top ranking statement.
Green Employee Involvement
Industry wise analysis for Green Employee Involvement has been shown in the Table
4.4 below.

Chapter 4 Data Analysis and Findings
108
Table 4.4: Top Ranking Statements for Green Employee Involvement
Ranks Overall Industry
I We have a system of joint consultations in solving environmental issues of the organization.
II My company recognizes union as a key stakeholder in environmental management.
III My company provides opportunities to the unions to negotiate with management about
green workplace agreement.
For overall industry ―We have a system of joint consultations in solving
environmental issues of the organization‖ emerged as the top ranking statement.
Employee Motivation
Industry wise analysis for Employee Motivation has been shown in the Table 4.5
below.
Table 4.5: Top Ranking Statements for Employee Motivation
Ranks Overall Industry
I Employees have a sense of personal obligation to take action to stop wasting resources (e.g.
saving water or using less electricity)
II The employee promotes environment protection in the workplace.
III Employees in this company are willing to sacrifice some of their self-interests for the benefit
of the environment (e.g. turn off the Air- conditioner, lights if you do not need)
For overall industry ―Employees have a sense of personal obligation to take action to
stop wasting resources (e.g. saving water or using less electricity)‖ emerged as the top
ranking statement.
Job Satisfaction
Industry wise analysis for Job Satisfaction has been shown in the Table 4.6 below.
Table 4.6: Top Ranking Statements for Job Satisfaction
Ranks Overall Industry
I My company provides training for green initiatives and therefore increase my Job
Satisfaction.
II I feel proud to be a part of company due to engagement in supporting green and sustainable
initiatives and activities.
III My company has fair policy for performance appraisal and evaluation which leads to Job
Satisfaction.

Chapter 4 Data Analysis and Findings
109
For overall industry ―My Company provides training for green initiatives and
therefore increase my Job Satisfaction‖ emerged as the top ranking statement.
Organisational Commitment
Industry wise analysis for Organisational Commitment has been shown in the Table
4.7 below.
Table 4.7: Top Ranking Statements for Organisational Commitment
Ranks Overall Industry
I The employee follows the Company‘s policy of disposing chemicals to avoid polluting
environment.
II The employee‘s behavior of saving paper and energy when operating the machine is beyond the
norm.
III The employee follows the Company‘s policy of disposing waste water to avoid polluting
environment.
For overall industry ―The employee follows the Company‘s policy of disposing
chemicals to avoid polluting environment‖ emerged as the top ranking statement.
4.3.2 Industry Wise Analysis of Green HRM Practices
Industry wise analysis of Green HRM Practices for different factors has been
discussed in this section below.
Green Recruitment and Selection
Industry wise analysis for Green Recruitment and Selection has been shown in the
Table 4.8 below.
Table 4.8: Top Ranking Statements for Green Recruitment and Selection
Ranks Type of Industry
Automobile Electronic Food Plastic
I
My Company
considers
candidates‘
environmental
concern and interest
as selection criteria.
My company
communicates the
employer‘s
concern about
greening through
recruitment efforts
My company
indicates about
organization‘s
environmental
performance (past
and current) when
communicating
recruitment
messages.
My company
indicates about
organization‘s
environmental
performance (past
and current) when
communicating
recruitment
messages.

Chapter 4 Data Analysis and Findings
110
Ranks Type of Industry
Automobile Electronic Food Plastic
II
My company
indicates about
organization‘s
environmental
performance (past
and current) when
communicating
recruitment
messages.
Company
generally selects
those candidates
who are
sufficiently aware
of greening to fill
job vacancies.
Company generally
selects those
candidates who are
sufficiently aware of
greening to fill job
vacancies.
Company generally
selects those
candidates who are
sufficiently aware of
greening to fill job
vacancies
III
Company generally
selects those
candidates who are
sufficiently aware of
greening to fill job
vacancies
My company
considers
candidates
‗environmental
concern and
interest as
selection criteria.
My company
considers candidates
‗environmental
concern and interest
as selection criteria.
My company
reflects
environmental
policy and strategies
of the organization
in its recruitment
policy.
For food and plastic industry ―My Company indicates about organization‘s
environmental performance (past and current) when communicating recruitment
messages‖ emerged as the top ranking statement. For automobile industry ―My
Company considers candidates‘ environmental concern and interest as selection
criteria‖ and for electronic industry ―My Company communicates the employer‘s
concern about greening through recruitment efforts‖ emerged as the top ranking
statements. Further ―Company generally selects those candidates who are sufficiently
aware of greening to fill job vacancies‖ emerged as common preferences at second
rank for electronic, food and plastic industry.
Green Training and Development
Industry wise analysis for Green Training and Development has been shown in the
Table 4.9 below.
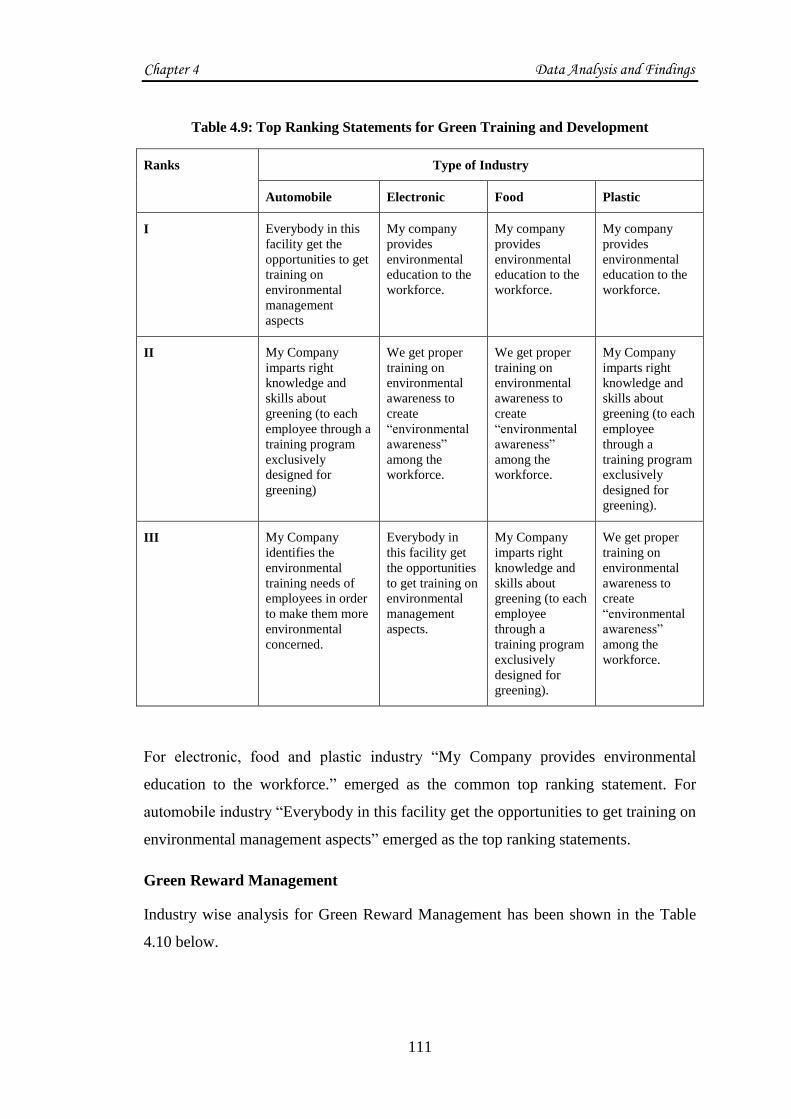
Chapter 4 Data Analysis and Findings
111
Table 4.9: Top Ranking Statements for Green Training and Development
Ranks Type of Industry
Automobile Electronic Food Plastic
I Everybody in this
facility get the
opportunities to get
training on
environmental
management
aspects
My company
provides
environmental
education to the
workforce.
My company
provides
environmental
education to the
workforce.
My company
provides
environmental
education to the
workforce.
II My Company
imparts right
knowledge and
skills about
greening (to each
employee through a
training program
exclusively
designed for
greening)
We get proper
training on
environmental
awareness to
create
―environmental
awareness‖
among the
workforce.
We get proper
training on
environmental
awareness to
create
―environmental
awareness‖
among the
workforce.
My Company
imparts right
knowledge and
skills about
greening (to each
employee
through a
training program
exclusively
designed for
greening).
III My Company
identifies the
environmental
training needs of
employees in order
to make them more
environmental
concerned.
Everybody in
this facility get
the opportunities
to get training on
environmental
management
aspects.
My Company
imparts right
knowledge and
skills about
greening (to each
employee
through a
training program
exclusively
designed for
greening).
We get proper
training on
environmental
awareness to
create
―environmental
awareness‖
among the
workforce.
For electronic, food and plastic industry ―My Company provides environmental
education to the workforce.‖ emerged as the common top ranking statement. For
automobile industry ―Everybody in this facility get the opportunities to get training on
environmental management aspects‖ emerged as the top ranking statements.
Green Reward Management
Industry wise analysis for Green Reward Management has been shown in the Table
4.10 below.
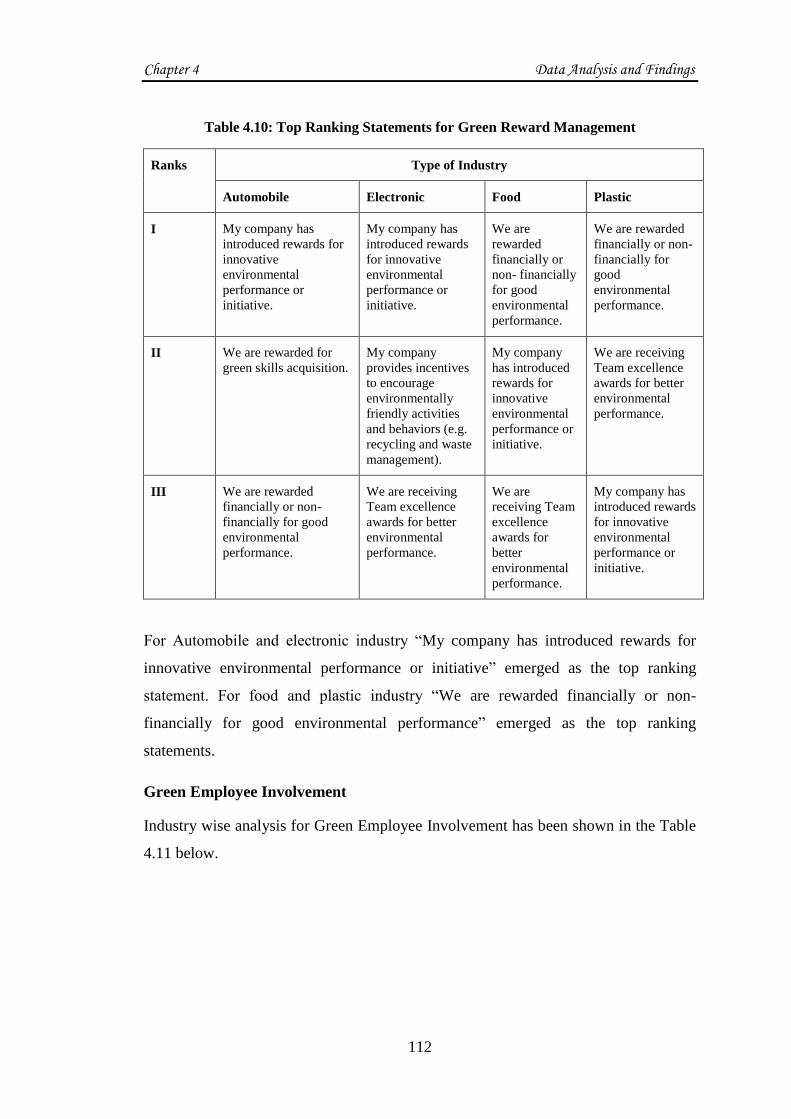
Chapter 4 Data Analysis and Findings
112
Table 4.10: Top Ranking Statements for Green Reward Management
Ranks Type of Industry
Automobile Electronic Food Plastic
I My company has
introduced rewards for
innovative
environmental
performance or
initiative.
My company has
introduced rewards
for innovative
environmental
performance or
initiative.
We are
rewarded
financially or
non- financially
for good
environmental
performance.
We are rewarded
financially or non-
financially for
good
environmental
performance.
II We are rewarded for
green skills acquisition.
My company
provides incentives
to encourage
environmentally
friendly activities
and behaviors (e.g.
recycling and waste
management).
My company
has introduced
rewards for
innovative
environmental
performance or
initiative.
We are receiving
Team excellence
awards for better
environmental
performance.
III We are rewarded
financially or non-
financially for good
environmental
performance.
We are receiving
Team excellence
awards for better
environmental
performance.
We are
receiving Team
excellence
awards for
better
environmental
performance.
My company has
introduced rewards
for innovative
environmental
performance or
initiative.
For Automobile and electronic industry ―My company has introduced rewards for
innovative environmental performance or initiative‖ emerged as the top ranking
statement. For food and plastic industry ―We are rewarded financially or non-
financially for good environmental performance‖ emerged as the top ranking
statements.
Green Employee Involvement
Industry wise analysis for Green Employee Involvement has been shown in the Table
4.11 below.
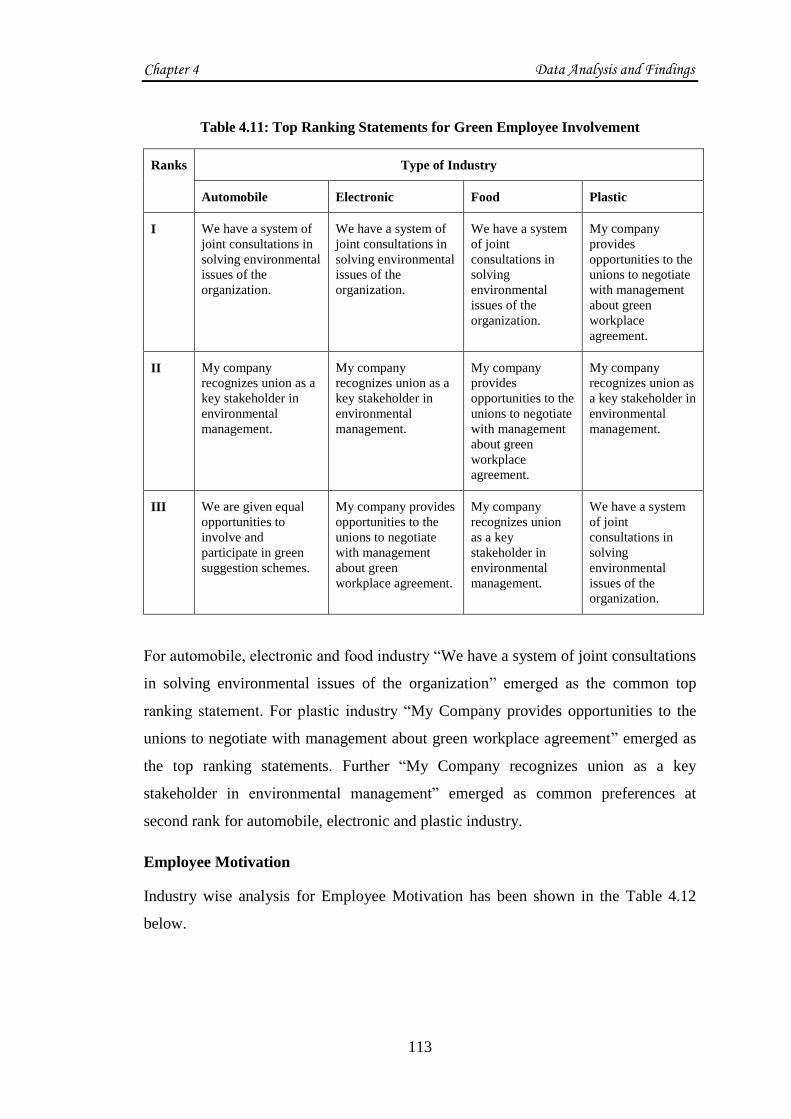
Chapter 4 Data Analysis and Findings
113
Table 4.11: Top Ranking Statements for Green Employee Involvement
Ranks Type of Industry
Automobile Electronic Food Plastic
I We have a system of
joint consultations in
solving environmental
issues of the
organization.
We have a system of
joint consultations in
solving environmental
issues of the
organization.
We have a system
of joint
consultations in
solving
environmental
issues of the
organization.
My company
provides
opportunities to the
unions to negotiate
with management
about green
workplace
agreement.
II My company
recognizes union as a
key stakeholder in
environmental
management.
My company
recognizes union as a
key stakeholder in
environmental
management.
My company
provides
opportunities to the
unions to negotiate
with management
about green
workplace
agreement.
My company
recognizes union as
a key stakeholder in
environmental
management.
III We are given equal
opportunities to
involve and
participate in green
suggestion schemes.
My company provides
opportunities to the
unions to negotiate
with management
about green
workplace agreement.
My company
recognizes union
as a key
stakeholder in
environmental
management.
We have a system
of joint
consultations in
solving
environmental
issues of the
organization.
For automobile, electronic and food industry ―We have a system of joint consultations
in solving environmental issues of the organization‖ emerged as the common top
ranking statement. For plastic industry ―My Company provides opportunities to the
unions to negotiate with management about green workplace agreement‖ emerged as
the top ranking statements. Further ―My Company recognizes union as a key
stakeholder in environmental management‖ emerged as common preferences at
second rank for automobile, electronic and plastic industry.
Employee Motivation
Industry wise analysis for Employee Motivation has been shown in the Table 4.12
below.
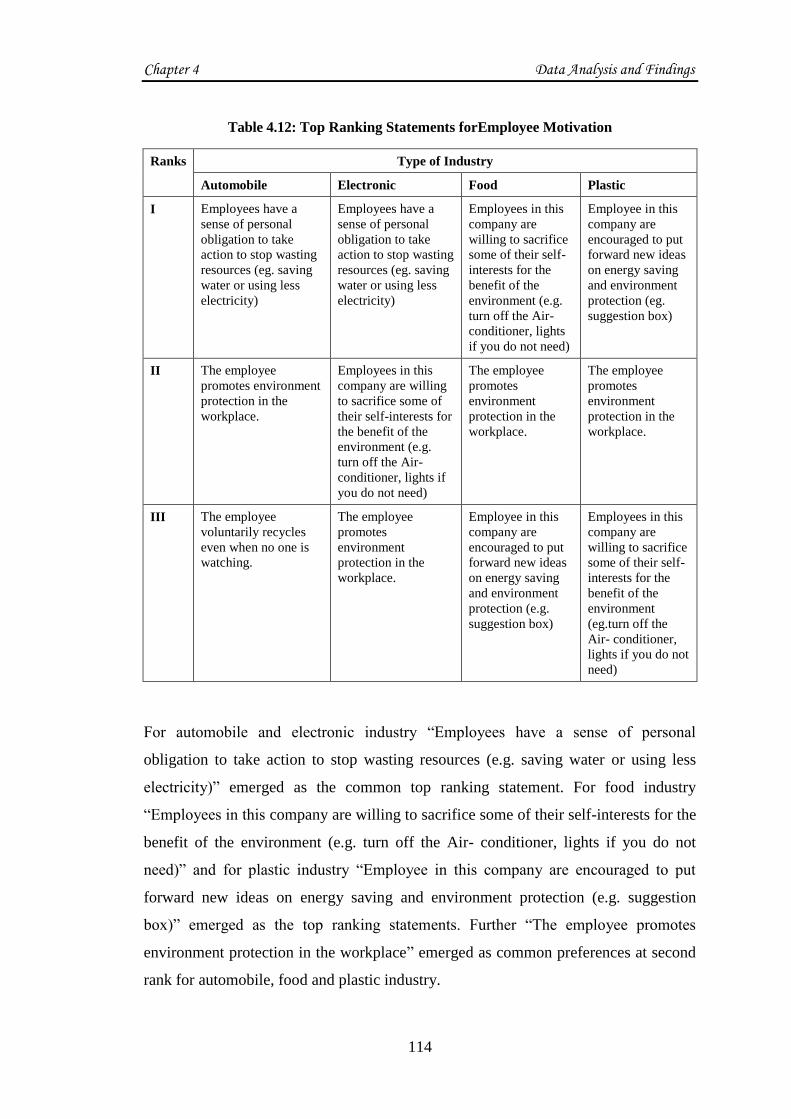
Chapter 4 Data Analysis and Findings
114
Table 4.12: Top Ranking Statements forEmployee Motivation
Ranks Type of Industry
Automobile Electronic Food Plastic
I Employees have a
sense of personal
obligation to take
action to stop wasting
resources (eg. saving
water or using less
electricity)
Employees have a
sense of personal
obligation to take
action to stop wasting
resources (eg. saving
water or using less
electricity)
Employees in this
company are
willing to sacrifice
some of their self-
interests for the
benefit of the
environment (e.g.
turn off the Air-
conditioner, lights
if you do not need)
Employee in this
company are
encouraged to put
forward new ideas
on energy saving
and environment
protection (eg.
suggestion box)
II The employee
promotes environment
protection in the
workplace.
Employees in this
company are willing
to sacrifice some of
their self-interests for
the benefit of the
environment (e.g.
turn off the Air-
conditioner, lights if
you do not need)
The employee
promotes
environment
protection in the
workplace.
The employee
promotes
environment
protection in the
workplace.
III The employee
voluntarily recycles
even when no one is
watching.
The employee
promotes
environment
protection in the
workplace.
Employee in this
company are
encouraged to put
forward new ideas
on energy saving
and environment
protection (e.g.
suggestion box)
Employees in this
company are
willing to sacrifice
some of their self-
interests for the
benefit of the
environment
(eg.turn off the
Air- conditioner,
lights if you do not
need)
For automobile and electronic industry ―Employees have a sense of personal
obligation to take action to stop wasting resources (e.g. saving water or using less
electricity)‖ emerged as the common top ranking statement. For food industry
―Employees in this company are willing to sacrifice some of their self-interests for the
benefit of the environment (e.g. turn off the Air- conditioner, lights if you do not
need)‖ and for plastic industry ―Employee in this company are encouraged to put
forward new ideas on energy saving and environment protection (e.g. suggestion
box)‖ emerged as the top ranking statements. Further ―The employee promotes
environment protection in the workplace‖ emerged as common preferences at second
rank for automobile, food and plastic industry.

Chapter 4 Data Analysis and Findings
115
Job Satisfaction
Industry wise analysis for Job Satisfaction has been shown in the Table 4.13 below.
Table 4.13: Top Ranking Statements for Job Satisfaction
Ranks Type of Industry
Automobile Electronic Food Plastic
I My company has fair
policy for performance
appraisal and
evaluation which leads
to Job Satisfaction.
My company
recognizes the
innovations
and
suggestions for
green practices
which leads to
Job
Satisfaction
My company
provides
training for
green initiatives
and therefore
increase my Job
Satisfaction.
I feel proud to
be a part of
company due to
engagement in
supporting green
and sustainable
initiatives and
activities.
II I feel proud to be a part
of company due to
engagement in
supporting green and
sustainable initiatives
and activities.
My company
provides
training for
green
initiatives and
therefore
increase my
Job
Satisfaction.
I feel proud to
be a part of
company due to
engagement in
supporting green
and sustainable
initiatives and
activities.
My company
has fair policy
for performance
appraisal and
evaluation
which leads to
Job Satisfaction.
III My company provides
training for green
initiatives and
therefore increase my
Job Satisfaction.
My company
has fair policy
for
performance
appraisal and
evaluation
which leads to
Job
Satisfaction.
Job Satisfaction
is derived due to
recognition of
green practices
by external
agencies
(Government)
Job Satisfaction
is derived due to
recognition of
green practices
by external
agencies
(Government)
For automobile industry ―My Company has fair policy for performance appraisal and
evaluation which leads to Job Satisfaction‖ emerged as the common top ranking
statement. For electronic industry ―My company recognizes the innovations and
suggestions for green practices which leads to Job Satisfaction‖, for food industry
―My company provides training for green initiatives and therefore increase my Job
Satisfaction‖ and for plastic industry ―I feel proud to be a part of company due to
engagement in supporting green and sustainable initiatives and activities‖ emerged as
the top ranking statements.

Chapter 4 Data Analysis and Findings
116
Organisational Commitment
Industry wise analysis for Organisational Commitment has been shown in the Table
4.14 below.
Table 4.14: Top Ranking Statements for Organisational Commitment
Ranks Type of Industry
Automobile Electronic Food Plastic
I The employee‘s behavior
of saving paper and
energy when operating
the machine is beyond
the norm.
The employee
follows the
Company‘s policy
of disposing
chemicals to avoid
polluting
environment.
The employee‘s
behavior of saving
paper and energy when
operating the machine
is beyond the norm.
The
employee‘s
behavior of
saving paper
and energy
when operating
the machine is
beyond the
norm.
II The employee follows
the Company‘s policy of
disposing chemicals to
avoid polluting
environment.
The employee‘s
behavior of saving
paper and energy
when operating the
machine is beyond
the norm.
The employee follows
the Company‘s policy
of disposing chemicals
to avoid polluting
environment.
The employee
follows the
Company‘s
policy of
disposing
chemicals to
avoid polluting
environment.
III The employee follows
the Company‘s policy of
disposing waste water to
avoid polluting
environment.
The employee
follows the
Company‘s policy
of disposing waste
water to avoid
polluting
environment.
The employee follows
the Company‘s policy
of disposing waste
water to avoid polluting
environment.
The employee
follows the
Company‘s
policy of
disposing
waste water to
avoid polluting
environment.
For automobile, food and plastic industry ―The employee‘s behaviour of saving paper
and energy when operating the machine is beyond the norm‖ emerged as the common
top ranking statement. For electronic industry ―The employee follows the Company‘s
policy of disposing chemicals to avoid polluting environment‖ emerged as the top
ranking statements. Further ―The employee follows the Company‘s policy of
disposing chemicals to avoid polluting environment‖ emerged as common preferences
at second rank for automobile, food and plastic industry.

Chapter 4 Data Analysis and Findings
117
4.4 Data Analysis
Data analysis was mainly used to check the assumption and to verify the research
inquiries. It also considered the methods and types of the tools to be used, and finally
helped in the development of the scheme, regarding data collection. In this context, for
data analysis, SPSS version 19 was used for various statistical tests applied.
4.4.1 Data Screening
Precisely, data screening is the course of action to make sure that data is clean and
ready to go before we carry out advanced statistical analysis. Data should essentially be
examined so as to make certain that the data is useable, dependable and authenticated
for assessing fundamental theory.
4.4.1.1 Missing data
Several missing values in data create problem to run data analysis. The EFA and CFA
entail a specific number of data points to facilitate the computation of estimates. It also
includes biasness on the part of respondents, who have not responded some of the
questions due to some personal bias or common issues. Upper limit for missing data
was compliant but by and large, more than 10% of missing values could be problematic
for analysis purposes. In this study, due care was taken during personal interaction for
questionnaire filling process so that no question remained unanswered.
4.4.2 Reliability
It is ―concerned with the stability, constancy, and reproducibility of measurement
results (Sekaran, 2000).‖ Reliability is considered as the utmost essential element for
checking the quality of any measurement instrument. For instance, it assists in
determining the inconsistencies if any and its influence on the findings of the
measurement instrument. Whenever there are many items relating to one construct in
the research work, then it becomes essential to check the internal reliability of the
instrument (Bryman and Cramer, 2005).
In this research work, there were multiple measurements consisting of numerous items.
For instance, there were eight items that were used for measuring the Green Recruitment

Chapter 4 Data Analysis and Findings
118
and Selection. Seven items were used for measuring Green Training and Development,
and Five were used to measure Green Reward Management, and so on, as elucidated
earlier. Name of the factors used and their codes are shown in Table 4.15. As suggested
by Nunally (1978), to check or estimate the uniformity in the answers of the respondents,
reliability of the measurement of items was checked. To measure it, Cronbach‘s alpha i.e.
the reliability coefficient was used and it was found out to be greater than 0.7 for all the
individual constructs as shown in Table 4.16. According to many researchers also
(Sekaran, 2000; Hair, 2006), the range of the Reliability coefficients should be greater
than 0.7.
Table 4.15: Name of the Factors and their Codes
Codes Factor Name
GRS Green Recruitment and Selection
GTD Green Training and Development
GR Green Reward Management
GEI Green Employee Involvement
EM Employee Motivation
JS Job Satisfaction
OC Organisational Commitment
Table 4.16: Summary of Reliability Analysis
Factor Name Items Cronbach Alpha
Coefficient
Reliability
Results
Green Recruitment and Selection 8 0.928 Good
Green Training and Development 7 0.880 Good
Green Reward Management 5 0.866 Good
Green Employee Involvement 5 0.869 Good
Employee Motivation 5 0.852 Good
Job Satisfaction 7 0.916 Good
Organisational Commitment 5 0.853 Good
Overall 42 0.913 Good
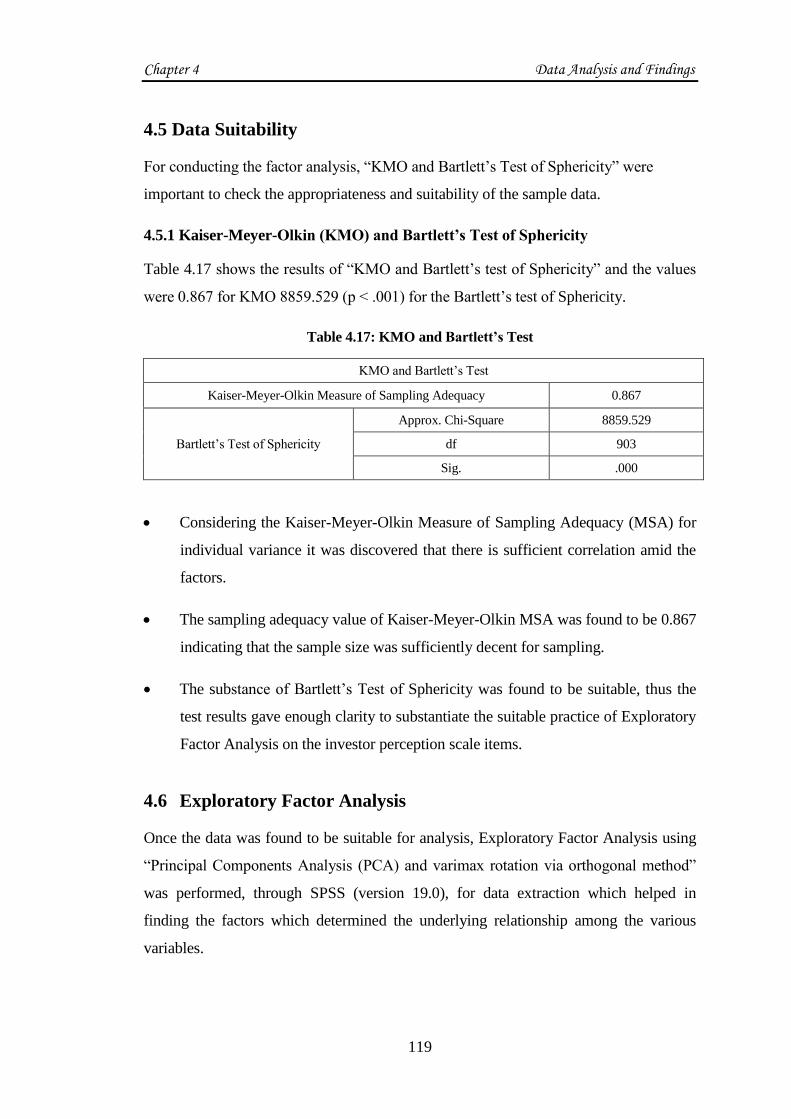
Chapter 4 Data Analysis and Findings
119
4.5 Data Suitability
For conducting the factor analysis, ―KMO and Bartlett‘s Test of Sphericity‖ were
important to check the appropriateness and suitability of the sample data.
4.5.1 Kaiser-Meyer-Olkin (KMO) and Bartlett’s Test of Sphericity
Table 4.17 shows the results of ―KMO and Bartlett‘s test of Sphericity‖ and the values
were 0.867 for KMO 8859.529 (p < .001) for the Bartlett‘s test of Sphericity.
Table 4.17: KMO and Bartlett’s Test
KMO and Bartlett‘s Test
Kaiser-Meyer-Olkin Measure of Sampling Adequacy 0.867
Bartlett‘s Test of Sphericity
Approx. Chi-Square 8859.529
df 903
Sig. .000
Considering the Kaiser-Meyer-Olkin Measure of Sampling Adequacy (MSA) for
individual variance it was discovered that there is sufficient correlation amid the
factors.
The sampling adequacy value of Kaiser-Meyer-Olkin MSA was found to be 0.867
indicating that the sample size was sufficiently decent for sampling.
The substance of Bartlett‘s Test of Sphericity was found to be suitable, thus the
test results gave enough clarity to substantiate the suitable practice of Exploratory
Factor Analysis on the investor perception scale items.
4.6 Exploratory Factor Analysis
Once the data was found to be suitable for analysis, Exploratory Factor Analysis using
―Principal Components Analysis (PCA) and varimax rotation via orthogonal method‖
was performed, through SPSS (version 19.0), for data extraction which helped in
finding the factors which determined the underlying relationship among the various
variables.
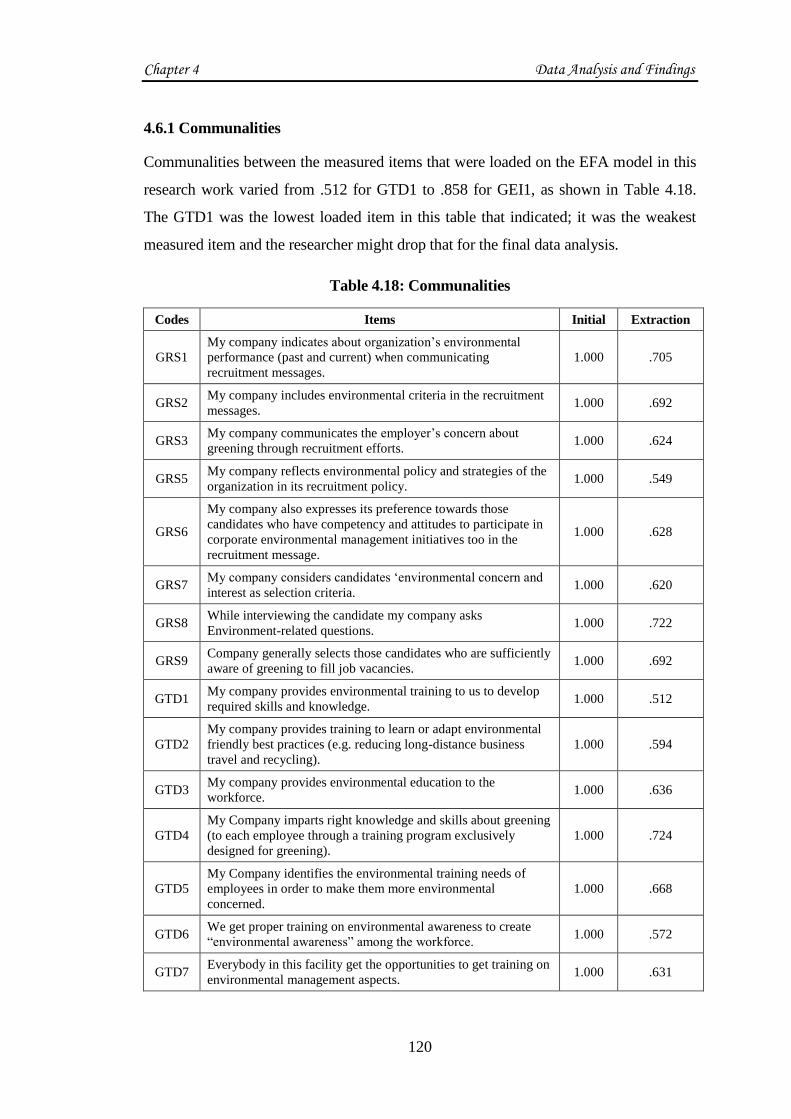
Chapter 4 Data Analysis and Findings
120
4.6.1 Communalities
Communalities between the measured items that were loaded on the EFA model in this
research work varied from .512 for GTD1 to .858 for GEI1, as shown in Table 4.18.
The GTD1 was the lowest loaded item in this table that indicated; it was the weakest
measured item and the researcher might drop that for the final data analysis.
Table 4.18: Communalities
Codes Items Initial Extraction
GRS1
My company indicates about organization‘s environmental
performance (past and current) when communicating
recruitment messages.
1.000 .705
GRS2 My company includes environmental criteria in the recruitment
messages. 1.000 .692
GRS3 My company communicates the employer‘s concern about
greening through recruitment efforts. 1.000 .624
GRS5 My company reflects environmental policy and strategies of the
organization in its recruitment policy. 1.000 .549
GRS6
My company also expresses its preference towards those
candidates who have competency and attitudes to participate in
corporate environmental management initiatives too in the
recruitment message.
1.000 .628
GRS7 My company considers candidates ‗environmental concern and
interest as selection criteria. 1.000 .620
GRS8 While interviewing the candidate my company asks
Environment-related questions. 1.000 .722
GRS9 Company generally selects those candidates who are sufficiently
aware of greening to fill job vacancies. 1.000 .692
GTD1 My company provides environmental training to us to develop
required skills and knowledge. 1.000 .512
GTD2
My company provides training to learn or adapt environmental
friendly best practices (e.g. reducing long-distance business
travel and recycling).
1.000 .594
GTD3 My company provides environmental education to the
workforce. 1.000 .636
GTD4
My Company imparts right knowledge and skills about greening
(to each employee through a training program exclusively
designed for greening).
1.000 .724
GTD5
My Company identifies the environmental training needs of
employees in order to make them more environmental
concerned.
1.000 .668
GTD6 We get proper training on environmental awareness to create
―environmental awareness‖ among the workforce. 1.000 .572
GTD7 Everybody in this facility get the opportunities to get training on
environmental management aspects. 1.000 .631
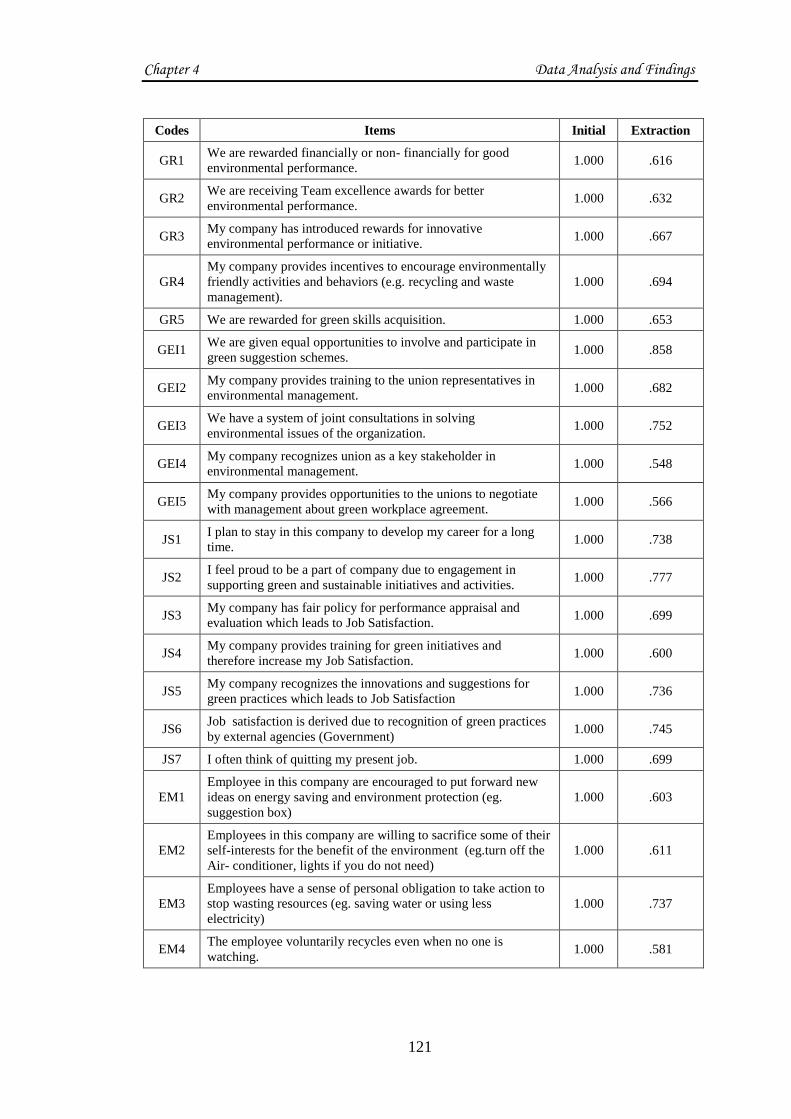
Chapter 4 Data Analysis and Findings
121
Codes Items Initial Extraction
GR1 We are rewarded financially or non- financially for good
environmental performance. 1.000 .616
GR2 We are receiving Team excellence awards for better
environmental performance. 1.000 .632
GR3 My company has introduced rewards for innovative
environmental performance or initiative. 1.000 .667
GR4
My company provides incentives to encourage environmentally
friendly activities and behaviors (e.g. recycling and waste
management).
1.000 .694
GR5 We are rewarded for green skills acquisition. 1.000 .653
GEI1 We are given equal opportunities to involve and participate in
green suggestion schemes. 1.000 .858
GEI2 My company provides training to the union representatives in
environmental management. 1.000 .682
GEI3 We have a system of joint consultations in solving
environmental issues of the organization. 1.000 .752
GEI4 My company recognizes union as a key stakeholder in
environmental management. 1.000 .548
GEI5 My company provides opportunities to the unions to negotiate
with management about green workplace agreement. 1.000 .566
JS1 I plan to stay in this company to develop my career for a long
time. 1.000 .738
JS2 I feel proud to be a part of company due to engagement in
supporting green and sustainable initiatives and activities. 1.000 .777
JS3 My company has fair policy for performance appraisal and
evaluation which leads to Job Satisfaction. 1.000 .699
JS4 My company provides training for green initiatives and
therefore increase my Job Satisfaction. 1.000 .600
JS5 My company recognizes the innovations and suggestions for
green practices which leads to Job Satisfaction 1.000 .736
JS6 Job satisfaction is derived due to recognition of green practices
by external agencies (Government) 1.000 .745
JS7 I often think of quitting my present job. 1.000 .699
EM1
Employee in this company are encouraged to put forward new
ideas on energy saving and environment protection (eg.
suggestion box)
1.000 .603
EM2
Employees in this company are willing to sacrifice some of their
self-interests for the benefit of the environment (eg.turn off the
Air- conditioner, lights if you do not need)
1.000 .611
EM3
Employees have a sense of personal obligation to take action to
stop wasting resources (eg. saving water or using less
electricity)
1.000 .737
EM4 The employee voluntarily recycles even when no one is
watching. 1.000 .581
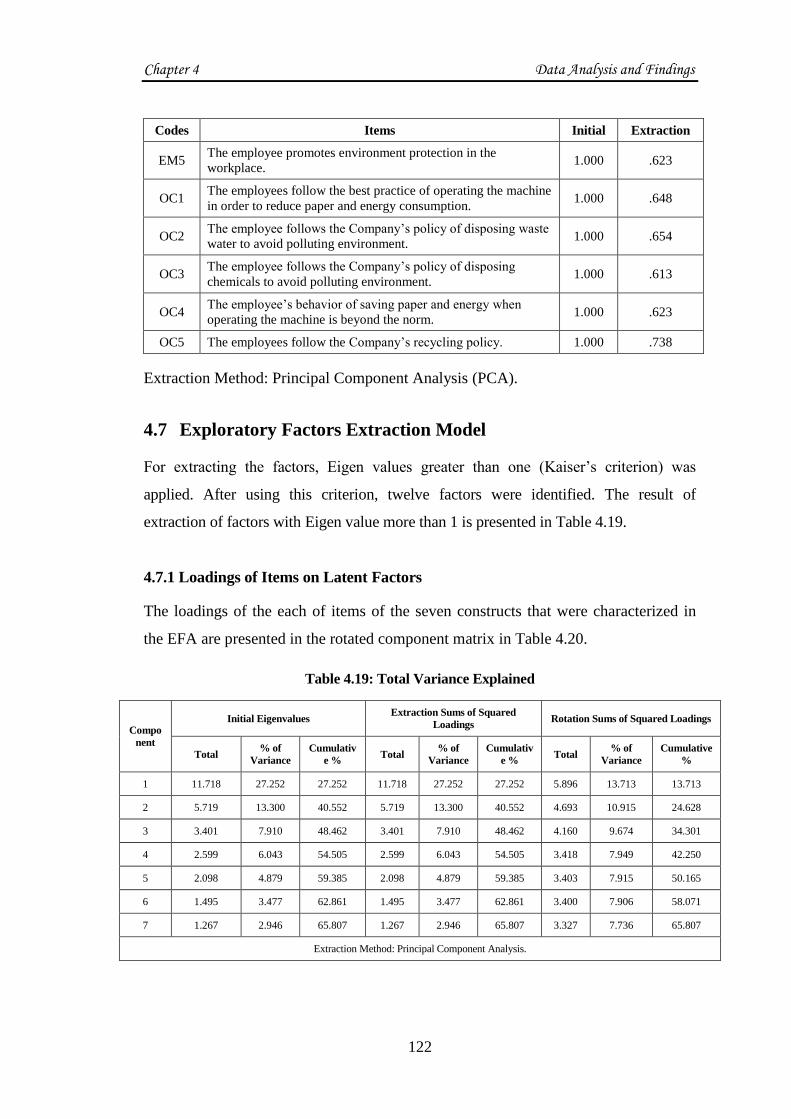
Chapter 4 Data Analysis and Findings
122
Codes Items Initial Extraction
EM5 The employee promotes environment protection in the
workplace. 1.000 .623
OC1 The employees follow the best practice of operating the machine
in order to reduce paper and energy consumption. 1.000 .648
OC2 The employee follows the Company‘s policy of disposing waste
water to avoid polluting environment. 1.000 .654
OC3 The employee follows the Company‘s policy of disposing
chemicals to avoid polluting environment. 1.000 .613
OC4 The employee‘s behavior of saving paper and energy when
operating the machine is beyond the norm. 1.000 .623
OC5 The employees follow the Company‘s recycling policy. 1.000 .738
Extraction Method: Principal Component Analysis (PCA).
4.7 Exploratory Factors Extraction Model
For extracting the factors, Eigen values greater than one (Kaiser‘s criterion) was
applied. After using this criterion, twelve factors were identified. The result of
extraction of factors with Eigen value more than 1 is presented in Table 4.19.
4.7.1 Loadings of Items on Latent Factors
The loadings of the each of items of the seven constructs that were characterized in
the EFA are presented in the rotated component matrix in Table 4.20.
Table 4.19: Total Variance Explained
Compo
nent
Initial Eigenvalues Extraction Sums of Squared
Loadings Rotation Sums of Squared Loadings
Total % of
Variance
Cumulativ
e % Total
% of
Variance
Cumulativ
e % Total
% of
Variance
Cumulative
%
1 11.718 27.252 27.252 11.718 27.252 27.252 5.896 13.713 13.713
2 5.719 13.300 40.552 5.719 13.300 40.552 4.693 10.915 24.628
3 3.401 7.910 48.462 3.401 7.910 48.462 4.160 9.674 34.301
4 2.599 6.043 54.505 2.599 6.043 54.505 3.418 7.949 42.250
5 2.098 4.879 59.385 2.098 4.879 59.385 3.403 7.915 50.165
6 1.495 3.477 62.861 1.495 3.477 62.861 3.400 7.906 58.071
7 1.267 2.946 65.807 1.267 2.946 65.807 3.327 7.736 65.807
Extraction Method: Principal Component Analysis.

Chapter 4 Data Analysis and Findings
123
Table 4.20: Rotated Component Matrix
Rotated Component Matrixa
Component
1 2 3 4 5 6 7
GRS1 .818
GRS2 .823
GRS3 .781
GRS5 .731
GRS6 .771
GRS7 .779
GRS8 .839
GRS9 .824
GTD1 .638
GTD2 .703
GTD3 .645
GTD4 .784
GTD5 .731
GTD6 .633
GTD7 .700
GR1 .727
GR2 .704
GR3 .746
GR4 .713
GR5 .770
GEI1 .788
GEI2 .636
GEI3 .741
GEI4 .620
GEI5 .690
JS1 .701
JS2 .796
JS3 .750
JS4 .676
JS5 .813
JS6 .826
JS7 .646
EM1 .635
EM2 .714
EM3 .805
EM4 .664
EM5 .687
OC1 .754
OC2 .785
OC3 .729
OC4 .692
OC5 .819
Extraction Method: Principal Component Analysis.
Rotation Method: Varimax with Kaiser Normalization.
a. Rotation converged in 7 iteratio

Chapter 4 Data Analysis and Findings
124
4.8 Interpretation of Factors
According to Tabachnick and Fidell (2007), each construct needs to be given a unique
label that shows its features and helps in the explanation of each factor. Each of the
variables affecting Green HRM Practices, were obtained through PCA in the process of
EFA in this research work, which is discussed below. The total variance explained,
factor loading of each item of the construct, and Cronbach alpha for each construct
related to the Green HRM Practices, are also discussed in the subsequent sub-sections.
4.8.1 Green Recruitment and Selection
The foremost variable that has the largest total variance explained has been clearly
explained as ―Green Recruitment and Selection‖.
Table 4.21: Summary of Factor Loadings, Percentage of Total Variance Explained and
Reliability of Green Recruitment and Selection
Factor No. 1: Green Recruitment and
Selection
Factor
Loadings
% of Variance Explained
Cronbach’s
Alpha Items
“Extraction
Sums of
Squared
Loadings”
“Rotation
Sums of
Squared
Loadings”
My company indicates about
organization‘s environmental performance
(past and current) when communicating
recruitment messages.
.818 27.252 13.713 0.928
My company includes environmental
criteria in the recruitment messages. .823
My company communicates the
employer‘s concern about greening through recruitment efforts.
.781
My company reflects environmental
policy and strategies of the organization in its recruitment policy.
.731
My company also expresses its preference
towards those candidates who have
competency and attitudes to participate in
corporate environmental management
initiatives too in the recruitment message.
.771
My company considers candidates
‗environmental concern and interest as selection criteria.
.779
While interviewing the candidate my
company asks Environment-related questions.
.839
Company generally selects those
candidates who are sufficiently aware of greening to fill job vacancies.
.824

Chapter 4 Data Analysis and Findings
125
Table 4.21 represents the summary of factor loadings, percentage of total variance
explained and reliability of Green Recruitment and Selection. Factor loadings, which is
coefficient of correlation between the statements and a factor, for all the items were
found to be above the minimum criteria of 0.40 and percentage of total variance
explained was 27.252%. Value of Cronbach‘s Alpha i.e. reliability coefficient was more
than 0.7 for this construct.
4.8.2 Green Training and Development
The Second construct has been explained as ―Green Training and Development‖.
Table 4.22: Summary of Factor Loadings, Percentage of Total Variance Explained and
Reliability of Green Training and Development
Factor No. 2: Green Training and
Development
Factor
Loadings
% of Variance Explained
Cronbach’s
Alpha Items
“Extraction
Sums of
Squared
Loadings”
“Rotation
Sums of
Squared
Loadings”
My company provides environmental training
to us to develop required skills and knowledge. .638 7.910 9.674 0.880
My company provides training to learn or
adapt environmental friendly best practices
(e.g. reducing long-distance business travel and
recycling).
.703
My company provides environmental
education to the workforce. .645
My Company imparts right knowledge and
skills about greening (to each employee
through a training program exclusively
designed for greening).
.784
My Company identifies the environmental
training needs of employees in order to make
them more environmental concerned.
.731
We get proper training on environmental
awareness to create ―environmental awareness‖
among the workforce.
.633
Everybody in this facility get the opportunities
to get training on environmental management
aspects.
.700

Chapter 4 Data Analysis and Findings
126
Table 4.22 represents the summary of factor loadings, percentage of total variance
explained and reliability of Green Training and Development. Factor loadings for all the
items were above the minimum criteria of 0.40 and percentage of total variance explained
was 9.674 %. Value of Cronbach‘s Alpha i.e. reliability coefficient was more than 0.7 for
this construct.
4.8.3 Green Reward Management
The Third construct has been explained as ―Green Reward Management‖.
Table 4.23: Summary of Factor Loadings, Percentage of Total Variance Explained and
Reliability of Green Reward Management
Factor No. 3 Green Reward Management
Factor
Loadings
% of Variance Explained
Cronbach’s
Alpha Items
“Extraction
Sums of
Squared
Loadings”
“Rotation
Sums of
Squared
Loadings”
We are rewarded financially or non-
financially for good environmental
performance.
.727 4.879 7.915 0.866
We are receiving Team excellence awards
for better environmental performance. .704
My company has introduced rewards for
innovative environmental performance or
initiative.
.746
My company provides incentives to
encourage environmentally friendly
activities and behaviors (e.g. recycling and
waste management).
.713
We are rewarded for green skills acquisition. .770
Table 4.23 represents the summary of factor loadings, percentage of total variance
explained and reliability of Green Reward Management. Factor loadings for all the
items were above the minimum criteria of 0.40 and percentage of total variance
explained was 7.915 %. Value of Cronbach‘s Alpha i.e. reliability coefficient was more
than 0.7 for this construct.

Chapter 4 Data Analysis and Findings
127
4.8.4 Green Employee Involvement
The fourth variable has been elucidated as, ―Green Employee Involvement‖.
Table 4.24: Summary of Factor Loadings, Percentage of Total Variance Explained and
Reliability of Green Employee Involvement
Factor No. 4: Green Employee
Involvement
Factor
Loadings
% of Variance
Explained
Cronbach’s
Alpha
Items
“Extraction
Sums of
Squared
Loadings”
“Rotation
Sums of
Squared
Loadings”
We are given equal opportunities to
involve and participate in green
suggestion schemes.
.788 3.477 7.906 0.869
My company provides training to the
union representatives in environmental
management.
.636
We have a system of joint consultations
in solving environmental issues of the
organization.
.741
My company recognizes union as a key
stakeholder in environmental
management.
.620
My company provides opportunities to
the unions to negotiate with management
about green workplace agreement.
.690
Table 4.24 represents the summary of factor loadings, percentage of total variance
explained and reliability of Green Employee Involvement. Factor loadings for all the
items were above the minimum criteria of 0.40 and percentage of total variance
explained was 7.906%. Value of Cronbach‘s Alpha i.e. reliability coefficient was more
than 0.7 for this construct.

Chapter 4 Data Analysis and Findings
128
4.8.5 Employee Motivation
The fifth construct has been described as, ―Employee Motivation‖.
Table 4.25: Summary of Factor Loadings, Percentage of Total Variance Explained and
Reliability ofEmployee Motivation
Factor No. 5:Employee Motivation
Factor
Loadings
% of variance explained
Cronbach’s
Alpha Items
“Extraction
Sums of
Squared
Loadings”
“Rotation
Sums of
Squared
Loadings”
Employee in this company are encouraged
to put forward new ideas on energy saving
and environment protection (eg. suggestion
box)
.635 2.946 7.736 0.852
Employees in this company are willing to
sacrifice some of their self-interests for the
benefit of the environment (eg.turn off the
Air- conditioner, lights if you do not need)
.714
Employees have a sense of personal
obligation to take action to stop wasting
resources (eg. saving water or using less
electricity)
.805
The employee voluntarily recycles even
when no one is watching. .664
The employee promotes environment
protection in the workplace. .687
Table 4.25 represents the summary of factor loadings, percentage of total variance
explained and reliability of Employee Motivation. Factor loadings for all the items were
above the minimum criteria of 0.40 and percentage of total variance explained was 7.736
%. Value of Cronbach‘s Alpha i.e. reliability coefficient was more than 0.7 for this
construct.

Chapter 4 Data Analysis and Findings
129
4.8.6 Job Satisfaction
The sixth construct has been interpreted as ―Job Satisfaction‖.
Table 4.26: Summary of Factor Loadings, Percentage of Total Variance Explained and
Reliability of Job Satisfaction
Factor No. 6: Job Satisfaction
Factor
Loadings
% of Variance
Explained
Cronbach’s
Alpha
Items
“Extraction
Sums of
Squared
Loadings”
“Rotation
Sums of
Squared
Loadings”
I plan to stay in this company to develop
my career for a long time. .701 13.300 10.915 0.916
I feel proud to be a part of company due
to engagement in supporting green and
sustainable initiatives and activities.
.796
My company has fair policy for
performance appraisal and evaluation
which leads to Job Satisfaction.
.750
My company provides training for green
initiatives and therefore increase my Job
Satisfaction.
.676
My company recognizes the innovations
and suggestions for green practices which
leads to Job Satisfaction
.813
Job satisfaction is derived due to
recognition of green practices by external
agencies (Government)
.826
I often think of quitting my present job. .646
Table 4.26 represents the summary of factor loadings, percentage of total variance
explained and reliability of Job Satisfaction. Factor loadings for all the items were
above the minimum criteria of 0.40 and percentage of total variance explained was
10.915 %. Value of Cronbach‘s Alpha i.e. reliability coefficient was more than 0.7 for
this construct.
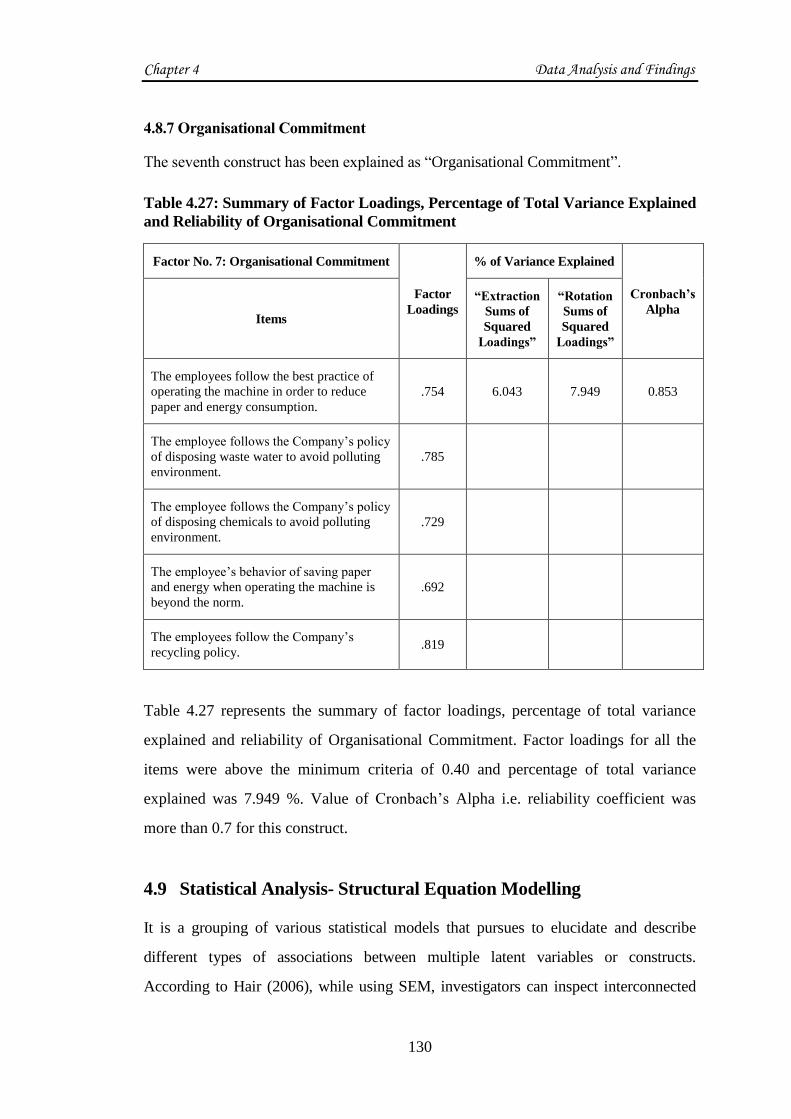
Chapter 4 Data Analysis and Findings
130
4.8.7 Organisational Commitment
The seventh construct has been explained as ―Organisational Commitment‖.
Table 4.27: Summary of Factor Loadings, Percentage of Total Variance Explained
and Reliability of Organisational Commitment
Factor No. 7: Organisational Commitment
Factor
Loadings
% of Variance Explained
Cronbach’s
Alpha Items
“Extraction
Sums of
Squared
Loadings”
“Rotation
Sums of
Squared
Loadings”
The employees follow the best practice of
operating the machine in order to reduce
paper and energy consumption.
.754 6.043 7.949 0.853
The employee follows the Company‘s policy
of disposing waste water to avoid polluting
environment.
.785
The employee follows the Company‘s policy
of disposing chemicals to avoid polluting
environment.
.729
The employee‘s behavior of saving paper
and energy when operating the machine is
beyond the norm.
.692
The employees follow the Company‘s
recycling policy. .819
Table 4.27 represents the summary of factor loadings, percentage of total variance
explained and reliability of Organisational Commitment. Factor loadings for all the
items were above the minimum criteria of 0.40 and percentage of total variance
explained was 7.949 %. Value of Cronbach‘s Alpha i.e. reliability coefficient was
more than 0.7 for this construct.
4.9 Statistical Analysis- Structural Equation Modelling
It is a grouping of various statistical models that pursues to elucidate and describe
different types of associations between multiple latent variables or constructs.
According to Hair (2006), while using SEM, investigators can inspect interconnected
Chapter 4 Data Analysis and Findings
131
associations amongst various dependent and independent variables concurrently. Hence,
many different authors and researchers have suggested that SEM as a scientific
procedure, has been utilized as a part of many fields, and has become an imperative
technique for analysing the data in various academic research (Hair, 2006; Kline, 2005;
Byrne, 2001). Likewise, different authors also claimed that SEM is a multivariate
technical analysis that permits scientists to analyse, both the estimation and basic parts
of a research model by checking the relations and associations between numerous
dependent and independent variables simultaneously (Tabachnick and Fidell, 2007).
Consequently, in the current research work, there were multiple dependent and
independent relationships in the proposed model for research as discussed in chapter 3
of the report, so SEM techniques found out to be the most appropriate technique, which
can be applied for data analysis of this research work. To investigate the statistical
associations amongst the measurements of dependent variables i.e., (Employee
Motivation, Job Satisfaction and Organisational Commitment) and independent
variables i.e. (Green Recruitment and Selection, Green Training and Development,
Green Reward Management, Green Employee Involvement), researcher has used the
SEM technical software package, known as, ―AMOS (Analysis of Moment Structure)
Version 20‖. SEM was chosen for the data analysis of this research work. There are two
reasons for this: Primarily, it is a systematic tool to confirm the relationships between
various variables and their indicators i.e. items, and to investigate the associations
between the variables in one model (Hair, 2006; Hoyle, 1995). Secondly, according to
many researchers, it offered an effective and challenging statistical tool that handles the
complicated research models (Hair, 2006; Tabachnick and Fidell, 2001; Bryne, 2001).
Bentler (1999) and Hoyle (1995, 2006) stated that in SEM, to find out the relationships
among constructs and indicators, confirmatory factor analysis (CFA) was used, which is
also called measurement model, and the model used to verify and investigate the
associations among various constructs is known as structural model, which are
explained in the Table 4.28.

Chapter 4 Data Analysis and Findings
132
Table 4.28: Code, Latent Variables and Observed Variables used for the study
Code Latent Variable Observed Variable
GRS
Green Recruitment
and Selection
My company indicates about organization‘s environmental
performance (past and current) when communicating recruitment
messages.
My company includes environmental criteria in the recruitment
messages.
My company communicates the employer‘s concern about greening
through recruitment efforts.
My company reflects environmental policy and strategies of the
organization in its recruitment policy.
My company also expresses its preference towards those candidates
who have competency and attitudes to participate in corporate
environmental management initiatives too in the recruitment message.
My company considers candidates ‗environmental concern and
interest as selection criteria.
While interviewing the candidate my company asks Environment-
related questions.
Company generally selects those candidates who are sufficiently
aware of greening to fill job vacancies.
GTD Green Training and
Development
My company provides environmental training to us to develop
required skills and knowledge.
My company provides training to learn or adapt environmental
friendly best practices (e.g. reducing long-distance business travel and
recycling).
My company provides environmental education to the workforce.
My Company imparts right knowledge and skills about greening (to
each employee through a training program exclusively designed for
greening).
My Company identifies the environmental training needs of
employees in order to make them more environmental concerned.
We get proper training on environmental awareness to create
―environmental awareness‖ among the workforce.
Everybody in this facility get the opportunities to get training on
environmental management aspects.
GRM Green Reward
Management
We are rewarded financially or non- financially for good
environmental performance.
We are receiving Team excellence awards for better environmental
performance.
My company has introduced rewards for innovative environmental
performance or initiative.
My company provides incentives to encourage environmentally
friendly activities and behaviors (e.g. recycling and waste
management).
We are rewarded for green skills acquisition.

Chapter 4 Data Analysis and Findings
133
Code Latent Variable Observed Variable
GEI
Green Employee
Involvement
We are given equal opportunities to involve and participate in green
suggestion schemes.
My company provides training to the union representatives in
environmental management.
We have a system of joint consultations in solving environmental
issues of the organization.
My company recognizes union as a key stakeholder in environmental
management.
My company provides opportunities to the unions to negotiate with
management about green workplace agreement.
EM
Employee Motivation
Employee in this company are encouraged to put forward new ideas
on energy saving and environment protection (eg. suggestion box)
Employees in this company are willing to sacrifice some of their self-
interests for the benefit of the environment (eg.turn off the Air-
conditioner, lights if you do not need)
Employees have a sense of personal obligation to take action to stop
wasting resources (eg. saving water or using less electricity)
The employee voluntarily recycles even when no one is watching.
The employee promotes environment protection in the workplace.
JS
Job Satisfaction
I plan to stay in this company to develop my career for a long time.
I feel proud to be a part of company due to engagement in supporting
green and sustainable initiatives and activities.
My company has fair policy for performance appraisal and evaluation
which leads to Job Satisfaction.
My company provides training for green initiatives and therefore
increase my Job Satisfaction.
My company recognizes the innovations and suggestions for green
practices which leads to Job Satisfaction
Job satisfaction is derived due to recognition of green practices by
external agencies (Government)
I often think of quitting my present job.
OC
Organisational
Commitment
The employees follow the best practice of operating the machine in
order to reduce paper and energy consumption.
The employee follows the Company‘s policy of disposing waste
water to avoid polluting environment.
The employee follows the Company‘s policy of disposing chemicals
to avoid polluting environment.
The employee‘s behavior of saving paper and energy when operating
the machine is beyond the norm.
The employees follow the Company‘s recycling policy.

Chapter 4 Data Analysis and Findings
134
4.9.1 Measurement Model
According to Kline (2005), CFA is a widely-used technique of SEM, and as per Byrne
(2001), it is by and large connected, when there is some contextual knowledge and
understanding of the basic factors and their measuring items. It is exceptionally suggested
that, CFA should be applied after EFA, so as to check and affirm the scales derived from
EFA (Hair, 1998; Byrne, 2001). So, the researcher in this research work has also applied
EFA before CFA. As stated by Byrne (2001), in practice, unlike EFA, in which
researcher explores the factors, CFA is a procedure used to affirm from the prior
hypotheses regarding, associations among the set of items and their corresponding latent
variables. As stated by Hair (2006), in CFA, there are two wide methodologies that were
used to assess the measurement model: (1) to decide the (GOF) goodness of fit criteria
indices, (2) to assess the reliability and validity of the measurement model. Hence, for
measuring the unidimensionality, reliability and validity of the measures, the researcher in
this research work has applied the measurement model, which has been described below.
4.9.2 Reliability
Reliability has already been discussed and checked in the section 4.4.2. The result of
reliability as desired i.e. above 0.7.
4.9.3 Validity
As suggested by Sekaran (2000), validity is associated with the accuracy of items. As
stated by Neuman (2003), validity is higher, when the items and the latent variables
show the good model fit. Convergent validity and discriminant validity are the two
types of validity, which helps in the analysis of Construct validity, which are described
below.
4.9.3.1 Convergent Validity
According to Hair (2006), for checking the convergent validity of each variable
(represented in Table 4.29), three estimations are generally used, these are factor
―Average Variance Extracted (AVE), loadings of factors, and construct reliability (CR)
estimation‖. In addition to this, Hair et al. (2006) also recommended that for assessing
the convergent validity, the minimum cut off criteria as follows:

Chapter 4 Data Analysis and Findings
135
Ideal standardized loading of each item should be either 0.7 or higher,
The Average Variance Extracted estimate should be more than 0.5, and
Reliability i.e. Cronbach alpha estimates should be greater than 0.7.
Table 4.29: Indices of Convergent Validity for the Constructs
Factor Name Cronbach Alpha
Coefficient
Average Variance
Explained
Green Recruitment and Selection 0.928 0.584
Green Training and Development 0.880 0.505
Green Reward Management 0.866 0.565
Green Employee Involvement 0.869 0.605
Employee Motivation 0.852 0.532
Job Satisfaction 0.916 0.616
Organisational Commitment 0.853 0.518
4.9.3.2 Discriminant Validity
Hair (2006) suggested the method to assess the discriminant validity (represented in
Table 4.30), in this AVE for every variable is equated with the matching (SIC) squared
inter-construct correlations, and calculated value of Average Variance Extracted
constantly should be greater than the estimate of SIC. This specifies the validation for
discriminant validity of each variable.
In this study, the researcher has used both Convergent Validity and Discriminant
Validity to evaluate the Construct Validity of each variable.
Table 4.30: Indices of Discriminant Validity for the Constructs
Factor Name Average Variance
Explained
Maximum Shared
Variance
Green Recruitment and Selection 0.584 0.028
Green Training and Development 0.505 0.352
Green Reward Management 0.565 0.511
Green Employee Involvement 0.605 0.506
Employee Motivation 0.532 0.511
Job Satisfaction 0.616 0.506
Organisational Commitment 0.518 0.208

Chapter 4 Data Analysis and Findings
136
Table 4.30 encapsulates the reliability and validity values of all the constructs, explicitly
Green Recruitment and Selection, Green Training and Development, Green Reward
Management, Green Employee Involvement, Employee Motivation, Job Satisfaction,
Organisational Commitment. The Cronbach‘s Alpha values for all the constructs were
higher than the mandatory threshold. Average Variance Explained also surpassed the
needed threshold of 0.5. This exhibits that all indicators successfully determine the
construct they belong to. Moreover, the MSV also was lower than AVE which was an
adequate indication to validate that the statements vary from each other.
4.9.4 Goodness of Fit Indices
Hair (1998), suggested that there are three kinds of fit measure indices used in SEM:
―incremental fit indices, parsimonious fit indices, and absolute fit indices‖. As stated by
Hair (1998), ―the absolute fit indices are used to measure the ability of the overall
model fit and these indices incorporate the likelihood ratio statistic chi-square (χ2), in
connotation with the root mean square error of approximation (RMSEA), and the
goodness of fit index (GFI).‖ According to Hair (1998) and Hair (2006) to contrast the
proposed model with the baseline model, incremental fit indexes were used and ―the
incremental fit indices comprised of comparative fit index (CFI) and normed fit index
(NFI)‖. Particulars of all these fit indices and their suggested levels are shown in the
Table 4.31.
Table 4.31: Statistics of Goodness of Fit used in SEM
Model Fix Index Recommended Cut-off Value
P Value <0.05 P <0.05
CMIN/df 1< CMIN/df>4 (HU and Bentler,1999)
Comparative Fix Index (CFI) Values greater than 0.9 (Bentler and Bonnet, 1980)
Goodness Fit Index (GFI) Values greater than 0.9 (Bryne (2001); Hair et.al. (2006))
Root Mean Square Error of
Approximation (RMSEA)
Values lower than 0.08 (MacCallum, Browne, and
Sugawara, 1996)

Chapter 4 Data Analysis and Findings
137
4.10 Model Estimates
To assess the measurement model, there are also other standardized estimates other than
GOF indices, such as, standardized regression weight i.e. factor loadings, and critical
ratio (Cr) approximations standards. The cut-off point, as suggested by many
academicians, was used in this research work. As suggested by Holmes-Smith (2002),
the value of each loadings of the factors should be at least 0.7; though, a value more
than 0.5 is also tolerable (Churchill, 1979) and the values of CR should not be less than
1.96 (Byrne, 2001; Hair, 1998).
As described earlier, measurement model was used in this research work to describe the
relationships among the various observed variables i.e. indicator variables and
unobserved variables i.e. latent variables. It assisted in determining and affirming which
item is related to the each of its corresponding fundamental variable i.e. the latent
variable. Hence, CFA is also called as measurement model, and according to Kline,
(1998) and Hair, (1998), it was executed in order to classify and validate the outline,
through this all, the measuring items were loaded onto its own specific variable.
Measurement model was projected by using AMOS software, as suggested by many
researchers (Hair, 1998; Tabachnick and Fidell, 2001). There were many reasons for
choosing this procedure of estimation as discussed below:-
Firstly, CFA was suggested, if the sample size is small and in case the research
model is not meeting the condition of having minimum 5 items of measurement
for each variable (Anderson and Gerbing, 1988; Hair, 1998) as some of the
constructs in this research work has also used less than 5 measurement items, So
CFA was applied in this study as well.
Secondly, in this research work, the researcher has used a five point Likert scale.
As suggested by many researchers, this Maximum Likelihood Estimation (MLE)
technique is impartial contrasted with other estimation techniques under adequate
defilements of normal data (Bollen, 1989; Bryne, 2001; Kline, 2005).
At last, while using the SEM analysis technique, MLE technique is the most
commonly used estimator (Tabachnick and Fidell, 2001; Kline, 1998) on the

Chapter 4 Data Analysis and Findings
138
grounds, that this technique minimizes the difference between observed matrices
and covariance; as an outcome and it enhances the assessments of various
parameters (Hair, 2006).
Consequently, in this research work, MLE method was used while running the
measurement model, as suggested by various investigators (Kline, 2005; Anderson and
Gerbing, 1988; Hair, 1998).
4.10.1 Individual Construct SEM Models – Measurement Models
In order to verify the various variables that were identified during EFA, Confirmatory
Factor Analysis (CFA) was conducted as a next step. Further, to assess the whole model
fit, the model fitness of individual factors was assessed through a zero order CFA, and it
was constructed for all the latent variables, as discussed below:-
Green Recruitment and Selection
Zero Order CFA of Green Recruitment and Selection and its Measured Variables is
shown in Figure 4.8 below.
Figure 4.8: “Zero Order CFA of Green Recruitment and Selection and its Measured
Variables”

Chapter 4 Data Analysis and Findings
139
The terminology used in this zero-order model is illustrated in Table 4.32 of ―Green
Recruitment and Selection (GRS)‖ and its measured variables.
Table 4.32: Terminology Referred for GRS
Code Latent Variable Observed Variable
GRS Green Recruitment and
Selection
GRS1 My company indicates about organization‘s environmental
performance (past and current) when communicating recruitment
messages.
GRS2 My company includes environmental criteria in the recruitment
messages.
GRS3 My company communicates the employer‘s concern about
greening through recruitment efforts.
GRS5 My company reflects environmental policy and strategies of the
organization in its recruitment policy.
GRS6 My company also expresses its preference towards those
candidates who have competency and attitudes to participate in
corporate environmental management initiatives too in the
recruitment message.
GRS7 My company considers candidates ‗environmental concern and
interest as selection criteria.
GRS8 While interviewing the candidate my company asks
Environment-related questions.
GRS9 Company generally selects those candidates who are sufficiently
aware of greening to fill job vacancies.
Green Recruitment and Selection (GRS) is the latent construct having eight measured
factors as shown in Figure 4.8, Variable loadings, or standardized estimate, represents
the extent to which each of the items is associated with its latent construct. Since the
item was unable to explain the latent variable entirely, so an error term was also added
to its respected measured item.
The Unstandardized Regression Coefficient (as Shown in Table 4.26) denotes ―the
extent by which the dependent variable changes, if the investigator changes the
independent variable by one unit, by keeping the other independent variables constant.‖
Figure 4.1 also explains the error variance. Error variance represents the ―extent of the
amount by which variance could not be explained by the observed variable.‖ For e.g.,
the result of the Zero Order CFA suggests that e9 is 0.50, which means; in predicting
the Green Recruitment and Selection, 50% of the variance is unexplained by GRS9.

Chapter 4 Data Analysis and Findings
140
Lower Variance indicates lower error, so it is a good indication. Table 4.33 also shows
that the value of R2
value is 0.69, and it reflects that, in the independent variable, 69%
of the variance is explicated by all the independent constructs taken together.
Moreover, the four curved arrows represent the covariance or correlations between the
pairs. Covariance is defined as ―a measure of how much two random variables vary
together.‖ It is more or less same as the variance, but the difference is, variance explains
the variation of single variable, whereas, covariance explains the variation of two
variables together.
Table 4.33: Unstandardized Regression Coefficients of Green Recruitment and Selection
Code Unstandardized Regression
Coefficients
R2 = 0.69
GRS1 1.00
GRS2 1.19
GRS3 1,13
GRS5 1.23
GRS6 1.21
GRS7 1.11
GRS8 1.25
GRS9 1.14
Table 4.34: Standardized Regression Weights and Model Fit Indices of Green Recruitment
and Selection
Estimate Model Fit Indicator
GRS1 <--- GRS .779 CMIN/DF 4.140
GRS2 <--- GRS .765 CFI .971
GRS3 <--- GRS .724 GFI .950
GRS5 <--- GRS .745 RMSEA .102
GRS6 <--- GRS .772 AVE 0.584
GRS7 <--- GRS .797 MSV 0.028
GRS8 <--- GRS .764
GRS9 <--- GRS .784

Chapter 4 Data Analysis and Findings
141
The Beta Value or Standardized Regression Weight is defined as ―a measure of how
strongly each predictor (independent) variable influences the criterion (dependent)
variable.‖ The Standard Deviation was used to measure the value of beta. As shown in
Table 4.34, GRS7 and GRS9 have factor loadings of 0.797 and 0.784 respectively; this
indicates that these two independent variables are the best indicators of Green
Recruitment and Selection. The model fit indices illustrated that, the model was a good
fit. All other model fit indices were at acceptable levels that represented a good fit for
Green Recruitment and Selection.
Green Training and Development
Zero Order CFA of Green Training and Development and its Measured Variables is
shown in Figure 4.9 below.
Figure 4.9: “Zero Order CFA of Green Training and Development and its Measured
Variables”
The terminology used in this Zero Order model is illustrated in Table 4.35 of ―Green
Training and Development (GTD)‖ and its measured variables.
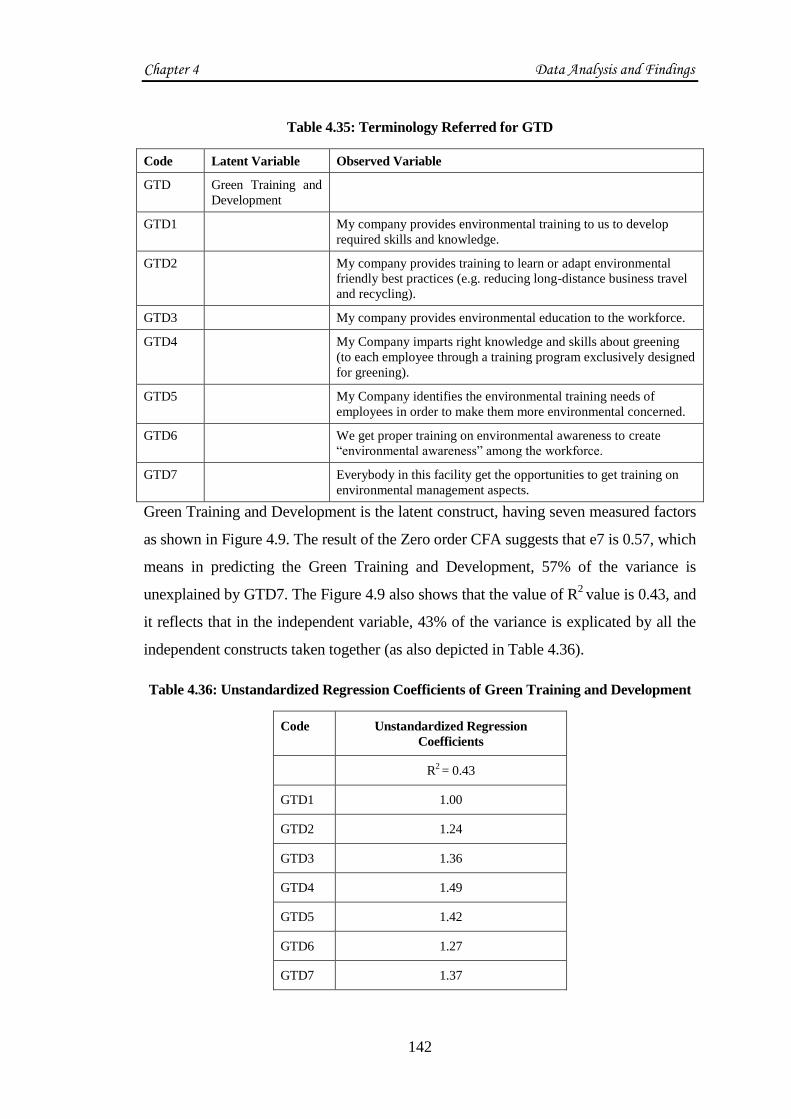
Chapter 4 Data Analysis and Findings
142
Table 4.35: Terminology Referred for GTD
Code Latent Variable Observed Variable
GTD Green Training and
Development
GTD1 My company provides environmental training to us to develop
required skills and knowledge.
GTD2 My company provides training to learn or adapt environmental
friendly best practices (e.g. reducing long-distance business travel
and recycling).
GTD3 My company provides environmental education to the workforce.
GTD4 My Company imparts right knowledge and skills about greening
(to each employee through a training program exclusively designed
for greening).
GTD5 My Company identifies the environmental training needs of
employees in order to make them more environmental concerned.
GTD6 We get proper training on environmental awareness to create
―environmental awareness‖ among the workforce.
GTD7 Everybody in this facility get the opportunities to get training on
environmental management aspects.
Green Training and Development is the latent construct, having seven measured factors
as shown in Figure 4.9. The result of the Zero order CFA suggests that e7 is 0.57, which
means in predicting the Green Training and Development, 57% of the variance is
unexplained by GTD7. The Figure 4.9 also shows that the value of R2 value is 0.43, and
it reflects that in the independent variable, 43% of the variance is explicated by all the
independent constructs taken together (as also depicted in Table 4.36).
Table 4.36: Unstandardized Regression Coefficients of Green Training and Development
Code Unstandardized Regression
Coefficients
R2 = 0.43
GTD1 1.00
GTD2 1.24
GTD3 1.36
GTD4 1.49
GTD5 1.42
GTD6 1.27
GTD7 1.37

Chapter 4 Data Analysis and Findings
143
Table 4.37: Standardized Regression Weights and Model Fit Indices of Green Training and
Development
Estimate Model Fit Indicator
GTD1 <--- GTD .610 CMIN/DF 3.377
GTD2 <--- GTD .670 CFI .970
GTD3 <--- GTD .706 GFI .964
GTD4 <--- GTD .826 RMSEA .089
GTD5 <--- GTD .735 AVE .505
GTD6 <--- GTD .712 MSV .352
GTD7 <--- GTD .748
As shown in Table 4.37, GTD4 and GTD7 have factor loadings of 0.826 and 0.748
respectively; this indicates that these two independent variables are the best indicators
of Green Training and Development. The model fit indices illustrated that, the model
was a good fit. All other model fit indices were at acceptable levels that represented a
good fit for Green Training and Development.
Green Reward Management
Zero Order CFA of Green Reward Management and its Measured Variables is shown
in Figure 4.10 below.
Figure 4.10: “Zero Order CFA of Green Reward Management and its Measured Variables”
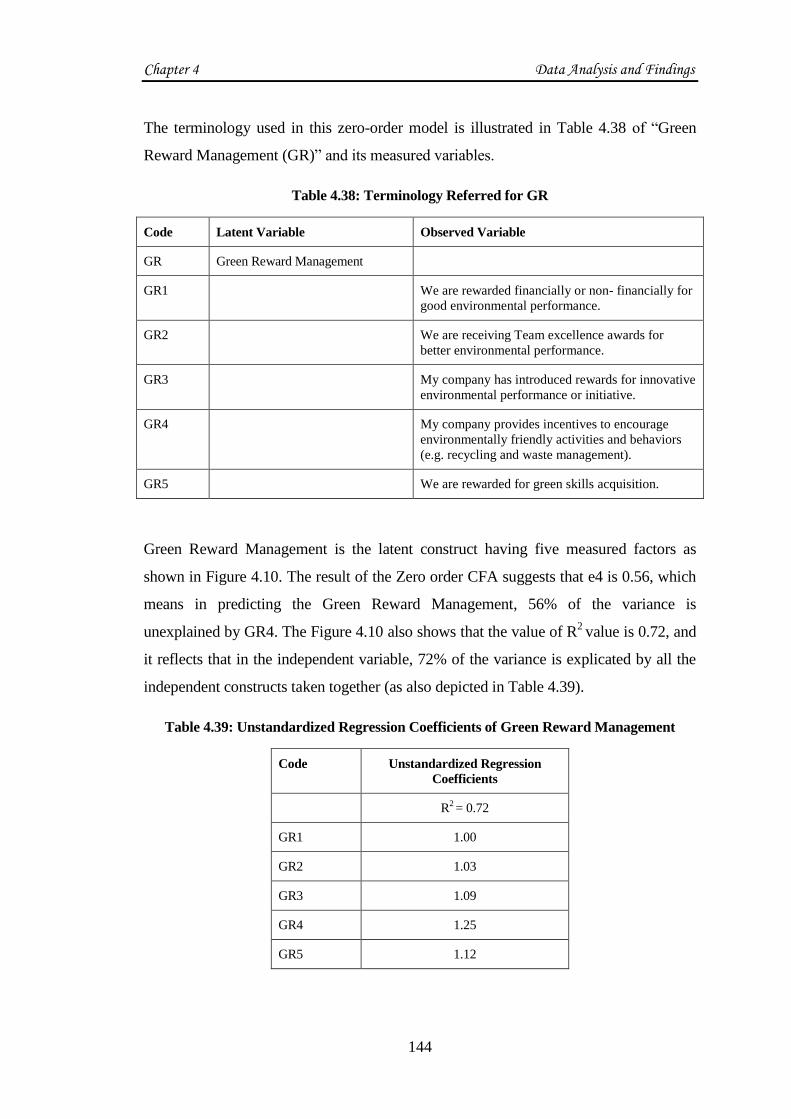
Chapter 4 Data Analysis and Findings
144
The terminology used in this zero-order model is illustrated in Table 4.38 of ―Green
Reward Management (GR)‖ and its measured variables.
Table 4.38: Terminology Referred for GR
Code Latent Variable Observed Variable
GR Green Reward Management
GR1 We are rewarded financially or non- financially for
good environmental performance.
GR2 We are receiving Team excellence awards for
better environmental performance.
GR3 My company has introduced rewards for innovative
environmental performance or initiative.
GR4 My company provides incentives to encourage
environmentally friendly activities and behaviors
(e.g. recycling and waste management).
GR5 We are rewarded for green skills acquisition.
Green Reward Management is the latent construct having five measured factors as
shown in Figure 4.10. The result of the Zero order CFA suggests that e4 is 0.56, which
means in predicting the Green Reward Management, 56% of the variance is
unexplained by GR4. The Figure 4.10 also shows that the value of R2
value is 0.72, and
it reflects that in the independent variable, 72% of the variance is explicated by all the
independent constructs taken together (as also depicted in Table 4.39).
Table 4.39: Unstandardized Regression Coefficients of Green Reward Management
Code Unstandardized Regression
Coefficients
R2 = 0.72
GR1 1.00
GR2 1.03
GR3 1.09
GR4 1.25
GR5 1.12

Chapter 4 Data Analysis and Findings
145
Table 4.40: Standardized Regression Weights and Model Fit Indices of Green Reward
Management
Estimate Model Fit Indicator
GR1 <--- GR .716 CMIN/DF 2.998
GR2 <--- GR .725 CFI .985
GR3 <--- GR .763 GFI .981
GR4 <--- GR .817 RMSEA 0.082
GR5 <--- GR .734 AVE .565
MSV .511
As shown in Table 4.40; GR4 and GR3 have factor loadings of 0.817 and 0.763
respectively; this indicates that these two independent variables are the best indicators
of Green Reward Management. The model fit indices illustrated that the model was a
good fit. All other model fit indices were at acceptable levels that represented a good fit
for Green Reward Management.
Green Employee Involvement
Zero Order CFA of Green Employee Involvement (GEI) and its Measured Variables
is shown in Figure 4.11 below.
Figure 4.11: “Zero Order CFA of Green Employee Involvement and its Measured Variables”

Chapter 4 Data Analysis and Findings
146
The terminology used in this zero-order model is illustrated in Table 4.41 of Green
Employee Involvement and its measured variables.
Table 4.41: Terminology Referred for GEI
Code Latent Variable Observed Variable
GEI Green Employee
Involvement
GEI1 We are given equal opportunities to involve and participate in
green suggestion schemes.
GEI2 My company provides training to the union representatives in
environmental management.
GEI3 We have a system of joint consultations in solving
environmental issues of the organization.
GEI4 My company recognizes union as a key stakeholder in
environmental management.
GEI5 My company provides opportunities to the unions to
negotiate with management about green workplace
agreement.
Green Employee Involvement is the latent construct having five measured factors as
shown in Figure 4.11. The result of the Zero order CFA suggests that e1 is 0.13, which
means in predicting the Green Employee Involvement, 13% of the variance is
unexplained by GEI1. The Figure 4.11 also shows that the value of R2
value is .65, and
it reflects that in the independent variable, 65% of the variance is explicated by all the
independent constructs taken together (as also depicted in Table 4.42).
Table 4.42: Unstandardized Regression Coefficients of Green Employee Involvement
Code Unstandardized Regression
Coefficients
R2 = 0.65
GEI1 1.00
GEI2 .65
GEI3 .59
GEI4 .49
GEI5 .53
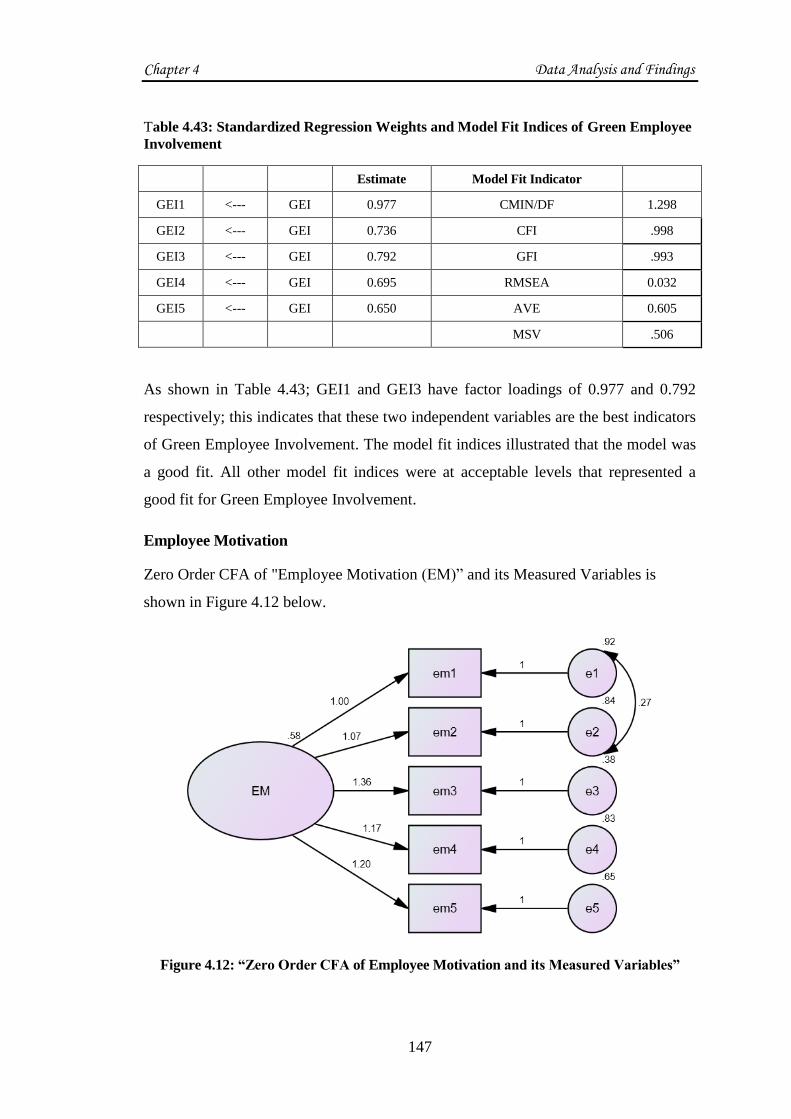
Chapter 4 Data Analysis and Findings
147
Table 4.43: Standardized Regression Weights and Model Fit Indices of Green Employee
Involvement
Estimate Model Fit Indicator
GEI1 <--- GEI 0.977 CMIN/DF 1.298
GEI2 <--- GEI 0.736 CFI .998
GEI3 <--- GEI 0.792 GFI .993
GEI4 <--- GEI 0.695 RMSEA 0.032
GEI5 <--- GEI 0.650 AVE 0.605
MSV .506
As shown in Table 4.43; GEI1 and GEI3 have factor loadings of 0.977 and 0.792
respectively; this indicates that these two independent variables are the best indicators
of Green Employee Involvement. The model fit indices illustrated that the model was
a good fit. All other model fit indices were at acceptable levels that represented a
good fit for Green Employee Involvement.
Employee Motivation
Zero Order CFA of "Employee Motivation (EM)‖ and its Measured Variables is
shown in Figure 4.12 below.
Figure 4.12: “Zero Order CFA of Employee Motivation and its Measured Variables”

Chapter 4 Data Analysis and Findings
148
The terminology used in this zero-order model is illustrated in Table 4.44 of Employee
Motivation and its measured variables.
Table 4.44: Terminology Referred for EM
Code Latent Variable Observed Variable
Employee Motivation
EM1 Employee in this company are encouraged to put forward new
ideas on energy saving and environment protection (eg.
suggestion box)
EM2 Employees in this company are willing to sacrifice some of their
self-interests for the benefit of the environment (eg.turn off the
Air- conditioner, lights if you do not need)
EM3 Employees have a sense of personal obligation to take action to
stop wasting resources (eg. saving water or using less electricity)
EM4 The employee voluntarily recycles even when no one is
watching.
EM5 The employee promotes environment protection in the
workplace.
Employee Motivation is the latent construct having five measured factors as shown in
Figure 4.12. The result of the Zero order CFA suggests that e3 is 0.38, which means in
predicting the Employee Motivation, 38% of the variance is unexplained by EM3.
Figure 4.12 also shows that the value of R2
value is .58, and it reflects that in the
independent variable, 58% of the variance is explicated by all the independent
constructs taken together (as also depicted in Table 4.45).
Table 4.45: Unstandardized Regression Coefficients of Employee Motivation
Code Unstandardized Regression
Coefficients
R2 = 0.58
EM1 1.00
EM2 1.07
EM3 1.36
EM4 1.17
EM5 1.20

Chapter 4 Data Analysis and Findings
149
Table 4.46: Standardized Regression Weights and Model Fit Indices of Employee Motivation
Estimate Model Fit Indicator
EM1 <--- EM .624 CMIN/DF 1.964
EM2 <--- EM .667 CFI .994
EM3 <--- EM .861 GFI .990
EM4 <--- EM .699 RMSEA .057
EM5 <--- EM .750 AVE .532
MSV .511
As shown in Table 4.46; EM3 and EM5 have factor loadings of 0.861 and 0.750
respectively; this indicates that these two independent variables are the best indicators
of Employee Motivation. The model fit indices illustrated that the model was a good fit.
All other model fit indices were at acceptable levels that represented a good fit for
Employee Motivation.
Job Satisfaction
Zero Order CFA of Job Satisfaction and its Measured Variables is shown in Figure
4.13 below.
Figure 4.13: “Zero Order CFA of Job Satisfaction and its Measured Variables”

Chapter 4 Data Analysis and Findings
150
The terminology used in this zero-order model is illustrated in Table 4.47 of ―Job
Satisfaction (JS)‖ and its measured variables.
Table 4.47: Terminology Referred for JS
Code Latent Variable Observed Variable
JS Job Satisfaction
JS1 I plan to stay in this company to develop my career for a long
time.
JS2 I feel proud to be a part of company due to engagement in
supporting green and sustainable initiatives and activities.
JS3 My company has fair policy for performance appraisal and
evaluation which leads to Job Satisfaction.
JS4 My company provides training for green initiatives and therefore
increase my Job Satisfaction.
JS5 My company recognizes the innovations and suggestions for
green practices which leads to Job Satisfaction
JS6 Job satisfaction is derived due to recognition of green practices
by external agencies (Government)
JS7 I often think of quitting my present job.
Job Satisfaction is the latent construct having five measured factors as shown in Figure
4.13. The result of the Zero order CFA suggests that e2 is 0.39, which means in predicting
the Job Satisfaction, 39% of the variance is unexplained by JS2. The Figure 4.13 also
shows that the value of R2
value is 0.78, and it reflects that in the independent variable,
78% of the variance is explicated by all the independent constructs taken together (as also
depicted in Table 4.48).
Table 4.48: Unstandardized Regression Coefficients of Job Satisfaction
Code Unstandardized Regression
Coefficients
R2 = .78
JS1 1.00
JS2 .78
JS3 .64
JS4 .63
JS5 .58
JS6 .71
JS7 .90
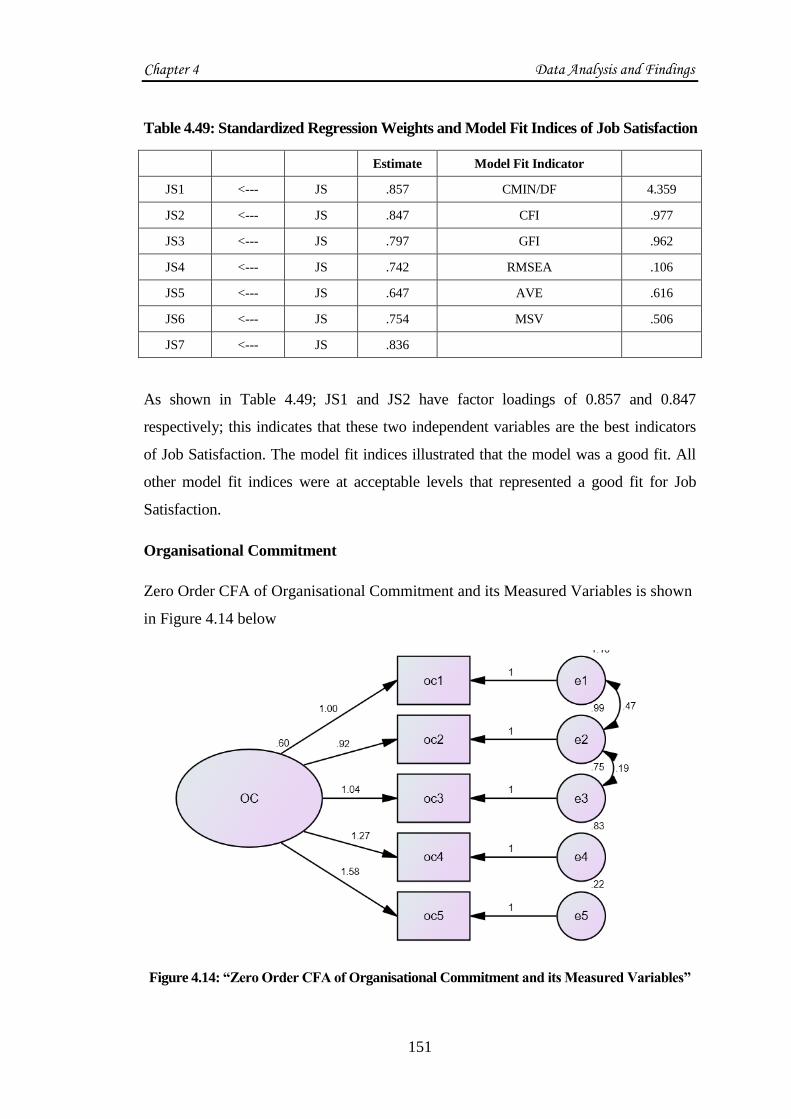
Chapter 4 Data Analysis and Findings
151
Table 4.49: Standardized Regression Weights and Model Fit Indices of Job Satisfaction
Estimate Model Fit Indicator
JS1 <--- JS .857 CMIN/DF 4.359
JS2 <--- JS .847 CFI .977
JS3 <--- JS .797 GFI .962
JS4 <--- JS .742 RMSEA .106
JS5 <--- JS .647 AVE .616
JS6 <--- JS .754 MSV .506
JS7 <--- JS .836
As shown in Table 4.49; JS1 and JS2 have factor loadings of 0.857 and 0.847
respectively; this indicates that these two independent variables are the best indicators
of Job Satisfaction. The model fit indices illustrated that the model was a good fit. All
other model fit indices were at acceptable levels that represented a good fit for Job
Satisfaction.
Organisational Commitment
Zero Order CFA of Organisational Commitment and its Measured Variables is shown
in Figure 4.14 below
Figure 4.14: “Zero Order CFA of Organisational Commitment and its Measured Variables”
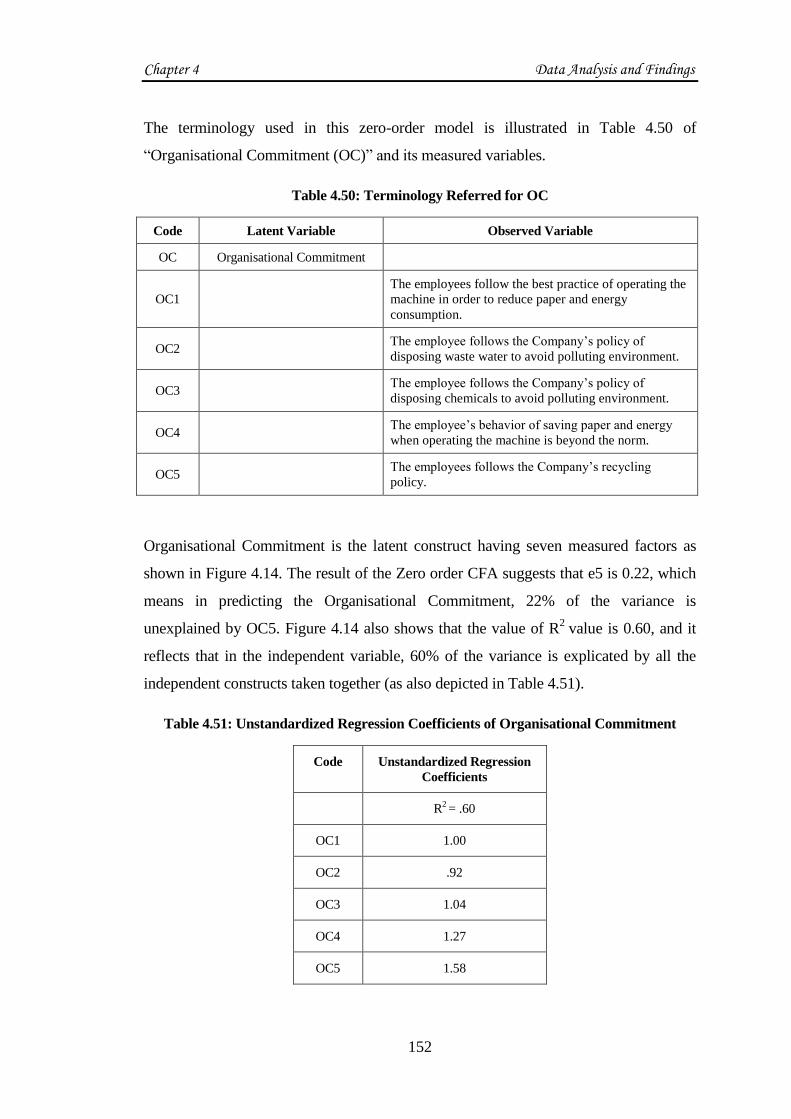
Chapter 4 Data Analysis and Findings
152
The terminology used in this zero-order model is illustrated in Table 4.50 of
―Organisational Commitment (OC)‖ and its measured variables.
Table 4.50: Terminology Referred for OC
Code Latent Variable Observed Variable
OC Organisational Commitment
OC1
The employees follow the best practice of operating the
machine in order to reduce paper and energy
consumption.
OC2 The employee follows the Company‘s policy of
disposing waste water to avoid polluting environment.
OC3 The employee follows the Company‘s policy of
disposing chemicals to avoid polluting environment.
OC4 The employee‘s behavior of saving paper and energy
when operating the machine is beyond the norm.
OC5 The employees follows the Company‘s recycling
policy.
Organisational Commitment is the latent construct having seven measured factors as
shown in Figure 4.14. The result of the Zero order CFA suggests that e5 is 0.22, which
means in predicting the Organisational Commitment, 22% of the variance is
unexplained by OC5. Figure 4.14 also shows that the value of R2
value is 0.60, and it
reflects that in the independent variable, 60% of the variance is explicated by all the
independent constructs taken together (as also depicted in Table 4.51).
Table 4.51: Unstandardized Regression Coefficients of Organisational Commitment
Code Unstandardized Regression
Coefficients
R2 = .60
OC1 1.00
OC2 .92
OC3 1.04
OC4 1.27
OC5 1.58

Chapter 4 Data Analysis and Findings
153
Table 4.52: Standardized Regression Weights and Model Fit Indices of Organisational
Commitment
Estimate Model Fit Indicator
OC1 <--- OC .595 CMIN/DF 0.374
OC2 <--- OC .586 CFI 1.000
OC3 <--- OC .681 GFI .999
OC4 <--- OC .733 RMSEA .000
OC5 <--- OC .933 AVE .518
MSV .208
As shown in Table 4.52; OC5 and OC4, have factor loadings of 0.933 and 0.733
respectively; this indicates that these two independent variables are the best indicators
of Organisational Commitment. The model fit indices illustrated that the model was a
good fit. All other model fit indices were at acceptable levels that represented a good fit
for Organisational Commitment.
4.10.2 First Order Model
The fitness of the model was tested using the measurement and structural model test.
Confirmatory factor analysis (CFA) was carried out with the intention to assert a more
meticulous elucidation of Green HRM Practices. To estimate the goodness-of-fit of the
model a number of measures of indices were employed as suggested by numerous
eminent researchers like Hair et al. (1998). All item parcels loaded significantly onto
their respective factors. All measures accomplished the minimum suggested benchmark
value requirements (refer to Table no. 4.53). Consequently, CFA model was understood
to be a good fit model.

Chapter 4 Data Analysis and Findings
154
Figure 4.15: First Order Model
Table 4.53: Model Fit Indices
CFI GFI RMSEA CMIN/df
First Order Model .900 .903 .059 2.044
The value of GFI in First Order model as shown in Figure 4.15, was above 0.90, the
required cut-off criterion. The CFI was also above the accepted guideline of 0.90.
Additionally, the RMSEA was below the 0.08 guideline of acceptability (as depicted in

Chapter 4 Data Analysis and Findings
155
Table 4.46). Therefore, the model was determined to be acceptable enough to proceed
for further analysis.
4.11 Evaluation of Structural Model and Hypothesis Testing
In this research work, the researcher has used a two-step method in analysing the
research model via SEM. Initially, measurement model estimation (via CFA) was
performed by investigating the unidimensionality, reliability, and validity of all the
latent variables. Henceforth, Kline (2005) and Hair (2006) suggested to test the
postulated association amongst all the latent variables in the proposed model via the
structural model. The hypothesized model, i.e. structural model showed the associations
between the latent variables. According to Byrne (2001), it aimed at hypothesizing
which variables directly or indirectly impact the values of other variables in the
proposed model for research.
The structural model was verified by using the Path analysis. It was initiated by
constructing a path diagram on the AMOS screen graphical program. As discussed
earlier, the observed variables (multiple items are summed and averaged into scales to
measure variables) were connected to other variables, representing the hypothesized
linkage in the conceptual model on the AMOS screen. The observed variables were
drawn in rectangles and the resulting path model is drawn on AMOS screen (Figure
4.9). Model – fitting analysis was then computed to determine the path coefficients.
Three dependent variables in the path analysis model ―(i.e. Employee Motivation, Job
Satisfaction and Organisational Commitment)‖ were being explained by four
independent constructs ―(i.e. Green Recruitment and Selection, Green Training and
Development, Green Reward Management, Green Employee Involvement)‖. The
variables being explained in the model are called as endogenous variables.
Path coefficients were the standardized regression coefficients (Beta weights), derived
from the analysis. In Figure 4.16, the error terms designated by the circles e2 and e3
represented other influences which may affect the endogenous variables besides those
specified in the model. In Figure 4.16, the error terms already have been assigned
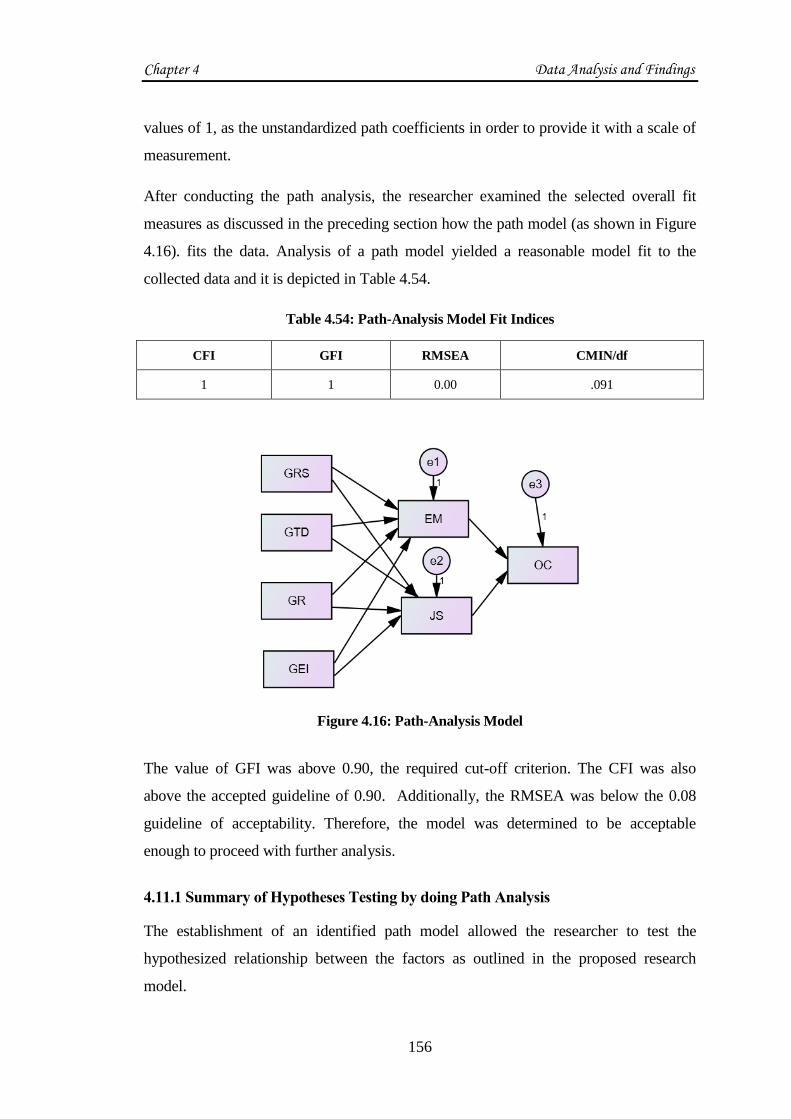
Chapter 4 Data Analysis and Findings
156
values of 1, as the unstandardized path coefficients in order to provide it with a scale of
measurement.
After conducting the path analysis, the researcher examined the selected overall fit
measures as discussed in the preceding section how the path model (as shown in Figure
4.16). fits the data. Analysis of a path model yielded a reasonable model fit to the
collected data and it is depicted in Table 4.54.
Table 4.54: Path-Analysis Model Fit Indices
CFI GFI RMSEA CMIN/df
1 1 0.00 .091
Figure 4.16: Path-Analysis Model
The value of GFI was above 0.90, the required cut-off criterion. The CFI was also
above the accepted guideline of 0.90. Additionally, the RMSEA was below the 0.08
guideline of acceptability. Therefore, the model was determined to be acceptable
enough to proceed with further analysis.
4.11.1 Summary of Hypotheses Testing by doing Path Analysis
The establishment of an identified path model allowed the researcher to test the
hypothesized relationship between the factors as outlined in the proposed research
model.
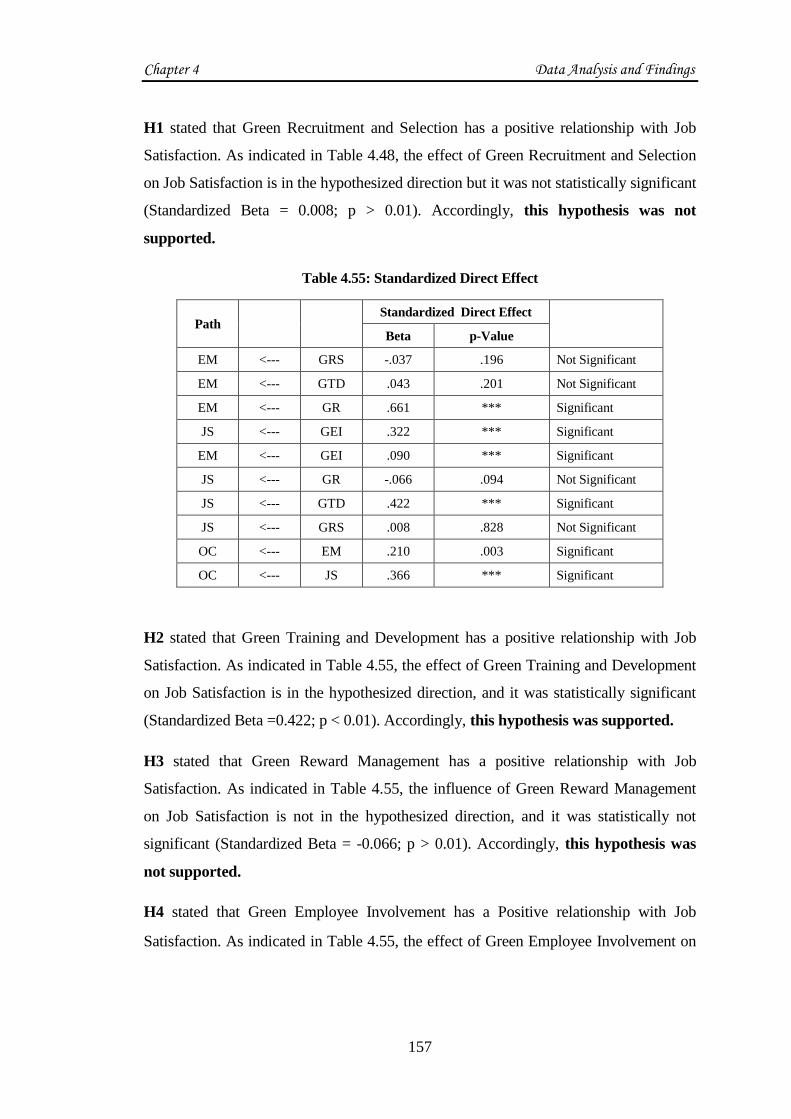
Chapter 4 Data Analysis and Findings
157
H1 stated that Green Recruitment and Selection has a positive relationship with Job
Satisfaction. As indicated in Table 4.48, the effect of Green Recruitment and Selection
on Job Satisfaction is in the hypothesized direction but it was not statistically significant
(Standardized Beta = 0.008; p > 0.01). Accordingly, this hypothesis was not
supported.
Table 4.55: Standardized Direct Effect
Path
Standardized Direct Effect
Beta p-Value
EM <--- GRS -.037 .196 Not Significant
EM <--- GTD .043 .201 Not Significant
EM <--- GR .661 *** Significant
JS <--- GEI .322 *** Significant
EM <--- GEI .090 *** Significant
JS <--- GR -.066 .094 Not Significant
JS <--- GTD .422 *** Significant
JS <--- GRS .008 .828 Not Significant
OC <--- EM .210 .003 Significant
OC <--- JS .366 *** Significant
H2 stated that Green Training and Development has a positive relationship with Job
Satisfaction. As indicated in Table 4.55, the effect of Green Training and Development
on Job Satisfaction is in the hypothesized direction, and it was statistically significant
(Standardized Beta =0.422; p < 0.01). Accordingly, this hypothesis was supported.
H3 stated that Green Reward Management has a positive relationship with Job
Satisfaction. As indicated in Table 4.55, the influence of Green Reward Management
on Job Satisfaction is not in the hypothesized direction, and it was statistically not
significant (Standardized Beta = -0.066; p > 0.01). Accordingly, this hypothesis was
not supported.
H4 stated that Green Employee Involvement has a Positive relationship with Job
Satisfaction. As indicated in Table 4.55, the effect of Green Employee Involvement on

Chapter 4 Data Analysis and Findings
158
Job Satisfaction is in the hypothesized direction, and it was statistically significant
(Standardized Beta = 0.322; p < 0.01). Accordingly, this hypothesis was supported.
H5 stated that Green Recruitment and Selection has a positive relationship with
Employee Motivation. As indicated in Table 4.55, the effect of Green Recruitment and
Selection on Employee Motivation is not in the hypothesized direction, and it was not
statistically significant (Standardized Beta = -0.037; p > 0.01). Accordingly, this
hypothesis was not supported.
H6 stated that Green Training and Development has a positive relationship with
Employee Motivation. As indicated in Table 4.55, the effect of Green Training and
Development on Employee Motivation is in the hypothesized direction but it was not
statistically significant (Standardized Beta =0.043; p > 0.01). Accordingly, this
hypothesis was not supported.
H7 stated that Green Reward Management has a positive relationship with Employee
Motivation. As indicated in Table 4.55, the effect of Green Reward Management on
Employee Motivation is in the hypothesized direction, and it was statistically significant
(Standardized Beta = 0.661; p <0.01). Accordingly, this hypothesis was supported.
H8 stated that Green Employee Involvement has a Positive relationship with Employee
Motivation. As indicated in Table 4.55, the effect of Green Employee Involvement on
Employee Motivation is in the hypothesized direction, and it was statistically significant
(Standardized Beta =0.090; p <0.001). Accordingly, this hypothesis was supported.
H9 stated Employee Motivation has a Positive relationship with Organisational
Commitment. As indicated in step 3 of Table 4.55, the effect of Employee Motivation
on Organisational Commitment is in the hypothesized direction, and it was statistically
significant (Standardized Beta =0.210; p <0.001). Accordingly, this hypothesis was
supported.
H10 stated that Job Satisfaction has a Positive relationship with Organisational
Commitment. As indicated in step 3 of Table 4.55, the effect of Job Satisfaction on

Chapter 4 Data Analysis and Findings
159
Organisational Commitment is in the hypothesized direction, and it was statistically
significant (Standardized Beta =0.366; p <0.001). Accordingly, this hypothesis was
supported.
To test the mediating effect of Job Satisfaction and Employee Motivation, as proposed
in H11 and H12, the researcher followed the procedure followed by Baron and Kenny.
The researcher has illustrated that the mediator analysis test was done through current
path analysis investigation. The researcher has also compared the direct effect model
(D-E-M), when the path from Job Satisfaction and Employee Motivation to
Organisational Commitment is constrained to zero (as shown in Figure 4.16 and Figure
4.17) with the free model when the mediating path from Job Satisfaction and Employee
Motivation to Organisational Commitment is opened. For illustration, the D-E-M
included the additional direct path from Green Recruitment and Selection to
Organisational Commitment. Similarly, the additional direct path from Green Training
and Development, Green Reward Management and Green Employee Involvement to
Organisational Commitment was drawn in addition to the Mediating Paths from Job
Satisfaction and Employee Motivation to Organisational Commitment. The comparison
of the proposed model allowed the researcher to test, whether Job Satisfaction and
Employee Motivation fully or partially mediated the influence of antecedent variables
on Organisational Commitment. To satisfy the condition of full or partial Mediation, the
effect of antecedent variables on Behaviour Intention should be significant in the
constrained model and the previous significant effect should not be significantly
reduced in the free model.
Initially, there was no significant relation observed between Green Recruitment and
Selection, Green Reward Management and Organisational Commitment and significant
relation between Green Training and Development, Green Employee Involvement and
Organisational Commitment.

Chapter 4 Data Analysis and Findings
160
Table 4.56: Regression Weights: (Group number 1 - Default Model) (Direct Effect)
Step 1: Regression Weights: (Group number 1 - Default model)
Direct effect
Estimate S.E. C.R. P
OC <--- GRS -0.042 0.053 -0.797 0.425 Not Significant
OC <--- GTD 0.173 0.063 2.755 0.006 Significant
OC <--- GR 0.027 0.059 0.461 0.645 Not Significant
OC <--- GEI 0.244 0.03 8.017 *** Significant
After reviewing the conditions for mediation, the researcher has recommended that the
mediating effects of Job Satisfaction and Employee Motivation were not present
amongst all exogenous variables on Organisational Commitment. This indicates that
there was no indirect relationship. This was checked through boot strapping too, which
replicates the same results in the Table 4.56:
Figure 4.17: Employee Management as Mediator
Table 4.57: Standardized Indirect Effect
In
Presence
of EM
Standardized Indirect Effect
Beta p-Value
OC <--- GEI 0.012 0.437 Not Significant
OC <--- GR 0.044 0.476 Not Significant
OC <--- GTD 0.003 0.343 Not Significant
OC <--- GRS -0.003 0.328 Not Significant
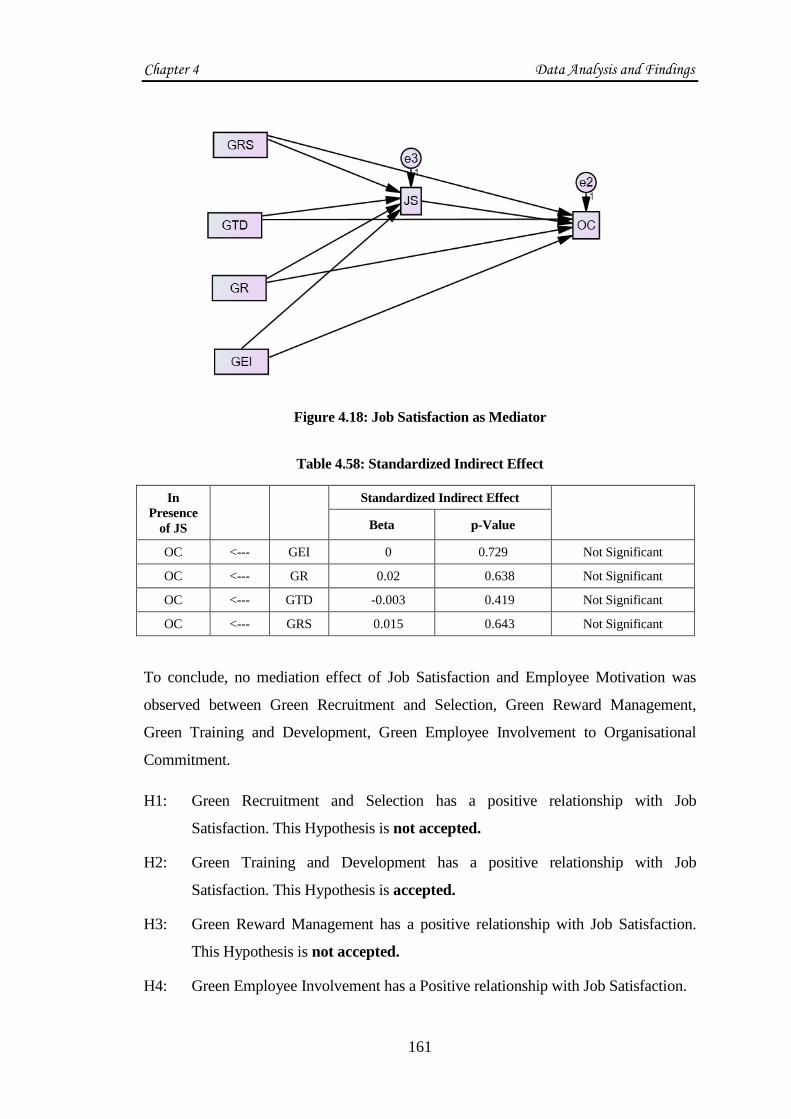
Chapter 4 Data Analysis and Findings
161
Figure 4.18: Job Satisfaction as Mediator
Table 4.58: Standardized Indirect Effect
In
Presence
of JS
Standardized Indirect Effect
Beta p-Value
OC <--- GEI 0 0.729 Not Significant
OC <--- GR 0.02 0.638 Not Significant
OC <--- GTD -0.003 0.419 Not Significant
OC <--- GRS 0.015 0.643 Not Significant
To conclude, no mediation effect of Job Satisfaction and Employee Motivation was
observed between Green Recruitment and Selection, Green Reward Management,
Green Training and Development, Green Employee Involvement to Organisational
Commitment.
H1: Green Recruitment and Selection has a positive relationship with Job
Satisfaction. This Hypothesis is not accepted.
H2: Green Training and Development has a positive relationship with Job
Satisfaction. This Hypothesis is accepted.
H3: Green Reward Management has a positive relationship with Job Satisfaction.
This Hypothesis is not accepted.
H4: Green Employee Involvement has a Positive relationship with Job Satisfaction.

Chapter 4 Data Analysis and Findings
162
This Hypothesis is accepted.
H5: Green Recruitment and Selection has a positive relationship with Employee
Motivation. This Hypothesis is not accepted.
H6: Green Training and Development has a positive relationship with Employee
Motivation. This Hypothesis is not accepted.
H7: Green Reward Management has a positive relationship with Employee
Motivation. This Hypothesis is accepted.
H8: Green Employee Involvement has a Positive relationship with Employee
Motivation. This Hypothesis is accepted
H9: Employee Motivation has a Positive relationship with Organisational
Commitment. This Hypothesis is accepted
H10: Job Satisfaction has a Positive relationship with Organisational Commitment.
This Hypothesis is accepted
Hypothesis for mediation:
H11: Job Satisfaction Mediates
a. The positive effect of Green Recruitment and Selection on Organisational
Commitment. There is no Mediating Effect observed.
b. The positive effect of Green Training and Development on Organisational
Commitment. There is no Mediating Effect observed.
c. The positive effect of Green Reward Management on Organisational
Commitment. There is no Mediating Effect observed.
d. The Positive effect of Green Employee Involvement on Organisational
Commitment. There is no Mediating Effect observed.
H12: Employee Motivation Mediates
e. The positive effect of Green Recruitment and Selection on Organisational
Commitment. There is no Mediating Effect observed.
Chapter 4 Data Analysis and Findings
163
f. The positive effect of Green Training and Development on Organisational
Commitment. There is no Mediating Effect observed.
g. The positive effect of Green Reward Management on Organisational
Commitment. There is no Mediating Effect observed.
h. The Positive effect of Green Employee Involvement on Organisational
Commitment. There is no Mediating Effect observed.
This section covered the data analysis. The next chapter has been devoted to
interpretation of findings, conclusions, limitations and suggestions.
Chapter 5 Interpretation of Findings, Conclusions, Limitations and Suggestions
164
CHAPTER 5
INTERPRETATION OF FINDINGS, CONCLUSIONS,
LIMITATIONS AND SUGGESTIONS
In view of the outcome of this research work, a detailed discussion of the theoretical
and practical implication is represented in this chapter. Additionally, the researcher has
also given some suggestions that can be adopted by the organizations. In this chapter,
suggestions based on research work, limitations and further scope of research has been
discussed.
5.1 Interpretation of Findings of Main Variables of Study
For finalizing the scale of different variables, Factor analysis was used which is a
technique of data reduction. From the analysis, 7 factors were finally extracted regarding
Green HRM. These are: Green Recruitment and Selection, Green Training and
Development, Green Reward Management, Green Employee Involvement, Employee
Motivation, Job Satisfaction, Organisational Commitment. It has been found that the
percentage of variance explained by factor one to seven is 13.713 for Green Recruitment
and Selection, 9.674 for Green Training and Development, 7.915 for Green Reward
Management, 7.906 Green Employee Involvement, 7.736 for Employee Motivation,
10.915 for Job Satisfaction, and 7.949 for Organisational Commitment. The empirical
analysis of the data has validated several major findings as per the objectives. The key
objectives of this study were, to identify the various Green HRM practices adopted by
Indian firms, and to identify the relationship between Green HRM practices and
Employee Motivation, Job Satisfaction and Organisational Commitment, and to analyse
the suggested model. The details of the findings of the research work are discussed below.
5.1.1 Green Recruitment and Selection and Job Satisfaction
The initial hypothesis formulated for this study was: “H1: Green Recruitment and
Selection has a positive relationship with Job Satisfaction.” This hypothesis was not
Accepted.
Chapter 5 Interpretation of Findings, Conclusions, Limitations and Suggestions
165
The results of this study indicate that Green Recruitment and Selection does not have
positive relationship with Job Satisfaction. As per the result, including environmental
criteria in Recruitment and Selection does not give Job Satisfaction to the employees
of the organisation but employees feel satisfaction with the job if the company is
giving them good environment, transparent reward system, timely promotions and
security of their job in the future.
5.1.2 Green Training and Development and Job Satisfaction
Second hypothesis was “H2: Green Training and Development has a positive
relationship with Job Satisfaction.” This hypothesis was Accepted.
The result of the study indicates that Green Training and Development has a positive
relationship with Job Satisfaction. This suggests that if company imparts environmental
training to their employees to develop required skills and knowledge, employees will
become more satisfied with their job. Environmental training practices include less
paper work, reducing long distance travel and giving training on online interaction with
the clients. North (1997) goes on to state that a core challenge for Personnel Managers
is providing environmental education that will result in a change of attitude and
behavior among managers and employees. Therefore, the researcher suggested that
environmental training and education are vital, in order to provide knowledge, change
attitudes and behaviors and acquire new skills. However, in order for this to be
achieved, environmental training and education programmes need to be appropriately
designed.
5.1.3 Green Reward Management and Job Satisfaction
Third Hypothesis was “H3: Green Reward Management has a positive relationship
with Job Satisfaction.” This hypothesis was not Accepted.
The result of this research indicates that Green Reward Management does not have a
positive relationship with Job Satisfaction. Rewards are not directly effecting the Job
Satisfaction in some organizations. Reward has an insignificant impact on Job Satisfaction.
Reward system should be based on individual performance not in totality. It was observed
that most of the companies are into green practices due to cost factor associated with waste

Chapter 5 Interpretation of Findings, Conclusions, Limitations and Suggestions
166
disposal, moral obligation to be more socially responsible, pressure from regulatory bodies
and pressure from competitors. Hence rewards were performance based.
5.1.4 Green Employee Involvement and Job Satisfaction
Fourth Hypothesis was “H4: Green Employee Involvement has a Positive
relationship with Job Satisfaction.” This hypothesis was Accepted.
The result of this research work indicates that Green Employee Involvement has a
Positive relationship with Job Satisfaction. This suggests that involvement of
employees in the decisions of the organizations will make them more satisfied with
their job. By giving equal opportunities to the employees to involve and participate in
green suggestion schemes make them more responsible to follow the green
management practices. It was observed that respondents were of the view that for
most businesses, sustainability plans now extend beyond daily operations. It affects
everyone in business from CEO level to workers working at the shop floor level.
5.1.5 Green Recruitment and Selection and Employee Motivation
Fifth hypothesis was “H5: Green Recruitment and Selection has a positive
relationship with Employee Motivation.” This hypothesis was not Accepted.
The result of this study also indicates that Green Recruitment and Selection does not
have positive relationship with Employee Motivation. Employees will not be motivated
if organizations follow green practices in framing recruitment and selection process. So
organizations need not ask environment related questions to the prospective candidates.
Employees are not in the favour that Company should select only those candidates
who are sufficiently aware of greening to fill job vacancies, as employee might be a
good performer in other areas.
5.1.6 Green Training and Development and Employee Motivation
Sixth hypothesis was “H6: Green Training and Development has a positive
relationship with Employee Motivation.” This hypothesis was not Accepted.
The result of the study indicates that Green Training and Development does not have
a positive relationship with Employee Motivation. This shows that employees are not

Chapter 5 Interpretation of Findings, Conclusions, Limitations and Suggestions
167
interested in environmental training and education, but employees want their training
to be completely based on the skills and knowledge needed for good performance.
Training and development based on the job skills will actually motivate them to
perform better.
5.1.7 Green Reward Management and Employee Motivation
Seventh hypothesis was “H7: Green Reward Management has a positive relationship
with Employee Motivation.” This hypothesis was Accepted.
The results of the study indicate that Green Reward Management has a positive
relationship with Employee Motivation. This means that employees have concern
with rewards. Crosbie and Knight (1995) state that some companies have
successfully rewarded extraordinary environmental performance, practices and ideas
by including environmental criteria into salary reviews. It can be implemented in the
form of monetary rewards (bonuses, cash premiums), non-monetary rewards
(sabbaticals, leave, gifts) and recognition awards (awards, dinners, daily praise)
(Bonnie F. Daily & Huang, 2001; Govindarajulu & Daily, 2004; Renwick, 2008). It
can motivate and increase employee‘s commitment to be more environmentally
responsible which can help both the company and its workers and environmental
performance will be enhanced (Bonnie F Daily, 2011). It can reinforce
empowerment and good decision making, improving corrective and preventive
measures employees initiate (Bonnie F. Daily & Huang, 2001). In order to produce
desirable behaviors in environmental management, companies require effective
employment of both incentives and disincentives (Rees, 1996).For example, Xerox
has awarded a number of environmental teams company-wide with team excellence
awards, in recognition for developing environmentally-sound packaging, re-use of
materials and packaging, and the marketing of recycled paper for Xerox copiers,
(Bhushan, 1994). Xerox has also further developed an 'Earth Award' that recognises
achievements in innovations of waste reduction, re-use and recycling.
5.1.8 Green Employee Involvement and Employee Motivation
Eighth hypothesis was ―H8: Green Employee Involvement has a positive relationship
with Employee Motivation.” This hypothesis was Accepted.

Chapter 5 Interpretation of Findings, Conclusions, Limitations and Suggestions
168
The result of this research work indicates that Green Employee Involvement has a
positive relationship with Employee Motivation. This suggests that involvement of
employees in the organization motivates the employees. By giving equal opportunities
to the employees to involve and participate in green suggestion schemes, motivates
the employees to work better. According to jabber and abid (2015), wider employee
participation rather than restricting involvement to managers and specialists is often
seen as crucial to successful outcomes. When a firm gives them opportunity to get
involved in eco-initiatives and make decisions then they become more motivated
and satisfied with their jobs. The two gains seen from introducing environmental
employee involvement are improvement in environmental and worker health and
safety, and development of more knowledgeable employees and supervisors
(Govindarajulu & Daily, 2004). Also it can have a strong effect on changing working
routines, affecting behaviour and increasing environmental consciousness (Kaur,
2011). Once the employees are involved, they will be motivated to work in teams in
order to achieve the team objectives (Bonnie F Daily et al., 2011).
5.1.9 Employee Motivation and Organisational Commitment
Ninth hypothesis was “H9: Employee Motivation has a Positive relationship with
Organisational Commitment.” This hypothesis was Accepted.
The result of this study indicates that Employee Motivation has a Positive relationship
with Organisational Commitment. This suggests that if employees are motivated in the
organization then they will be more committed towards the organizations. Employees will
follow the green practices and policies of the organizations on their own without any need
of imposing the practices on them. (Daily & Huang,2001) states that management clearly
establishes its commitment to environmental improvement by forming environmental
policy. It establishes an environmental vision and guide the company‘s efforts to achieve
it (Wee& Quazi,2005,Govindarajula &Daily,2004).With the top management support
environmental strategies could be adopted that leads to low emissions, reduce wastes and
environmentally responsible products that can lead to continual improvement in
environmental performance.

Chapter 5 Interpretation of Findings, Conclusions, Limitations and Suggestions
169
5.1.10 Job Satisfaction and Organisational Commitment.
Tenth hypothesis was ―H10: Job Satisfaction has a Positive relationship with
Organisational Commitment.” This hypothesis was Accepted.
The result of this study also indicates a positive relationship between Job Satisfaction
and Organisational Commitment. This suggests that employees who are satisfied with
their job will be more committed towards the organization. Employees will not think of
quitting the job for a longer period and they will feel proud in working with such
organisations. Many studies assert the high correlation between Job Satisfaction and
Organisational Commitment (Mathieu, 1991, Yousef, 2002, Rayton, 2006, and Huang
& Hsiao, 2007). Huang & Hsiao (2007) stated satisfaction is the precursor of
commitment; it may benefit both changing human behavior outcome and increasing
commitment. People will be more committed to their work if they felt satisfied and
appreciated. Aamodt (2007) indicated that satisfied employees tend to be committed to
an organization, and employees who are satisfied and committed are more likely to
attend work, stay with an organization, arrive at work on time, perform well and engage
in behavior helpful to the organization.
5.2 Conclusions
Today, Organizations are trying to focus on profit maximization and environmental
obligation at the same time. In today‘s world organization that has more focus on
environment has higher acceptance in society. Due to this rising awareness of the society
about environment, organizations are being pushed to pay more attention on the
environment. Now, it may seem that more investment on environmental issues will cause
profit minimization. In that case, non-financial practice like green human resource
management can be implemented in the organization. Financial help to a part of the total
population of a country may get less focus than being green through Green HRM. Higher
focus will create higher acceptance. Higher focus will facilitate an organization to
maximize their profit in long run. In this way CSR can also be performed through Green
HRM. So practicing Green HRM as a means of promoting CSR in this industry will have
a positive impact over the industry which will facilitate them to achieve higher social
acceptance as well as higher profit making in the long run.

Chapter 5 Interpretation of Findings, Conclusions, Limitations and Suggestions
170
1. In this empirical research work, the researcher has provided useful insights into the
green practices adopted by organizations in the background of a developing
economy like India where environmental concern is on rise.
2. Using confirmatory factor analysis, the study confirms seven major factors i.e. ―a)
Green Recruitment and Selection, b) Green Training and Development, c) Green
Reward Management, d) Employee Involvement, e)Employee Motivation, f) Job
Satisfaction, g) Organisational Commitment‖, important for adoption of green
practices by various organisations in India and it also establishes the structural
relationship between these factors.
3. The insights from the study, can indeed be used to formulate various strategies
especially for green services in various sectors in India. It would ultimately give rise
to sustainable development and preservation of environment. Green HRM helps in
the effective outcomes like they could get a first mover advantage, many
organizations can also develop a competitive edge by creating a brand image as an
environment conscious body.
4. In view of the optimistic response of various organizations towards adoption of
green practices, the research work suggests implication for the marketers and policy
makers for effective implementation of green programs in future which helps them
to get subsidies from the government.
5. Previously, Armstrong (2014) has recognized that training is important in creating a
strong culture based on values and mission statements. Thus, this HRM attribute
can be supported and reinforced by Cook and Seith (1992) who state that training is
a very crucial element in the success of environmental initiatives and North (1997)
who state that training is definitely a core factor in developing human resources for
the environment. In addition, Milliman and Clair, (1996); Beaumont et al, (1993);
Barrett et al, (1996); and North, (1992, 1997), all argue the vital importance of
training and development which must take place at all levels within the organization
in order to embed an environmental consciousness and organizational
environmental commitment.
6. Crosbie and Knight's, (1995) and Milliman and Clair's, (1994, 1996) statements
support the key HRM attribute by stating that reward systems should include
Chapter 5 Interpretation of Findings, Conclusions, Limitations and Suggestions
171
environmental criteria. Reward systems should also be linked to the achievement of
performance appraisal goals in order to motivate the employees of the organizations.
7. Schmidheiny (1992), argues that adopting environmentally responsible practices
will probably involve major change in organizational values, practices and
procedures, breaking embedded habits and practices and adopting new ways of
thinking which will consider what is done, why and how.
8. Though the green movement and Green HR are still in the stages of infancy,
growing awareness within organizations of the significance of green issues have
compelled them to embrace environment-friendly HR practices with a specific
focus on waste management, recycling, reducing the carbon footprint, and using and
producing green products. Clearly, a majority of the employees feel strongly about
the environment and, exhibit greater commitment and Job Satisfaction toward an
organization that is ever ready to go ―Green.‖
9. The responsibilities of the present generation HR managers are to create awareness
among the youngsters and among the people working for the organization about the
Green HRM, Green movement, utilization of natural resources and helping the
corporate to maintain proper environment, and retain the natural resources for our
future generation i.e. sustainable development (Mathapati, 2013).
The conclusion that can be derived from this research is that Green ideas and practices
are finding more and more relevance in many organizations‘ and within the space of
the HR profession. HR leaders being the advocates of organizational culture and
policies are critical to inculcate a sense of responsibility in each employee towards a
sustainable green human resources management. However, still greater change needs
to happen so that employees and organizations 'take that big leap in ensuring greening
process in all their activities.
5.3 Limitations
This research work was carried out to find out the relationship between Green HRM
practices with Employee Motivation, Job Satisfaction and organizational. Despite best of
efforts to minimize all limitations that might creep in course of the research, there were
certain constraints within which the research was completed. These are discussed below:

Chapter 5 Interpretation of Findings, Conclusions, Limitations and Suggestions
172
Notwithstanding its wide-ranging coverage, the current research work may be
criticized because it misses an in-depth analysis of the type the psychologists or
anthropologists has often conducted. This research work has not analysed by
using any econometric test or psychometric test. This research work is totally
based on the practices followed in the organisations.
Sustainability has three aspects: social, economic and environment. In this study,
the researcher has studied only environment dimension in relation to Green HRM
Practices.
In this study, the researcher has only taken Green Recruitment and Selection,
Green Training and Development, Green Reward Management, Employee
Involvement, Employee Motivation, Job Satisfaction and Organisational
Commitment. There are other factors also which impact the Green HRM practices
like, Green Health and Safety Management, Green Job Design and Analysis,
Green Induction, etc. that have not been considered.
The research was purely based on primary data as well as secondary data. The
primary data for this study was collected from the samples based in NCR only.
While researcher has tried to make sure that the sample is a true representation of
the population, the generalization of the findings of the research work is restricted
as defined by the size of the sample, which comprised of 300 respondents
carefully chosen from various areas of NCR.
5.4 Suggestions
Based on the above findings the following suggestions are proposed by the researcher
for the effective implementation of the GHRM in the Organizations.
5.4.1 To Business Organizations
Secure job environment enhances the degree of Job Satisfaction. Management
must create an environment of job security among employees Apart from job
security, management must provide job stability.
Job Satisfaction of employees in any organization is of utmost importance to in order
to achieve the objectives of an organization and make it sustainable in the long run.

Chapter 5 Interpretation of Findings, Conclusions, Limitations and Suggestions
173
A business and businessmen have to ensure the employee participation in
management and administration. In management there is a proverb that ―Esprit de
corps‖ that means unity is strength. Harmonious and team work is always
effective and efficient for the business success. When the workers and employees
are encouraged to take part in the management and decision making that means
they are contributing to the organization.
It reflects that when the level of Job Satisfaction increases, the level of
Organisational Commitment also increases. Therefore, this factor should be
increased to improve an employee‘s commitment to an organization.
Organizations should commence proper performance appraisal systems which
result in pay rise, promotion, and training of the employees that will enhance on
employees‘ Job Satisfaction.
Human Resource Management of the organizations should offer extensive Green
Training and Development programs for the employees for better satisfaction of
the employees.
As there is no positive relation between Green Reward Management and Job
Satisfaction, so employees should be properly trained and promotion of the
employees should be based on the qualification of employees and /or experience
of employees to create Job Satisfaction.
As there is positive relation between Green Reward Management and Employee
Motivation so, company should offer recognition rewards for environmental
performance. The success of recognition rewards relies on the importance of
company-wide identification. For example, such attention increases employee‘s
awareness of environmental achievements (Bhushan, 1994). There are many
ways in which organisations can communicate their environmental excellence
within the organisation. For example, managers at Coors present awards at
important meetings to employees who have participated in successful
environmental programmes, (Woods, 1993).
Organizations must give environmental training and education to the employees
as these are vital, in order to provide knowledge, change attitudes and behavior
and acquire new skills.

Chapter 5 Interpretation of Findings, Conclusions, Limitations and Suggestions
174
Rewards should be given to the employees who uses bicycles to commute or uses
car pools. It would encourage those who live nearby to commute by cycle or
walk, thereby reducing pollution. The ones who live far off could use bicycles to
go to the market. It would be a good exercise and would keep the employee in
good health.
Employees should be recognised and rewarded for green innovations. The
employees who come up with the most innovative green initiatives should be
awarded a ‗Go Green‘ badge.
Segregation of waste and disposal of waste should be streamlined in the
organisation. Food canteen should adhere to zero wastage policy and use the
leftover food for a better cause.
Organizations should attempt to replace the age old tradition of paper
documentation by paperless office. This can be achieved by ensuring 100% IT-
based HR operations.
Organizations should initiates practices of green rewards to departments and
individuals for innovative initiatives and green contribution through reduction of
wastes, green resources and energy. Take innovative initiatives of saving
electricity by encouraging volunteering to switch off lights and fans where and
whenever required. Companies should conduct an energy audit to ensure
effective and efficient use of energy in organisations and use energy efficient
bulbs and install timer to switch off the light automatically after a definite time.
Corporate gardens must encourage the use of natural fertilisers and pesticides.
Every office should maintain greening of office premises with gardens. There
should be HR policies for participation of employees for gardening; by
contributing manure or attending to a certain plant area of the garden.
Use online system in most of the procedures of the organizational activities to
make your organization eco-friendly. Companies should encourage suppliers to
provide environmentally sustainable product to make the outer world green.

Chapter 5 Interpretation of Findings, Conclusions, Limitations and Suggestions
175
Develop or Enhance waste management system to reduce atmospheric (air, water,
soil) pollution. At most care about use of water and leakage of drainage system to
ensure efficient use of water and to reduce water pollution.
Spread green thinking among employees and stakeholders to make them green
psychologically. Engaging with employees and empowering them to act through
the company in a nonsuperficial way is a most effective means through which to
increase output towards and ultimately achieve or enhance environmental
strategies and goals.
Reward employees on the basis of green activities to motivate them to be more
aware about environment. They should use organization‘s transport in group
rather than privately to ensure less emission of different harmful gases to the
atmosphere. Reduce business travel and focus on teleconferencing to minimize
the emission of carbon-di-oxide.
Make everyone feel concerned about the green benefits (even cash value of
greening) to create their willingness towards green. Companies should also create
a green identity through green activities that will create a Brand image.
Encourage employees to share new ideas regarding environmental issues. Get
your surrounding community know about your greening practice that will make
them loyal to your brand. Companies should also try to integrate green HR
practices with corporate social responsibilities.
Install heat management system to ensure comfortable temperature in the
organization and surroundings that increases productivity and efficiency of
employees.
Conduct annual survey on measuring the level of green practice adopted by the
organization at different levels.
This research work should act as a guiding force for the HR of the organization to
develop policies and procedures which will help in making energy efficient,
sustainable and environmentally friendly product and services.

Chapter 5 Interpretation of Findings, Conclusions, Limitations and Suggestions
176
5.4.2 To the Government
Government of India can also play a proactive role with a special role assigned to
Ministry of Environment (MoE) in enhancing the speed of reforms to combat the
issues of climate change and decarbonize the economy. Various skill development
centres should be developed that are related to training workforce specially in the
area of environmental management, sustainable energy, recycling waste,
generation of energy from waste, managing e-waste, clean technologies etc.
Compensation in the form of ―Green Allowance‖ can be added as an incentive to
the salary of central government/ state government employees who qualifies
exams related to environment or contributes by way of innovation towards
environment related practices in their offices.
In order to create better educational infrastructure in country an introduction of
nominal cess can be thought. The money collected in this manner can be used to
create environment institutes across different states that can train and create green
manpower.
Government should create green advisory for industry and public. Just like
advisory to farmers helped in improving yield of crops at one point of time,
similarly, creation of green advisory for industry and public can help, educate
and motivate general public and industries undertake practices that help in
conserving, improving and cleaning environment. Special help line numbers can
be an added advantage that make access to such advisory organisations earlier.
Tax holidays can be given to green organisations who wish to invest in India.
Organisations promoting buying, selling or manufacturing of green products can
be encouraged by way of exemption from paying tax for two years. Such
organisations will be requested to spend this money on training and giving
incentives to its employees for learning and implementing green practices. There
organisations should be encouraged to have their own green eco labels and
green trademarks to promote their products and services.
Chapter 5 Interpretation of Findings, Conclusions, Limitations and Suggestions
177
Government should implement green tax on polluting and non- green
organisations. Organisations that have direct impact on environment because of
their activity should be made to pay green tax to compensate for damage made
by them to environment. They should be further enforced to train their
workforce regarding green practices so that employees can bring change in their
organisation.
Like BSE and NSE, creation of stock exchange looking after trading of carbon
credits and equities linked to green organisation should be created. Organisations
should then think of creating a concept of green employee‘s stock options
(GESOP) so that they can have stake in green organisations of future.
5.4.3 To Researchers and Academicians
Though area of environmental science, environmental management, and environment
conservation is a well-developed area but creation of green workforce is far from
reality. Environment has been seen as a credence good and hence reaction to issues
related to environment is slow and not instantaneous. Many researches have been
conducted in the field of management in area of green marketing, green supply chain,
green human resource, green finance but change in behaviour related to environment
protection is less observed.
Present government has started many new schemes like digital India, Swachh Bharat
Abhiyan, and clean India which is starting towards changing behaviour of general
masses towards clean and green environment.
In order to create orientation towards environment, academicians at primary,
secondary and tertiary level need to create curriculum related to creation of green
workforce. This workforce need to be trained in a manner that creates skill set
required for:
1) Managing waste
2) Promote reduce, recycling and reuse.
3) Promote digitization
4) Promote social awareness and transformation among students

Chapter 5 Interpretation of Findings, Conclusions, Limitations and Suggestions
178
5) Promote innovation related modified environmental conscious behaviour among
general masses.
6) Integration of IT and environmental conservation.
Researcher can undertake studies on areas like creation of on the job green
induction and training programmes, promoting green investment, and trading in
carbon credits, creation of green services, investor behaviour and career
progression of green human resource.
Studies should be undertaken to assess effectiveness and usefulness of training
manpower related to environment related courses presently being offered by
educational institutions and how can they be modified to create better learning
outcomes that have far reaching effect on society.
Researcher has proposed that GHRM has substantial scope for research in
management field but there are very few studies on this topic hence, there is a need
to bridge the gap between professional GHRM practices and preaches in research
and teaching of environmental management.
Academicians in the field of management and engineering, economics and law
should come together and suggest an integrated model for environment that can be
applied for this great nation-India and use this piece of research as a small link of a
big chain which needs to be developed fast.
5.5 Future Scope of Research
The following are the related areas which have been identified by the researcher for the
scope of further research related to this area.
The present study proposes future researchers to fill the gap in the existing
literatures by conducting empirical studies such as Green HRM practices in the
manufacturing or service organizations (particularly the organizations that are
polluting environment, Comparing Green HRM practices between developed and
developing countries, Green perceptions, attitudes of employer and employees,
barriers in the Green HRM implementation in organizations.

Chapter 5 Interpretation of Findings, Conclusions, Limitations and Suggestions
179
A comparative study of Green HRM among different sectors can be conducted to
get an insight of Green HRM practices followed by the organizations.
In the present study, the researcher has studied only few organizations, the future
researcher can select some other organizations for study and can suggest some more
options for better implementation of Green HRM Practices.
In addition, it will be of interest to the future researchers to explore and validate the
model developed for this study in other cultural settings, like Asian or Western
developing or developed countries. This will be valuable in providing evidence
concerning the robustness of research model across different cultural settings. It is
understood that the robustness of the model may vary across different cultural
settings and thus need to be empirically tested (Mao and Palvia, 2006).
As there is still confusion and compromise on the integration of environmental
issues into organization‘s policies, further research should be conducted to
determine the association between other HRM Functions like employee health,
employee retention, self-actualization in context to environment needs and its
relationship with the environmental performance.
Further studies can be conducted in backdrop of suggestions provided in the
previous section.

Bibliography
180
BIBLIOGRAPHY
Aamodt, M.G. (2007). Industrial Organizational Psychology: An Applied
Approach. Belmont, CA: Wadsworth Cengage Learning.
Adane, L. and Muleta, D. (2011). Survey on the usage of plastic bags, their
disposal and adverse impacts on environment: A case study in Jimma City,
Southwestern Ethiopia.Journal of Toxicology and Environmental Health
Sciences Vol. 3(8) pp. 234-248.
Ahmad, S. (2015). Green Human Resource Management: Policies and practices.
Cogent Business and Management. https://doi.org/10.1080/23311975.
2015.1030817
Ahmad, S., & Schroeder, R. G. (2003). The impact of human resource
management practices on operational performance: Recognizing country and
industry differences. Journal of Operations Management. https://doi.org/
10.1016/S0272-6963(02)00056.
Allen, N. J., & Meyer, J. P. (1990). The measurement and antecedents of
affective, continuance and normative commitment to the organization. Journal
of Occupational Psychology. https://doi.org/10.1111/j.2044-
8325.1990.tb00506.x
Anderton, K., and Jack, K. (2011). Green behavior change: A case study of Eco
Concierge, in Going Green: The Psychology of Sustainability in the Workplace,
ed. D. Bartlett, The British Psychological Society, 76-83.
Andrady, A.L., 2003. Plastics and the environment. In: Anthony L. Andrady
(Ed.),Publisher: John Wiley and Sons, ISBN 0-471-09520-6
ARAGÓN-CORREA, J. A., AND SHARMA, S. (2003) ―A Contingent
Resource-Based View of Proactive, Corporate Environmental Strategy‖,
Academy of Management Review, 28(1): 71-88.

Bibliography
181
Aravamudhan NR. (2012). Green HR getting into the Business of Green, HRM
Review, 12.
Aretz H.J., Hansen K. (2003), Erfolgreiches Management von Diversity. Die
multikulturelle Organisation als Strategie zur Verbesserung einer nachhaltigen
Wettbewerbsfähigkeit, Zeitschrift für Personalforschung 17 (1), pp. 9-36
Armstrong, M. (2009) Armstrong‘s Handbook of Human Resource Management
Practice. 11th edn. UK: Kogan Page Limited.
Armstrong, M. (2012) Armstrong‘s Handbook of Human Resource Management
Practice. 12th edn. UK: Kogan Page Limited.
Armstrong, M. (2014) Armstrong‘s Handbook of Human Resource Management
Practice. 13th edn. UK: Kogan Page Limited.
AUTODATA. (2011) Terreno Fértil—Setor Automotivo Intensifica Programas
e Práticas em Busca de Sustentabilidade, 262nd ed.; AUTODATA: Maidenhead,
UK.
Azzarello, M. Y., and E. S. van Vleet. (1987). Marine birds and plastic
pollution. Mar. Ecol. Progr. Ser. 37~295-303.
Backhaus, K. B., Stone, B. A., and Heiner, K. (2002). Exploring the relationship
between corporate social performance and employer attractiveness. Business
and Society, 41, 292–318. http://dx.doi.org/10.1177/ 0007650302041003003
Bansal, P., and Roth, K. 2000. ―Why companies go green: A model of
ecological responsiveness,‖ Academy of Management Journal, Volume 43, No.
4, pp. 717-736.
Barney, J. (1991). Firm Resources and Sustained Competitive Advantage.
Journal of Management, 17, 99- 120.
Barney, J., and Tyler, B. (1991). The prescriptive limits and potential for
applying strategic management theory. Managerial and Decision Economics.

Bibliography
182
Baron, R.M. and Kenny, D.A. (1986). The moderator-mediator variable
distinction in social psychological research: conceptual, strategic and statistical
considerations. Journal of Personality and Social Psychology, 51, 1173–1182.
Barrett, S. M., and Murphy, D. F., (1995), ―The Implications of The Corporate
Environmental Policy Process for Human Resource Management‖, Greener
Management International Journal, April, No 10.
Barrett, S. M., and Murphy, D. F., (1996), ―Managing Corporate Environmental
Policy: a Process of Complex Change‖, in Wehrmeyer, E., (Ed), (1996),
Greening People – Human Resource and Environmental Management, First
Edition, Sheffield, England: Greenleaf Publishing.
Bentler, P. M. (1999). Structural equation modeling with small samples: Test
statistics. Multivariate Behavioral Research, 34(2) 181-197.
Bentler, P. M., and Bonett, D. G. (1980). Significance tests and goodness of fit in
the analysis of covariance structures. Psychological Bulletin, 88, 588-606.
Berg, B. L. (2009). Qualitative research methods for the social sciences (7th
ed.). Pearson International.
Berg, B. L., and Lune, H. (2012). Qualitative research methods for the social
sciences (8th ed.). Pearson Education.
Bernal, J.G., Castel A.G., Navarro, M.M., and Torres P.R., (2005), ―Job
Satisfaction : empirical evidence of gender differences‖, Women in
Management Review, vol. 20, No. 4, pp. 279-288.
Berry, M. A., and Rondinelli, D. A. (1998). Proactive corporate environmental
management: A new industrial revolution. The Academy of Management
Executive, 12(2), 38-50.
Bhushan, A.K. and Mackenzie, J.C. (1994), Environmental leadership plus total
quality management equals continuous improvement, Environmental TQM, 2nd
ed, McGrawHill, New York, pp. 72-93.

Bibliography
183
Biswas, S., and Varma, A. (2012). Linkages between antecedents of in-role
performance and intentions to quit: An investigation in India. The International
Journal of Human Resource Management, 23(5), 987-1005.
Bollen, K. A. (1989). Structural equations with latent variables. New York:
Wiley.
Bonnie F. Daily, Su‐chun Huang, (2001) "Achieving sustainability through
attention to human resource factors in environmental
management", International Journal of Operations and Production
Management, Vol. 21 Issue: 12, pp.1539-1552,
Boselie, P., Dietz, G., and Boon, C. (2005). Commonalities and contradictions
in HRM and performance research. Human Resource Management Journal,
15(3), 67-94.
Bowen, D. E., and Ostroff, C. (2004). Understanding HRM - firm performance
linkages: The role of the "strength‖ of the HRM system. Academy of
Management Journal, 29(2), 203-221.
Brace, I. (2004) Questionnaire design. How to plan, structure and write survey
material for effective market research. London: Kogan Page.
Brundtland, G. (1987). Report of the World Commission on Environment and
Development: Our Common Future. United Nations General Assembly
document A/42/427.
Buchan, J. (2000), ―Health sector reform and human resources: lessons from the
United Kingdom‖, Health Policy and Planning, Vol. 15 No. 3, pp. 319-25.
Buchan, J. (2004). What difference does (―good‖) HRM make? Human
Resources for Health, 2(6), 1-7.
Buck Consultants (2009), the Greening of HR Survey, 1-12.
Burns, A.C. and R.F. Bush, 2003. Marketing Research: Online Research
Application. 4th Edn., Prentice Hall, New Jersey.

Bibliography
184
Byrne, B. M. (2010). Structural equation modeling with AMOS, (1st ed.). New
York: Routledge.
Cable DM, Turban DB (2001) Establishing the dimensions, sources and value of
job seekers‘ employer knowledge during recruitment. Elsevier Science, New
York.
Callenbach, E., Capra, F., Goldman, L., Lutz, R. and Marburg, S. (1993),
EcoManagement: The Elmwood Guide to Ecological Auditing and Sustainable
Business, Berrett-Koehler, San Francisco, CA
Candice Harris and Dr. Helen Tregidga (2008),HR managers and Environmental
Sustainability : Strategic leaders or passive observers, Track management.
Cantor, D. E., Morrow, P. C., and Montabon, F. (2012). Engagement in
environmental behaviors among supply chain management employees: An
organizational support theoretical perspective. Journal of Supply Chain
Management, 48(3), 33-51..
Carmona-Moreno, E., Céspedes-Lorente, J., and Martinez-del-Rio, J. (2012).
Environmental human resource management and competitive advantage.
Management Research: The Journal of the Ibero-American Academy of
Management, 10(2), 125-142.
Carroll, A. B., and Shabana, K. M. (2010). The business case for corporate
social responsibility: A review of concepts, research and practice. International
Journal of Management Reviews, 12(1), 85-105.
Casler, A., Gundlach, M. J., Persons, B., and Zivnuska, S. (2010). Sierra Nevada
Brewing Company‘s thirty-year journey toward sustainability. People and
Strategy, 33, 44–51.
Chad Holliday‘s ‗‗Sustainable Growth, the DuPont Way,‘‘ Harvard Business
Review, 2001, September, 129–134, as well as Dunphy et al. (2007).
Charbel José Chiappetta Jabbour and Fernando César Almada Santos (2008):
The central role of human resource management in the search for sustainable

Bibliography
185
organizations, The International Journal of Human Resource Management,
19:12, 2133-2154
Charbel Jose Chiappetta Jabbour, (2011) "How green are HRM practices,
organizational culture, learning and teamwork? A Brazilian
study", Industrial and Commercial Training, Vol. 43 Issue: 2, pp.98-105,
Charbel Jose ChiappettaJabbour, (2011) "How green are HRM practices,
organizational culture, learning and teamwork? A Brazilian
study", Industrial and Commercial Training, Vol. 43 Issue: 2, pp.98-105.
Chartered Institute of Personnel and Development (CIPD) (2007), The
environment and people management, Discussion web page.
Cherian, J., and Jacob, J. (2012). A study of green HR practices and its effective
implementation in the organisation: A review. International Journal of Business
and Management, 7(21), 25-33.
Churchill, Gilbert A., Jr. Marketing Research: Methodological Foundations.
Hinsdale, 6th Edition.: Dryden Press, 1995.
Clarke, E. (2006), Power Brokers, People Management, 18thMay, pp. 40-42.
Cohen, A., and Keren, D. (2008). Individual values and social exchange
variables examining their relationship to and mutual effect on in-role
performance and organizational citizenship behavior. Group and Organisation
Management, 33(4), 425-452.
Cohen, A., and Liu, Y. (2011). Relationships between in-role performance and
individual values, commitment, and organizational citizenship behavior among
Israeli teachers. International Journal of Psychology, 46(4), 271-287.
Cohen, D., and Crabtree, B. (2006). Triangulation. [Online accessed 3
December, 2014] URL: http://www.qualres.org/HomeTria-3692.
Cohen, E., Taylor, S., and Muller-Camen, M. (2010). HR‘s role in corporate
social responsibility and sustainability. SHRM Foundation.
Bibliography
186
Collier, J., and Esteban, R. (2007). Corporate social responsibility and employee
commitment. Business Ethics: A European Review, 16, 19–33.
Commissioned review of Rod Ellis‘ (2008) ―The Study of Second Language
Acquisition‖ (2nd ed.) (Oxford, UK: Oxford University Press, 2008). System.
38. 146-149.
Cook and Seith, (1992), in Milliman, J., and Clair, J., (1996), ―Best
Environmental HRM Practices in the USA‖, in Wehrmeyer, W., (Ed), (1996),
Greening People – Human Resources and Environmental Management, First
Edition, Sheffield, England: Greenleaf Publishing.
Cooper and Schindler (2003), Business Research Methods, 8th Edition, Tata Mc-
Graw Hill Publishing Company Limited, New Delhi.
Cox, T. H. (1993). Cultural Diversity in Organizations: Theory, Research and
Practice. San Francisco, CA: Berrett-Koehler Publishers.
Cox, T. H., and Blake, S. (1991). Managing cultural diversity: Implications for
organizational competitiveness. Academy of Management Executive, 5(3), 45-
56.
Cox, T. H., and Finley-Nickelson, J. (1991). Models of acculturation for
intraorganizational cultural diversity. Canadian Journal of Administrative
Sciences, 8(2), 90-100.
Cramer, J. (1998). Environmental management: From ‗fit‘ to ‗stretch‘. Business
Strategy and the Environment, 7(3), 162-172.
Cranny, C.J., Smith, P.C., and Stone, E.F. (1992), Job Satisfaction: How people
feel about their jobs and how it affects their performance, Lexington Books,
New York.
Crosbie, L. and Knight, K. (1995), Strategy for Sustainable Business:
Environmental Opportunity and Strategic Choice, McGraw-Hill, Maidenhead:
England.

Bibliography
187
Dahlsrud, A. (2006). How corporate social responsibility is defined: An analysis
of 37 definitions. Corporate Social Responsibility and Environmental
Management, 15(1), 1-13.
Daily, B. F., and Huang, S. (2001). Achieving sustainability through attention to
human resource factors in environmental management. International Journal of
Operations and Production Management, 21(12), 1539-1552.
Daily, B. F., Bishop, J. W., and Govindarajulu, N. (2009). A conceptual model
for organizational citizenship behavior directed toward the environment.
Business and Society, 48(2), 243-256.
Daily, B. F., Bishop, J. W., and Massoud, J. A. (2012). The role of training and
empowerment in environmental performance: A study of the Mexican
Maquiladora industry. International Journal of Operations and Production
Management, 32(5), 631- 647.
Daily, B. F., Bishop, J. W., and Steiner, R. (2007). The mediating role of EMS
teamwork as it pertains to HR factors and perceived environmental performance.
Journal of Applied Business Research, 23(1), 95-110.
Daily, Bonnie and Bishop, James andGovindarajulu, Nalini. (2009). A
Conceptual Model for Organizational Citizenship Behavior Directed Toward the
Environment. Business and Society - BUS SOC. 48. 243-256.
De Prins P. (2011), Duurzaam HRM: Synthetische academische introductie,
Retrieved J.,cited by: Rompa I., Explorative research on Sustainable Human
Resource Management, http://www. innovatiefinwerk.nl/sites/.../sustainable_
hrm.pdf [10.01.2015]
De Roeck, K., and Delobbe, N. (2012). Do environmental CSR initiatives serve
organisations‘ legitimacy in the oil industry? Exploring employees‘ reactions
through organizational identification theory. Journal of Business Ethics, 110(4),
397-412.

Bibliography
188
Delery, J.E. and Doty, D.H. (1996) ‗Theoretical Frameworks in Strategic
Human Resource Management: Universalistic, Contingency, and ConŽ
gurational Perspectives‘, Academy of Management Journal, 39: 802–35.
Doyle, M., (1997). Management development, in Beardwell, I. and Holden, L.
eds Human Resource Management: A Contemporary Perspective,. London:
Pitman.
Dr. Parul Deshwal (2015), Green HRM : An organizational strategy of greening
people, International Journal of Applied Research, Vol.1, No. 13
DuBois, C. L., and Dubois, D. A. (2012). Strategic HRM as social design for
environmental sustainability in organisation. Human Resource Management,
51(6), 799-826.
Duxbury, L. and Higgins, C. (2001). Work-life balance in the new millennium:
Where are we? Where do we need to go? Ottawa: Canadian Policy Research
Networks, Discussion Paper No. W-12
Dwyer, R. J. (2009). ―Keen to be green‖ organisations: A focused rules
approach to accountability. Management Decision, 47(7), 1200-1216.
Ehnert I. (2006), Sustainability Issues in Human in Human Resource
Management: Linkages, theoretical, approaches, and outlines for an emerging
field, Paper prepared for 21st EIASM SHRM Workshop, Aston, Birmingham,
March 28th-29th, http://www.sfb637. uni-bremen.de/.../SFB637-A2-06-004-I
[10.01.2015]
Ehnert I. (2009), Sustainable Human Resource Management: A conceptual and
exploratory analysis from a paradox perspective, Springer Physica-Verlag
Heidelberg, Berlin
Ehnert, I. (2009). Sustainable human resource management. A Conceptual and
Exploratory Analysis from a Paradox Perspective, Heidelberg.
Ehnert, I., and Harry, W. (2012). Recent developments and future prospects on
sustainable human resources management: Introduction to the special issue.
Management Revue, 23(2), 221-238.
Bibliography
189
Ellis S, Kantner S, Saab A, Watson M (2005). Plastic grocery bags: The
ecological footprint. Environmental changes are spreading infectious diseases-
UN study, Victoria, pp. 1-19.
Ellis, A. D. (2008). The impact of corporate social responsibility on employee
attitudes and behaviors. (Doctoral Dissertation). Arizona State University.
Fernandez E, B Junquera and M Ordiz (2003) Organizational culture and human
resources in the environmental issue: a review of the literature. International
Journal of Human Resource Management 14(4), 634–656.
Florida, R., and Davison, D. (2001). Gaining from Green Management:
Environmental management systems inside and outside the factory. California
Management Review, 43, 64– 84.
Friedman, B. A. (2009). Human resource management role implications for
corporate reputation. Corporate Reputation Review, 12(3), 229-244.
Friedman, M. 2009. The social responsibility of business is to increase its
profits. New York Times Magazine, September 13: 33.
Garavan, T. N., and McGuire, D. (2010). Human resource development and
society: Human resource development‘s role in embedding corporate social
responsibility, sustainability, and ethics in organisations. Advances in
Developing Human Resources, 12(5), 487-507.
Gerbing, D. W., and Anderson, J. C. (1984). On the Meaning of within-Factor
Correlated Measurement Errors. Journal of Consumer Research, 11, 572-580.
Gill Mandip (2012) Green HRM: People Management Commitment to
Environmental Sustainability, Research Journal of Recent Sciences Vol. 1 (ISC-
2011), 244-252 (2012) Korean SMEs in manufacturing industry. Management
Decision, 47(7), 1101-1121.
Gould Williams, J. (2003). The Importance of HR practices and work Place trust
in achieving superior performance: a study of public-sector organizations.
International Journal of Human Resource Management, Vol.14, No.1, pp. 28-54

Bibliography
190
Greening, D. W., and Turban, D. W. (2000). Corporate social performance as a
competitive advantage in attracting a quality workforce. Business and Society,
39(3), 254-280.
Hagihara, A., Babazono, A., Nobutomo, K., and Morimoto, K. (1998), Work
versus non-work predictors of Job Satisfaction among Japanese white-collar
workers‖, Journal of Occupational Health, Vol. 40, pp. 285-292.
Hair ,J.,F., Anderson, R.E. Tatham, L. and Black, W.,(2003),Multivariate Data
Analysis 5th Edition, Prentice Hall.
Hair J.F., Anderson R.E., Tatham R.L. and Black W.C. 1998. Multivariate Data
Analysis, Prentice-Hall, Englewood Cliffs, NJ.
Hair, J., Black, W., Babin, B., Anderson, R., and Tatham, R. (2006). Multivariate
data analysis (6th ed.). Uppersaddle River, N.J.: Pearson Prentice Hall.
Hallahan, K. (2001). Enhancing motivation, ability, and opportunity to process
public relations messages. Public Relations Review, 26(4), 463-480.
Harrell-Cook, G., & Mahoney, J. T. (2011). Manufacturing Advantage: Why
High-Performance Work Systems Pay Off. Academy of Management Review.
https://doi.org/10.5465/amr.2001.4845847
Harrison, D. A., and Klein, K. J. (2007). What's the difference? Diversity
constructs as separation, variety, or disparity in organizations. Academy of
Management Review, 32(4), 1199–1228.
Harrison, D. A., Kravitz, D. A., Mayer, D. M., Leslie, L. M., and Lev-Arey, D.
(2006). Understanding attitudes toward affirmative action programs in
employment: Summary and meta-analysis of 35 years of research. Journal of
Applied Psychology, 91(5), 1013-1036.
Hart, S. (2005). Beyond greening. Strategies for a sustainable world Harvard
Business Review, 75(1), pp. 66- 76.
Bibliography
191
Harvey, G., Williams, K., and Probert, J. (2013). Greening the airline pilot:
HRM and the green performance of airlines in the UK. The International Journal
of Human Resource Management, 24(1), 152-166.
Harvey, Jason andPadrón-Navarta, José Alberto andGarrido, Carlos J. and
Gómez-Pugnaire, Mª Teresa andSavov, Ivan andLópez Sánchez-Vizcaíno,
Vicente andAgostini, SamueleandMarchesi, Claudio. (2014). Harvey et al
2014b.
Hassel, A. (2008). The evolution of a global labor governance regime.
Governance: An International Journal of Policy, Administration and
Institutions, 21(2), 231-251.)
Haynes, S.N., Richard, D.C.S., and Kubany, E.S. (1995). Content validity in
psychological assessment: A functional approach to concepts and methods.
Psychological Assessment, 7, 238-247.
Higgins C and Duxbury L (2005) Saying ‗no‘ in a culture of hours, money and
non-support. Ivey Business Journal , July/August: 1–5.
Higgins, C., Duxbury, L. and Lyons, S. (2008). Reducing Work–Life Conflict:
What Works? What Doesn‘t?: examines what employers, employees and their
families can do to reduce work– life conflict, Ottawa: Health Canada Website:
http://www.hc-sc.gc.ca/ewh-semt/pubs/occup-travail/balancing-
equilibre/index_e.html
Hofmeyr G. J. G., Bester M. N., Kirkman S. P., Lydersen C., Kovacs K. M.
(2006) Entanglement of Antarctic fur seals at Bouvetóya, Southern Ocean. Mar.
Pollut. Bull. 52, 1077–1080.
Hoyle, R. (1995). The structural equation modeling approach: Basic concepts
and fundamental issues. In R. H. Hoyle (Ed.), Structural Equation modeling:
Concepts, issues, and applications (pp. 1-15). Thousand Oaks CA: Sage.
https://www.goodnet.org/articles/5-biodegradable-plastic-companies-for-greener-
future.

Bibliography
192
Huang, T. C, & Hsiao, W. J. (2007). The causal relationship between Job
Satisfaction and Organisational Commitments. Social Behaviour and
Personality, 35(9), 1265-1276.
Huffman, A., Watrous-Rodriguez, K., Henning, J., and Berry, J. (2009).
Working through environmental issues: The role of the I-O psychologist. The
Industrial-Organizational Psychologist, 47(2), 27-35.
Huselid, M. A. (1995). The impact of human resource management practices on
turnover, productivity, and corporate financial performance. Academy of
Management Journal, 38(3), 635-672.
Huselid, M. A., Jackson, S. E., and Schuler, R. S. (1997). Technical and
strategic human resource management effectiveness as determinants of firm
performance. Academy of Management Journal, 40(1), 171-188.
Intan, Ros & Munir, Rosintansafinas & Ali, Syukrina & Ali, Mat & Rahman,
Ab & Abdul Rahman, Ramlee. (2014). Relationship between Job Satisfaction
and Organisational Commitment at Health Tourism Hospital in Malaysia.
International Standard for Organization. (n.d.). ISO 26000— Social
responsibility. Retrieved from http://www.iso.org/iso/social_ responsibility)
Jabbar, Hassan & Abid, Muhammad. (2015). A Study of Green HR Practices
and Its Impact on Environmental Performance: A Review. MAGNT Research
Report. 3. 142-154.
Jabbar, M.H., Abid, M., (2014). GHRM: Motivating Employees towards
organizational environmental performance MAGNT Research Report.
Jabbour Chiappetta, C. J., Jabbou Lopes de Sousa, A. B., Govindan, K.,
Teixeira, A. A., and Freitas Ricardo de Souza, W. (2012). Environmental
management and operational performance in automotive companies in Brazil:
The role of human resource management and lean manufacturing, Journal of
Cleaner Production, http://dx.doi.org/10.1016/j.jclepro.2012. 07.010 22.

Bibliography
193
Jabbour CJC and Santos FCA (2008) Relationships between human resource
dimensions and environmental management in companies: proposal of a model,
Journal of Cleaner Production, 16 (1), pp. 51-58.
Jabbour CJC, FCA Santos and MS Nagano (2008) Environmental management
system and human resource practices: is there a link between them in four
Brazilian companies? Journal of Cleaner Production 16(17), 1922–1925.
Jabbour, C. J. C. (2011). How green are HRM practices, organizational culture,
learning and teamwork? A Brazilian study. Industrial and Commercial Training,
43(2), 98- 105.
Jabbour, C. J. C., and Santos, F. C. A. (2008). The central role of human
resource management in the search for sustainable organisations. The
International Journal of Human Resource Management, 19(12), 2133-2154.
Jabbour, C. J. C., Santos, F. C. A., and Nagano, M. S. (2008). Environmental
management system and human resource practices: Is there a link between them
in four Brazilian companies? Journal of Cleaner Production, 16(17), 1922-1925.
Jabbour, C. J. C., Santos, F. C. A., Nagano, M. S. (2010), Contributions of HRM
throughout the stages of environmental management: methodological
triangulation applied to companies in Brazil, International Journal of Human
Resource Management,Vol. 21 No. 7, pp. 1049- 1089 21.
Jackson SE and J Seo (2010) The greening of strategic HRM
scholarship. Organization Management Journal 7(4), 278–290.
Jackson, S. E., Renwick, D. W. S., Jabbour, C. J. C., and Muller-Camen, M.
(2011). State-of-the-art and future directions for green human resource
management: Introduction to the special issue. German Journal of Human
Resource Management, 25, 99–116.
Jackson, S. E., Renwick, D. W. S., Jabbour, C. J. C., and Muller-Camen, M.
(2011). Stateof-the-art and future directions for green human resource
management: Introduction to the special issue. Zeitschrift Fur
Personalforschung, 25(2), 99-116.
Bibliography
194
Jackson, Susan andSeo, Janghoon. (2010). The greening of strategic HRM
scholarship. Organization Management Journal.
Jafri, S. (2012). Green HR practices: an empirical study of certain automobile
organizations of India. Human Resource Management, 42, 6193-6198.
Jain Neelu and Chawla Pamela. (2012). Generation Amount prediction of
Hazardous Substance from Computer Waste: A Case Study of India. Int. J. of
Emerging Technology and Advanced Engineering. 2(3).
Jiang, K., Lepak, D. P., Hu, J., and Baer, J. C. (2012). How does human
resource management influence organizational outcomes? A meta-analytic
investigation of mediating mechanisms. Academy of Management Journal,
55(6), 1264-1294.
John R. Rathgeber (2007), Sustainability and Connecticut business, A CBIA
Survey, 1-16.
Johnson, H. T. (2006). Sustainability and " lean operations". Journal of Cost
Management, 20(2), 40-45.
Judge, T.A., Erez, A., Bono, J., and Locke, E.A., (2005), ―Core self evaluations
and job and life satisfaction : the role of self concordance and goal attainment‖,
Journal of Applied Psychology, Vol. 90, No. 2, pp.257-268.
Judge, T.A., Hulin, C.L. (1993), ―Job Satisfaction as a reflection of a disposition
: a multiple source causal analysis‖, Organizational Behavior and Human
Decisions Processes, Vol. 56, pp. 388-421.
Justin Victor (2008), Green workplace, SHRM Survey, 1-6
Kalleberg, A.L (1977). ‗Work Values and Job rewards-Theory of Job
Satisfaction‘, American Sociological Review 42:124-143
Kaman Lee, (2009) "Gender differences in Hong Kong adolescent
consumers' green purchasing behavior", Journal of Consumer Marketing, Vol.
26 Issue: 2, pp.87-96,

Bibliography
195
Kane, A. (2011). Green recruitment, development and engagement, in Going
Green: The Psychology of Sustainability in the Workplace, ed. D. Bartlett, The
British Psychological Society, 6-17.
Kapil, K., 2015b. Green HRM: trends and prospects. GE Int. Res. J. Manag.
Res. 1, 43e55.
Kapil, P., 2015a. Green HRM- Engaging Human Resource in reducing carbon
footprint and enhancing environment sustainability: a case study based
approach. Int. J. Eng. Technol. Sci. Res. 2, 5e14.
Kaur, H. (2013). Today‘s Success Mantra-Going Green at Functional Areas of
HRM. International Journal of Management and Business Studies, 3(1), 96-99.
Kerlinger, F.N. (1973). Foundation of Behavioral Research. New York. Holt.
Rinehand and Hinston.
Kim, S. H. : An Investigation into Hotel Employees' Perception of Green
Practices. (2009).
King, Stephen. Dark Tower: Song of Susannah, The. Hampton, NH: Donald M.
Grant, Publisher, 2004.
Kitazawa, S., and Sarkis, J. (2000). The relationship between ISO 14001 and
continuous source reduction programs. International Journal of Operations and
Production Management, 20, 225–248.
Klassen, R. D., and McLaughlin, C. P. (1996). The impact of environmental
management on firm performance. Management Science, 42(8), 1199-1214.
Klassen, R.D. and C.P. Mclaughlin,(1993) TQM and Environmental Excellence
in Manufacturing.industrial management and data systems,93,6.14-22.
Kline, R. (2005). Principles and practices of structural equation modeling (2n ed.).
New York: Guilford Press.
Kothari, C.R.,1985, Research Methodology- Methods and Techniques, New
Delhi, Wiley Eastern Limited.

Bibliography
196
Kramar, R. (2014). Beyond strategic human resource management: Is
sustainable human resource management the next approach? The International
Journal of Human Resource Management, 25(8), 1069-1089.
Kumari, P. (2012). Green HRM - issues and challenges. Global Research
Analysis, 1(5), 80-83.
Lado, A. A., and Wilson, M. C. (1994). Human resource systems and sustained
competitive advantage: A competency-based perspective. The Academy of
Management Review, 19(4), 699-727.
Lado, A.A., Boyd, N.G. and Wright, P. (1992) ‗A Competency-Based Model of
Sustained Competitive Advantage: Toward a Conceptual Integration ‘, Journal
of Management, 18: 77–91.
Lamb, C.W., Jr., Hair, J.F., Jr. and McDaniel, C. (2004). Marketing 7th ed.
Oxford: Oxford University Press.
Lawrence, A. T., and Morell, D. (1995). Leading-edge environmental
management: Motivation, opportunity, resources, and processes. Research in
Corporate Social Performance and Policy, Supplement 1, 99-126.
Lee, J. A., and Holden, S. J. (1999). Understanding the determinants of
environmentally conscious behavior. Psychology and Marketing, 16(5), 373-
392.
Lee, K. (2009). Why and how to adopt green management into business
organisations? The case study of Korean SMEs in manufacturing industry.
Management Decision, 47(7), 1101-1121.
Lee, K. H. and Ball, R. (2003). Achieving Sustainable Corporate
Competitiveness: Strategic Link between Top Management's (Green)
Commitment and Corporate Environmental Strategy. Greener Management
International, (44), 89-104.
Lithner, D., Damberg, J., Dave, G., Larsson, A. (2009). Leachates from
plastic consumer products-Screening for toxicity with Daphnia magna.
Chemosphere 74, pp. 1195-1200.

Bibliography
197
Litchfield, J.H. (1987). Microbiological and enzymatic treatments for utilizing
agricultural and food processing wastes. Food Biotechnology, 1, 29-57.
Lis, B. (2012). The relevance of corporate social responsibility for a sustainable
human resource management: An analysis of organizational attractiveness as a
determinant in employees' selection of a (potential) employer. Management
Revue, 23(3), 279-295.
Liu, W. (2010). The Environmental Responsibility of Multinational
Corporation. Journal of American Academy of Business, Cambridge, 15(2), 81-
88
Locke, E.A., (1969), ―What is Job Satisfaction‖, Organizational Behavior and
Human Performance, Vol. 4, Iss. 4, pp. 309-336.
Lowe, G. S. 2000. The Quality of Work: A People Centred Agenda. Toronto,
ON: Oxford University Press.
Lowe, G. S. and G. Schellenberg. 2001. What's a Good Job? The Importance of
Employment Relationships. CPRN Study W-05. Ottawa, ON: Canadian Policy
Research Networks.
Lund, D.B. (2003), ―Organizational culture and Job Satisfaction‖, Journal of
Business and Industrial Marketing, Vol. 18, No 3, pp. 219-236.
Luthans, F., and Youssef, C. M. (2004). Human, Social, and Now Positive
Psychological Capital Management: Investing in people for competitive
advantage. Organizational Dynamics, 33(2), 143-160.
Madsen, H., and Ulhøi, J. P. (2001). Greening of human resources:
Environmental awareness and training interests within the workforce. Industrial
Management and Data Systems, 101(2), 57-65.
Malhotra, N.K., 2007. Marketing Research: An Applied Orientation. 5th Edn.
Pearson Education, Inc., New Jersey.
Mandip, G. (2012). Green HRM: People management commitment to
environmental sustainability. Research Journal of Recent Sciences. 1. 244-252.

Bibliography
198
Manika, D. and Wells, V.K. and Gregory-Smith, D. and Gentry, M. (2014)
'Investigating the impact of individual attitudinal and organizational variables on
green behaviors and commuting at the workplace.', 17th Academy of Marketing
Science World Marketing Congress. Lima, Peru, 5-8 August 2014.
Manika, D., Wells, V.K., Gregory-Smith, D., and Gentry, M. (2014). The
impact of individual attitudinal and organizational variables on workplace
environmentally friendly behaviors. Journal of Business Ethics, 126(4), 663-
684.
Mao, E. and P. Palvia (2006). Testing an Extended Model of IT Acceptance in the
Chinese Cultural Context. Advances in Information Systems, 37(2,3), 20-32.
Margaretha, M., and Saragih, S. (2013). Developing new corporate culture
through green human resource practice. International Conference on Business,
Economics, and Accounting, 1-10.
Marin, L., Rubio, A. and Ruiz de Maya, S. (2012). Competitiveness as a
strategic outcome of corporate social responsibility. Corporate Social
Responsibility and Environmental Management, 19, 364–376.
Marín, L., Rubio, A., and Maya, S. R. (2012). Competitiveness as a strategic
outcome of corporate social responsibility. Corporate Social Responsibility and
Environmental Management, 19(6), 364-376.
Mathapati, C. M. (2013). Green HRM: A strategic facet. Tactful Management
Research Journal, 2(2), 1–6.
Mathieu, J. E. and Zajac, D. M. 1990. A Review and Meta-analysis of the
Antecedents, Correlates and Consequences of Organisational Commitment.
Psychological Bulletin 108 (2), 171–194.
Mathieu, J. E. (1991). Across Level No recursive Model of the Antecedents of
Organisational Commitment and Satisfaction, Journal of Applied Psychology,
76, 607-618.
May, D. R., and Flannery, B. L. (1995). Cutting waste with employee
involvement teams. Business Horizons, 38, 28–38.
Bibliography
199
Mazur B., (2013), Linking diversity management and corporate social
responsibility, Journal of Intercultural Management 5 (3), pp. 39-47
McGuire, J. B., Sundgren, A., and Schneeweis, T. (1988). Corporate social
responsibility and firm financial performance. Academy of Management
Journal, 31(4), 854-872.
McWilliams, A., Siegel, D. S., and Wright, P. M. (2006). Corporate social
responsibility: Strategic implications. Journal of Management Studies, 43(1), 1-
18.
McWilliams, Abagail and Siegel, Donald S. and Wright, Patrick M., Corporate
Social Responsibility: International Perspectives (May 2006 ). Available at
SSRN: https://ssrn.com/abstract=900834 or http://dx.doi.org/10.2139/ssrn.90083
4
Merriman, K. K., and Sen, S. (2012). Incenting managers toward the triple
bottom line: An agency and social norm perspective. Human Resource
Management, 51(6), 851-871.
Meyer J.P. and Allen N.J. 1984. Testing the ‗side-bet‘ theory of Organisational
Commitment: some methodological considerations. Journal of Applied
Psychology. 69: 372-8.
Meyer J.P. and Allen N.J. 1991. A three-component conceptualization of
Organisational Commitment. Human Resources Management Review. 1(1): 61-
89.
Meyer J.P. and Herscovitch L. 2001. Commitment in the workplace: toward a
general model. Human Resource Management Review. 11(3): 299-326.
Meyer J.P., Allen N.J. and Gellatly I.R. 1990. Affective and continuance
commitment to the organization: evaluation of measures and analysis of
concurrent and time-lagged relations. Journal of Applied Psychology. 6: 710-20.
Meyer J.P., Becker T.E. and Vandenberghe C. 2004. Employee commitment and
motivation: a conceptual analysis and integrative model. Journal of Applied
Psychology. 89(6): 991-1007.

Bibliography
200
Meyer J.P., Irving P.G. and Allen N.J. 1998. Examination of the combined
effects of work values and early work experiences on Organisational
Commitment. Journal of Organizational Behavior. 19(1): 29-52.
Meyer, J. P. and Herscovitch, L. 2001. Commitment in the workplace. Toward a
general model. Human Resource Management Review 11 (3), 299–326.
Meyer, J. P., Stanley, D. J., Jackson, T. A., McInnis, K. J., Maltin, E. R. and
Sheppard, L. 2012. Affective, normative, and continuance commitment levels
across cultures: A meta-analysis. Journal of Vocational Behavior 80 (2), 225–
245.
Michal Mozes, ZviJosman, EyalYaniv, (2011) "Corporate social
responsibility organizational identification and motivation", Social
Responsibility Journal, Vol. 7 Issue: 2, pp.310-325,
Milliman, J. (2013). Leading-Edge green human resource practices: Vital
components to advancing environmental sustainability. Environmental Quality
Management, 23(2), 31-45.
Milliman, J., and Clair, J., (1994), in Milliman, J., and Clair, J., (1996), ―Best
Environmental HRM Practices in the USA‖, in Wehrmeyer, W., (Ed), (1996),
Greening People – Human Resources and Environmental Management, First
Edition, Sheffield, England: Greenleaf Publishing.
Milliman, J., and Clair, J., (1996), ―Best Environmental HRM Practices in the
USA‖, in Wehrmeyer, W., (Ed), (1996), Greening People – Human Resources
and Environmental Management, First Edition, Sheffield, England: Greenleaf
Publishing.
Mitchell, T. R., Holtom, B. C., Lee, T. W., Sablynski, C. J., and Erez, M.
(2001). Why people stay: Using job embeddedness to predict voluntary
turnover. Academy of Management Journal, 44(6), 1102-1121.
Moroko, L. and Uncles, M. (2008), ―Characteristics of Successful Employer
Brands‖, Brand Management, Vol. 16, No. 3, pp. 160-176.

Bibliography
201
Mowday R., Porter L. and Steers R. 1982. Employeeorganization Linkages: The
Psychology of Commitment, Absenteeism, and Turnover, Academic Press, New
York, NY.
Mowday R., Steers R. and Porter L. 1979. The measure of Organisational
Commitment. Journal of Vocational Behavior. 14(2): 224-7.
Mozes, M., Josman, Z., and Yaniv, E. (2011). Corporate social responsibility
organizational identification and motivation. Social Responsibility Journal, 7(2),
310-325.
Nalini Govinda rajulu, Bonnie F. Daily, (2004) "Motivating employees for
environmental improvement", Industrial Management and Data Systems, Vol.
104 Issue: 4, pp.364-372,
Neuman, W.L. 2003. Socilll Research ,Hethods: Qaaliratil‘e ((//(1 Qllalltitative
Approaches. Fifth edition. Allyn and Bacon. Boston. Massachusetts.
Nijhawan, G. (2014). Green HRM- A requirement for sustainable Organisation.
ParipexIndian journal of Research , 69-70.
Njeru J (2006). The urban political economy of plastic bag waste problem
in Nairobi, Kenya‘. Geoforum, 37: 1046-1058.
North, K. (1997), Environmental Business Management – An Introduction, 2nd
ed, International Labour Office: Geneva.
North, K., (1992), Environment – an Introduction, First Edition, International
Labour Organisations: Switzerland.
Nunnally, J.C. (1978).Psychometric Theory (2ed). McGraw-Hill, New York.
Oates, A. (1996), Industrial Relations and the Environment in the UK, In
Wehrmeyer, W. (eds), (1996), Greening People - Human Resources and
Environmental Management, First Edition, Sheffield, England: Greenleaf
Publishing.
OECD (2011). OECD guidelines for multinational enterprises. Retrieved from
http://www.oecd.org/ dataoecd/43/29/48004323.pdf)

Bibliography
202
Ones, D. S., and Dilchert, S. (2012a). Employee green behaviors. In Jackson,
S.E. Ones, D.S. and Dilchert, S. (eds), Managing Human Resources for
Environmental Sustainability, 85-11. USA: Jossey Bass Ltd.
Ones, D. S., and Dilchert, S. (2012b). Environmental sustainability at work: A
call to
Opatha, H.H.D.N.P. (2002), Performance Evaluation of Human Resources,
Colombo: Institute of Management Sciences.
Opatha, H.H.D.N.P. (2013), Green Human Resource Management: A Simplified
Introduction, Proceedings of the HR Dialogue 2013, Department of HRM,
University of Sri Jayewardenepura, pp. 21-41.
Opatha, H.H.D.N.P. (2015), Organizational Behavior, The Human Side of
Work, Author Publication, Nugegoda, Colombo: Sri Lanka.
Opatha, H.H.D.N.P. and Arulrajah, A.A. (2014), Green Human Resource
Management: Simplified General Reflections, International Business Research,
Canadian Center of Science and Education, Vol. 7, No. 8, pp. 101-112.
Ormazabal, M., and Sarriegi, J. (2012). Environmental management evolution:
Empirical evidence from Spain and Italy. Business Strategy and the
Environment, 23(2), 73-88.
Özen S, Küskü F. Corporate Environmental Citizenship Variation in Developing
Countries: An Institutional Framework. Journal of Business Ethics. 2008;
89(2):297-313.
Paillé P, Y Chen, O Boiral and JF Jin (2014) The impact of human resource
management on environmental performance: an employee‐level study. Journal
of Business Ethics 121(3), 451–466.
Paillé, P., and Mejia-Morelos, J. H. (2014). Antecedents of pro-environmental
behaviors at work: The moderating influence of psychological contract breach.
Journal of Environmental Psychology, 38, 124-131.

Bibliography
203
Paille, P., Boiral, O., Chen, Y., 2013. Linking environmental management
practices and organizational citizenship behavior for the environment: a social
exchange perspective. Int. J. Hum. Resour. Manag. 24, 3552e3575.
Paille, P., Raineri, N., 2015. Linking perceived corporate environmental policies
and employees eco-initiatives: the influence of perceived organizational support
and psychological contract breach. J. Bus. Res. 68, 2404e2411
Paul A K, Anantharaman R N (2004), Influence of HRM practices on
Organisational Commitment: A study among software professionals in India,
Human Resource Development Quarterly (2004) , Volume: 15, Issue: 1, Pages:
77-88
Paul, A., and Anantharaman, R. (2003). Impact of people management practices
on organizational performance. International Journal of Human Resource
Management, 14, 1246−1266.
Pava, M. L. and Krausz, J. (1996). 'The association between corporate social-
responsibility and financial performance: The paradox of social cost'. Journal of
Business Ethics, 15, 321-57
Payne, S. C., Huffman, A. H., (2005). ―A longitudinal examination of the
influence of mentoring on Organisational Commitment and turnover‖, Academy
of Management Journal, 48, pp 158-168.
Pfeffer, J. (1982). Organizations and Organization Theory. Pitman, Marshfield,
Mass.
Phillips, L. (2007), Go Green to Gain the Edge over Rivals, People
Management, 23rd August, p.9.
Prathima, M. and Misra, S. (2012). The green revolution in human resource
management. Asia Pacific Journal of Management and Entrepreneurship
Research, 1(3), 227-237.
Ramus, A. C. (2002). Encouraging innovative environmental actions: what
companies and managers must do. Journal of world business, 36, 151-164.

Bibliography
204
Rangarajan, N., and Rahm, D. (2011). Greening human resources: A survey of
city-level initiatives. Review of Public Personnel Administration, 31(3), 227-
247.
Rayton, B. R. (2006). Examining the interconnection of Job Satisfaction adn
Organisational Commitment: An application of the bivariate probit model.The
International Journal of Human Resource Management, 17(1), 139-154.
Renwick, D. (2008). Green HRM: A review, process model, and research
agenda (Discussion Paper Series). The University of Sheffield. Retrieved from
http://www.shef.ac.uk/content/1/c6/08/70/89/2008-01.pdf
Renwick, D. W., Redman, T., and Maguire, S. (2013). Green human resource
management: A review and research agenda. International Journal of
Management Reviews, 15(1), 1-14.
Renwick, D.W.S. Redman, T. and Maguire, S. (2013), Green Human Resource
Management: A Review, and Research Agenda, International Journal of
Management Review, Vol. 15, pp. 1-14.
Research Methodology- Methods and Techniques (1985) by C R Kothari,
GauravGarg, New Age International Publishers, re-printed 2014
Revill, C. (2000), The „Greening‟ of Personnel/Human Resource Management
an Assessment, International Journal of Applied HRM, Vol.1, No. 3, pp. 1-30.
Robbins, S. (1993). Organizational Behavior (6th ed.). Englewood Cliffs, NJ:
Prentice Hall.
Roberts, G.C. (1992). Motivation in sport and exercise: Conceptual constraints
and convergence. In G.C. Roberts (Ed.). Motivation in sport and exercise (pp. 3-
30).
Roberts, R. W. (1992). Determinants of corporate social responsibility
disclosure: An application of stakeholder theory. Accounting, Organisations and
Society, 17(6), 595- 612.

Bibliography
205
Robertson, J. L., and Barling, J. (2013). Greening organisations through leaders'
influence on employees' pro-environmental behaviors. Journal of Organizational
Behavior, 34(2), 176-194.
Rousseau, D. (1978), ―Characteristics of departments, positions, and individuals:
contexts for attitudes and behaviors‖, Administrative Science Quarterly,; Vol.
23, pp. 521–540.
Royle, T. (2005). Realism or idealism? Corporate social responsibility and the
employee stakeholder in the global fast-food industry. Business Ethics: A
European Review, 14(1), 42-55.
Rylander, D. H. 2003. Changes in Organisational Commitment for sales force
newcomers: an exploratory look at early employment influences. Advances in
Marketing – The Proceedings of the Annual Meeting of the Association of
Collegiate Marketing Educators, 140–146. Available on the Internet
<http://sbaer.uca.edu/research/acme/2003/24.pdf>.
Sarkis, J., Gonzalez-Torre, P., and Adenso-Diaz, B. (2010). Stakeholder
pressure and the adoption of environmental practices: The mediating effect of
training. Journal of Operations Management, 28(2), 163-176.
Sathyapriya, J., Kanimozhi, R., and Adhilakshmi, V. (2013). Green HRM-
delivering high PERFORMANCE HR systems. International Journal of
Marketing and Human Resource Management, 4, (2), 19-25.
Schmidheiny, (1992), Quoted in Hutchinson, A., and Hutchinson, F., (1997),
Environmental Business Management: Sustainable Development in the New
Millennium, First Edition, Maidenhead, England: Mcgraw-Hill.
Schmidheiny, (1992: 86), in Barrett, S. M., and Murphy, D. F., (1996)
―Managing Corporate Environmental Policy: a Process of Complex Change‖, in
Wehrmeyer, W., (Ed), (1996), Greening People – Human Resources and
Environmental Management, First Edition, Sheffield, England: Greenleaf
Publishing.

Bibliography
206
Sekaram, u., 2006. Research Methods For Business A Skill Building Approach.
4th ed. Wiley Indiatp) Ltd. New Delhi.
Shahid, A. and Azhar, S. M. 2013. Gaining Employee Commitment: Linking to
Organizational Effectiveness. Journal of Management Research 5 (1), 250–268.
Shaikh, M. W. (2012). Green HRM, A requirement of 21st ABHINAV National
monthly refereed journal of research in commerce and management, 1(10), 122-
127. Retrieved from http://abhinavjournal. com/journal/
Sharma, S., Gupta, N., 2015. Green HRM: an innovative approach to
environmental sustainability. In: Proceeding of the Twelfth AIMS International
Conference on Management. 2e5 January, Calicut, India, pp. 825e830.
Shen, J. and Benson, J. (2014). When CSR is a social norm: How socially
responsible human resource management affects employee work behaviors.
Journal of Management (in Press).
Shen, J. (2011). Developing the concept of socially responsible international
human resource management. The International Journal of Human Resource
Management, 22(6), 1351-1363.
Shen, J. Principle and application of multilevel modelling in HRM research.
Human Resource Management (In Press).
Shen, J., and Jiuhua Zhu, C. (2011). Effects of socially responsible human
resource management on employee Organisational Commitment. The
International Journal of Human Resource Management, 22(15), 3020-3035.
SHRM ( society for human resource management), (2011), Advancing
Sustainability : HR‘s Role, Retrieved June , 2011.
Shultz, C. J., and Holbrook, M. B. (1999). Marketing and the tragedy of the
commons: A synthesis, commentary, and analysis for action. Journal of Public
Policy and Marketing, 18(2), 218-229.
Siegel, D. J. (2009). Mindsight. New York: Bantam.

Bibliography
207
Siegel, D. S. (2009). Green management matters only if it yields more green: An
Economic/Strategic perspective. Academy of Management Perspectives, 23(3),
5-16.
Social Accountability International. (2010). SA8000 Standard. Retrieved from
http://www.sa-intl. org/index.cfm?fuseaction=Page.vi ewPageandpageId=9
37andparentID=4 79andnodeID=1)
Staffelbach, B., Bruger, E.A. and Ba¨bler, S. (2012), ―The role of strategic
context in environmental sustainability initiatives: three case studies‖, in
Jackson, S.E., Dilchert, S. and Ones, D.S. (Eds), Managing Human Resources
for Environmental Sustainability, Jossey-Bass/Wiley, San Francisco, CA, pp.
36-60.
Steg, L., Bolderdijk, J. W., Keizer, K., and Perlaviciute, G. (2014). An
integrated framework for encouraging pro-environmental behavior: The role of
values, situational factors and goals. Journal of Environmental Psychology, 38,
104-115.
Steijn, B. (2004). Human resource management and Job Satisfaction in the
Dutch public sector. Review of Public Personnel Administration, Vol.24, No.4,
pp. 291-303.
Stringer, L. (2009), The Green Workplace. Sustainable Strategies that Benefit
Employees, the Environment, and the Bottom Line, Palgrave Macmillan: New
York.
SuhaimiSudin (2011), ―Strategic Green HRM: a proposed model that supports
corporate environmental citizenship‖, UniversitiTenagaNasional, Malaysia, 2011.
Tabachnick, B., Fidell, L. (2007), Using Multivariate Statistics. Boston:
Pearson/Allyn and Bacon.
Taj ,Y. (2011). ―Green‖ with pride? The Times of India, 27
Teixeira, A. A., Jabbour, C. J. C., and Jabbour, Ana Beatriz Lopes de Sousa.
(2012). Relationship between green management and environmental training in

Bibliography
208
companies located in brazil: A theoretical framework and case studies.
International Journal of Production Economics, 140(1), 318-329.
Thomas R.R.(1992), Managing diversity: a conceptual framework, in: Jackson
S. E. and associates, Diversity in the Workplaces, Human Resource Initiatives,
Guilford Press, New York
Ticehurst, G.W., Veal, A.J. (2000), Business Research Methods: A Managerial
Approach. NSW, Australia: Pearson Education.
Ting, Y. (1997). Determinants of Job Satisfaction of federal government
employees, Public Personnel Management, Vol. 26, No.3, pp. 313-334.
Torugsa, N. A., O‘Donohue, W., and Hecker, R. (2013). Proactive CSR: An
empirical analysis of the role of its economic, social and environmental
dimensions on the association between capabilities and performance. Journal of
Business Ethics, 115(2), 383-402.
Trade Union Congress (TUC). (2014). Value my skills (Annual Report). United
Kingdom: TUC.
Tsoutsoura, M. (2004). Corporate social responsibility and financial
performance. Working paper series. Centre for Responsible Business, University
of California, Berkeley, USA.
Turban DB, Cable DM (2003) Firm reputation and applicant pool
characteristics. J. Organizational Behavior 24: 733-751.
Turker, D. (2009). How corporate social responsibility influences Organisational
Commitment. Journal of Business Ethics, 89(2), 189-204.
Turner, J. C. (1985). Social categorization and the self-concept: A social
cognitive theory of group behavior. In E. J. Lawler (Ed.), Advances in group
processes. Greenwich, CT: JAI Press.
Uma, Sekaran, (2000). Research Methods for Business: A Skill-building
Approach. Third Ed. New York: John Wiley and Sons, Inc..

Bibliography
209
United Nations (1987). Our common future: The World Commission on
Environment and Development. Oxford: Oxford University Press.
Vaccaro, A., and Echeverri, D. P. (2010). Corporate transparency and green
management. Journal of Business Ethics, 95(3), 487-506.
Van de Ven, B. and R. Jeurissen: 2005, ‗Competing Responsibly‘, Business
Ethics Quarterly 15(2), 299–317.
Vaccaro, A., & Echeverri, D. P. (2010). Corporate transparency and green
management. Journal of Business Ethics. https://doi.org/10.1007/s10551-010-
0435-z.
Vandermerwe, S., and Michael, D. Oliff. (1990). Customers Drive Corporations
Green. Long Range Planning, 23(6), 10-16.
Vilanova, M.; Lozano, J.M.; Arenas, D. Exploring the nature of the relationship
between CSR and competitiveness. J. Bus. Ethics 2009, 87, 57–69.
Waddock, S.: 2000, ‗The Multiple Bottom Lines of Corporate Citizenship:
Social Investing, Reputation, and Responsibility Audits‘, Business and Society
Review 105(3), 323–346.
Waddock, Sandra (2004). Parallel Universes: Companies, Academics, and the
Progress of Corporate Citizenship. Business and Society Review, March, 109: 5-
42
Wee, Y. S., and Quazi, H. A. (2005). Development and validation of critical
factors of environmental management. Industrial Management and Data
Systems, 105, 96–114
Wehrmeyer, W. (1996), Greening People – Human Resources and
Environmental Management, Sheffield, England: Greenleaf Publishing.
Wimmer, R.D., Dominick, J.R. (2000), Mass Media Research: An Introduction.
Belmont, CA: Wadsworth Publishing Company.
Windsor, D.: 2001, ‗The Future of Corporate Social Responsibility‘, The
International Journal of Organizational Analysis 9(3), 225–256.
Bibliography
210
World Commission on Environment and Development,1990
Wright, P. M., and McMahan, G. C. (1992). Alternative theoretical perspectives
for strategic human resource management. Journal of Management, 18, 295-320.
Wright, P. M., Gardner, T. M., Moynihan, L. M. and Allen, M. R. 2005. The
relationship between HR practices and firm performance: examining causal
order. Personnel psychology 58 (2), 409–446.
Wright, P., and Gardner, T. (2003). Theoretical and empirical challenges in
studying the HR practice – firm performance relationship. In D. Holman, T.D.
Wall, C. Clegg, P. Sparrow, and A. Howard (Eds.), The New Workplace: People
Technology, and Organisation, Sussex, UK: John Wiley and Sons.
Wright, P., Gardner, T., Moynihan, L., Park, H., Gerhart, B. and Delery, J.
(2001). Measurement error in research on human resources and firm
performance: Additional data and suggestions for future research. Personnel
Psychology, 54: 875-902.
Wright, P.M., McMahan, G.C. and McWilliams, A. (1994) ‗Human Resource
and Sustained Competitive Advantage: A Resource-Based Perspective‘,
International Journal of Human Resource Management, 5: 301–26.
Yeo Soo Wee, Hesan A. Quazi, (2005) "Development and validation of
critical factors of environmental management", Industrial Management and
Data Systems, Vol. 105 Issue: 1, pp.96-114.
Yin, R. K. (1994). Case study research: Design and methods (2nd ed.).
Thousand Oaks, CA: Sage.
Yousef, DA. (2002). Job Satisfaction as a mediator of the relationship between
role stressors and Organisational Commitment. Journal of Managerial
Psychology. 17(4), 250-266.
Yusliza Mohd Yusoff (2015). Conceptualization of Green Human Resource
Management: An Exploratory Study from Malaysian-based Multinational
Companies. International Journal of Business Management and Economic
Research, 6 (3), 158-166.

Bibliography
211
Zhang, B., Bi, J., Yuan, Z., Ge, J., Liu, B., and Bu, M. (2008). Why do firms
engage in environmental management? An empirical study in China. Journal of
Cleaner Production, 16(10), 1036-1045.
Zikmund, W. G. (2000). Business Research Methods (6th edition). USA:
Harcourt.
Zikmund, W.G. (2003). Business Research Methods. (7th Edition). Thomson
South Western, Ohio.
Zoogah, D. B. (2011). The dynamics of Green HRM behaviors: A cognitive
social information processing approach. Zeitschrift Für Personalforschung,
25(2), 117-139.
Zutshi, A., and Sohal, A. S. (2003). Stakeholder involvement in the EMS
adoption process. Business Process Management Journal, 9(2), 133-148.
Zutshi, A., & Sohal, A. S. (2003). Stakeholder involvement in the EMS adoption
process. Business Process Management Journal. https://doi.org/10.1108/14637
150310468362.

Appendicees
212
APPENDIX A
LIST OF COMPANIES TAKEN FOR SURVEY
SN Name of company Industry
1 Amtek Auto Ltd. Automobile
2 Anand Group Automobile
3 Anand NVH Products Pvt. Ltd. Automobile
4 ANG Auto Ltd Automobile
5 Anu Industries Ltd. Automobile
6 Autodoor Systems India (P) Ltd Automobile
7 Autofit Ltd. Automobile
8 AVTEC Limited Automobile
9 Continental Engines Ltd. Automobile
10 Eicher Motors Ltd Automobile
11 Goetze (India) Limited Automobile
12 Hero Moto Corp Ltd. Automobile
13 J.S. Automobiles Automobile
14 Jamna Auto Industries Ltd Automobile
15 Maruti Suzuki India Ltd Automobile
16 Meko Auto Pvt Ltd Automobile
17 Paul Automobiles Automobile
18 Reva Transmission Automobile
19 Roop Group Of Companies Automobile
20 Sadhu Forging Ltd Automobile
21 Sakshi Polytubes pvt ltd Automobile
22 Sharda Motor Industries Ltd Automobile
23 Shivam Autotech Limited Automobile
24 Silco Cables Automobile
25 Sona Koyo Steering Systems Ltd. Automobile
26 Sudhir Automotive Industries Pvt. Ltd. Automobile

Appendicees
213
27 Viking Filters Private Limited Automobile
28 Bansal Wire Industries Ltd Electronics
29 Captain Gears and Fans Electronics
30 Compact Lamps Pvt. Ltd. Electronics
31 ECCO Electronics Pvt Ltd Electronics
32 ECE Elevators Ltd Electronics
33 Eon Electric Ltd. Electronics
34 Glorious Electronics (I) Pvt Ltd Electronics
35 Gupta Electric Company Electronics
36 Havells India Limited Electronics
37 HPL Electric and Power Pvt. Ltd. Electronics
38 Ledvance Pvt Ltd Electronics
39 LG Electronics India Electronics
40 Moser Baer India Ltd. Electronics
41 National Electric Company Electronics
42 Orient Electric Electronics
43 Osram Lighting Private Limited Electronics
44 Philips Lighting India Limited Electronics
45 Phoenix Electric (India) Ltd Electronics
46 Precision Electronic Electronics
47 S M Creative Electronics Ltd Electronics
48 Samitech Electronics Private Limited Electronics
49 Securico Electronics India Ltd Electronics
50 Super Electrical Company Electronics
51 Surya Roshni Ltd Electronics
52 Usha International Ltd Electronics
53 Usha Shriram Enterprises Pvt. Ltd. Electronics
54 Agro Pure Capital Foods Pvt Ltd Food
55 Agson Global Pvt Ltd Food
56 Annpurna Food Industries Food
57 Apsara Food Industries (P) Ltd Food
58 B L Agro Oils Limited Food

Appendicees
214
59 Best Foods Ltd Food
60 Borges India Pvt Ltd Food
61 BTW India Pvt Ltd Food
62 Cremica Food Industries Ltd. Food
63 Dabur Food
64 Dhampur Sugar Mills Ltd Food
65 Dr.Oetker India Pvt Ltd Food
66 Dupont Danisco India Pvt Ltd Food
67 GTC Foods Pvt Ltd Food
68 Jadli Foods (India) Pvt Ltd Food
69 Jagatjit Industries Ltd Food
70 KRBL Ltd Food
71 Lamba Food Products Food
72 LT Foods Limited Food
73 Mother Dairy Fruit and Vegetable Pvt Ltd Food
74 Nestle Food
75 Nitish Food Products Food
76 O.H.P.Food Products Private Limited Food
77 S. S. Food Industries Food
78 Sidel India Pvt Ltd Food
79 Tirupati Food Industries Pvt Ltd Food
80 21 Century Polymers Plastic
81 All India Plastic Industries Association Plastic
82 Alok Masterbatches Pvt.Ltd Plastic
83 Aravali Plastics and Steel Pvt Ltd Plastic
84 Diamond Plastic Company Plastic
85 Durga Polyplast Pvt Ltd Plastic
86 General Plastic Industries Plastic
87 Gold Plast India Private Limited Plastic
88 Haryana Plastics and Engg. Works Plastic
89 Hindustan Plastic And Machine Corporation Plastic
90 Jindal Poly Films Ltd. Plastic

Appendicees
215
91 JPS Plastics Pvt Ltd Plastic
92 JPS Plastics Pvt. Ltd. Plastic
93 Kay Kay Industries Plastic
94 Krishna Plastic Industries Plastic
95 Krishna Polyplast (India) Pvt Ltd Plastic
96 Krishna Polyplast Pvt Limited Plastic
97 Nagraj Plastic Company Plastic
98 National Plastic Industries Plastic
99 Neetu Plastic Plastic
100 Om Plastic Industries Plastic
101 Pacific Plastic Industries Plastic
102 R. K. G Plastic Plastic
103 Raymonds Plastics Plastic
104 Royal Touch Plastics Plastic
105 S. S. Plastic Works Plastic
106 Sona Plastic Industries Plastic
107 Sunshine Indus India Plastic
108 Supreme Plastics Plastic
109 Winner Plastic Plastic
110 Yash Plastics Plastic

Appendicees
216
APPENDIX B
Dear Respondent,
This survey is anonymous and is used for the academic research purpose only. No
individual will be identified and responses will only be viewed in aggregate.
PART A – ORGANIZATIONAL PROFILE
1) Name of the organization: __________________________________________
2) Position of the respondent filling the questionnaire: _______________________
3) Your organization exists in which industry? ____________________________
PART – B
1) Are you aware of the term ‗Green Human Resource Management Practices‖?
Yes/No
2) Are you aware of ISO 14000 series issued on environmental management
system, which includes a broad range of environmental disciplines? Yes/No
3) Is your Company ISO 14000 Certified? Yes/No
4) If yes (for Q.3), what is the reason that motivated your company to be certified
under ISO 14000?
________________________________________________________________
________________________________________________________________
________________________________________________________________
________________________________________________________________
5) Do you think that Green Human Resource Management Practices should be
applied in your industry? (Please encircle and give different ranks to different
Appendicees
217
statements from 1 to 4) Use 1 for the strongest reason and 4 for the weakest
reason
Ranks
• Cost factor associated with waste disposal. 1 2 3 4
• Moral obligation to be more socially responsible 1 2 3 4
• Pressure from regulatory bodies 1 2 3 4
• Pressure from competitors 1 2 3 4
6) What are the internal efforts made by your organization to promote and protect
environment? (Please tick)
i. Use of CNG/LPG in office vehicle ( )
ii. Car pool for officers ( )
iii. Video Conferencing ( )
iv. Rain Water Harvesting ( )
v. Tree plantation in locality ( )
vi. Adoption of nearby villages to educate people in environment protection. ( )
vii. Organize national/international seminars/workshops/ Symposiums etc. ( )
viii. Donate/sponsor organizers for national events on environment protection ( )
ix. Any other, please specify ________________________________________
7) What are the different HR Policies formulated in your organization related to
GHRM?
________________________________________________________________
________________________________________________________________
________________________________________________________________
____________________________________________________________
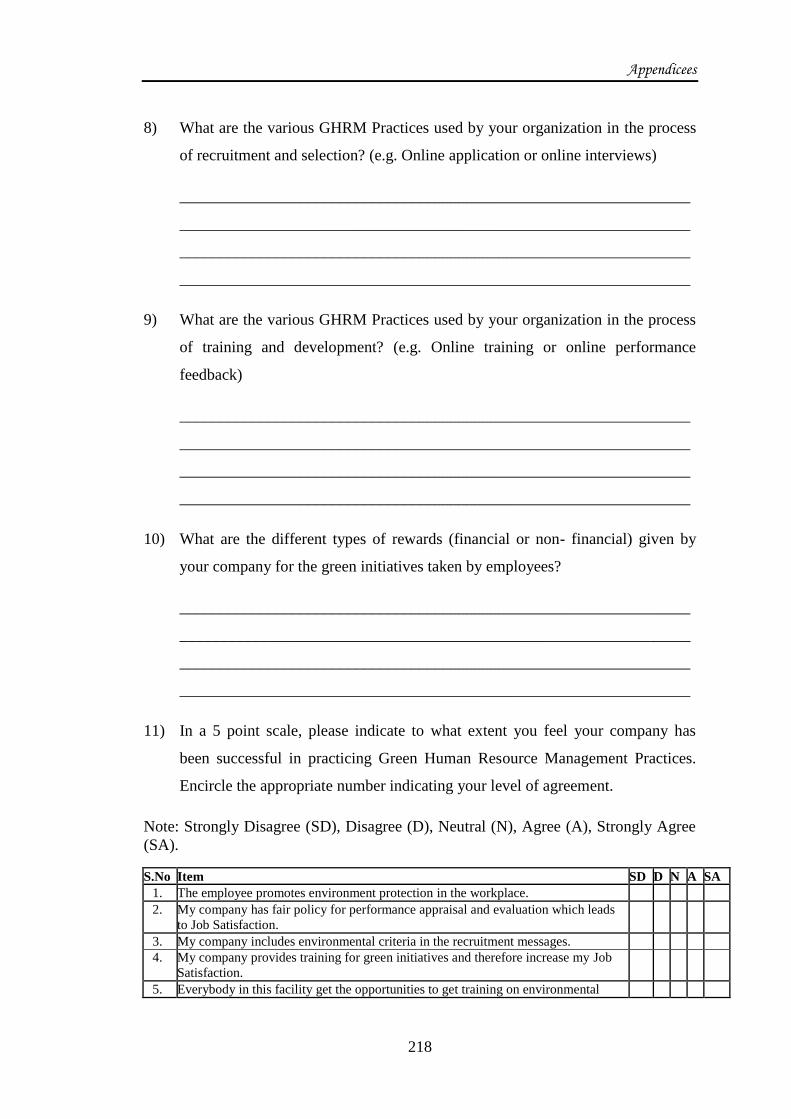
Appendicees
218
8) What are the various GHRM Practices used by your organization in the process
of recruitment and selection? (e.g. Online application or online interviews)
________________________________________________________________
________________________________________________________________
________________________________________________________________
________________________________________________________________
9) What are the various GHRM Practices used by your organization in the process
of training and development? (e.g. Online training or online performance
feedback)
________________________________________________________________
________________________________________________________________
________________________________________________________________
________________________________________________________________
10) What are the different types of rewards (financial or non- financial) given by
your company for the green initiatives taken by employees?
________________________________________________________________
________________________________________________________________
________________________________________________________________
________________________________________________________________
11) In a 5 point scale, please indicate to what extent you feel your company has
been successful in practicing Green Human Resource Management Practices.
Encircle the appropriate number indicating your level of agreement.
Note: Strongly Disagree (SD), Disagree (D), Neutral (N), Agree (A), Strongly Agree
(SA).
S.No Item SD D N A SA
1. The employee promotes environment protection in the workplace.
2. My company has fair policy for performance appraisal and evaluation which leads
to Job Satisfaction.
3. My company includes environmental criteria in the recruitment messages.
4. My company provides training for green initiatives and therefore increase my Job
Satisfaction.
5. Everybody in this facility get the opportunities to get training on environmental
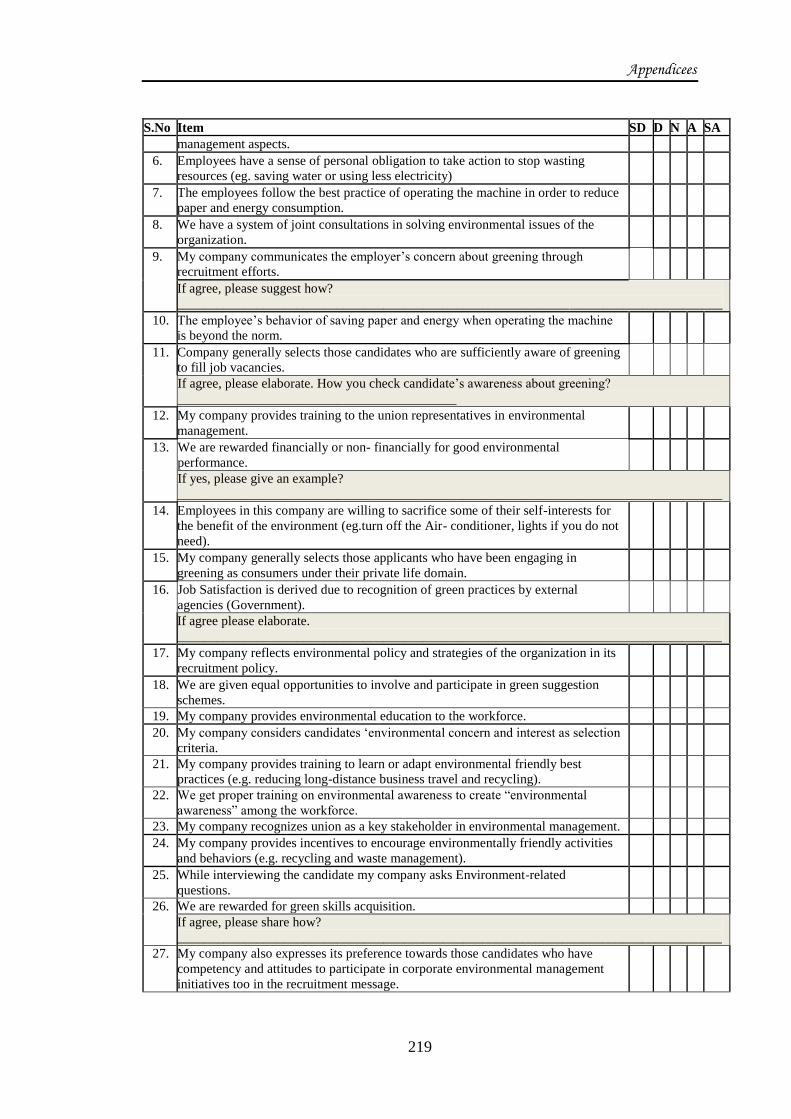
Appendicees
219
S.No Item SD D N A SA
management aspects.
6. Employees have a sense of personal obligation to take action to stop wasting
resources (eg. saving water or using less electricity)
7. The employees follow the best practice of operating the machine in order to reduce
paper and energy consumption.
8. We have a system of joint consultations in solving environmental issues of the
organization.
9. My company communicates the employer‘s concern about greening through
recruitment efforts.
If agree, please suggest how?
__________________________________________________________________________________
10. The employee‘s behavior of saving paper and energy when operating the machine
is beyond the norm.
11. Company generally selects those candidates who are sufficiently aware of greening
to fill job vacancies.
If agree, please elaborate. How you check candidate‘s awareness about greening?
__________________________________________
12. My company provides training to the union representatives in environmental
management.
13. We are rewarded financially or non- financially for good environmental
performance.
If yes, please give an example?
__________________________________________________________________________________
14. Employees in this company are willing to sacrifice some of their self-interests for
the benefit of the environment (eg.turn off the Air- conditioner, lights if you do not
need).
15. My company generally selects those applicants who have been engaging in
greening as consumers under their private life domain.
16. Job Satisfaction is derived due to recognition of green practices by external
agencies (Government).
If agree please elaborate.
__________________________________________________________________________________
17. My company reflects environmental policy and strategies of the organization in its
recruitment policy.
18. We are given equal opportunities to involve and participate in green suggestion
schemes.
19. My company provides environmental education to the workforce.
20. My company considers candidates ‗environmental concern and interest as selection
criteria.
21. My company provides training to learn or adapt environmental friendly best
practices (e.g. reducing long-distance business travel and recycling).
22. We get proper training on environmental awareness to create ―environmental
awareness‖ among the workforce.
23. My company recognizes union as a key stakeholder in environmental management.
24. My company provides incentives to encourage environmentally friendly activities
and behaviors (e.g. recycling and waste management).
25. While interviewing the candidate my company asks Environment-related
questions.
26. We are rewarded for green skills acquisition.
If agree, please share how?
__________________________________________________________________________________
27. My company also expresses its preference towards those candidates who have
competency and attitudes to participate in corporate environmental management
initiatives too in the recruitment message.

Appendicees
220
S.No Item SD D N A SA
28. My Company identifies the environmental training needs of employees in order to
make them more environmental concerned.
29. I plan to stay in this company to develop my career for a long time.
30. My company has introduced rewards for innovative environmental performance or
initiative.
31. My company indicates about organization‘s environmental performance (past and
current) when communicating recruitment messages.
32. We are receiving Team excellence awards for better environmental performance.
33. I feel proud to be a part of company due to engagement in supporting green and
sustainable initiatives and activities.
34. Employee in this company are encouraged to put forward new ideas on energy
saving and environment protection (eg. suggestion box).
35. I often think of quitting my present job.
36. The employee follows the Company‘s policy of disposing chemicals to avoid
polluting environment.
37. My company provides environmental training to us to develop required skills and
knowledge.
38. The employee voluntarily recycles even when no one is watching.
39. The employee follows the Company‘s policy of disposing waste water to avoid
polluting environment.
40. My Company imparts right knowledge and skills about greening (to each employee
through a training program exclusively designed for greening).
41. The employees follows the Company‘s recycling policy.
42. My company provides opportunities to the unions to negotiate with management
about green workplace agreement.
12 a) According to you, how adoption of GHRM Practices makes a difference to your
organization?
1. ____________________________________________________________________
2. ____________________________________________________________________
3. ____________________________________________________________________
4. ____________________________________________________________________
5. ____________________________________________________________________
12 b) According to you, how adoption of GHRM Practices does not makes a difference
to your organization?
1. ____________________________________________________________________
2. ____________________________________________________________________

Appendicees
221
3. ____________________________________________________________________
4. ____________________________________________________________________
5. ____________________________________________________________________
Personal Information:
Name (optional):________________________________
Age (in years): a) Below 30 b) 30 to 40 c) 40 to 50 d) Above 50
Designation: ____________________________________
Thank you for participating in this short survey to help us understand the Green Human
Resource Management Practices that are being adopted in your organization.

Appendicees
222
APPENDIX C
STATISTICS
N %
Cases
Valid 100 100.0
Excludeda 0 .0
Total 100 100.0
a. Listwise deletion based on all variables in the procedure.
Reliability Statistics
Cronbach's Alpha Cronbach's Alpha Based on
Standardized Items N of Items
.962 .962 43
Item Statistics
Mean Std. Deviation N
grs1 3.7900 1.52617 100
grs2 4.0300 1.16736 100
grs4 4.0900 1.18146 100
grs5 3.9500 1.25025 100
grs6 3.8200 1.39537 100
grs9 3.7400 1.49491 100
grs7 3.9200 1.40475 100
grs8 4.1000 1.29880 100
gtd1 3.4000 1.55050 100
gtd2 3.6400 1.29115 100
gtd3 3.6700 1.25573 100
gtd4 3.7000 1.32192 100
gtd5 3.6300 1.34581 100
gtd6 3.4400 1.43773 100
gtd7 3.5600 1.40216 100
gr2 3.7200 1.34900 100
gr3 3.6800 1.30948 100
gr4 3.7900 1.30496 100
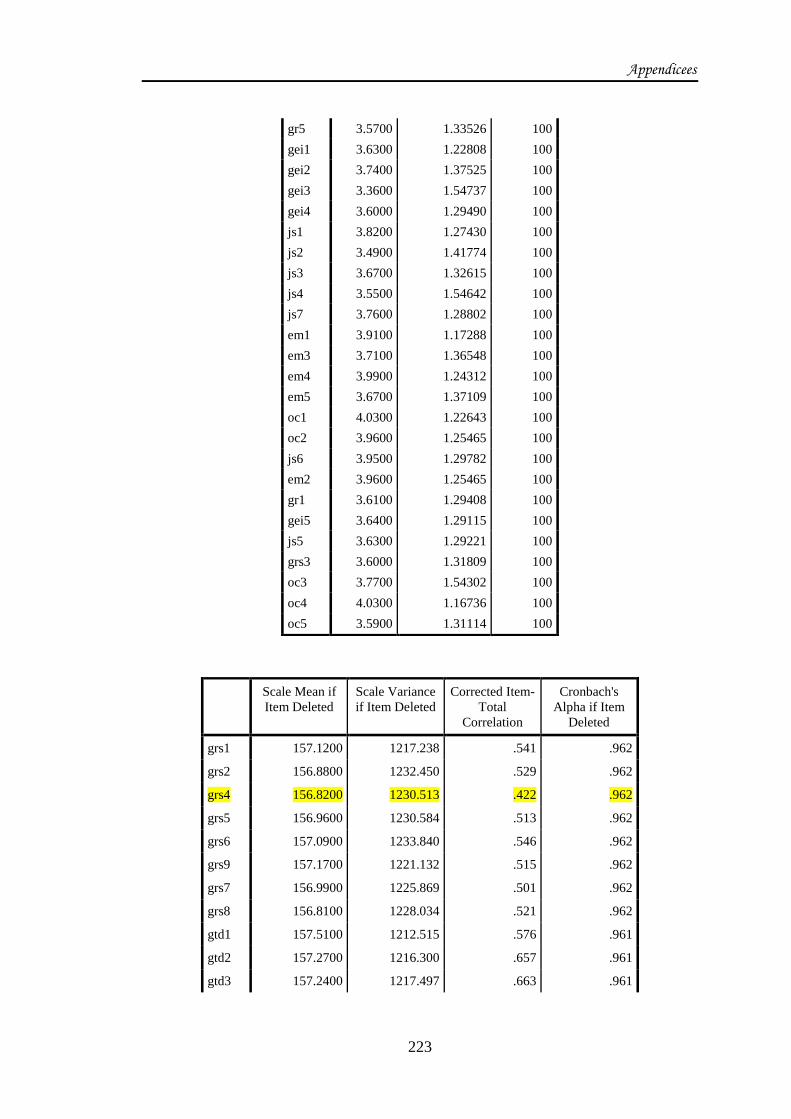
Appendicees
223
Scale Mean if
Item Deleted
Scale Variance
if Item Deleted
Corrected Item-
Total
Correlation
Cronbach's
Alpha if Item
Deleted
grs1 157.1200 1217.238 .541 .962
grs2 156.8800 1232.450 .529 .962
grs4 156.8200 1230.513 .422 .962
grs5 156.9600 1230.584 .513 .962
grs6 157.0900 1233.840 .546 .962
grs9 157.1700 1221.132 .515 .962
grs7 156.9900 1225.869 .501 .962
grs8 156.8100 1228.034 .521 .962
gtd1 157.5100 1212.515 .576 .961
gtd2 157.2700 1216.300 .657 .961
gtd3 157.2400 1217.497 .663 .961
gr5 3.5700 1.33526 100
gei1 3.6300 1.22808 100
gei2 3.7400 1.37525 100
gei3 3.3600 1.54737 100
gei4 3.6000 1.29490 100
js1 3.8200 1.27430 100
js2 3.4900 1.41774 100
js3 3.6700 1.32615 100
js4 3.5500 1.54642 100
js7 3.7600 1.28802 100
em1 3.9100 1.17288 100
em3 3.7100 1.36548 100
em4 3.9900 1.24312 100
em5 3.6700 1.37109 100
oc1 4.0300 1.22643 100
oc2 3.9600 1.25465 100
js6 3.9500 1.29782 100
em2 3.9600 1.25465 100
gr1 3.6100 1.29408 100
gei5 3.6400 1.29115 100
js5 3.6300 1.29221 100
grs3 3.6000 1.31809 100
oc3 3.7700 1.54302 100
oc4 4.0300 1.16736 100
oc5 3.5900 1.31114 100

Appendicees
224
gtd4 157.2100 1218.875 .612 .961
gtd5 157.2800 1212.810 .667 .961
gtd6 157.4700 1208.151 .670 .961
gtd7 157.3500 1210.391 .664 .961
gr2 157.1900 1221.125 .575 .961
gr3 157.2300 1220.684 .598 .961
gr4 157.1200 1220.450 .603 .961
gr5 157.3400 1200.772 .806 .960
gei1 157.2800 1216.628 .689 .961
gei2 157.1700 1218.789 .588 .961
gei3 157.5500 1202.371 .674 .961
gei4 157.3100 1215.549 .663 .961
js1 157.0900 1228.871 .522 .962
js2 157.4200 1207.095 .691 .961
js3 157.2400 1216.750 .634 .961
js4 157.3600 1215.142 .553 .962
js7 157.1500 1223.058 .582 .961
em1 157.0000 1234.626 .599 .962
em3 157.2000 1220.909 .570 .961
em4 156.9200 1235.084 .564 .962
em5 157.2400 1223.922 .535 .962
oc1 156.8800 1241.218 .398 .962
oc2 156.9500 1231.381 .502 .962
js6 156.9600 1230.503 .594 .962
em2 156.9500 1235.361 .656 .962
gr1 157.3000 1202.071 .818 .960
gei5 157.2700 1205.593 .779 .960
js5 157.2800 1203.759 .800 .960
grs3 157.3100 1200.903 .815 .960
oc3 157.1400 1215.596 .550 .962
oc4 156.8800 1233.258 .519 .962
oc5 157.3200 1201.674 .811 .960
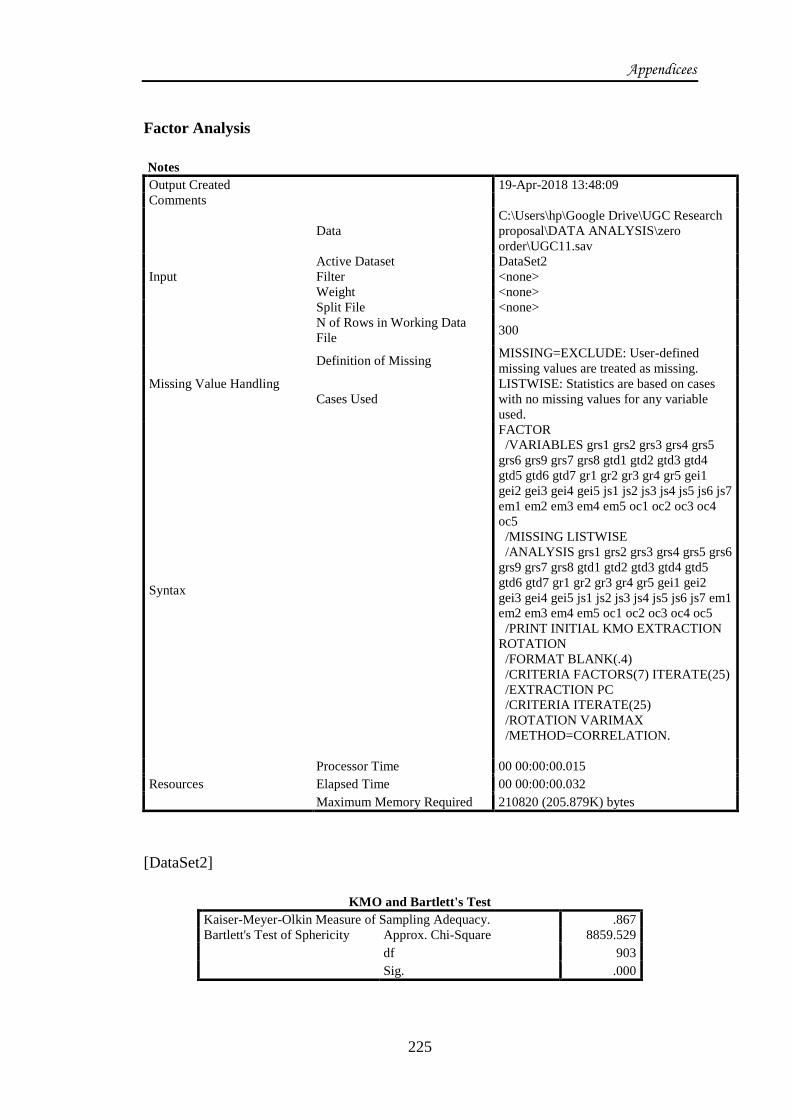
Appendicees
225
Factor Analysis
Notes
Output Created 19-Apr-2018 13:48:09
Comments
Input
Data
C:\Users\hp\Google Drive\UGC Research
proposal\DATA ANALYSIS\zero
order\UGC11.sav
Active Dataset DataSet2
Filter <none>
Weight <none>
Split File <none>
N of Rows in Working Data
File 300
Missing Value Handling
Definition of Missing MISSING=EXCLUDE: User-defined
missing values are treated as missing.
Cases Used
LISTWISE: Statistics are based on cases
with no missing values for any variable
used.
Syntax
FACTOR
/VARIABLES grs1 grs2 grs3 grs4 grs5
grs6 grs9 grs7 grs8 gtd1 gtd2 gtd3 gtd4
gtd5 gtd6 gtd7 gr1 gr2 gr3 gr4 gr5 gei1
gei2 gei3 gei4 gei5 js1 js2 js3 js4 js5 js6 js7
em1 em2 em3 em4 em5 oc1 oc2 oc3 oc4
oc5
/MISSING LISTWISE
/ANALYSIS grs1 grs2 grs3 grs4 grs5 grs6
grs9 grs7 grs8 gtd1 gtd2 gtd3 gtd4 gtd5
gtd6 gtd7 gr1 gr2 gr3 gr4 gr5 gei1 gei2
gei3 gei4 gei5 js1 js2 js3 js4 js5 js6 js7 em1
em2 em3 em4 em5 oc1 oc2 oc3 oc4 oc5
/PRINT INITIAL KMO EXTRACTION
ROTATION
/FORMAT BLANK(.4)
/CRITERIA FACTORS(7) ITERATE(25)
/EXTRACTION PC
/CRITERIA ITERATE(25)
/ROTATION VARIMAX
/METHOD=CORRELATION.
Resources
Processor Time 00 00:00:00.015
Elapsed Time 00 00:00:00.032
Maximum Memory Required 210820 (205.879K) bytes
[DataSet2]
KMO and Bartlett's Test
Kaiser-Meyer-Olkin Measure of Sampling Adequacy. .867
Bartlett's Test of Sphericity Approx. Chi-Square 8859.529
df 903
Sig. .000
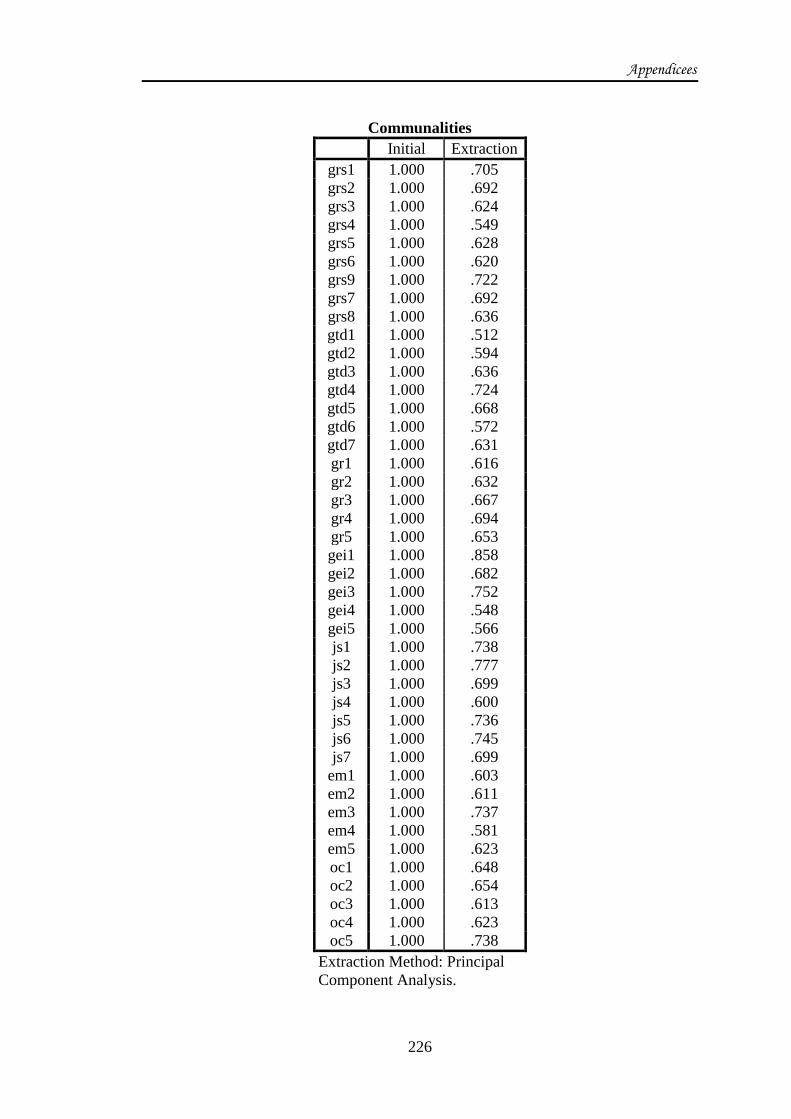
Appendicees
226
Communalities
Initial Extraction
grs1 1.000 .705
grs2 1.000 .692
grs3 1.000 .624
grs4 1.000 .549
grs5 1.000 .628
grs6 1.000 .620
grs9 1.000 .722
grs7 1.000 .692
grs8 1.000 .636
gtd1 1.000 .512
gtd2 1.000 .594
gtd3 1.000 .636
gtd4 1.000 .724
gtd5 1.000 .668
gtd6 1.000 .572
gtd7 1.000 .631
gr1 1.000 .616
gr2 1.000 .632
gr3 1.000 .667
gr4 1.000 .694
gr5 1.000 .653
gei1 1.000 .858
gei2 1.000 .682
gei3 1.000 .752
gei4 1.000 .548
gei5 1.000 .566
js1 1.000 .738
js2 1.000 .777
js3 1.000 .699
js4 1.000 .600
js5 1.000 .736
js6 1.000 .745
js7 1.000 .699
em1 1.000 .603
em2 1.000 .611
em3 1.000 .737
em4 1.000 .581
em5 1.000 .623
oc1 1.000 .648
oc2 1.000 .654
oc3 1.000 .613
oc4 1.000 .623
oc5 1.000 .738
Extraction Method: Principal
Component Analysis.

Appendicees
227
Total Variance Explained
Component
Initial Eigenvalues
Extraction Sums of Squared
Loadings
Rotation Sums of Squared
Loadings
Total
% of
Variance
Cumulative
% Total
% of
Variance
Cumulative
% Total
% of
Variance
Cumulative
%
1 11.718 27.252 27.252 11.718 27.252 27.252 5.896 13.713 13.713
2 5.719 13.300 40.552 5.719 13.300 40.552 4.693 10.915 24.628
3 3.401 7.910 48.462 3.401 7.910 48.462 4.160 9.674 34.301
4 2.599 6.043 54.505 2.599 6.043 54.505 3.418 7.949 42.250
5 2.098 4.879 59.385 2.098 4.879 59.385 3.403 7.915 50.165
6 1.495 3.477 62.861 1.495 3.477 62.861 3.400 7.906 58.071
7 1.267 2.946 65.807 1.267 2.946 65.807 3.327 7.736 65.807
8 .967 2.248 68.055
9 .869 2.020 70.075
10 .810 1.884 71.959
11 .759 1.766 73.725
12 .699 1.624 75.350
13 .666 1.548 76.898
14 .626 1.456 78.354
15 .606 1.409 79.763
16 .591 1.374 81.138
17 .575 1.337 82.474
18 .532 1.236 83.710
19 .525 1.221 84.932
20 .492 1.144 86.076
21 .463 1.077 87.153
22 .435 1.012 88.165
23 .428 .995 89.160
24 .402 .934 90.094
25 .375 .871 90.965
26 .356 .827 91.793
27 .332 .771 92.564
28 .308 .717 93.281
29 .291 .676 93.957
30 .283 .658 94.615
31 .275 .639 95.254
32 .250 .582 95.836
33 .244 .567 96.403
34 .222 .516 96.919
35 .218 .506 97.426
36 .209 .486 97.911
37 .180 .418 98.330
38 .150 .349 98.679
39 .144 .336 99.015
40 .142 .330 99.345
41 .124 .289 99.633
42 .086 .201 99.834
43 .071 .166 100.000
Extraction Method: Principal Component Analysis.
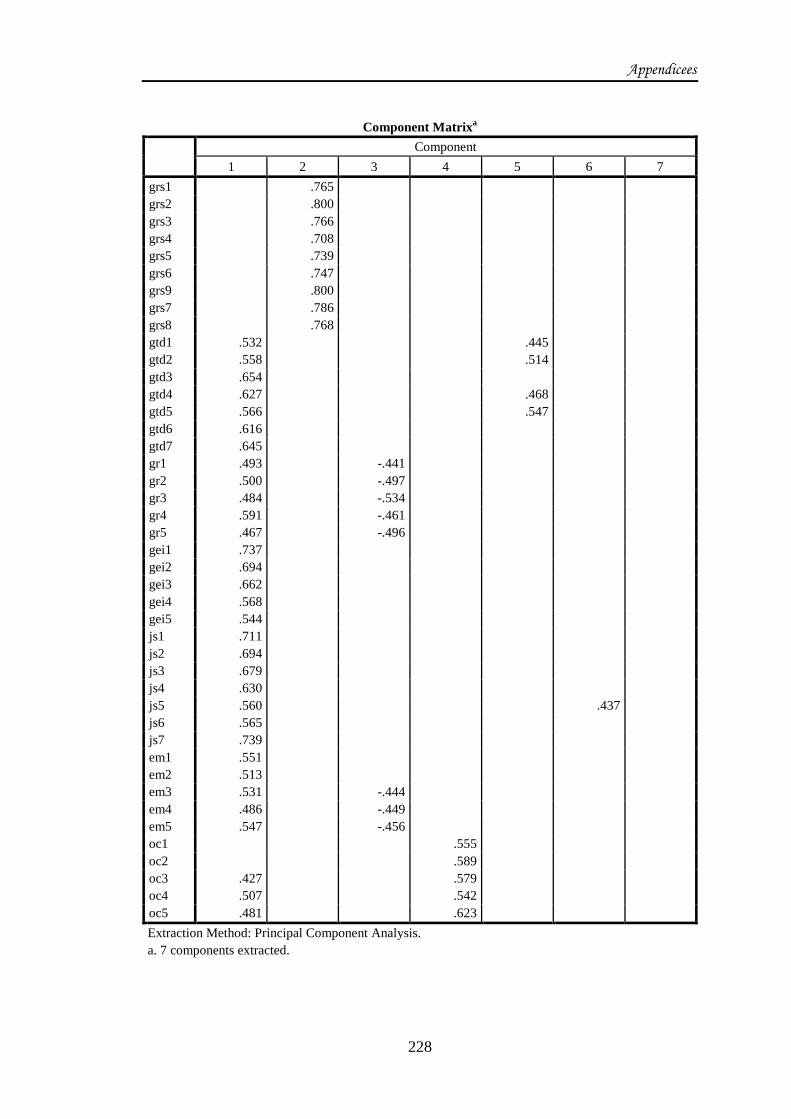
Appendicees
228
Component Matrixa
Component
1 2 3 4 5 6 7
grs1 .765
grs2 .800
grs3 .766
grs4 .708
grs5 .739
grs6 .747
grs9 .800
grs7 .786
grs8 .768
gtd1 .532 .445
gtd2 .558 .514
gtd3 .654
gtd4 .627 .468
gtd5 .566 .547
gtd6 .616
gtd7 .645
gr1 .493 -.441
gr2 .500 -.497
gr3 .484 -.534
gr4 .591 -.461
gr5 .467 -.496
gei1 .737
gei2 .694
gei3 .662
gei4 .568
gei5 .544
js1 .711
js2 .694
js3 .679
js4 .630
js5 .560 .437
js6 .565
js7 .739
em1 .551
em2 .513
em3 .531 -.444
em4 .486 -.449
em5 .547 -.456
oc1 .555
oc2 .589
oc3 .427 .579
oc4 .507 .542
oc5 .481 .623
Extraction Method: Principal Component Analysis.
a. 7 components extracted.
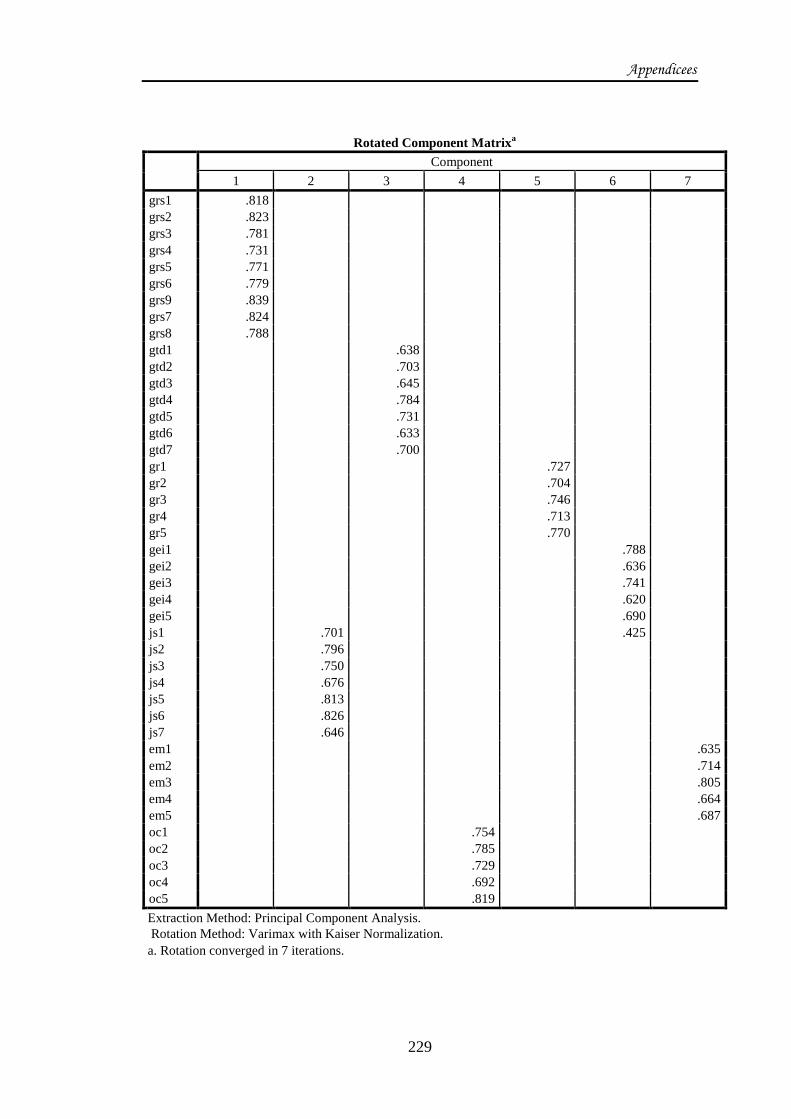
Appendicees
229
Rotated Component Matrixa
Component
1 2 3 4 5 6 7
grs1 .818
grs2 .823
grs3 .781
grs4 .731
grs5 .771
grs6 .779
grs9 .839
grs7 .824
grs8 .788
gtd1 .638
gtd2 .703
gtd3 .645
gtd4 .784
gtd5 .731
gtd6 .633
gtd7 .700
gr1 .727
gr2 .704
gr3 .746
gr4 .713
gr5 .770
gei1 .788
gei2 .636
gei3 .741
gei4 .620
gei5 .690
js1 .701 .425
js2 .796
js3 .750
js4 .676
js5 .813
js6 .826
js7 .646
em1 .635
em2 .714
em3 .805
em4 .664
em5 .687
oc1 .754
oc2 .785
oc3 .729
oc4 .692
oc5 .819
Extraction Method: Principal Component Analysis.
Rotation Method: Varimax with Kaiser Normalization.
a. Rotation converged in 7 iterations.

Appendicees
230
Component Transformation Matrix
Component 1 2 3 4 5 6 7
1 -.197 .494 .463 .305 .339 .412 .354
2 .970 .098 .075 -.002 .166 .020 .123
3 .119 .454 -.044 .318 -.600 .253 -.503
4 .039 -.453 -.276 .831 .094 .102 .091
5 .022 -.273 .781 .194 .010 -.363 -.381
6 -.059 .499 -.281 .237 .394 -.650 -.186
7 .006 .109 .116 .147 -.578 -.448 .647
Extraction Method: Principal Component Analysis.
Rotation Method: Varimax with Kaiser Normalization.
Model Fit Summary
CMIN
Model NPAR CMIN DF P CMIN/DF
Default model 11 7.857 4 .097 1.964
Saturated model 15 .000 0
Independence model 5 622.645 10 .000 62.265
RMR, GFI
Model RMR GFI AGFI PGFI
Default model .027 .990 .962 .264
Saturated model .000 1.000
Independence model .668 .462 .193 .308
Baseline Comparisons
Model NFI
Delta1
RFI
rho1
IFI
Delta2
TLI
rho2 CFI
Default model .987 .968 .994 .984 .994
Saturated model 1.000
1.000
1.000
Independence model .000 .000 .000 .000 .000

Appendicees
231
Parsimony-Adjusted Measures
Model PRATIO PNFI PCFI
Default model .400 .395 .397
Saturated model .000 .000 .000
Independence model 1.000 .000 .000
NCP
Model NCP LO 90 HI 90
Default model 3.857 .000 15.955
Saturated model .000 .000 .000
Independence model 612.645 534.549 698.144
FMIN
Model FMIN F0 LO 90 HI 90
Default model .026 .013 .000 .053
Saturated model .000 .000 .000 .000
Independence model 2.082 2.049 1.788 2.335
RMSEA
Model RMSEA LO 90 HI 90 PCLOSE
Default model .057 .000 .115 .351
Independence model .453 .423 .483 .000
AIC
Model AIC BCC BIC CAIC
Default model 29.857 30.307 70.598 81.598
Saturated model 30.000 30.614 85.557 100.557
Independence model 632.645 632.850 651.164 656.164

Appendicees
232
ECVI
Model ECVI LO 90 HI 90 MECVI
Default model .100 .087 .140 .101
Saturated model .100 .100 .100 .102
Independence model 2.116 1.855 2.402 2.117
HOELTER
Model HOELTER
.05
HOELTER
.01
Default model 362 506
Independence model 9 12
Model Fit Summary
CMIN
Model NPAR CMIN DF P CMIN/DF
Default model 11 5.192 4 .268 1.298
Saturated model 15 .000 0
Independence model 5 795.157 10 .000 79.516
RMR, GFI
Model RMR GFI AGFI PGFI
Default model .027 .993 .973 .265
Saturated model .000 1.000
Independence model .917 .424 .136 .283
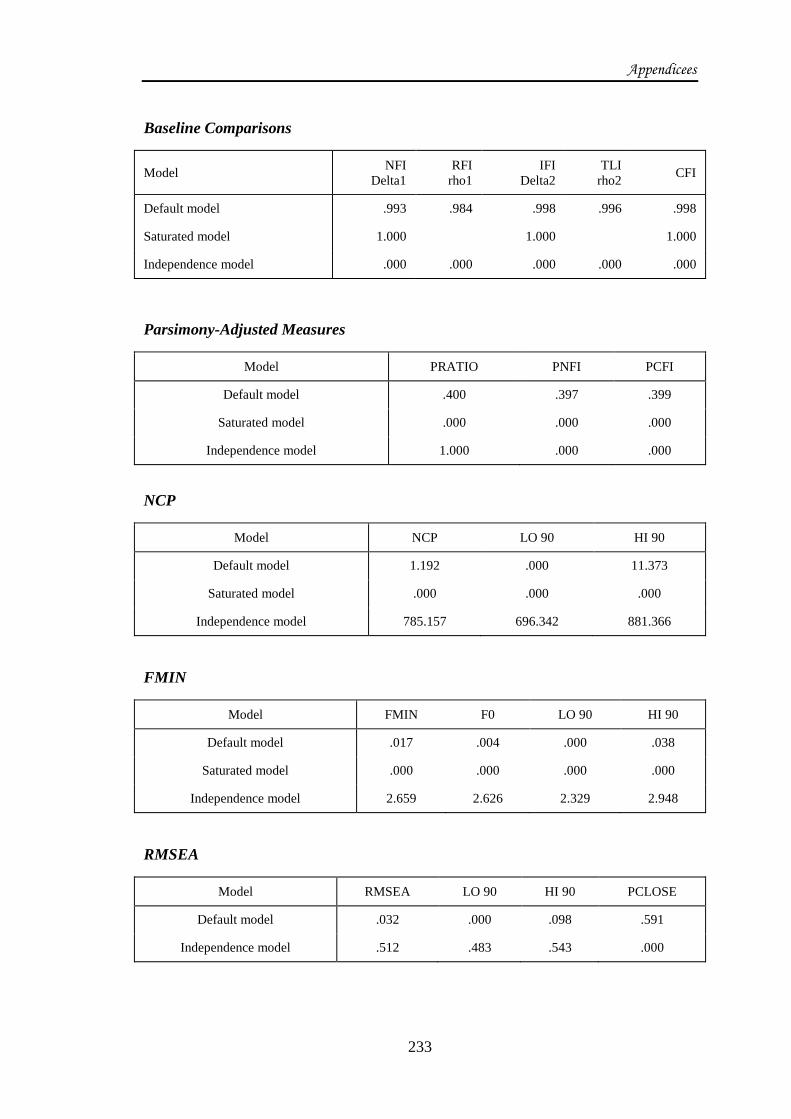
Appendicees
233
Baseline Comparisons
Model NFI
Delta1
RFI
rho1
IFI
Delta2
TLI
rho2 CFI
Default model .993 .984 .998 .996 .998
Saturated model 1.000
1.000
1.000
Independence model .000 .000 .000 .000 .000
Parsimony-Adjusted Measures
Model PRATIO PNFI PCFI
Default model .400 .397 .399
Saturated model .000 .000 .000
Independence model 1.000 .000 .000
NCP
Model NCP LO 90 HI 90
Default model 1.192 .000 11.373
Saturated model .000 .000 .000
Independence model 785.157 696.342 881.366
FMIN
Model FMIN F0 LO 90 HI 90
Default model .017 .004 .000 .038
Saturated model .000 .000 .000 .000
Independence model 2.659 2.626 2.329 2.948
RMSEA
Model RMSEA LO 90 HI 90 PCLOSE
Default model .032 .000 .098 .591
Independence model .512 .483 .543 .000

Appendicees
234
AIC
Model AIC BCC BIC CAIC
Default model 27.192 27.643 67.934 78.934
Saturated model 30.000 30.614 85.557 100.557
Independence model 805.157 805.362 823.676 828.676
ECVI
Model ECVI LO 90 HI 90 MECVI
Default model .091 .087 .125 .092
Saturated model .100 .100 .100 .102
Independence model 2.693 2.396 3.015 2.694
HOELTER
Model HOELTER
.05
HOELTER
.01
Default model 547 765
Independence model 7 9
Model Fit Summary
CMIN
Model NPAR CMIN DF P CMIN/DF
Default model 10 14.992 5 .010 2.998
Saturated model 15 .000 0
Independence model 5 663.627 10 .000 66.363
RMR, GFI
Model RMR GFI AGFI PGFI
Default model .039 .981 .943 .327
Saturated model .000 1.000
Independence model .716 .438 .158 .292
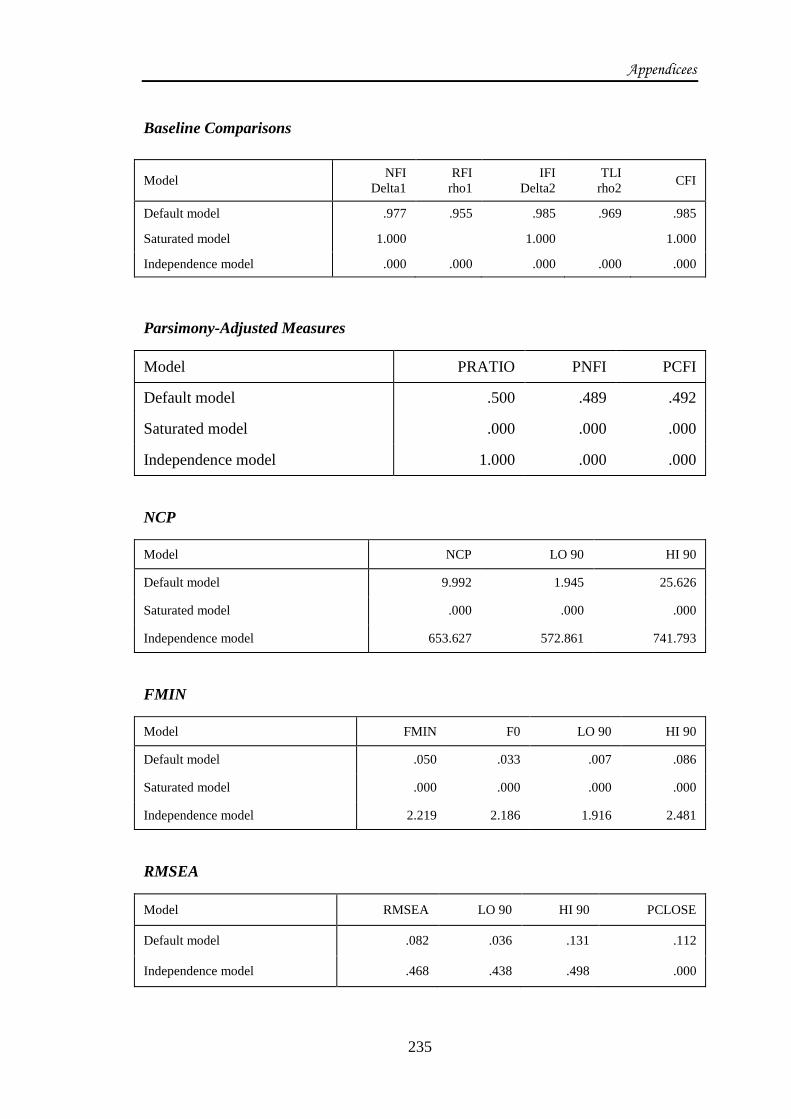
Appendicees
235
Baseline Comparisons
Model NFI
Delta1
RFI
rho1
IFI
Delta2
TLI
rho2 CFI
Default model .977 .955 .985 .969 .985
Saturated model 1.000
1.000
1.000
Independence model .000 .000 .000 .000 .000
Parsimony-Adjusted Measures
Model PRATIO PNFI PCFI
Default model .500 .489 .492
Saturated model .000 .000 .000
Independence model 1.000 .000 .000
NCP
Model NCP LO 90 HI 90
Default model 9.992 1.945 25.626
Saturated model .000 .000 .000
Independence model 653.627 572.861 741.793
FMIN
Model FMIN F0 LO 90 HI 90
Default model .050 .033 .007 .086
Saturated model .000 .000 .000 .000
Independence model 2.219 2.186 1.916 2.481
RMSEA
Model RMSEA LO 90 HI 90 PCLOSE
Default model .082 .036 .131 .112
Independence model .468 .438 .498 .000
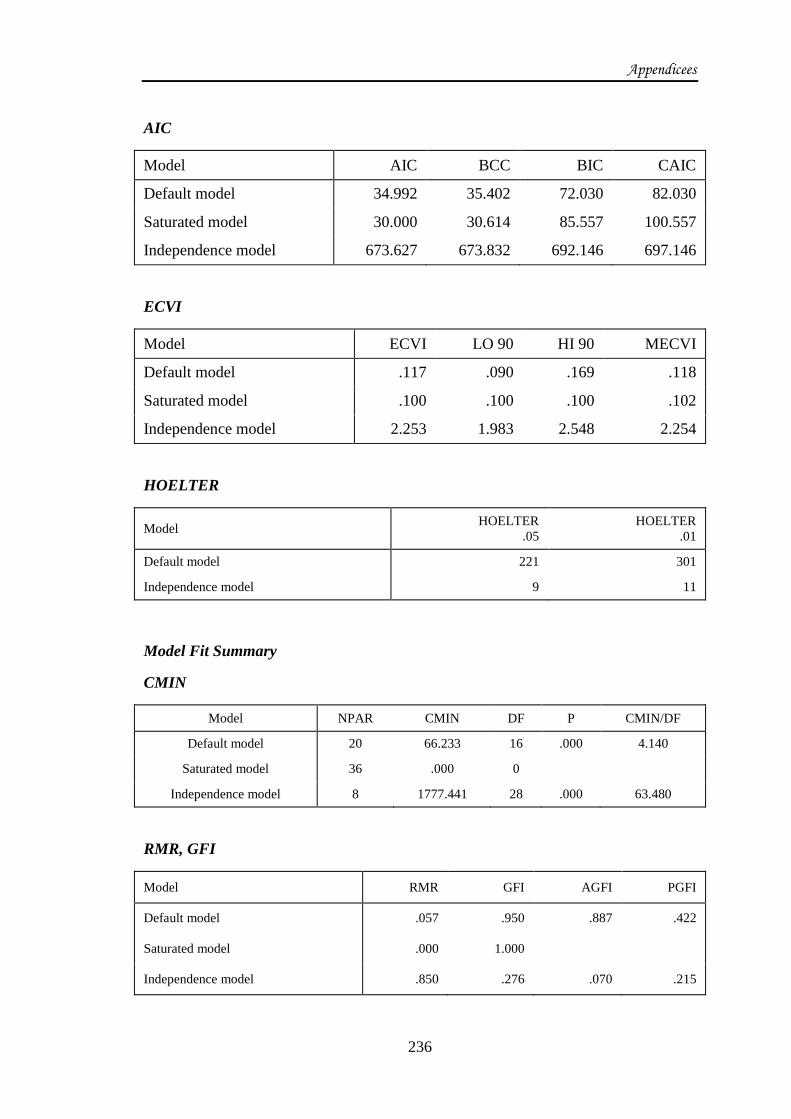
Appendicees
236
AIC
Model AIC BCC BIC CAIC
Default model 34.992 35.402 72.030 82.030
Saturated model 30.000 30.614 85.557 100.557
Independence model 673.627 673.832 692.146 697.146
ECVI
Model ECVI LO 90 HI 90 MECVI
Default model .117 .090 .169 .118
Saturated model .100 .100 .100 .102
Independence model 2.253 1.983 2.548 2.254
HOELTER
Model HOELTER
.05
HOELTER
.01
Default model 221 301
Independence model 9 11
Model Fit Summary
CMIN
Model NPAR CMIN DF P CMIN/DF
Default model 20 66.233 16 .000 4.140
Saturated model 36 .000 0
Independence model 8 1777.441 28 .000 63.480
RMR, GFI
Model RMR GFI AGFI PGFI
Default model .057 .950 .887 .422
Saturated model .000 1.000
Independence model .850 .276 .070 .215

Appendicees
237
Baseline Comparisons
Model NFI
Delta1
RFI
rho1
IFI
Delta2
TLI
rho2 CFI
Default model .963 .935 .971 .950 .971
Saturated model 1.000
1.000
1.000
Independence model .000 .000 .000 .000 .000
Parsimony-Adjusted Measures
Model PRATIO PNFI PCFI
Default model .571 .550 .555
Saturated model .000 .000 .000
Independence model 1.000 .000 .000
NCP
Model NCP LO 90 HI 90
Default model 50.233 28.808 79.216
Saturated model .000 .000 .000
Independence model 1749.441 1614.929 1891.313
FMIN
Model FMIN F0 LO 90 HI 90
Default model .222 .168 .096 .265
Saturated model .000 .000 .000 .000
Independence model 5.945 5.851 5.401 6.325
RMSEA
Model RMSEA LO 90 HI 90 PCLOSE
Default model .102 .078 .129 .000
Independence model .457 .439 .475 .000

Appendicees
238
AIC
Model AIC BCC BIC CAIC
Default model 106.233 107.475 180.309 200.309
Saturated model 72.000 74.234 205.336 241.336
Independence model 1793.441 1793.938 1823.072 1831.072
ECVI
Model ECVI LO 90 HI 90 MECVI
Default model .355 .284 .452 .359
Saturated model .241 .241 .241 .248
Independence model 5.998 5.548 6.473 6.000
HOELTER
Model HOELTER
.05
HOELTER
.01
Default model 119 145
Independence model 7 9
Model Fit Summary
CMIN
Model NPAR CMIN DF P CMIN/DF
Default model 16 40.519 12 .000 3.377
Saturated model 28 .000 0
Independence model 7 976.382 21 .000 46.494
RMR, GFI
Model RMR GFI AGFI PGFI
Default model .048 .964 .916 .413
Saturated model .000 1.000
Independence model .658 .384 .178 .288

Appendicees
239
Baseline Comparisons
Model NFI
Delta1
RFI
rho1
IFI
Delta2
TLI
rho2 CFI
Default model .959 .927 .970 .948 .970
Saturated model 1.000
1.000
1.000
Independence model .000 .000 .000 .000 .000
Parsimony-Adjusted Measures
Model PRATIO PNFI PCFI
Default model .571 .548 .554
Saturated model .000 .000 .000
Independence model 1.000 .000 .000
NCP
Model NCP LO 90 HI 90
Default model 28.519 12.860 51.770
Saturated model .000 .000 .000
Independence model 955.382 856.801 1061.357
FMIN
Model FMIN F0 LO 90 HI 90
Default model .136 .095 .043 .173
Saturated model .000 .000 .000 .000
Independence model 3.265 3.195 2.866 3.550
RMSEA
Model RMSEA LO 90 HI 90 PCLOSE
Default model .089 .060 .120 .016
Independence model .390 .369 .411 .000
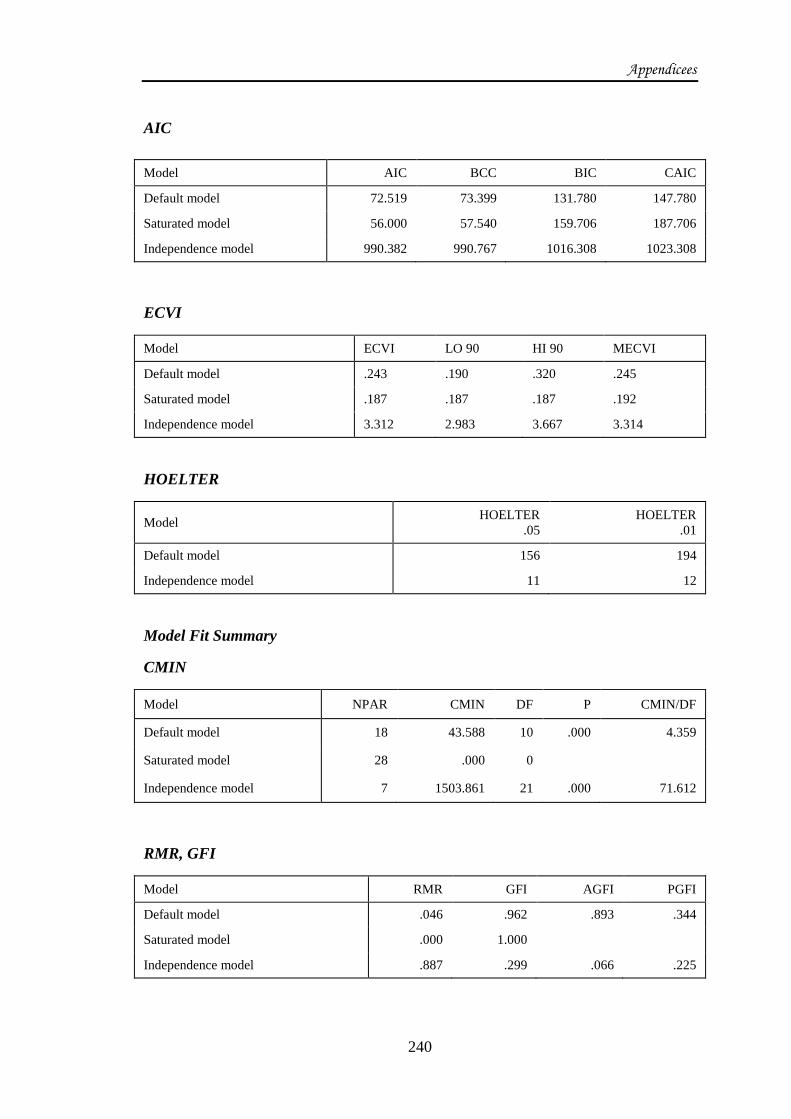
Appendicees
240
AIC
Model AIC BCC BIC CAIC
Default model 72.519 73.399 131.780 147.780
Saturated model 56.000 57.540 159.706 187.706
Independence model 990.382 990.767 1016.308 1023.308
ECVI
Model ECVI LO 90 HI 90 MECVI
Default model .243 .190 .320 .245
Saturated model .187 .187 .187 .192
Independence model 3.312 2.983 3.667 3.314
HOELTER
Model HOELTER
.05
HOELTER
.01
Default model 156 194
Independence model 11 12
Model Fit Summary
CMIN
Model NPAR CMIN DF P CMIN/DF
Default model 18 43.588 10 .000 4.359
Saturated model 28 .000 0
Independence model 7 1503.861 21 .000 71.612
RMR, GFI
Model RMR GFI AGFI PGFI
Default model .046 .962 .893 .344
Saturated model .000 1.000
Independence model .887 .299 .066 .225

Appendicees
241
Baseline Comparisons
Model NFI
Delta1
RFI
rho1
IFI
Delta2
TLI
rho2 CFI
Default model .971 .939 .978 .952 .977
Saturated model 1.000
1.000
1.000
Independence model .000 .000 .000 .000 .000
Parsimony-Adjusted Measures
Model PRATIO PNFI PCFI
Default model .476 .462 .465
Saturated model .000 .000 .000
Independence model 1.000 .000 .000
NCP
Model NCP LO 90 HI 90
Default model 33.588 16.801 57.919
Saturated model .000 .000 .000
Independence model 1482.861 1359.375 1613.716
FMIN
Model FMIN F0 LO 90 HI 90
Default model .146 .112 .056 .194
Saturated model .000 .000 .000 .000
Independence model 5.030 4.959 4.546 5.397
RMSEA
Model RMSEA LO 90 HI 90 PCLOSE
Default model .106 .075 .139 .002
Independence model .486 .465 .507 .000

Appendicees
242
AIC
Model AIC BCC BIC CAIC
Default model 79.588 80.578 146.256 164.256
Saturated model 56.000 57.540 159.706 187.706
Independence model 1517.861 1518.246 1543.788 1550.788
ECVI
Model ECVI LO 90 HI 90 MECVI
Default model .266 .210 .348 .269
Saturated model .187 .187 .187 .192
Independence model 5.076 4.663 5.514 5.078
HOELTER
Model HOELTER
.05
HOELTER
.01
Default model 126 160
Independence model 7 8
Model Fit Summary
CMIN
Model NPAR CMIN DF P CMIN/DF
Default model 12 1.123 3 .772 .374
Saturated model 15 .000 0
Independence model 5 675.002 10 .000 67.500
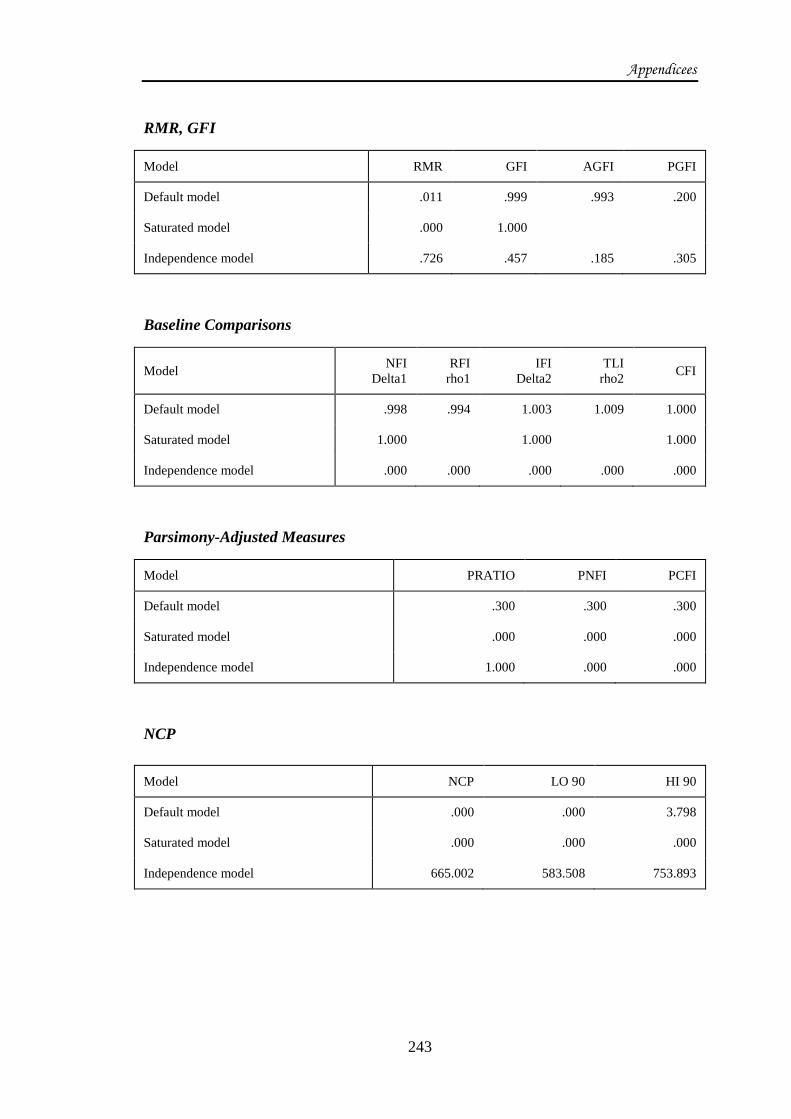
Appendicees
243
RMR, GFI
Model RMR GFI AGFI PGFI
Default model .011 .999 .993 .200
Saturated model .000 1.000
Independence model .726 .457 .185 .305
Baseline Comparisons
Model NFI
Delta1
RFI
rho1
IFI
Delta2
TLI
rho2 CFI
Default model .998 .994 1.003 1.009 1.000
Saturated model 1.000
1.000
1.000
Independence model .000 .000 .000 .000 .000
Parsimony-Adjusted Measures
Model PRATIO PNFI PCFI
Default model .300 .300 .300
Saturated model .000 .000 .000
Independence model 1.000 .000 .000
NCP
Model NCP LO 90 HI 90
Default model .000 .000 3.798
Saturated model .000 .000 .000
Independence model 665.002 583.508 753.893
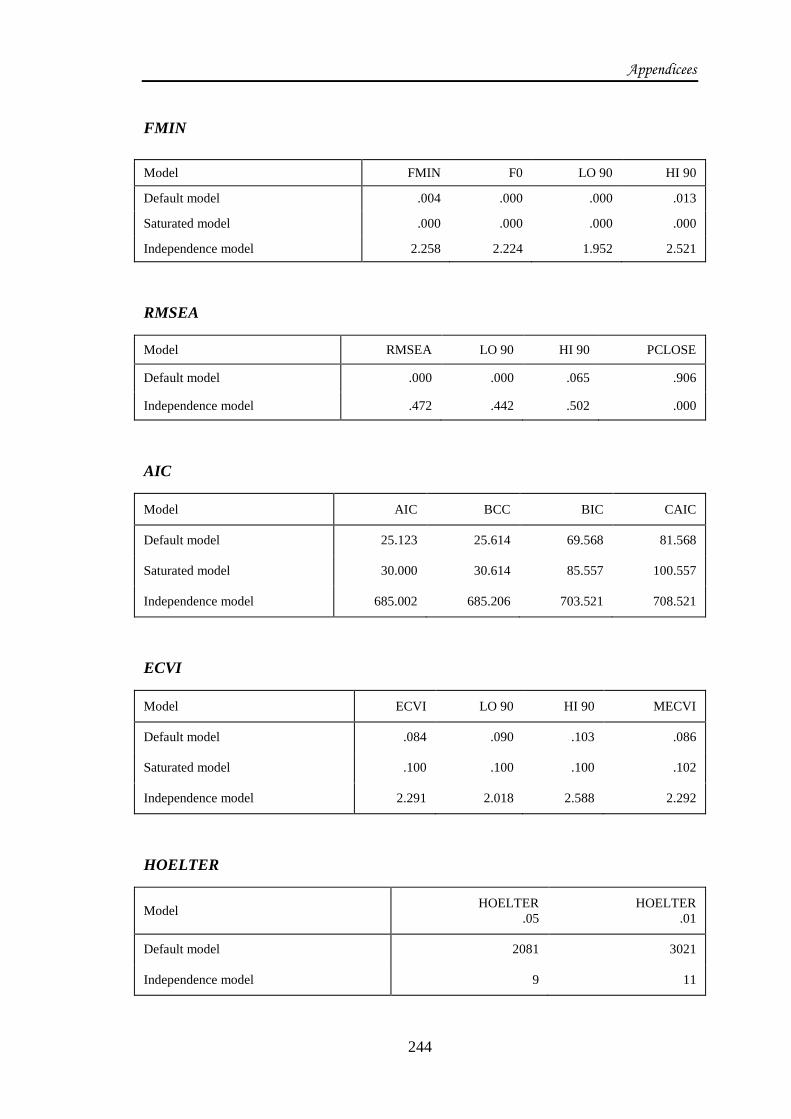
Appendicees
244
FMIN
Model FMIN F0 LO 90 HI 90
Default model .004 .000 .000 .013
Saturated model .000 .000 .000 .000
Independence model 2.258 2.224 1.952 2.521
RMSEA
Model RMSEA LO 90 HI 90 PCLOSE
Default model .000 .000 .065 .906
Independence model .472 .442 .502 .000
AIC
Model AIC BCC BIC CAIC
Default model 25.123 25.614 69.568 81.568
Saturated model 30.000 30.614 85.557 100.557
Independence model 685.002 685.206 703.521 708.521
ECVI
Model ECVI LO 90 HI 90 MECVI
Default model .084 .090 .103 .086
Saturated model .100 .100 .100 .102
Independence model 2.291 2.018 2.588 2.292
HOELTER
Model HOELTER
.05
HOELTER
.01
Default model 2081 3021
Independence model 9 11

Appendicees
245
First Order
Notes for Model (Default model)
Computation of degrees of freedom (Default model)
Number of distinct sample moments: 903
Number of distinct parameters to be estimated: 120
Degrees of freedom (903 - 120): 783
Result (Default model)
Minimum was achieved
Chi-square = 1600.292
Degrees of freedom = 783
Probability level = .000
Estimates (Group number 1 - Default model)
Scalar Estimates (Group number 1 - Default model)
Maximum Likelihood Estimates
Regression Weights: (Group number 1 - Default model)
Estimate S.E. C.R. P Label
gei1 <--- GEI 1.000
gei2 <--- GEI .693 .040 17.491 *** par_1
gei3 <--- GEI .617 .031 19.891 *** par_2
gei5 <--- GEI .545 .040 13.751 *** par_3
gr1 <--- GR 1.000
gr2 <--- GR 1.050 .089 11.782 *** par_4
gr3 <--- GR 1.098 .090 12.226 *** par_5
gr4 <--- GR 1.263 .096 13.094 *** par_6
gr5 <--- GR 1.108 .096 11.558 *** par_7
js3 <--- JS 1.000
js4 <--- JS .924 .067 13.887 *** par_8
gtd2 <--- GTD 1.000
gtd3 <--- GTD 1.137 .105 10.793 *** par_9

Appendicees
246
Estimate S.E. C.R. P Label
gtd4 <--- GTD 1.200 .105 11.455 *** par_10
gtd5 <--- GTD 1.132 .103 10.956 *** par_11
gtd6 <--- GTD 1.068 .105 10.147 *** par_12
gtd7 <--- GTD 1.117 .099 11.283 *** par_13
em1 <--- EM 1.000
em2 <--- EM 1.021 .086 11.940 *** par_14
em3 <--- EM 1.205 .103 11.712 *** par_15
em4 <--- EM 1.092 .105 10.435 *** par_16
em5 <--- EM 1.141 .102 11.193 *** par_17
oc4 <--- OC 1.000
oc5 <--- OC 1.176 .082 14.309 *** par_18
gei4 <--- GEI .484 .040 12.121 *** par_40
gtd1 <--- GTD .814 .078 10.434 *** par_41
js6 <--- JS 1.025 .073 14.015 *** par_42
oc1 <--- OC .773 .077 10.049 *** par_43
oc2 <--- OC .722 .073 9.929 *** par_44
oc3 <--- OC .816 .069 11.793 *** par_45
grs9 <--- GRS 1.000
grs5 <--- GRS 1.078 .077 14.044 *** par_47
grs8 <--- GRS 1.096 .075 14.536 *** par_48
grs7 <--- GRS .976 .070 14.027 *** par_49
grs6 <--- GRS 1.062 .075 14.252 *** par_50
grs3 <--- GRS 1.001 .077 13.022 *** par_51
grs1 <--- GRS .879 .050 17.441 *** par_52
grs2 <--- GRS 1.042 .052 20.066 *** par_53
js2 <--- JS 1.090 .065 16.783 *** par_54
js1 <--- JS 1.480 .086 17.191 *** par_55
js7 <--- JS 1.338 .080 16.668 *** par_56
js5 <--- JS .844 .072 11.767 *** par_57

Appendicees
247
Standardized Regression Weights: (Group number 1 - Default model)
Estimate
gei1 <--- GEI .952
gei2 <--- GEI .760
gei3 <--- GEI .812
gei5 <--- GEI .657
gr1 <--- GR .713
gr2 <--- GR .734
gr3 <--- GR .763
gr4 <--- GR .824
gr5 <--- GR .719
js3 <--- JS .794
js4 <--- JS .739
gtd2 <--- GTD .664
gtd3 <--- GTD .724
gtd4 <--- GTD .783
gtd5 <--- GTD .738
gtd6 <--- GTD .680
gtd7 <--- GTD .765
em1 <--- EM .669
em2 <--- EM .682
em3 <--- EM .816
em4 <--- EM .702
em5 <--- EM .766
oc4 <--- OC .755
oc5 <--- OC .904
gei4 <--- GEI .670
gtd1 <--- GTD .604
js6 <--- JS .741
oc1 <--- OC .600
oc2 <--- OC .596
oc3 <--- OC .697
grs9 <--- GRS .800
grs5 <--- GRS .760
grs8 <--- GRS .786
grs7 <--- GRS .760
grs6 <--- GRS .769
grs3 <--- GRS .725
grs1 <--- GRS .736
grs2 <--- GRS .773
js2 <--- JS .845
js1 <--- JS .864
js7 <--- JS .843
js5 <--- JS .642
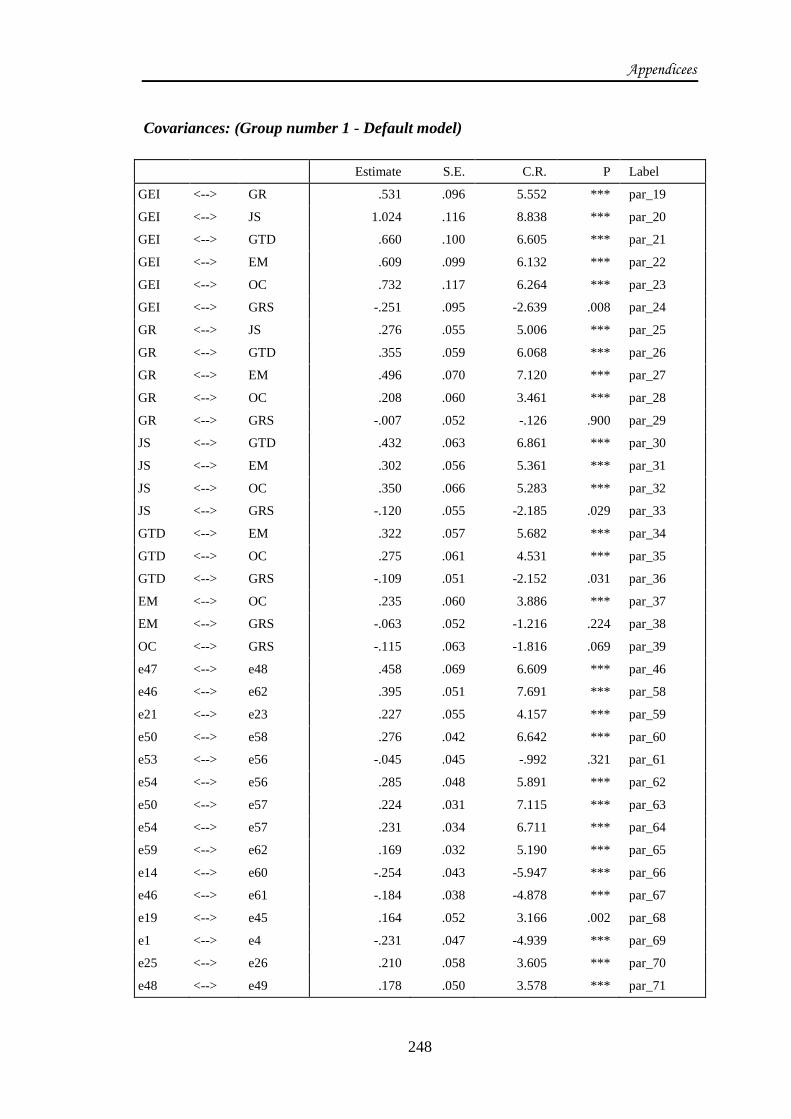
Appendicees
248
Covariances: (Group number 1 - Default model)
Estimate S.E. C.R. P Label
GEI <--> GR .531 .096 5.552 *** par_19
GEI <--> JS 1.024 .116 8.838 *** par_20
GEI <--> GTD .660 .100 6.605 *** par_21
GEI <--> EM .609 .099 6.132 *** par_22
GEI <--> OC .732 .117 6.264 *** par_23
GEI <--> GRS -.251 .095 -2.639 .008 par_24
GR <--> JS .276 .055 5.006 *** par_25
GR <--> GTD .355 .059 6.068 *** par_26
GR <--> EM .496 .070 7.120 *** par_27
GR <--> OC .208 .060 3.461 *** par_28
GR <--> GRS -.007 .052 -.126 .900 par_29
JS <--> GTD .432 .063 6.861 *** par_30
JS <--> EM .302 .056 5.361 *** par_31
JS <--> OC .350 .066 5.283 *** par_32
JS <--> GRS -.120 .055 -2.185 .029 par_33
GTD <--> EM .322 .057 5.682 *** par_34
GTD <--> OC .275 .061 4.531 *** par_35
GTD <--> GRS -.109 .051 -2.152 .031 par_36
EM <--> OC .235 .060 3.886 *** par_37
EM <--> GRS -.063 .052 -1.216 .224 par_38
OC <--> GRS -.115 .063 -1.816 .069 par_39
e47 <--> e48 .458 .069 6.609 *** par_46
e46 <--> e62 .395 .051 7.691 *** par_58
e21 <--> e23 .227 .055 4.157 *** par_59
e50 <--> e58 .276 .042 6.642 *** par_60
e53 <--> e56 -.045 .045 -.992 .321 par_61
e54 <--> e56 .285 .048 5.891 *** par_62
e50 <--> e57 .224 .031 7.115 *** par_63
e54 <--> e57 .231 .034 6.711 *** par_64
e59 <--> e62 .169 .032 5.190 *** par_65
e14 <--> e60 -.254 .043 -5.947 *** par_66
e46 <--> e61 -.184 .038 -4.878 *** par_67
e19 <--> e45 .164 .052 3.166 .002 par_68
e1 <--> e4 -.231 .047 -4.939 *** par_69
e25 <--> e26 .210 .058 3.605 *** par_70
e48 <--> e49 .178 .050 3.578 *** par_71

Appendicees
249
Correlations: (Group number 1 - Default model)
Estimate
GEI <--> GR .395
GEI <--> JS .711
GEI <--> GTD .518
GEI <--> EM .468
GEI <--> OC .456
GEI <--> GRS -.168
GR <--> JS .360
GR <--> GTD .522
GR <--> EM .715
GR <--> OC .243
GR <--> GRS -.008
JS <--> GTD .593
JS <--> EM .406
JS <--> OC .381
JS <--> GRS -.140
GTD <--> EM .489
GTD <--> OC .338
GTD <--> GRS -.144
EM <--> OC .283
EM <--> GRS -.081
OC <--> GRS -.120
e47 <--> e48 .445
e46 <--> e62 .512
e21 <--> e23 .320
e50 <--> e58 .483
e53 <--> e56 -.061
e54 <--> e56 .401
e50 <--> e57 .413
e54 <--> e57 .383
e59 <--> e62 .294
e14 <--> e60 -.424
e46 <--> e61 -.282
e19 <--> e45 .211
e1 <--> e4 -.534
e25 <--> e26 .257
e48 <--> e49 .212

Appendicees
250
Variances: (Group number 1 - Default model)
Estimate S.E. C.R. P Label
GEI
2.516 .234 10.755 *** par_72
GR
.716 .106 6.776 *** par_73
JS
.824 .101 8.148 *** par_74
GTD
.645 .105 6.146 *** par_75
EM
.672 .109 6.141 *** par_76
OC
1.025 .142 7.239 *** par_77
GRS
.893 .111 8.051 *** par_78
e1
.258 .065 3.989 *** par_79
e2
.885 .079 11.236 *** par_80
e3
.493 .046 10.642 *** par_81
e5
.983 .084 11.751 *** par_82
e6
.694 .066 10.573 *** par_83
e7
.676 .065 10.350 *** par_84
e8
.618 .062 9.977 *** par_85
e9
.541 .061 8.821 *** par_86
e10
.820 .078 10.506 *** par_87
e13
.483 .044 11.028 *** par_88
e14
.586 .053 10.968 *** par_89
e19
.818 .075 10.874 *** par_90
e20
.755 .073 10.412 *** par_91
e21
.587 .062 9.501 *** par_92
e22
.692 .067 10.261 *** par_93
e23
.855 .081 10.596 *** par_94
e24
.569 .058 9.893 *** par_95
e25
.828 .078 10.601 *** par_96
e26
.808 .077 10.502 *** par_97
e27
.489 .058 8.490 *** par_98
e28
.826 .079 10.432 *** par_99
e29
.616 .064 9.574 *** par_100
e33
.772 .080 9.642 *** par_101
e34
.317 .068 4.688 *** par_102
e4
.726 .069 10.566 *** par_103
e45
.742 .066 11.213 *** par_104
e46
.711 .064 11.138 *** par_105
e47
1.090 .097 11.245 *** par_106
e48
.972 .085 11.397 *** par_107

Appendicees
251
Estimate S.E. C.R. P Label
e49
.723 .069 10.477 *** par_108
e50
.502 .048 10.543 *** par_109
e52
.757 .074 10.278 *** par_110
e53
.662 .068 9.740 *** par_111
e54
.622 .058 10.790 *** par_112
e55
.694 .068 10.161 *** par_113
e56
.809 .079 10.255 *** par_114
e57
.585 .052 11.211 *** par_115
e58
.652 .065 10.049 *** par_116
e59
.394 .038 10.418 *** par_117
e60
.611 .065 9.458 *** par_118
e61
.600 .059 10.101 *** par_119
e62
.838 .070 12.042 *** par_120
Squared Multiple Correlations: (Group number 1 - Default model)
Estimate
js5
.412
js7
.711
js1
.747
js2
.713
grs2
.598
grs1
.542
grs3
.525
grs6
.592
grs7
.578
grs8
.618
grs5
.578
grs9
.640
oc3
.486
oc2
.355
oc1
.360
js6
.549
gtd1
.365
gei4
.448
oc5
.817
oc4
.570
em5
.587
em4
.493
em3
.666
em2
.465
em1
.448
gtd7
.586

Appendicees
252
Estimate
gtd6
.462
gtd5
.544
gtd4
.613
gtd3
.525
gtd2
.441
js4
.546
js3
.630
gr5
.518
gr4
.678
gr3
.583
gr2
.539
gr1
.508
gei5
.432
gei3
.660
gei2
.577
gei1
.907
Model Fit Summary
CMIN
Model NPAR CMIN DF P CMIN/DF
Default model 120 1600.292 783 .000 2.044
Saturated model 903 .000 0
Independence model 42 9042.898 861 .000 10.503
RMR, GFI
Model RMR GFI AGFI PGFI
Default model .092 .803 .773 .696
Saturated model .000 1.000
Independence model .481 .212 .173 .202
Baseline Comparisons
Model NFI
Delta1
RFI
rho1
IFI
Delta2
TLI
rho2 CFI
Default model .823 .805 .901 .890 .900
Saturated model 1.000
1.000
1.000
Independence model .000 .000 .000 .000 .000

Appendicees
253
Parsimony-Adjusted Measures
Model PRATIO PNFI PCFI
Default model .909 .748 .819
Saturated model .000 .000 .000
Independence model 1.000 .000 .000
NCP
Model NCP LO 90 HI 90
Default model 817.292 706.759 935.574
Saturated model .000 .000 .000
Independence model 8181.898 7879.858 8490.429
FMIN
Model FMIN F0 LO 90 HI 90
Default model 5.352 2.733 2.364 3.129
Saturated model .000 .000 .000 .000
Independence model 30.244 27.364 26.354 28.396
RMSEA
Model RMSEA LO 90 HI 90 PCLOSE
Default model .059 .055 .063 .000
Independence model .178 .175 .182 .000
AIC
Model AIC BCC BIC CAIC
Default model 1840.292 1880.604 2284.746 2404.746
Saturated model 1806.000 2109.352 5150.516 6053.516
Independence model 9126.898 9141.007 9282.457 9324.457

Appendicees
254
ECVI
Model ECVI LO 90 HI 90 MECVI
Default model 6.155 5.785 6.550 6.290
Saturated model 6.040 6.040 6.040 7.055
Independence model 30.525 29.515 31.557 30.572
HOELTER
Model HOELTER
.05
HOELTER
.01
Default model 159 165
Independence model 31 32