(a) Straight turning (b) Cutting of f Common Machining ... · PDF fileManufacturing Processes...
63
Manufacturing Processes for Engineering Materials, 5th ed. Kalpakjian • Schmid © 2008, Pearson Education ISBN No. 0-13-227271-7 Common Machining Processes FIGURE 8.1 Some examples of common machining processes. (c) Slab milling (d) End milling End mill Cutter (b) Cutting off (a) Straight turning Tool Tool
Transcript of (a) Straight turning (b) Cutting of f Common Machining ... · PDF fileManufacturing Processes...

Manufacturing Processes for Engineering Materials, 5th ed. Kalpakjian • Schmid© 2008, Pearson EducationISBN No. 0-13-227271-7
Common Machining Processes
FIGURE 8.1 Some examples of common machining processes.
(c) Slab milling (d) End milling
End mill
Cutter
(b) Cutting off(a) Straight turning
ToolTool

Manufacturing Processes for Engineering Materials, 5th ed. Kalpakjian • Schmid© 2008, Pearson EducationISBN No. 0-13-227271-7
Orthogonal Cutting
FIGURE 8.2 Schematic illustration of a two-dimensional cutting process, or orthogonal cutting. (a) Orthogonal cutting with a well-defined shear plane, also known as the Merchant model; (b) Orthogonal cutting without a well-defined shear plane.
Rake angle
Chip
Tool face
V Flank
Relief orclearanceangle
Shear angle
Shear plane
!
Tool
Shiny surfaceRough surface
Workpiece
to
tc
- +
"
(a)
Chip
Roughsurface
Primaryshear zone Flank
Relief orclearanceangle
Tool face
Tool
tc
to
V
- +
"
Rake angle
(b)
Rough surface

Manufacturing Processes for Engineering Materials, 5th ed. Kalpakjian • Schmid© 2008, Pearson EducationISBN No. 0-13-227271-7
Chip Formation
FIGURE 8.3 (a) Schematic illustration of the basic mechanism of chip formation in cutting. (b) Velocity diagram in the cutting zone.
Shear plane
Workpiece
d
Chip
Tool
A C
B
A C
B O
Rake angle,
(b)
Vc
Vs
V
(a)
(90° - )
(90° - + )
( - )
( - )

Manufacturing Processes for Engineering Materials, 5th ed. Kalpakjian • Schmid© 2008, Pearson EducationISBN No. 0-13-227271-7
Types of Chips
FIGURE 8.4 Basic types of chips produced in metal cutting and their micrographs: (a) continuous chip with narrow, straight primary shear zone; (b) secondary shear zone at the tool-chip interface; (c) continuous chip with built-up edge; (d) segmented or nonhomogeneous chip; and (e) discontinuous chip. Source: After M.C. Shaw, P.K. Wright, and S. Kalpakjian.
(e)(d)
(a) (b) (c)
Tool
WorkpiecePrimary
shearzone
Chip
Primaryshear zone
Chip
Tool
Secondary shear zones
BUE
Lowshearstrain
Highshearstrain
FIGURE 8.5 Shiny (burnished) surface on the tool side of a continuous chip produced in turning.

Manufacturing Processes for Engineering Materials, 5th ed. Kalpakjian • Schmid© 2008, Pearson EducationISBN No. 0-13-227271-7
Hardness in Cutting Zone
FIGURE 8.6 (a) Hardness distribution in the cutting zone for 3115 steel. Note that some regions in the built-up edge are as much as three times harder than the bulk workpiece. (b) Surface finish in turning 5130 steel with a built-up edge. (c) Surface finish on 1018 steel in face milling. Source: Courtesy of Metcut Research Associates, Inc.
(a)
(b)
(c)
474
661
588
492
588
656 604
684
565
432589
656 567 578
512704
704 639
655770734
466
587704
372306
329
289325
331286
289
371 418
383
306386
261
565327
361281
289
410341
281308
231
201
251266
317229
377503544409297
316
230
Workpiece
Built-upedge
Hardness (HK)
Chip

Manufacturing Processes for Engineering Materials, 5th ed. Kalpakjian • Schmid© 2008, Pearson EducationISBN No. 0-13-227271-7
Chip Breakers
FIGURE 8.7 (a) Schematic illustration of the action of a chip breaker. Note that the chip breaker decreases the radius of curvature of the chip. (b) Chip breaker clamped on the rake face of a cutting tool. (c) Grooves on the rake face of cutting tools, acting as chip breakers. Most cutting tools now are inserts with built-in chip-breaker features.
(a) (b)
Workpiece
Tool
After
Chip
Before
Chip breaker
Rake faceof tool
Tool
Clamp
Chip breaker
(c)
Positive rake
Rake face
0° rakeRadius
FIGURE 8.8 Various chips produced in turning: (a) tightly curled chip; (b) chip hits workpiece and breaks; (c) continuous chip moving radially outward from workpiece; and (d) chip hits tool shank and breaks off. Source: After G. Boothroyd. (a) (b) (c) (d)

Manufacturing Processes for Engineering Materials, 5th ed. Kalpakjian • Schmid© 2008, Pearson EducationISBN No. 0-13-227271-7
Oblique Cutting
FIGURE 8.9 (a) Schematic illustration of cutting with an oblique tool. (b) Top view, showing the inclination angle, i. (c) Types of chips produced with different inclination angles.
Workpiecei = 30°
i = 15°
i = 0°
Chip
(a) (b) (c)
i
a
o
Tool
Top view
Workpiece
i
a
o
Tool
Chip
y
z
x
c
t

Manufacturing Processes for Engineering Materials, 5th ed. Kalpakjian • Schmid© 2008, Pearson EducationISBN No. 0-13-227271-7
Right-Hand Cutting Tool
FIGURE 8.10 (a) Schematic illustration of a right-hand cutting tool for turning. Although these tools have traditionally been produced from solid tool-steel bars, they are now replaced by inserts of carbide or other tool materials of various shapes and sizes, as shown in (b).
(a) (b)
End-cuttingedge angle
(ECEA)
Side-rakeangle, + (SR)
Axis
Axis
Cutting edge
Face
Back-rake angle, + (BR)
Nose radius
Flank
Side-relief angle
Side-cutting edge angle (SCEA)
Clearance or end-relief angle
AxisSha
nk
Insert
Clamp
Clamp screw
Toolholder
Seat or shim

Manufacturing Processes for Engineering Materials, 5th ed. Kalpakjian • Schmid© 2008, Pearson EducationISBN No. 0-13-227271-7
Cutting Forces
FIGURE 8.11 (a) Forces acting on a cutting tool in two-dimensional cutting. Note that the resultant forces, R, must be collinear to balance the forces. (b) Force circle to determine various forces acting in the cutting zone. Source: After M.E. Merchant.
Chip
Tool
Workpiece
(a) (b)
Fn
Fc
Fs
Ft
R
F
N
R
Chip
V
V
Tool
Workpiece
Fc
Fs
FtF
N
R
Cutting force Friction coefficient
Fc = Rcos(β!α) =wtoτcos(β!α)
sinφcos(φ+β!α)µ= tanβ=
Ft +Fc tanαFc!Ft tanα

Manufacturing Processes for Engineering Materials, 5th ed. Kalpakjian • Schmid© 2008, Pearson EducationISBN No. 0-13-227271-7
Cutting Data
FIGURE 8.12 Thrust force as a function of rake angle and feed in orthogonal cutting of AISI 1112 cold-rolled steel. Note that at high rake angles, the thrust force is negative. A negative thrust force has important implications in the design of machine tools and in controlling the stability of the cutting process. Source: After S. Kobayashi and E.G. Thomsen.
! = 5°
10°
15°
20°
25°
30°
35°
40°
0 0.1 0.2 0.3
mm/revmm/rev
800
400
0
2200
(N)
Ft (
lb)
200
150
100
50
0
2500 0.002 0.004 0.006 0.008 0.010 0.012
Feed (in./rev)
ut
(in.-lb/in3 uf/ut
! " # µ $ Fc (lb) Ft (lb) !103) us uf (%)25! 20.9! 2.55 1.46 56 380 224 320 209 111 3535 31.6 1.56 1.53 57 254 102 214 112 102 4840 35.7 1.32 1.54 57 232 71 195 94 101 5245 41.9 1.06 1.83 62 232 68 195 75 120 62to = 0.0025 in.; w = 0.475 in.; V = 90 ft/min; tool: high-speed steel.
uf/ut
! V " # µ $ Fc Ft ut us uf (%)+10 197 17 3.4 1.05 46 370 273 400 292 108 27
400 19 3.1 1.11 48 360 283 390 266 124 32642 21.5 2.7 0.95 44 329 217 356 249 107 301186 25 2.4 0.81 39 303 168 328 225 103 31
-10 400 16.5 3.9 0.64 33 416 385 450 342 108 24637 19 3.5 0.58 30 384 326 415 312 103 251160 22 3.1 0.51 27 356 263 385 289 96 25
to = 0.037 in.; w = 0.25 in.; tool: cemented carbide.
TABLE 8.1 Data on orthogonal cutting of 4130 steel.
TABLE 8.2 Data on orthogonal cutting of 9445 steel.

Manufacturing Processes for Engineering Materials, 5th ed. Kalpakjian • Schmid© 2008, Pearson EducationISBN No. 0-13-227271-7
Shear Force & Normal Force
FIGURE 8.13 (a) Shear force and (b) normal force as a function of the area of the shear plane and the rake angle for 85-15 brass. Note that the shear stress in the shear plane is constant, regardless of the magnitude of the normal stress, indicating that the normal stress has no effect on the shear flow stress of the material. Source: After S. Kobayashi and E.G. Thomsen.
= 20° to 40°
800
400
0
= 50,000 psi
0 1 32 4 5 6
0 1 32
1200
320
280
240
200
160
120
80
40
0
mm2
(N)
As (in2 x 10-3)
Fs (
lb)
(a)
0 1 32 4 5 6
0 1 32
1200
320
280
240
200
160
120
80
40
0
800
400
As (in2 x 10-3)
mm2
(N)
Ft (lb)
(b)
25
303540
20°

Manufacturing Processes for Engineering Materials, 5th ed. Kalpakjian • Schmid© 2008, Pearson EducationISBN No. 0-13-227271-7
Shear Stress on Tool Face
FIGURE 8.14 Schematic illustration of the distribution of normal and shear stresses at the tool-chip interface (rake face). Note that, whereas the normal stress increases continuously toward the tip of the tool, the shear stress reaches a maximum and remains at that value (a phenomenon known as sticking; see Section 4.4.1).
!
"
Tool face
Sliding
Sticking
Stresses on tool face
Tool tip
Tool
Flank face

Manufacturing Processes for Engineering Materials, 5th ed. Kalpakjian • Schmid© 2008, Pearson EducationISBN No. 0-13-227271-7
Shear-Angle Relationships
FIGURE 8.15 (a) Comparison of experimental and theoretical shear-angle relationships. More recent analytical studies have resulted in better agreement with experimental data. (b) Relation between the shear angle and the friction angle for various alloys and cutting speeds. Source: After S. Kobayashi.
50
40
30
20
10
0230 220 210 0 10 20 30 40 50 60
Lead
Copper
Tin
Eq. (8.21)
Eq. (8.20)
Mild steel
Alum
inum
(! - ")
Sh
ea
r a
ng
le, # (
de
g.)
" = 0
! = 10 30 50 70 (deg.)
µ=0 0.5 1 2
60
40
20
0
# (
de
g.)
(a) (b)
Merchant [Eq. (8.20)]
Shaffer [Eq. (8.21)]
Mizuno [Eqs. (8.22)-(8.23]
φ= 45!+α2" β2
φ= 45!+α"β
φ= α for α> 15!
φ= 15! for α< 15!

Manufacturing Processes for Engineering Materials, 5th ed. Kalpakjian • Schmid© 2008, Pearson EducationISBN No. 0-13-227271-7
Specific Energy
Specific Energy∗
Material W-s/mm3 hp-min/in3
Aluminum alloys 0.4-1.1 0.15-0.4Cast irons 1.6-5.5 0.6-2.0Copper alloys 1.4-3.3 0.5-1.2High-temperature alloys 3.3-8.5 1.2-3.1Magnesium alloys 0.4-0.6 0.15-0.2Nickel alloys 4.9-6.8 1.8-2.5Refractory alloys 3.8-9.6 1.1-3.5Stainless steels 3.0-5.2 1.1-1.9Steels 2.7-9.3 1.0-3.4Titanium alloys 3.0-4.1 1.1-1.5∗ At drive motor, corrected for 80% e!ciency; multiplythe energy by 1.25 for dull tools.
TABLE 8.3 Approximate Specific-Energy Requirements in Machining Operations
Manufacturing Processes for Engineering Materials, 5th ed. Kalpakjian • Schmid© 2008, Pearson EducationISBN No. 0-13-227271-7
Temperatures in Cutting400
500
450
Workpiece
Tool
Chip
3080
130
380
600360
500
600
650
700
Temperature (°C)
650
600
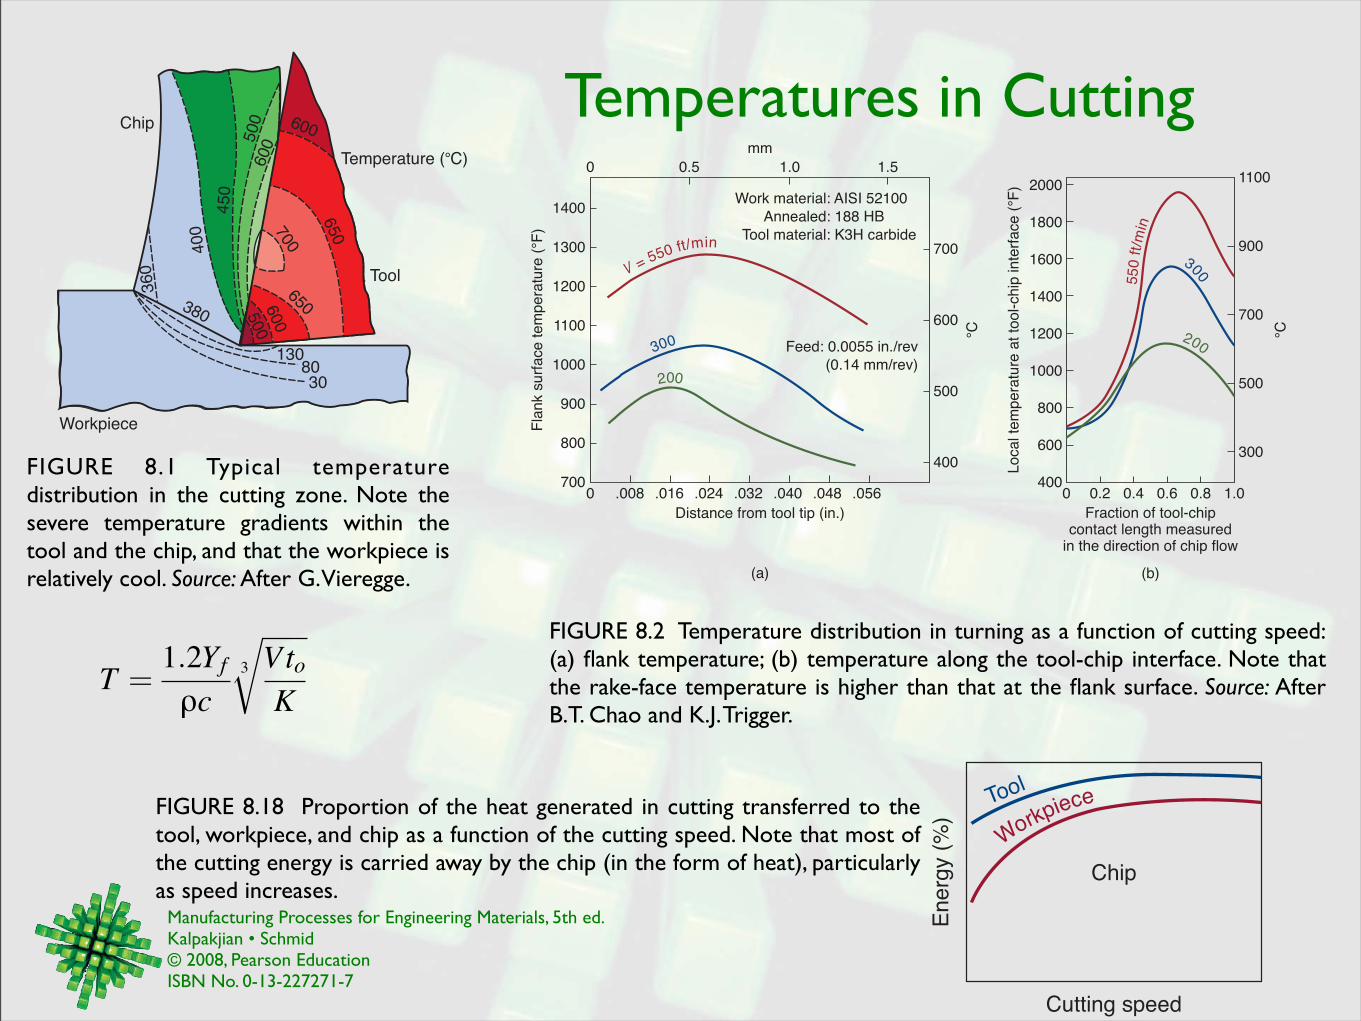
FIGURE 8.1 Typical temperature distribution in the cutting zone. Note the severe temperature gradients within the tool and the chip, and that the workpiece is relatively cool. Source: After G. Vieregge.
200
300
V = 550 ft/min
Work material: AISI 52100
Annealed: 188 HB
Tool material: K3H carbide
Feed: 0.0055 in./rev
(0.14 mm/rev)
0 0.5 1.0 1.5
mm
700
600
500
400
°C
0 .008 .016 .024 .032 .040 .048 .056
Distance from tool tip (in.)
1400
1300
1200
1100
1000
900
800
700
Fla
nk s
urf
ace
te
mp
era
ture
(°F
)
(a)
55
0 f
t/m
in
300
200
2000
1800
1600
1400
1200
1000
800
600
400
Lo
ca
l te
mp
era
ture
at
too
l-ch
ip in
terf
ace
(°F
)
0 0.2 0.4 0.6 0.8 1.0
Fraction of tool-chipcontact length measured
in the direction of chip flow
1100
900
700
500
300
°C
(b)
FIGURE 8.2 Temperature distribution in turning as a function of cutting speed: (a) flank temperature; (b) temperature along the tool-chip interface. Note that the rake-face temperature is higher than that at the flank surface. Source: After B.T. Chao and K.J. Trigger.
T =1.2Yfρc
3
√VtoK
FIGURE 8.18 Proportion of the heat generated in cutting transferred to the tool, workpiece, and chip as a function of the cutting speed. Note that most of the cutting energy is carried away by the chip (in the form of heat), particularly as speed increases.
Workpiece
Cutting speed
En
erg
y (
%)
Tool
Chip

Manufacturing Processes for Engineering Materials, 5th ed. Kalpakjian • Schmid© 2008, Pearson EducationISBN No. 0-13-227271-7
Terminology in Turning
FIGURE 8.19 Terminology used in a turning operation on a lathe, where f is the feed (in mm/rev or in./rev) and d is the depth of cut. Note that feed in turning is equivalent to the depth of cut in orthogonal cutting (see Fig. 8.2), and the depth of cut in turning is equivalent to the width of cut in orthogonal cutting. See also Fig. 8.42.
Depth of cut(mm or in.)
Feed(mm/rev or in./rev)
Tool
Chip
Manufacturing Processes for Engineering Materials, 5th ed. Kalpakjian • Schmid© 2008, Pearson EducationISBN No. 0-13-227271-7
Tool Wear
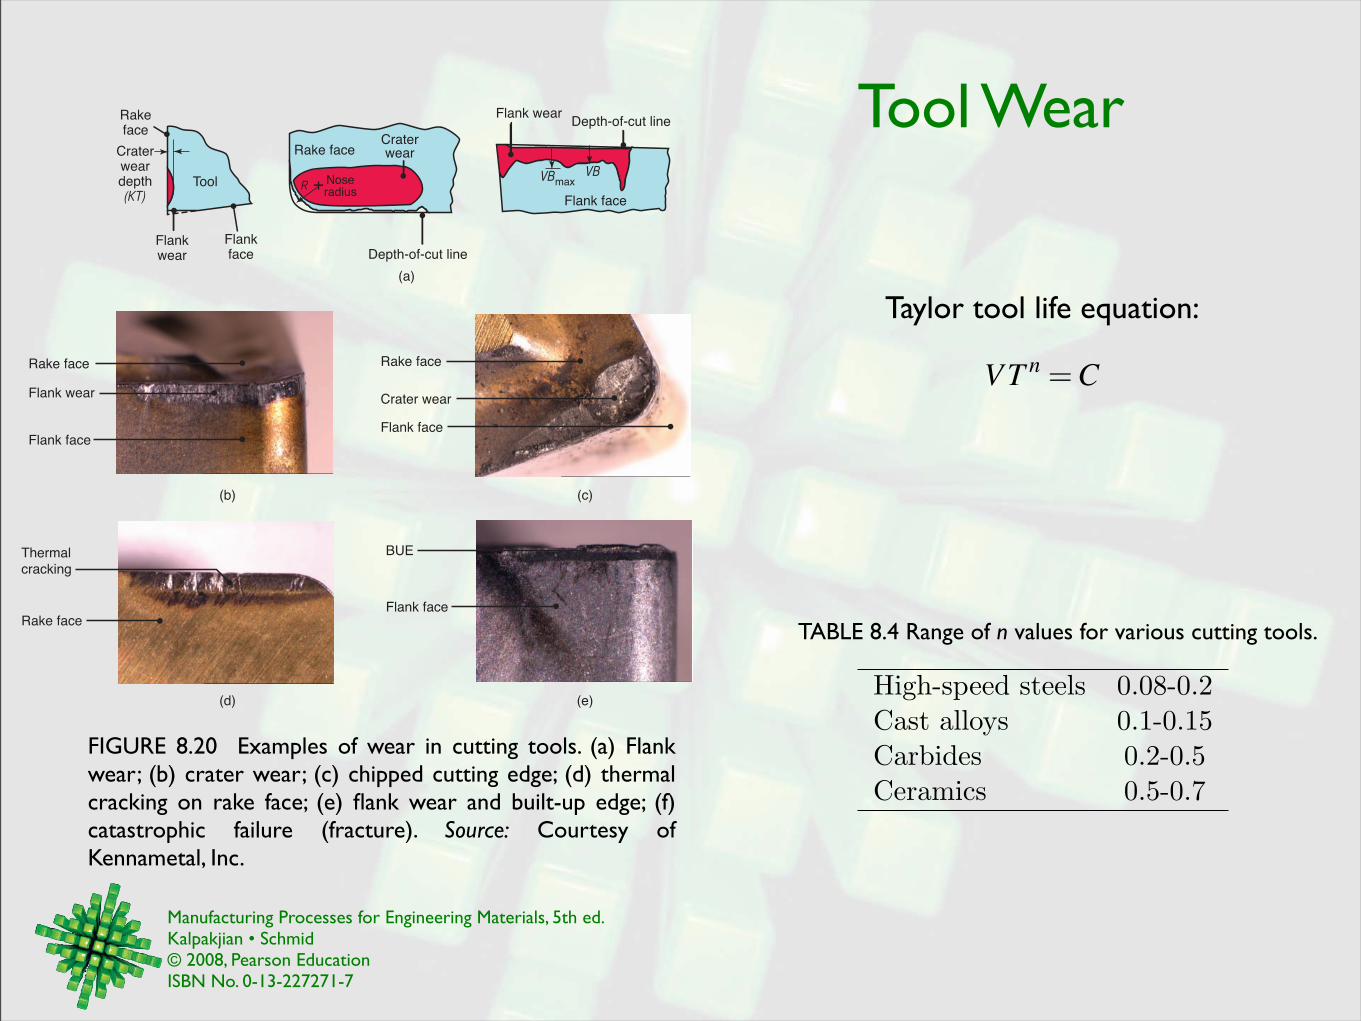
FIGURE 8.20 Examples of wear in cutting tools. (a) Flank wear; (b) crater wear; (c) chipped cutting edge; (d) thermal cracking on rake face; (e) flank wear and built-up edge; (f) catastrophic failure (fracture). Source: Courtesy of Kennametal, Inc.
Flank face
Rake face
Flank wear
Flank face
BUE
Rake face
Crater wear
Flank face
Rake face
Thermal
cracking
(b)
(d)
(c)
(e)
(a)
Rakeface
Craterweardepth(KT)
Flankwear
Flankface
Tool
Rake faceCraterwear
Depth-of-cut line
Noseradius
R
Flank wearDepth-of-cut line
VBmaxVB
Flank face
Taylor tool life equation:
VTn =C
High-speed steels 0.08-0.2Cast alloys 0.1-0.15Carbides 0.2-0.5Ceramics 0.5-0.7
TABLE 8.4 Range of n values for various cutting tools.
Manufacturing Processes for Engineering Materials, 5th ed. Kalpakjian • Schmid© 2008, Pearson EducationISBN No. 0-13-227271-7
Effect of Workpiece on Tool Life
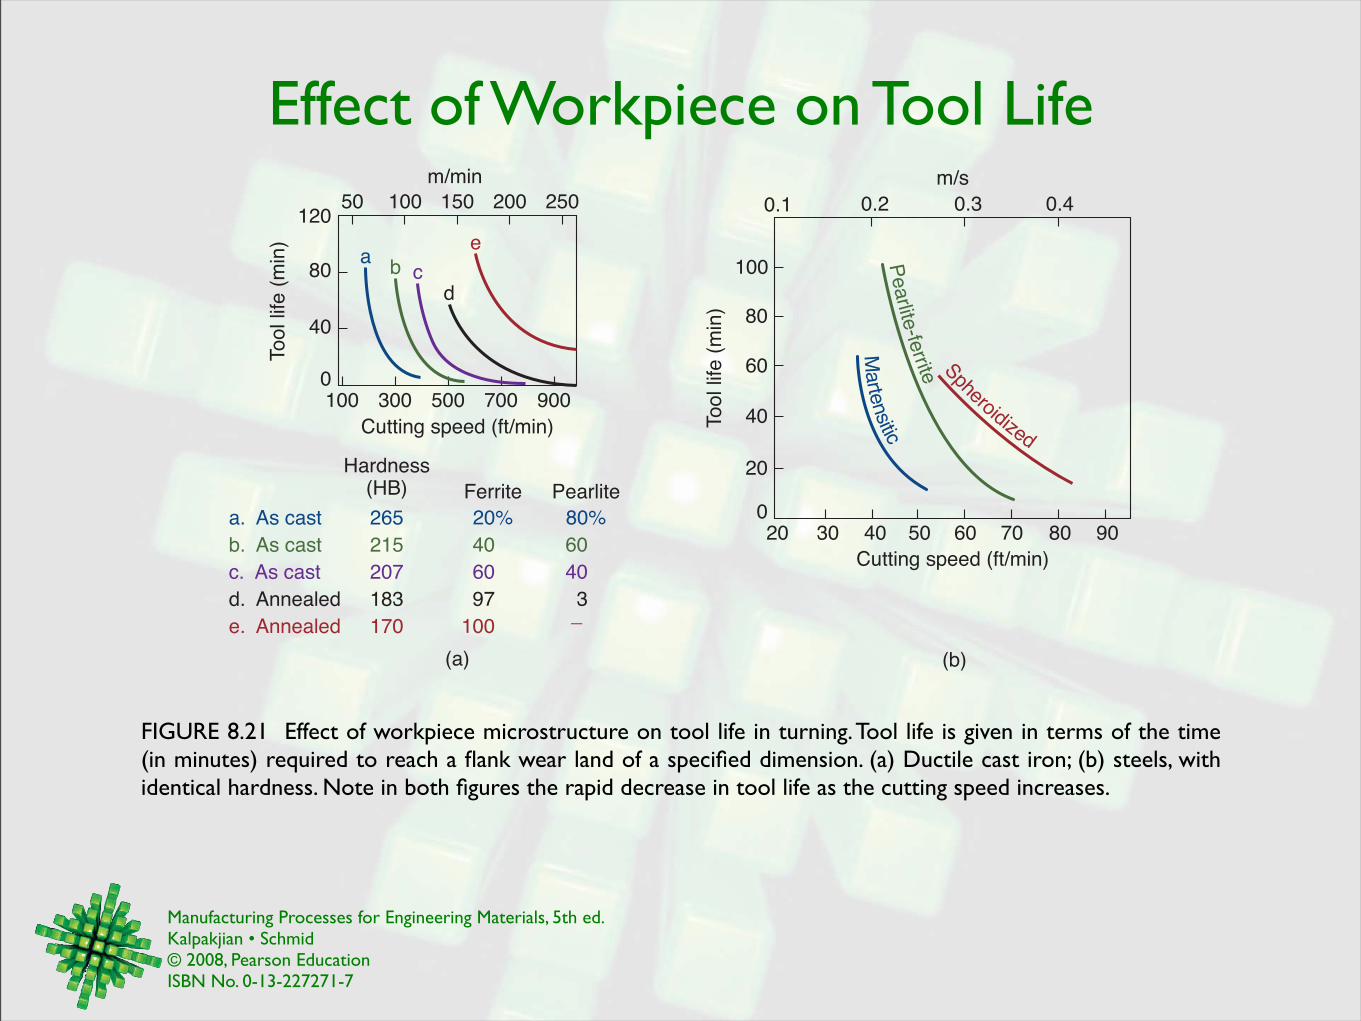
FIGURE 8.21 Effect of workpiece microstructure on tool life in turning. Tool life is given in terms of the time (in minutes) required to reach a flank wear land of a specified dimension. (a) Ductile cast iron; (b) steels, with identical hardness. Note in both figures the rapid decrease in tool life as the cutting speed increases.
Hardness(HB) Ferrite Pearlite
a. As cast
b. As cast
c. As cast
d. Annealed
e. Annealed
265
215
207
183
170
20%
40
60
97
100
80%
60
40
3_
50
100 300 500 700 900
100 150 200 250
0
40
80
120
m/min
Cutting speed (ft/min)
To
ol lif
e (
min
)a
b cd
e
(a)
Pearlite
-ferrite
Marte
nsitic
Spheroidized
0.1 0.2 0.3 0.4
m/s
(b)
100
80
60
40
20
0
To
ol lif
e (
min
)
20 30 40 50 60 70 80 90
Cutting speed (ft/min)

Manufacturing Processes for Engineering Materials, 5th ed. Kalpakjian • Schmid© 2008, Pearson EducationISBN No. 0-13-227271-7
Tool-Life Curves
FIGURE 8.22 (a) Tool-life curves for a variety of cutting-tool materials. The negative inverse of the slope of these curves is the exponent n in tool-life equations. (b) Relationship between measured temperature during cutting and tool life (flank wear). Note that high cutting temperatures severely reduce tool life. See also Eq. (8.30). Source: After H. Takeyama and Y. Murata.
300
50 300
m/min
3000
100
300
100
10
20
Tool lif
e (
min
)
5
110,00050001000
Cutting speed (ft/min)
n
Hig
h-s
peed s
teel
Cast a
lloy
Carb
ide
Ceram
ic
Feed constant,speed variable
Speed constant,feed variable
800 1000 1200 1400
°C
400200
100
6040
20
10
642
1
0.6
0.2
Tool lif
e (
min
)
1500 1800 2100 2400
Temperature (°F)
Work material: Heat-resistant alloyTool material: Tungsten carbideTool life criterion: 0.024 in. (0.6 mm) flank wear
(a) (b)

Manufacturing Processes for Engineering Materials, 5th ed. Kalpakjian • Schmid© 2008, Pearson EducationISBN No. 0-13-227271-7
Tool Wear
FIGURE 8.23 Relationship between crater-wear rate and average tool-chip interface temperature in turning: (a) high-speed-steel tool; (b) C1 carbide; (c) C5 carbide. Note that crater wear increases rapidly within a narrow range of temperature. Source: After K.J. Trigger and B.T. Chao.
Average tool-chip interfacetemperature (°F)
800 1200 1600 2000
0.15
0.3020
500 700 900 1100
10
0 0
°C
mm
3/m
in
Cra
ter
we
ar
rate
(in
3/m
in x
10-6
) a b c
Allowable Wear Land (mm)Operation High-Speed Steels CarbidesTurning 1.5 0.4Face milling 1.5 0.4End milling 0.3 0.3Drilling 0.4 0.4Reaming 0.15 0.15
TABLE 8.5 Allowable average wear lands for cutting tools in various operations.
Rake face
Crater wear
Chip Flank face
FIGURE 8.23 Interface of chip (left) and rake face of cutting tool (right) and crater wear in cutting AISI 1004 steel at 3 m/s (585 ft/min). Discoloration of the tool indicates the presence of high temperature (loss of temper). Note how the crater-wear pattern coincides with the discoloration pattern. Compare this pattern with the temperature distribution shown in Fig. 8.16. Source: Courtesy of P.K. Wright.

Manufacturing Processes for Engineering Materials, 5th ed. Kalpakjian • Schmid© 2008, Pearson EducationISBN No. 0-13-227271-7
Acoustic Emission and Wear
FIGURE 8.25 Relationship between mean flank wear, maximum crater wear, and acoustic emission (noise generated during cutting) as a function of machining time. This technique has been developed as a means for continuously and indirectly monitoring wear rate in various cutting processes without interrupting the operation. Source: After M.S. Lan and D.A. Dornfeld.
Crater wear
Flank wear
0.005
0.0040.003
0.002
0.0010
in. mm
0.15
0.1
0.05
0
Ma
xim
um
cra
ter
de
pth
Me
an
fla
nk w
ea
r
1.5
1.0
0.5
0
mm in.
Me
an
RM
S (
mV
)
0.0500.0400.0300.020
0.010
1500
1000
500
0
0 10 20 30 40 50 60
Elapsed machining time (min)

Manufacturing Processes for Engineering Materials, 5th ed. Kalpakjian • Schmid© 2008, Pearson EducationISBN No. 0-13-227271-7
Surface Finish
FIGURE 8.26 Range of surface roughnesses obtained in various machining processes. Note the wide range within each group, especially in turning and boring. (See also Fig. 9.27).
Flame cutting
Snagging (coarse grinding)
Sawing
Planing, shaping
Drilling
Chemical machining
Electrical-discharge machining
Milling
Broaching
Reaming
Electron-beam machining
Laser machining
Electrochemical machining
Turning, boring
Barrel finishing
Electrochemical grinding
Roller burnishing
Grinding
Honing
Electropolishing
Polishing
Lapping
Superfinishing
Process 2000 1000 500 250 125 63 32 16 8 4 2 1 0.550 25 12.5 6.3 3.2 1.6 0.8 0.40 0.20 0.10 0.05 0.025 0.012
Roughness (Ra)
µin.
µm
Average application
Less frequent application
Sand casting
Die casting
Hot rolling
Forging
Permanent mold casting
Investment casting
Extruding
Cold rolling, drawing
Rough cutting
Casting
Forming
Machining
Advanced machining
Finishing processes

Manufacturing Processes for Engineering Materials, 5th ed. Kalpakjian • Schmid© 2008, Pearson EducationISBN No. 0-13-227271-7
Surfaces in Machining
FIGURE 8.27 Surfaces produced on steel in machining, as observed with a scanning electron microscope: (a) turned surface, and (b) surface produced by shaping. Source: J.T. Black and S. Ramalingam.
(a) (b)
FIGURE 8.28 Schematic illustration of a dull tool in orthogonal cutting (exaggerated). Note that at small depths of cut, the rake angle can effectively become negative. In such cases, the tool may simply ride over the workpiece surface, burnishing it, instead of cutting.
Incre
asin
g d
epth
of cut
Workpiece Machinedsurface
Tool

Manufacturing Processes for Engineering Materials, 5th ed. Kalpakjian • Schmid© 2008, Pearson EducationISBN No. 0-13-227271-7
Inclusions in Free-Machining Steels
FIGURE 8.29 Photomicrographs showing various types of inclusions in low-carbon, resulfurized free-machining steels. (a) Manganese-sulfide inclusions in AISI 1215 steel. (b) Manganese-sulfide inclusions and glassy manganese-silicate-type oxide (dark) in AISI 1215 steel. (c) Manganese sulfide with lead particles as tails in AISI 12L14 steel. Source: Courtesy of Ispat Inland Inc.
(a) (b) (c)

Manufacturing Processes for Engineering Materials, 5th ed. Kalpakjian • Schmid© 2008, Pearson EducationISBN No. 0-13-227271-7
Hardness of Cutting Tools
FIGURE 8.30 Hardness of various cutting-tool materials as a function of temperature (hot hardness). The wide range in each group of tool materials results from the variety of compositions and treatments available for that group.
055
60
65
70
75
80
85
90
95100 300 500 700
200 400 600 800 1000 1200 1400
20
25
30
35
40
45
50
55
60
65
70
Ha
rdn
ess (
HR
A)
HR
C
Temperature (°F)
°C
Ceramics
Carbides
Hig
h-sp
eed ste
els
Cast alloys
Carbon too
l steels
Manufacturing Processes for Engineering Materials, 5th ed. Kalpakjian • Schmid© 2008, Pearson EducationISBN No. 0-13-227271-7
Tool Materials
CarbidesCubic Single
High-Speed Cast Boron CrystalProperty Steel Alloys WC TiC Ceramics Nitride Diamond!
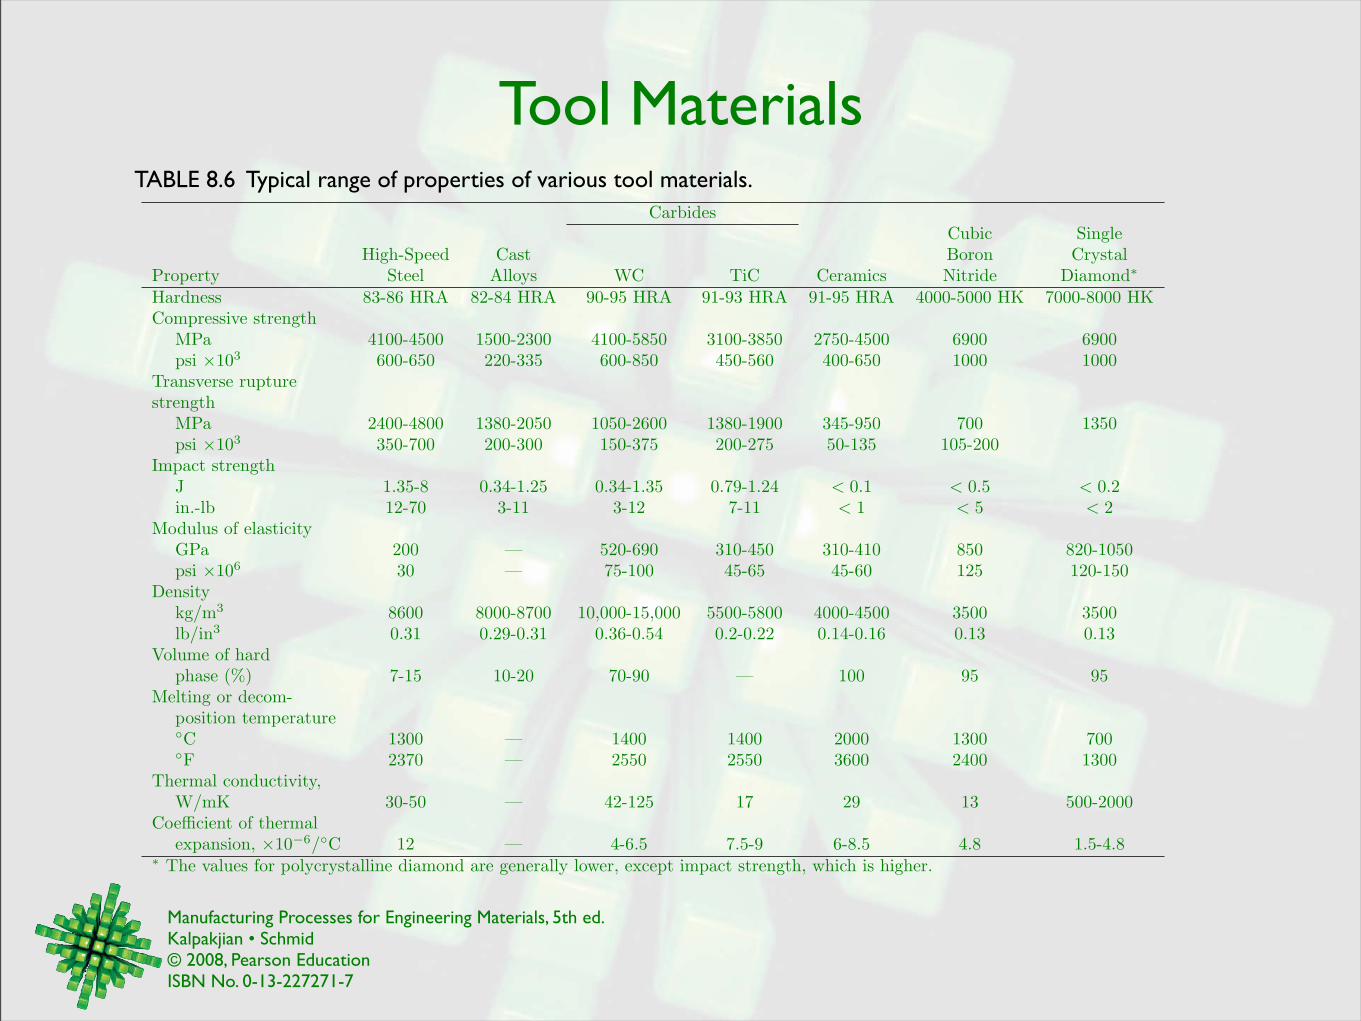
Hardness 83-86 HRA 82-84 HRA 90-95 HRA 91-93 HRA 91-95 HRA 4000-5000 HK 7000-8000 HKCompressive strength
MPa 4100-4500 1500-2300 4100-5850 3100-3850 2750-4500 6900 6900psi !103 600-650 220-335 600-850 450-560 400-650 1000 1000
Transverse rupturestrength
MPa 2400-4800 1380-2050 1050-2600 1380-1900 345-950 700 1350psi !103 350-700 200-300 150-375 200-275 50-135 105-200
Impact strengthJ 1.35-8 0.34-1.25 0.34-1.35 0.79-1.24 < 0.1 < 0.5 < 0.2in.-lb 12-70 3-11 3-12 7-11 < 1 < 5 < 2
Modulus of elasticityGPa 200 — 520-690 310-450 310-410 850 820-1050psi !106 30 — 75-100 45-65 45-60 125 120-150
Densitykg/m3 8600 8000-8700 10,000-15,000 5500-5800 4000-4500 3500 3500lb/in3 0.31 0.29-0.31 0.36-0.54 0.2-0.22 0.14-0.16 0.13 0.13
Volume of hardphase (%) 7-15 10-20 70-90 — 100 95 95
Melting or decom-position temperature"C 1300 — 1400 1400 2000 1300 700"F 2370 — 2550 2550 3600 2400 1300
Thermal conductivity,W/mK 30-50 — 42-125 17 29 13 500-2000
Coe!cient of thermalexpansion, !10#6/"C 12 — 4-6.5 7.5-9 6-8.5 4.8 1.5-4.8
! The values for polycrystalline diamond are generally lower, except impact strength, which is higher.
TABLE 8.6 Typical range of properties of various tool materials.

Manufacturing Processes for Engineering Materials, 5th ed. Kalpakjian • Schmid© 2008, Pearson EducationISBN No. 0-13-227271-7
Properties of Tungsten-Carbide Tools
FIGURE 8.31 Effect of cobalt content in tungsten-carbide tools on mechanical properties. Note that hardness is directly related to compressive strength (see Section 2.6.8) and hence, inversely to wear [see Eq. (4.6)].
We
ar
(mg
), c
om
pre
ssiv
e a
nd
tra
nsve
rse
-
rup
ture
str
en
gth
(kg
/mm
2)
Cobalt content (% by weight)
Vic
ke
rs h
ard
ne
ss (
HV
)
600
500
400
300
200
100
00 5 10 15 20 25 30
1750
1500
1250
1000
750
500
HRA 92.4
90.5
88.5
85.7
Compressive strengthHardness
Wear
Transverse-rupture strength

Manufacturing Processes for Engineering Materials, 5th ed. Kalpakjian • Schmid© 2008, Pearson EducationISBN No. 0-13-227271-7
Inserts
FIGURE 8.32 Methods of mounting inserts on toolholders: (a) clamping, and (b) wing lockpins. (c) Examples of inserts mounted using threadless lockpins, which are secured with side screws. Source: Courtesy of Valenite.
(c)(b)
Shank
Seat
Lockpin
Insert
(a)
Insert
Clamp
Clampscrew
Seator shim
Toolholder

Manufacturing Processes for Engineering Materials, 5th ed. Kalpakjian • Schmid© 2008, Pearson EducationISBN No. 0-13-227271-7
Insert Strength
FIGURE 8.33 Relative edge strength and tendency for chipping and breaking of inserts with various shapes. Strength refers to that of the cutting edge shown by the included angles. Source: Courtesy of Kennametal, Inc.
90°100° 80° 60° 55° 35°
Increasing strength
Increased chipping and breaking
FIGURE 8.34 Edge preparations for inserts to improve edge strength. Source: Courtesy of Kennametal, Inc.
Ne
ga
tive
with
la
nd
an
d h
on
e
Ne
ga
tive
with
la
nd
Ne
ga
tive
ho
ne
d
Ne
ga
tive
sh
arp
Po
sitiv
ew
ith
ho
ne
Po
sitiv
esh
arp
Increasing edge strength

Manufacturing Processes for Engineering Materials, 5th ed. Kalpakjian • Schmid© 2008, Pearson EducationISBN No. 0-13-227271-7
Historical Tool Improvement
FIGURE 8.35 Relative time required to machine with various cutting-tool materials, with indication of the year the tool materials were introduced. Note that, within one century, machining time has been reduced by two orders of magnitude. Source: After Sandvik Coromant.
Carbon steel
High-speed steel
Cast cobalt-based alloys
Cemented carbides
Improved carbide grades
First coated grades
First double-coated grades
First triple-coated grades
1900 !10 !20 !30 !40 !50 !60 !70 !80 !90
100
26
15
6
3
1.5
10.7
Ma
ch
inin
g t
ime
(m
in)
Year
!00
0.5 Functionally graded triple-coated

Manufacturing Processes for Engineering Materials, 5th ed. Kalpakjian • Schmid© 2008, Pearson EducationISBN No. 0-13-227271-7
Coated Tools
FIGURE 8.36 Wear patterns on high-speed-steel uncoated and titanium-nitride-coated cutting tools. Note that flank wear is lower for the coated tool.
TiN coated
Uncoated
Flank wear
Rake
face
Tool
FIGURE 8.37 Multiphase coatings on a tungsten-carbide substrate. Three alternating layers of aluminum oxide are separated by very thin layers of titanium nitride. Inserts with as many as 13 layers of coatings have been made. Coating thicknesses are typically in the range of 2 to 10 µm. Source: Courtesy of Kennametal, Inc.
TiN
TiN
TiN
TiC + TiN
TiC + TiN
Carbide substrate
Al2O3
Al2O3
Al2O3

Manufacturing Processes for Engineering Materials, 5th ed. Kalpakjian • Schmid© 2008, Pearson EducationISBN No. 0-13-227271-7
Properties of Cutting Tool Materials
FIGURE 8.38 Ranges of properties for various groups of cutting-tool materials. (See also Tables 8.1 through 8.5.)
Hot hard
ness a
nd w
ear
resis
tance
Strength and toughness
Diamond, cubic boron nitride
Aluminum oxide (HIP)
Aluminum oxide + 30% titanium carbide
Silicon nitride
Cermets
Coated carbides
Carbides
HSS
FIGURE 8.39 Construction of polycrystalline cubic-boron-nitride or diamond layer on a tungsten-carbide insert.
Braze
Polycrystalline cubic boron nitride or diamond layer
Carbide substrate
Tungsten-carbide insert
Manufacturing Processes for Engineering Materials, 5th ed. Kalpakjian • Schmid© 2008, Pearson EducationISBN No. 0-13-227271-7
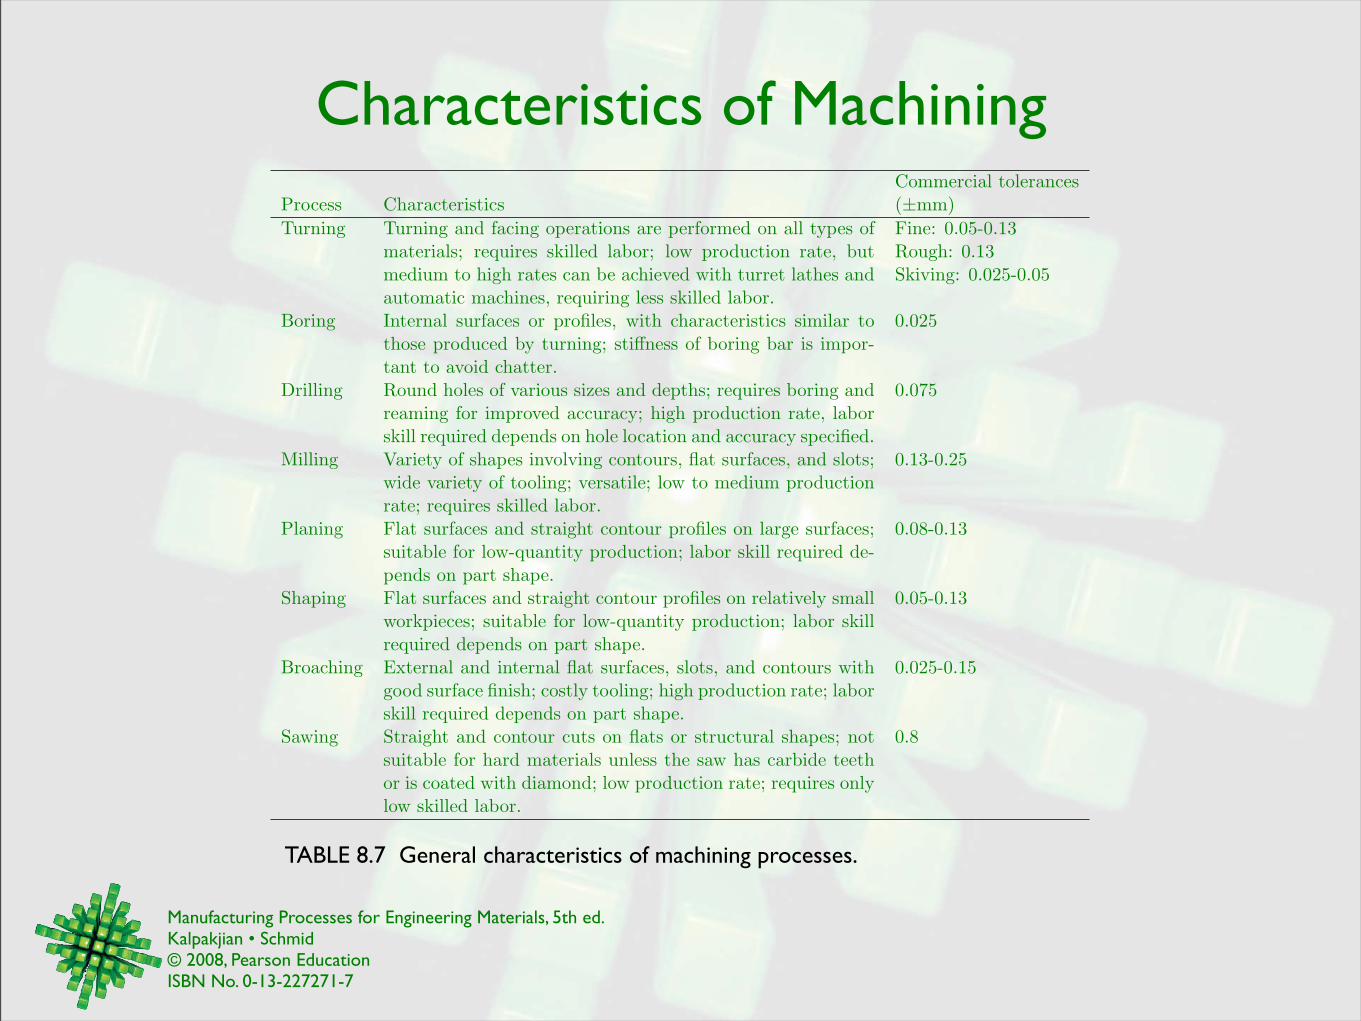
Characteristics of MachiningCommercial tolerances
Process Characteristics (±mm)Turning Turning and facing operations are performed on all types of
materials; requires skilled labor; low production rate, butmedium to high rates can be achieved with turret lathes andautomatic machines, requiring less skilled labor.
Fine: 0.05-0.13Rough: 0.13Skiving: 0.025-0.05
Boring Internal surfaces or profiles, with characteristics similar tothose produced by turning; sti!ness of boring bar is impor-tant to avoid chatter.
0.025
Drilling Round holes of various sizes and depths; requires boring andreaming for improved accuracy; high production rate, laborskill required depends on hole location and accuracy specified.
0.075
Milling Variety of shapes involving contours, flat surfaces, and slots;wide variety of tooling; versatile; low to medium productionrate; requires skilled labor.
0.13-0.25
Planing Flat surfaces and straight contour profiles on large surfaces;suitable for low-quantity production; labor skill required de-pends on part shape.
0.08-0.13
Shaping Flat surfaces and straight contour profiles on relatively smallworkpieces; suitable for low-quantity production; labor skillrequired depends on part shape.
0.05-0.13
Broaching External and internal flat surfaces, slots, and contours withgood surface finish; costly tooling; high production rate; laborskill required depends on part shape.
0.025-0.15
Sawing Straight and contour cuts on flats or structural shapes; notsuitable for hard materials unless the saw has carbide teethor is coated with diamond; low production rate; requires onlylow skilled labor.
0.8
TABLE 8.7 General characteristics of machining processes.

Manufacturing Processes for Engineering Materials, 5th ed. Kalpakjian • Schmid© 2008, Pearson EducationISBN No. 0-13-227271-7
Lathe Operations
FIGURE 8.40 Variety of machining operations that can be performed on a lathe.
Depth
of cut
ToolFeed, f
(a) Straight turning
(g) Cutting with
a form tool
(e) Facing
(b) Taper turning (c) Profiling
(k) Threading
(d) Turning and
external grooving
(f) Face grooving
(h) Boring and
internal grooving
(i) Drilling
(j) Cutting off (l) Knurling
Workpiece

Manufacturing Processes for Engineering Materials, 5th ed. Kalpakjian • Schmid© 2008, Pearson EducationISBN No. 0-13-227271-7
Tool Angles
FIGURE 8.41 Designations and symbols for a right-hand cutting tool. The designation “right hand” means that the tool travels from right to left, as shown in Fig. 8.19.
High-speed steel Carbide insertsMaterial Back Side End Side Side and end Back Side End Side Side and end
rake rake relief relief cutting edge rake rake relief relief cutting edgeAluminum and
magnesium alloys 20 15 12 10 5 0 5 5 5 15Copper alloys 5 10 8 8 5 0 5 5 5 15Steels 10 12 5 5 15 -5 -5 5 5 15Stainless steels 5 8-10 5 5 15 -5-0 -5-5 5 5 15High-temperature 0 10 5 5 15 5 0 5 5 45
alloysRefractory alloys 0 20 5 5 5 0 0 5 5 15Titanium alloys 0 5 5 5 15 -5 -5 5 5 5Cast irons 5 10 5 5 15 -5 -5 5 5 15Thermoplastics 0 0 20-30 15-20 10 0 0 20-30 15-20 10Thermosets 0 0 20-30 15-20 10 0 15 5 5 15
(a) End view (b) Side view
Shank
Flank face
Back rakeangle (BRA)
End reliefangle (ERA)
Wedgeangle
Side rakeangle (RA)
Side reliefangle (SRA)
(c) Top view
Rake face
End cutting-edgeangle (ECEA)
Side cutting-edgeangle (SCEA)
Noseangle
Noseradius
TA B L E 8 . 8 G e n e r a l recommendations for tool angles in turning.
Manufacturing Processes for Engineering Materials, 5th ed. Kalpakjian • Schmid© 2008, Pearson EducationISBN No. 0-13-227271-7
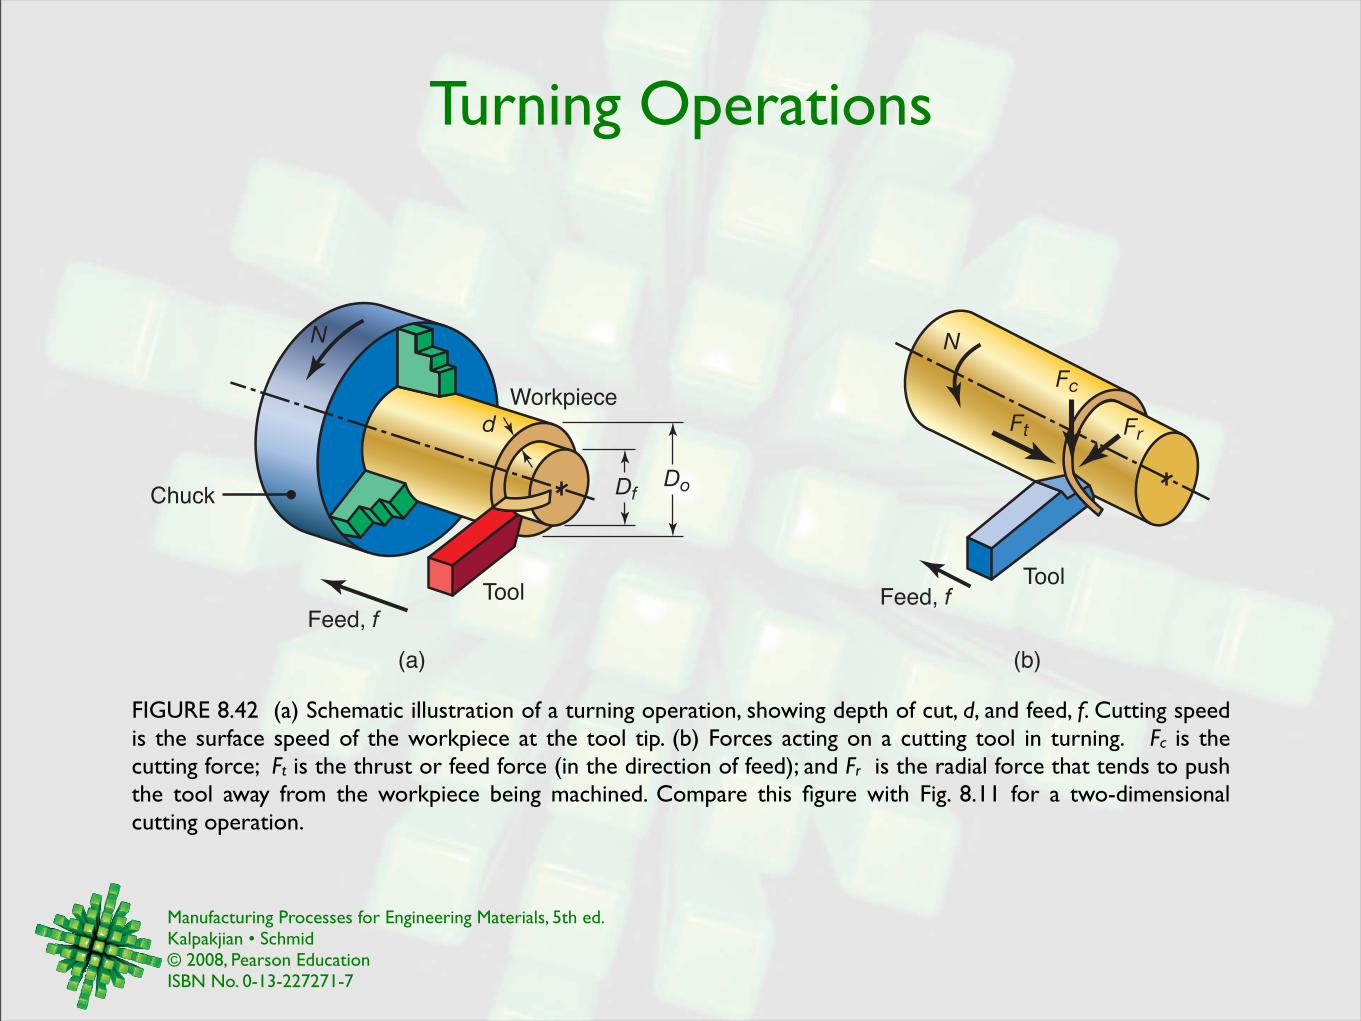
Turning Operations
FIGURE 8.42 (a) Schematic illustration of a turning operation, showing depth of cut, d, and feed, f. Cutting speed is the surface speed of the workpiece at the tool tip. (b) Forces acting on a cutting tool in turning. Fc is the cutting force; Ft is the thrust or feed force (in the direction of feed); and Fr is the radial force that tends to push the tool away from the workpiece being machined. Compare this figure with Fig. 8.11 for a two-dimensional cutting operation.
(a) (b)
d
DoDf
Workpiece
N
Chuck
Tool
Feed, f
ToolFeed, f
N
Fc
Ft Fr

Manufacturing Processes for Engineering Materials, 5th ed. Kalpakjian • Schmid© 2008, Pearson EducationISBN No. 0-13-227271-7
Cutting Speeds for Turning
FIGURE 8.43 The range of applicable cutting speeds and feeds for a variety of cutting-tool materials.
Cubic boron nitride,diamond, andceramics
Cermets
Coatedcarbides
Uncoatedcarbides
3000
2000
1000
500
300
200
Cu
ttin
g s
pe
ed
(ft
/min
)
0.004 0.008 0.012 0.020 0.030
Feed (in./rev)
0.10 0.20 0.30 0.50 0.75
mm/rev
900
600
300
150
100
50
m/m
in
Cutting SpeedWorkpiece Material m/min ft/minAluminum alloys 200-1000 650-3300Cast iron, gray 60-900 200-3000Copper alloys 50-700 160-2300High-temperature alloys 20-400 65-1300Steels 50-500 160-1600Stainless steels 50-300 160-1000Thermoplastics and thermosets 90-240 300-800Titanium alloys 10-100 30-330Tungsten alloys 60-150 200-500Note: (a) The speeds given in this table are for carbides and ce-ramic cutting tools. Speeds for high-speed-steel tools are lowerthan indicated. The higher ranges are for coated carbides and cer-mets. Speeds for diamond tools are significantly higher than anyof the values indicated in the table.(b) Depths of cut, d, are generally in the range of 0.5-12 mm (0.02-0.5 in.).(c) Feeds, f , are generally in the range of 0.15-1 mm/rev (0.006-0.040 in./rev).
TABLE 8.9 Approximate Ranges of Recommended Cutting Speeds for Turning Operations

Manufacturing Processes for Engineering Materials, 5th ed. Kalpakjian • Schmid© 2008, Pearson EducationISBN No. 0-13-227271-7
Lathe
FIGURE 8.44 General view of a typical lathe, showing various major components. Source: Courtesy of Heidenreich & Harbeck.
Spindle speedselector
Headstock assembly
Spindle (with chuck)
Tool post
Compoundrest
Cross slide
Carriage
Ways
Dead center
Tailstock quill
Tailstockassembly
Handwheel
BedFeed selector
Clutch
Chip pan
Apron
Split nut
Clutch
Longitudinal &transverse feedcontrol
Feed rod
Lead screw

Manufacturing Processes for Engineering Materials, 5th ed. Kalpakjian • Schmid© 2008, Pearson EducationISBN No. 0-13-227271-7
CNC Lathe
FIGURE 8.45 (a) A computer-numerical-control lathe, with two turrets; these machines have higher power and spindle speed than other lathes in order to take advantage of advanced cutting tools with enhanced properties; (b) a typical turret equipped with ten cutting tools, some of which are powered.
DrillMultitooth
cutter
Tool forturning
or boring
Reamer
Individualmotors
Drill
Round turret forOD operationsCNC unit Chuck
End turret for ID operations Tailstock
(a) (b)

Manufacturing Processes for Engineering Materials, 5th ed. Kalpakjian • Schmid© 2008, Pearson EducationISBN No. 0-13-227271-7
Typical CNC Parts
FIGURE 8.46 Typical parts made on computer-numerical-control machine tools.
(a) Housing base
Material: Titanium alloyNumber of tools: 7Total machining time(two operations):5.25 minutes
Material: 52100 alloy steelNumber of tools: 4Total machining time(two operations):6.32 minutes
(c) Tube reducer
Material: 1020 Carbon SteelNumber of tools: 8Total machining time(two operations):5.41 minutes
(b) Inner bearing race
67.4 mm(2.654")
87.9 mm(3.462")
98.4 mm(3.876")
85.7 mm (3.375")32 threads per in.
235.6 mm(9.275")
78.5 mm(3.092")
50.8 mm(2")
23.8 mm(0.938")
53.2 mm(2.094")

Manufacturing Processes for Engineering Materials, 5th ed. Kalpakjian • Schmid© 2008, Pearson EducationISBN No. 0-13-227271-7
Typical Production Rates
Operation RateTurning
Engine lathe Very low to lowTracer lathe Low to mediumTurret lathe Low to mediumComputer-control lathe Low to mediumSingle-spindle chuckers Medium to highMultiple-spindle chuckers High to very high
Boring Very lowDrilling Low to mediumMilling Low to mediumPlaning Very lowGear cutting Low to mediumBroaching Medium to highSawing Very low to lowNote: Production rates indicated are relative: Very low is aboutone or more parts per hour; medium is approximately 100 partsper hour; very high is 1000 or more parts per hour.
TABLE 8.10 Typical production rates for various cutting operations.

Manufacturing Processes for Engineering Materials, 5th ed. Kalpakjian • Schmid© 2008, Pearson EducationISBN No. 0-13-227271-7
Boring Mill
FIGURE 8.47 Schematic illustration of the components of a vertical boring mill.
Cross-rail
Tool head
Workpiece
Work table
Bed
Column

Manufacturing Processes for Engineering Materials, 5th ed. Kalpakjian • Schmid© 2008, Pearson EducationISBN No. 0-13-227271-7
DrillsFIGURE 8.48 Two common types of drills: (a) Chisel-point drill. The function of the pair of margins is to provide a bearing surface for the drill against walls of the hole as it penetrates into the workpiece. Drills with four margins (double-margin) are available for improved drill guidance and accuracy. Drills with chip-breaker features are also available. (b) Crankshaft drills. These drills have good centering ability, and because chips tend to break up easily, they are suitable for producing deep holes.
(a) Chisel-point drill
Tang drive
Shank diameter
Straight shank
Neck
Overall length
Flute length
Body
Point angle
Lip-relief angle
Chisel-edge angle
Chisel edge
Drill diameter
Body diameter clearance
Clearance diameter
(b) Crankshaft-point drill
Lip
Margin
Land
Flutes Helix angle
Shank length
Web
Tang Taper shank
Drilli
ng
Co
re d
rilli
ng
Ste
p d
rilli
ng
Co
un
terb
orin
g
Co
un
ters
inkin
g
Re
am
ing
Ce
nte
r d
rilli
ng
Gu
n d
rilli
ng
High-pressure coolant
FIGURE 8.49 Various types of drills and drilling operations.

Manufacturing Processes for Engineering Materials, 5th ed. Kalpakjian • Schmid© 2008, Pearson EducationISBN No. 0-13-227271-7
Speeds and Feeds in Drilling
Surface Feed, mm/rev (in./rev) Spindle speed (rpm)Speed Drill Diameter Drill Diameter
Workpiece 1.5 mm 12.5 mm 1.5 mm 12.5 mmMaterial m/min ft/min (0.060 in.) (0.5 in.) (0.060 in.) (0.5 in.)Aluminum alloys 30-120 100-400 0.025 (0.001) 0.30 (0.012) 6400-25,000 800-3000Magnesium alloys 45-120 150-400 0.025 (0.001) 0.30 (0.012) 9600-25,000 1100-3000Copper alloys 15-60 50-200 0.025 (0.001) 0.25 (0.010) 3200-12,000 400-1500Steels 20-30 60-100 0.025 (0.001) 0.30 (0.012) 4300-6400 500-800Stainless steels 10-20 40-60 0.025 (0.001) 0.18 (0.007) 2100-4300 250-500Titanium alloys 6-20 20-60 0.010 (0.0004) 0.15 (0.006) 1300-4300 150-500Cast irons 20-60 60-200 0.025 (0.001) 0.30 (0.012) 4300-12,000 500-1500Thermoplastics 30-60 100-200 0.025 (0.001) 0.13 (0.005) 6400-12,000 800-1500Thermosets 20-60 60-200 0.025 (0.001) 0.10 (0.004) 4300-12,000 500-1500Note: As hole depth increases, speeds and feeds should be reduced. Selection of speeds andfeeds also depends on the specific surface finish required.
TABLE 8.11 General recommendations for speeds and feeds in drilling.

Manufacturing Processes for Engineering Materials, 5th ed. Kalpakjian • Schmid© 2008, Pearson EducationISBN No. 0-13-227271-7
Reamers and Taps
FIGURE 8.50 Terminology for a helical reamer.
Chamfer angle Chamfer length
Chamfer relief
Helix angle, -Primary
relief angle
Margin width
Land width
Radial rake
FIGURE 8.51 (a) Terminology for a tap; (b) illustration of tapping of steel nuts in high production.
(b)
Rake angle
Hook angle
(a)
Tap
NutLand
Chamferrelief
Flute
Cutting edge
Heel
Chamferangle

Manufacturing Processes for Engineering Materials, 5th ed. Kalpakjian • Schmid© 2008, Pearson EducationISBN No. 0-13-227271-7
Typical Machined Parts
FIGURE 8.52 Typical parts and shapes produced by the machining processes described in Section 8.10.
(a) (b) (c)
(d) (e) (f)
Drilled and tapped holes
Stepped cavity

Manufacturing Processes for Engineering Materials, 5th ed. Kalpakjian • Schmid© 2008, Pearson EducationISBN No. 0-13-227271-7
Conventional and Climb Milling
(a) (b) (c)
Workpiece
Conventionalmilling
Climbmilling
d
N
D
f
tc
d
v
Cutter
D
v
llc
Workpiece
Cutter
FIGURE 8.53 (a) Illustration showing the difference between conventional milling and climb milling. (b) Slab-milling operation, showing depth of cut, d; feed per tooth, f; chip depth of cut, tc and workpiece speed, v. (c) Schematic illustration of cutter travel distance, lc, to reach full depth of cut.

Manufacturing Processes for Engineering Materials, 5th ed. Kalpakjian • Schmid© 2008, Pearson EducationISBN No. 0-13-227271-7
Face Milling
f
w
v
lc
lc
l
Workpiece
D
Cutter
(b)
f
v
(c)(a)
Insert
(d)
l
d
w
v
Machined surface
Workpiece
Cutter
FIGURE 8.54 Face-milling operation showing (a) action of an insert in face milling; (b) climb milling; (c) conventional milling; (d) dimensions in face milling.
Peripheral relief(radial relief)
Radialrake, 2
Axial rake, 1
End cutting-edge angle
Cornerangle
End relief(axial relief)
FIGURE 8.55 Terminology for a face-milling cutter.

Manufacturing Processes for Engineering Materials, 5th ed. Kalpakjian • Schmid© 2008, Pearson EducationISBN No. 0-13-227271-7
Cutting Mechanics
Insert
Undeformed chip thickness
Depth of cut, d
Leadangle
f
Feed per tooth, f
(a) (b)
FIGURE 8.56 The effect of lead angle on the undeformed chip thickness in face milling. Note that as the lead angle increases, the undeformed chip thickness (and hence the thickness of the chip) decreases, but the length of contact (and hence the width of the chip) increases. Note that the insert must be sufficiently large to accommodate the increase in contact length.
(b)
Exit
Entry
Re-entry
Exit
(a)
Cutter
Workpiece
(c)
Cutter
Desirable
Milledsurface
+ -
Undesirable
FIGURE 8.57 (a) Relative position of the cutter and the insert as it first engages the workpiece in face milling, (b) insert positions at entry and exit near the end of cut, and (c) examples of exit angles of the insert, showing desirable (positive or negative angle) and undesirable (zero angle) positions. In all figures, the cutter spindle is perpendicular to the page.

Manufacturing Processes for Engineering Materials, 5th ed. Kalpakjian • Schmid© 2008, Pearson EducationISBN No. 0-13-227271-7
Milling Operations
(a) Straddle milling (b) Form milling
Arbor
(c) Slotting (d) Slitting
FIGURE 8.58 Cutters for (a) straddle milling; (b) form milling; (c) slotting; and (d) slitting operations.
Cutting SpeedWorkpiece Material m/min ft/minAluminum alloys 300-3000 1000-10,000Cast iron, gray 90-1300 300-4200Copper alloys 90-1000 300-3300High-temperature alloys 30-550 100-1800Steels 60-450 200-1500Stainless steels 90-500 300-1600Thermoplastics and thermosets 90-1400 300-4500Titanium alloys 40-150 130-500Note: (a) These speeds are for carbides, ceramic, cermets, and diamond cuttingtools. Speeds for high-speed-steel tools are lower than those indicated in this table.(b) Depths of cut, d, are generally in the range of 1-8 mm (0.04-0.3 in.).(c) Feeds per tooth, f , are generally in the range of 0.08-0.46 mm/rev (0.003-0.018in./rev).
TABLE 8.12 Approximate range of recommended cutting speeds for milling operations.

Manufacturing Processes for Engineering Materials, 5th ed. Kalpakjian • Schmid© 2008, Pearson EducationISBN No. 0-13-227271-7
Milling Machines
(a) (b)
Work table Head
Column
Base
Workpiece
Saddle
Knee
Overarm
Arbor
Column
Workpiece
Work table
Saddle
Knee
Base
T-slots T-slots
FIGURE 8.59 (a) Schematic illustration of a horizontal-spindle column-and-knee-type milling machine. (b) Schematic illustration of a vertical-spindle column-and-knee-type milling machine. Source: After G. Boothroyd.

Manufacturing Processes for Engineering Materials, 5th ed. Kalpakjian • Schmid© 2008, Pearson EducationISBN No. 0-13-227271-7
Broaching
(a)
(b) (c)
FIGURE 8.60 (a) Typical parts finished by internal broaching. (b) Parts finished by surface broaching. The heavy lines indicate broached surfaces; (c) a vertical broaching machine. Source: (a) and (b) Courtesy of General Broach and Engineering Company, (c) Courtesy of Ty Miles, Inc.

Manufacturing Processes for Engineering Materials, 5th ed. Kalpakjian • Schmid© 2008, Pearson EducationISBN No. 0-13-227271-7
Broaches
(b)
Root radius
Pitch
LandRake orhook angle
Toothdepth
Backoff orclearance angle
(a)
Cut pertooth
Chip gullet
Workpiece
FIGURE 8.61 (a) Cutting action of a broach, showing various features. (b) Terminology for a broach.
Pull end
Root diameter
Follower diameter
Overall length
Shank length
Front pilot
Roughening teeth
Cutting teeth
Semifinishing teeth
Rear pilot
Finishing teeth
FIGURE 8.62 Terminology for a pull-type internal broach, typically used for enlarging long holes.

Manufacturing Processes for Engineering Materials, 5th ed. Kalpakjian • Schmid© 2008, Pearson EducationISBN No. 0-13-227271-7
Saws and Saw Teeth
(a) (b)
Straight tooth
Raker tooth
Wave tooth
Tooth set
Width
Back edge
Tooth spacing
Tooth face
Tooth back (flank)
Tooth back clearance angle
Tooth rake angle (positive)
Gullet depth
FIGURE 8.63 (a) Terminology for saw teeth. (b) Types of saw teeth, staggered to provide clearance for the saw blade to prevent binding during sawing.
M2 HSS 64-66 HRC
Electron-beam weld
(a) (b)
Carbideinsert
Flexible alloy-steelbacking
FIGURE 8.64 (a) High-speed-steel teeth welded on a steel blade. (b) Carbide inserts brazed to blade teeth.

Manufacturing Processes for Engineering Materials, 5th ed. Kalpakjian • Schmid© 2008, Pearson EducationISBN No. 0-13-227271-7
Gear Manufacture
(b)(a)
(c) (d)
Top view
Gearblank
Hob
Gear blank
Hob
Rack-shaped cutter
Gear blank
Gear cutter Base circle
Gear blank
Pitch circle
Pitch circle
Base circle
Gearteeth
Pinion-shaped cutter
Gear blank
Spacer
Cutter spindle
FIGURE 8.65 (a) Schematic illustration of gear generating with a pinion-shaped gear cutter. (b) Schematic illustration of gear generating in a gear shaper, using a pinion-shaped cutter; note that the cutter reciprocates vertically. (c) Gear generating with a rack-shaped cutter. (d) Three views of gear cutting with a hob. Source: After E.P. DeGarmo.

Manufacturing Processes for Engineering Materials, 5th ed. Kalpakjian • Schmid© 2008, Pearson EducationISBN No. 0-13-227271-7
Machining Centers
Tools (cutters)
Index table
Tool storageTool-interchange arm
Traveling column
Spindle
Pallets
Bed
Spindle carrier
Computernumerical-control panel
FIGURE 8.67 Schematic illustration of a computer numerical-controlled turning center. Note that the machine has two spindle heads and three turret heads, making the machine tool very flexible in its capabilities. Source: Courtesy of Hitachi Seiki Co., Ltd.
1st Spindle head
2nd Turret head
1st Turret head
2nd Spindle head
3rd Turret head
FIGURE 8.66 A horizontal-spindle machining center, equipped with an automatic tool changer. Tool magazines in such machines can store as many as 200 cutting tools, each with its own holder. Source: Courtesy of Cincinnati Machine.

Manufacturing Processes for Engineering Materials, 5th ed. Kalpakjian • Schmid© 2008, Pearson EducationISBN No. 0-13-227271-7
Reconfigurable Machines
Magazine unit
Arm unit
Rotational motion
Arm unitBase unitBed unit
Linear motionLinear motion
Functional unit
Rotationalmotion
FIGURE 8.68 Schematic illustration of a reconfigurable modular machining center, capable of accommodating workpieces of different shapes and sizes, and requiring different machining operations on their various surfaces. Source: After Y. Koren.

Manufacturing Processes for Engineering Materials, 5th ed. Kalpakjian • Schmid© 2008, Pearson EducationISBN No. 0-13-227271-7
Reconfigurable Machining Center
(a) (b) (c)
FIGURE 8.69 Schematic illustration of assembly of different components of a reconfigurable machining center. Source: After Y. Koren.

Manufacturing Processes for Engineering Materials, 5th ed. Kalpakjian • Schmid© 2008, Pearson EducationISBN No. 0-13-227271-7
Machining of Bearing Races
1. Finish turning of outside diameter
2. Boring and grooving on outside diameter
3. Internal grooving with a radius-form tool
4. Finish boring of internal groove and rough boring of internal diameter
5. Internal grooving with form tool and chamfering
6. Cutting off finished part; inclined bar picks up bearing race
Tube
Bearingrace
Formtool
Form tool
FIGURE 8.70 Sequences involved in machining outer bearing races on a turning center.

Manufacturing Processes for Engineering Materials, 5th ed. Kalpakjian • Schmid© 2008, Pearson EducationISBN No. 0-13-227271-7
Hexapod
(a) (b)
Spindle
Hexapodlegs
Cutting tool
Workpiece
FIGURE 8.71 (a) A hexapod machine tool, showing its major components. (b) Closeup view of the cutting tool and its head in a hexapod machining center. Source: National Institute of Standards and Technology.

Manufacturing Processes for Engineering Materials, 5th ed. Kalpakjian • Schmid© 2008, Pearson EducationISBN No. 0-13-227271-7
Chatter & Vibration
FIGURE 8.72 Chatter marks (right of center of photograph) on the surface of a turned part. Source: Courtesy of General Electric Company.
1.2
0.8
0.4
0.0
-0.4
-0.8
-1.2
-1.6
-2.00 1000 2000 3000 4000
10-5 s
10-1
V
Cast iron
(a)
1.2
0.8
0.4
0.0
20.4
20.8
21.2
21.6
22.00 1000 2000 3000 4000
10-5 s
10-1
V
Epoxy/graphite
(b)
FIGURE 8.73 Relative damping capacity of (a) gray cast iron and (b) epoxy-granite composite material. The vertical scale is the amplitude of vibration and the horizontal scale is time.
Incre
asin
g d
am
pin
g
Bed only
Bed +carriage
Bed +headstock
Bed +carriage +headstock
Complete machine
FIGURE 8.74 Damping of vibrations as a function of the number of components on a lathe. Joints dissipate energy; thus, the greater the number of joints, the higher the damping. Source: After J. Peters.

Manufacturing Processes for Engineering Materials, 5th ed. Kalpakjian • Schmid© 2008, Pearson EducationISBN No. 0-13-227271-7
Machining EconomicsTotal cost
Machining cost
Nonproductive cost
Tool-change cost
Tool cost
(a)
Co
st
pe
r p
iece
Cutting speed
Machining time
Total time
Nonproductive time
Tool-changing time
(b)
High-efficiency machining range
Cutting speed
Tim
e p
er
pie
ce
FIGURE 8.75 Qualitative plots showing (a) cost per piece, and (b) time per piece in machining. Note that there is an optimum cutting speed for both cost and time, respectively. The range between the two optimum speeds is known as the high-efficiency machining range.
Manufacturing Processes for Engineering Materials, 5th ed. Kalpakjian • Schmid© 2008, Pearson EducationISBN No. 0-13-227271-7
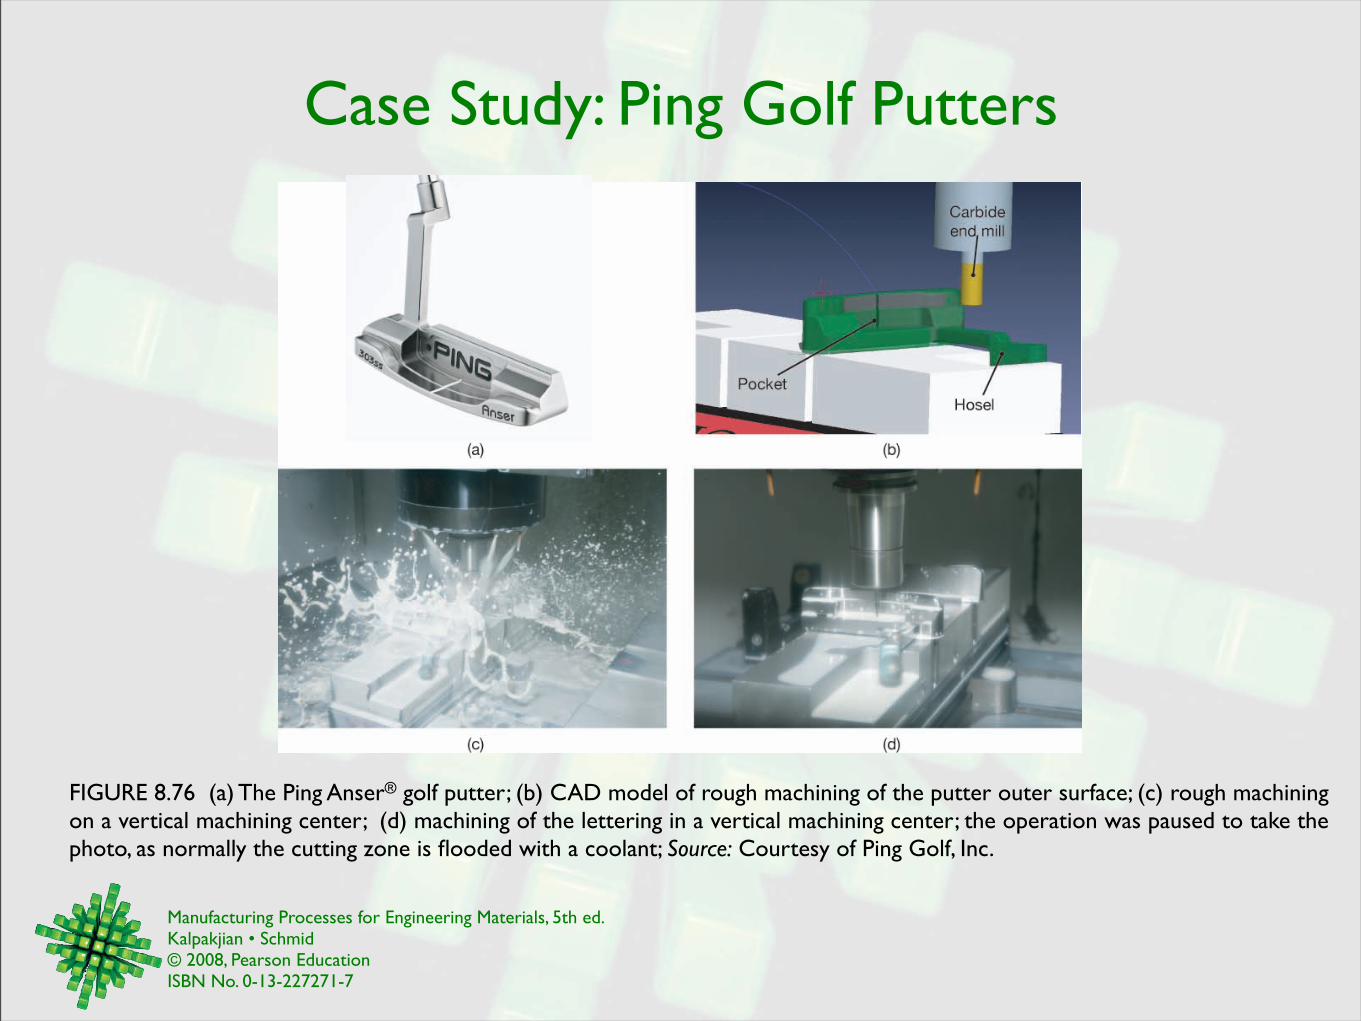
Case Study: Ping Golf Putters
FIGURE 8.76 (a) The Ping Anser® golf putter; (b) CAD model of rough machining of the putter outer surface; (c) rough machining on a vertical machining center; (d) machining of the lettering in a vertical machining center; the operation was paused to take the photo, as normally the cutting zone is flooded with a coolant; Source: Courtesy of Ping Golf, Inc.


![Determination and Analysis of Spindle Load in Boring ... · design, selection of raw materials and the sequence of the manufacturing procedure, Kalpakjian and Schmid [1]. In today‟s](https://static.fdocuments.in/doc/165x107/5f1019107e708231d4476f6c/determination-and-analysis-of-spindle-load-in-boring-design-selection-of-raw.jpg)