NetPicks · Learn A Simple Range Trading Strategy Swing Trading With MACD Insight ... At NetPicks,...
64
NetPicks Income Indicators Using Price Action to Create a Lifetime of Trading Income
Transcript of NetPicks · Learn A Simple Range Trading Strategy Swing Trading With MACD Insight ... At NetPicks,...

NetPicks
Income IndicatorsUsing Price Action to Create a Lifetime of Trading Income
1.
2.
3.
4.
5.
6.
7.
8.
9.
10.
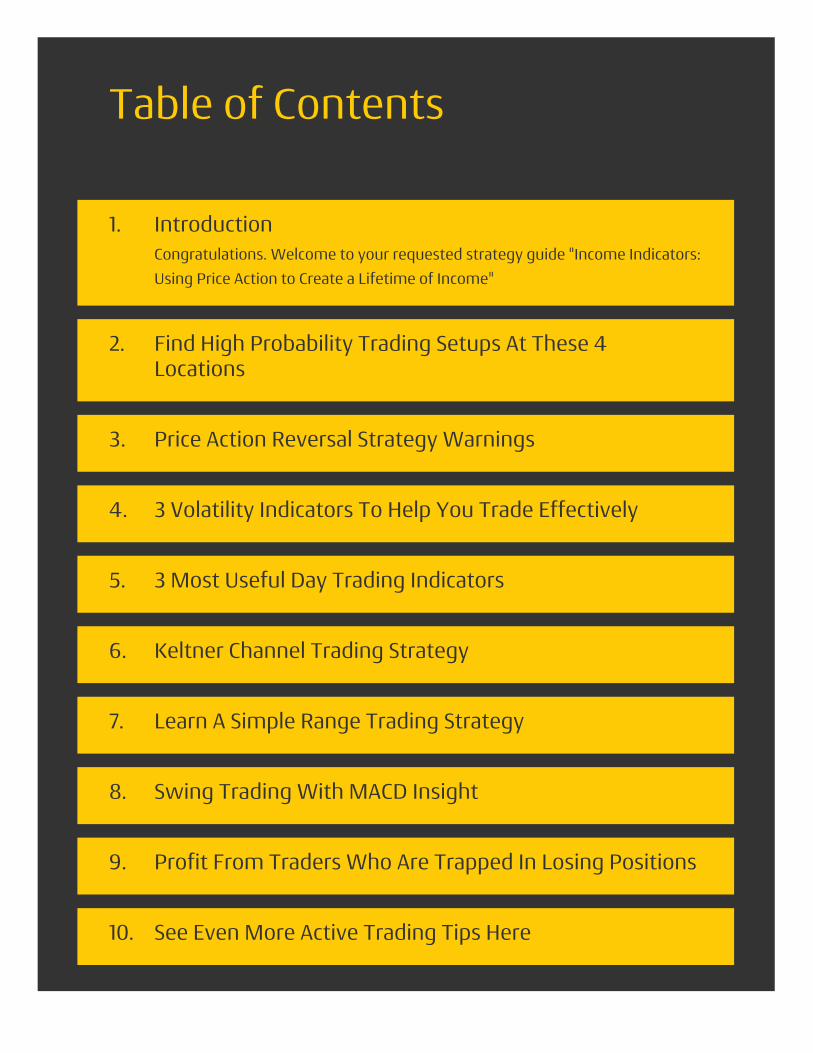
IntroductionCongratulations. Welcome to your requested strategy guide "Income Indicators:Using Price Action to Create a Lifetime of Income"
Find High Probability Trading Setups At These 4Locations
Price Action Reversal Strategy Warnings
3 Volatility Indicators To Help You Trade Effectively
3 Most Useful Day Trading Indicators
Keltner Channel Trading Strategy
Learn A Simple Range Trading Strategy
Swing Trading With MACD Insight
Profit From Traders Who Are Trapped In Losing Positions
See Even More Active Trading Tips Here
Table of Contents

Take your time reading each of these guides.
You'd be surprised how powerful indicators based on price action can be to help guideyour trading.
Indicators on their own are not enough to develop a complete trading system.However, they are the baseline of any successful technically based trading system.
Income Indicators...
Just some of what we will be covering...
How to Profit from Volatility in Your TradingSurfing the ranges - learn how to profit from range based marketsDay trading too tiring? Learn how to Swing Trade with the MACD insteadThe art of using the Keltner Channel - we built a whole trading system on this oneindicator
At NetPicks, we've spent 21 years developing active trading systems for people justlike you. All of our systems use indicators. Most times we use standard indicatorscombined with our own proprietary indicators to create a complete trading system.The "Trade Plan" is key with every successful system.
I think you'll see what is possible with indicators and price action and then I urge youto watch your email for more information and education from us on our fullydeveloped trade systems.
Mark Soberman, NetPicks.com
IntroductionCongratulations. Welcome to your requested strategy guide "IncomeIndicators: Using Price Action to Create a Lifetime of Income"

You have heard about high probability trading setups and you probably wonder if theyreally exist. Often times that term is used by marketers that say their trading strategiesare high probability hoping to hook the novice trader with those words.
Let's define what that probability means:Let's define what that probability means:
Probability is the measure of the likelihood that an event will occur.Probability isquantified as a number between 0 and 1 (where 0 indicates impossibility and 1indicates certainty). The higher the probability of an event, the more certain that theevent will occur. - Wikipedia
I think the term "high probability trading setups" is misleading because it implies thatwhatever setup that is being referred to does not just have a probable outcome, butthe outcome is close to certain.
There is nothing certain in trading.There is nothing certain in trading.
When we talk about a trading edge, and the edges in the market are quite small, weare still talking about a random distribution of wins and losses throughout the use ofthe trading technique.
Semantics?
Perhaps.
In trading though, I think being exact in your thoughts being exact in your thoughts is very important. Take supportand resistance as an example. When price is coming down to a certain level that hasrejected price in the past, we don't know if price will hold. Using the term "potential"support is more exact and reminds you that certainty does not exist.
Find High Probability TradingSetups At These 4 LocationsShane Daly
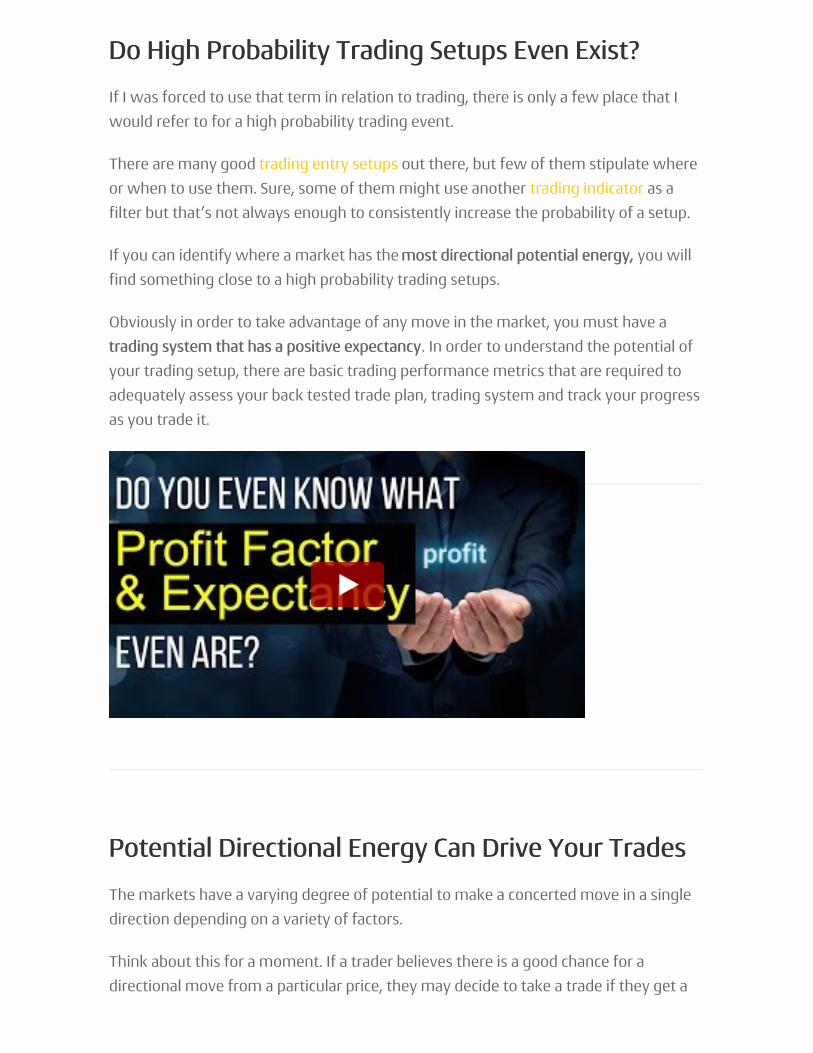
Do High Probability Trading Setups Even Exist?Do High Probability Trading Setups Even Exist?
If I was forced to use that term in relation to trading, there is only a few place that Iwould refer to for a high probability trading event.
There are many good trading entry setups out there, but few of them stipulate whereor when to use them. Sure, some of them might use another trading indicator as afilter but that’s not always enough to consistently increase the probability of a setup.
If you can identify where a market has the most directional potential energy, most directional potential energy, you willfind something close to a high probability trading setups.
Obviously in order to take advantage of any move in the market, you must have atrading system that has a positive expectancytrading system that has a positive expectancy. In order to understand the potential ofyour trading setup, there are basic trading performance metrics that are required toadequately assess your back tested trade plan, trading system and track your progressas you trade it.
Potential Directional Energy Can Drive Your TradesPotential Directional Energy Can Drive Your Trades
The markets have a varying degree of potential to make a concerted move in a singledirection depending on a variety of factors.
Think about this for a moment. If a trader believes there is a good chance for adirectional move from a particular price, they may decide to take a trade if they get a

setup and see what they need to in order to be convinced that the opportunity is agood one.
If many traders believe in an opportunity, the chances that their combined action will combined action willprecipitate the expected moveprecipitate the expected move, are far greater.
Of course, directional moves can start from anywhere. However, they tend to startfrom key prices and times.
For example, consider a market that’s been in a trading range for the last week or so.It’s currently trading towards the upper end of the range and there’s no particularreason, such as news or economic data that’s just been released, to believe thatthere’s an imminent change.
At the high of the range, there’s the maximum potential for price movement possible,the maximum potential for price movement possible,without the need for the balanced ranging behavior to changewithout the need for the balanced ranging behavior to change.
In this scenario, it’s quite likely that there will be many traders who are persuaded bythe location and the fact that there’s not been a change in the context which createdthe recent range, to take the opportunity.
This doesn’t mean they are right. But if they are, they should get a nice move for themand if they’re not, they don’t have to risk too many ticks in order to find outthey don’t have to risk too many ticks in order to find out.
If you take trades when a market is poised like this, you’re maximizing the probabilitymaximizing the probabilityof your particular trading techniqueof your particular trading technique.
Let’s take a look at some examples of where and when a market might have a decentamount of potential directional energy.
1. Look At The Primary Trading Session Open For1. Look At The Primary Trading Session Open ForTrading SetupsTrading Setups
For many markets, the primary session open is naturally a time when there’s a goodchance to see a decent move. This is because participants are at their most activemost active atthis time. You can easily see this in a volume or range heat map such as this one forCrude Oil.

High Probability Trading Setups At Market Open
In particular, if a market is opening some distance from the where the majority of theprior session’s trading activity executed, either the market is going to correct andeither the market is going to correct andretrace back to this zone or there’s a reason why it’s moving away and the move couldretrace back to this zone or there’s a reason why it’s moving away and the move couldcontinuecontinue.
2. Session and Range Gaps Make For High2. Session and Range Gaps Make For HighProbability TradesProbability Trades
In the same way, a market that has gapped away from the closing price, ideallybeyond the high or low of the prior session, is showing that either it’s moving stronglyin that direction and is likely to continue or traders have got ahead of themselves andwill need to cover their positions as the market retraces the gap.
In general, gaps are most prominent when charting the primary market session. Theyalso tend to be the most important. Once a gap starts to close, it often closes or atit often closes or atleast pushes a significant wayleast pushes a significant way. A failed test into the gap and new extreme on theopposite side for the day, often leads to a gap continuationoften leads to a gap continuation.
Here’s a chart with two examples in the ES – one gap close, one gap continuation.

Use Gaps To Find High Probability Trading Technique Areas
3. Strong Impulse Moves Can Lead To Another For A3. Strong Impulse Moves Can Lead To Another For APossible Trading SetupPossible Trading Setup
When you get a strong move in a market, there’s often at least a secondary attempt inthere’s often at least a secondary attempt inthe same directionthe same direction, following the pullback. Recognizing this, a trader can look for asetup that could be classified as a high probability trading setup by virtue of themomentum in the market, to take advantage, once the pullback starts to roll over.
Impulse Moves Often Lead To Another

The caveat to this is that you need to understand what a big move is for the timeframe that you personally trade. A 20 tick move might be huge on a 233 tick chart forsome products, but if you’re trading a 610 tick chart, it might be the norm. Do the statswork in ExcelExcel so you know what’s abnormal.
4. High Probability Trading Setups With Balanced4. High Probability Trading Setups With BalancedOr Ranging MarketsOr Ranging Markets
Balanced or ranging markets, have at least two reliable places where something isbound to happen at. These are the extremes of the balanceThese are the extremes of the balance. This can mean the highand low of the range or like in the FTSE example below, the pattern which defines thebalance.
Balance Areas For Better Trading Setups
These are where either the market decides it wants to remain in balance – in whichcase there’s plenty of room to trade back in to or it decides to break out of the recentbreak out of the recentbalancebalance and explore different prices. In both cases, there’s plenty of scope for a large,directional move.
The point to recognize with balances is that they are far more reliable in their actionmore reliable in their actionwhen they are based on a longer time framewhen they are based on a longer time frame. I tend to like looking for balance overseveral days at least to find places where a big move could happen from and I classifythose as high probability trading setups. The FTSE example here has a 2 monthbalance.

You shouldn’t expect that a strategy will work in every location and every moment inevery location and every moment intimetime, even if it has got a high win rate. By targeting trades that occur when a markethas a high level directional potential energy, like some of the examples discussed here,and staying out of the noise, you’re adding a reason for other traders to get behindother traders to get behindyouyou and you’re targeting high probability trading setups.
Combining a good entry setup and technique with good location, can give yourstrategy the best chance of generating winning trades for you. Are these highprobability trading setups at these locations? I think it is as close to that as you willever get.
Can You Pick The Right Options Trade Out Of 3000+ names?Learn How We Keep It Simple With Our Options Hot List.Click here & download your free hotlistClick here & download your free hotlist to avoid picking a dud!

Many traders like to find ways to short the tops and buy the bottoms so they seek outprice action reversal strategiesprice action reversal strategies so they catch the turns. There is a time and place to usea reversal strategy and the key is to know when the move is failing.
More often than not, the stronger trend will assert itself and if you are not usingappropriate risk measures, you could be looking at a loss much greater thananticipated if the move fails with strength.
It is vital to understand when a move is not playing out as expected and to takeappropriate action to avoid an unplanned loss.
Bullish Bar Reversal in USDCADBullish Bar Reversal in USDCAD
This Forex pair has been in a steady downtrend for a year (time frame dependent) andafter a strong push downwards of 14%, price began to consolidate. After swings wereregistered, we were able to start a trend line (demand line) on the bottom of price.
Price Action Reversal StrategyWarnings

Solid Rejections at Levels Of Support
I've left out the top trend line that would form a trend channel to keep this examplefocused. I've also left out many fanned trend lines except for the small red initial line.
1. Price puts in a clean double bottom pattern that starts the drive to take out theswing high on the left. After the high is registered, price begins its decent.
2. The decent halts in the area of the previous double bottom and that is a fairly clean,albeit low volatility move away from the level. We are also able to connect twoswing point for our demand line.
3. After another clean rejection just to the right of the #2 label, price rallies and afterputting in a higher high (uptrend pattern), price drops to reject off the previous lowgiving us a double bottom and an obvious bullish reversal candle.
4. Price makes a tentative approach to the demand line (price action would point tolow interest at this point and a probably hold of support) and 5 days of CAD gainsare cleanly wiped out.
In all of these cases, there was never a warning shot given as price approachedsupport that we'd lose the level. If there was a trend channel drawn, you can see thattrading this range would not have been too difficult (although real time may havecaused you some issues).

Range Break and Price Action Signs Of DangerRange Break and Price Action Signs Of Danger
A great way to read price is to ask yourself what should happen if "A" happens. Anexample of that is #3. Price found support and rejected with a pin bar and then twobull candles right after which broke highs.
Breakout! Reversal?
That's a true sign of strength and something you'd expect to see given the context ofthe play.
What if the pin formed and price didn't move?
As price once again approached the demand line and previous low rejection withstrength zone, price began to consolidate. It's a hard fought battle and the lasthighlighted candle breaks support.
Not shown but on the one hour chart, you can see how that candle formed. It hadbearish implications as price broke to the upside of the consolidation first then brokesupport.
Important information? There are a few ways that candle could have formed andwould it change your opinion of the support break if price broke lower first and thentook the high of the consolidation? Food for thought.
We get the obvious pin bar and what would you expect to happen?We get the obvious pin bar and what would you expect to happen?
1. Would you expect consolidation or would you expect clean rejections like theprevious ones?

2. Would you expect to see the large bear candle if it was a strong arrow of support?
These are the types of questions you need to ask yourself in real time. Forget thatCanada was set to release interest rate news the next day (they held on rates) but justlooking at price would not point to strength. Reading the price action would alert youthat the bulls are in jeopardy and a long play could get painful.
To be fair, the pin bar reversal strategy would have had you playing long at the breakof the pin (fakey - never liked that name. Price is seeking volume.) and clearly therewas buying interest prior to the break.
Was that momentum red candle brought to life by those hitting the exits when pricedidn't soundly reject the low and trade back inside the range?
You Trade What You See On The ChartYou Trade What You See On The Chart
I'm sure there are quite a few people boasting that they took part in this quick upsidemove because they read the pin bar play. However, price action was not pointingtowards upside at the point before the news release. In fact, the day before closed onits lows eating up the pin buyers and those that came before it.
I will be transparent....I was set to play the upside move and cancelled my order whenthere was no follow through and we had momentum to the downside. There was notrade for me and the trade was not simply because there was a pin bar. It was contextand I read it as a failure test of lows.
http://www.cmegroup.com/
So where are we now?
Who knows. I don't forecast and just trade what I see. Will this upwards movecontinue on this massive volume relative to recent history (CAD futures) or, since themarket likes to hurt the most people, will it turn and take out the long heavy candleswe just formed?

Let the price action tell you the story and you just read along.
Since many traders like to use indicators (usually the wrong wayusually the wrong way) for their tradingmethod, Netpicks has put together a free and vital “Indicator Blueprint” to put you onthe right track when using an indicator for your trading decision.Get access to the PDF and videos by clicking here.Get access to the PDF and videos by clicking here.
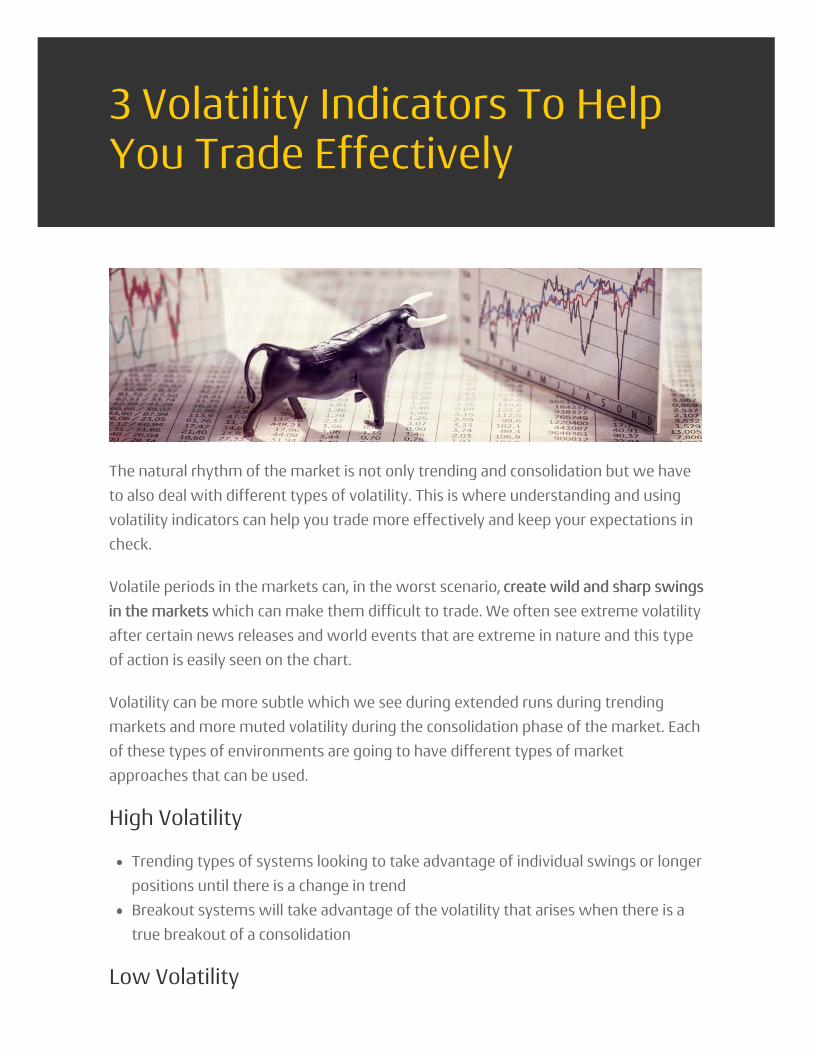
The natural rhythm of the market is not only trending and consolidation but we haveto also deal with different types of volatility. This is where understanding and usingvolatility indicators can help you trade more effectively and keep your expectations incheck.
Volatile periods in the markets can, in the worst scenario, create wild and sharp swingscreate wild and sharp swingsin the marketsin the markets which can make them difficult to trade. We often see extreme volatilityafter certain news releases and world events that are extreme in nature and this typeof action is easily seen on the chart.
Volatility can be more subtle which we see during extended runs during trendingmarkets and more muted volatility during the consolidation phase of the market. Eachof these types of environments are going to have different types of marketapproaches that can be used.
High Volatility
Trending types of systems looking to take advantage of individual swings or longerpositions until there is a change in trendBreakout systems will take advantage of the volatility that arises when there is atrue breakout of a consolidation
Low Volatility
3 Volatility Indicators To HelpYou Trade Effectively

You can utilize a channel trading system which can be trend line channels or sometypes of bandsReversion systems will have you taking positions when markets reach a support orresistance zone the contains the consolidation
Knowing what phase the market is in will assist you in using the "right tool" for theusing the "right tool" for thejobjob. You probably don't want to look for longer term trending plays inside of a lowvolatility consolidation area. You would be letting positions ride when the reversaltakes place which will have detrimental impact on your trading account.
Inside of every charting platform, there are tools called volatility indicatorsthere are tools called volatility indicators that willhelp you objectively measure the level of the volatility and it's important to fullyunderstand the tool you are going to use. Keep in mind there is no best volatilityindicator to use so don't spend too much time picking and tweaking the indicator. Thisapplies to any market including Forex and Futures. Apply it to your chart using thestandard setting and that should help you begin to learn how to see volatility in priceaction.
Using ADX As A Volatility IndicatorUsing ADX As A Volatility Indicator
The ADX indicator measures the strength of a trend based on the highs and lows ofthe price bars over a specified number of bars, typically 14. Generally an ADX crossingof the 20 or 25 levels is considered the beginning of a trend, either an uptrend or adowntrend. A move down in the ADX is considered to signal the end of a trendsignal the end of a trend. Whilethe ADX is below 20 or 25 the market is usually in a consolidation.
As long as ADX continues to rise, the trend remains strong, but once it starts to turndown the trend is weakening. This chart shows a strong trend in place on the left andas price is showing consolidation periods and no strong price thrusts, the ADX peaksand is s sloping downwards with occasional upturns. This can objectively show youobjectively show youthat the strength of the movethat the strength of the move has softened and any positions in the price trenddirection should be managed closely.
The far right of the chart we see an upturn from below 20 with an upturn in the ADX.This can indicate the volatility has returnedthe volatility has returned to the market and you may want to adaptyour trading approach to suit the new reality.

ADX Volatility Indicator Rising And Falling
The ADX has two drawbacks that you must be aware of before thinking you've foundthe holy grail of trading.
1. It does not indicate the direction of the trend. For that it’s often combined with theDirectional Indicator (+DI and –DI) and as a matter of fact the ADX calculation isbased on the DI. It’s easy enough however to determine the trend visually of withthe use of a simple moving average or using the typical trending price description.
2. As is the case with most trading indicators the ADX is a lagging indicator. It signalsthe beginning or end of a trend after the fact. With proper risk managementhowever that can still allow us to profit from the bulk of a strong move.
Compare the move of the ADX and the condition of price in the graphic and see whatelse you can learn from this chart that may apply to your trading.
ATR - Average True Range IndicatorATR - Average True Range Indicator
The ATR measures the true range of the specified number of price bars, again typically14. The true range differs from a simple range in that it includes the close of the priorbar in its calculation.
ATR is a pure volatility measurepure volatility measure and does not necessarily indicate a trend. It’s quitepossible to have volatile price movement inside a choppy market, as is often the caseduring an important news event.
The best way to use the ATR is as an indication of a change in the nature of thechange in the nature of the
marketmarket. We may see ATR rise as the market moves from a tight consolidation to a

strong trend or we may see ATR fall as the market transitions from choppy priceaction into a smooth, strong trend. This chart shows a couple of examples where ATRactually falls as price begins to trend, and drops as price enters some choppyconsolidation.
Average True Range Not A Direct Reflection Of Price
The ATR has the same drawbacks as the ADX.
1. It does not indicate direction, so we often see a rising (or falling) ATR in both anuptrend and a downtrend
2. It is a lagging indicator so it will not catch the very beginning or end of a markettransition.
3. The ATR will not work with range, momentum or Renko bars. Since those are allconstant range bars the ATR will essentially be flat and equal to the constant range.
Using Bollinger Bands As A Volatility MeasureUsing Bollinger Bands As A Volatility Measure
Bollinger Bands are calculated based on the distance of price from a moving averageover a specified number of bars, typically 20. The bands are a fixed number ofstandard deviations above and below the moving average, usually two standarddeviations. If the price deviation follows a normal distribution that means that 95% ofthe normal price fluctuation should be contained within the bands, so a breakout fromthe bands implies a move outside of that 95% probability range, or an increase inincrease involatilityvolatility.
Direction and Volatility
Unlike ADX and ATR, Bollinger Bands indicate both volatility and directionvolatility and direction. When price

volatility is high the bands widen, when it’s low the bands tighten. Since it’s possibleto have high volatility during consolidation, typically choppy periods will have widebands moving sideways, as shown in the highlighted section labelled "A".
Bollinger Bands Show Volatility and Direction
When prices transition into a trend, the bands will widen and slope up or down, asshown in the area marked "B". As long as price continues to hug the upper or lowerband the trend remains strong, but once price drops away from the bands the marketis typically entering a consolidation phase or possibly reversing typically entering a consolidation phase or possibly reversing. You can clearly seethese transitions in the chart but I have highlighted small retraces in price to themoving average inside the bands.
A simple trading method using the information the Bollinger Bands is telling us couldbe:
1. Wait for price to poke outside the bands which indicates a large deviation fromnormal price hence volatility
2. Price pulls back to the area around the 20 period moving average (there is nomagic here)
3. Look for a price pattern to indicate a reversal in price
I put together a post on a trading system that uses the same idea but utilizes KeltnerChannels for the volatility and the price pullback measure. I also compare thedifferences between the two indicators: Simple Keltner Channel Trading Strategy
Bollinger Bands are an excellent volatility and trend indicator but like all indicators,they are not perfect. They also lag price actionprice action so they will not catch the verybeginning or end of a trend. To be fair, you don't need to catch the exact turning pointbut you also don't want to be taking positions when the move has had a significant

run.
They can also signal false transitions as shown in the zone marked "A", where pricebounces between the bands. Although clear in hindsight, at the time price touches thebands it’s not clear if it signals the start of a trend or the beginning of a fading move orreversal.
Volatility SqueezeVolatility Squeeze
This is not a single volatility indicator but combines both the Keltner Channel and theBollinger Bands. It takes full advantage of the difference in the way both indicatorsdifference in the way both indicatorsmeasure and react to changesmeasure and react to changes in volatility which can assist you in determining truebreakouts as well as the end of a trending move.
This is a special technique and Netpicks has put together a standalone article on thistopic so you can better understand and utilize this technique called the Bollinger Bandsqueeze.
Apply These Indicators To Your TradingApply These Indicators To Your Trading
These have been just a few volatility indicators commonly available in all chartingplatforms. I encourage you to experiment with them and observe them in action. Theycan be excellent tools to identify market transitions, and combined with othertrending indicators or oscillators could form the basis of a flexible trading system.
Keep in mind that nothing is perfect and optimizing indicators such as these used forvolatility can have you curve fitting a trading system. This is a dangerous practice andone you should avoid at all costs. You should read: How To Avoid Curve Fitting DuringBack Testing which will give you concrete steps you can take to ensure the viability ofa trading system.
Options trading has become very popular over the last few years. Netpicks own“Options Guru” Mike has put together a hot list of some of the best names to trade inthe Options market. You can click here and download your free hotlistclick here and download your free hotlist to see whatnames Mike has been piling up the winners with.

Day trading indicators Day trading indicators are often touted as the holy grail of trading but that is simplynot true.
They are a useful trading tool that should be used in conjunction with a well roundedtrading plan but are not the plan itself.
In this article I will cover:
The uses of trading indicatorsThe uses of trading indicatorsIndicator selectionIndicator selectionTwo simple trading methods you can expand onTwo simple trading methods you can expand on
Keeping Trading SimpleKeeping Trading Simple
Whether you swing trade, day trade, or even position trade, too many tradingindicators equals complexity which usually equals lack of consistency with tradingdecisions.
Information overload is often the result of traders finding a mix of day tradingindicators potentially useful but in fact don't really help in the trader making aprofitable decision.
3 Most Useful Day TradingIndicators

I have used trading tools in different combinations over the years and there are threethat I found to initially be the most useful day trading indicators for how I like to trade.
As time went on, simple became my mantra and as a result, my trading decisions wereclearer and were made with much less confusion and stress.
Day Trading Indicators Give Information AboutDay Trading Indicators Give Information AboutPrice and VolumePrice and Volume
Almost every charting platform comes with a host of indicators that those whoengage in technical trading may find useful. You simply apply any of them to yourchart and a mathematical calculation takes place taking into past price, current priceand depending on the market, volume.
Different types of technical indicators do different things:
Trend directionTrend directionMomentum or the lack of momentum in the marketMomentum or the lack of momentum in the marketVolatility for profit potentialVolatility for profit potentialVolume measures to see how popular the market isVolume measures to see how popular the market is
The issue now becomes using the same types of indicators on the chart whichbasically gives you the same information. While this may be explained as looking for"trade confirmation", what it really does is give you conflicting information as well asmore information to process.
A simple example is having several trend indicators that show you the short term,medium term, and longer term trend. From a multiple time frame perspective, thismay appear logical.
Many traders though can attest to seeing a perfectly valid setup negated because of atrend conflict and then watching the trade play itself out to profit.
Too much information can cause analysis paralysis which can keep youToo much information can cause analysis paralysis which can keep youfrom making trading choices that are actually profitable ones.from making trading choices that are actually profitable ones.
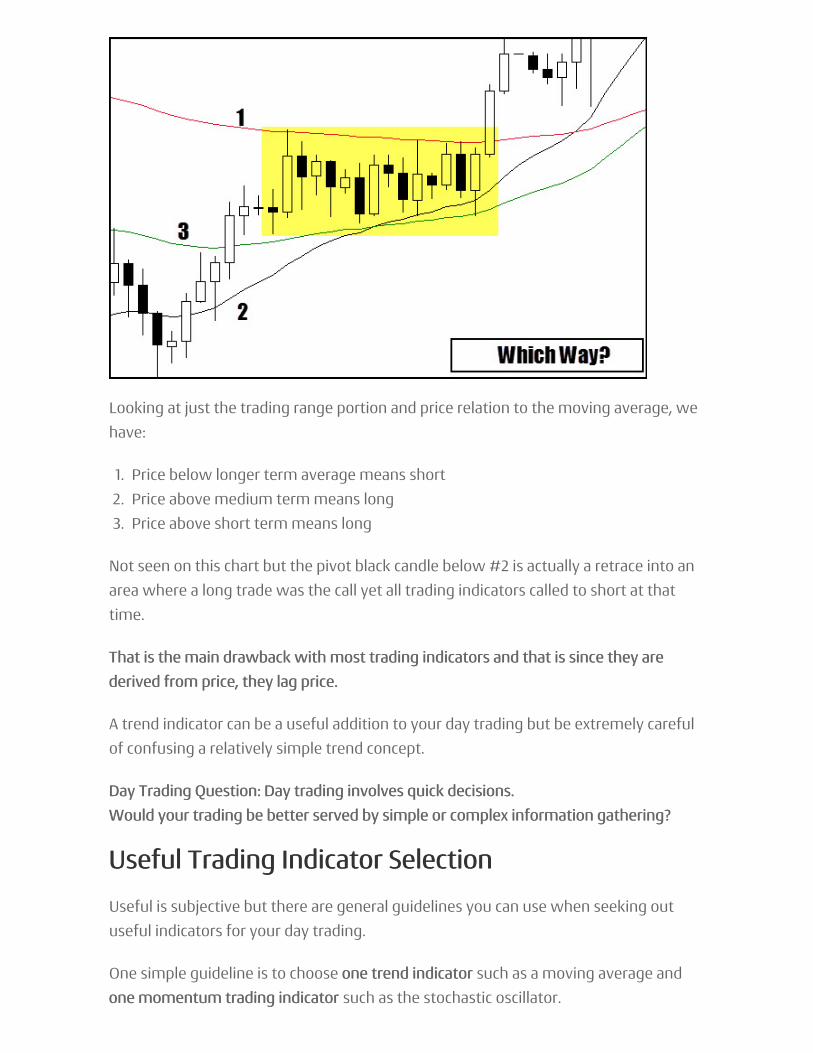
Looking at just the trading range portion and price relation to the moving average, wehave:
1. Price below longer term average means short2. Price above medium term means long3. Price above short term means long
Not seen on this chart but the pivot black candle below #2 is actually a retrace into anarea where a long trade was the call yet all trading indicators called to short at thattime.
That is the main drawback with most trading indicators and that is since they areThat is the main drawback with most trading indicators and that is since they arederived from price, they lag price.derived from price, they lag price.
A trend indicator can be a useful addition to your day trading but be extremely carefulof confusing a relatively simple trend concept.
Day Trading Question: Day Trading Question: Day trading involves quick decisions.Day trading involves quick decisions.Would your trading be better served by simple or complex information gathering?Would your trading be better served by simple or complex information gathering?
Useful Trading Indicator SelectionUseful Trading Indicator Selection
Useful is subjective but there are general guidelines you can use when seeking outuseful indicators for your day trading.
One simple guideline is to choose one trend indicatorone trend indicator such as a moving average andone momentum trading indicatorone momentum trading indicator such as the stochastic oscillator.

In order to explain how these can be useful as day trading indicators, take a look atthis chart:
1. In brief, this is a pivot area where price broke through and rallied hard away fromthe moving average
2. Price starts to trade above moving average as well as slope of indicator is up andour plan says trend is up
3. Price returns to the area marked #1 (also a complex ab=cd retrace)4. Momentum indicator crosses and turns up and we buy stop the high of the candle
that turned it
Simple selection of trading indicators mixed with chart technicals can be the basis foryour trading system.
Do Trading Indicators Work?Do Trading Indicators Work?
It all depends on how they are put together in the context of a trading plan. Some of
the most used technical indicators such as moving averages, MACD, and CCI work inthe sense that they do their job in calculating information.

The power of the indicator lies in how you interpret theinformation as part of an overall trade plan.
Don't be sold on the "holy grail" indicator that marketers flood your inbox with. Properusage of basic indicators against a well tested trade plan through back testing ,forward testing, and through demo trading is a solid route to take.
All of the systems that are offered by Netpicks not only come with tested trade plansbut also hammer home that you must prove any trading system or trading indicator toyourself.
Threat Of Over-OptimizationThreat Of Over-Optimization
There is a downside when searching for day trading indicators that work for your styleof trading and your plan.
Many systems that are sold use standard indicators that have been fine tuned to givethe best results on past data. They package it up and then sell it without taking intoaccount changes in market behavior.
The backbone of many trading systems are very mechanical in the sense that "if AThe backbone of many trading systems are very mechanical in the sense that "if Ahappens, do B".happens, do B".
There is nothing wrong with optimizing to take into account current market realitiesbut your approach and mindset in doing so can either have you being realistic or over-optimizing out of the realm of reality.
One way you may choose to not fall into the over-optimizing trap is to simply use thestandard settings for all trading indicators. This ensures you are not zeroing in on themost effective setting for the market of today without regard for tomorrow.
Small List of Useful Day Trading IndicatorsSmall List of Useful Day Trading Indicators
As I mentioned at the start of this article, there are three indicators which I personallyhave had great success with over the years and is how I started.
My trading as evolved as I began to understand other aspects of the trading but theseMy trading as evolved as I began to understand other aspects of the trading but theseare where I started:are where I started:
1. Fibonacci2. Moving averages3. CCI - Commodity Channel Index

For the sake of consistency, I am going to use the same chart as I previously did. Thisis a day trading/swing trading chart of 1 hour on a Forex pair.
1. This zone was determined once the swing high was in place. It is a combination ofthe Fibonacci retracement and Fibonacci expansion (used for symmetry)
2. This is the moving average used for objective trend determination. A short termsetting will give you faster trend changes with more whipsaw. A longer termsetting can have you miss a large portion of the current move
3. Once the CCI comes close to or crosses the 0 level, a buy stop is place above thehigh.
You can see the trend is up and price has retraced into an area that I would beinterested in taking a trade. Once price hits the area, there is a potential setup but atrade trigger is needed to get into the trade.

The commodity channel index plus price moving in the trade direction is the neededtrigger.
I purposely left out exact rules and settings (hint - settings are standard) so you candesign your own strategy using your current trading knowledge.
This exact setup is applicable to day trading, swing trading, and even position trading
To summarize:To summarize:
Moving averageMoving average - Determine trend and can be part of the process in triggering in atrade and momentum plays. (both not described in this trading article)FibonacciFibonacci - Determine, in advance of price, zones I may be interested in for a setupand possible trigger. Can also be used for profit targets.CCICCI - Used for trade triggers but does have many uses including trenddetermination.
Does The Choice Of Trading Indicators Change?Does The Choice Of Trading Indicators Change?
As you can see, this list gives the 3 most useful trading indicators for me at a certainme at a certainpoint in my trading.point in my trading.
Times change and what was useful then may not be useful for me today.
Every trader will find something that speaks to them which will allow them to find aparticular technical trading indicatorparticular technical trading indicator useful. Whatever you find, the keys is to beconsistent with it and try not to overload your charts and yourself with information.
Simple is usually best:
Determine trend - Determine setup - Determine trigger -Manage riskDetermine trend - Determine setup - Determine trigger -Manage risk
One thing you want to be aware of when trading an indicator method such as theKeltner Channel trading strategy is that, like all indicators, there is a lag time.
Indicators are derivative of price meaning that the results that you see via an indicatorwill come via a calculation using the price you see on your chart.
Price first.
Indicator second.
Before we get into the strategy that you can use with the Keltner Channel indicator(Keltner bands), let's cover why a channel can be useful for any trading strategy.
Channels Measure ExtremesChannels Measure Extremes
It is the buying and selling by humans (and computers although the trading programsare programmed by humans) that will move price. As humans, we are susceptible toemotions and beliefs and emotions are even more vulnerable when money is on theline.
Channels, and this includes Bollinger bands and moving average envelopes, aretheoretically designed to surround the general price action of the charted instrument.
The key words are "general price action" because anything seen outside of the generalThe key words are "general price action" because anything seen outside of the generalmovement of price can be considered an extreme movement.movement of price can be considered an extreme movement.
One way to envision this general movement is consider that the price is travellingwithout an extreme bullish or bearish bias. While there may be an overall bias in onedirection, there is nothing out of the ordinary with the movement of price.
Keltner Channel TradingStrategy
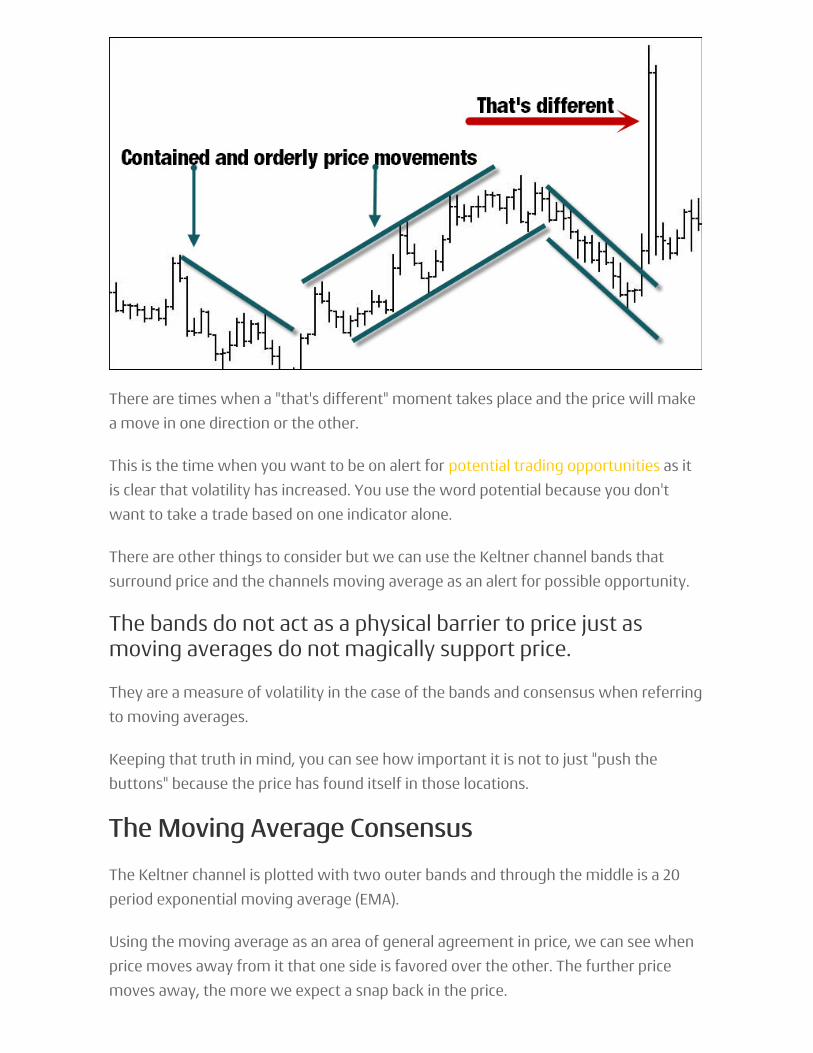
There are times when a "that's different" moment takes place and the price will makea move in one direction or the other.
This is the time when you want to be on alert for potential trading opportunities as itis clear that volatility has increased. You use the word potential because you don'twant to take a trade based on one indicator alone.
There are other things to consider but we can use the Keltner channel bands thatsurround price and the channels moving average as an alert for possible opportunity.
The bands do not act as a physical barrier to price just asmoving averages do not magically support price.
They are a measure of volatility in the case of the bands and consensus when referringto moving averages.
Keeping that truth in mind, you can see how important it is not to just "push thebuttons" because the price has found itself in those locations.
The Moving Average ConsensusThe Moving Average Consensus
The Keltner channel is plotted with two outer bands and through the middle is a 20period exponential moving average (EMA).
Using the moving average as an area of general agreement in price, we can see whenprice moves away from it that one side is favored over the other. The further pricemoves away, the more we expect a snap back in the price.

The moving average can also act as the landing zone after the price makes the snapback and when I say zone, I mean we don't expect price to land directly on theaverage. That is why we don't simply execute trades when price is supporting orresisting in the area of a moving average.
Keltner Channel SettingsKeltner Channel Settings
Like most indicators, there are inputs that you can change and that in itself can offerup a whole different set of problems.
There are several settings we can change with the Keltner channel depending on yourcharting platform:
1. Moving average length (will determine lag time of channel)2. Average true range (ATR)3. Band multiplier (uses ATR reading)4. Moving average type (EMA, SMA)5. ATR type (EMA, SMA)
The band multiplier is a very important number as it will determine how tight theouter and lower bands are to price. If the bands are tight, you may get a lot ofexcursions to the bands and beyond. This may be suitable for those scalping with theKeltner channel but not suitable for those looking for longer term plays in theirinstrument.
Day trading is also a viable option with the Keltner channel and you can tweak theband multiplier to suit your trading needs.
Keltner Channel VS Bollinger BandsKeltner Channel VS Bollinger Bands
There are those that often confuse the BB and KC but they do act differently in termsof reaction to price. The big difference is the Bollinger band is calculated using astandard deviation while the Keltner uses ATR.
You can visually see how Bollinger bands reacts differently with sudden price shocks.

Some traders utilize the Bollinger bands and the Keltner channel together to show aBollinger squeeze. When the Bollinger is inside the keltner, the squeeze is on andwhen in a trade setup, the movement of the bands outside of the channel is thetrigger. This would indicate that the price is potentially about to go on a run.
Whether you are going to use the channel or Bollinger indicator for this tradingsystem, is not the point. You can use either because it is the concept we are looking at.
Price Channel Trading PlanPrice Channel Trading Plan
The original Keltner used a 10 period for the moving average but it caused traders tobe whipsawed around far too much. Over time, the popular setting became a 20period EMA, a 20 period ATR and a 2.25 multiple. You can of course test variousYou can of course test varioussettings but in the end, we are simply looking for price engaging with either of sidessettings but in the end, we are simply looking for price engaging with either of sidesof the channel.of the channel.
Pullback TradingPullback Trading
Trading pullbacks is best done in a market that has exhibited a strong push in adirection. This is based on swing analysis where you want to see conviction in amarket swing that indicates another move in the same direction.
Using the Keltner channel, we can use travel outside the bands as an indication therewas conviction in the swing.
If we are trading in an downtrend, you want to see price travel to the bottom channeland plot outside of the channel. Even a shadow plot is sufficient if you are a moreaggressive trader.
Remember, an excursion outside of the channel indicates anextreme from what was a considered normal price action.
When price is at the channel, that is an alert to look for a pullback in the price to anarea around the 20 period EMA.

This chart shows a down trending market in play. Highlighted by the orange color, youcan see that price has traveled outside of the channel. This is the first sign that we mayhave a trade if the pullback fits other criteria. In certain charting packages, you can setan alert that will signal you if/when price has hit the channel and some of you mayfind that useful.
Not all excursions equaled a pullback into the zone around the moving average and asyou can see that at times, price traveled along the channel. That issue will be coveredin a later trading tips segment.

We now have three definite pullbacks that met our criteria of:
1. Excursion outside of channel2. Pullback to area of 20 EMA3. Obvious trending market
Confluence and Trade TriggersConfluence and Trade Triggers
Our potential trade is now being setup but we still don't simply enter when pricetouches the 20 EMA. We would like to see price pulling back not only to the mid-linebut also to a price structure or exhibiting a topping pattern. This is called confluenceand can actually increase the probability of your trade getting some traction.
We need a trigger to get into the trade and there are many tools that you can use.Momentum indicators are a popular method as well as the very basic trend line.
This chart is a factor 4 less than the previous chart. By using a smaller time frame toget into the trade, you may be able to get a better position sizing as you positionyourself higher in the curve to the downside in this example.

The black dotted lines on this chart are boxing off structures of possible resistance thatcoincide with the pullback to the mid-line. Let's call these potential resistance zonesbecause when price is pulling back, we don't know with 100% certainty if price willstop at these areas but it potentially could.
These potential zones of trading opportunity that includes the structure are from thetrading chart and I encourage you not to use the trigger chart to find the structure.
The trigger chart is only used for exactly what the nameimplies.
Before continuing, the area marked three may have some questions. It is a sloppycomplex pullback because the second leg did pierce the bottom of the first beforereversing from what may be considered a double bottom.
Where this gets interesting is the second leg matches in distance the first leg of themove. This is called symmetry and many traders will utilize this as a stand alonetrading system. Price also exhibits a topping pattern, a double top and you can seefrom this chart that a confluence of factors were in play when price broke solidly tothe downside.

I am using standard trend-lines to show the counter-trend move in price which bringsus to our setup zone. You may use a standard break of the trend-line for your tradeentry.
Stop placements could go either above the turn or above the zone that has acted asresistance.
Trade TargetsTrade Targets
We are going to use the setup chart for targets and like trade entries, you have a fewoptions.
Some traders like to target opposing structures while others would like a moreobjective means to find profit targets.
I've spoken about Fibonacci many times over the years and have shown examplesfrom my own trading. Fibonacci was my original method of trading when I firststarted and have since refined things since the early days.
The fact that we are trading pullbacks makes it easy to find our targets with Fibonacciin a way that is completely objective. We are going to take the move into the extremeof our pullback and project forward in time to a potential price target.
The diagram on the chart shows that "A" is the anchor point and you pull the Fibonacciretracement tool to "B". You project your targets at "C."
Here are the numbers that I personally use and will use for this example. Note that 200

is omitted but I use it for targeting after a range.
1. I used the bottom of the structure range for the entry price.2. I use .786 as the stop price once price breached the low of the swing leading to the
extreme3. Whatever target price hit just prior to breaching the .786, it was a full exit price.
You can see the total pips for each trade in green for a combined total of 245 pips(Forex example) before spread costs. These targets are shown on the trigger chart fordetail.
Complete Trading PlanComplete Trading Plan
This Keltner channel trading system is not complicated but don't be misled by thesimplicity. You still have to put in the work in determining the overall trend direction,when counter trend trading is appropriate, extent of excursion plus the very importantaccount management and risk profiles.
That's just to name a few variables.That's just to name a few variables.
There are also other trading opportunities that Keltner channel trading may provideand I will cover some of those in a later post.
A lot of work goes into designing a full trading plan including back testing and forwardtesting. Take a seat in a free Netpicks trading webinar where you can see how aproperly designed and tested trading system can increase your trading success. Clickhere to sign up.

It's been said that a market only trends 30% of the time.
I can't quantify that figure but having a range trading strategy to take advantage ofI can't quantify that figure but having a range trading strategy to take advantage ofthe other 70% the other 70% is good business.is good business.
Range trading is not difficult however it does require discipline and a method ofdetermining when a trading range is in play.
What Is Range TradingWhat Is Range Trading
When a market is trending, you will see a stair stepping pattern of higher highs andhigher lows in the case of an uptrend. There is an imbalance of buyers and sellers andyou can generally see the difference between an impulse move and a corrective move.
Impulse moves are stronger and bigger in scope than a corrective move.Impulse moves are stronger and bigger in scope than a corrective move.
Once that condition stops, markets tend to find themselves stuck between a high anda low and continue to oscillate between these two points.
Learn A Simple Range TradingStrategy

Buyers and sellers have found a point of relative equilibrium and you can find yourselfin a very choppy environment if attempting to trade between the extremes.
This is when traders will place trades against the high/low extremes and will continueuntil price breaks out of either side.
We've just come to the first issue with range tradingWe've just come to the first issue with range trading and that is finding the two pointsthat will act as potential support and resistance levels to trade against.
I did a piece on support and resistance where I blanked out the chart and randomlylaid on some horizontal lines. Turning the price bars back on, price found both supportand resistance on every single line.
Related - Do You Textbook Trade Support & Resistance
Of course, that does not discount the validity of S/Rdoes not discount the validity of S/R but it does bring home the factthat price can and will bounce seemingly from a random level on the chart.
To ensure you are using a level that may have some importance, levels that arelevels that areobviousobvious would be a better place to watch for price action and potential tradingopportunities.
This instrument is trending down and puts in an obvious low at #1. For the downtrend to continue, you would need to see this low taken out to continue our pattern oflower highs and lower lows.
Price rallies and when the price starts to drop, we have our high at #2. The issue is apotential pivot at #3 and is confirmed when the price at #4 takes out the #2 high.
Has this market gone right from a down trend to an up trend?

No.No.
You will later see that price falls back and takes out the #3 low and you can clearly seethat price is not in a trending pattern.
You have the extremes of our range labelled as #1 and #2 but #4 highlights animportant fact about these levels.
They are not a defined priceThey are not a defined price.
When looking at these turns, consider them to be zones with a margin of error bothoutside and inside the range.
Range trading will take into account both extreme zones and a trader will look toposition a trade against the potential zones of support and resistance that form therange.
Why potential support/resistance?Why potential support/resistance?
You don't know what will happen when price returns to those extreme zones.
It could stop.It could reverse.It could breakout.
These zones potentially have an effect on price and keeping that word in mind willkeep your expectations in check when confronted with the meeting of price and zone.
It will stop you from simply pushing the buttons and taking a trade and will force youto look for signs of what the probable move may be.
Trading Range = ConsolidationTrading Range = Consolidation
When trading trends, most people are used to the impulse and corrective swings inthe market. These pullbacks/rallies are continuation patterns of the overall trend.
The same thing can be said about trading ranges.The same thing can be said about trading ranges.
More often than not, a range is a price consolidation as part of the overall trend move.It certainly can be the ending of the current trend and a reversal is imminent but that
has to prove itself and not to be assumed.
4 phases of a market are accumulation, mark up, distribution, and mark down. It is

possible that the consolidation you are looking at is either accumulation/distribution.Let it prove itself to be a trend change or show a clue such as higher time framedivergence but assume a continuation play if trading the smaller time frame.
Ranges can also occur when the higher time frame becomes overextended and theRanges can also occur when the higher time frame becomes overextended and therange is where that condition is being worked off.range is where that condition is being worked off.
The first chart shows a range on the daily chart that occurred after 148 days of anoverall down trend in the market and 27 days of an impulse leg that terminated at the#1 low.
This chart shows the weekly chart of the same point in time.
You can see that price had two weeks of a momentum push to the downside and ourindicator shows an oversold state.
Our daily range played out for 63 days but a quick look at the larger time frameshowed an extended and oversold market but the lower highs/lows, lack ofdivergence, and lack of reversal price action pointed towards a trend continuation andnot a reversal.
Risks Of Range TradingRisks Of Range Trading
There are a few issues with trading the range but many of them can be avoided if thetrader is disciplined in their trading approach and knows what to look for.
Having a read on price action will also go a long way in helping you take advantage ofthe opportunities that range trading provides.
Runs to the range extremes

You've probably heard it said that the more times something is tested, the stronger itbecomes. "Look for multiple touches to confirm strength".
No.
I go on the opposite premise that multiple runs to a level weakens it, not strengthens.If a price level is important enough to reject price, why should it continue to revisitthat area multiple times?
If it is going to revisit multiple times, I would also expect to see the move away gettingIf it is going to revisit multiple times, I would also expect to see the move away gettingstronger and not weaker to indicate strong interest at the extreme.stronger and not weaker to indicate strong interest at the extreme.
I also look at the number of times traders take positions against the extreme and placetheir stops just on the other side. If that breaks, especially in the direction of the highertime frame trend, a protective stop cascade could propel price hard, fast, and whenthose protective stop orders get hit and turn to market orders, how much slippage isgoing to occur?
The point is not to blindly take a position simply because the price has moved to annot to blindly take a position simply because the price has moved to anareaarea from the past especially after multiple hits at the extreme. Remember thatmarkets cycle through ranges and trends so eventually, one of the extremes willbreak.
If you want to fade the extremes, you want to see some type of failure or signs of aIf you want to fade the extremes, you want to see some type of failure or signs of areversal at the extremes.reversal at the extremes.
Related - Profit From The Failure
On the other side of the coin, you don't want to assume you are going to have atrading range breakout simply because price moves strongly towards an extreme.

This chart shows a range and at #1, you can see the strength in the candle as pricepushes towards a potential resistance area. You know people bought into this moveand the small upper shadow shows a very small number of sellers.
Just as strongly as price advanced, it collapsed and once it was obvious the rangebreakout was not going to happen, a large momentum candle shows up that couldindicate the buyers exiting their positions. It could also indicate that those who boughtat the small consolidation or at the support extreme, are taking their profits.
Regardless, anticipating the trading range breakout served up a healthy amount ofRegardless, anticipating the trading range breakout served up a healthy amount oflosers.losers.
Price advances once again to the potential zone of resistance and price action at #2shows the imbalance of sellers and buyers at the extreme that could be used for atrade entry. This is a picture perfect reversal although it was not a strong continuationaway.
You wouldn't know that of course and that is why trade management must be part oftrade management must be part ofany range/trend trading strategyany range/trend trading strategy.
If you are looking to fade either extreme, this next chart shows the type of action youdo not want to see. It's not a perfect example but understanding what is happening isimportant.

The extreme has been in place for a while and has seen multiple reversals in the area.This last one is different. The reversal on the left had signs of indecision until sellerstook over. The last push up has consolidation right at the extreme and there does notappear to have much of a bull/bear battle taking place. You can also see part of theuptrend pattern of higher lows taking place.
We do not want to see a pattern of higher lows into the resistance extreme nor lowerWe do not want to see a pattern of higher lows into the resistance extreme nor lowerhighs into the support extreme.highs into the support extreme.
We do not want to see accumulation at either extreme.We do not want to see accumulation at either extreme.
While a reversal could still happen, this type of price action and structure at theextreme does not give much confidence for shorts (longs). If anything, some tradersmay find an entry inside of the consolidation at the failure test candle marked with thearrow.
Expanding trading ranges
When you see price breakout out of both extremes and failing to trend, plus eachswing is larger than the previous you get a range that is expanding.
These are not something I want to take part in as the market has
no clear cut consensus on what it wants to do.
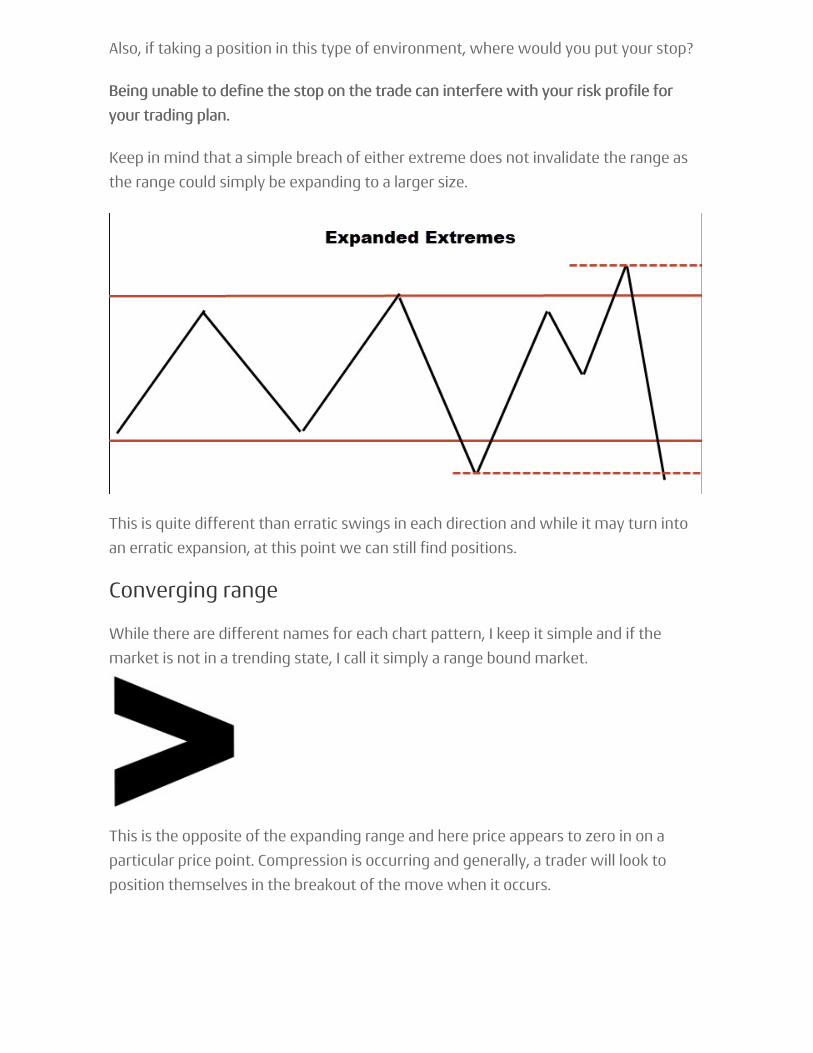
Also, if taking a position in this type of environment, where would you put your stop?
Being unable to define the stop on the trade can interfere with your risk profile forBeing unable to define the stop on the trade can interfere with your risk profile foryour trading plan.your trading plan.
Keep in mind that a simple breach of either extreme does not invalidate the range asthe range could simply be expanding to a larger size.
This is quite different than erratic swings in each direction and while it may turn intoan erratic expansion, at this point we can still find positions.
Converging range
While there are different names for each chart pattern, I keep it simple and if themarket is not in a trending state, I call it simply a range bound market.
This is the opposite of the expanding range and here price appears to zero in on aparticular price point. Compression is occurring and generally, a trader will look toposition themselves in the breakout of the move when it occurs.

Noting there is compression is importantcompression is important because when it breaks, there could be astrong move behind it. Given that, looking to fade breaks of these types ofcompression ranges is probably not a wise trading plan.
Why Range Trading WorksWhy Range Trading Works
We covered a few things to look for when trading ranges including not assuming therange will hold and looking for a sign that a fade of the range extreme is the right play.
You also noted that a range can take various forms and some are easier to get ahandle on than others.
Seeing a market in an expanding range would probably take that market off my list oftradeable instruments.
The converging range would have a breakout play in mind and while some will stillfade the extremes, it doesn't suit my plan.
I actually don't know of anybody who trades inside the converging range.While there may be some, looking to position in a breakout in the direction price washeaded prior to the range seems to be the most common play.
Let's cover why range trading works as a viable tradingmethod.
Once a range has formed and you have determined where the extreme zones are, youyounow know exactly where you are to look for a trading opportunitynow know exactly where you are to look for a trading opportunity. There's noguesswork involved. Price will either break out of the extremes, reverse at theextremes, or expand at the extremes.
The middle of the range is not an area you want to play in.The middle of the range is not an area you want to play in.
Support and resistance levels (remember you are looking for obvious ones) make upthe extremes of the range and S/R are zones that garner a lot of trader interest. YouYouwill have some type of action around these levelswill have some type of action around these levels that can range from a clean test ofthe level to price whipping around the zone.
The key is to have a trading strategy that sets up what you are looking for and howyou are going to trade it.
What type of price rejection are you looking for?Where will you place your stop?Will you use other tools to help in your decision?

Just remember that ranges end and a trend will begin. Before that happens, takingtrades while in a trading range can offer up another opportunity for those looking tomake money in the markets.
Using Range Trading IndicatorsUsing Range Trading Indicators
Trading indicators can aid in your decisions and when trading ranges, oscillators canhave a place as part of a trading plan. Let's look at the slow stochastic trading indicatoras a tool you can use when looking to trade the extremes of the range.
The extremes are marked by the circles but you can see later that the top getsexceeded in a breakout failure type of action.
Related - 3 Of My Favorite Trading Indicators
At "A", price pushes into the extreme and sets up a reversal candle. The indicator plotsinto the overbought area (not a signal by itself)(not a signal by itself) and you have a shift in momentumwhich is shown by the cross of the indicator lines. It's a combination of each event thatmay/may not constitute a trade.
Price drops to the lower extreme at "B" and you get an engulfing candle, an oversold

indicator plus a momentum line cross.
Is "C" close enough to the new extreme put in at "A"?
Is there a reversal type of candle pattern?
Is there a slowing of momentum seen in price?
Besides the indicator position, I don't see much enticing with this trade especially sinceprice action did not show any sign of a potential reversal.price action did not show any sign of a potential reversal.
Finally, at "D" price pushes to the new extreme, shows weakness while the indicator isoverbought and you see a momentum line cross.
The indicator is part of an overall range trading plan and should not be the onlyvariable you use for making a trading decision.
Range Trading Strategy OutlineRange Trading Strategy Outline
Simple still works in trading and the key is discipline and consistency. Without those,any type of success will be short lived regardless of the merits of your trading system.As you head into the trading strategy, keep in mind everything you've covered up tohere.
Find Our Trading Range
Trading ranges are formed with support and resistance zones. You can look for currentranges or find trending markets that are starting to slow down. Ranges turn to trendsand trend turn into ranges.
I also consider pullbacks a range in the general sense but those won't be a coveredtopic here.
This chart has an uptrend in play and then price started to pullback. The high is markedoff and once the pivot low is in place, that is marked as well.

For the trend to continue, you need to see a higher high. If that does not develop, youcan start thinking of a range play. The chart shows that price didn't advance into atrend continuation after the low as you put in a lower high marked "X" but fail to makea lower low.
I choose a not so perfect example of a range as showing perfection is always easy todo.
Location Of Price
With the extremes of the range marked off, you now have areas where you canmonitor what price does and if you have a trading opportunity. In our example chart,the yellow highlights areas of interest.
1. Price revisits the low. Indicator is oversold. Momentum line cross. Inside barcandlestick.
2. High is tested. Consolidation below extreme calls for caution. Candlesticks startshowing a lack of momentum and inside pattern. Indicator oversold and cross.
3. Price fails before an extreme test. Indicator not in the overbought zone. Goodreversal pattern but no trade.
4. The indicator in the middle zone. Bearish momentum cross. No reversal pattern.Price breaks through extreme.
Quick strategy recap
We needed price to make an attempt at the extremes. When that condition was met,we wanted to see an oversold/overbought indicator position. A bullish/bearishmomentum cross helped build our case for a trade and then we needed to see areversal pattern in the price action.
Place The Protective StopPlace The Protective Stop
You would think that placing your stop just outside of the extreme would make sense.After all, you often read that you should place the stop where you would be provenwrong.
The problem is that you can have the extreme broken and the trade (and range) is stillThe problem is that you can have the extreme broken and the trade (and range) is stillvalid.valid.
Think back to the expanded range chart and you can see that the range play is still avalid trading opportunity.
The range still exists but with different extremes.The range still exists but with different extremes.
There is a pattern called a failure test that needs to break an extreme and can take youout of your current trade when you should actually be getting into a trade.
What about a distance away from the extreme? How far is far enough?What about a distance away from the extreme? How far is far enough?
Given that most people base their position size on their stop size, this could lead tovery small positions or, depending on the market and your capital, no trade.
Inside the range? Thinking about where the majority of people put their stops(textbook stops), where do stop runs usually go?
If you know that most traders use either the extreme or a little bit beyond, those thatcan run the stops know that as well. Depending on the market and trading volume, astop run could have traders exiting at prices beyond their stop due to slippage.
Stop orders once triggered turn to market orders to be filled at the best price.

If you were short from the extremes and your stop was placed just outside theextreme, you'd be taken out before the trade is able to mature. If stopped out, thistrade may have had slippage giving you a worse risk profile than you planned for.
If the price is going to come close to the extreme, it is probably going to test theextreme and slightly beyond. A stop just inside of the extreme will have you out of thetrade before the stop runs trigger.
The fact is there is not a perfect location for the stop that will still allow an optimumThe fact is there is not a perfect location for the stop that will still allow an optimumposition size.position size.
Thinking of yourself as a risk manager will aid you in your stop placement decision.
Range Trading BlueprintRange Trading Blueprint
How you end up trading ranges is going to depend a lot on the type of trader youwant to be. There are a few important variables to pay attention to however it can besimply summed up with:
Find the extremes of the trading range. Look for signs of reversal. Take a position andmanage it.
Whether you are range trading Forex, Futures, or any other market, the basics thatwere covered here apply. Take your time, test, develop your trading plan, and beconsistent with how you have chosen to trade.

I made a piece on using the MACD modified into the 3/10 oscillator and mentioned Iwould show a real life and recent example.
Swing trading Forex is something I've been doing for quite a while and living inCanada, my favorite currency pairing to swing trade is the USDCAD.
Even though I say it was a swing trade, it is actually a position trade that has beenadded to over the last four years.
At times, it is not a leap to make a swing trade into a position trade especially whenthe drivers of the moves has changed.
Related - Learn The 3/10 Oscillator - MACD Version
CAD Oil CorrelationCAD Oil Correlation
There is a high correlation between oil prices and the USDCAD currency pairing.Currency traders should know that the CAD (the loonie) is a commodity currency andCanada exports about 97% of total crude exports to the United States.
Swing Trading With MACDInsight
When oil prices drop, the CAD weakens against the USD.
An increase in the price of oil generally means a stronger CAD.
The oil/CAD correlation is not 100%The oil/CAD correlation is not 100% as there are times of divergence in prices howeverit's high enough for any trader to consider adding it to their trading list and tracking oilprices as well.
A side benefit is that when oil prices increase, gas prices usually increase, and tradingthis pair can help offset the pain at the pumps.
I want to break down a recent decision on the USDCAD and especially highlight theespecially highlight theusage of the 3/10 oscillator (modified MACD)usage of the 3/10 oscillator (modified MACD) along with other analysis to aid in thedecision.
Swing Trading With MACDSwing Trading With MACD
The weekly chart is clearly in an uptrend. When looking at swing trades/positiontrades, having a bigger picture view helps define your play.

Just looking at the condition of price, do you see "orderly" price movement as opposedto choppy ranging type of action?
I do and that makes it a great chart to trade!I do and that makes it a great chart to trade!
1. A simple trend line connecting two recent lows that have taken out prior swinghigh levels.
2. Going back to the piece on the 3/10 oscillator, the slow line has crossed the zeroline and is setting up a first cross trade to the upside.
You get a jump on the momentum shift by color coding the slope of the fast line asyou can see on the chart
Weekly Chart Breakdown
In an uptrendIntermediate time frame is upMomentum is shifting to the upside
Now that you have taken a look at the weekly, dropping down to the daily can helpget a more involved look at what is playing out.
Daily Chart Swing Trade SetupDaily Chart Swing Trade Setup
There's a lot going on with this chart and it highlights basic technical analysisbasic technical analysis but alsohow effective the modified MACD indicator can be.

11. This line represented structure to the left (off the chart) that was resistance for 166days.
22. The yellow highlighted line represents symmetry to another corrective decline inthis uptrend.
33. Marks an obvious pivot that ends in a pin bar that many traders would classify as asound rejection of lower prices and a possible support zone. It was actually a failuretest of a range that was in place for 24 days.
44. The 3/10 (modified MACD) puts in a lower low compared to the previous low. Pricebehaved the same. The low lines up with the swing that was put in with price justprior to a test of the support level (1). This is a sign to sell the next swing in price.
The short trade works into profit if you shorted but you are shorting into a potentialsupport area.
Shorting into support is not a high probability tradeShorting into support is not a high probability trade but depending on trademanagement, a scratch or a small profit would have been made on this chart.
Continuing with #4, price is moving down but the fast line of the 3/10 is showingmomentum to the upside. That is a strong heads up that the down move is coming toan end.
55. Notice that the trading indicator puts in a higher high on the bounce off support (as

does price) which tells you to be on alert to buy the next swing down in price.
66. Price corrects to the swing point at #3. It is also a perfect symmetry with the lastswing leading into the support rejection.
Trading Indicators Plus PriceTrading Indicators Plus Price
In the chart, there were two great buying zones however there were traders that soldthe swing down right after the bounce off support.
You may be thinking that traders saw the nine bear candles plus a pivot low taken outand thought the pullback off support was a shorting opportunity into the low at #6.
You would be right and the move down makes that obvious.You would be right and the move down makes that obvious.
Those who shorted had a few days to rethink their trade before they became trapped.Trapped traders bring on a whole different rhythm to the market.
Related - What Are 3 Very Useful Trading Indicators?
But using straight technical analysis plus understanding what the 3/10 MACD is tellingyou, you would not be one of those traders.
The weekly chartThe weekly chart through a combination of technicals and the MACD 3/10 styleoscillator that the trend (intermediate and long term) is up and momentum is to theupside.
A lot of information came through the daily USDCAD chartdaily USDCAD chart including a swing analysiswith the MACD plus momentum to the upside while price was moving down. We thenhad a first cross setting up a long entry at point #6.
Trade Swing Entries
1. Is at the correction to support (also market symmetry setup) as momentum turnedto the upside on the 3/10 MACD as price was moving downwards.
2. Corrective move finding support at pivot #3, a symmetry pullback, and swinganalysis using the MACD
The swing analysis using price swings and the 3/10 MACD fast line swings is a reallygreat tool in adding a confluence to your current trading setups. It is something youmay want to investigate further.
Price has not done too much since the last pullback and has stalled inside of a 140 pip

range.
The MACD fast and slow line have turned down and the fast line momentum swingsare lower highs while price made a moderate higher high. Price is also just below therecent highs.
We may be in for a lengthy range, another correction or perhaps a failure test of therange and then a run for the top. That would be crystal balling the market which is notsomething I would recommend.
It does however keep your expectations in check and on alert for other tradingopportunities.

The concept of profiting from traders who are trapped in a losing position is simple.
These traders, by virtue of being on the wrong side of the market, can help propelyour trade when they hit the exits.
Wyckoff is actually the person who brought this idea of using upthrusts and springs tocapitalize on traders who are on the wrong side of the market.
It is simply using a common price action trading setup and wrong footed traders to aidyou in obtaining high probability trading setups.
I want to show you how you can profit from these tradersprofit from these traders.
Profit From Traders Who AreTrapped In Losing Positions

Issues Of Traders Who Are TrappedIssues Of Traders Who Are Trapped
The fear and panic by those who enter a trade only to find the market going againstthem can cause a sudden burst of price movement.
This movement in price is caused by these traders exiting their positions and creatingorder flow in the opposite direction from which they entered the trade.
Whenever you look at the high of a green candle, picture someone hitting their buybutton and entering the trade. Flash forward to the next candle being a redmomentum candle and that trader who bought the high, is trapped.
To exit, they have to sell.To exit, they have to sell.
Now imagine many traders or many contracts being sold as these traders exit.
That is what we want to jump on.
Related - Use Momentum In Your Trading
Setups Where Traders May Be TrappedSetups Where Traders May Be Trapped
I want to show two trading setups that are designed to capitalize on the plight ofthese traders and take advantage of their mistakes. We've all been there and knowwhat it's like to find ourselves on the wrong side of the colored candles.
Now, let's find a way that we can profit from those that find themselves in the sameposition.
These concepts apply to both long and short positions.
Failure Tests Of High/Lows
Some will call these false breakouts but what is usually happening is the market isprobing levels above certain areas for some sort of market action. These probes aredesigned to grab stops above key levels as well as entice buyers or sellers to jump onthe breakout. They are also used to gauge interest at prices they are testing.
These are called failure tests or using the term the real inventor of this type of trading(Wyckoff) described it, upthrusts.

This is a daily chart and I have extended a weekly resistance line (since 2013) over tothe displayed chart position.
Price is consolidating around the zone and this can often indicate a potential for amove in the same direction. I personally look for strong pushes and then price toconsolidate at the highs of the move. Often times this can result in a further move up.
But here, context is key. Many traders take too small a view of the market and in doingso, miss out on important information.
This is not a short-term price resistance zone.This is not a short-term price resistance zone.
It goes back over two years, it's a weekly zone, and the dashed line is not the top endof the zone. It is from a consolidation of price just under the extreme high of the zone.
Traders see the large green candle, the consolidation, probes, and finally a strong pushup. Remember, that failure candle was actually a strong green candlethat failure candle was actually a strong green candle at one point.
Traders pile into the long side and that high of the reversal candle runs right into theextreme high of the zone!
On the same daily candle, price falls back into the consolidation zone and those longand those longare trapped on the wrong side of the market.are trapped on the wrong side of the market.

They must exit.They must exit.
The next day, the red candle tells the story of all those traders that ended up beingtrapped, exiting and new shorts entering the market.
How to play this move?
Once you have noted the reversal candle, you can enter at the break of the low or goshort when price revisits inside the consolidation area.
Stop placement is simply above the extreme of the candle. If this is a true failure, wewedon't expect the price to exceed that highdon't expect the price to exceed that high.
We also don't expect the price to stay in the consolidation areadon't expect the price to stay in the consolidation area. We want to see strongmovement after those that are stuck on the wrong side, exit the trade.
Failure to see price move in your favor soon after entry, you can use the "3-periodrule" to exit your trade.
3 Period Rule: 3 Period Rule: If the price does not do what you expected within 3 bars/candles afterIf the price does not do what you expected within 3 bars/candles afterentry, exit the position.entry, exit the position.
Related - Failure Test Setup In Action
Trapped Pullback Traders
Markets move in waves with impulsive and corrective moves. A very popular tradingmethod is trading the corrective move and entering a trade in the direction of thetrend once the corrective move signals completion.
The issue is that many traders are impatient and don't want to risk not being in theThe issue is that many traders are impatient and don't want to risk not being in themove.move.
So they enter trades too early at the first sign of completion. When stopped out, theystill don't want to miss the move so they re-enter.
Complex pullbacks are a little tricky in that they can be hiding inside a higher timeframe structure. What may appear to be a simple pullback will actually be a two-legged (complex) pullback on a lower time frame.

Again, this is simply how the markets movesimply how the markets move and nobody invented this concept. If youare a trader and you have to exit a losing position, when would you do it? It's commonsense.
Before this complex pullback, we had what appeared to be simple pullbacks on thistime frame. Remember, simple pullbacks can be complex pullbacks on smaller timeframes. Price advanced off the simple but when this complex completed, the pricewent on an extended up move.
The first black line indicates the first leg of this pullback and the pin bar looks like itcould indicate a resumption of the up trend. Traders enter and place their stop belowthe candle.
But you are looking for a complex pullback and you sit on your hands.
Price advances then turns around and turns the longs into traders who are trappedshort and takes out stops. This could also entice short players who will end up beingtrapped if/when price turns back in the direction of the trend.
Seeing that large green momentum candle, what could be taking place?Seeing that large green momentum candle, what could be taking place?
Traders playing complex corrections take the longTraders who were in a losing position who exited longs earlier, re-enterBreak out traders who got trapped shorting the market exit their position
Entering these types of trades is not always straightforward and neither is the stopplacement.

1. You could drill down to a lower time frame and look for a pattern such as a shortbreakout failure on that chart.
2. You could buy stop a break of the highs once price breaches the low of the firstcorrection and scale buy stop down until invalid.
3. Use a momentum indicator turn such as Stochastic.
Stops can be placed a distance from the low of the correction but not right under thepivot. You can still have price retest the area and execute the test that was mentionedearlier thereby taking out your stop.
Power Of Desperate TradersPower Of Desperate Traders
It's very hard to see your position on the wrong side of the market and the executionof your stop not only saves your account, but feed the account of others whounderstand how those who are trapped in a losing position are going to react.
It's only logic to think that a trader in a losing position will exit at moment the paperlosses evaporate and they are able to exit at or close to break-even.
Standard technical analysis always tells traders to place stops around the pivot areasor just above support/resistance in a range. How can you tell traders do that?How can you tell traders do that?
Look around your charts and on every time frame, you will see price enter a zonebeyond the traditional stop zones and suddenly reverse.
Being on the right side of those moves can propel your positions into profit veryquickly. The key is to see where traders may be on the wrong side of the market andget yourself positioned to take advantage of them when they have to execute.

See Even More Active TradingTips Here
NetPicks Active Trading Tips


![MACD Ultimate Guide + 5 Profitable Trading Strategies [Video]](https://static.fdocuments.in/doc/165x107/617c94f490706c45b8343c92/macd-ultimate-guide-5-profitable-trading-strategies-video.jpg)