A semi-analytical noise prediction model for airfoils with ...
13
A semi-analytical noise prediction model for airfoils with serrated trailing edges Yannick D. Mayer a , Benshuai Lyu b , Hasan Kamliya Jawahar a , Mahdi Azarpeyvand a, * a Faculty of Engineering, University of Bristol, Bristol, BS8 1TR, United Kingdom b Department of Applied Mathematics and Theoretical Physics, University of Cambridge, Cambridge, CB3 0WA, United Kingdom article info Article history: Received 22 February 2019 Received in revised form 11 April 2019 Accepted 24 April 2019 Available online 6 May 2019 Keywords: Aeroacoustics Trailing edge serrations Scattering Boundary layer Trailing edge noise abstract Trailing edge serrations are a widely used passive technique for the suppression of aerodynamic noise from wind turbines. Despite their popularity, no reliable engineering prediction tool has yet been developed to estimate the noise reduction for different serrations. This paper concerns the development of an engineering noise prediction tool, based on a recently developed mathematical model. Results show that the new model has several advantages over Howe's model, as it can take both destructive and constructive sound interference effects into account. Two surface pressure wavenumber-frequency models are implemented, namely Chase and TNO models, to demonstrate the sensitivity of the model to boundary layer characteristics. The boundary layer parameters needed in the wavenumber-frequency models are obtained using RANS CFD simulations. Far-field noise comparisons are provided between the proposed prediction tool and experimental data for a NACA0018 airfoil. A parametric study regarding the boundary layer changes of serrated airfoils signifies the need for more reliable wavenumber-frequency models. The results presented in the paper show that the proposed engineering tool can provide a fairly accurate estimate of the noise reduction performance of serrated airfoils, but its accuracy relies heavily on the availability of reliable near-field boundary layer information. © 2019 Elsevier Ltd. All rights reserved. 1. Introduction The rapid expansion and the rising prevalence of wind turbines have resulted in negative, noise associated, health effects for a large number of people living in the vicinity of airports or large wind farms [1]. The European Union, amongst other governmental bodies worldwide, has introduced more stringent regulations to limit these adverse effects. Hence, it is now a key requirement and a critical design driver to reduce the aerodynamic noise from wind turbines in order to comply with the existing and future noise regulations. A study by Venugopal et al. [2] in the context of wind turbines reasoned that for a given maximum overall sound pres- sure level, a noise reduction of 1 dBA allows a larger blade to be utilized and the annual harvested energy to be increased by 2e3%, revealing the economic and practical importance of reducing aerodynamic self-noise from wind-turbines. It is generally recognized that out of the five different airfoil self- noise mechanisms identified by Brooks [3], the dominant aero- dynamic noise source for attached flows is the turbulent boundary layer trailing edge noise. Trailing edge noise is generated when turbulent flow structures pass the trailing edge and are subse- quently scattered at the edge [4]. In order to reduce the trailing edge noise, various treatments, such as serrations, riblets and porous material have been investigated [4e7]. The use of serrations represents a passive and cost-effective solution to mitigate the sound radiated from airfoils, by introducing destructive interfer- ence between the scattered sound fields. A multitude of serration geometries have been investigated experimentally. After initially focusing on sinusoidal and sawtooth serrations, more recently, novel serrations such as slitted, slitted-sawtooth and sawtooth- sinusoidal serrations [8] as well as concave serrations [9, 10] were examined in order to further increase the noise reduction capa- bilities of the serration technology. Several experimental studies by Dassen et al. [11], Moreau et al. [12], Gruber [13] and Leon et al. [14], Oerlemans et al. [15] among others have also examined the sound reduction potential of serrated trailing edges, while Liu et al. [16] and Chong et al. [17] have investigated the aerodynamic changes * Corresponding author. Queen's Building, BS8 1TR, Bristol, United Kingdom. E-mail addresses: [email protected] (Y.D. Mayer), [email protected] (B. Lyu), [email protected] (H.K. Jawahar), [email protected] (M. Azarpeyvand). Contents lists available at ScienceDirect Renewable Energy journal homepage: www.elsevier.com/locate/renene https://doi.org/10.1016/j.renene.2019.04.132 0960-1481/© 2019 Elsevier Ltd. All rights reserved. Renewable Energy 143 (2019) 679e691
Transcript of A semi-analytical noise prediction model for airfoils with ...
lable at ScienceDirect
Renewable Energy 143 (2019) 679e691
Contents lists avai
Renewable Energy
journal homepage: www.elsevier .com/locate/renene
A semi-analytical noise prediction model for airfoils with serratedtrailing edges
Yannick D. Mayer a, Benshuai Lyu b, Hasan Kamliya Jawahar a, Mahdi Azarpeyvand a, *
a Faculty of Engineering, University of Bristol, Bristol, BS8 1TR, United Kingdomb Department of Applied Mathematics and Theoretical Physics, University of Cambridge, Cambridge, CB3 0WA, United Kingdom
a r t i c l e i n f o
Article history:Received 22 February 2019Received in revised form11 April 2019Accepted 24 April 2019Available online 6 May 2019
Keywords:AeroacousticsTrailing edge serrationsScatteringBoundary layerTrailing edge noise
* Corresponding author. Queen's Building, BS8 1TRE-mail addresses: [email protected] (Y
(B. Lyu), [email protected] (H.K. Jawahar),(M. Azarpeyvand).
https://doi.org/10.1016/j.renene.2019.04.1320960-1481/© 2019 Elsevier Ltd. All rights reserved.
a b s t r a c t
Trailing edge serrations are a widely used passive technique for the suppression of aerodynamic noisefrom wind turbines. Despite their popularity, no reliable engineering prediction tool has yet beendeveloped to estimate the noise reduction for different serrations. This paper concerns the developmentof an engineering noise prediction tool, based on a recently developed mathematical model. Resultsshow that the new model has several advantages over Howe's model, as it can take both destructive andconstructive sound interference effects into account. Two surface pressure wavenumber-frequencymodels are implemented, namely Chase and TNO models, to demonstrate the sensitivity of the modelto boundary layer characteristics. The boundary layer parameters needed in the wavenumber-frequencymodels are obtained using RANS CFD simulations. Far-field noise comparisons are provided between theproposed prediction tool and experimental data for a NACA0018 airfoil. A parametric study regarding theboundary layer changes of serrated airfoils signifies the need for more reliable wavenumber-frequencymodels. The results presented in the paper show that the proposed engineering tool can provide afairly accurate estimate of the noise reduction performance of serrated airfoils, but its accuracy reliesheavily on the availability of reliable near-field boundary layer information.
© 2019 Elsevier Ltd. All rights reserved.
1. Introduction
The rapid expansion and the rising prevalence of wind turbineshave resulted in negative, noise associated, health effects for a largenumber of people living in the vicinity of airports or large windfarms [1]. The European Union, amongst other governmentalbodies worldwide, has introduced more stringent regulations tolimit these adverse effects. Hence, it is now a key requirement and acritical design driver to reduce the aerodynamic noise from windturbines in order to comply with the existing and future noiseregulations. A study by Venugopal et al. [2] in the context of windturbines reasoned that for a given maximum overall sound pres-sure level, a noise reduction of 1 dBA allows a larger blade to beutilized and the annual harvested energy to be increased by 2e3%,revealing the economic and practical importance of reducingaerodynamic self-noise from wind-turbines.
, Bristol, United Kingdom..D. Mayer), [email protected]@bristol.ac.uk
It is generally recognized that out of the five different airfoil self-noise mechanisms identified by Brooks [3], the dominant aero-dynamic noise source for attached flows is the turbulent boundarylayer trailing edge noise. Trailing edge noise is generated whenturbulent flow structures pass the trailing edge and are subse-quently scattered at the edge [4]. In order to reduce the trailingedge noise, various treatments, such as serrations, riblets andporous material have been investigated [4e7]. The use of serrationsrepresents a passive and cost-effective solution to mitigate thesound radiated from airfoils, by introducing destructive interfer-ence between the scattered sound fields. A multitude of serrationgeometries have been investigated experimentally. After initiallyfocusing on sinusoidal and sawtooth serrations, more recently,novel serrations such as slitted, slitted-sawtooth and sawtooth-sinusoidal serrations [8] as well as concave serrations [9,10] wereexamined in order to further increase the noise reduction capa-bilities of the serration technology. Several experimental studies byDassen et al. [11], Moreau et al. [12], Gruber [13] and Leon et al. [14],Oerlemans et al. [15] among others have also examined the soundreduction potential of serrated trailing edges, while Liu et al. [16]and Chong et al. [17] have investigated the aerodynamic changes

Fig. 1. Schematic of the idealized flat plate with trailing edge serrations, reproducedfrom Ref. [37].
Y.D. Mayer et al. / Renewable Energy 143 (2019) 679e691680
due to the presence of serrations. Recently, Ragni et al. [18], Sanderset al. [19] and Avallone et al. [20,21] have investigated the effect ofserrations on the hydrodynamic near-field and found a low-frequency reduction of the surface pressure spectra towards theserration tip, as well as an increase of the spanwise correlationlength.
Current trailing edge noise prediction methods include nu-merical, semi-empirical and analytical methods. Computationalaeroacoustics (CAA) approaches either simultaneously calculate thehydrodynamic and acoustic fields, i.e. direct numerical simulations(DNS) [22], or use high-quality flow simulations as input intoacoustic noise propagation models [23e27], such as the FfowcsWilliams and Hawkings model [28], which takes monopole, dipoleand quadrupole noise sources into account. A common approach isto use Large Eddy Simulation to achieve relatively high Reynoldsnumbers in combination with the Ffowcs Williams and Hawkingspropagation model, which has been used for a variety of applica-tions [29e31]. The CAA approaches are often used only for betterunderstanding of the physics of noise generation and rarely usedfor industrial design purposes due to the high computational cost.Alternatively, semi-empirical methods can be employed, such asthe popular BPMmodel [3], however, their accuracy is questionablewhen flow parameters or geometry deviate from those in the un-derlying investigation. With regards to analytical models, Amiet forexample proposed a model which simplifies the airfoil as a flatplate. The scattered pressure on the surface of the plate is deduced,and in order to calculate the far-field noise, the Kirchhoff radiationintegral is evaluated [32]. This model was later extended by Rogerand Moreau [33] to take the leading-edge back-scattering effectsinto account, which improves the predictions at low-frequencies.Modeling the underlying physics more accurately was the aim ofother analytical models, such as the TNO model [34], which havereduced the reliance on semi-empirical models and their intrinsiclimitations. Recent improvements include the coupling of the TNOmodel to RANS simulations or panel methods, as for exampleproposed by Bertagnolio et al. [35].
Whilst the prediction capabilities for trailing edge noise aresteadilymoving towardmaturity, the noise reduction from serratedtrailing edges has been a challenging problem. Howe proposed amodel which was able to demonstrate that sawtooth serrationsprovide substantial noise reduction [4]. However, it was reportedthat the model overpredicts the noise reduction greatly [36].Following a similar approach to Howe, Azarpeyvand et al. [8]extended this model to slitted, slitted-sawtooth and sawtooth-sinusoidal serrations. Recently, Lyu et al. [37] developed aserrated trailing edge model based on Amiet's theory of trailingedge noise using an iterative procedure, and the solution has beenvalidated against the results from a finite element simulation. Thepredicted noise reduction results for sawtooth serrations werefound to be more realistic compared to experimental results. This isbelieved to be due to the fact that the iterative solution proposed inRef. [37] provides a more accurate modeling to the scatteringresponse than the Green's function used by Howe. The first-ordersolution of the Lyu et al. model has recently been implementedby Fischer et al. [38] to predict the sound reduction of serratedairfoils. More recently, Huang [39] proposed a theoretical model tosolve the acoustic scattering problem for arbitrary but periodicallyserrated trailing edges, by applying the Fourier expansion andWiener-Hopf method. He also confirmed the criteria developed byLyu et al. with regards to effective noise reduction using serratedtrailing edges. Another very recent model was proposed by Ayton[40], where the Wiener-Hopf method was also used to obtain thefar-field sound power spectral density for a semi-infinite flat platewith arbitrary but periodic trailing edge serrations.
This paper implements the full second order-solution of Lyu
et al. [37] and combines it with both the TNO and Chasewavenumber-frequency (k� u) spectra to predict the far-fieldnoise. Firstly, the model developed by Lyu et al. as well as themodel developed by Howe will be reintroduced and comparedbriefly in Section 2. Section 2 will present a validation of the modelby Lyu et al. against the Amiet solution for a straight trailing edge.Section 3 will then detail the implementation of the differentwavenumber-frequency spectra, namely the Chase model and TNOmodel. Subsequently, the noise-reduction prediction for a NACA0018 airfoil with a serrated trailing edge is presented in Section 4and compared to experimental data found in the literature. Therequired flow field inputs are taken from a CFD simulation which isalso detailed in Section 4. Lastly, the concluding remarks and futurework are outlined in Section 5.
2. Serration model overview
This section will firstly reintroduce the scattering modeldeveloped by Lyu et al. for airfoils with serrated trailing edges andwill demonstrate its consistency with Amiet's model. Hereafter, thescattering model from Lyu et al. will be referred to as STE model forbrevity. Secondly, Howe's model will be presented and discussedbriefly as a comparison to the STE model.
2.1. Serrated trailing edge noise model (STE)
The airfoil under consideration is modelled as a flat plate, asillustrated in Fig. 1, where c denotes the average chord and d thespan. The serration amplitude is 2h and the serrationwavelength isdenoted by l. x0, y0 and z0 denote the streamwise, spanwise andnormal-to-plate coordinates with the far-field observer located atx ¼ x1;x2;x3, corresponding to a polar angle of q and an azimuthalangle of f. In order to calculate the scattered pressure field from thetrailing edge, an oncoming gust of the form
pi ¼ Pie�iðut�k1x0�k2y0Þ; (1)
is considered, as shown in Fig. 1. Here, Pi is the magnitude of theincident wall pressure gust with a frequency of u and k1 and k2represent the chordwise and spanwise wavenumbers, respectively.Inwhat follows, thewavenumber vector will be denoted k ¼ ðk1;k2;k3Þ. As detailed by Amiet, the incident pressure gust causes ascattered field starting at the trailing edge due to the change in

Y.D. Mayer et al. / Renewable Energy 143 (2019) 679e691 681
boundary condition at the trailing edge [41]. The total pressure, pt ,consists of two parts, firstly, the incident pressure, pi, and secondly,the scattered pressure, ps, which neutralizes the incident pressureand thereby satisfies the Kutta condition of zero pressure gradientat the trailing edge. The wave equation governing the scatteredpressure field has to be solved
V2ps � 1c20
�v
vtþ U∞
v
vx0�2
ps ¼ 0; (2)
where c0 represents the speed of sound, U∞ is the ambient meanflow velocity, andM0 ¼ U=c0 is the mean flowMach number. In thecase of a serration with a geometric profile of Hðy0Þ, applying acoordinate transformation, x ¼ x0 � Hðy0Þ; y ¼ y0; z ¼ z0, andassuming harmonic perturbations, ps ¼ Pðx0; y0; z0Þe�iut , Lyu et al.derived the following partial differential equations
�b2 þ H02ðyÞ
� v2Pvx2
þ v2Pvy2
þ v2Pvz2
� 2H0ðyÞ v2Pvxvy
þ�2iM0k0 � H
00 ðyÞ� vPvx
þ k20P ¼ 0;
(3)
where k0 ¼ u=c0 and b2 ¼ 1� M20. H
0ðyÞ and H00 ðyÞ denote the first
and second derivative of the serration profile, respectively [37]. AFourier expansion of the form
Pðx; y; zÞ ¼X∞�∞
Pnðx; zÞeik2ny (4)
can be applied due to the periodicity of the scattering in thespanwise direction, to obtain the following equation(�
b2 þ H02ðyÞ� v2
vx2þ v2
vy2þ v2
vz2� 2H0ðyÞ v2
vxvy
þ�2iM0k0 � H
00 ðyÞ� v
vxþ k20
)�X∞�∞
Pnðx; zÞeik2ny ¼ 0;
(5)
where k2n ¼ k2 þ 2np=l. The summationP∞
�∞Pnðx; zÞeik2ny adds upthe different modes of the scattered pressure. Substituting thesawtooth serration geometry and taking care of the singularities atthe tip and root of each sawtooth, one can show that the followingset of differential equations results
DP�AP ¼ BvPvx
; (6)
where A and B are defined as follows
Aml ¼�k22m � k20
�dml;Bml ¼
8<:
4sl
mþ lþ k2l=pl�m
; m� l is odd
0; m� l is even;(7)
with dml representing the Kronecker delta. D is a differentialoperator and Pðx; zÞ is a vector of the different mode functions,given by
D ¼(�
b2 þ s2� v2
vx2þ v2
vz2þ 2ik0M0
v
vx
); (8)
P ¼ ð/P�n0 ðx; zÞ; P�n0þ1ðx; zÞ; /Pn0�1ðx; zÞ; Pn0 ðx; zÞ; /ÞT : (9)
A solution for P is derived using an iterative technique and
solving the Schwarzschild problem at each iteration step. The de-tails of the iterative technique can be found in Lyu et al. [37]. Thescattered surface pressure field is obtained by adding up alldifferent modes of Pn0 ðx;0Þ and transforming the solution back tothe original coordinate system, that is
Pðx0; y0;0Þ ¼X∞
n0¼�∞Pn0 ðx0 � Hðy0Þ;0Þeik2n0y0 ; (10)
where
Pðx;0Þ¼NðxÞ þ Cð1ÞðxÞ þ Cð2ÞðxÞ þ Cð3ÞðxÞ þ/: (11)
Finally, the far-field power spectral density, Spp, is found inanalogy to Amiet's model by applying a surface integral over k2 toyield the far-field power spectral density in the midplane, y0 ¼ 0, ofthe idealized flat plate, namely
Sppðx;uÞ ¼
ux3c4pc0S20
!2
2pd
�X∞
m¼�∞jL�u; k1;2mp=l
�j2Pðu;2mp=lÞ (12)
here, Pðu;2mp=lÞ is the wavenumber-frequency, k� u, spectrum
integrated over k1, S20 ¼ x21 þ b2ðx22 þ x23Þ, k1 ¼ u=Uc and Uc is the
average convection velocity. The far-field sound gust-responsefunction L is calculated iteratively in a similar way to the scat-tered surface pressure field as
L ðu; k1; k2Þ¼ ð1� iÞ 1lce�ik0ðM0x1�S0Þ
�b2
eik0ðM0�x1=S0Þh�b2
�X
n0¼�∞
∞ �Qn0 þQð1Þ
n0 þQð2Þn0 þ/
�:
(13)
The complete mathematical formulation of each individual Qterm can be found in Lyu et al. [37]. Equation (12) also marks theunderlying result of the STE model and reduces to Amiet's modelwhen h =l approaches zero, i.e. the serrated edge reduces to astraight edge. However, it has to be noted that whilst it is possibleto have a point-spectrum as input into Amiet's model, this is not thecase for the serrated trailing edge model which requires awavenumber-frequency spectrum as input in order to calculate thesound reduction achieved with serrated trailing edges.
In order to validate that the STE model reduces to Amiet'strailing edge noise model for a straight trailing edge, experimentalpoint spectra and the corresponding Amiet far-field noise pre-dictions from Gruber [42] were used. Gruber conducted a largenumber of noise tests in varying flow conditions and the chosentest cases concern a NACA 0012 and a NACA 65(12)-10 airfoil with achord length of 0.15m and span of 0.45m. The NACA 0012 airfoilwas tested for U∞ ¼ 40m/s at an angle of attack (AoA) of a ¼ 0� andthe NACA 65(12)-10 airfoil was tested for U∞ ¼ 20m/s at a ¼ 5�.The airfoils were tripped at 10% of the chord on both the suctionand pressure sides to achieve a fully turbulent boundary layerbefore the trailing edge. Gruber approximated the wavenumber-frequency spectrum, integrated over k1 and k2, as
PðuÞzGppðuÞ�lyðuÞ; (14)
where lyðuÞ ¼ bcUcu and bc is the Corcos constant, as adopted in
Ref. [42]. The required surface pressure fluctuation point spectranear the trailing edge of the airfoil were extracted from the relevantsurface pressure spectra plots provided in Ref. [42]. In order to

Y.D. Mayer et al. / Renewable Energy 143 (2019) 679e691682
simulate the straight trailing edgewith the STEmodel, the serrationamplitude was set to approximately zero and the serration wave-length was assigned a very large value. Finally, the sound pressurelevel (SPL) is calculated as follows,
SPLðuÞ ¼ 10 log10
SppðuÞp20
!; (15)
where p0 ¼ 20mPa.Fig. 2 shows Gruber's far-field noise data measured at a location
right above the trailing edge at a distance of r ¼ 1.2m and Gruber'sAmiet noise predictions, as depicted in Ref. [42]. The figure alsodisplays the noise predictions obtained from the STE model, Eq.(12), presented in this paper. It can be seen that for both validationtest cases, the STE model matches Gruber's Amiet model very well.It is believed that the main reason for the small discrepancies isinaccurate data extraction from the figures presented by Gruber inRef. [42], both for Gruber's Amiet prediction as well as for thesurface pressure spectrum required in the k� u spectrumapproximation. Based on the results in Fig. 2, it can be confirmedthat the STE model implemented in this paper reduces to Amiet'smodel for straight trailing edges. More validations against FEMresults can be found in Ref. [37]. It is very important to note thoughthat the wavenumber-frequency spectrum approximation usedhere, i.e. surface pressure point spectrum multiplied by the span-wise correlation length, cannot be used for the prediction of the far-field noise reduction in the case of serrated trailing edges. This is
Fig. 2. Comparison of the STE model prediction with experimental data and Amiet's noiseNACA 0012 U∞ ¼ 40m/s at a ¼ 0, (b) NACA 65(12)-10 U∞ ¼ 20m/s at a ¼ 5� .
f�ud
Uc;hl;hd;c
�¼ 1�
ud
Uc
�2�1þ
�4hl
�2 �þ c2
�
0BB@1þ
64�hl
�3�dh
��ud
Uc
�2 cosh
�l
2d
� ffiffiffiffiffiffiffiffiffiffiffiffiffiffiffiffiffiffiffiffiffiffiffiffiffiffi�ud
Uc
�2
þ c2
s !� cosð2u
ffiffiffiffiffiffiffiffiffiffiffiffiffiffiffiffiffiffiffiffiffiffiffiffiffiffi�ud
Uc
�2
þ c2
s �ud
Uc
�2�1þ
�4hl
�2 �þ c2
!sinh
�l
2d
� ffiffiffiffiffi�u
U
s
the case because a surface pressure wavenumber-frequency spec-trum is required as an input in Eq. (12), as opposed to a pointspectrum approximation in Amiet's model.
2.2. Howe's trailing edge model
In order to provide a comprehensive study, Howe's trailing edgenoise model is provided here, which will be used in the followingsections for comparison against the STE model. According to Howe,the power spectral density of the far-field noise of a flat plate with asawtooth trailing edge can be found from Ref. [43].
Sppðx;uÞðr0v�Þ2ðd=c0Þðd=jxjÞ2
¼ Cmpsin2
�q
2
�sinðfÞJðuÞ; (16)
where the non-dimensional edge noise spectrum JðuÞ is given by
JðuÞ ¼�1þ 1
2c
v
vc
�f�ud
Uc;hl;hd;c
�; (17)
andwhere r0 is the density of air and d is the boundary layer thickness.Howe's model uses Chase's k� u spectrum and hence,Cm ¼ 0:1553;c ¼ 1:33 and v� ¼ 0:03U. One can easily show that inthe case of a flat plate without trailing edge serration, the non-dimensional edge noise spectrum reduces to
prediction from Gruber [42] for 0.15m chord airfoils with a straight trailing edge: (a)
h=UcÞ!
ffiffiffiffiffiffiffiffiffiffiffiffiffiffiffiffiffiffiffiffiffid
c
�2
þ c2!1CCA;
(18)

Y.D. Mayer et al. / Renewable Energy 143 (2019) 679e691 683
JðuÞ ¼ ðud=UcÞ2hðud=UcÞ2 þ c2
i2: (19)
As a preliminary comparison between the STE and Howe'smodel, a parametric study of varying l =h was performed. Theparametric study was carried out for a plate with a serration lengthof h =c ¼ 0:2, at a free stream velocity of U∞ ¼ 30m/s and aboundary layer thickness of d =c ¼ 0:035. The Chase wavenumber-frequency model [4] has been used as input to both the Howe andSTE far-field noise models, termed STE-Chase and Howe-Chase, asshown in Fig. 3. Fig. 3 shows the reduction of the sound pressurelevel (D SPL), i.e. the effect of a serrated compared to a straighttrailing edge case, for five different serration wavelengths, namelyl =h ¼ 0.125, 0.25, 0.5, 1.0, 2.0. A positive D SPL is indicative of a far-field noise reduction. It can be seen that with decreasing l =h, i.e.sharper serrations, both far-field noise models predict higher levelsof noise reduction, with Howe's model consistently predictinggreater noise reduction at high-frequencies. One interestingobservation is that according to Howe's model (Fig. 3a) higherlevels of noise reduction are achieved by using very sharp serra-tions (i.e. small l =h), while the STE results in Fig. 3b reveal that aftera certain l =h, the use of even sharper serrations will only lead tofurther noise reduction at high-frequencies, with no noise benefitat lower frequencies. A similar behavior was also observed in theexperimental results by Gruber [42]. This is believed to have beendue to the edge-diffraction Green's function used in Howe's model,whereas the STE model is able to capture both constructive anddestructive interferences, due to the different modes involved inthe radiation integral, see Eq. (13).
3. Wavenumber-frequency spectra implementation
As discussed earlier, a prior knowledge of the boundary layersurface pressure fluctuations, in the form of wavenumber-frequency spectra, in the vicinity of the trailing edge is needed forthe calculation of the far-field noise using the STE model. Eventhough the STE model is derived based on flat-plate assumptions, itis still applicable to airfoils operating in the fully attached flowregime, similar to Amiet's model, which has been successfullyapplied to airfoils at non-zero angles of attack, for instance by Rogeret al. [44]. The underlying flat plate assumptions, such as frozenturbulence and linear scattering, hold at low to moderate angles ofattack, depending on the specific flow conditions and airfoil
Fig. 3. Comparison of 1/3 octave band noise reduction between the STE and Howe's modelairfoil at U∞ ¼ 30m/s: (a) Howe, (b) STE.
geometry. For all test cases presented in this work, no flow sepa-ration was found and hence the STE model is applicable.
A major question remaining, however, is the wavenumber-frequency spectrum input needed for the STE noise predictionmodel. Prior research has shown that the boundary layer pointspectrum can greatly change over the airfoil and serrations,particularly in the presence of a pressure gradient. Thewavenumber-frequency model used for the modeling of theboundary layer and the location of extracting the boundary layerinformation is therefore of great importance. Various wavenumber-frequency models, such as the Corcos, Efimtsov, Smol'yakov andTkachenko, Chase, TNO model, etc. have been developed and usedin various applications [45]. In the absence of prior extensive near-field hydrodynamic information for serrated airfoils, here we willadopt twowavenumber-frequency models, namely Chase and TNO,to provide a comparative study. The Chase model has also beenpreviously used by others [4,8], due to its simplicity. The TNOmodel provides a more physics-based prediction tool and hastherefore been extensively used in engineering applications,particularly for wind turbine noise prediction [35,46]. To demon-strate the influence of the boundary layer information extractionlocation, a parametric study will also be performed in Section 4.2.
3.1. Chase wavenumber-frequency spectrum model
The Chase wavenumber-frequency spectrum model has beenused extensively for various applications [37,40], including Howe'sfar-field trailing edge noise model [4]. The Chase wavenumber-frequency spectrum is given by
Pðu; k1; k2Þ ¼Cmr20v
3�k21d
5hðk1 � u=UcÞ2ðdUcv�=3Þ2 þ
�k21 þ k22
�d2 þ c2
i5=2:(20)
Equation (12) requires the wavenumber-frequency spectrum tobe integrated with respect to k1 in order to calculate the far-fieldpower spectral density, and hence, Eq. (20) is integrated over k1to obtain
Pðu; k2Þ ¼4Cmr20v
4�ðu=UcÞ2d4
Uc
nhðu=UcÞ2 þ k22
id2 þ c2
o2: (21)
The boundary layer thickness can be obtained using a panelmethod code such as XFoil [47] to avoid the need for a CFD
for varying l =h at a constant serration length of h =c ¼ 0.2 for a c ¼ 0.2m NACA 0018

Y.D. Mayer et al. / Renewable Energy 143 (2019) 679e691684
simulation, as used by Bertagnolio et al. [35] for instance. Thiswould have the advantage of a very short run time. Alternatively,the boundary layer thickness can be acquired from experimentalwork or computational fluid dynamics (CFD) simulations of varyingfidelity. In this study the boundary layer thickness is obtained froma RANS CFD simulation. The combination of the STE noise model, inconjunction with Chase wavenumber-frequency spectrum input,will be referred to as the “STE-Chase” method.
3.2. TNO wavenumber-frequency spectrum model
The second wavenumber-frequency spectrum model imple-mented as part of this work is the TNO model. The TNO model wasoriginally devised by Parchen at the TNO Institute of AppliedPhysics [34]. It is computationally efficient, robust and models thephysics of a turbulent boundary layer more accurately than mostother models. Based on the TNO model, the wavenumber-frequency spectrum of a turbulent boundary layer can be foundfrom Ref. [34],
Pðu; k1; k2Þ ¼ 4r20k21
k21 þ k22
ðd0
L3u
23
�vU1
vzw
�2
F33Fme�2jkjzw!dzw;
(22)
where zw is the wall normal direction, L3 is the vertical correlationlength characterizing the vertical extent of the vertical turbulentvelocity component (u3), u23 is the vertical Reynolds stress,
vU1vzw
is thevelocity gradient in the wall normal direction through the bound-ary layer, F33 is the vertical velocity spectrum, Fm is the movingaxis spectrum and jkj is the magnitude of the wavenumber vector.The vertical velocity spectrum has been defined as
F33 ¼ 4
9pk2e
k21.k2e þ k22
.k2eh
1þ ðk1=keÞ2 þ ðk2=keÞ2i73
; (23)
where ke describes the wavenumber of the energy containingeddies [35]. Similarly, the moving axis spectrum which describeshow the turbulent velocity spectrum is distorted by the evolution ofeddies as they are convected, is defined as follows [35],
Fm ¼ 1a2
ffiffiffip
p e�ðu�Uck1Þ2
a22 ; (24)
where a2 ¼ 0:05 UcL3
and Uc ¼ 0:7U∞. As before, the STE far-fieldnoise model, Eq. (12), requires the wavenumber-frequency spec-trum to be integrated with respect to k1, and hence, Eq. (22) isintegrated over k1 numerically. The boundary layer informationnecessary for the TNO wavenumber-frequency spectrum is ob-tained using RANS CFD. Inwhat follows, the combination of the STEnoise model and the TNO wavenumber-frequency spectrum inputwill be referred to as the “STE-TNO” approach.
In order to obtain the parameters required for the TNOwavenumber-frequency spectrum from a RANS CFD simulation, theapproach of Bertagnolio et al. is adopted [48]. The boundary layervelocity profile and hence the boundary layer thickness can beobtained directly from the CFD simulation. In order to estimate thevertical Reynolds stress, the following relationship with the tur-bulent kinetic energy (TKE), k, obtained from the CFD simulation,can be used.
u23 ¼ akk; (25)
where ak is taken as 0.30 and 0.45 for the pressure and the suctionside, respectively [48]. The wavenumber of the energy containingeddies is related to the turbulent dissipation rate, ε, and the tur-bulent kinetic energy, k, by
ke ¼ 1:923ε
k3=2; (26)
which in turn can be related to the vertical correlation length asfollows,
L3 ¼ 0:747=ke: (27)
Lastly, the turbulence dissipation rate can be calculated from thespecific turbulence dissipation rate u, obtained from the RANS CFDsimulation, as follows [49],
ε ¼ 0:09ku: (28)
It is important to note that the quantities required as input intothe TNO model can be obtained from any RANS CFD simulation,both from airfoils with a straight trailing edge as well as from air-foils with a serrated trailing edge. Clearly though, a straight trailingedge simulation will not take the changes due to the presence ofany serrations into account, and hence, the necessity to perform aCFD simulation of an airfoil with a serrated trailing edge will beinvestigated in Section 4.2.
3.3. Computational setup
A three-dimensional steady RANS CFD simulation is employedto study the NACA 0018 airfoil with and without a serrated trailingedge and to provide the necessary boundary layer information foruse in Eqs. (21) and (22). The RANS equations were numericallysolved using OpenFOAM, employing the k� u SST turbulencemodel [49]. The simulations were carried out for two effectiveangles of attack, a ¼ 0� and 6.6�, and the free stream velocities ofU∞ ¼ 30m/s and 40m/s, corresponding to the chord-based Rey-nolds numbers of 3:9,105 and 5:2,105, respectively. Since the noisereduction prediction will be compared against the data from Leonet al. [14], the geometry of the airfoil and the serration follows theirexperimental setup and hence, the airfoil has a chord length of c ¼0:2 m, with the trailing edge serrations having a wavelength of l ¼20 mm and amplitude of h ¼ 20 mm, as shown in Fig. 4. A step tripwith a height of 0.8mm and a length of 2mm was placed on boththe suction and pressure sides of the airfoil at x =c ¼ 0:2 to ensure aturbulent boundary layer over the trailing edge area of the airfoil.The computational domain for the simulation extends 20c in thestreamwise direction, 10c in the normal direction and 0.4c in thespanwise direction, equivalent to four serration wavelengths, asillustrated in Fig. 4. At the airfoil surface, a non-slip boundarycondition was applied, while a periodic boundary condition wasused at the spanwise boundaries. A mesh convergence study hasbeen performed before settling with approximately 3.7 millionmesh elements and a yþ value of 30 with wall functions. The meshwas generated using the snappyHex technique available withinOpenFOAM. The geometry of the NACA 0018 airfoil as well as theboundary conditions can be seen in Fig. 4 and close-up views of thestep trip and serration mesh are shown in Fig. 5.
Fig. 6 shows the pressure distribution for the NACA 0018 airfoilwith straight trailing edge, as well as the pressure distribution inthe root and tip planes for the serrated airfoil case, obtained fromthe RANS simulation. The pressure distribution results for the

Fig. 4. (a) CFD domain and mesh overview and (b) NACA 0018 geometry.
Fig. 5. Close-up views of (a) step trip surface mesh and (b) serration surface mesh.
Y.D. Mayer et al. / Renewable Energy 143 (2019) 679e691 685
baseline NACA 0018 airfoil, i.e. straight trailing edge, using XFoil isalso provided for comparison. It can be seen in Fig. 4 that thepressure distribution does not change greatly between the straightand serrated case for U∞ ¼ 30m/s at a ¼ 0� angle of attack. The CFDsimulations show a strong pressure change around the step tripwhich was also observed in previous similar CFD simulations [50].In the case of a NACA 0018 at a ¼ 6.6� and a free stream velocity ofU∞ ¼ 40m/s, both the suction side and pressure side exhibit astrong pressure change around the step trip again. There is also aslight difference in the suction peak when comparing the straighttrailing edge baseline case to the serration pressure distribution.Additionally, the pressure distribution for the tip plane reveals apressure difference over the serration leading to a small amount ofadditional lift in comparison to the baseline case.
4. Results and discussion
In this section, we will use the two far-field noise predictiontools, namely the STE and Howe's model, using different types ofwavenumber-frequency spectra input, and will compare the resultsagainst available experimental data. The experimental data aretaken from a recent work by Leon et al. [14], for a NACA 0018 airfoilwith a chord length of 20 cm, span of 40 cm and flow velocities of
U∞ ¼ 30m/s, 35m/s and 40m/s. The airfoil is tripped at 20% chordusing carborundum and the acoustic measurements were obtainedusing a beamforming microphone array consisting of 64 electret-condenser microphones located at a distance of 1.05m from theairfoil. The sawtooth serrations used have a length of 2h ¼ 4 cm anda wavelength of l ¼ 2 cm. Two test cases are considered in thepresent work, firstly for a free stream velocity of U∞ ¼ 30m/s anda ¼ 0� angle of attack and secondly for a free stream velocity ofU∞ ¼ 40m/s at an effective angle of attack of a ¼ 6.6� (corre-sponding to the geometric angle of attack of 12+ [14]).
Firstly, the STE-Chase approach will be compared against theSTE-TNO approach, where the CFD results were obtained from astraight trailing edge to ensure a consistent comparison. Secondly,CFD simulation results for the NACA 0018 airfoil with a serratedtrailing edge will be used as an input into the STE-TNO approach.Since it is unclear which location on the serration should be chosento extract the required boundary layer parameters as input in theSTE model, a selection of several boundary layer extraction loca-tions will be investigated to determine the sensitivity of the resultswith respect to the predicted far-field noise reduction. This will alsopermit a first comment onwhether it is necessary to perform a CFDsimulation with a serrated trailing edge or not.

Fig. 6. Pressure distribution for the NACA 0018 airfoil with straight and serratedtrailing edge: (a) U∞ ¼ 30m/s at a ¼ 0� , (b) U∞ ¼ 40m/s at a ¼ 6.6� .
Fig. 7. 1/3 octave band noise reduction for a NACA 0018 airfoil with l ¼ 2 cm and h ¼ 2cm; experimental data from Ref. [14]: (a) U∞ ¼ 30m/s at a ¼ 0� , (b) U∞ ¼ 40m/s ata ¼ 6.6� .
Y.D. Mayer et al. / Renewable Energy 143 (2019) 679e691686
4.1. Far-field prediction based on straight trailing edge CFD input
This section presents the predicted noise reduction (D SPL) re-sults based on the CFD simulation for the NACA 0018 airfoil with astraight trailing edge. All required flow-field information has beenextracted at x =c ¼ 0:99. Fig. 7(a) and (b) present a comparisonbetween the experimental noise reduction in 1/3 octave bandsfrom Ref. [14], the noise reduction obtained using Howe's model,Eq. (16), as well as the noise reduction from the STE-Chase, Eqs. (12)and (21), and STE-TNO, Eqs. (12) and (22), models for both testcases. A positive D SPL value is indicative of a reduction in airfoiltrailing edge noise. As can be seen from the results, Howe's noisereduction prediction increases for increasing frequencies, whilstthe STE based models predict a peak noise reduction at around630 Hz. Despite no available experimental data for low-frequencies,it can be seen for both test cases that for frequencies of up to 3 kHzthe STE-Chase approach was able to predict the noise reductionmore accurately, while the STE-TNO approach underpredicts thenoise reduction. At high-frequencies (>3 kHz), the discrepanciesbetween both STE-based models and the experimental measure-ments increase. The high-frequency deviation could be due to anumber of reasons. For example, this can be due to the fact that thewavenumber-frequency spectra become less accurate at high-frequencies, in particular, the spanwise correlation length mightdecay more quickly than anticipated in the wavenumber-frequencyspectra [20]. The discrepancy at higher frequencies may also notresult from the STE model. Whilst theoretically, the noise at high-frequencies should also be reduced, previous experiments haveshown that the high-frequency noise increase can be attributed tothe serration valley flow, which cannot be captured by a scatteringmodel [42]. The valley flow noise could possibly be captured using ahigh-fidelity CAA approach, which takes the flow field as input forthe noise prediction, albeit with the associated high computationalcost. However, the approach taken in this study, fundamentallybased on Amiet's scattering model, is computationally much moreattainable and therefore useful at a design stage. Additionally, thehigh-frequency deviation is unlikely to be of major concern forsome practical applications due to the lower absolute noise levels of
trailing edge noise at high frequencies.In contrast to the STE-based approaches, Howe's model over-
predicts the noise reduction, as also observed in previous studies[42]. Howe's model additionally predicts increasing noise re-ductions for increasing frequencies in contrast to both STE-basedpredictions and the presented experimental data. Comparing thea ¼ 0� case with the a ¼ 6.6� case, it can be seen that both ap-proaches capture the trend that the sound reduction potential isdecreased at increased angles of attack, and thereby follows theexperimental trend. The peak far-field noise reduction for the STE-Chase approach reduces from 10 dB at a ¼ 0� to 8 dB at a ¼ 6.6�,whilst the peak far-field noise reduction for the STE-TNO approachreduces from 6 dB at a ¼ 0� to 4 dB at a ¼ 6.6�.
4.2. Far-field prediction based on serrated trailing edge CFD input
This section utilizes the CFD simulation with a serrated trailingedge in order to investigate the changes to the predicted noisereduction due to the presence of a serration as well as its sensitivityto the boundary layer extraction location over the serration areausing the STE-TNO approach. In contrast to the STE-TNO approach,the sound reduction prediction based on the STE-Chase approachwould not vary much for the different boundary layer extractionlocation, because the boundary layer thickness, which is the onlyflow field input required for the STE-Chase approach, does not

Fig. 8. Boundary layer extraction locations and naming convention.
Y.D. Mayer et al. / Renewable Energy 143 (2019) 679e691 687
change considerably as a result of the presence of the serrations, aswill be seen in Fig. 9. As a result of the parametric study for the STE-TNO approach, one can therefore establish whether it is sufficientto perform a CFD analysis of an un-serrated airfoil or if theboundary layer information must be taken at a specific locationover the serration. This is key in order to obtain the correct input forthe STE model.
The parametric study with respect to the extraction locationover the serration area is conducted for the locations displayed inFig. 8, where “E” and “T” represent the edge-line of the serrationand the tip-plane, respectively.
It is crucial to determine which location provides the best inputinto the STE-TNO model, as the TNO wavenumber-frequencyspectrum is sensitive to changes in the boundary layer profile,vertical Reynolds stress changes and vertical correlation length.These parameters are influenced by the flow field changes due tothe formation of the horseshoe vortices at the edges of the serration[9,16], andwill therefore impact the noise reduction prediction. Thechanges to the flow field can clearly be seen in Fig. 9(a) and (b)depicting the velocity, turbulent kinetic energy (TKE) and turbulentdissipation boundary layer profiles for the suction side of the NACA0018 airfoil at a free stream velocity of U∞ ¼ 30m/s and a ¼ 0�, aswell as U∞ ¼ 40m/s and a ¼ 6.6�. It should be noted that the“baseline T0” case, represents the “T0” location without the serra-tion being present, i.e. a straight trailing edge.
At a ¼ 0�, one can see in Fig. 9a that the boundary layer velocityprofiles over the serration have a fuller profile, i.e. a reduced ve-locity deficit, when compared to the “T0” location. For a constantchordwise (x =c) position, the velocity profile is slightly fuller forthe edge location (“E”) when compared to the mid-plane location(“T”) of the serration. Similarly, it can be seen that for the locationscloser to the serration tip, the boundary layer velocity profilesbecome fuller, which matches the observations of Avallone et al.obtained using the Lattice Boltzmann method [20]. Similar obser-vations can be made for the TKE energy and turbulent dissipation.For the locations closer to the tip of the serration, lower TKE as wellas lower turbulent dissipation rates are observed. Equally, thepresented results indicate that for a constant chordwise (x =c)
position the TKE has decreased near the serration surface, whilstthe turbulent dissipation has increased near the surface for theserration edge locations (“E”) compared to the serration midplanelocations (“T”).
In the case of a ¼ 6.6�, Fig. 9b shows that the boundary layervelocity profiles have a reduced velocity deficit for the chordwiselocations closer to the serration tip. For a constant chordwise (x =c)position, the velocity profile is again fuller for the midplane loca-tions (“T”) when compared to the edge locations (“E”) of theserration. The turbulent dissipation is reduced toward the serrationtip and the reduction is greater than that of a ¼ 0�, while for aconstant chordwise (x =c) location, the edge locations (“E”) display ahigher level of dissipation. Lastly, it can be seen that TKE is againreduced toward the serration tip and that the TKE reduction for theserration edge locations (“E”) compared to the serration midplanelocations (“T”) is significantly more pronounced than at a ¼ 0�.These results are consistent with the previous experimental ob-servations by Liu et al. [16], which have found an increased flowmixing for flows passing over airfoil serrations due to the afore-mentioned horseshoe vortices on the serration edges, leading tofuller velocity boundary layer profiles and lower velocity fluctua-tions and thereby lower TKE.
Further insight into the flow field changes can be obtained bystudying the contour plots of the wake turbulent kinetic energy.Fig. 10 shows the TKE contour plots at different wake locations,x =c ¼ 1.0, 1.12 and 1.2, for the airfoil at a ¼ 0+ and 6:6+. The resultsshow that the TKE for the unserrated baseline case is uniform alongthe span at the chordwise location x =c ¼ 1.0 for both angles ofattack. The TKE results in Fig. 10c and d show the results for theserrated airfoil at a chordwise location of x =c ¼ 1.12 for both theangles of attack. It is evident that reduced TKE levels can be seenbetween the serrations for both cases. At a ¼ 0+, the TKE on thesuction and pressure side of the serration peaks in the midplane ofthe serration and reduces toward the serration edges and the areain between the neighboring serrations. At a ¼ 6:6+, an increasedTKE is observed on the pressure side in comparison to the suctionside. At the chordwise location of x =c ¼ 1.20, i.e. at the very trailingedge of the serration the flow follows the same trend as that oflocation x =c ¼ 1.12 for a ¼ 0+, but for a ¼ 6:6+ increased TKE levelscan be found in the serration valley region, revealing an upwardflow direction from the pressure side to the suction side, consistentwith the experimental observations by Liu et al. [16].
Finally, Fig. 11(a) and (b) illustrate the predicted noise reductionin 1/3 octave bands for the various extraction locations, as well asthe experimental data for both test cases of the NACA 0018 airfoil,i.e. U∞ ¼ 30m/s at a ¼ 0� and U∞ ¼ 40m/s at a ¼ 6.6� using theSTE-TNO approach. Again, a positive D SPL value is indicative of areduction in airfoil trailing edge noise. The baseline T0 case, rep-resents the T0 locationwithout the serration being present, i.e.witha straight trailing edge. It can be seen that at the peak experimentalnoise reduction, the agreement between the experimental data andthe simulation improves as the boundary layer extraction locationmoves toward the serration tip. Significant differences between the“T0” location and the “E3” location of almost 5 dB have been foundfor both angles of attack. Additionally, it is clear that for the samechordwise (x =c) position, the edge location (“E”) results in a highernoise reduction prediction compared to the serration midplane(“T”). These results are consistent with the earlier observationregarding the flow field changes over the serrations. The discrep-ancies at higher frequencies (>2e3 kHz) are again present and thelikely reasons have been elaborated in Section 4.1.
At a ¼ 0�, the “T0” and “baseline T0” (straight trailing edge)results are almost identical, revealing that the presence of theserration does not alter the flow field significantly before the

Fig. 9. Velocity, turbulent kinetic energy and turbulent dissipation boundary layer profiles in the wall-normal direction, zw , for the suction side at different locations of a NACA0018airfoil: (a/left column) U∞ ¼ 30m/s at a ¼ 0� , (b/right column) U∞ ¼ 40m/s at a ¼ 6.6� .
Y.D. Mayer et al. / Renewable Energy 143 (2019) 679e691688
physical serration for symmetric airfoils at a ¼ 0�. However, at a ¼6.6�, there is a noticeable difference between the “T0” and “baselineT0” location, because of the induced upward flowmotion due to thepressure difference between the suction and pressure sides of theairfoil. Similar to the results from Section 4.1, it is also clear fromFig. 11(a) and (b) that for the STE-TNO approach, an increased angleof attack leads to a smaller noise reduction.
The strong variation of the predicted D SPL depending on theboundary layer extraction location for the STE-TNO approach,demonstrated the fact that a prior knowledge of the wavenumber-frequency spectrum plays an important role for the accurate pre-diction of noise from serrated airfoils. This is in agreement with theflow field changes resulting from the presence of the serrations,which have revealed a strongly varying flow field over the serra-tions. Horseshoe vortices have been shown to develop over theedges of each serration, in both experiment and simulation[9,14,16,17,21]. Gruber [42] and Ragni et al. [18] have shown that thesurface pressure fluctuations change rapidly over a serration, andinvestigations by Avallone et al. [20,21] have revealed noticeablechanges in the velocity fluctuations in the boundary layer overserrations. It can, therefore, be concluded that serrations clearlyimpact the local flow-field, and therefore the sound radiation. The
results presented in this paper show a sensitivity of the STE scat-tering model toward the utilized wavenumber-frequency modeland the boundary layer extraction location. The need to furtherinvestigate the changes to the wavenumber-frequency spectrumdue to the presence of a serrated trailing edge is thereforedemonstrated.
5. Conclusions
A novel trailing edge noise reduction prediction model devel-oped by Lyu et al. for serrated airfoils has been implemented andvalidated successfully for straight and serrated trailing edges forrealistic airfoils. The implementation of the serration model iscomputationally efficient and consequently, it would also befeasible to use this code to optimize serration geometries within alarger optimization framework. The necessary boundary layer inputparameters are obtained from RANS CFD simulations. Twowavenumber-frequency spectra, namely Chase model and the TNOmodel, are implemented in the model, which is shown to provide abetter sound reduction prediction compared to Howe's model. Thisis believed to be due to the fact that the iterative solution provides amore accuratemodeling to the scattering response than the Green's
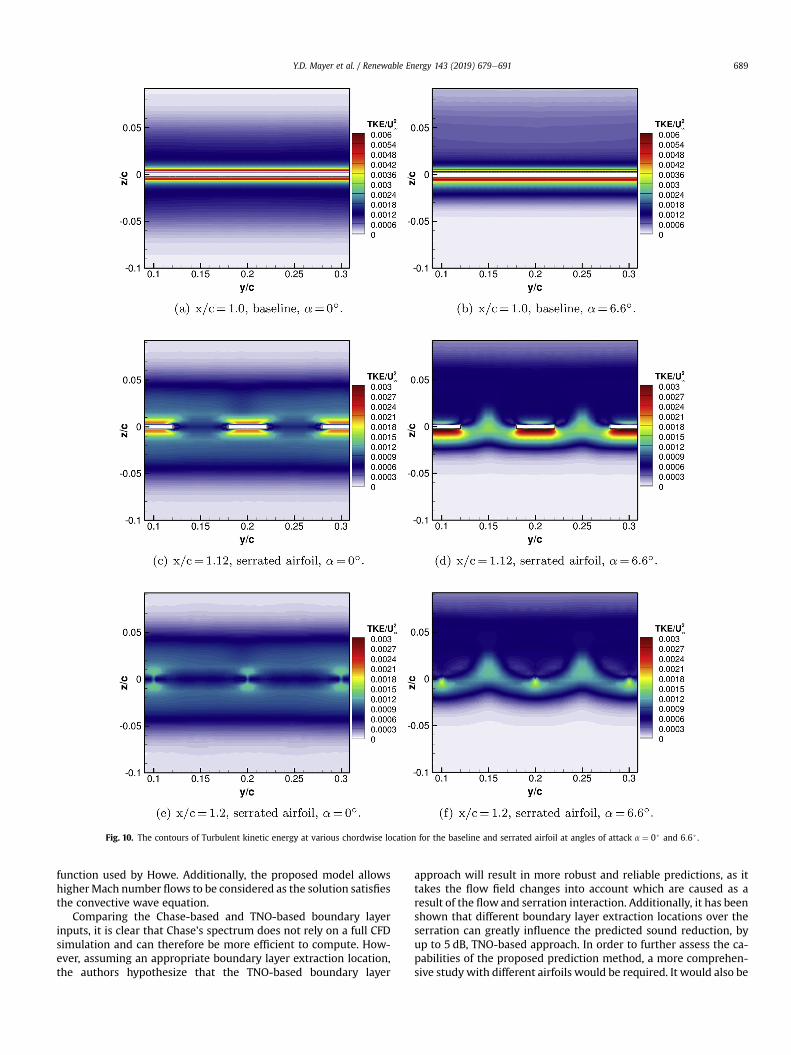
Fig. 10. The contours of Turbulent kinetic energy at various chordwise location for the baseline and serrated airfoil at angles of attack a ¼ 0+ and 6:6+ .
Y.D. Mayer et al. / Renewable Energy 143 (2019) 679e691 689
function used by Howe. Additionally, the proposed model allowshigherMach number flows to be considered as the solution satisfiesthe convective wave equation.
Comparing the Chase-based and TNO-based boundary layerinputs, it is clear that Chase's spectrum does not rely on a full CFDsimulation and can therefore be more efficient to compute. How-ever, assuming an appropriate boundary layer extraction location,the authors hypothesize that the TNO-based boundary layer
approach will result in more robust and reliable predictions, as ittakes the flow field changes into account which are caused as aresult of the flow and serration interaction. Additionally, it has beenshown that different boundary layer extraction locations over theserration can greatly influence the predicted sound reduction, byup to 5 dB, TNO-based approach. In order to further assess the ca-pabilities of the proposed prediction method, a more comprehen-sive study with different airfoils would be required. It would also be
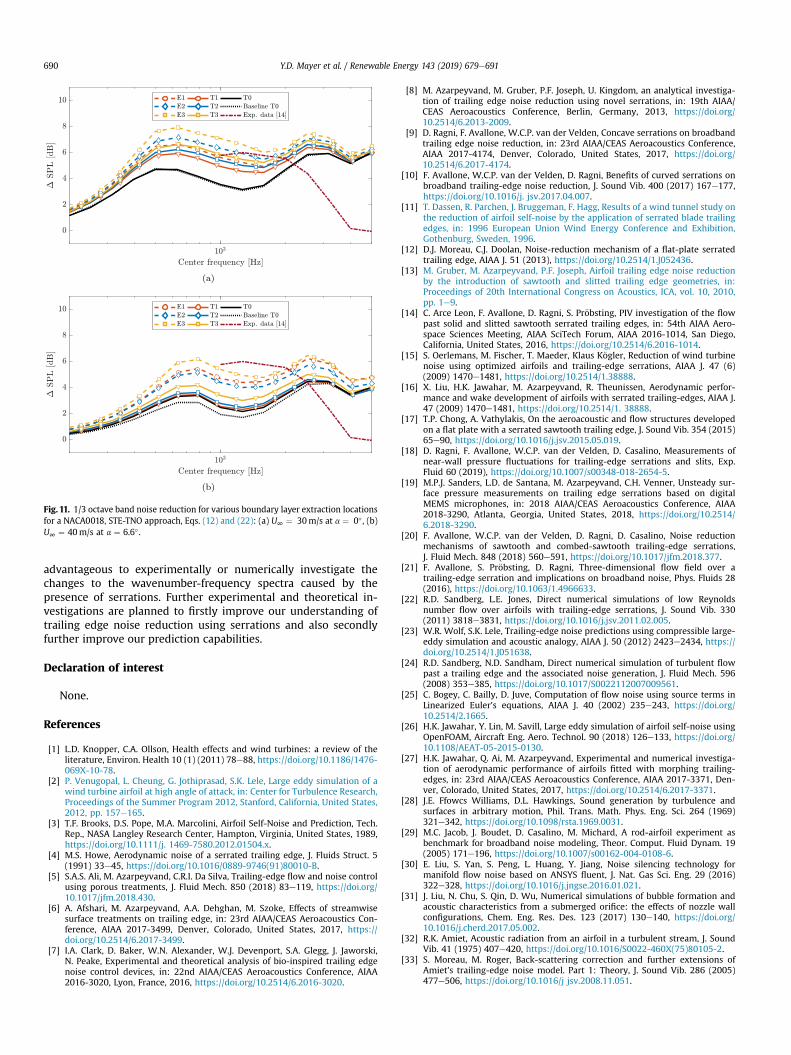
Fig. 11. 1/3 octave band noise reduction for various boundary layer extraction locationsfor a NACA0018, STE-TNO approach, Eqs. (12) and (22): (a) U∞ ¼ 30m/s at a ¼ 0� , (b)U∞ ¼ 40m/s at a ¼ 6.6� .
Y.D. Mayer et al. / Renewable Energy 143 (2019) 679e691690
advantageous to experimentally or numerically investigate thechanges to the wavenumber-frequency spectra caused by thepresence of serrations. Further experimental and theoretical in-vestigations are planned to firstly improve our understanding oftrailing edge noise reduction using serrations and also secondlyfurther improve our prediction capabilities.
Declaration of interest
None.
References
[1] L.D. Knopper, C.A. Ollson, Health effects and wind turbines: a review of theliterature, Environ. Health 10 (1) (2011) 78e88, https://doi.org/10.1186/1476-069X-10-78.
[2] P. Venugopal, L. Cheung, G. Jothiprasad, S.K. Lele, Large eddy simulation of awind turbine airfoil at high angle of attack, in: Center for Turbulence Research,Proceedings of the Summer Program 2012, Stanford, California, United States,2012, pp. 157e165.
[3] T.F. Brooks, D.S. Pope, M.A. Marcolini, Airfoil Self-Noise and Prediction, Tech.Rep., NASA Langley Research Center, Hampton, Virginia, United States, 1989,https://doi.org/10.1111/j. 1469-7580.2012.01504.x.
[4] M.S. Howe, Aerodynamic noise of a serrated trailing edge, J. Fluids Struct. 5(1991) 33e45, https://doi.org/10.1016/0889-9746(91)80010-B.
[5] S.A.S. Ali, M. Azarpeyvand, C.R.I. Da Silva, Trailing-edge flow and noise controlusing porous treatments, J. Fluid Mech. 850 (2018) 83e119, https://doi.org/10.1017/jfm.2018.430.
[6] A. Afshari, M. Azarpeyvand, A.A. Dehghan, M. Szoke, Effects of streamwisesurface treatments on trailing edge, in: 23rd AIAA/CEAS Aeroacoustics Con-ference, AIAA 2017-3499, Denver, Colorado, United States, 2017, https://doi.org/10.2514/6.2017-3499.
[7] I.A. Clark, D. Baker, W.N. Alexander, W.J. Devenport, S.A. Glegg, J. Jaworski,N. Peake, Experimental and theoretical analysis of bio-inspired trailing edgenoise control devices, in: 22nd AIAA/CEAS Aeroacoustics Conference, AIAA2016-3020, Lyon, France, 2016, https://doi.org/10.2514/6.2016-3020.
[8] M. Azarpeyvand, M. Gruber, P.F. Joseph, U. Kingdom, an analytical investiga-tion of trailing edge noise reduction using novel serrations, in: 19th AIAA/CEAS Aeroacoustics Conference, Berlin, Germany, 2013, https://doi.org/10.2514/6.2013-2009.
[9] D. Ragni, F. Avallone, W.C.P. van der Velden, Concave serrations on broadbandtrailing edge noise reduction, in: 23rd AIAA/CEAS Aeroacoustics Conference,AIAA 2017-4174, Denver, Colorado, United States, 2017, https://doi.org/10.2514/6.2017-4174.
[10] F. Avallone, W.C.P. van der Velden, D. Ragni, Benefits of curved serrations onbroadband trailing-edge noise reduction, J. Sound Vib. 400 (2017) 167e177,https://doi.org/10.1016/j. jsv.2017.04.007.
[11] T. Dassen, R. Parchen, J. Bruggeman, F. Hagg, Results of a wind tunnel study onthe reduction of airfoil self-noise by the application of serrated blade trailingedges, in: 1996 European Union Wind Energy Conference and Exhibition,Gothenburg, Sweden, 1996.
[12] D.J. Moreau, C.J. Doolan, Noise-reduction mechanism of a flat-plate serratedtrailing edge, AIAA J. 51 (2013), https://doi.org/10.2514/1.J052436.
[13] M. Gruber, M. Azarpeyvand, P.F. Joseph, Airfoil trailing edge noise reductionby the introduction of sawtooth and slitted trailing edge geometries, in:Proceedings of 20th International Congress on Acoustics, ICA, vol. 10, 2010,pp. 1e9.
[14] C. Arce Leon, F. Avallone, D. Ragni, S. Pr€obsting, PIV investigation of the flowpast solid and slitted sawtooth serrated trailing edges, in: 54th AIAA Aero-space Sciences Meeting, AIAA SciTech Forum, AIAA 2016-1014, San Diego,California, United States, 2016, https://doi.org/10.2514/6.2016-1014.
[15] S. Oerlemans, M. Fischer, T. Maeder, Klaus K€ogler, Reduction of wind turbinenoise using optimized airfoils and trailing-edge serrations, AIAA J. 47 (6)(2009) 1470e1481, https://doi.org/10.2514/1.38888.
[16] X. Liu, H.K. Jawahar, M. Azarpeyvand, R. Theunissen, Aerodynamic perfor-mance and wake development of airfoils with serrated trailing-edges, AIAA J.47 (2009) 1470e1481, https://doi.org/10.2514/1. 38888.
[17] T.P. Chong, A. Vathylakis, On the aeroacoustic and flow structures developedon a flat plate with a serrated sawtooth trailing edge, J. Sound Vib. 354 (2015)65e90, https://doi.org/10.1016/j.jsv.2015.05.019.
[18] D. Ragni, F. Avallone, W.C.P. van der Velden, D. Casalino, Measurements ofnear-wall pressure fluctuations for trailing-edge serrations and slits, Exp.Fluid 60 (2019), https://doi.org/10.1007/s00348-018-2654-5.
[19] M.P.J. Sanders, L.D. de Santana, M. Azarpeyvand, C.H. Venner, Unsteady sur-face pressure measurements on trailing edge serrations based on digitalMEMS microphones, in: 2018 AIAA/CEAS Aeroacoustics Conference, AIAA2018-3290, Atlanta, Georgia, United States, 2018, https://doi.org/10.2514/6.2018-3290.
[20] F. Avallone, W.C.P. van der Velden, D. Ragni, D. Casalino, Noise reductionmechanisms of sawtooth and combed-sawtooth trailing-edge serrations,J. Fluid Mech. 848 (2018) 560e591, https://doi.org/10.1017/jfm.2018.377.
[21] F. Avallone, S. Pr€obsting, D. Ragni, Three-dimensional flow field over atrailing-edge serration and implications on broadband noise, Phys. Fluids 28(2016), https://doi.org/10.1063/1.4966633.
[22] R.D. Sandberg, L.E. Jones, Direct numerical simulations of low Reynoldsnumber flow over airfoils with trailing-edge serrations, J. Sound Vib. 330(2011) 3818e3831, https://doi.org/10.1016/j.jsv.2011.02.005.
[23] W.R. Wolf, S.K. Lele, Trailing-edge noise predictions using compressible large-eddy simulation and acoustic analogy, AIAA J. 50 (2012) 2423e2434, https://doi.org/10.2514/1.J051638.
[24] R.D. Sandberg, N.D. Sandham, Direct numerical simulation of turbulent flowpast a trailing edge and the associated noise generation, J. Fluid Mech. 596(2008) 353e385, https://doi.org/10.1017/S0022112007009561.
[25] C. Bogey, C. Bailly, D. Juve, Computation of flow noise using source terms inLinearized Euler's equations, AIAA J. 40 (2002) 235e243, https://doi.org/10.2514/2.1665.
[26] H.K. Jawahar, Y. Lin, M. Savill, Large eddy simulation of airfoil self-noise usingOpenFOAM, Aircraft Eng. Aero. Technol. 90 (2018) 126e133, https://doi.org/10.1108/AEAT-05-2015-0130.
[27] H.K. Jawahar, Q. Ai, M. Azarpeyvand, Experimental and numerical investiga-tion of aerodynamic performance of airfoils fitted with morphing trailing-edges, in: 23rd AIAA/CEAS Aeroacoustics Conference, AIAA 2017-3371, Den-ver, Colorado, United States, 2017, https://doi.org/10.2514/6.2017-3371.
[28] J.E. Ffowcs Williams, D.L. Hawkings, Sound generation by turbulence andsurfaces in arbitrary motion, Phil. Trans. Math. Phys. Eng. Sci. 264 (1969)321e342, https://doi.org/10.1098/rsta.1969.0031.
[29] M.C. Jacob, J. Boudet, D. Casalino, M. Michard, A rod-airfoil experiment asbenchmark for broadband noise modeling, Theor. Comput. Fluid Dynam. 19(2005) 171e196, https://doi.org/10.1007/s00162-004-0108-6.
[30] E. Liu, S. Yan, S. Peng, L. Huang, Y. Jiang, Noise silencing technology formanifold flow noise based on ANSYS fluent, J. Nat. Gas Sci. Eng. 29 (2016)322e328, https://doi.org/10.1016/j.jngse.2016.01.021.
[31] J. Liu, N. Chu, S. Qin, D. Wu, Numerical simulations of bubble formation andacoustic characteristics from a submerged orifice: the effects of nozzle wallconfigurations, Chem. Eng. Res. Des. 123 (2017) 130e140, https://doi.org/10.1016/j.cherd.2017.05.002.
[32] R.K. Amiet, Acoustic radiation from an airfoil in a turbulent stream, J. SoundVib. 41 (1975) 407e420, https://doi.org/10.1016/S0022-460X(75)80105-2.
[33] S. Moreau, M. Roger, Back-scattering correction and further extensions ofAmiet's trailing-edge noise model. Part 1: Theory, J. Sound Vib. 286 (2005)477e506, https://doi.org/10.1016/j jsv.2008.11.051.

Y.D. Mayer et al. / Renewable Energy 143 (2019) 679e691 691
[34] R.R. Parchen, Progress Report DRAW: A Prediction Scheme for Trailing EdgeNoise Based on Detailed Boundary Layer Characteristics, TNO-Report HAG-RPT, TNO Institute of Applied Physics, 1998.
[35] F. Bertagnolio, Trailing Edge Noise Model Applied to Wind Turbine Airfoils,Risø-R-163, Risø National Laboratory, Technical University of Denmark, Ros-kilde, Denmark, 2008, ISBN 9788755036567.
[36] D.J. Moreau, L.A. Brooks, C.J. Doolan, Flat plate self-noise reduction at low-to-moderate Reynolds number with trailing edge serrations, in: Proceedings ofAcoustics 2011, Gold Coast, Australia, 2011.
[37] B. Lyu, M. Azarpeyvand, S. Sinayoko, Prediction of noise from serrated trailingedges, J. Fluid Mech. 793 (2016) 556e588, https://doi.org/10.1017/jfm.2016.132.
[38] A. Fischer, F. Bertagnolio, W.Z. Shen, J. Madsen, Noise model for serratedtrailing edges compared to wind tunnel measurements, J. Phys. Conf. Ser. 753(2016), https://doi.org/10.1088/1742-6596/753/2/022053.
[39] X. Huang, Theoretical model of acoustic scattering from a flat plate withserrations, J. Fluid Mech. 819 (2017) 228e257, https://doi.org/10.1017/jfm.2017.176.
[40] L.J. Ayton, Analytic solution for aerodynamic noise generated by plates withspanwise-varying trailing edges, J. Fluid Mech. 849 (2018) 448e466, https://doi.org/10.1017/jfm.2018.431.
[41] R.K. Amiet, Noise due to turbulent flow past a trailing edge, J. Sound Vib. 47(1976) 387e393, https://doi.org/10.1016/0022-460X(76)90948-2.
[42] M. Gruber, Airfoil Noise Reduction by Edge Treatments, Ph.D. thesis, Univer-sity of Southampton, 2012.
[43] M.S. Howe, Noise produced by a sawtooth trailing edge, J. Acoust. Soc. Am. 90(1991) 482e487.
[44] S. Moreau, M. Roger, Back-scattering correction and further extensions ofAmiet's trailing-edge noise model. Part II: Application, J. Sound Vib. 323(2009) 397e425, 10. 1016/j.jsv.2008.11.051.
[45] W.R. Graham, A comparison of models for the wavenumber-frequency spec-trum of turbulent boundary layer pressures, J. Sound Vib. 206 (1997)541e565, https://doi.org/10.1006/jsvi. 1997.1114.
[46] F. Bertagnolio, H.A. Madsen, C. Bak, Experimental validation of TNO trailingedge noise model and application to airfoil optimization, in: European WindEnergy Conference, Marseille, France, 2009.
[47] M. Drela, XFOIL: an analysis and design system for low Reynolds numberairfoils, in: Low Reynolds Number Aerodynamics: Proceedings of the Con-ference Notre Dame, Notre Dame, Indiana, United States, 1989.
[48] F. Bertagnolio, A. Fischer, W. Jun Zhu, Tuning of turbulent boundary layeranisotropy for improved surface pressure and trailing-edge noise modeling,J. Sound Vib. 333 (2014) 991e1010, https://doi.org/10.1016/j.jsv.2013.10.008.
[49] F.R. Menter, M. Kuntz, R. Langtry, Ten years of industrial experience with theSST turbulence model, in: 4th International Symposium on Turbulence, Heatand Mass Transfer, 2003. Antalya, Turkey.
[50] J. Winkler, R.D. Sandberg, S. Moreau, Direct numerical simulation of the self-noise radiated by an airfoil in a narrow stream, in: 18th AIAA/CEAS Aero-acoustics Conference, AIAA 2012-2059, Colorado Springs, Colorado, UnitedStates, 2012, https://doi.org/10.2514/6.2012-2059.