A Review of IPO Activity, Pricing, and Allocations and Welch.… · A Review of IPO Activity,...
35
A Review of IPO Activity, Pricing, and Allocations JAY R. RITTER and IVO WELCH* ABSTRACT We review the theory and evidence on IPO activity: why firms go public, why they reward first-day investors with considerable underpricing, and how IPOs perform in the long run. Our perspective is threefold: First, we believe that many IPO phenomena are not stationary. Second, we believe research into share allocation issues is the most promising area of research in IPOs at the moment. Third, we argue that asymmetric information is not the primary driver of many IPO phe- nomena. Instead, we believe future progress in the literature will come from non- rational and agency conflict explanations. We describe some promising such alternatives. From 1980 to 2001, the number of companies going public in the United States exceeded one per business day. The number of initial public offerings ~IPOs! has varied from year to year, however, with some years seeing fewer than 100 IPOs, and others seeing more than 400. These IPOs raised $488 billion ~in 2001 dollars! in gross proceeds, an average of $78 million per deal. At the end of the first day of trading, their shares traded on average at 18.8 percent above the price at which the company sold them. For an investor buying shares at the first-day closing price and holding them for three years, IPOs returned 22.6 percent. Still, over three years, the average IPO under- performed the CRSP value-weighted market index by 23.4 percent and un- derperformed seasoned companies with the same market capitalization and book-to-market ratio by 5.1 percent. In a nutshell, these numbers summarize the patterns in issuing activity, underpricing, and long-run underperformance, which have been the focus of a large theoretical and empirical literature. We survey this literature, focus- ing on recent papers. Space constraints force us to take a U.S.-centric point of view and to omit a description of the institutional aspects of going public. The interested reader can consult Ellis, Michaely, and O’Hara ~2000!, * Ritter is from the Warrington College of Business Administration at the University of Flor- ida; Welch is from the Yale School of Management and the NBER. This survey was presented at the 2002 Atlanta AFA meetings. We thank Chris James, Roni Michaely, Ann Sherman, Dong- hang Zhang, and especially Tim Loughran and Maureen O’Hara for comments, and Kenneth French for supplying factor returns. The authors maintain a more extensive bibliography of IPO-related work at http:00www.iporesources.org. This web site contains links to many IPO- related sites and some reasonably up-to-date information on aggregate IPO activity and IPO working papers. THE JOURNAL OF FINANCE • VOL. LVII, NO. 4 • AUGUST 2002 1795
Transcript of A Review of IPO Activity, Pricing, and Allocations and Welch.… · A Review of IPO Activity,...
A Review of IPO Activity, Pricing,and Allocations
JAY R. RITTER and IVO WELCH*
ABSTRACT
We review the theory and evidence on IPO activity: why firms go public, why theyreward first-day investors with considerable underpricing, and how IPOs performin the long run. Our perspective is threefold: First, we believe that many IPOphenomena are not stationary. Second, we believe research into share allocationissues is the most promising area of research in IPOs at the moment. Third, weargue that asymmetric information is not the primary driver of many IPO phe-nomena. Instead, we believe future progress in the literature will come from non-rational and agency conf lict explanations. We describe some promising suchalternatives.
From 1980 to 2001, the number of companies going public in the UnitedStates exceeded one per business day. The number of initial public offerings~IPOs! has varied from year to year, however, with some years seeing fewerthan 100 IPOs, and others seeing more than 400. These IPOs raised $488billion ~in 2001 dollars! in gross proceeds, an average of $78 million per deal.At the end of the first day of trading, their shares traded on average at 18.8percent above the price at which the company sold them. For an investorbuying shares at the first-day closing price and holding them for three years,IPOs returned 22.6 percent. Still, over three years, the average IPO under-performed the CRSP value-weighted market index by 23.4 percent and un-derperformed seasoned companies with the same market capitalization andbook-to-market ratio by 5.1 percent.
In a nutshell, these numbers summarize the patterns in issuing activity,underpricing, and long-run underperformance, which have been the focus ofa large theoretical and empirical literature. We survey this literature, focus-ing on recent papers. Space constraints force us to take a U.S.-centric pointof view and to omit a description of the institutional aspects of going public.The interested reader can consult Ellis, Michaely, and O’Hara ~2000!,
* Ritter is from the Warrington College of Business Administration at the University of Flor-ida; Welch is from the Yale School of Management and the NBER. This survey was presentedat the 2002 Atlanta AFA meetings. We thank Chris James, Roni Michaely, Ann Sherman, Dong-hang Zhang, and especially Tim Loughran and Maureen O’Hara for comments, and KennethFrench for supplying factor returns. The authors maintain a more extensive bibliography ofIPO-related work at http:00www.iporesources.org. This web site contains links to many IPO-related sites and some reasonably up-to-date information on aggregate IPO activity and IPOworking papers.
THE JOURNAL OF FINANCE • VOL. LVII, NO. 4 • AUGUST 2002
1795
Foerster ~2000!, Jenkinson and Ljungqvist ~2001!, and Killian, Smith, andSmith ~2001! for descriptions of the institutional process. Ritter ~2002! andespecially Jenkinson and Ljungqvist give extensive coverage to inter-national patterns and practices.
Averages hide the time trends and year-by-year variation in these phe-nomena, as shown in Table I. The 1980s saw modest IPO activity ~about $8billion in issuing activity per year!. In the 1990s, issuing volume roughlydoubled to $20 billion per year during 1990 to 1994, doubled again from1995 to 1998 ~$35 billion per year!, and then doubled again from 1999 to2000 ~$65 billion per year!, before falling to $34 billion in 2001. Averagefirst-day returns show a similar pattern, increasing from 7.4 percent in the1980s to 11.2 percent in the early 1990s, to 18.1 percent in the mid-1990s,and to 65.0 percent in 1999 and 2000, before falling back to 14.0 percent in2001. The long-run performance of IPOs also varies over time. Three-yearmarket-adjusted buy-and-hold returns are negative in every subperiod, butnot for every cohort year. Style-adjusted buy-and-hold returns are not asreliably negative, with many cohorts, and some subperiods, having positivestyle-adjusted buy-and-hold returns.
Our article seeks to review different explanations for these patterns inissuing activity, underpricing, and long-run underperformance. But it alsoweighs in with our personal perspective on issues that are still contentious.We believe that the time-variation in these phenomena deserves more em-phasis. For example, the long-run performance of IPOs is not only sensitiveto the widely debated choice of econometric methodology, but also to thechoice of sample period, as shown in Table I. Further, we argue that asym-metric information theories are unlikely to be the primary determinant off luctuations in IPO activity and underpricing, especially the excesses of theInternet bubble period. Instead, we believe that specific nonrational expla-nations and agency explanations will play a bigger role in the future re-search agenda. In discussing theories of underpricing, we devote significantattention to the topic of share allocations and subsequent ownership. In ourview, how IPO shares are allocated is one of the most interesting issues inIPO research today.
The remainder of this article is organized as follows. In Section I, wesurvey IPO activity. Section II covers IPO pricing and allocation. Section IIIpresents evidence and analysis on the long-run underperformance of IPOs,and Section IV concludes.
I. IPO Activity: Choosing to Go Public
The first question must be “why do firms go public?” In most cases, theprimary answer is the desire to raise equity capital for the firm and tocreate a public market in which the founders and other shareholders canconvert some of their wealth into cash at a future date. Nonfinancial rea-sons, such as increased publicity, play only a minor role for most firms:
1796 The Journal of Finance
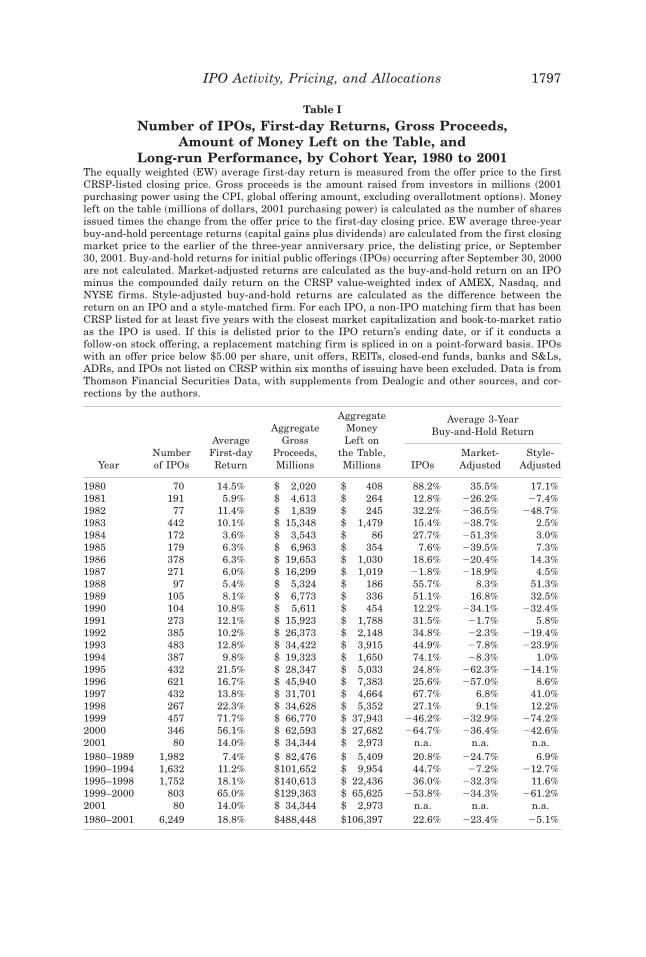
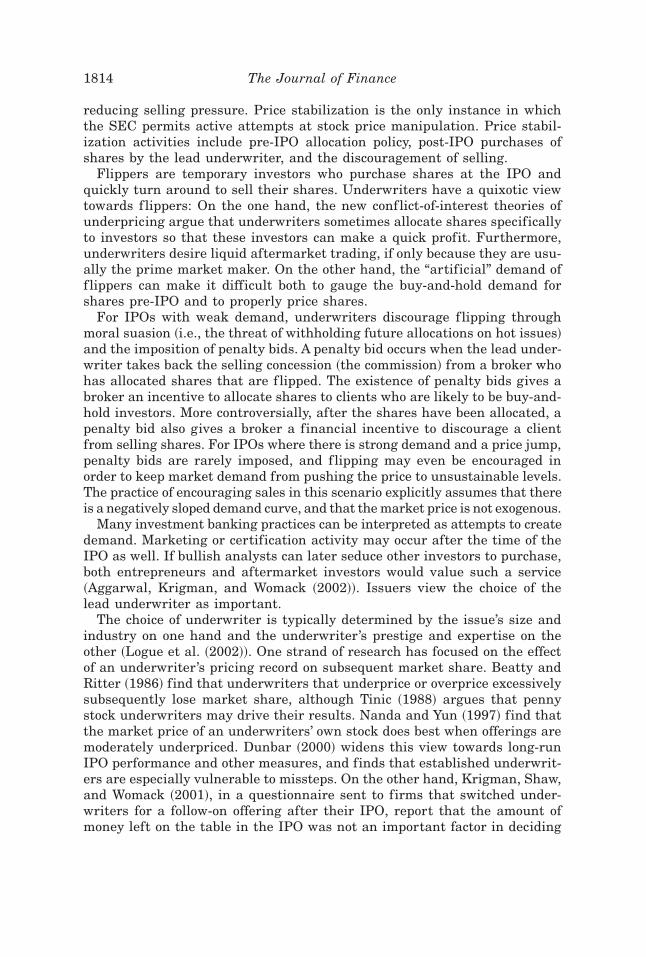
Table I
Number of IPOs, First-day Returns, Gross Proceeds,Amount of Money Left on the Table, and
Long-run Performance, by Cohort Year, 1980 to 2001The equally weighted ~EW! average first-day return is measured from the offer price to the firstCRSP-listed closing price. Gross proceeds is the amount raised from investors in millions ~2001purchasing power using the CPI, global offering amount, excluding overallotment options!. Moneyleft on the table ~millions of dollars, 2001 purchasing power! is calculated as the number of sharesissued times the change from the offer price to the first-day closing price. EW average three-yearbuy-and-hold percentage returns ~capital gains plus dividends! are calculated from the first closingmarket price to the earlier of the three-year anniversary price, the delisting price, or September30, 2001. Buy-and-hold returns for initial public offerings ~IPOs! occurring after September 30, 2000are not calculated. Market-adjusted returns are calculated as the buy-and-hold return on an IPOminus the compounded daily return on the CRSP value-weighted index of AMEX, Nasdaq, andNYSE firms. Style-adjusted buy-and-hold returns are calculated as the difference between thereturn on an IPO and a style-matched firm. For each IPO, a non-IPO matching firm that has beenCRSP listed for at least five years with the closest market capitalization and book-to-market ratioas the IPO is used. If this is delisted prior to the IPO return’s ending date, or if it conducts afollow-on stock offering, a replacement matching firm is spliced in on a point-forward basis. IPOswith an offer price below $5.00 per share, unit offers, REITs, closed-end funds, banks and S&Ls,ADRs, and IPOs not listed on CRSP within six months of issuing have been excluded. Data is fromThomson Financial Securities Data, with supplements from Dealogic and other sources, and cor-rections by the authors.
Average 3-YearBuy-and-Hold Return
YearNumberof IPOs
AverageFirst-dayReturn
AggregateGross
Proceeds,Millions
AggregateMoneyLeft on
the Table,Millions IPOs
Market-Adjusted
Style-Adjusted
1980 70 14.5% $ 2,020 $ 408 88.2% 35.5% 17.1%1981 191 5.9% $ 4,613 $ 264 12.8% 226.2% 27.4%1982 77 11.4% $ 1,839 $ 245 32.2% 236.5% 248.7%1983 442 10.1% $ 15,348 $ 1,479 15.4% 238.7% 2.5%1984 172 3.6% $ 3,543 $ 86 27.7% 251.3% 3.0%1985 179 6.3% $ 6,963 $ 354 7.6% 239.5% 7.3%1986 378 6.3% $ 19,653 $ 1,030 18.6% 220.4% 14.3%1987 271 6.0% $ 16,299 $ 1,019 21.8% 218.9% 4.5%1988 97 5.4% $ 5,324 $ 186 55.7% 8.3% 51.3%1989 105 8.1% $ 6,773 $ 336 51.1% 16.8% 32.5%1990 104 10.8% $ 5,611 $ 454 12.2% 234.1% 232.4%1991 273 12.1% $ 15,923 $ 1,788 31.5% 21.7% 5.8%1992 385 10.2% $ 26,373 $ 2,148 34.8% 22.3% 219.4%1993 483 12.8% $ 34,422 $ 3,915 44.9% 27.8% 223.9%1994 387 9.8% $ 19,323 $ 1,650 74.1% 28.3% 1.0%1995 432 21.5% $ 28,347 $ 5,033 24.8% 262.3% 214.1%1996 621 16.7% $ 45,940 $ 7,383 25.6% 257.0% 8.6%1997 432 13.8% $ 31,701 $ 4,664 67.7% 6.8% 41.0%1998 267 22.3% $ 34,628 $ 5,352 27.1% 9.1% 12.2%1999 457 71.7% $ 66,770 $ 37,943 246.2% 232.9% 274.2%2000 346 56.1% $ 62,593 $ 27,682 264.7% 236.4% 242.6%2001 80 14.0% $ 34,344 $ 2,973 n.a. n.a. n.a.1980–1989 1,982 7.4% $ 82,476 $ 5,409 20.8% 224.7% 6.9%1990–1994 1,632 11.2% $101,652 $ 9,954 44.7% 27.2% 212.7%1995–1998 1,752 18.1% $140,613 $ 22,436 36.0% 232.3% 11.6%1999–2000 803 65.0% $129,363 $ 65,625 253.8% 234.3% 261.2%2001 80 14.0% $ 34,344 $ 2,973 n.a. n.a. n.a.1980–2001 6,249 18.8% $488,448 $106,397 22.6% 223.4% 25.1%
IPO Activity, Pricing, and Allocations 1797
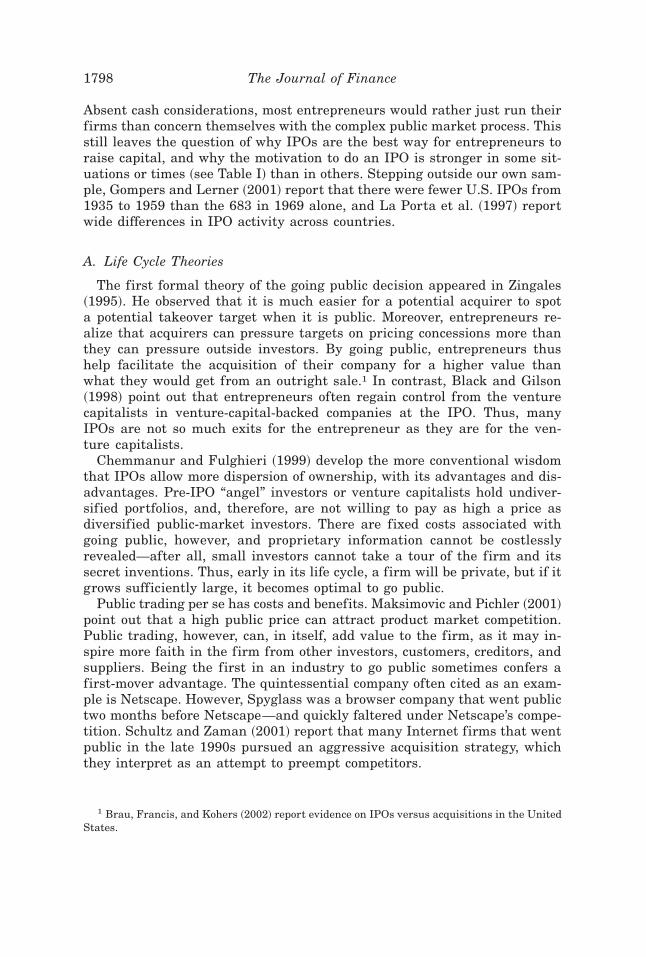
Absent cash considerations, most entrepreneurs would rather just run theirfirms than concern themselves with the complex public market process. Thisstill leaves the question of why IPOs are the best way for entrepreneurs toraise capital, and why the motivation to do an IPO is stronger in some sit-uations or times ~see Table I! than in others. Stepping outside our own sam-ple, Gompers and Lerner ~2001! report that there were fewer U.S. IPOs from1935 to 1959 than the 683 in 1969 alone, and La Porta et al. ~1997! reportwide differences in IPO activity across countries.
A. Life Cycle Theories
The first formal theory of the going public decision appeared in Zingales~1995!. He observed that it is much easier for a potential acquirer to spota potential takeover target when it is public. Moreover, entrepreneurs re-alize that acquirers can pressure targets on pricing concessions more thanthey can pressure outside investors. By going public, entrepreneurs thushelp facilitate the acquisition of their company for a higher value thanwhat they would get from an outright sale.1 In contrast, Black and Gilson~1998! point out that entrepreneurs often regain control from the venturecapitalists in venture-capital-backed companies at the IPO. Thus, manyIPOs are not so much exits for the entrepreneur as they are for the ven-ture capitalists.
Chemmanur and Fulghieri ~1999! develop the more conventional wisdomthat IPOs allow more dispersion of ownership, with its advantages and dis-advantages. Pre-IPO “angel” investors or venture capitalists hold undiver-sified portfolios, and, therefore, are not willing to pay as high a price asdiversified public-market investors. There are fixed costs associated withgoing public, however, and proprietary information cannot be costlesslyrevealed—after all, small investors cannot take a tour of the firm and itssecret inventions. Thus, early in its life cycle, a firm will be private, but if itgrows sufficiently large, it becomes optimal to go public.
Public trading per se has costs and benefits. Maksimovic and Pichler ~2001!point out that a high public price can attract product market competition.Public trading, however, can, in itself, add value to the firm, as it may in-spire more faith in the firm from other investors, customers, creditors, andsuppliers. Being the first in an industry to go public sometimes confers afirst-mover advantage. The quintessential company often cited as an exam-ple is Netscape. However, Spyglass was a browser company that went publictwo months before Netscape—and quickly faltered under Netscape’s compe-tition. Schultz and Zaman ~2001! report that many Internet firms that wentpublic in the late 1990s pursued an aggressive acquisition strategy, whichthey interpret as an attempt to preempt competitors.
1 Brau, Francis, and Kohers ~2002! report evidence on IPOs versus acquisitions in the UnitedStates.
1798 The Journal of Finance
B. Market-Timing Theories
Lucas and McDonald ~1990! develop an asymmetric information modelwhere firms postpone their equity issue if they know they are currentlyundervalued. If a bear market places too low a value on the firm, given theknowledge of entrepreneurs, then they will delay their IPOs until a bullmarket offers more favorable pricing. In Choe, Masulis, and Nanda ~1993!,firms avoid issuing in periods where few other good-quality firms issue. Othertheories have argued that markets provide valuable information to entre-preneurs ~“information spillovers”!, who respond to increased growth oppor-tunities signaled by higher prices ~Subrahmanyam and Titman ~1999!, Schultz~2000!!.
We suggest that in addition to these rational theories for IPO volume f luc-tuations, a plausible semirational theory without asymmetric informationcan also explain cycles in issuing activity: Entrepreneurs’ sense of enterprisevalue derives more from their internal perspective, their day-to-day involve-ment with the underlying business fundamentals, and less so from the pub-lic stock market. Sudden changes in the value of publicly traded firms arenot as quickly absorbed into the private sense of value held by entrepre-neurs. Thus, entrepreneurs adjust their valuation with a lag. As a result,even if the market price is driven by irrational public sentiment or the en-trepreneur’s price is driven by irrational private sentiment, entrepreneursare more inclined to sell shares after valuations in the public markets haveincreased.
C. Evidence
For the most part, formal theories of IPO issuing activity are difficult totest. This is because researchers usually only observe the set of firms actu-ally going public. They do not observe how many private firms could havegone public. Pagano, Panetta, and Zingales ~1998! escape this criticism witha unique data set of Italian firms. They find that larger companies andcompanies in industries with high market-to-book ratios are more likely togo public, and that companies going public seem to have reduced their costsof credit. Remarkably, they also find that IPO activity follows high invest-ment and growth, not vice versa. Lerner ~1994! focuses on a single U.S.industry, biotechnology. Lerner documents that industry market-to-bookratios have a substantial effect on the decision to go public rather than toacquire additional venture capital financing.
The academic literature has tended to view increases in the valuation ofcomparable firms as ref lecting improved growth opportunities. But morefavorable investor sentiment could also play a role in the increased valua-tions. When investors are overoptimistic, firms respond by issuing equity ina “window of opportunity.” Baker and Wurgler ~2000! investigate a predic-tion of this framework. Using annual data starting in the 1920s on aggre-gate equity issuance relative to debt plus equity issuance, they find that thehigher the fraction of equity issuance is, the lower the overall stock market
IPO Activity, Pricing, and Allocations 1799
return is in the following year. Lowry ~2002! finds that investor sentiment~measured by the discount on closed-end funds!, growth opportunities, andadverse selection considerations all are determinants of aggregate IPO vol-ume. A glance at Table I also conveys some of the correlation between IPOissuing activity and underpricing, investigated in greater detail in Lowryand Schwert ~2002!. They and other authors find that high IPO first-dayreturns lead high IPO activity by about six months.
High IPO activity may follow high underpricing because underwriters en-courage more firms to go public when public valuations turn out to be higherthan expected and because underwriters discourage firms from filing or pro-ceeding with an offering when public valuations turn out to be lower thanexpected. For example, in 2000, the Nasdaq Composite index had the lowestreturn in Nasdaq’s 30-year history, and the ratio of withdrawn offerings tocompleted offerings increased to 38 percent, a proportion much higher thannormal ~Ljungqvist and Wilhelm ~2002b!!.
D. The Changing Composition of IPO Issuers
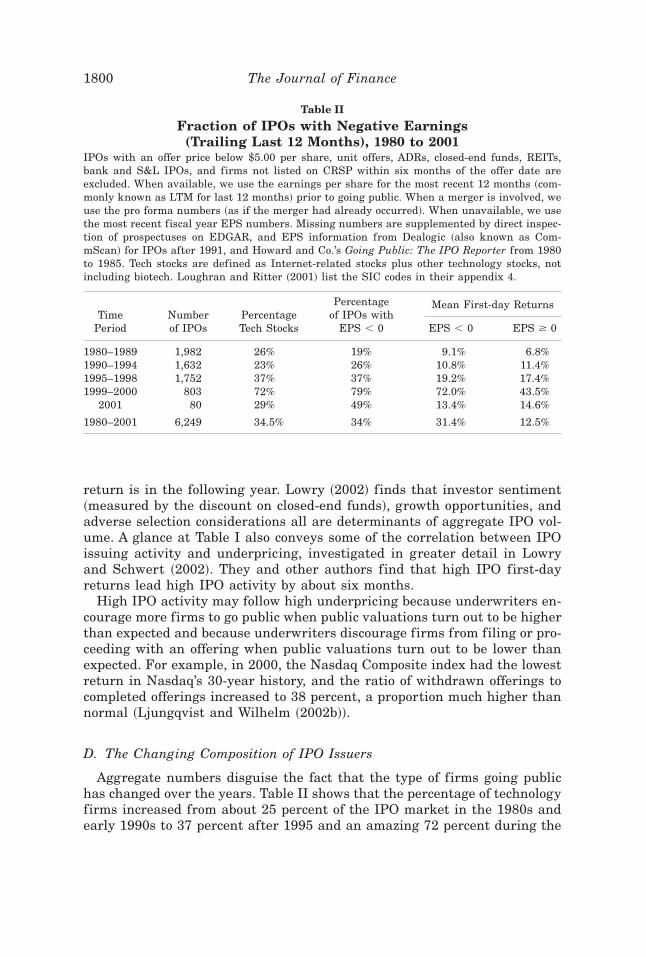
Aggregate numbers disguise the fact that the type of firms going publichas changed over the years. Table II shows that the percentage of technologyfirms increased from about 25 percent of the IPO market in the 1980s andearly 1990s to 37 percent after 1995 and an amazing 72 percent during the
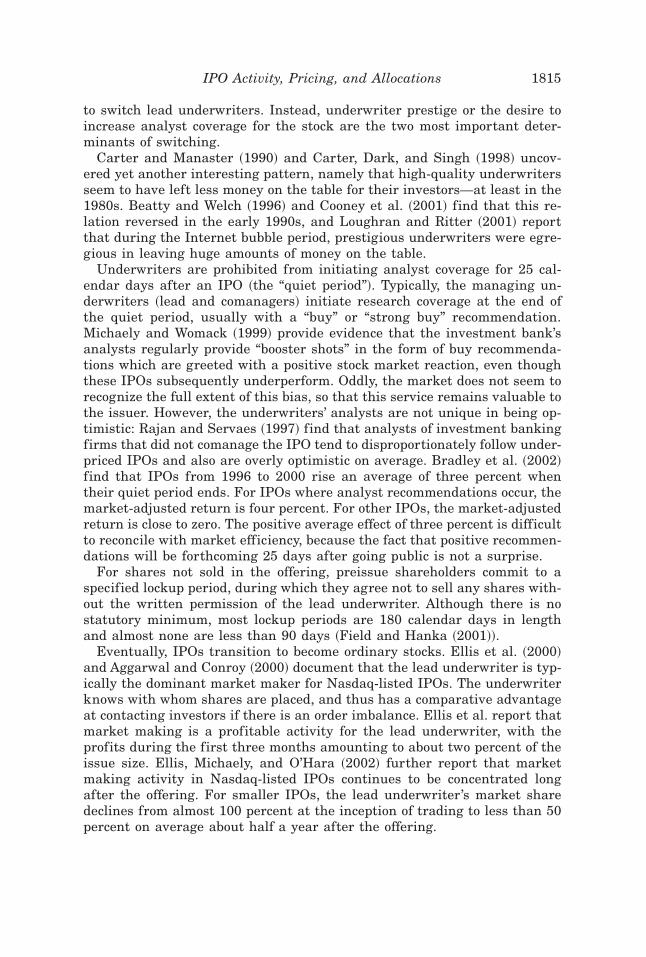
Table II
Fraction of IPOs with Negative Earnings(Trailing Last 12 Months), 1980 to 2001
IPOs with an offer price below $5.00 per share, unit offers, ADRs, closed-end funds, REITs,bank and S&L IPOs, and firms not listed on CRSP within six months of the offer date areexcluded. When available, we use the earnings per share for the most recent 12 months ~com-monly known as LTM for last 12 months! prior to going public. When a merger is involved, weuse the pro forma numbers ~as if the merger had already occurred!. When unavailable, we usethe most recent fiscal year EPS numbers. Missing numbers are supplemented by direct inspec-tion of prospectuses on EDGAR, and EPS information from Dealogic ~also known as Com-mScan! for IPOs after 1991, and Howard and Co.’s Going Public: The IPO Reporter from 1980to 1985. Tech stocks are defined as Internet-related stocks plus other technology stocks, notincluding biotech. Loughran and Ritter ~2001! list the SIC codes in their appendix 4.
Mean First-day ReturnsTime
PeriodNumberof IPOs
PercentageTech Stocks
Percentageof IPOs with
EPS , 0 EPS , 0 EPS $ 0
1980–1989 1,982 26% 19% 9.1% 6.8%1990–1994 1,632 23% 26% 10.8% 11.4%1995–1998 1,752 37% 37% 19.2% 17.4%1999–2000 803 72% 79% 72.0% 43.5%
2001 80 29% 49% 13.4% 14.6%
1980–2001 6,249 34.5% 34% 31.4% 12.5%
1800 The Journal of Finance
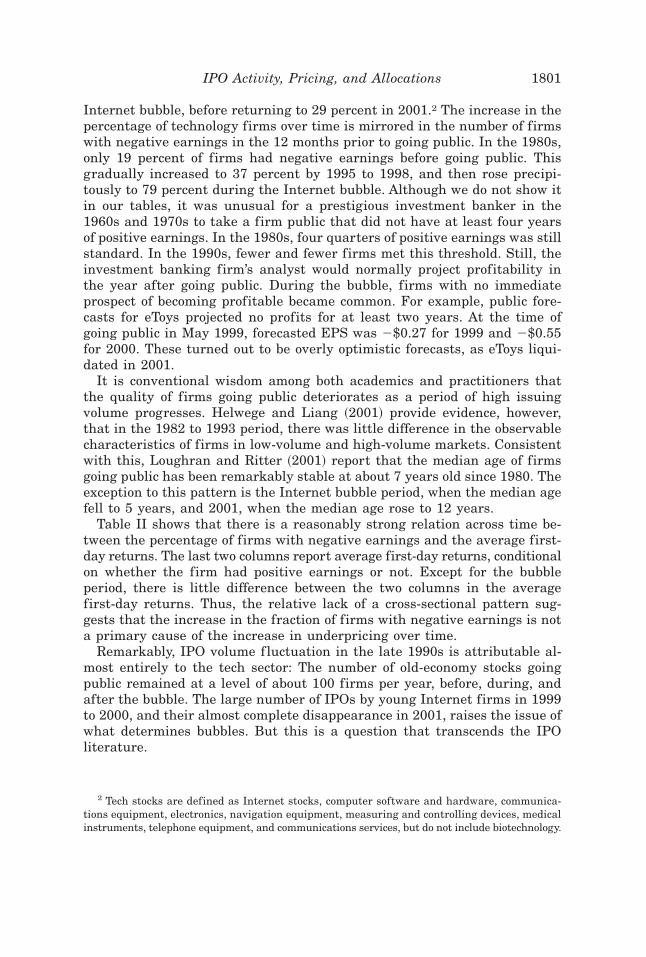
Internet bubble, before returning to 29 percent in 2001.2 The increase in thepercentage of technology firms over time is mirrored in the number of firmswith negative earnings in the 12 months prior to going public. In the 1980s,only 19 percent of firms had negative earnings before going public. Thisgradually increased to 37 percent by 1995 to 1998, and then rose precipi-tously to 79 percent during the Internet bubble. Although we do not show itin our tables, it was unusual for a prestigious investment banker in the1960s and 1970s to take a firm public that did not have at least four yearsof positive earnings. In the 1980s, four quarters of positive earnings was stillstandard. In the 1990s, fewer and fewer firms met this threshold. Still, theinvestment banking firm’s analyst would normally project profitability inthe year after going public. During the bubble, firms with no immediateprospect of becoming profitable became common. For example, public fore-casts for eToys projected no profits for at least two years. At the time ofgoing public in May 1999, forecasted EPS was 2$0.27 for 1999 and 2$0.55for 2000. These turned out to be overly optimistic forecasts, as eToys liqui-dated in 2001.
It is conventional wisdom among both academics and practitioners thatthe quality of firms going public deteriorates as a period of high issuingvolume progresses. Helwege and Liang ~2001! provide evidence, however,that in the 1982 to 1993 period, there was little difference in the observablecharacteristics of firms in low-volume and high-volume markets. Consistentwith this, Loughran and Ritter ~2001! report that the median age of firmsgoing public has been remarkably stable at about 7 years old since 1980. Theexception to this pattern is the Internet bubble period, when the median agefell to 5 years, and 2001, when the median age rose to 12 years.
Table II shows that there is a reasonably strong relation across time be-tween the percentage of firms with negative earnings and the average first-day returns. The last two columns report average first-day returns, conditionalon whether the firm had positive earnings or not. Except for the bubbleperiod, there is little difference between the two columns in the averagefirst-day returns. Thus, the relative lack of a cross-sectional pattern sug-gests that the increase in the fraction of firms with negative earnings is nota primary cause of the increase in underpricing over time.
Remarkably, IPO volume f luctuation in the late 1990s is attributable al-most entirely to the tech sector: The number of old-economy stocks goingpublic remained at a level of about 100 firms per year, before, during, andafter the bubble. The large number of IPOs by young Internet firms in 1999to 2000, and their almost complete disappearance in 2001, raises the issue ofwhat determines bubbles. But this is a question that transcends the IPOliterature.
2 Tech stocks are defined as Internet stocks, computer software and hardware, communica-tions equipment, electronics, navigation equipment, measuring and controlling devices, medicalinstruments, telephone equipment, and communications services, but do not include biotechnology.
IPO Activity, Pricing, and Allocations 1801
E. Summary
We interpret the evidence on the going-public decision as suggesting thatfirms go public in response to favorable market conditions, but only if theyare beyond a certain stage in their life cycle. Perhaps the most importantunanswered question is why issuing volume drops so precipitously followingstock market drops. Although offer prices are lowered, many firms withdrawtheir offering rather than proceed with their IPO. In other words, why isthere quantity adjustment, rather than price adjustment? This is a puzzlenot only for the IPO market, but for follow-on offerings as well.
II. IPO Pricing and Allocation
Stoll and Curley ~1970!, Logue ~1973!, Reilly ~1973!, and Ibbotson ~1975!first documented a systematic increase from the offer price to the first dayclosing price.3 Academics use the terms first-day returns and underpricinginterchangeably. In our sample of 6,249 IPOs from 1980 to 2001 in Table I,the average first-day return is 18.8 percent.4 Although not shown here, ap-proximately 70 percent of the IPOs end the first day of trading at a closingprice greater than the offer price and about 16 percent have a first-dayreturn of exactly zero.5 We know of no exceptions to the rule that the IPOsof operating companies are underpriced, on average, in all countries. Theofferings of nonoperating companies, such as closed-end funds, are generallynot underpriced.
A. Theoretical Explanations of Short-run Underpricing
Ibbotson ~1975! offered a list of possible explanations for underpricing,many of which were formally explored by other authors in later work. Beforegoing into detail, it is important to understand that simple fundamentalmarket misvaluation or asset-pricing risk premia are unlikely to explain theaverage first-day return of 18.8 percent reported in our Table I. To put thisin perspective, the comparable daily market return has averaged only 0.05percent. Furthermore, if diversified IPO first-day investors require compen-
3 The opening market price is close to an unbiased indicator of the closing market price onthe first day, so results are insensitive to whether the opening or closing market price is used.The vast majority of empirical work has used the first closing price to measure the first-dayreturn. This is also frequently called the initial return.
4 The annual volume numbers reported in Table I are lower than those reported in Ritter~1998, Table 2! because of our exclusion of “penny” stocks ~defined as IPOs with an offer priceof below $5.00 per share! and unit offers. Ritter reports annual volume numbers for IPOsstarting in 1960. In the 1960s, 1970s, and 1980s, penny stock IPOs were a major portion of thenumber of IPOs, although only a small portion of aggregate proceeds.
5 From 1980 to 1994, only 15 out of 3,614 IPOs doubled in value on their first day of trading.During 1995 to 1998, 34 out of 1,752 IPOs doubled on the first day. In the Internet bubble yearsof 1999 to 2000, 182 out of 803 offerings doubled in price on the first day, with the last occur-rence in November 2000.
1802 The Journal of Finance
sation for bearing systematic or liquidity risk, why do second-day investors~purchasing from first-day investors! not seem to require this premium? Af-ter all, fundamental risk and liquidity constraints are unlikely to be re-solved within one day. Thus, the solution to the underpricing puzzle has tolie in focusing on the setting of the offer price, where the normal interplay ofsupply and demand is suppressed by the underwriter.
One way of classifying theories of underpricing is to categorize them onthe basis of whether asymmetric information or symmetric information isassumed. The former can, in turn, be classified into theories in which IPOissuers are more informed than investors ~perhaps about internal projects!and into theories in which investors are more informed than the issuer ~per-haps about demand!. Because we believe that recent share allocation- andtrading-related explanations offer considerable promise, we take the libertyto discuss these newer theories in their own section, even though they couldalso be distributed into asymmetric and symmetric information theories.
A.1. Theories Based on Asymmetric Information
If the issuer is more informed than investors, rational investors fear a lemonsproblem: Only issuers with worse-than-average quality are willing to sell theirshares at the average price. To distinguish themselves from the pool of low-quality issuers, high-quality issuers may attempt to signal their quality. Inthese models, better quality issuers deliberately sell their shares at a lowerprice than the market believes they are worth, which deters lower qualityissuers from imitating. With some patience, these issuers can recoup theirup-front sacrifice post-IPO, either in future issuing activity ~Welch ~1989!!,favorable market responses to future dividend announcements ~Allen andFaulhaber ~1989!!, or analyst coverage ~Chemmanur ~1993!!. In common withmany other signaling models, high-quality firms demonstrate that they arehigh quality by throwing money away. One way to do this is to leave moneyon the table in the IPO. On theoretical grounds, however, it is unclear whyunderpricing is a more efficient signal than, say, committing to spend moneyon charitable donations or advertising.
The evidence in favor of these signaling theories is, at best, mixed: Thereis evidence of substantial postissuing market activity by IPO firms ~Welch~1989!!, and it is clear that some issuers approach the market with an in-tention to conduct future equity issues.6 However, there is reason to believethat any price appreciation would induce entrepreneurs to return to themarket for more funding.7 Jegadeesh, Weinstein, and Welch ~1993! find thatreturns after the first day are just as effective in inducing future issuingactivity as the first-day returns are. Michaely and Shaw ~1994! outright
6 It is worth noting that there is little controversy about whether issuing firms pursue adynamic strategy, in which the IPO is just one part. The controversy is whether postissuingactivity can explain underpricing, not IPO activity.
7 Van Bommel and Vermaelen ~2001! find that firms with higher first-day returns spendmore money on investment after the IPO.
IPO Activity, Pricing, and Allocations 1803
reject signaling: In a simultaneous equation model, they find no evidence ofeither a higher propensity to return to the market for a seasoned offering orof a higher propensity to pay dividends for IPOs that were more under-priced. Still, aside from the persistence of the signaling explanation on thestreet, its most appealing feature is that some issuers voluntarily desire toleave money on the table to create “a good taste in investors’ mouths.” Assuch, it is relatively compatible with higher levels of IPO underpricing.
If investors are more informed than the issuer, for example, about the gen-eral market demand for shares, then the issuer faces a placement problem.The issuer does not know the price the market is willing to bear. In otherwords, an issuer faces an unknown demand for its stock. A number of theo-ries model a specific demand curve.
One can simply assume that all investors are equally informed, and thuspurchase shares only if their price is below their common assessment. Ob-served ~successful! IPOs thus are necessarily underpriced. There are, how-ever, some overpriced firms going public, which would not be predicted becauseall investors are assumed to know that these would be overpriced. A morerealistic assumption is that investors are differentially informed. Pricing toohigh might induce investors and issuers to fear a winner’s curse ~Rock ~1986!!or a negative cascade ~Welch ~1992!!.
In a winner’s curse, investors fear that they will only receive full alloca-tions if they happen to be among the most optimistic investors. When ev-eryone desires the offering, they get rationed. An investor would receive afull allocation of overpriced IPOs but only a partial allocation of underpricedIPOs. Thus, his average return, conditional on receiving shares, would bebelow the unconditional return. To break even, investors need to be under-priced. Koh and Walter ~1989! have rationing information and find that anuninformed strategy in Singapore indeed just about broke even.
In an informational cascade, investors attempt to judge the interest ofother investors. They only request shares when they believe the offering ishot. Pricing just a little too high leaves the issuer with too high a probabilityof complete failure, in which investors abstain because other investors ab-stain. In support, Amihud, Hauser, and Kirsh ~2001! find that IPOs tend tobe either undersubscribed or hugely oversubscribed, with very few offeringsmoderately oversubscribed.
Benveniste and Spindt ~1989!, Benveniste and Wilhelm ~1990!, and Spattand Srivastava ~1991! argue that the common practice of “bookbuilding” al-lows underwriters to obtain information from informed investors.8 With book-building, a preliminary offer price range is set, and then underwriters andissuers go on a “road show” to market the company to prospective investors.This road show helps underwriters to gauge demand as they record “indica-tions of interest” from potential investors. If there is strong demand, theunderwriter will set a higher offer price. But if potential investors know that
8 Benveniste and Busaba ~1997! consider whether bookbuilding or cascade creation is moreprofitable from the issuer’s point of view.
1804 The Journal of Finance
showing a willingness to pay a high price will result in a higher offer price,these investors must be offered something in return. To induce investors totruthfully reveal that they want to purchase shares at a high price, under-writers must offer them some combination of more IPO allocations and under-pricing when they indicate a willingness to purchase shares at a high price.
Bookbuilding theories lend themselves unusually well to empirical testswith available data. The most commonly cited evidence in favor of book-building theories is the effect of revisions in the offer price during the filingperiod, first documented by Hanley ~1993!. She finds that underwriters donot fully adjust their pricing upward to keep underpricing constant whendemand is strong. Thus, when underwriters revise the share price upwardfrom their original estimate in the preliminary prospectus, underpricing tendsto be higher. Table III shows that this pattern has held throughout 1980 to2001: When the offer price exceeds the maximum of the original file pricerange, the average underpricing of 53 percent is significantly above the 12percent for IPOs priced within their filing range, or the 3 percent for IPOsadjusting their offer price downward. This extra underpricing is interpretedto be compensation that is necessary to induce investors to reveal their highpersonal demand for shares. Consistent with the information revelation theoryof bookbuilding, Lee, Taylor, and Walter ~1999! and Cornelli and Goldreich~2001! show that informed investors request more, and preferentially receivemore, allocations. In related work, Cornelli and Goldreich ~2002! examineorders placed by institutional investors and find that underwriters set offerprices that are more related to the prices bid than to the quantities demanded.
The information-gathering perspective of bookbuilding is certainly useful,but the theory also suggests that the information provided by one incremen-tal investor is not very valuable when the investment banker can canvashundreds of potential investors. Thus, it is not obvious that this frameworkis capable of explaining average underpricing of more than a few percent.The average underpricing of 53 percent, conditional on the offer price havingbeen revised upwards, reported in Table III, seems too large to be explainedas equilibrium compensation for revealing favorable information.
Baron ~1982! offers a different, agency-based explanation for underpric-ing. His theory also has the issuer less informed, but relative to its under-writer, not relative to investors. To induce the underwriter to put in therequisite effort to market shares, it is optimal for the issuer to permit someunderpricing, because the issuer cannot monitor the underwriter withoutcost. Muscarella and Vetsuypens ~1989!, however, find that when underwrit-ers themselves go public, their shares are just as underpriced even thoughthere is no monitoring problem. This evidence does not favor the Baron hy-pothesis, although it does not refute it either. After all, underwriters maywant to underprice their own offerings in order to make the case that un-derpricing is a necessary cost of going public.
Habib and Ljungqvist ~2001! also argue that underpricing is a substitutefor costly marketing expenditures. Using a data set of IPOs from 1991 to1995, they report that an extra dollar left on the table reduces other mar-
IPO Activity, Pricing, and Allocations 1805
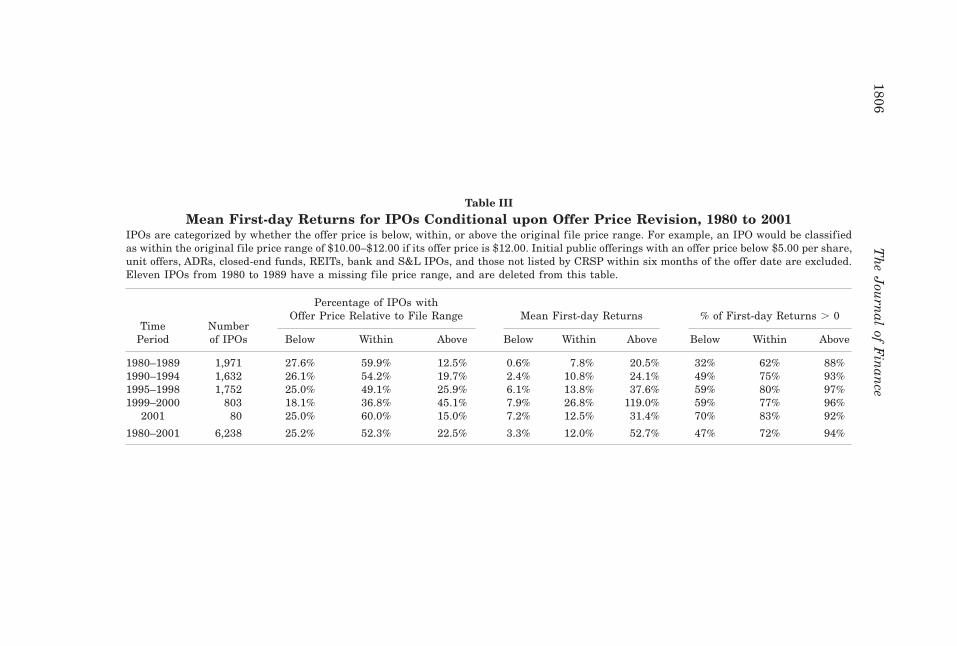
Table III
Mean First-day Returns for IPOs Conditional upon Offer Price Revision, 1980 to 2001IPOs are categorized by whether the offer price is below, within, or above the original file price range. For example, an IPO would be classifiedas within the original file price range of $10.00–$12.00 if its offer price is $12.00. Initial public offerings with an offer price below $5.00 per share,unit offers, ADRs, closed-end funds, REITs, bank and S&L IPOs, and those not listed by CRSP within six months of the offer date are excluded.Eleven IPOs from 1980 to 1989 have a missing file price range, and are deleted from this table.
Percentage of IPOs withOffer Price Relative to File Range Mean First-day Returns % of First-day Returns . 0
TimePeriod
Numberof IPOs Below Within Above Below Within Above Below Within Above
1980–1989 1,971 27.6% 59.9% 12.5% 0.6% 7.8% 20.5% 32% 62% 88%1990–1994 1,632 26.1% 54.2% 19.7% 2.4% 10.8% 24.1% 49% 75% 93%1995–1998 1,752 25.0% 49.1% 25.9% 6.1% 13.8% 37.6% 59% 80% 97%1999–2000 803 18.1% 36.8% 45.1% 7.9% 26.8% 119.0% 59% 77% 96%
2001 80 25.0% 60.0% 15.0% 7.2% 12.5% 31.4% 70% 83% 92%
1980–2001 6,238 25.2% 52.3% 22.5% 3.3% 12.0% 52.7% 47% 72% 94%
1806T
he
Jou
rnal
ofF
inan
ce
keting expenditures by a dollar. As with almost all other theories of under-pricing, however, these trade-off theories do not plausibly explain the severeunderpricing of IPOs during the Internet bubble. During the bubble, theIPOs of many Internet firms were the easiest shares ever to sell because ofthe intense interest by many investors. It is difficult to believe that an un-derwriter could not have easily placed shares with half the underpricingthat was observed.
All theories of underpricing based on asymmetric information share theprediction that underpricing is positively related to the degree of asymmet-ric information. When the asymmetric information uncertainty approacheszero in these models, underpricing disappears entirely. Consequently, a strat-egy of selling IPOs only in bundles could reduce the uncertainty about theaverage value of offerings, and with it, the average underpricing necessaryto successfully go public. In other words, because underwriters have discre-tion regarding whom shares are allocated to, they could insist on sellingIPOs only to investors who agree to buy both hot and cold IPOs. For averagelevels of underpricing that were observed in the 1980s, 7.4 percent, the bun-dling costs ~e.g., waiting for sufficiently many IPOs to become available,taste differences across investors, disagreements among issuers about value!may be higher than the bundling benefits. However, for the 65 percent un-derpricing in 1999 and 2000, this is not likely to be the case.
A.2. Theories Based on Symmetric Information
There are also theories of underpricing that do not rely on asymmetricinformation that is resolved on the first day of trading. Tinic ~1988! andHughes and Thakor ~1992! argue that issuers underprice to reduce theirlegal liability: An offering that starts trading at $30 that is priced at $20 isless likely to be sued than if it had been priced at $30, if only because it ismore likely that at some point the aftermarket share price will drop below$30 than below $20. In spite of this, Drake and Vetsuypens ~1993! find thatsued IPOs had higher, not lower underpricing, that is, that underpricing didnot protect them from being sued. However, Lowry and Shu ~2002! point outthat this may be because IPOs more likely to be sued later also underpricedmore. In our opinion, leaving money on the table appears to be a cost-ineffective way of avoiding subsequent lawsuits. But the most convincingevidence that legal liability is not the primary determinant of underpricingis that countries in which U.S. litigative tendencies are not present havesimilar levels of underpricing ~Keloharju ~1993!!.
One popular related explanation for the high IPO underpricing during theInternet bubble is that underwriters could not justify a higher offer price onInternet IPOs, perhaps out of legal liability concerns, given the already loftyvaluations on these companies. One way of interpreting this is that under-writers were “leaning against the wind” by not taking advantage of tempo-rary overoptimism on the part of some investors. Although this argumenthas a certain plausibility, we find it unconvincing because investment bank-
IPO Activity, Pricing, and Allocations 1807
ing firms were making other efforts to encourage overvaluations during theInternet bubble, such as subsequently issuing “buy” recommendations whenmarket prices had risen far above the offer price.9
Boehmer and Fishe ~2001! advance another explanation for underpricing.They note that trading volume in the aftermarket is higher, the greater isunderpricing. ~See Krigman, Shaw, and Womack ~1999! and Ellis et al. ~2000!for related evidence.! Thus, an underwriter that makes a market in a Nasdaq-listed IPO gains additional trading revenue. Unlike the lawsuit-avoidanceexplanation of underpricing, it is not clear how the issuing firm benefitsfrom the underpricing, unless the increased liquidity is persistent ~Boothand Chua ~1996!!.
B. Theories Focusing on the Allocation of Shares
In recent years, more attention has been drawn to how IPOs are allocatedand how their shares trade. Part of the reason for the increased academicattention on share allocation is related to the increased public attention onperceived unfairness in how shares are allocated, given the large amount ofmoney left on the table in recent years. Specifically, the allocation of sharesto institutional investors versus individuals has been a topic of interest. Thedevelopment of the literature on IPO trading activity has required access todetailed data, information that has only recently become available. We dis-cuss this literature on allocation and trading initiation separately from theprevious papers that we have reviewed because we believe that it exploresthe most interesting open questions today. How do investors decide in whichissues to request IPO allocations, and how heavily inf luenced is this by per-ceptions of what others are going to do? Who receives IPO allocations? Howdo allocations relate to other business provided by the investor? How mucheffective bundling of shares across issues ~and thus a reduction of averageuncertainty! do subscribers experience? Do large institutions receive prefer-ential treatment based on valuable information, and if so, what is it? Un-fortunately, not only do the answers to these questions depend upon thesample period, but underwriters also usually guard information about thespecifics of their share allocations, posing significant challenges to empiri-cists. Still, progress has already been made. Table IV classifies this litera-ture into some popular lines of inquiry and lists some recent representativepapers.
9 For example, Credit Suisse First Boston ~CSFB! took Corvis public on July 28, 2000, at anoffer price of $36.00. At the closing price of $84.719 on the first day of trading, the first-dayreturn was 135 percent. When the quiet period ended 25 calendar days after the IPO, the fivecomanaging underwriters all put out “buy” recommendations, and CSFB initiated coveragewith a “strong buy” recommendation, even though the price had increased to $90. At $90 pershare, Corvis had a market capitalization of $30 billion, despite never having had any revenue.~In December 2001, its market valuation was less than $1 billion.! Bradley, Jordan, and Ritter~2002! report that 87 percent of analyst initiations at the end of the quiet period were “buys” or“strong buys” during 1996 to 2000.
1808 The Journal of Finance
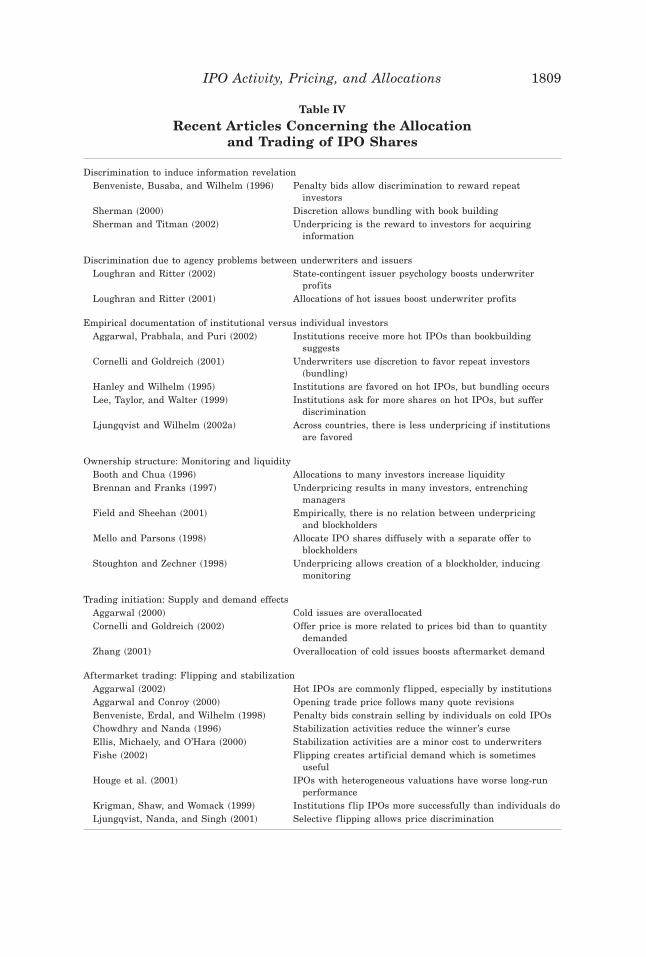
Table IV
Recent Articles Concerning the Allocationand Trading of IPO Shares
Discrimination to induce information revelationBenveniste, Busaba, and Wilhelm ~1996! Penalty bids allow discrimination to reward repeat
investorsSherman ~2000! Discretion allows bundling with book buildingSherman and Titman ~2002! Underpricing is the reward to investors for acquiring
information
Discrimination due to agency problems between underwriters and issuersLoughran and Ritter ~2002! State-contingent issuer psychology boosts underwriter
profitsLoughran and Ritter ~2001! Allocations of hot issues boost underwriter profits
Empirical documentation of institutional versus individual investorsAggarwal, Prabhala, and Puri ~2002! Institutions receive more hot IPOs than bookbuilding
suggestsCornelli and Goldreich ~2001! Underwriters use discretion to favor repeat investors
~bundling!
Hanley and Wilhelm ~1995! Institutions are favored on hot IPOs, but bundling occursLee, Taylor, and Walter ~1999! Institutions ask for more shares on hot IPOs, but suffer
discriminationLjungqvist and Wilhelm ~2002a! Across countries, there is less underpricing if institutions
are favored
Ownership structure: Monitoring and liquidityBooth and Chua ~1996! Allocations to many investors increase liquidityBrennan and Franks ~1997! Underpricing results in many investors, entrenching
managersField and Sheehan ~2001! Empirically, there is no relation between underpricing
and blockholdersMello and Parsons ~1998! Allocate IPO shares diffusely with a separate offer to
blockholdersStoughton and Zechner ~1998! Underpricing allows creation of a blockholder, inducing
monitoring
Trading initiation: Supply and demand effectsAggarwal ~2000! Cold issues are overallocatedCornelli and Goldreich ~2002! Offer price is more related to prices bid than to quantity
demandedZhang ~2001! Overallocation of cold issues boosts aftermarket demand
Aftermarket trading: Flipping and stabilizationAggarwal ~2002! Hot IPOs are commonly f lipped, especially by institutionsAggarwal and Conroy ~2000! Opening trade price follows many quote revisionsBenveniste, Erdal, and Wilhelm ~1998! Penalty bids constrain selling by individuals on cold IPOsChowdhry and Nanda ~1996! Stabilization activities reduce the winner’s curseEllis, Michaely, and O’Hara ~2000! Stabilization activities are a minor cost to underwritersFishe ~2002! Flipping creates artificial demand which is sometimes
usefulHouge et al. ~2001! IPOs with heterogeneous valuations have worse long-run
performanceKrigman, Shaw, and Womack ~1999! Institutions f lip IPOs more successfully than individuals doLjungqvist, Nanda, and Singh ~2001! Selective f lipping allows price discrimination
IPO Activity, Pricing, and Allocations 1809
The seminal model focusing on the allocation of shares was Benvenisteand Spindt ~1989!, which we have previously discussed along with otherasymmetric information-based theories. In this model, underwriters use theirdiscretion to extract information from investors, which reduces average un-derpricing and increases proceeds to the issuers. As Sherman ~2000! andothers have noted, the average level of underpricing required to induce in-formation revelation is reduced if underwriters have the ability to allocateshares in future IPOs to investors. Sherman and Titman ~2002! argue thatthere is an equilibrium degree of underpricing which compensates investorsfor acquiring costly information. Many models are at least partly based onthe notion that if IPOs are underpriced on average, investors have an in-centive to acquire information about the firms to try and discern which willbe underpriced the most.
Loughran and Ritter ~2002! explore the conf lict of interest between un-derwriters and issuers. If underwriters are given discretion in share alloca-tions, the discretion will not automatically be used in the best interests ofthe issuing firm. Underwriters might intentionally leave more money on thetable then necessary, and then allocate these shares to favored buy-side cli-ents. There is some evidence that underpriced share allocations have beenused by underwriters to enrich buy-side clients in return for quid pro quos~Pulliam and Smith ~2000, 2001!, SEC news release 2002-14!, to curry favorwith the executives of other prospective IPO issuers in a practice known as“spinning” ~Siconolfi ~1997!!, or even to inf luence politicians.
The mystery is why issuing firms appear generally content to leave somuch money on the table, and more so when their value has recently in-creased.10 Loughran and Ritter use prospect theory ~Kahneman and Tversky~1979!! to argue that entrepreneurs are more tolerant of excessive under-pricing if they simultaneously learn about a postmarket valuation that ishigher than what they expected. In other words, the greater the recent in-crease in their wealth, the less is the bargaining effort of issuers in theirnegotiations over the offer price with underwriters.
It is interesting to put the magnitude of the underpricing and its possibleinf luence on trading volume into perspective. In Table I, we report that $66billion was left on the table during the Internet bubble. If investors rebated20 percent of this back to underwriters in the form of extra commissions,this would amount to $13 billion.11 At an average commission of 10 cents per
10 A deeper question is why firms do not choose a different mechanism for selling IPOsaltogether. For selling many other items where there is valuation uncertainty, auctions are thedominant mechanism. Worldwide, however, auctions have been losing market share relative tobookbuilding when it comes to selling IPOs ~Sherman ~2001!!. Kandel, Sarig, and Wohl ~1999!,Biais and Faugeron ~2002!, and Derrien and Womack ~2002! document that auctions result inless underpricing than other methods of selling IPOs.
11 The $100 million settlement of abusive IPO allocation practices between Credit SuisseFirst Boston and the SEC and NASD on January 22, 2002, includes the statement that “CSFBallocated shares of IPOs to more than 100 customers who, in return, funneled between 33 and65 percent of their IPO profits to CSFB. These customers typically f lipped the stock on the day
1810 The Journal of Finance
share, this would amount to 130 billion shares traded, or an average of 250million shares per trading day during 1999 to 2000. Because combined Nas-daq and NYSE volume averaged about 10 times this amount during theseyears, this would suggest that portfolio churning by investors to receive IPOallocations may have accounted for as much as 10 percent of all shares tradedduring the Internet bubble. Although 10 percent might be an overestimate ofthe effect on overall trading volume, the January 22, 2002, SEC settlementwith Credit Suisse First Boston states that extra share volume was concen-trated in certain highly liquid stocks. Market microstructure empirical workmay need to take this trading volume into account, much as “dividend cap-ture” schemes by Japanese insurance companies in the 1980s led to artifi-cially high volume for U.S. stocks paying high dividends around the ex dividenddate ~Koskie and Michaely ~2000!!.
At this point, there has been no academic research investigating how themoney left on the table during the Internet bubble was split among buy-sideparticipants ~individual investors, mutual funds, hedge funds, “friends andfamily,” etc.! and sell-side participants ~the stockholders of investment bank-ing firms through higher profits; and analysts, traders, and corporate fi-nance employees through bigger bonuses!. Ljungqvist and Wilhelm ~2002b!document that the frequency of directed share programs ~friends and familyshares! increased dramatically between 1996 and 1999. They argue that thisreduced the opportunity cost of underpricing for firm managers.
Both the Benveniste and Spindt bookbuilding theory and the Loughranand Ritter conf lict of interest theory predict sluggish price adjustment: Thefinal offer price is not fully adjusted from the midpoint of the file pricerange when underwriters receive favorable information. Although the infor-mation revelation theory can explain underwriters’ sluggish price adjust-ment to private information, it does not predict that there should be anythingless than full adjustment to public information. In contrast, the prospecttheory explanation predicts that there will be sluggish adjustment to bothprivate and public information, because prospect theory makes no distinc-tion about the source of good news. Bradley and Jordan ~2002!, Loughranand Ritter ~2002!, and Lowry and Schwert ~2002! present evidence that whenthe overall stock market rallies during the road show period, underwritersdo not fully adjust their pricing. However, this alone cannot fully explain therelationship between price adjustment and first-day returns, pointing to arole for private information extraction, too.
of the IPO, often gaining tremendous profits. They then transferred a share of their f lippingprofits to CSFB by way of excessively high brokerage commissions . . . The customers paidthese commissions on uneconomic, limited-risk trades in highly liquid, exchange-traded sharesunrelated to the IPO shares—trades that they effected for the sole purpose of paying IPOflipping profits back to CSFB” ~SEC News Release 2002-14!. The NASD specifically mentionschurning of Compaq and Disney stock for the purpose of generating commission payments. Anumber of hedge fund managers have told us that they generated commissions by churningmassive numbers of shares in highly liquid stocks without ever paying more than eight centsper share.
IPO Activity, Pricing, and Allocations 1811
The prospect theory explanation of the partial adjustment phenomenonpredicts that all IPOs that are in the road show stage of going public whenthere is an overall market rally will have higher expected underpricing, be-cause offer prices are not raised as much as they could be in this scenario.Because the bookbuilding period is typically about four weeks in length, thefirst day returns of these IPOs will be correlated. This provides a partialexplanation for the phenomenon of hot issue markets. Empirically, the auto-correlation of monthly average first-day returns is 0.60 from 1960 to 1997~Lowry and Schwert ~2002!!. The autocorrelation is even higher if 1998 to2001 is included in the sample period, due to the extremely high first-dayreturns during the Internet bubble. Every single month from November 1998to April 2000 had an average first-day return of more than 30 percent.
Many empirical papers examining IPO allocations focus on the distinctionbetween institutional and individual ~or retail! investors. Institutions aredifferent from retail clients, in that their scale should make it more likelythat they are both better informed and more important clients. The evidenceto date suggests that where bookbuilding is used, institutions do receivepreferential allocations. Using U.S. data, Hanley and Wilhelm ~1995! andAggarwal, Prabhala, and Puri ~2002! find that institutions are favored, asdo Cornelli and Goldreich ~2001! using U.K. data. Cornelli and Goldreich~2001! also find that more information-rich requests are favorably rewarded.Future research is likely to further distinguish among different classes andcharacteristics of institutional investors.
Institutions are also naturally blockholders, potentially capable of displac-ing poorly performing management. Who purchases an IPO’s shares may inturn inf luence IPO activity, underpricing, and long-run performance. A goodnumber of companies begin implementing takeover defenses as early as theIPO ~Field and Karpoff ~2002!!. Booth and Chua ~1996!, Brennan and Franks~1997!, Mello and Parsons ~1998!, and Stoughton and Zechner ~1998! all pointout that underpricing creates excess demand and thus allows issuers andunderwriters to decide to whom to allocate shares. Stoughton and Zechnerargue that underpricing is needed to create an incentive to acquire a blockof stock and then monitor the firm’s management, creating a positive exter-nality for atomistic investors. Mello and Parsons point out that a two-partissuing strategy may be more efficient, with the IPO aimed at atomisticinvestors and a private placement aimed at a blockholder. In the UnitedStates, large blockholders are common prior to the IPO in the form of ven-ture capitalists and leveraged buyout financiers, but the venture capitaliststypically distribute shares to their limited partners as soon as the lockupperiod ends. Furthermore, the general partners typically also relinquish con-trol via open market sales, rather than selling a strategic block. This sug-gests that corporate control considerations related to blockholders may notbe of primary importance for many of these companies.
In a sample of 69 British IPOs, Brennan and Franks ~1997! find that whenshares are placed more widely rather than placed with just a few powerful largeshareholders, the entrepreneur is less easy to oust from the company. Bren-
1812 The Journal of Finance
nan and Franks also find that directors continue to hold onto shares more thanother investors, again presumably trying to retain control of the company.
In contrast to models in which big investors add value, Booth and Chua~1996! link allocation to aftermarket trading and argue that small investorsare more valuable. Issuers like the increased liquidity associated with moreaftermarket trading brought about by more investor dispersion.
In all of these models, underpricing results in excess demand, which per-mits underwriters to place shares with specific clienteles. To raise the sameamount of capital, if the shares offered are underpriced, the issuing firmmust sell more shares, diluting the existing shareholders. It is not at allobvious that the benefits of placing shares with specific clienteles outweighthe control benefits of insiders retaining a larger fraction of the firm. Fieldand Sheehan ~2001! find that clienteles are rather temporary, casting doubton the usefulness of explanations based on future services from investorswho receive allocations of shares at the time of the IPO.
A number of articles focus on the actions of the lead underwriter whenaftermarket trading begins. Underwriters can influence the aftermarket pricenot only by their pre-IPO decisions on pricing and allocation, but also throughactively participating in the aftermarket themselves.
Underwriters not only have price discretion, but also quantity discretion.In allocating shares, they control not only who gets shares, but how manyshares in the aggregate are allocated. Almost all IPOs contain an overallot-ment option for up to 15 percent of the shares offered.12 In allocating shares,if there is strong demand, the underwriter will allocate 115 percent of theshares. Then, if the price weakens in aftermarket trading, the underwritercan buy back up to the extra 15 percent and retire the shares, as if they hadnever been offered in the first place.
Aggarwal ~2000! and Zhang ~2001! focus on the number of shares that areallocated. Aggarwal reports that if the underwriter anticipates weak de-mand, it will typically allocate up to 135 percent of the offering, taking anaked short position. The underwriter then buys back the incremental 20 per-cent, and has the option of buying back the other 15 percent, treating theshares as if they were never issued in the first place. Zhang argues that theallocation of these extra shares boosts the aftermarket demand for the stock.This is because institutional investors who are allocated shares are likely tocontinue holding them, whereas if they had not received any shares in thefirst place, they would have been unlikely to buy them in the aftermarket.The extra buy-and-hold demand that results from the overallocation booststhe aftermarket price and increases the price at which issuers can offershares. If the demand for an IPO is strong, underwriters do not take a nakedshort position because covering it would be too costly.
Once trading commences, if there is weak demand, the lead underwritermight attempt to “stabilize” the price through various activities aimed at
12 The overallotment option is also called a “Green Shoe” option, after the first company thatincluded one in its 1963 IPO.
IPO Activity, Pricing, and Allocations 1813
reducing selling pressure. Price stabilization is the only instance in whichthe SEC permits active attempts at stock price manipulation. Price stabil-ization activities include pre-IPO allocation policy, post-IPO purchases ofshares by the lead underwriter, and the discouragement of selling.
Flippers are temporary investors who purchase shares at the IPO andquickly turn around to sell their shares. Underwriters have a quixotic viewtowards f lippers: On the one hand, the new conf lict-of-interest theories ofunderpricing argue that underwriters sometimes allocate shares specificallyto investors so that these investors can make a quick profit. Furthermore,underwriters desire liquid aftermarket trading, if only because they are usu-ally the prime market maker. On the other hand, the “artificial” demand off lippers can make it difficult both to gauge the buy-and-hold demand forshares pre-IPO and to properly price shares.
For IPOs with weak demand, underwriters discourage f lipping throughmoral suasion ~i.e., the threat of withholding future allocations on hot issues!and the imposition of penalty bids. A penalty bid occurs when the lead under-writer takes back the selling concession ~the commission! from a broker whohas allocated shares that are f lipped. The existence of penalty bids gives abroker an incentive to allocate shares to clients who are likely to be buy-and-hold investors. More controversially, after the shares have been allocated, apenalty bid also gives a broker a financial incentive to discourage a clientfrom selling shares. For IPOs where there is strong demand and a price jump,penalty bids are rarely imposed, and f lipping may even be encouraged inorder to keep market demand from pushing the price to unsustainable levels.The practice of encouraging sales in this scenario explicitly assumes that thereis a negatively sloped demand curve, and that the market price is not exogenous.
Many investment banking practices can be interpreted as attempts to createdemand. Marketing or certification activity may occur after the time of theIPO as well. If bullish analysts can later seduce other investors to purchase,both entrepreneurs and aftermarket investors would value such a service~Aggarwal, Krigman, and Womack ~2002!!. Issuers view the choice of thelead underwriter as important.
The choice of underwriter is typically determined by the issue’s size andindustry on one hand and the underwriter’s prestige and expertise on theother ~Logue et al. ~2002!!. One strand of research has focused on the effectof an underwriter’s pricing record on subsequent market share. Beatty andRitter ~1986! find that underwriters that underprice or overprice excessivelysubsequently lose market share, although Tinic ~1988! argues that pennystock underwriters may drive their results. Nanda and Yun ~1997! find thatthe market price of an underwriters’ own stock does best when offerings aremoderately underpriced. Dunbar ~2000! widens this view towards long-runIPO performance and other measures, and finds that established underwrit-ers are especially vulnerable to missteps. On the other hand, Krigman, Shaw,and Womack ~2001!, in a questionnaire sent to firms that switched under-writers for a follow-on offering after their IPO, report that the amount ofmoney left on the table in the IPO was not an important factor in deciding
1814 The Journal of Finance
to switch lead underwriters. Instead, underwriter prestige or the desire toincrease analyst coverage for the stock are the two most important deter-minants of switching.
Carter and Manaster ~1990! and Carter, Dark, and Singh ~1998! uncov-ered yet another interesting pattern, namely that high-quality underwritersseem to have left less money on the table for their investors—at least in the1980s. Beatty and Welch ~1996! and Cooney et al. ~2001! find that this re-lation reversed in the early 1990s, and Loughran and Ritter ~2001! reportthat during the Internet bubble period, prestigious underwriters were egre-gious in leaving huge amounts of money on the table.
Underwriters are prohibited from initiating analyst coverage for 25 cal-endar days after an IPO ~the “quiet period”!. Typically, the managing un-derwriters ~lead and comanagers! initiate research coverage at the end ofthe quiet period, usually with a “buy” or “strong buy” recommendation.Michaely and Womack ~1999! provide evidence that the investment bank’sanalysts regularly provide “booster shots” in the form of buy recommenda-tions which are greeted with a positive stock market reaction, even thoughthese IPOs subsequently underperform. Oddly, the market does not seem torecognize the full extent of this bias, so that this service remains valuable tothe issuer. However, the underwriters’ analysts are not unique in being op-timistic: Rajan and Servaes ~1997! find that analysts of investment bankingfirms that did not comanage the IPO tend to disproportionately follow under-priced IPOs and also are overly optimistic on average. Bradley et al. ~2002!find that IPOs from 1996 to 2000 rise an average of three percent whentheir quiet period ends. For IPOs where analyst recommendations occur, themarket-adjusted return is four percent. For other IPOs, the market-adjustedreturn is close to zero. The positive average effect of three percent is difficultto reconcile with market efficiency, because the fact that positive recommen-dations will be forthcoming 25 days after going public is not a surprise.
For shares not sold in the offering, preissue shareholders commit to aspecified lockup period, during which they agree not to sell any shares with-out the written permission of the lead underwriter. Although there is nostatutory minimum, most lockup periods are 180 calendar days in lengthand almost none are less than 90 days ~Field and Hanka ~2001!!.
Eventually, IPOs transition to become ordinary stocks. Ellis et al. ~2000!and Aggarwal and Conroy ~2000! document that the lead underwriter is typ-ically the dominant market maker for Nasdaq-listed IPOs. The underwriterknows with whom shares are placed, and thus has a comparative advantageat contacting investors if there is an order imbalance. Ellis et al. report thatmarket making is a profitable activity for the lead underwriter, with theprofits during the first three months amounting to about two percent of theissue size. Ellis, Michaely, and O’Hara ~2002! further report that marketmaking activity in Nasdaq-listed IPOs continues to be concentrated longafter the offering. For smaller IPOs, the lead underwriter’s market sharedeclines from almost 100 percent at the inception of trading to less than 50percent on average about half a year after the offering.
IPO Activity, Pricing, and Allocations 1815
C. Valuation
An immediate question raised by the difference between the offer priceand the first-day market price is whether issuers or the stock market ispricing offerings in line with a firm’s fundamentals. The most common methodfor valuing firms going public is the use of comparable firm multiples. Butunfortunately, accounting data are in many cases too unreliable a measureof valuation to facilitate powerful tests, especially because many firms goingpublic are being valued on the basis of their growth options, not their his-torical financials. As a result, the power of tests to explain pricing relativeto some “true fundamental value” is too low to make much headway in test-ing whether IPO pricing or aftermarket valuation better ref lects the IPOs’fundamental valuations unless the sample is large. Kim and Ritter ~1999!find only a modest ability to explain the pricing of IPOs using accountingmultiples, even when using earnings forecasts.
Purnanandam and Swaminathan ~2001! construct a measure of intrinsicvalue based on industry-matched Price0Sales and Price0Ebitda from compa-rable publicly traded firms ~“comps”! for a sample of over 2,000 IPOs from1980 to 1997. They find that, when offer prices are used, IPO firms arepriced about 50 percent above comparables, which is an enormous differ-ence. They also find that this initial overpricing with respect to comparableshelps predict long-run underperformance.
Although it is difficult to come up with accurate valuation measures forIPOs, this literature is promising. The next step may involve the use ofearnings forecasts with more detailed corporate information to enhance thepower of these tests.
D. Summary
As readers of this literature, we come away with the view that underpric-ing is a persistent feature of the IPO market, and, while cyclical, may haveincreased in magnitude over time. While asymmetric information modelshave been popular among academics, we feel that these models have beenoveremphasized. In our view, there is no single dominant theoretical causefor underpricing. Thus, it is not so much a matter of which model is right,but more a matter of the relative importance of different models. Further-more, one reason can be of more importance for some firms and0or at sometimes. To date, there has been little empirical work attempting to quantifythe relative importance of different explanations of underpricing.
III. Long-run Performance
Perhaps the facet of IPOs that has attracted the most interest from aca-demics in recent years is the stock price performance of IPOs in the yearsafter the offering. Efficient markets proponents would argue that once anIPO is publicly traded, it is just like any other stock and thus the aftermar-ket stock price should appropriately ref lect the shares’ intrinsic value. Con-sequently, risk-adjusted post-IPO stock price performance should not be
1816 The Journal of Finance
predictable. In this sense, post-IPO long-run performance is less of an IPO~or corporate finance! issue than it is a standard asset-pricing issue. Still,many IPO shares have been difficult to sell short and thus have retainedsome peculiarity even post-IPO.
In measuring long-run performance, one can focus either on raw ~abso-lute! performance, or performance relative to a benchmark ~abnormal re-turns!. Table I shows that investing in an equal-weighted portfolio of IPOsover a three-year horizon did not lose money in absolute terms, but an in-vestment in the value-weighted market portfolio would have yielded abouttwice the return, resulting in a three-year market-adjusted return of 223.4percent. Still, there is far from a consensus with respect to the proper mea-surement technique. We believe that the sample used, both in terms of thesample period and the sample selection criteria, is also an important deter-minant of the difference in findings across studies.
A. Long-run Performance Evidence
Statistical inference is problematic when the returns on individual IPOsoverlap, as they do when multiyear buy-and-hold returns ~as in Table I! areused. Indeed, this is a problem for all long-term performance studies, notjust those examining IPO performance. These measurement issues have beenaddressed in Brav ~2000! and other papers. Nevertheless, Table I highlightsone important issue plaguing this literature: When publicly traded firmssimilar in market capitalization and book-to-market values are used as abenchmark, it becomes clear that the poor long-run performance of firms“similar to IPO firms” extends beyond the IPO market. IPOs are stronglytilted towards small growth firms, and this has been the worst-performingstyle category of the last several decades. In Table I, the three-year averagemarket-adjusted return on IPOs is 223.4 percent, whereas the average style-adjusted return is 25.1 percent.13 In other words, seasoned firms matched
13 A careful reader may wonder about the accuracy of the style-adjusted three-year buy-and-hold return of 274.2 percent for the IPOs going public in calendar year 1999 that we report inTable 1. Since the average buy-and-hold return on IPOs is 246.2 percent, this implies an aver-age matching firm return of 128.0 percent, even though growth stocks did very poorly in 2000and 2001. Part of the high benchmark return is due to chance: One IPO was matched with aseasoned firm that had a 2,200 percent return in the four months after the date of the IPO, atwhich point the matching firm conducted a follow-on stock offering and was replaced on apoint-forward basis by another matching firm. This second firm then had a return of over100 percent before being delisted, at which point it was replaced on a point-forward basis byanother firm that had a 36 percent return until the end of September 2001, when our returnsdata ended. The compounded return for these three matching firms was 6,300 percent, whichboosts the average benchmark return for the 457 firms in the 1999 cohort by 14 percent. A fewother matching firms in this cohort also had relatively high returns. The 6,300 percent outlieraffects the average style-adjusted return for the 6,249 IPOs from 1980 to 2001 by only 1.0 per-cent. Note that for IPOs from October 1998 and later, the three-year buy-and-hold return isactually less than three years, since our returns end on September 2001. Our returns end inSeptember 2001 because this was the most recent available version of returns data from CRSPas of January 2002.
IPO Activity, Pricing, and Allocations 1817
by market capitalization and book-to-market underperform the broader mar-ket by almost as much as IPOs do.
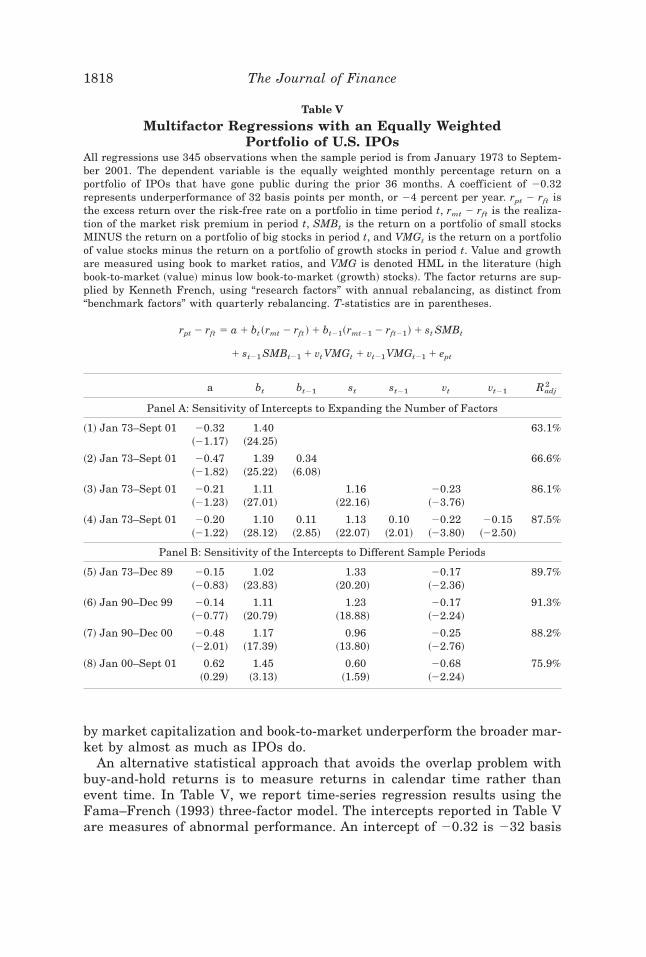
An alternative statistical approach that avoids the overlap problem withbuy-and-hold returns is to measure returns in calendar time rather thanevent time. In Table V, we report time-series regression results using theFama–French ~1993! three-factor model. The intercepts reported in Table Vare measures of abnormal performance. An intercept of 20.32 is 232 basis
Table V
Multifactor Regressions with an Equally WeightedPortfolio of U.S. IPOs
All regressions use 345 observations when the sample period is from January 1973 to Septem-ber 2001. The dependent variable is the equally weighted monthly percentage return on aportfolio of IPOs that have gone public during the prior 36 months. A coefficient of 20.32represents underperformance of 32 basis points per month, or 24 percent per year. rpt 2 rft isthe excess return over the risk-free rate on a portfolio in time period t, rmt 2 rft is the realiza-tion of the market risk premium in period t, SMBt is the return on a portfolio of small stocksMINUS the return on a portfolio of big stocks in period t, and VMGt is the return on a portfolioof value stocks minus the return on a portfolio of growth stocks in period t. Value and growthare measured using book to market ratios, and VMG is denoted HML in the literature ~highbook-to-market ~value! minus low book-to-market ~growth! stocks!. The factor returns are sup-plied by Kenneth French, using “research factors” with annual rebalancing, as distinct from“benchmark factors” with quarterly rebalancing. T-statistics are in parentheses.
rpt 2 rft 5 a 1 bt ~rmt 2 rft ! 1 bt21~rmt21 2 rft21! 1 st SMBt
1 st21 SMBt21 1 vt VMGt 1 vt21VMGt21 1 ept
a bt bt21 st st21 vt vt21 Radj2
Panel A: Sensitivity of Intercepts to Expanding the Number of Factors
~1! Jan 73–Sept 01 20.32 1.40 63.1%~21.17! ~24.25!
~2! Jan 73–Sept 01 20.47 1.39 0.34 66.6%~21.82! ~25.22! ~6.08!
~3! Jan 73–Sept 01 20.21 1.11 1.16 20.23 86.1%~21.23! ~27.01! ~22.16! ~23.76!
~4! Jan 73–Sept 01 20.20 1.10 0.11 1.13 0.10 20.22 20.15 87.5%~21.22! ~28.12! ~2.85! ~22.07! ~2.01! ~23.80! ~22.50!
Panel B: Sensitivity of the Intercepts to Different Sample Periods
~5! Jan 73–Dec 89 20.15 1.02 1.33 20.17 89.7%~20.83! ~23.83! ~20.20! ~22.36!
~6! Jan 90–Dec 99 20.14 1.11 1.23 20.17 91.3%~20.77! ~20.79! ~18.88! ~22.24!
~7! Jan 90–Dec 00 20.48 1.17 0.96 20.25 88.2%~22.01! ~17.39! ~13.80! ~22.76!
~8! Jan 00–Sept 01 0.62 1.45 0.60 20.68 75.9%~0.29! ~3.13! ~1.59! ~22.24!
1818 The Journal of Finance
points per month, or about 24 percent per year. Row 1 reports the results ofa simple one-factor regression, with the market excess return as the explan-atory variable. Row 2 reports the results of a regression that includes alagged market return. The lagged beta is significantly positive, and thesummed beta is 1.73, indicating that IPOs have a high level of systematicrisk. This accords with the common sense notion that IPOs tend to be riskystocks. The Row 2 intercept is 247 basis points per month, suggesting thatthe Row 1 intercept is underestimated due to the underestimation of sys-tematic risk when the lagged effect is ignored.
Row 3 of Table V reports regression results with the three traditionalFama–French ~1993! regressors, and Row 4 adds the lagged Fama–Frenchfactors. The intercepts in Rows 3 and 4 return to a value of about 22.5 per-cent per year. As Brav and Gompers ~1997! note, Fama–French three-factorregressions tend to have negative intercepts for portfolios of small growthfirms, whether or not the portfolio is composed of IPOs. Brav and Gompersshow that a large fraction of IPOs fall in the extreme small growth firmcategory, so this is an important concern. In our Table V, we have excludedmost of the smallest firms by screening out IPOs with an offer price below$5.00 per share. There is another bias in multifactor regressions, as nor-mally implemented. Loughran and Ritter ~2000! point out that the right-hand side variables, the Fama–French factor returns, are themselves partlycomposed of the returns on IPOs. Because IPOs tend to be small growthstocks, a small firm portfolio will have more IPOs than a large firm port-folio, especially after periods of heavy issuing volume. Similarly, a portfolioof value stocks will have fewer IPOs than a portfolio of growth stocks. Thus,SMB will have a low return and VMG will have a high return followingheavy IPO issuance if IPOs underperform. This “factor contamination” biasesthe intercept towards zero. Table VI of Loughran and Ritter ~2000! reportsthat the effect of this bias is 18 basis points per month during the period1973 to 1996.
Rows 5 through 8 split the sample into different time periods. The under-performance in the 1990 to 1999 period is virtually identical to that in the1973 to 1989 period, a statistically insignificant 214 or 215 basis points permonth. The estimates, however, are very sensitive to the ending date. Whilethe Internet bubble was inf lating in the late 1990s, post-IPO returns wereexceptionally good. If the sample is extended by just one year, from Decem-ber 1999 to December 2000, the Row 6 intercept of 214 basis points for 1990to 1999 changes in Row 7 to 248 basis points for 1990 to 2000.
Most remarkably, however, are the Row 8 subperiod results from January2000 to September 2001. This time period shows how methodology and timeperiod matter in a most startling fashion. Table I showed that IPOs from1999 and 2000 performed poorly by any measure during the well-knowncollapse of the Internet bubble. For IPOs from calendar year 2000, the aver-age return from the closing price on its first day of trading until September2001 was 264.7 percent. From January 2000 to September 2001, our depen-dent variable in Table V, the equally weighted portfolio of IPOs from the
IPO Activity, Pricing, and Allocations 1819
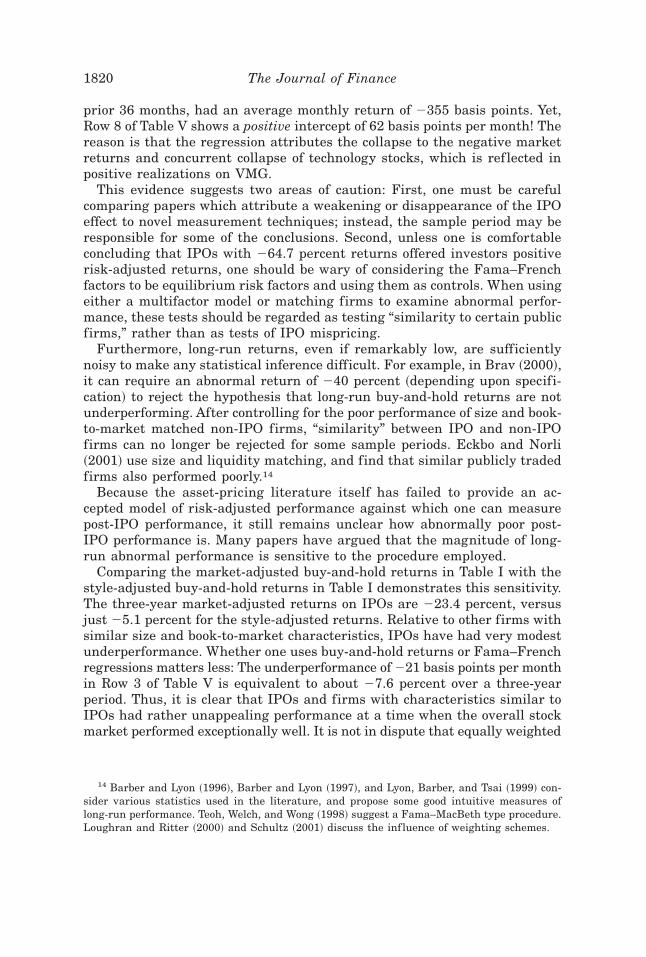
prior 36 months, had an average monthly return of 2355 basis points. Yet,Row 8 of Table V shows a positive intercept of 62 basis points per month! Thereason is that the regression attributes the collapse to the negative marketreturns and concurrent collapse of technology stocks, which is ref lected inpositive realizations on VMG.
This evidence suggests two areas of caution: First, one must be carefulcomparing papers which attribute a weakening or disappearance of the IPOeffect to novel measurement techniques; instead, the sample period may beresponsible for some of the conclusions. Second, unless one is comfortableconcluding that IPOs with 264.7 percent returns offered investors positiverisk-adjusted returns, one should be wary of considering the Fama–Frenchfactors to be equilibrium risk factors and using them as controls. When usingeither a multifactor model or matching firms to examine abnormal perfor-mance, these tests should be regarded as testing “similarity to certain publicfirms,” rather than as tests of IPO mispricing.
Furthermore, long-run returns, even if remarkably low, are sufficientlynoisy to make any statistical inference difficult. For example, in Brav ~2000!,it can require an abnormal return of 240 percent ~depending upon specifi-cation! to reject the hypothesis that long-run buy-and-hold returns are notunderperforming. After controlling for the poor performance of size and book-to-market matched non-IPO firms, “similarity” between IPO and non-IPOfirms can no longer be rejected for some sample periods. Eckbo and Norli~2001! use size and liquidity matching, and find that similar publicly tradedfirms also performed poorly.14
Because the asset-pricing literature itself has failed to provide an ac-cepted model of risk-adjusted performance against which one can measurepost-IPO performance, it still remains unclear how abnormally poor post-IPO performance is. Many papers have argued that the magnitude of long-run abnormal performance is sensitive to the procedure employed.
Comparing the market-adjusted buy-and-hold returns in Table I with thestyle-adjusted buy-and-hold returns in Table I demonstrates this sensitivity.The three-year market-adjusted returns on IPOs are 223.4 percent, versusjust 25.1 percent for the style-adjusted returns. Relative to other firms withsimilar size and book-to-market characteristics, IPOs have had very modestunderperformance. Whether one uses buy-and-hold returns or Fama–Frenchregressions matters less: The underperformance of 221 basis points per monthin Row 3 of Table V is equivalent to about 27.6 percent over a three-yearperiod. Thus, it is clear that IPOs and firms with characteristics similar toIPOs had rather unappealing performance at a time when the overall stockmarket performed exceptionally well. It is not in dispute that equally weighted
14 Barber and Lyon ~1996!, Barber and Lyon ~1997!, and Lyon, Barber, and Tsai ~1999! con-sider various statistics used in the literature, and propose some good intuitive measures oflong-run performance. Teoh, Welch, and Wong ~1998! suggest a Fama–MacBeth type procedure.Loughran and Ritter ~2000! and Schultz ~2001! discuss the inf luence of weighting schemes.
1820 The Journal of Finance
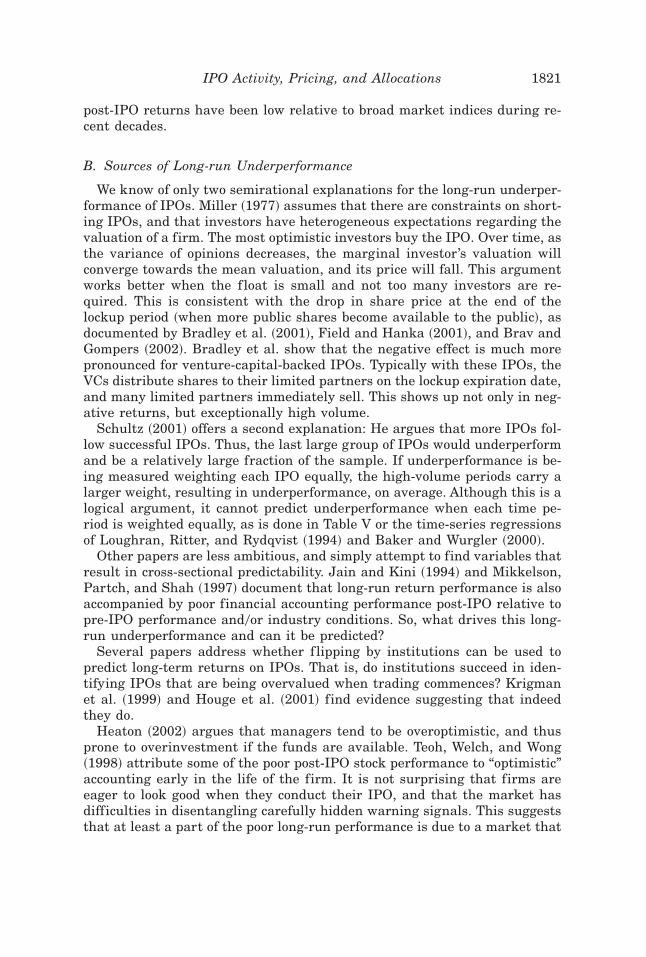
post-IPO returns have been low relative to broad market indices during re-cent decades.
B. Sources of Long-run Underperformance
We know of only two semirational explanations for the long-run underper-formance of IPOs. Miller ~1977! assumes that there are constraints on short-ing IPOs, and that investors have heterogeneous expectations regarding thevaluation of a firm. The most optimistic investors buy the IPO. Over time, asthe variance of opinions decreases, the marginal investor’s valuation willconverge towards the mean valuation, and its price will fall. This argumentworks better when the f loat is small and not too many investors are re-quired. This is consistent with the drop in share price at the end of thelockup period ~when more public shares become available to the public!, asdocumented by Bradley et al. ~2001!, Field and Hanka ~2001!, and Brav andGompers ~2002!. Bradley et al. show that the negative effect is much morepronounced for venture-capital-backed IPOs. Typically with these IPOs, theVCs distribute shares to their limited partners on the lockup expiration date,and many limited partners immediately sell. This shows up not only in neg-ative returns, but exceptionally high volume.
Schultz ~2001! offers a second explanation: He argues that more IPOs fol-low successful IPOs. Thus, the last large group of IPOs would underperformand be a relatively large fraction of the sample. If underperformance is be-ing measured weighting each IPO equally, the high-volume periods carry alarger weight, resulting in underperformance, on average. Although this is alogical argument, it cannot predict underperformance when each time pe-riod is weighted equally, as is done in Table V or the time-series regressionsof Loughran, Ritter, and Rydqvist ~1994! and Baker and Wurgler ~2000!.
Other papers are less ambitious, and simply attempt to find variables thatresult in cross-sectional predictability. Jain and Kini ~1994! and Mikkelson,Partch, and Shah ~1997! document that long-run return performance is alsoaccompanied by poor financial accounting performance post-IPO relative topre-IPO performance and0or industry conditions. So, what drives this long-run underperformance and can it be predicted?
Several papers address whether f lipping by institutions can be used topredict long-term returns on IPOs. That is, do institutions succeed in iden-tifying IPOs that are being overvalued when trading commences? Krigmanet al. ~1999! and Houge et al. ~2001! find evidence suggesting that indeedthey do.
Heaton ~2002! argues that managers tend to be overoptimistic, and thusprone to overinvestment if the funds are available. Teoh, Welch, and Wong~1998! attribute some of the poor post-IPO stock performance to “optimistic”accounting early in the life of the firm. It is not surprising that firms areeager to look good when they conduct their IPO, and that the market hasdifficulties in disentangling carefully hidden warning signals. This suggeststhat at least a part of the poor long-run performance is due to a market that
IPO Activity, Pricing, and Allocations 1821
is unduly optimistic and unable to properly forecast tougher times ahead.Similarly, Purnanandam and Swaminathan ~2001! f ind that IPOs thatare priced high relative to public market comparables tend to perform worsein the long run, even though they show higher first-day returns. Both pa-pers point towards overconfidence, perhaps by both entrepreneurs ~Bernar-do and Welch ~2001!! and investors ~Daniel, Hirshleifer, and Subrahmanyam~1998!!.
There have been some other less successful attempts to correlate long-runperformance to pre-IPO characteristics. For example, there is no reliablerelationship between short-run underpricing and long-run performance, al-though this evidence is sensitive to whether penny stock IPOs are includedor not. These IPOs, which were common before the 1990s, frequently hadhigh first-day returns and exceptionally low long-run returns. Many of theseissues involved stock price manipulation. For samples excluding penny stockIPOs, whether there is a reversal of the highest first-day returns in the longrun depends mostly on whether the Internet bubble period is included in thesample. Almost all of the IPOs from 1999 to 2000 with large first-day re-turns have subsequently collapsed. Since most of these were Internet re-lated, the number of independent observations is limited.
The recent bubble has made it amply clear that even if there is systematiclong-run underperformance, it is difficult or impossible to exploit it in areliable manner. Many short sellers lost a great deal of money on Internetbubble IPOs, and had to close out their shorts before they would have paidoff. Still, we hope to see further work to tell us which subsamples are par-ticularly prone to poor post-IPO performance, both in the United States andin other countries.
IV. Conclusions
This paper has focused on three areas of current research on IPOs: rea-sons for going public, the pricing and allocation of shares, and long-runperformance.
There are myriad theoretical reasons for firms wanting to go public, butonly sparse evidence due to a general lack of data on the pool of privatefirms. Still, the evidence of large variation in the number of IPOs suggeststhat market conditions are the most important factor in the decision to gopublic. The stage of the firm in its life cycle seems to be the second impor-tant factor.
The underpricing of IPOs has been a topic of theoretical investigations fordecades. Recently, this topic has enjoyed a resurgence of activity, motivatedby the astonishingly high first-day returns on IPOs during the Internet bub-ble. We argue that theories based on asymmetric information are unlikely toexplain average first-day returns of 65 percent. Underwriters did not bundlemultiple offerings together, which would have lowered the average uncer-tainty and the need for underpricing in the context of information models.Thus, we believe that future explanations will need to concentrate on agency
1822 The Journal of Finance
conf licts and share allocation issues on one hand and behavioral explana-tions on the other hand. The challenge for such theories will be to explainthe dramatic variations in underpricing over the last few decades.
The allocation of shares by underwriters is perhaps the most active area ofcurrent IPO research. Share allocation has an impact on many topics, in-cluding theories of underpricing, post-issue ownership structure, and under-writer compensation. To date, empirical research has been limited due to thelack of microlevel data on share allocations in the United States. As thisdata becomes available, we expect that it will be able to shed light on manyquestions. Microlevel trading data has already resulted in light being shedon some of these important issues.
Long-run performance may be the most controversial area of IPO re-search, with some researchers lining up behind an efficient markets point ofview and others lining up behind a behavioral point of view. Although wetend to favor the behavioral point of view, our main perspective is that cau-tion is advisable. First, the results are sensitive not only to methodology, butalso to the exact time period chosen. Depending on whether and how oneincludes 1999, 2000, and 2001, one can come to rather different conclusions.Second, Fama–French multifactor regressions can produce very odd results.They indicate that the period during which the Internet bubble collapsedwere great years for recent IPOs, even though an equally weighted portfolioof recent IPOs lost on average 355 basis points per month.
REFERENCES
Aggarwal, Rajesh, Laurie Krigman, and Kent Womack, 2002, Strategic IPO underpricing, in-formation momentum, and lockup expiration selling, Journal of Financial Economics,forthcoming.
Aggarwal, Reena, 2000, Stabilization activities by underwriters after initial public offerings,Journal of Finance 55, 1075–1103.
Aggarwal, Reena, 2002, Allocation of initial public offerings and f lipping activity, Journal ofFinancial Economics, forthcoming.
Aggarwal, Reena, and Patrick Conroy, 2000, Price discovery in initial public offerings and therole of the lead underwriter, Journal of Finance 55, 2903–2922.
Aggarwal, Reena, Nagpurnanand R. Prabhala, and Manju Puri, 2002, Institutional allocationin initial public offerings: Empirical evidence, Journal of Finance 57, 1421–1442.
Allen, Franklin, and Gerald R. Faulhaber, 1989, Signaling by underpricing in the IPO market,Journal of Financial Economics 23, 303–324.
Amihud, Yakov, Shmuel Hauser, and Amir Kirsh, 2001, Allocations, adverse selection and cas-cades in IPOs: Evidence from Israel, Working paper, New York University.
Baker, Malcolm P., and Jeffrey Wurgler, 2000, The equity share in new issues and aggregatestock returns, The Journal of Finance 55, 2219–2257.
Barber, Brad M., and John D. Lyon, 1996, Detecting abnormal operating performance: Theempirical power and specification of test statistics, Journal of Financial Economics 41,359–399.
Barber, Brad M., and John D. Lyon, 1997, Detecting long-run abnormal stock returns: Theempirical power and specification of test statistics, Journal of Financial Economics 43,341–372.
Baron, David P., 1982, A model of the demand for investment banking advising and distributionservices for new issues, Journal of Finance 37, 955–976.
IPO Activity, Pricing, and Allocations 1823
Beatty, Randolph P., and Jay R. Ritter, 1986, Investment banking, reputation, and the under-pricing of initial public offerings, Journal of Financial Economics 15, 213–232.
Beatty, Randolph P., and Ivo Welch, 1996, Issuer expenses and legal liability in initial publicofferings, Journal of Law and Economics 39, 545–602.
Benveniste, Lawrence M., and Walid Y. Busaba, 1997, Bookbuilding vs. fixed price: An analysisof competing strategies for marketing IPOs, Journal of Financial and Quantitative Analy-sis 32, 383–403.
Benveniste, Lawrence M., Walid Y. Busaba, and William J. Wilhelm, Jr., 1996, Price stabiliza-tion as a bonding mechanism in new equity issues, Journal of Financial Economics 42,223–256.
Benveniste, Lawrence M., Sina M. Erdal, and William J. Wilhelm, Jr., 1998, Who benefits fromsecondary market price stabilization of IPOs? Journal of Banking and Finance 22, 741–767.
Benveniste, Lawrence M., and Paul A. Spindt, 1989, How investment bankers determine theoffer price and allocation of new issues, Journal of Financial Economics 24, 343–362.
Benveniste, Lawrence M., and William J. Wilhelm, 1990, A comparative analysis of IPO pro-ceeds under alternative regulatory environments, Journal of Financial Economics 28, 173–208.
Bernardo, Antonio E., and Ivo Welch, 2001, On the evolution of overconfidence and entrepre-neurs, Journal of Economics and Management Strategy 10, 301–330.
Biais, Bruno, and Anne Marie Faugeron, 2002, IPO auctions: English, Dutch, . . . French andInternet, Journal of Financial Intermediation 11, 9–36.
Black, Bernard S., and Ronald J. Gilson, 1998, Venture capital and the structure of capitalmarkets: Banks versus stock markets, Journal of Financial Economics 47, 243–277.
Boehmer, Ekkehart, and P. Raymond Fishe, 2001, Equilibrium rationing in initial public offer-ings of equity, Working paper, University of Miami.
Booth, James R., and Lena Chua, 1996, Ownership dispersion, costly information, and IPOunderpricing, Journal of Financial Economics 41, 291–310.
Bradley, Daniel, and Brad Jordan, 2002, Partial adjustment to public information and IPOunderpricing, Journal of Financial and Quantitative Analysis, forthcoming.
Bradley, Daniel, Brad Jordan, and Jay R. Ritter, 2002, The quiet period goes out with a bang,Journal of Finance, forthcoming.
Bradley, Daniel, Brad Jordan, Ivan Roten, and Ha-Chin Yi, 2001, Venture capital and IPOlockup expirations: An empirical analysis, Journal of Financial Research 24, 465–492.
Brau, James C., Bill Francis, and Ninon Kohers, 2002, The choice of IPO versus takeover:Empirical evidence, Journal of Business, forthcoming.
Brav, Alon, 2000, Inference in long-horizon event studies: A Bayesian approach with applica-tions to initial public offerings, Journal of Finance 55, 1979–2016.
Brav, Alon, and Paul A. Gompers, 1997, Myth or reality? The long-run underperformance ofinitial public offerings: Evidence from venture and nonventure capital-backed companies,Journal of Finance 52, 1791–1821.
Brav, Alon, and Paul A. Gompers, 2002, Insider trading subsequent to initial public offerings:Evidence from expirations of lockup provisions, Review of Financial Studies, forthcoming.
Brennan, Michael J., and J. Franks, 1997, Underpricing, ownership and control in initial publicofferings of equity securities in the UK, Journal of Financial Economics 45, 391–413.
Carter, Richard B., Frederick H. Dark, and Ajai K. Singh, 1998, Underwriter reputation, initialreturns, and the long-run performance of IPO stocks, Journal of Finance 53, 285–311.
Carter, Richard B., and Steven Manaster, 1990, Initial public offerings and underwriter repu-tation, Journal of Finance 45, 1045–1067.
Chemmanur, Thomas J., 1993, The pricing of initial public offers: A dynamic model with infor-mation production, Journal of Finance 48, 285–304.
Chemmanur, Thomas J., and Paolo Fulghieri, 1999, A theory of the going-public decision, Re-view of Financial Studies 12, 249–279.
Choe, Hyuk, Ronald Masulis, and Vikram Nanda, 1993, Common stock offerings across thebusiness cycle: Theory and evidence, Journal of Empirical Finance 1, 3–31.
Chowdhry, Bhagwan, and Vikram Nanda, 1996, Stabilization, syndication, and pricing of IPOs,Journal of Financial and Quantitative Analysis 31, 25–42.
1824 The Journal of Finance
Cooney, John W., Ajai K. Singh, Richard B. Carter, and Frederick H. Dark, 2001, IPO initialreturns and underwriter reputation: Has the inverse relationship f lipped in the 1900s?Working paper, University of Kentucky, Case Western Reserve University, and Iowa StateUniversity.
Cornelli, Francesca, and David Goldreich, 2001, Bookbuilding and strategic allocation, Journalof Finance 56, 2337–2369.
Cornelli, Francesca, and David Goldreich, 2002, Bookbuilding: How informative is the orderbook? Working paper, London Business School.
Daniel, Kent, David Hirshleifer, and A. Subrahmanyam, 1998, Investor psychology and securitymarket under- and over-reactions, Journal of Finance 53, 1839–1886.
Derrien, Francois, and Kent L. Womack, 2002, Auctions vs. bookbuilding and the control ofunderpricing in hot IPO markets, Review of Financial Studies, forthcoming.
Drake, Philip D., and Michael R. Vetsuypens, 1993, IPO underpricing and insurance againstlegal liability, Financial Management 22, 64–73.
Dunbar, Craig G., 2000, Factors affecting investment bank initial public offering market share.Journal of Financial Economics 55, 3–41.
Eckbo, Espen, and Oyvind Norli, 2001, Leverage, liquidity, and long-run IPO returns, WorkingPaper, Dartmouth College.
Ellis, Katrina, Roni Michaely, and Maureen O’Hara, 2000, When the underwriter is the marketmaker: An examination of trading in the IPO aftermarket, Journal of Finance 55, 1039–1074.
Ellis, Katrina, Roni Michaely, and Maureen O’Hara, 2002, The making of a dealer market:From entry to equilibrium in the trading of Nasdaq stocks, Journal of Finance 57, forthcoming.
Fama, Eugene F., and Kenneth French, 1993, Common risk factors in the returns on bonds andstocks, Journal of Financial Economics 33, 3–56.
Field, Laura C., and Gordon Hanka, 2001, The expiration of IPO share lockups, Journal ofFinance 56, 471–500.
Field, Laura C., and Jonathon Karpoff, 2002, Takeover defenses at IPO firms, Journal of Fi-nance 57, forthcoming.
Field, Laura C., and Dennis P. Sheehan, 2001, Underpricing in IPOs: Control, monitoring, orliquidity? Working paper, Pennsylvania State University.
Fishe, Raymond P. H., 2002, How stock f lippers affect IPO pricing and stabilization, Journal ofFinancial and Quantitative Analysis, forthcoming.
Foerster, Bruce, 2000, Securities Industry Association’s Capital Markets Handbook, 2nd edition~Aspen Publishers, Aspen, CO!.
Gompers, Paul, and Josh Lerner, 2001, The really long-term performance of initial public offer-ings: The pre-Nasdaq evidence, Working paper, Harvard Business School.
Habib, Michel, and Alexander Ljungqvist, 2001, Underpricing and entrepreneurial wealth lossesin IPOs: Theory and evidence, Review of Financial Studies 14, 433–458.
Hanley, Kathleen Weiss, 1993, The underpricing of initial public offerings and the partial ad-justment phenomenon, Journal of Financial Economics 34, 231–250.
Hanley, Kathleen Weiss, and William J. Wilhelm, Jr., 1995, Evidence on the strategic allocationof initial public offerings, Journal of Financial Economics 37, 239–257.
Heaton, J. B., 2002, Managerial optimism and corporate finance, Financial Management,forthcoming.
Helwege, Jean, and Nellie Liang, 2001, Initial public offerings in hot and cold markets, Workingpaper, Ohio State University.
Houge, Todd, Tim Loughran, Gerry Suchanek, and Xuemin Yan, 2001, Divergence of opinion,uncertainty, and the quality of initial public offerings, Financial Management 30, 5–23.
Hughes, Patricia J., and Anjan V. Thakor, 1992, Litigation risk, intermediation, and the un-derpricing of initial public offerings, Review of Financial Studies 5, 709–742.
Ibbotson, Roger G., 1975, Price performance of common stock new issues, Journal of FinancialEconomics 2, 235–272.
Jain, Bharat A., and Omesh Kini, 1994, The post-issue operating performance of IPO firms,Journal of Finance 49, 1699–1726.
IPO Activity, Pricing, and Allocations 1825
Jegadeesh, Narasimhan, Mark Weinstein, and Ivo Welch, 1993, An empirical investigationof IPO returns and subsequent equity offerings, Journal of Financial Economics 34,153–175.
Jenkinson, Tim, and Alexander Ljungqvist, 2001, Going Public: The Theory and Evidence onHow Companies Raise Equity Finance, 2nd edition ~Oxford University Press, Oxford, UK!.
Kahneman, Daniel, and Amos Tversky, 1979, Prospect theory: An analysis of decision underrisk, Econometrica 47, 263–291.
Kandel, Shmuel, Oded Sarig, and Avi Wohl, 1999, The demand for stocks: An analysis of IPOauctions, Review of Financial Studies 12, 227–247.
Keloharju, Matti, 1993, The winner’s curse, legal liability, and the long-run price performanceof initial public offerings in Finland, Journal of Financial Economics 34, 251–277.
Killian, Linda, Kathleen Smith, and William Smith, 2001, IPOs for Everyone ~John Wiley &Sons, New York, NY!.
Kim, Moonchul, and Jay R. Ritter, 1999, Valuing IPOs, Journal of Financial Economics 53,409–437.
Koh, Francis, and Terry Walter, 1989, A direct test of Rock’s model of the pricing of unseasonedissues, Journal of Financial Economics 23, 251–272.
Koskie, Jennifer Lynch, and Roni Michaely, 2000, Prices, liquidity, and the information contentof trades, Review of Financial Studies 13, 659–696.
Krigman, Laurie, Wayne H. Shaw, and Kent L. Womack, 1999, The persistence of IPO mis-pricing and the predictive power of f lipping, Journal of Finance 54, 1015–1044.
Krigman, Laurie, Wayne H. Shaw, and Kent L. Womack, 2001, Why do firms switch under-writers? Journal of Financial Economics 60, 245–284.
La Porta, Rafael, Florencio Lopez-de-Silanes, Andrei Shleifer, and Robert W. Vishny, 1997, Legaldeterminants of external finance, Journal of Finance 52, 1131–1150.
Lee, Philip J., Stephen L. Taylor, and Terry S. Walter, 1999, IPO underpricing explanations:Implications from investor application and allocation schedules, Journal of Financial andQuantitative Analysis 34, 425–444.
Lerner, Josh, 1994, Venture capitalists and the decision to go public, Journal of FinancialEconomics 35, 293–316.
Ljungqvist, Alexander, Vikram Nanda, and Raj Singh, 2001, Hot markets, investor sentiment,and IPO pricing, Working paper, New York University.
Ljungqvist, Alexander, and William Wilhelm, 2002a, IPO allocations: Discriminatory or discre-tionary? Journal of Financial Economics, forthcoming.
Ljungqvist, Alexander, and William Wilhelm, 2002b, IPO pricing in the dot-com bubble: Com-placency or incentives? Working paper, New York University.
Logue, Dennis E., 1973, On the pricing of unseasoned equity issues: 1965–1969, Journal ofFinancial and Quantitative Analysis 8, 91–103.
Logue, Dennis E., Richard Rogalski, James Seward, and Lynn Foster-Johnson, 2002, What’sspecial about the role of underwriter reputation and market activities in IPOs? Journal ofBusiness 75, 213–243.
Loughran, Tim, and Jay R. Ritter, 2000, Uniformly least powerful tests of market efficiency,Journal of Financial Economics 55, 361–389.
Loughran, Tim, and Jay R. Ritter, 2001, Why has IPO underpricing increased over time? Work-ing Paper, University of Florida.
Loughran, Tim, and Jay R. Ritter, 2002, Why don’t issuers get upset about leaving money onthe table in IPOs? Review of Financial Studies 15, 413–443.
Loughran, Tim, Jay R. Ritter, and Kristian Rydqvist, 1994, Initial public offerings: Inter-national insights, Pacific-Basin Finance Journal 2, 165–199.
Lowry, Michelle, 2002, Why does IPO volume f luctuate? Journal of Financial Economics,forthcoming.
Lowry, Michelle, and G. William Schwert, 2002, IPO market cycles: Bubbles or sequential learn-ing? Journal of Finance 57, 1171–1200.
Lowry, Michelle, and Susan Shu, 2002, Litigation risk and IPO underpricing, Journal of Finan-cial Economics, forthcoming.
1826 The Journal of Finance
Lucas, Deborah, and Robert McDonald, 1990, Equity issues and stock price dynamics, Journalof Finance, 45, 1019–1043.
Lyon, John D., Brad M. Barber, and Chih-Ling Tsai, 1999, Improved methods for tests of long-run abnormal stock returns, Journal of Finance 54, 165–201.
Maksimovic, Vojislav, and Pegaret Pichler, 2001, Technological innovation and initial publicofferings, Review of Financial Studies 14, 459–494.
Mello, Antonio S., and John E. Parsons, 1998, Going public and the ownership structure of thefirm. Journal of Financial Economics 49, 79–109.
Michaely, Roni, and Wayne H. Shaw, 1994, The pricing of initial public offerings: Tests of adverse-selection and signaling theories, Review of Financial Studies 7, 279–319.
Michaely, Roni, and Kent L. Womack, 1999, Conf lict of interest and the credibility of under-writer analyst recommendations, Review of Financial Studies 12, 653–686.
Mikkelson, Wayne H., M. Megan Partch, and Kshitij Shah, 1997, Ownership and operatingperformance of companies that go public, Journal of Financial Economics 44, 281–307.
Miller, Edward M., 1977, Risk, uncertainty, and divergence of opinion, Journal of Finance 32,1151–1168.
Muscarella, Chris J., and Michael R. Vetsuypens, 1989, A simple test of Baron’s model of IPOunderpricing, Journal of Financial Economics 24, 125–136.
Nanda, Vikram, and Youngkeol Yun, 1997, Reputation and financial intermediation: An empir-ical investigation of the impact of IPO mispricing on underwriter market value, Journal ofFinancial Intermediation 6, 39–63.
Pagano, Marco, Fabio Panetta, and Luigi Zingales, 1998, Why do computers go public? Anempirical analysis, Journal of Finance 53, 27–64.
Pulliam, Susan, and Randall Smith, 2000, Linux deal is focus of IPO-commission probe, WallStreet Journal December 12, C1.
Pulliam, Susan, and Randall Smith, 2001, CSFB official set quota for repayment of IPO profitsin form of commissions, Wall Street Journal August 10, C1.
Purnanandam, Amiyatosh K., and B. Swaminathan, 2001, Are IPOs underpriced? Workingpaper, Cornell University.
Rajan, Raghuram, and Henri Servaes, 1997, Analyst following of initial public offerings, Jour-nal of Finance 52, 507–529.
Reilly, Frank K., 1973, Further evidence on short-run results for new issues investors, Journalof Financial and Quantitative Analysis 8, 83–90.
Ritter, Jay R., 1998, Initial public offerings, Contemporary Finance Digest 2, 5–30.Ritter, Jay R., 2002, Investment banking and securities issuance, in G. Constantinides, M.
Harris, and R. Stulz, eds.: Handbook of the Economics of Finance ~North-Holland, NewYork, NY!.
Rock, Kevin, 1986, Why new issues are underpriced, Journal of Financial Economics 15, 187–212.Schultz, Paul H., 2000, The timing of initial public offerings, Working paper, University of
Notre Dame.Schultz, Paul H., 2001, Pseudo market timing and the long-run underperformance of IPOs,
Working paper, University of Notre Dame.Schultz, Paul H., and Mir Zaman, 2001, Do the individuals closest to Internet firms believe
they are overvalued? Journal of Financial Economics 59, 347–381.Sherman, Ann, 2000, IPOs and long-term relationships: An advantage of bookbuilding, Review
of Financial Studies 13, 697–714.Sherman, Ann, 2001, Global trends in IPO methods: Book building versus auctions, Working
paper, University of Notre Dame.Sherman, Ann, and Sheridan Titman, 2002, Building the IPO order book: Underpricing and
participation limits with costly information, Journal of Financial Economics, forthcoming.Siconolfi, Michael, 1997, Underwriters set aside IPO stock for officials of potential customers,
Wall Street Journal November 12, A1.Spatt, Chester S., and Sanjay Srivastava, 1991, Preplay communication, participation
restrictions, and efficiency in initial public offerings, Review of Financial Studies 4,709–726.
IPO Activity, Pricing, and Allocations 1827
Stoll, Hans R., and Anthony J. Curley, 1970, Small business and the new issues market forequities. Journal of Financial and Quantitative Analysis 5, 309–322.
Stoughton, Neal M., and Josef Zechner, 1998, IPO-mechanisms, monitoring and ownership struc-ture, Journal of Financial Economics 49, 45–77.
Subrahmanyam, Avanidhar, and Sheridan Titman, 1999, The going public decision and thedevelopment of financial markets, Journal of Finance 54, 1045–1082.
Teoh, Siew Hong, Ivo Welch, and T. J. Wong, 1998, Earnings management and the long-runmarket performance of initial public offerings, Journal of Finance 53, 1935–1974.
Tinic, Seha M., 1988, Anatomy of initial public offerings of common stock, Journal of Finance43, 789–822.
van Bommel, Jos, and Theo Vermaelen, 2001, Post-IPO capital expenditures and market feed-back, Journal of Banking and Finance, forthcoming.
Welch, Ivo, 1989, Seasoned offerings, imitation costs, and the underpricing of initial publicofferings, Journal of Finance 44, 421–450.
Welch, Ivo, 1992, Sequential sales, learning, and cascades, Journal of Finance 47, 695–732.Zhang, Donghang, 2001, Why do IPO underwriters allocate extra shares when they expect to
buy them back? Working paper, University of Florida.Zingales, Luigi, 1995, Insider ownership and the decision to go public, Review of Economic
Studies 62, 425–448.
1828 The Journal of Finance