A Review of IPO Activity, Pricing, and...
47
Yale ICF Working Paper No. 02-01 January 3, 2002 A REVIEW OF IPO ACTIVITY, PRICING AND ALLOCATIONS Ivo Welch Yale School of Management Jay Ritter University of Florida This paper can be downloaded without charge from the Social Science Research Network Electronic Paper Collection: http://papers.ssrn.com/abstract=296393
Transcript of A Review of IPO Activity, Pricing, and...
Yale ICF Working Paper No. 02-01
January 3, 2002
A REVIEW OF IPO ACTIVITY, PRICING AND ALLOCATIONS
Ivo Welch Yale School of Management
Jay Ritter University of Florida
This paper can be downloaded without charge from the Social Science Research Network Electronic Paper Collection:
http://papers.ssrn.com/abstract=296393

1
A Review of IPO Activity, Pricing, and Allocations
Jay Ritter Cordell Professor of Finance
University of Florida P.O. Box 117168
Gainesville FL 32611-7168 http://dale.cba.ufl.edu/ritter
[email protected] (352) 846-2837
Ivo Welch
Professor of Finance School of Management at Yale University
Box 208200 New Haven CT 06520-8200 http://welch.som.yale.edu/
[email protected] (203) 436-0777
January 3, 2002
ABSTRACT
We interpret the theory and evidence on IPO activity: why firms go public, why they reward first-day investors with considerable underpricing, how underwriters choose these first-day investors, and how IPOs perform in the long run. Our perspective on the literature is three-fold: First, we believe that many IPO phenomena are not stationary. The long-run performance of IPOs is particularly sensitive to choice of sample period, but not necessarily how one would expect it to be. Second, we believe research into IPO share allocation issues is the most promising area of research in IPOs at the moment. Third, we argue that asymmetric information is not the primary driver of many IPO phenomena. Instead, we believe future progress in the literature will come from non-rational and agency conflict explanations. We describe some promising such alternatives.
Presented at the Atlanta AFA meetings on Friday, January 4, 2002. We thank Tim Loughran, Maureen O’Hara, and Donghang Zhang for comments, and Kenneth French for supplying factor returns. The authors maintain a more extensive bibliography of IPO-related work at http://www.iporesources.org. This website further contains links to many IPO-related sites and some reasonably up-to-date information on aggregate IPO activity and IPO working papers.

2
The last two decades have seen an active market for initial public offerings (IPOs) of
equity securities in the U.S. and around the world. This market activity has been accompanied
by a growing empirical and theoretical literature documenting and explaining the patterns.
Indeed, given the size of the IPO market relative to, say, the bond market, a disproportionate
amount of attention has focused on IPOs. But if one measures market size by the extent of
uncertainty or potential misvaluations, this attention is warranted. Bonds are rarely misvalued by
more than a few basis points, whereas the increase from the offer price of an IPO to its first
closing market price can exceed several hundred percent. Thus, a substantial amount of money
is at risk. In this article, we review some of the literature on IPO activity, pricing, and
allocations. Space constraints require us to be selective. Indeed, an entire book by Jenkinson
and Ljungqvist (2001) is devoted to IPOs.
In limiting our article, we assume that the reader has some background knowledge. Most
finance textbooks have a chapter on securities issuance, with much of the chapter devoted to
IPOs of equity securities. Thus, we will gloss over many of the institutional details on “how to
go public.” We will also be U.S.-centric in our coverage of the empirical evidence. The
Jenkinson and Ljungqvist book and recent surveys by Ritter (1998, 2002) cover the international
evidence and theories explaining the differences across countries in the volume of IPO activity
and mechanism design.
Our paper addresses four primary questions:
1. What induces firms to go public?
2. Why is the closing market price on the first day of trading on average higher than the
offer price (“IPO underpricing”)?
3. Who receives these shares? I.e., how are IPOs allocated to investors?
4. Do issuers underperform over the long run?
These questions are not exclusive, but they are the defining first order questions of the
IPO literature. Other issues, such as the role of intermediaries or the legal environment, are also
quite interesting, but are more general and play a role outside the IPO domain. With their high
agency and information costs, IPOs just happen to be an unusually good laboratory to examine
them.

3
Our survey differs from earlier surveys in a number of dimensions. On a general level,
even though we try to outline all sides, we do offer a personal perspective to weigh in on current
debates, on issues that are still contentious. More specifically, we interpret some of the literature
from a different perspective: First, we believe that time-variation in many IPO phenomena
deserves more emphasis. For example, we show that long-run performance is sensitive to the
choice of sample period as well as to the widely debated choice of econometric methodology.
Second, we believe that the topic of share allocations and subsequent ownership ranks among the
most interesting issues in IPO research today. Third, we believe that asymmetric information
theories are unlikely to be the primary determinant of IPO activity and underpricing. Instead, we
believe that specific non-rational explanations and agency explanations have to play a bigger role
in the research agenda than they do today.
I. The Going Public Process
Selling securities to the general public in the United States requires the approval of the
U.S. Securities and Exchange Commission (SEC). Furthermore, the American Stock Exchange
(Amex), New York Stock Exchange (NYSE), and Nasdaq have listing requirements that
companies must satisfy in order to be traded. In general, the requirements focus on full
disclosure of information, leaving it up to investors to decide whether a security is fairly valued
or not. Ellis, Michaely, and O’Hara (2000, Table I), Foerster (2000), and Killian, Smith, and
Smith (2001, Chapter 1) provide a description of the IPO process.
Although there is no requirement to hire an investment banking firm, firms going public
invariably do so. The process starts when the issuer chooses a lead investment banker (or
increasingly, co-lead investment bankers) and signs a letter of intent to go public. The issuing
firm then enters the “quiet period” during which neither it nor its underwriters are permitted to
make forward-looking statements or release non-routine information that is not contained in the
prospectus. The logic is that all material information should be in the prospectus, although some
oral statements to qualified investors are permitted.
The first public disclosure of an IPO normally occurs when the issuer files a registration
statement with the SEC. Except for small offerings and offerings by foreign firms, this is SEC
form S-1, available on the SEC’s Electronic Data Retrieval and Gathering (EDGAR) internet site
(http://www.sec.gov). About a month later, the firm typically files an amended S-1/A that

4
contains the anticipated number of shares and the file price range (such as $12-14 per share).
The preliminary prospectus is distributed to the investment bankers’ sales force, and a marketing
campaign (e.g., road shows by executives to institutional investors) that typically lasts several
weeks commences. Issuers often file amendments during the process, especially to amend the
proposed filing price range.
With the exception of a handful of auctions, book-building has been the method used for
selling almost all IPOs in the U.S. in recent years. During the road show period, there are two
goals: the creation of demand and the measurement of demand. The underwriter attempts to
generate demand by making potential investors aware of the company and its upside potential.
Presentations are made to groups of institutional investors, both in person and by webcast. The
most important institutional investors are given special consideration, with “one-on-one”
meetings in which company executives visit investors’ offices and answer questions in private.
In addition to creating demand, the lead underwriter, or book runner, also “builds the
book.” This involves collecting indications of interest from potential investors regarding the
price they are willing to pay and the number of shares they would like to receive. Book-building
is a complicated process in which potential investors know that their allocations will be based
partly upon the amount of excess demand. Consequently, if they expect substantial excess
demand, they ask for even more shares, creating artificial demand based upon conjectures about
the demand from others. This can lead to explosively growing or collapsing demand.
The actual offering usually occurs the day after the SEC has given its go-ahead. The
issuer and lead underwriter hold a pricing meeting at which the offer price, the gross spread (the
commission paid to the underwriters), and the number of shares for sale are agreed upon. The
IPO is declared “effective,” shares are allocated, and trading commences. Ellis, Michaely, and
O’Hara (2000, 2002) and Aggarwal and Conway (2000) document that the lead underwriter is
typically the dominant market maker for Nasdaq-listed IPOs. Because the lead underwriter
knows with whom shares are placed, it has a comparative advantage at contacting potential
sellers if excess demand is present, and deterring flipping if there is insufficient demand to keep
the price from dropping.
Most IPOs contain an overallotment option for up to 15% of the shares offered. The
overallotment option is also called a “Green Shoe” option, after the first company that included
one in its 1963 IPO. This option helps underwriters in post-IPO “price stabilization,” which is

5
the only situation in which active stock price manipulation is legal. Typically, the option has an
exercise date 30 days after the offering. Normally, if the price rises on the first day and stays up,
the overallotment option is exercised in full.
Twenty-five calendar days after going public, the quiet period ends. Typically, the
managing underwriters (lead and co-managers) initiate research coverage at this point, usually
with a “buy” or “strong buy” recommendation. For shares not sold in the offering, pre-issue
shareholders commit to a specified lockup period, during which they agree not to sell any shares
without the written permission of the lead underwriter. Although there is no statutory minimum,
most lockup periods are 180 calendar days in length and almost none are less than 90 days (Field
and Hanka (2001)).
II. Choosing to Go Public
The first question must be "what makes firms go public?" In most cases, the primary
answer is the desire to raise equity capital for the firm and create a public market where the
founders and other shareholders can convert some of their paper wealth into cash at a future date.
Non-financial reasons, such as increased publicity, play only a minor role for most firms: absent
cash considerations, most entrepreneurs would rather just run their firms than concern
themselves with the complex public market process. This still leaves the question of why IPOs
are the best way for entrepreneurs to raise capital, and why these reasons are stronger in some
situations or times than others. The number of IPOs, appropriately scaled, varies widely across
countries and widely across years (sometimes by a factor of 50 or more). For example, Gompers
and Lerner (2001) report that there were fewer U.S. IPOs from 1935-1959 than in 1969 alone,
and La Porta, Lopez-de-Silanes, Shleifer, and Vishny (1997) report wide differences in IPO
activity across countries. Surprisingly, changes in capital gains tax policy are not important
determinants of the differences over time.
A. Life Cycle Theories
The first formal theory of the going public decision appeared in Zingales (1995). He
observed that it is much easier for a potential acquiror to spot a potential firm as a takeover target
when it is public. Moreover, entrepreneurs realize that acquirors can pressure them on pricing
concessions more than they can pressure outside investors. By going public, entrepreneurs thus
help facilitate the acquisition of their company for a higher value than what they would get from

6
an outright sale. Although probably the case for some IPOs, we believe that this is not the main
reason for most IPOs going public.1
Chemmanur and Fulghieri (1999) develop the more conventional wisdom that IPOs allow
more dispersion of ownership, with its advantages and disadvantages. Pre-IPO “angel” investors
or venture capitalists hold undiversified portfolios, and therefore are not willing to pay as high a
price as diversified public-market investors. There are fixed costs associated with going public,
however, and proprietary information cannot be costlessly revealed—after all, small investors
cannot take a tour of the firm and its secret inventions. Thus, early in its life cycle a firm will be
private, but if it grows sufficiently large, it becomes optimal to go public. Because of the fixed
cost of going public, this should only occur once the firm can profitably invest the proceeds. If it
raises too much money, value is destroyed because the abandonment option is discarded,
assuming that contracting is sufficiently costly. This is the theory of staged financing (Sahlman
(1990)). Public trading, however, can in itself add value to the firm, as it may inspire more faith
in the firm from other investors, customers, creditors, and suppliers. On the other hand, as
Maksimovic and Pichler (2001) point out, a high public price could also attract competition.
Still, IPO capital can confer a first-mover advantage, which may outweigh this disadvantage of
going public.2
B. Market-Timing Theories
Lucas and McDonald (1990) develop an asymmetric information model where firms
postpone their equity issue if they know they are currently undervalued. If there are common
misvaluations, aggregate issue volume will increase following bull markets. In Choe, Masulis,
and Nanda (1993), building on the adverse selection framework of Akerlof (1970) and Myers
and Majluf (1984), firms avoid issuing in periods where few other good-quality firms issue.
Other theories have argued that markets provide valuable information to entrepreneurs
1 In contrast, Black and Gilson (1998) point out that entrepreneurs often regain control from the venture capitalists in venture capital-backed companies at the IPO. Thus, many IPOs are not so much exits for the entrepreneur as they are for the venture capitalists. 2 The quintessential company often cited as an example is Netscape. However, Spyglass was a browser company that went public two months before Netscape---and quickly faltered under Netscape’s competition. Schultz and Zaman (2001) report that many internet firms that went public in the late 1990s pursued an aggressive acquisition strategy, which they interpret as an attempt to pre-empt competitors.

7
(“information spillovers”), who respond to increased growth opportunities signaled by higher
prices (Subramanyam and Titman (1999), Schultz (2000)).
We suggest that in addition to these rational theories for IPO volume fluctuations, there is
a plausible semi-rational theory without asymmetric information: entrepreneurs’ sense of
enterprise value derives more from their operations perspective and underlying business
fundamentals than from public markets. Sudden changes in the value of publicly traded firms
are not as quickly absorbed into the private sense of value held by entrepreneurs. Even if either
the market price is driven by irrational public sentiment or the entrepreneur’s price is driven by
irrational private sentiment, it is this discrepancy that makes entrepreneurs more inclined to sell
shares after comparable valuations in the public markets have increased.
For the most part, these formal theories of IPO issuing activity are difficult to test. This
is because researchers usually only observe the set of firms actually going public. They do not
observe how many private firms could have gone public.
Pagano, Panetta, and Zingales (1998) escape this criticism, albeit for a set of Italian firms
only. They have data on private companies, and find that larger companies and companies in
industries with high market-to-book ratios are more likely to go public. One benefit of going
public seems to be reduced costs of credit. Remarkably, they also find that IPO activity follows
high investment and growth, not vice versa. Brau, Francis, and Kohers (2001) find that
takeovers are a substitute for some private U.S. firms, especially in non high-tech industries.
Lerner (1994) focuses on a single U.S. industry, biotechnology. Lerner documents that industry
market-to-book ratios indeed have an effect on the decision to go public rather than acquire
additional venture capital financing.
The academic literature has tended to view increases in the valuation of comparable firms
as reflecting improved growth opportunities. But more favorable investor sentiment could also
play a role in the increased valuations. When investors are overoptimistic, in this “windows of
opportunity” framework, firms respond by issuing equity. Baker and Wurgler (2000) have
investigated a prediction of this framework. If equity issuance increases when investors are
overoptimistic, then subsequent stock returns will be low. Using data starting in the 1920s on
aggregate equity issuance relative to debt plus equity issuance, Baker and Wurgler find that the
higher the fraction of equity issuance is in a given year, the lower the overall stock market return
is in the following year.

8
Lowry (2002) finds that investor sentiment (measured by the discount on closed-end
funds), growth opportunities, and adverse selection considerations all are determinants of
aggregate IPO volume. Table 1 shows that IPO activity has varied considerably over the years.3
The largest number of IPOs occurred in 1996, the highest inflation-adjusted gross proceeds
occurred in 1999. Table 1 also conveys some of the correlation between IPO issuing activity and
underpricing, investigated in greater detail in Lowry and Schwert (2002). They and other
authors find that high IPO first-day returns lead high IPO activity by six months or so.
The reason for the leading relation is that underwriters encourage more firms to go public
when public valuations turn out to be higher than expected (high IPO underpricing) and
discourage firms from filing or proceeding with an offering when public valuations turn out to be
lower than expected. For example, in 2000, the Nasdaq Composite index had the worst year in
Nasdaq’s thirty-year history, and about 200 firms that had filed to go public withdrew their
offerings.
3 The annual volume numbers reported in Table 1 are lower than those reported in Ritter (1998, Table 2) because of our exclusion of “penny” stocks (defined as IPOs with an offer price of below $5.00 per share) and unit offers. Ritter reports annual volume numbers for IPOs starting in 1960. In the 1960s, 1970s, and 1980s, penny stock IPOs were a major portion of the number of IPOs, although only a small portion of aggregate proceeds.

9
Table 1
Number of IPOs, First Day Returns, Amount of Money Left on the Table, Gross Proceeds, and Frequency of Upward Revisions, by Cohort Year
IPOs with an offer price below $5.00 per share, unit offers, REITs, closed-end funds, banks and S&Ls, ADRs, and IPOs not listed on CRSP within six months of issuing have been excluded. Data is from Thomson Financial Securities Data, with supplements from Dealogic and other sources, and corrections by authors. The first-day return is defined as the percentage change from the offer price to the closing price. IPOs doubling in price are those with a first-day return of 100% or more. Money on the table is defined as the first-day price change (offer price to close) times the number of shares issued (global offering amount, excluding overallotment options). Money on the table and gross proceeds numbers are in millions of dollars of 2001 purchasing power, using the CPI. The last column reports the mean issue size relative to the post-issue number of shares outstanding (including all classes of shares).
Number of IPOs
Year Total Doubling
Average First-day Return
Aggregate Money Left
on the Table
Aggregate Gross
Proceeds
Average Percentage
of Firm Sold
1980 70 1 14.5% $408 $2,020 30.3% 1981 191 0 5.9% $264 $4,613 28.8% 1982 77 0 11.4% $245 $1,839 27.4% 1983 442 3 0.1% $1,479 $15,348 30.2% 1984 172 3 3.6% $86 $3,543 29.9% 1985 179 1 6.3% $354 $6,963 31.8% 1986 378 3 6.3% $1,030 $19,653 31.6% 1987 271 0 6.0% $1,019 $16,299 31.7% 1988 97 0 5.4% $186 $5,324 27.8% 1989 105 0 8.1% $336 $6,773 31.8% 1990 104 1 10.8% $454 $5,611 33.2% 1991 273 0 12.1% $1,788 $15,923 33.0% 1992 385 2 10.2% $2,148 $26,373 35.3% 1993 483 2 12.8% $3,915 $34,422 35.9% 1994 387 1 9.8% $1,650 $19,323 34.3% 1995 432 13 21.5% $5,033 $28,347 32.6% 1996 621 7 16.7% $7,383 $45,940 31.9% 1997 432 2 13.8% $4,664 $31,701 32.7% 1998 267 12 22.3% $5,352 $34,628 30.1% 1999 457 111 71.7% $37,943 $66,770 22.9% 2000 346 71 56.1% $27,682 $62,593 21.8%
2001 80 0 14.0% $2,973 $34,344 26.3%
1980-1989
1,982
9
7.4%
$5,409
$82,476
30.5% 1990-1994 1,632 6 11.2% $9,954 $101,652 34.7% 1995-1998 1,752 34 18.1% $22,436 $140,613 32.0% 1999-2000 803 182 65.0% $65,625 $129,363 22.4%
2001 80 0 14.0% $2,973 $34,344 26.3%
1980-2001
6,249
231
18.8%
$106,397
$488,448
29.0%
10
To examine stability, we divide our sample into three subperiods with roughly equal
observations (1980-1989, 1990-1994, 1995-1998), one subperiod containing the internet bubble
of 1999-2000, and the post-bubble year of 2001. For the full 22-year sample period, the average
inflation-adjusted money left on the table is $17 million, and the average inflation-adjusted gross
proceeds is $78 million.
C. The Changing Composition of IPO Issuers
Table 2 shows that the type of firms going public has changed over the years. The
percentage of technology firms increased from about 25% of the IPO market in the 1980s and
early 1990, to 37% after 1995 and an amazing 72% during the internet bubble, before returning
to 29% in 2001.4 It is fair to characterize the bubble as a “tech-firm” phenomenon, even though
many non-tech firms also showed large underpricing during the bubble. (The April 2000 IPO of
Krispy Kreme Doughnuts had a first day return of 76%.) The increase in the percentage of
technology firms over time is mirrored in the number of firms with negative earnings in the
twelve months prior to going public. In the 1980s, only 19% of firms had negative earnings
before going public. This gradually increased to 37% by 1995-1998, and then rose precipitously
to 79% during the bubble. The last two columns of Table 2 report the average first-day returns,
conditional on whether the firm had positive earnings or not. Except for the bubble period, there
is little difference in the average first-day returns.
4 Tech stocks are defined as internet stocks, computer software and hardware, communications equipment, electronics, navigation equipment, measuring and controlling devices, medical instruments, telephone equipment, and communications services, but do not include biotechnology. See Loughran and Ritter (2001, appendix 4) for the specific SIC codes.

11
Table 2
Fraction of IPOs with Negative Earnings (trailing last twelve months), 1980-2001
IPOs with an offer price below $5.00 per share, unit offers, ADRs, closed-end funds, REITs, bank and S&L IPOs, and firms not listed on CRSP within six months of the offer date are excluded. When available, we use the earnings per share for the most recent twelve months (commonly known as LTM for last twelve months) prior to going public. When a merger is involved, we use the pro forma numbers (as if the merger had already occurred). When unavailable, we use the most recent fiscal year EPS numbers. Missing numbers are supplemented by direct inspection of prospectuses on EDGAR, and EPS information from Dealogic (also known as CommScan) for IPOs after 1991, and Howard and Co.’s Going Public: The IPO Reporter from 1980-1985. Tech stocks are defined as internet-related stocks plus other technology stocks, not including biotech. Loughran and Ritter (2001) list the SIC codes in their appendix 3.
Mean First-day Returns Time Period
Number of IPOs
Percentage Tech Stocks
Percentage of IPOs with EPS<0 EPS<0 EPS≥0
1980-1989 1,982 26% 19% 9.1% 6.8% 1990-1994 1,632 23% 26% 10.8% 11.4% 1995-1998 1,752 37% 37% 19.2% 17.4% 1999-2000 803 72% 79% 72.0% 43.5%
2001 80 29% 49% 13.3% 11.6%
1980-2001 6,249 34.5% 34% 31.4% 12.5%
Although we do not show it in our tables, it was unusual for a prestigious investment
banker in the 1960s and 1970s to take a firm public that did not have at least four years of
positive earnings. In the 1980s, four quarters of positive earnings was still standard. In the
1990s, fewer and fewer firms met this threshold. Still, the firm’s analysts would normally
project profitability in the year after going public. During the bubble, firms with no immediate
prospect of becoming profitable became common. For example, public forecasts for eToys
projected no profits for at least two years. At the time of going public in May 1999, forecasted
EPS was -$0.27 for 1999 and -$0.55 for 2000. (These turned out to be overly optimistic
forecasts. eToys liquidated in 2001.) Remarkably, the IPO volume fluctuation in the late 1990s
is attributable almost entirely to the tech sector: the number of old-economy stocks going public
remained at a level of about 100 firms per year, before, during, and after the bubble.
In sum, we interpret the evidence on the decision to go public as follows. The patterns
suggest a life-cycle hypothesis, in which firms become larger and their products more mature,

12
and then go public in response to favorable market conditions. Loughran and Ritter (2001)
report that the median age of firms going public has been remarkably stable at about 7 years old
since 1980, with the main exceptions being the internet bubble period, when the median age fell
to 5 years, and 2001, when the median age rose to 12 years. The large number of internet IPOs
in 1999-2000, and their almost complete disappearance in 2001 (in response to tumbling internet
public market valuations), of course raises the issue of what determines bubbles. But this is a
question that transcends the IPO literature.
III. The Creation of Demand
Many investment-banking practices can be interpreted as attempts to “create demand.”
This leads immediately to the question of how and why marketing influences the demand for
IPO shares. 5 Marketing or certification activity may not occur just at the time of the IPO. If
bullish analysts can later seduce other investors to purchase, both entrepreneurs and original
investors would value such a service (Aggarwal, Krigman, and Womack (2001)). With rare
exceptions, academic finance researchers take the market price of an IPO as exogenous. This,
after all, is consistent with standard asset pricing theory. Relaxing this assumption may prove to
be a productive area for future research.
Issuers view the choice of underwriter as important. The choice of underwriter is
typically negotiated and determined by the issue’s size and industry on one hand and the
underwriter’s prestige and expertise on the other (Logue, Rogalski, Seward, and Foster-Johnson
(2001)). It is rare that a top-tier underwriter handles a small issue, or that a third-tier underwriter
handles a large offering.
One strand of research has focused on the effect of an underwriter’s pricing record on
subsequent market share. Beatty and Ritter (1986) find that underwriters who underprice or
overprice excessively subsequently lose market share, although Tinic (1988) argues that penny
stock underwriters may drive their results. Nanda and Yun (1997) find that underwriters’ own
public stock market price does best when offerings are moderately underpriced. Dunbar (2000)
widens this view towards long-run IPO performance and other measures, and finds that
5 DuCharme, Rajgopal, and Sefcik (2001) report that, for internet IPOs, more pre-IPO media exposure resulted in greater underpricing. This is consistent with investor awareness affecting the demand for shares.
13
established IPO underwriters are especially vulnerable to missteps. On the other hand, Krigman,
Shaw, and Womack (2001), in a questionnaire sent to firms who switched underwriters for a
follow-on offering after their IPO, report that the amount of money left on the table in the IPO
was not an important factor in deciding to switch lead underwriters. Instead, underwriter
prestige or a desire to increase analyst coverage for the stock are the two most important
determinants of switching.
Carter and Manaster (1990) and Carter, Dark, and Singh (1998) uncovered another
interesting pattern, namely that high-quality underwriters seem to have left less money on the
table for their investors---at least in the 1980s. Beatty and Welch (1996) and Cooney, Singh,
Carter, and Dark (2001) find that this relationship reversed in the early 1990s, and Loughran and
Ritter (2001) report that during the internet bubble period, prestigious underwriters were
egregious in leaving huge amounts of money on the table.
An important service provided by the underwriter is coverage by analysts. Michaely and
Womack (1999) provide evidence that the investment bank’s analysts regularly provide “booster
shots” in the form of buy recommendations even though issuers usually perform poorly after
their IPOs. Oddly, the market does not seem to recognize the full extent of this bias, so that this
service remains valuable to the issuer. However, the underwriters’ analysts are not unique in
being optimistic: Rajan and Servaes (1997) find that analysts of investment banking firms that
did not co-manage the IPO tend to disproportionally follow underpriced IPOs and also are overly
optimistic on average. Bradley, Jordan, and Ritter (2001) find that, for IPOs from 1996-2000,
when the quiet period ends 25 calendar days after going public, there is a 3 percent positive
market-adjusted return, on average. For IPOs where analyst recommendations occur, the
market-adjusted return is 4 percent. For other IPOs, the market-adjusted return is close to zero.
The positive average effect of 3 percent is difficult to reconcile with market efficiency, since the
fact that positive recommendations will be forthcoming 25 days after going public is not a
surprise.

14
IV. IPO Pricing
A. Empirical Patterns in Short-run Underpricing
Stoll and Curley (1970), Reilly (1973), Logue (1973), and Ibbotson (1975) first
documented a systematic increase from the offer price to the first day closing price.6 Academics
use the terms first-day returns and IPO underpricing interchangeably. In our sample of 6,249
IPOs from 1980-2001, which excludes penny stocks, the average first-day return is 18.8%.
Although not shown, approximately 70% of the IPOs end the first day of trading at a closing
price greater than the offer price and about 16% have a first-day return of exactly zero. We know
of no exceptions to the rule that the IPOs of operating companies are underpriced, on average, in
all countries. The offerings of non-operating companies, such as closed-end funds are generally
not underpriced.
Table 1 shows that in our sample period, IPO underpricing increased from about 7% in
the 1980s to 18% by 1995-1998. During the bubble years of 1999-2000, IPO underpricing
jumped to a whopping 65%. The average IPO during this period left $82 million on the table as
a windfall profit for its first-day investors, and one in four IPOs doubled on the first day. This
underpricing was so extreme that it is especially difficult to understand why the
issuers/underwriters did not raise their offering prices further. Since the internet bubble burst,
IPO underpricing has returned to more common levels, 14% in 2001.
Expressed in dollars of 2001 purchasing power, the average proceeds (the amount of
money raised in the offer, before fees and before any overallotment option exercise) were $78
million during 1980-2001, as reported in Table 1. Since the equally weighted average gross
spread, or commission, paid by issuing firms is about 7%, on a $78 million deal, this is just over
$5 million. The amount of money left on the table, defined as the change in price from the offer
to first-day close, multiplied by the number of shares sold, averaged $17 million. Thus, this
opportunity cost of going public is roughly three times the direct cost. Financial economists find
the willingness of issuing firms to leave so much money on the table perplexing. For example, if
a firm leaving $17 million on the table had 17 million shares outstanding before the offering, and
6 The opening market price is close to an unbiased indicator of the closing market price on the first day, so results are insensitive to whether the opening or closing market price is used. The vast majority of empirical work has used the first closing price to measure the first-day return. This is also frequently called the initial return.

15
none of its shares were sold in the offering, the opportunity cost to the pre-issue shareholders is
$1.00 per share.
Table 1 also reports the average issue size as a percentage of the post-issue shares
outstanding. In its IPO, the average firm sells 29% of the post-issue shares outstanding. Thus,
until the lockup period expires, the public float is only 29% of the market capitalization. During
the internet bubble period, the mean public float dropped to 22%. At the time, many
practitioners argued that internet IPOs were receiving especially high prices due to their special
scarcity value.
A different way to view this phenomenon, popular with practitioners, is that internet IPOs
were especially scarce and sought after, driving their high prices—in other words, the demand
curve was particularly steep. At the time, many practitioners argued that internet IPOs were
receiving high prices due to their scarcity value. This argument assumes that there is a
negatively sloped demand curve for a given IPO. As we will see, the evidence is highly
supportive of this assumption, and almost all explanations of the empirical patterns that have
been documented in the literature either explicitly or, more commonly, implicitly, make this
assumption.
B. Theoretical Explanations of Short-run Underpricing
Ibbotson (1975) offered a list of possible explanations for IPO underpricing, many of
which were formally explored by other authors in later work. Before going into detail, it is
important to understand that simple fundamental market misvaluation or asset-pricing risk
premia are unlikely to explain the average first-day return of 18.8% reported in our Table 1. To
put this in perspective, the comparable daily market return has averaged only 0.05%.
Furthermore, if diversified IPO first-day investors require compensation for bearing systematic
or liquidity risk, why do second-day investors (purchasing from first-day investors) not seem to
require this premium? After all, fundamental risk and liquidity constraints are unlikely to be
resolved within one day. Thus, the solution to the underpricing puzzle has to lie in focusing on
the special differences between the issuer’s price and the first after-market price, which are
resolved or revealed when the aftermarket first opens.
Most theories of IPO underpricing were developed in the 1980s, when average first-day
returns averaged about 7%. As we argue below, most of these theories are incapable of
explaining the severe underpricing of internet IPOs observed in 1999-2000. Thus, just as our

16
Table 1 documents structural breaks in underpricing. It is our opinion that academics are
appropriately responding with structural breaks in their explanations for IPO underpricing.
One way of classifying theories of IPO underpricing is to categorize them on the basis of
whether asymmetric information or symmetric information is assumed. The former can in turn
be classified into theories in which IPO issuers are more informed than after-market investors
(perhaps about internal projects) and into theories in which investors are more informed than the
issuer (perhaps about demand).
B.1. Theories Based on Asymmetric Information
If the issuer is more informed than investors, rational investors fear a lemons problem:
only issuers with worse-than-average quality are willing to sell their shares at the average price.
To distinguish themselves from the pool of low-quality issuers, high-quality issuers may attempt
to signal their quality. In these models, better quality issuers deliberately sell their shares at a
lower price than the market believes they are worth, which deters lower quality issuers from
imitating. With some patience, these issuers can recoup their upfront sacrifice post-IPO, either
in future issuing activity (Welch (1989)), favorable market responses to future dividend
announcements (Allen and Faulhaber (1989)), or analyst coverage (Chemmanur (1993)). In
common with many other signaling models, high quality firms demonstrate that they are high
quality by throwing money away. One way to do this is to leave money on the table in the IPO.
However, on theoretical grounds, it is unclear why IPO underpricing is a more efficient signal
than, say, charitable donations or advertising.
The evidence in favor of these signaling theories is, at best, mixed: there is evidence of
substantial post-issuing market activity by IPO firms (Welch (1989)), and it is clear that some
issuers approach the market with a multi-issuing strategy.7 However, it is natural to believe that
any price appreciation would induce entrepreneurs to return to the market for more funding.8
Jegadeesh, Weinstein, and Welch (1993) find that returns after the first day are just as effective
7 One statement of this is that the IPO is a marketing event rather than a capital-raising event. This only makes sense if the window of opportunity is likely to still be open when it is time for the follow-on offer (also known as a seasoned equity offer). It is worth noting that there is little controversy about whether IPO issuers pursue a dynamic strategy, in which the IPO is just one part. The controversy is whether post-issuing activity can explain IPO underpricing, not IPO activity. 8 van Bommel and Vermaelen (2001) find that firms with higher first-day returns spend more money on investment after the IPO.

17
in inducing future issuing activity as the first-day returns are. Michaely and Shaw (1994)
outright reject signaling: in a simultaneous equation model, they find no evidence of either a
higher propensity to return to the market for a seasoned offering or of a higher propensity to pay
dividends for IPOs that were more underpriced. Still, aside from the persistence of this
explanation on the street, the most appealing feature of the signaling hypotheses is that some
issuers voluntarily desire to underprice and leave money on the table to create “a good taste in
investors’ mouths.”
If investors are more informed than the issuer, for example about the general market
demand for shares in the aggregate, then the issuer faces a placement problem. The issuer does
not know the price the market is willing to bear. In other words, issuers face an unknown
demand for their stocks. A number of theories model a specific demand curve.
One can simply assume that all investors are equally informed, and thus purchase shares
only if their price is below their common assessment. Observed (successful) IPOs thus are
necessarily underpriced. However, there are some overpriced IPOs going public, which would
not be predicted since all investors are assumed to know that these would be overpriced. A more
realistic assumption is that investors are differentially informed. Pricing too high might induce
investors to fear a winner’s curse (Rock (1986)) or a negative cascade (Welch (1992)).
In a winner’s curse, investors fear that they will only receive full allocations if they
happen to be among the most optimistic investors. When everyone desires the offering, they get
rationed. An investor would receive a full allocation of overpriced IPOs but only a partial
allocation of underpriced IPOs. Thus, his average return, conditional on receiving shares, would
be below the unconditional return. To break even, investors need to receive IPO underpricing.
Koh and Walther (1989) have rationing information, and find that an uninformed strategy in
Singapore indeed just about broke even. In an informational cascade, investors attempt to judge
the interest of other investors. They only request shares when they believe the offering is hot.
Pricing just a little too high leaves the issuer with too high a probability of complete failure, in
which investors abstain because other investors abstain. In support, Amihud, Hauser, and Kirsh
(2001) find that IPOs are either hugely oversubscribed or totally undersubscribed, with very few
offerings moderately oversubscribed.
Benveniste and Spindt (1989), Benveniste and Wilhelm (1990), and Spatt and Srivastava
(1991) offer an alternative pricing mechanism for uninformed issuers: they can attempt to obtain

18
information from informed investors.9 And, indeed, the practice of building the book before the
IPO and using this information to adjust the offer price for the IPO is widespread. To induce
investors to truthfully reveal that they want to purchase shares, underwriters must offer them
some combination of more IPO allocations and underpricing when they indicate a willingness to
purchase shares at a high price. This information gathering perspective of book-building is
certainly useful, but it is not clear how valuable the information provided by one incremental
investor is when the investment banker can canvas hundreds of potential investors. Thus, it is
unclear whether the Benveniste and Spindt (1989) framework is capable of explaining
underpricing of more than a few percent.
Book-building theories lend themselves unusually well to empirical tests with available
data. The most commonly cited evidence in favor of book-building theories is the effect of
revisions in the offer price during the filing period, first documented by Hanley (1993). She
finds that underwriters seem reluctant to fully adjust their pricing upward to keep IPO
underpricing constant when demand is strong. Thus, when underwriters revise the share price
upward from their original estimate in the preliminary IPO prospectus, underpricing tends to be
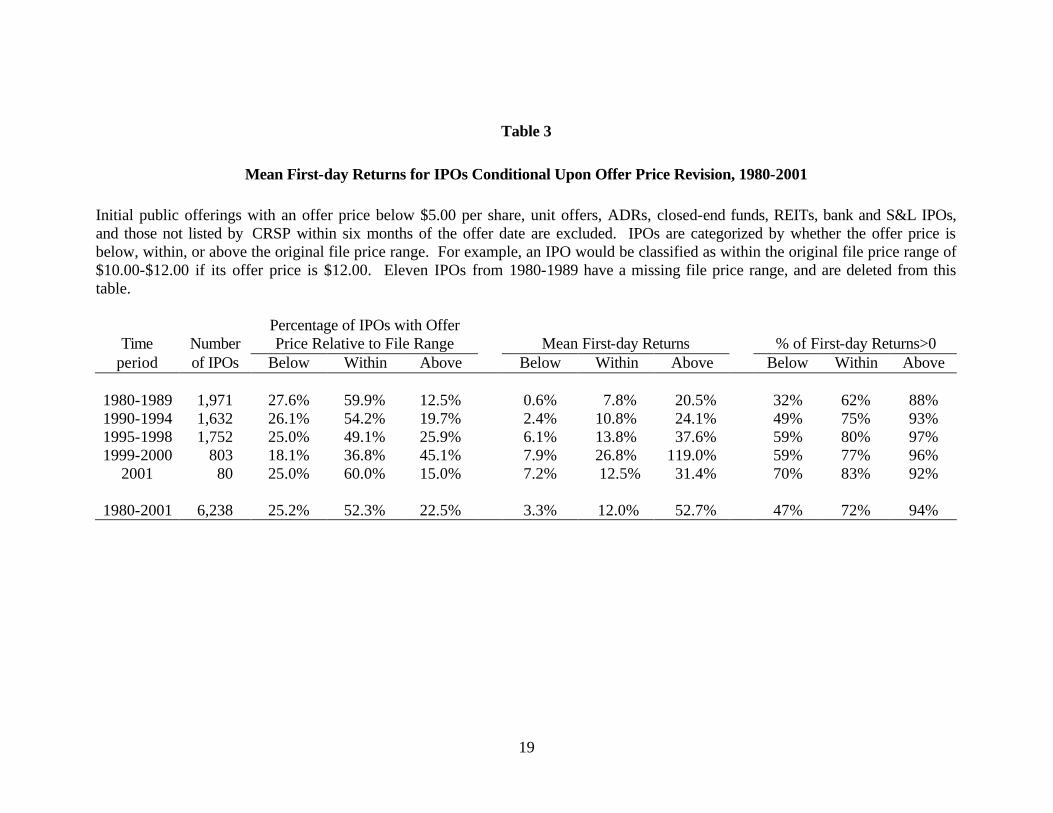
higher. Table 3 shows that this pattern has held throughout 1980-2001: When the offer price
exceeds the maximum of the original file price range, the average IPO underpricing is
significantly above average (53% instead of 3% for IPOs adjusting their offer price downward
and 12% for IPOs priced within their filing range). This extra underpricing is interpreted in this
dynamic information acquisition theory to be compensation that is necessary to induce investors
to reveal their high personal demand for shares. Consistent with the information revelation
theory of bookbuilding, Lee, Taylor, and Walter (1999) and Cornelli and Goldreich (2001) show
that informed investors request more, and preferentially receive more, allocations.
9 Benveniste and Busaba (1997) consider whether book building or cascade creation is more profitable from the issuer’s point of view.
19
Table 3
Mean First-day Returns for IPOs Conditional Upon Offer Price Revision, 1980-2001 Initial public offerings with an offer price below $5.00 per share, unit offers, ADRs, closed-end funds, REITs, bank and S&L IPOs, and those not listed by CRSP within six months of the offer date are excluded. IPOs are categorized by whether the offer price is below, within, or above the original file price range. For example, an IPO would be classified as within the original file price range of $10.00-$12.00 if its offer price is $12.00. Eleven IPOs from 1980-1989 have a missing file price range, and are deleted from this table.
Time
Number Percentage of IPOs with Offer Price Relative to File Range
Mean First-day Returns
% of First-day Returns>0
period of IPOs Below Within Above Below Within Above Below Within Above 1980-1989
1,971
27.6%
59.9%
12.5%
0.6%
7.8%
20.5%
32%
62%
88%
1990-1994 1,632 26.1% 54.2% 19.7% 2.4% 10.8% 24.1% 49% 75% 93% 1995-1998 1,752 25.0% 49.1% 25.9% 6.1% 13.8% 37.6% 59% 80% 97% 1999-2000 803 18.1% 36.8% 45.1% 7.9% 26.8% 119.0% 59% 77% 96%
2001 80 25.0%
60.0% 15.0% 7.2% 12.5% 31.4% 70% 83% 92%
1980-2001 6,238 25.2% 52.3% 22.5% 3.3% 12.0% 52.7% 47% 72% 94%

20
But, as Loughran and Ritter (2002) and Lowry and Schwert (2002) point out, the book-
building theories apply to private information only. If plain and simple reluctance to adjust
prices, rather than a deeper theoretical cause (the search for information from investors) were at
work, then we would also see public market changes help predict IPO underpricing. Indeed,
both sets of authors find that when the overall stock market has rallied, underwriters do not fully
adjust their pricing. In our opinion, the fact that past performance by other firms has an
influence on IPO underpricing points more to a behavioral explanation, such as that in Loughran
and Ritter (2002), than to an information extraction theory. It should be noted, however, that
these theories are not mutually exclusive. Both probably explain part of the pattern.
Baron (1982) offers a different, agency-based explanation for underpricing. His theory
also has the issuer less informed, but relative to its underwriter, not relative to investors. To
induce the underwriter to put in the requisite effort to market shares, it is optimal for the issuer to
make the shares easier to sell by underpricing them. In Habib and Ljungqvist (2001),
underpricing is similarly a substitute for IPO marketing. However, Muscarella and Vetsuypens
(1989) find that underwriters going public underprice just like other issuers. This does not favor
the Baron hypothesis, even though underwriters may have to underprice in order to not shine the
light on their underpricing practices in other cases. More importantly, internet IPOs were the
easiest shares ever to sell, and nevertheless showed the highest, not the lowest underpricing.
In all theories that rely on asymmetric information, is that making the purchase of one
IPO conditional on the purchase of other IPOs (“bundling”) could reduce the (average)
uncertainty, which in turn could significantly reduce the necessary IPO underpricing. Thus, we
deem it unlikely that asymmetric information theories explain more than a few percent of IPO
underpricing. In the 1980s, when underpricing averaged 7 percent, the emphasis on asymmetric
information models was understandable. With the levels of underpricing that we have observed
in recent years, however, a new class of explanations is called for.
B.2. Theories Based on Symmetric Information
There are also theories of underpricing that do not rely on asymmetric information that is
resolved on the first day of trading. Tinic (1988) and Hughes and Thakor (1992) argue that
issuers underprice to reduce their legal liability: an offering that starts trading at $30 that is
priced at $20 is less likely to be sued than an offering priced at $30, if only because it is more

21
likely that at some point the after-market share price drops below $30 than below $20. Indeed,
some law firms seem to specialize in suing IPOs that have dropped in value. Still, Drake and
Vetsuypens (1993) find that sued IPOs had higher, not lower IPO underpricing, i.e., that IPO
underpricing did not protect them from being sued. However, Lowry and Shu (2002) point out
that this may be because IPOs more likely to be sued later also underpriced more. In our
opinion, leaving money on the table appears to be a cost-ineffective way of avoiding subsequent
lawsuits. But the most convincing evidence that legal liability is not the primary determinant of
underpricing is that countries in which U.S. litigative tendencies are not present have IPOs that
are similarly underpriced (Keloharju (1993)).
As shown in Table 1, the 1999-2000 internet bubble period saw extreme underpricing of
IPOs. One popular explanation is that underwriters could not justify a higher offer price on
internet IPOs, perhaps out of legal liability concerns, given the already lofty valuations on these
companies. One way of interpreting this is that underwriters were “leaning against the wind” by
not taking advantage of temporary overoptimism on the part of some investors. While this
argument has a certain plausibility, we find the logic wanting because investment banking firms
were making other efforts to encourage overvaluations during the internet bubble, such as
subsequent buy recommendations at market prices far above the offer price.10
Another explanation for underpricing is advanced by Boehmer and Fishe (2001). They
note that trading volume in the aftermarket is higher, the greater is the underpricing. (See
Krigman, Shaw, and Womack (1999) and Ellis, Michaely, and O’Hara (2000) for related
evidence.) Thus, an underwriter who makes a market in a Nasdaq-listed IPO gains additional
trading revenue. Unlike the lawsuit-avoidance explanation of underpricing, it is not clear how
the issuing firm benefits from the underpricing, unless the increased liquidity is persistent (Booth
and Chua (1996)).
10For example, Credit Suisse First Boston (CSFB) took Corvis public on July 28, 2000 at an offer price of $36.00. At the closing price of $84.719 on the first day of trading, the first-day return was 135%. When the quiet period ended on August 22, 2000, the five co-managing underwriters all put out “buy” recommendations, and CSFB initiated coverage with a “strong buy” recommendation, even though the price had increased to $90. At $90 per share, Corvis had a market capitalization of $30 billion, despite never having had any revenue. (In December 2001, its market valuation was less than $1 billion.) Bradley, Jordan, and Ritter (2001) report that 87% of analyst initiations at the end of the quiet period were “buys” or “strong buys” during 1998-2000.

22
Table 4
Summary of Recent Articles Concerning the Allocation of IPO Shares
Discrimination in favor of regular investors to induce information revelation:
Benveniste, Busaba, and Wilhelm (1996) penalty bids allow discrimination to reward repeat investors
Sherman and Titman (2002 JFE) underpricing is the reward to investors for acquiring information
Sherman (2000) discretion allows bundling with book building
Agency problems between underwriters and issuers:
Loughran and Ritter (2002 RFS) state-contingent issuer psychology boosts underwriter profits
Loughran and Ritter (2001) allocations of hot issues boost underwriter profits
Ownership structure:
Booth and Chua (1996) allocations to many investors increase liquidity
Brennan and Franks (1997) allocations to many investors entrenches managers
Stoughton and Zechner (1998) allocation creating a blockholder induces monitoring
Mello and Parsons (1998) allocation creating a blockholder induces monitoring
Supply and demand effects:
Aggarwal (2000) cold issues are overallocated
Zhang (2001) overallocation of cold issues boosts aftermarket demand
Cornelli and Goldreich (2002) offer price is more related to prices bid than to quantity demanded
Empirical documentation of institutional versus individual investors:
Ljungqvist and Wilhelm (2002 JFE) across countries, there is less underpricing if institutions are favored
Hanley and Wilhelm (1995) institutions are favored on hot IPOs, but bundling occurs
Lee, Taylor, and Walter (1999) institutions ask for more shares on hot IPOs, but suffer discrimination
Cornelli and Goldreich (2001 JF) underwriters use discretion to favor repeat investors (bundling)
Aggarwal, Prabhala, and Puri (2002 JF) institutions receive higher allocations on hot IPOs
Flipping and stabi lization:
Benveniste, Erdal, and Wilhelm (1998) penalty bids constrain selling by individuals on cold IPOs
Chowdhry and Nanda (1996) stabilization activities reduce the winner’s curse
Ljungqvist, Nanda, and Singh (2001) selective flipping allows price discrimination
Fishe (2002 JFQA) flipping creates artificial demand which is sometimes useful
Krigman, Shaw, and Womack (1999) institutions flip IPOs more successfully than individuals do
Aggarwal (2002 JFE) hot IPOs are commonly flipped, with interdealer trades common
Houge et al. (2002 FM) IPOs with heterogeneous valuations underperform more

23
B.3. Theories Focusing on the Allocation of Shares
In recent years, more attention has been drawn to how IPOs are allocated. Table 4 lists
recent papers, both theoretical and empirical, that explicitly deal with allocations, including
flipping and stabilization activity:
With bookbuilding, underwriters have discretion regarding who will be allocated shares
(Sherman and Titman (2002)). This discretion can be used to the advantage of issuers, in that the
pooling of hot and cold IPOs can reduce the winner’s curse problem (Sherman (2000)). But
there is a dark side to bookbuilding, too. There is some anecdotal evidence that underpriced
share allocations have been used by underwriters to enrich buy-side clients in return for quid pro
quos (Pulliam and Smith (2000, 2001)), to curry favor with other prospective IPO issuers
(Siconolfi (1997)), or even to influence politicians.11 Because direct payments to selected buy-
side clients are generally illegal, preferential IPO allocations to them could be the next-best
option.12
Unfortunately, not much public evidence is available to formally test this hypothesis
because underwriters are careful to guard information about the specifics of their share
allocations. We believe that the most interesting questions today relate to these allocations:
How much effective bundling of shares across issues (and thus a reduction of average
uncertainty) do subscribers experience? How do investors decide in which issues they would
like to request IPO allocations, and how heavily influenced is this by perceptions of what others
are going to do? Who receives IPO allocations? How do allocations relate to other business
provided by the investor? Do large institutions receive preferential treatment based on valuable
information, and if so, what is it? Furthermore, we believe that the answers to these questions
are likely to depend upon the time period examined.
11 Hundreds of private sector lawsuits against underwriters, as well as government investigations, have followed the bursting of the internet bubble. The lawsuits have focused on two issues. The first, so-called “laddering,” alleges that underwriters drove up first-day market prices by requiring some investors to buy additional shares in the open market as a condition for receiving shares at the offer price. The second issue concerns how IPOs were allocated and the compensation that underwriters received. Some underwriters, especially Credit Suisse First Boston, are alleged to have allocated hot IPOs to hedge funds and other investors who in return generated abnormal commission business. 12 Rydqvist (1997) argues that IPO compensation could be tax-efficient compensation if shares are primarily allocated to employees and capital gains taxes are low relative to labor income taxes.
24
An even more basic question is why issuers do not demand that underwriters conduct
auctions. Auctions are associated with only a little underpricing (Biais and Faugeron (2001),
Kandel, Sarig, and Wohl (1999), and Loughran, Ritter, and Rydqvist (1994)). On a world wide
basis, however, auctions have been losing market share (Sherman (2001)), and the introduction
of auctions in the U.S. by WRHambrecht in 1999 has attracted only six IPOs in the following 2.5
years. There have been allegations that issuers’ managers are complacent because they
personally (rather than their companies) received favorable allocations in other underpriced IPOs
as a tit-for-tat from their underwriters (Siconolfi (1997)).
The first model to focus on the allocation of shares was Benveniste and Spindt (1989),
which we have previously discussed along with other asymmetric information-based theories.
This information revelation theory has the result that underwriter discretion results in less
underpricing on average, and therefore higher expected proceeds. Loughran and Ritter (2002)
instead focus on the agency problem which suggests that underwriter discretion can result in
more underpricing on average: if underwriters can recapture money left on the table, they have
an incentive to leave more of the issuers’ money on the table. The mystery is why issuing firms
appear generally content to leave so much money on the table. Loughran and Ritter use prospect
theory to argue that entrepreneurs are more tolerant of excessive underpricing if they
simultaneously learn about a post-market valuation that is higher than what they expected.13 In
other words, the greater the recent increase in their wealth, the less is the bargaining effort of
issuers in their negotiations over the offer price with underwriters.
Both the information revelation and prospect theory explanations of underpricing are
consistent with the right-skewness in the first-day returns on IPOs that is observed. Only the
prospect theory explanation explains why lagged market returns (public information) are not
fully incorporated into the offer price, however. Indeed, empirically there is an asymmetric
response: if there is a negative market return during the three weeks prior to going public, the
offer price is lowered (Bradley and Jordan (2002) and Lowry and Schwert (2002)). But if the
13 Prospect theory is a positive model of how people behave developed by Kahneman and Tversky (1979). Prospect theory assumes that people focus on changes in wealth, rather than the level of their wealth, in making decisions. In Loughran and Ritter’s (2002) application to the IPO market, it is assumed that issuers measure their wealth change from the midpoint of the file price range to the closing market price on the first day of trading.

25
market rallies during the three weeks prior to going public, the offer price is not equally raised,
on average.
The prospect theory explanation for underpricing also addresses another pattern that has
perplexed financial economists for decades: the strong autocorrelation of first-day returns. In
Lowry and Schwert (2002, Table I), the equally weighted average first-day return is calculated in
each calendar month from 1960 to 1997. The first-order autocorrelation of these monthly
average first-day returns is 0.60. If offer prices are not adjusted upwards when the market return
is positive during the book-building period, then all IPOs whose book-building periods overlap
will have higher expected first-day returns. Since the typical book-building period lasts about 30
calendar days, the first-day returns in adjacent calendar months will be autocorrelated.
Almost all IPOs contain a 15% overallotment option. In allocating shares, if there is
strong demand, the underwriter will allocate 115% of the shares. Then, if the price weakens in
aftermarket trading, the underwriter can buy back up to the extra 15% and retire the shares, as if
they had never been offered in the first place. In an important paper, Aggarwal (2000) reports
that if the underwriter anticipates weak demand, it will typically allocate up to 135% of the
offering, taking a naked short position. The underwriter then buys back the incremental 20%,
and has the option of buying back the other 15%, treating the shares as if they were never issued
in the first place.
Zhang (2001) argues that the allocation of these extra shares boosts the aftermarket
demand for the stock. This is because institutional investors who are allocated shares are likely
to continue holding them, whereas if they hadn’t received any shares in the first place, they
would be unlikely to buy the shares in the aftermarket. The extra demand to buy and hold that
results from the overallocation boosts the aftermarket price, allowing the issuer to receive a
higher offer price. If the demand for an IPO is strong, underwriters do not take a naked short
position because covering it would be too costly. Aggarwal and Zhang’s papers show that how
many shares are allocated matters.
Who purchases an IPO’s shares may in turn influence IPO activity, underpricing, and
long-run performance. A good number of companies begin implementing takeover defenses as
early as the IPO (Field and Karpoff (2001)). Booth and Chua (1996), Brennan and Franks
(1997), Mello and Parsons (1998), and Stoughton and Zechner (1998) all point out that IPO

26
underpricing creates excess demand and thus allows issuers to decide whom to allocate shares to.
Stoughton and Zechner argue that underpricing is needed to create an incentive to acquire a
block of stock and then monitor the firm’s management, creating a positive externality for
atomistic investors. Mello and Parsons point out that a two-part issuing strategy may be more
efficient, with the IPO aimed at atomistic investors and a private placement aimed at a
blockholder. In the U.S., large blockholders are common prior to the IPO in the form of venture
capitalists and leveraged buyout financiers, but the venture capitalists typically distribute shares
to their limited partners as soon as the lockup period ends. Furthermore, the general partners
typically also relinquish control via open market sales, rather than selling a strategic block. This
is contrary to the predictions of almost all models of control in the corporate finance literature.
In Booth and Chua, issuers like the increased liquidity associated with more aftermarket
trading brought about by more investor dispersion. In these models, the allocation of shares thus
results in a higher market value for the firm. In contrast, in Brennan and Franks the diffuse
ownership of public shareholders lowers firm value. Nevertheless, issuers may prefer a wider
and more dispersed investor base to escape institutional pressure and allow them to enjoy private
benefits of control.
In a sample of 69 British IPOs, Brennan and Franks (1997) find that when shares are
placed more widely rather than placed with just a few powerful large shareholders, the
entrepreneur is less easy to oust from the company. Brennan and Franks also find that directors
continue to hold onto shares more than other investors, again presumably trying to retain control
of the company.
To raise a given proceeds, underpricing results in a dilution of the percentage ownership
of the original shareholders since more shares must be sold, the lower is the offer price.
Underpricing also results in excess demand, permitting the underwriter to allocate shares to
specific clienteles. In our opinion, it is not at all obvious that the benefits of placing shares with
specific clienteles, which may be just temporary unless there are resale restrictions, outweigh the
control benefits of selling a smaller fraction of the firm. We believe that the identities and roles
of different clienteles remain important areas of future research.
An extreme category of temporary investors is flippers. Flippers purchase shares at the
IPO and quickly turn around to sell their shares in an attempt to profit from the first-day

27
underpricing. Underwriters have a quixotic view towards flippers: on the one hand, the new
agency theories of underpricing argue that underwriters sometimes allocate shares specifically to
investors so that these investors can make a quick profit. Furthermore, underwriters desire liquid
after-market trading. (After all, someone has to sell!) On the other hand, the “unreal” demand of
flippers make it difficult both to gauge the buy-and-hold demand for shares pre-IPO and properly
price shares.
For IPOs where there is weak demand, underwriters discourage flipping through moral
suasion (i.e., the threat of withholding future allocations on hot issues) and the imposition of
penalty bids. A penalty bid occurs when the lead underwriter takes back the selling concession
(the commission) from a broker who has allocated shares that are flipped. The existence of
penalty bids gives a broker an incentive to allocate shares to clients who are likely to be buy-and-
hold investors. More controversially, a penalty bid also gives a broker an incentive to discourage
a client from selling shares, when the client may not be aware of the broker’s financial incentive.
For IPOs where there is strong demand and a price jump, penalty bids are rarely imposed, and
flipping may even be encouraged in order to keep market demand from pushing the price to
unsustainable levels. This practice by underwriters explicitly assumes that there is a negatively
sloped demand curve, and that the market price is not exogenous.
One question that arises is whether flipping by institutions can be used to predict long-
term returns on IPOs. That is, do institutions succeed in identifying IPOs that are being
overvalued when trading commences? Field (1997), Krigman, Shaw and Womack (1999) and
Houge, Loughran, Suchanek, and Yan (2002) find evidence suggesting that indeed they do.
In Table 1, we report that $66 billion was left on the table during the internet bubble.
This is an enormous amount of money. At this point, there has been no research investigating
how this $66 billion was split among buy-side participants (individual investors, mutual funds,
hedge funds, “friends and family,” etc.) and sell-side participants (the stockholders of investment
banking firms through higher profits; and analysts, traders, and corporate finance employees
through bigger bonuses). Furthermore, if many institutional investors were directing their trades
to investment banking firms that had IPOs to hand out, how much did this harm electronic
communication networks that did not get the order flow, in spite of their lower commissions?
In the 1980s, “dividend capture” schemes by Japanese insurance companies led to

28
artificially high volume for U.S. stocks paying high dividends around the ex dividend day. In
recent years, it is likely that share volume was unusually high for certain stocks as certain
investors sought to generate commissions as a way of receiving hot IPO allocations. To get
some idea of the magnitude of the effect, table 1 reports that $66 billion was left on the table in
1999-2000. If investors rebated 20% of this back to underwriters in the form of extra
commissions, this would amount to $13 billion. At an average commission of 10 cents per share,
this would amount to 130 billion shares traded, or an average of 250 million shares per trading
day during 1999-2000. Because combined Nasdaq and NYSE volume averaged about ten times
this amount during these years, this would suggest that portfolio churning by investors to receive
IPO allocations may have accounted for as much as 10 percent of all shares traded during the
internet bubble. This extra trading volume is not likely to have been evenly distributed across all
stocks. Instead, the churning probably was concentrated in the most liquid stocks. At this point,
we are unaware of any market microstructure research that has investigated this issue.
Other effects of the large amount of money left on the table during the internet bubble
might include the growth of hedge funds. If hedge funds were able to boost their returns
substantially because of their ability to receive hot IPO allocations in return for rebating part of
the profits back to underwriters via commission business, then the high returns on this asset class
may have been transitory. Hedge funds operate more clandestinely, trade more frequently, and
share a larger fraction of their profits with their principals, giving them even greater incentives
than mutual funds.
B.4. Summary of IPO Pricing
As readers of this literature we come away with the view that IPO underpricing is real
and persistent, indeed even increasing over time. While asymmetric information models have
been popular among academics, we feel that these models have been overemphasized. In any
case, we believe that there is no single dominant theoretical cause for underpricing. In other
words, it is not so much a matter of which model is right, but more a matter of the relative
importance of different models. Furthermore, one reason can be of more importance for some
firms and/or at some times. To date, there has been little empirical work attempting to quantify
the relative importance of different explanations of underpricing.
29
C. Valuation
An immediate question raised by the sometimes large differences between the offer price
and the first-day market price is whether issuers or the stock market is pricing offerings in line
with a firm’s fundamentals. The most common method for valuing firms going public is the use
of comparable firm multiples. But unfortunately, accounting data are too unreliable a measure of
true valuation to facilitate reliable tests, especially because many firms going public are being
valued for their growth options, not their historical financials. As a result, the power of tests to
explain pricing relative to some “true fundamental value” is too low to make much headway in
testing whether IPO pricing or after-market valuation better reflects the IPOs’ fundamental
valuations. Kim and Ritter (1999) found only a modest ability to explain the pricing of IPOs
using accounting multiples. Purnanandam and Swaminathan (2001) find that IPOs tend to be
overpriced relative to comparables (“comps”) in the public market. We also hope that future
research would use practitioner earnings forecasts (e.g., I/B/E/S) instead of time-series forecasts
from historical earnings listed on the IPO prospectus.
One method of testing whether the offer price or the first closing market price is a better
measure of “true” value is to examine long-run returns. If the first closing market price is an
unbiased measure of a firm’s fundamental value, then there should be no abnormal returns in the
future.
V. Long-run Performance
No survey would be complete without covering a facet of IPOs that has attracted
substantial interest from academics in recent years: the performance of IPOs in the market in the
years after the offering. Efficient markets proponents would argue that once an IPO is publicly
traded, it is just like any other stock and thus that the after-market stock price should
appropriately reflect the shares’ intrinsic value. Thus, risk-adjusted post-IPO stock price
performance should not be predictable. In this sense, post-IPO long-run performance is less of
an IPO (or corporate finance) issue as it is a standard asset-pricing issue. Still, many IPO shares
have been difficult to sell short and thus have retained some peculiarity even post-IPO.
In measuring long-run performance, one can focus either on raw (absolute) performance,
or performance relative to a benchmark (abnormal returns). The evidence below shows that

30
IPOs had poor abnormal returns, but even more so, poor absolute performance since 1970.
However, the choice of sample period plays a role in how significant this underperformance was,
and perhaps sometimes as much as the chosen statistical measurement techniques.
A. Long-Run Performance Evidence
Statistical inference is problematic when the returns on individual IPOs overlap, as they
do when multi-year buy-and-hold returns are used. Indeed, this is a problem for all long-term
performance studies, not just those examining IPO performance. While Brav (2000) and others
have addressed this issue, an alternative approach is to measure returns in calendar time. In
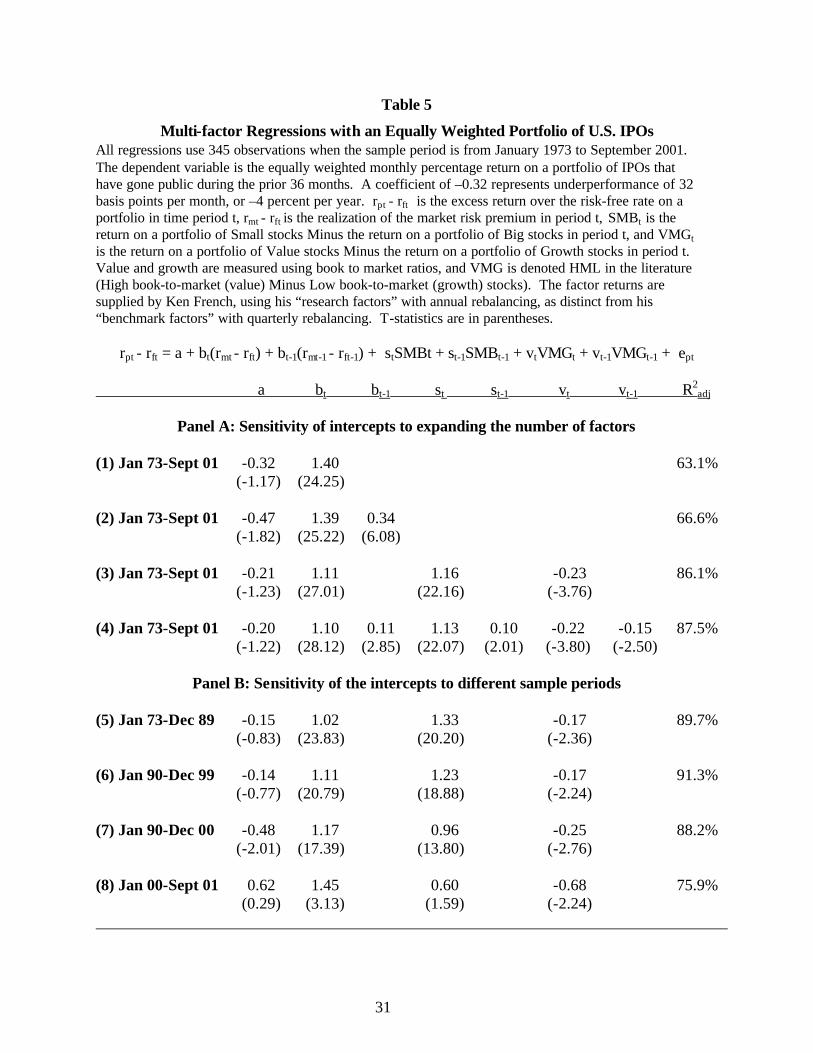
Table 5, we report time-series regression results using the Fama-French (1993) 3-factor model.
31
Table 5
Multi-factor Regressions with an Equally Weighted Portfolio of U.S. IPOs All regressions use 345 observations when the sample period is from January 1973 to September 2001. The dependent variable is the equally weighted monthly percentage return on a portfolio of IPOs that have gone public during the prior 36 months. A coefficient of –0.32 represents underperformance of 32 basis points per month, or –4 percent per year. rpt - rft is the excess return over the risk-free rate on a portfolio in time period t, rmt - rft is the realization of the market risk premium in period t, SMBt is the return on a portfolio of Small stocks Minus the return on a portfolio of Big stocks in period t, and VMGt is the return on a portfolio of Value stocks Minus the return on a portfolio of Growth stocks in period t. Value and growth are measured using book to market ratios, and VMG is denoted HML in the literature (High book-to-market (value) Minus Low book-to-market (growth) stocks). The factor returns are supplied by Ken French, using his “research factors” with annual rebalancing, as distinct from his “benchmark factors” with quarterly rebalancing. T-statistics are in parentheses.
rpt - rft = a + bt(rmt - rft) + bt-1(rmt-1 - rft-1) + stSMBt + st-1SMBt-1 + vtVMGt + vt-1VMGt-1 + ept a bt bt-1 st st-1 vt vt-1 R2
adj
Panel A: Sensitivity of intercepts to expanding the number of factors
(1) Jan 73-Sept 01 -0.32 1.40 63.1% (-1.17) (24.25) (2) Jan 73-Sept 01 -0.47 1.39 0.34 66.6% (-1.82) (25.22) (6.08) (3) Jan 73-Sept 01 -0.21 1.11 1.16 -0.23 86.1% (-1.23) (27.01) (22.16) (-3.76) (4) Jan 73-Sept 01 -0.20 1.10 0.11 1.13 0.10 -0.22 -0.15 87.5% (-1.22) (28.12) (2.85) (22.07) (2.01) (-3.80) (-2.50)
Panel B: Sensitivity of the intercepts to different sample periods
(5) Jan 73-Dec 89 -0.15 1.02 1.33 -0.17 89.7% (-0.83) (23.83) (20.20) (-2.36) (6) Jan 90-Dec 99 -0.14 1.11 1.23 -0.17 91.3% (-0.77) (20.79) (18.88) (-2.24) (7) Jan 90-Dec 00 -0.48 1.17 0.96 -0.25 88.2% (-2.01) (17.39) (13.80) (-2.76) (8) Jan 00-Sept 01 0.62 1.45 0.60 -0.68 75.9% (0.29) (3.13) (1.59) (-2.24)

32
The intercepts reported in Table 5 are measures of abnormal performance. An intercept
of –0.32 is minus 32 basis points per month, or about –4% per year. Row 1 reports the results of
a simple one-factor regression, with the market excess return as the explanatory variable. Row 2
reports the results of a regression that includes a lagged market return. The lagged beta is
significantly positive, and the summed beta is 1.73, indicating that IPOs have a high level of
systematic risk. This accords with the common sense notion that IPOs tend to be risky stocks.
The row 2 intercept is –47 basis points per month, suggesting that the row 1 intercept is
underestimated due to the underestimation of systematic risk when the lagged effect is ignored.
Row 3 of Table 5 reports regression results with the three traditional Fama-French (1993)
regressors, and row 4 adds the lagged Fama-French factors. The intercepts in rows 3 and 4
return to a value of about –2.5% per year. As Brav and Gompers (1997) note, Fama-French 3-
factor regressions tend to have negative intercepts for portfolios of small growth firms, whether
or not the portfolio is composed of IPOs. Brav and Gompers show that a large fraction of IPOs
fall in the extreme small growth firm category, so this is an important concern. In our Table 5,
we have excluded most of the smallest firms by screening out IPOs with an offer price below
$5.00 per share. There is another bias in multi-factor regressions, as normally implemented.
Loughran and Ritter (2000) point out that the right-hand side variables, the Fama-French factor
returns, are partly composed of the returns on IPOs.14 This “factor contamination” biases the
intercept towards zero. Table 6 of Loughran and Ritter (2000) reports that the effect of this bias
is 18 basis points per month during 1973-1996.
Rows 5 through 8 split the sample into different time periods. The underperformance in
the 1990-1999 period is virtually identical to that in the 1973-1989 period, a statistically
insignificant –14 or –15 basis points per month. The estimates, however, are very sensitive to
the ending date. While the internet bubble was inflating in the late 1990s, post-IPO returns were
exceptionally good. If the sample is extended by just one year, from December 1999 to
December 2000, the intercept of –14 basis points for 1990-1999 changes to –48 basis points for
1990-2000.
14 Because IPOs tend to be small growth stocks, a small firm portfolio will have more IPOs than a large firm portfolio, especially after periods of heavy issuing volume. Similarly, a portfolio of value stocks will have fewer IPOs than a portfolio of growth stocks. Thus, SMB will have a low return and VMG will have a high return following heavy IPO issuance if IPOs underperform.
33
Perhaps even more remarkable are the following 21 months, the period from January
2000 to September 2001. It shows how methodology matters in a most startling fashion. The
(unreported) monthly average arithmetic return on our equal-weighted portfolio of IPOs from the
past three years is –355 basis points per month (whereas the CRSP value weighted index
produced an equivalent return of –151 basis points per month). The internet bubble collapsed
and the majority of 1998-2000 IPOs fell below their offer price, or went outright bankrupt. Yet,
row 8 shows a positive intercept of 62 basis points per month! The reason is that the regression
attributes the collapse to the negative market returns and concurrent collapse of technology
stocks, which is reflected in positive realizations on VMG.
This evidence suggests two areas of caution: First, one must be careful comparing papers
which attribute a weakening or disappearance of the IPO effect to novel measurement
techniques; instead, the sample period may be responsible for some of the conclusions. Second,
unless one is comfortable to conclude that the internet IPOs with –400 basis points per month
returns offered investors positive risk-adjusted returns, one should be wary of considering the
Fama-French factors to be equilibrium risk factors and using them as controls. When using
either a multifactor model or matching firms to examine abnormal performance, these tests
should be regarded as testing “similarity to certain public firms,” rather than as tests of IPO
mispricing.
Furthermore, long-run returns, even if remarkably low, are sufficiently noisy to make any
statistical inference difficult. For example, in Brav (2000), it can require an abnormal return of –
40% (depending upon specification) to reject the hypothesis that those long-run buy-and-hold
returns are not underperforming. After controlling for the poor performance of book/market and
size-matched non-IPO firms, “similarity” between IPO and non-IPO firms can no longer be
rejected for some sample periods. Eckbo and Norli (2001) use size and liquidity matching, and
find that similar publicly traded firms also performed poorly.15
Because the asset-pricing literature itself has failed to provide an accepted model of risk-
adjusted performance against which one can measure post-IPO performance (and it is even
15 Barber and Lyon (1996), Barber and Lyon (1997) and Lyon, Barber and Tsai (1999) consider various statistics used in the literature, and propose some good intuitive measures of long-run performance. Teoh, Welch, and Wong (1998) suggest a Fama-MacBeth type procedure. The Loughran and Ritter (2000) and Schultz (2001) papers discuss the influence of weighting schemes.

34
unclear whether the Fama-French factors are risk factors or evidence of market inefficiency), it
still remains unclear how abnormally poor post-IPO performance is. Nevertheless, it is clear that
IPOs and firms with characteristics similar to IPOs had rather unappealing performance at a
time when the overall stock market performed exceptionally well. It is not in dispute that
equally weighted post-IPO returns have been low relative to broad market indices since Nasdaq
came on line. For instance, if an investor had put an equal amount of money at the first CRSP-
reported closing price into each of the 7,396 IPOs (using the same inclusion criteria as in our
Table 1) from January 1970 to September 2000, and rebalanced the portfolio annually in event
time, during the five years after going public, the average annual geometric return would have
been 10.6%, according to Ritter (2002, Table 10). But if one had just invested in the S&P 500 at
the beginning of January 1970, over the next 31 years an investor would have earned a
compound annual return of 12.9% per year.
Out of sample evidence has confirmed long-run IPO underperformance in many other
countries and in the years after its original description (Ritter (1991), Loughran and Ritter
(1995)). However, Gompers and Lerner (2001) find that IPOs in the 1935-1972 did not
underperform.
B. Sources of Long-run Underperformance
We know of only two semi-rational explanations for the long-run underperformance of
IPOs. Miller (1977) assumes that there are constraints on shorting IPOs, and that investors have
heterogeneous expectations regarding the valuation of a firm. The most optimistic investors buy
the IPO. Over time, as the variance of opinions decreases, the marginal investor’s valuation will
converge towards the mean valuation, and its price will fall. This argument works better when
the float is small and not too many investors are required. This is consistent with the drop in
share price at the end of the lockup period (when more public shares become available to the
public), as documented by Bradley, Jordan, Roten, and Yi (2001), Field and Hanka (2001), and
Brav and Gompers (2001). Bradley et al show that the negative effect is much more pronounced
for venture capital-backed IPOs. Typically with these IPOs, the VCs distribute shares to their
limited partners on the lockup expiration date, and many limited partners immediate sell. This
shows up not only in negative returns, but exceptionally high volume.
Schultz (2001) offers a second explanation: he argues that more IPOs follow successful

35
IPOs. Thus, the last large group of IPOs would underperform and be a relatively large fraction
of the sample. Although this is a logical argument, it cannot predict underperformance when
each time period is weighted equally, as is done in Table 5.
Other papers are less ambitious, and simply attempt to find variables that result in cross-
sectional predictability. Jain and Kini (1994) and Mikkelson, Partch, and Shah (1997) document
that long-run return performance is also accompanied by poor financial accounting performance
post-IPO relative to pre-IPO performance and/or industry conditions. So, what drives this long-
run underperformance and can it be predicted?
Heaton (2001) argues that managers tend to be overoptimistic, and thus prone to
overinvestment if the funds are available. Teoh, Welch, and Wong (1998) attribute some of the
poor post-IPO stock performance to “optimistic” accounting early in the life of the firm. It is not
surprising that firms are eager to look good when they conduct their IPO, and that the market has
difficulties to disentangle carefully hidden warning signals. This suggests that at least a part of
the poor long-run performance is due to a market that is unduly optimistic and unable to properly
forecast tougher times ahead. Similarly, Purnanandam and Swaminathan (2001) find that IPOs
that are priced high relative to public market comparables tend to perform worse in the long run,
even though they show higher IPO initial returns. Both papers point towards overconfidence,
perhaps by both entrepreneurs (Bernardo and Welch (2001)) and investors (Daniel, Hirshleifer,
and Subramanyam (1998)).
There have been some other less successful attempts to correlate IPO long-run
performance to pre-IPO characteristics. Brav and Gompers (1997) find few differences across
different IPO underwriters. Similarly, there is no reliable relationship between short-run IPO
underpricing and long-run performance, although this evidence is sensitive to whether penny-
stock IPOs are included or not. These IPOs, which were common before the 1990s, frequently
had high first-day returns and exceptionally low long-run returns. Many of these issues involved
stock price manipulation. For samples excluding penny stock IPOs, whether there is a reversal
of the highest first-day returns in the long run depends mostly on whether the internet bubble
period is included in the sample. Almost all of the IPOs from 1999-2000 with large first-day
returns have subsequently collapsed. Since most of these were internet related, the number of
independent observations is limited.

36
Surprisingly, we could find very little academic evidence relating clientele information to
long-run performance. There is no published study about how IPO first-day share allocations (or
even institutional holdings [cite laura!]) influence long-run performance. There is not even a
published study of how post-IPO insider trading affects long-run performance. Although there
are problems with the data (such as exchange funds, which de-facto allow insiders to swap out
their holdings without requiring formal disclosure), these problems have not prevented insider
trading data from being used in other contexts.
The recent bubble has made it amply clear that even if there is systematic long-run
underperformance, it is difficult or impossible to exploit in a reliable manner. Many short sellers
lost a great deal of money on internet bubble IPOs, and had to close out their shorts before they
would have paid off. Still, we hope to see further work to tell us which subsamples are
particularly prone to poor post-IPO performance, both in the United States and in other countries.
VI. Conclusions
This paper has focused on four areas of current research on IPOs: reasons for going
public, underpricing, share allocations, and long-run performance.
There are myriad theoretical reasons for firms wanting to go public, but only sparse
evidence due to a general lack of data on the pool of private firms. Still, the evidence of large
variation in the number of IPOs suggests that market conditions are the most important factor in
the decision to go public. The stage of the firm in its life cycle seems to be the second important
factor.
The underpricing of IPOs has been a topic of theoretical investigations for decades.
Recently, this topic has enjoyed a resurgence of activity, motivated by the astonishingly high
first-day returns on IPOs during the internet bubble. We argue that theories based on asymmetric
information are unlikely to explain average first-day returns of 65 percent. Even if there was
substantial uncertainty about the demand for a given IPO, the bundling of multiple IPOs could
lower the uncertainty driving IPO underpricing in information models if issuers and underwriters
were trying to reduce it. Thus, we believe that future explanations will need to concentrate on
agency conflicts and IPO share allocation issues on one hand and behavioral explanations on the
other hand. A particular challenge for such theories will be to explain the dramatic variations in

37
the magnitude of average IPO underpricing over the last few decades, and not just that variation
is present, but why it could reach levels of 100% and more for some but not other IPOs.
The allocation of shares by underwriters is perhaps the most active area of current IPO
research. Share allocation has an impact on many topics, including theories of underpricing,
post-issue ownership structure, and underwriter compensation. To date, empirical research has
been limited due to the lack of micro-level data on share allocations in the U.S. As this data
becomes available, we expect that it will be able to shed light on many questions.
Post-IPO performance may be the most controversial area of IPO research, with some
researchers lining up behind an efficient markets point of view and others lining up behind a
behavioral point of view. Although we tend to favor the behavioral point of view, our main
perspective is that caution is advisable. First, the results are sensitive not only to methodology,
but also to the exact time-period chosen. Depending on whether and how one includes 1999,
2000, and 2001, one can come to rather different conclusions. Second, Fama-French multifactor
regressions can produce very odd results. They indicate that the period during which the internet
bubble collapsed were great years for recent IPOs, even though an equally weighted portfolio of
recent IPOs lost on average 400 basis points per month.

38
References
Aggarwal, Rajesh, Laurie Krigman, and Kent Womack, 2001, Strategic IPO underpricing, information momentum, and lockup expiration selling, Journal of Financial Economics, forthcoming. Aggarwal, Reena, 2000, Stabilization activities by underwriters after initial public offerings, Journal of Finance 55, 1075-1103. Aggarwal, Reena, 2002, Allocation of initial public offerings and flipping activity, Journal of Financial Economics, forthcoming. Aggarwal, Reena, and Patrick Conway, 2000, Price discovery in initial public offerings and the role of the lead underwriter, Journal of Finance 55, 2093-2922. Aggarwal, Reena, N. Prabhala, and Manju Puri, 2002, Institutional allocation in initial public offerings: Empirical evidence, Journal of Finance 57, forthcoming. Akerlof, George, 1970, The market for lemons: Quality and the market mechanism, Quarterly Journal of Economics 84, 488-500. Allen, Franklin and Gerald R. Faulhaber, 1989, Signaling by underpricing in the IPO market, Journal of Financial Economics 23, 303-324. Amihud, Yakov, Shmuel Hauser and Amir Kirsh. 2001 Allocations, adverse selection and cascades in IPOs: Evidence from Israel, working paper. Malcolm Baker, and Jeff Wurgler, 2000, The equity share in new issues and aggregate stock returns, The Journal of Finance 55, 2219-2257. Barber, Brad M. and John D. Lyon, 1996, Detecting abnormal operating performance: The empirical power and specification of test statistics, Journal of Financial Economics 41, 359-399. Barber, Brad M. and John D. Lyon, 1997, Detecting long-run abnormal stock returns: The empirical power and specification of test statistics, Journal of Financial Economics 43, 341-372. Baron, David P., 1982, A model of the demand for investment banking advising and distribution services for new issues, Journal of Finance 37, 955-976. Beatty, Randolph P. and Jay R. Ritter, 1986, Investment banking, reputation, and the underpricing of initial public offerings, Journal of Financial Economics 15, 213-232. Beatty, Randolph P. and Ivo Welch, 1996, Issuer expenses and legal liability in initial public offerings, Journal of Law and Economics 39, 545-602.
39
Benveniste, Lawrence M., and Walid Y. Busaba, 1997, Bookbuilding vs. fixed price: An analysis of competing strategies for marketing IPOs, Journal of Financial and Quantitative Analysis 32, 383-403. Benveniste, Lawrence M., Walid Y. Busaba and William J. Wilhelm, Jr., 1996, Price stabilization as a bonding mechanism in new equity issues, Journal of Financial Economics 42, 223-256. Benveniste, Lawrence M. and Paul A. Spindt, 1989, How investment bankers determine the offer price and allocation of new issues, Journal of Financial Economics 24, 343-362. Benveniste, Lawrence M. and William J. Wilhelm, 1990, A comparative analysis of IPO proceeds under alternative regulatory environments, Journal of Financial Economics 28, 173-208. Benveniste, Lawrence M., Sina M. Erdal, and William J. Wilhelm, Jr., 1998, Who benefits from secondary market price stabilization of IPOs, Journal of Banking and Finance 22, 741-767. Bernardo, Antonio E., and Ivo Welch, 2001, On the evolution of overconfidence and entrepreneurs, Journal of Economics and Management Strategy 10, 301-330. Biais, Bruno, and Anne Marie Faugeron, 2001, IPO auctions: English, Dutch, …French and internet, Journal of Financial Intermediation, forthcoming. Black, Bernard S., and Ronald J. Gilson, 1998, Venture capital and the structure of capital markets: Banks versus stock markets, Journal of Financial Economics 47, 243-277. Boehmer, Ekkehart, and P. Raymond Fishe, 2001, Equilibrium rationing in initial public offerings of equity, unpublished University of Miami working paper. Booth, James R. and Lena Chua, 1996, Ownership dispersion, costly information, and IPO underpricing, Journal of Financial Economics 41, 291-310. Bradley, Daniel, and Brad Jordan, 2002, Partial adjustment to public information and IPO underpricing, Journal of Financial and Quantitative Analysis forthcoming. Bradley, Daniel, Brad Jordan, and Jay R. Ritter, 2001, The quiet period goes out with a bang, unpublished University of Kentucky working paper. Bradley, Daniel, Brad Jordan, I. Roten, and H. Yi, 2001, Venture capital and IPO lockup expirations: An empirical analysis, Journal of Financial Research forthcoming. Brau, James C., Bill Francis, and Ninon Kohers, 2002, The choice of IPO versus takeover: Empirical evidence. Journal of Business, forthcoming.

40
Brav, Alon, 2000, Inference in long-horizon event studies: A Bayesian approach with applications to initial public offerings, Journal of Finance 55, 1979-2016. Brav, Alon and Paul A. Gompers, 1997, Myth or reality? The long-run underperformance of initial public offerings: Evidence from venture and nonventure capital-backed companies, Journal of Finance 52, 1791-1821. Brav, Alon and Paul A. Gompers, 2001, Insider trading subsequent to initial public offerings: Evidence from expirations of lockup provisions, unpublished Duke University working paper. Brennan, Michael J. and J. Franks, 1997, Underpricing, ownership and control in initial public offerings of equity securities in the UK, Journal of Financial Economics 45, 391-413. Carter, Richard B., Frederick H. Dark and Alan K. Singh, 1998, Underwriter reputation, initial returns, and the long-run performance of IPO stocks, Journal of Finance 53, 285-311. Carter, Richard and Steven Manaster, 1990, Initial public offerings and underwriter reputation, Journal of Finance 45, 1045-1067. Chemmanur, Thomas J., 1993, The pricing of initial public offers: A dynamic model with information production, Journal of Finance 48, 285-304. Chemmanur, Thomas J. and Paolo Fulghieri, 1999, A theory of the going-public decision, Review of Financial Studies 12, 249-279. Choe, Hyuk, Ronald Masulis, and Vikram Nanda, 1993, Common stock offerings across the business cycle: Theory and evidence, Journal of Empirical Finance 1, 3-31. Chowdhry, Bhagwan and Vikram Nanda, 1996, Stabilization, syndication, and pricing of IPOs, Journal of Financial and Quantitative Analysis 31, 25-42. Cooney, John W., Ajai K. Singh, Richard B. Carter, and Frederick H. Dark, 2001, IPO initial returns and underwriter reputation: Has the inverse relationship flipped in the 1900s? unpublished University of Kentucky, Case Western Reserve, and Iowa State working paper. Cornelli, Francesca, and David Goldreich, 2001, Bookbuilding and strategic allocation, Journal of Finance, 2337-2369. Cornelli, Francesca, and David Goldreich, 2002, Bookbuilding: How informative is the order book? Unpublished London Business School working paper. Daniel, Kent, David Hirshleifer and A. Subrahmanyam, 1998, Investor Psychology and Security Market Under- and Over-reactions, Journal of Finance 53, 1839-1886. Drake, Philip D. and Michael R. Vetsuypens, 1993, IPO underpricing and insurance against legal liability, Financial Management 22, 64-73.

41
DuCharme, Larry L., Shivaram Rajgopal, and Stephan E. Sefcik, 2001, Why was internet underpricing so severe?, unpublished University of Washington working paper. Dunbar, Craig G., 2000, Factors affecting investment bank initial public offering market share. Journal of Financial Economics 55, 3-41. Eckbo, Espen, and Orvind Norli, 2001, Leverage, liquidity, and long-run IPO returns. unpublished Dartmouth working paper. Ellis, Katrina, Roni Michaely, and Maureen O’Hara, 2000, When the underwriter is the market maker: An examination of trading in the IPO aftermarket, Journal of Finance 55, 1039-1074. Ellis, Katrina, Roni Michaely, and Maureen O’Hara, 2002, The making of a dealer market: From entry to equilibrium in the trading of Nasdaq stocks, Journal of Finance 57, forthcoming. Fama, Eugene F., and Kenneth French, 1993, Common risk factors in the returns on bonds and stocks, Journal of Financial Economics 33, 3-56. Field, Laura C., 1997, Is institutional investment in initial public offerings related to the long-run performance of these firms? Unpublished Penn State working paper. Field, Laura C., and Gordon Hanka, 2001, The expiration of IPO share lockups Journal of Finance 56, 471-500. Field, Laura C., and Jonathon Karpoff, 2001, Takeover defenses at IPO firms, unpublished Penn State working paper. Fishe, Raymond P. H., 2002, How stock flippers affect IPO pricing and stabilization, Journal of Financial and Quantitative Analysis, forthcoming. Foerster, Bruce, 2000, Securities industry association’s Capital Markets Handbook (2nd edition) Aspen, CO: Aspen Publishers. Gompers, Paul, and Josh Lerner, 2001, The really long-term performance of initial public offerings: The pre-Nasdaq evidence, unpublished Harvard Business School working paper. Habib, Michel, and Alexander Ljungqvist, 2001, Underpricing and entrepreneurial wealth losses in IPOs: theory and evidence, Review of Financial Studies 14, 433-458. Hanley, Kathleen Weiss, 1993, The underpricing of initial public offerings and the partial adjustment phenomenon, Journal of Financial Economics 34, 231-250. Hanley, Kathleen Weiss and William J. Wilhelm, Jr., 1995, Evidence on the strategic allocation of initial public offerings, Journal of Financial Economics 37, 239-257.

42
Heaton, J.B., 2001, Managerial optimism and corporate finance, unpublished Bartlet Beck working paper, Chicago IL). Houge, Todd, Tim Loughran, Gerry Suchanek, and Xuemin Yan, 2002, Divergence of opinion, uncertainty, and the quality of initial public offerings, Financial Management, forthcoming. Hughes, Patricia J. and Anjan V. Thakor, 1992, Litigation risk, intermediation, and the underpricing of initial public offerings, Review of Financial Studies 5, 709-742. Ibbotson, R. G., 1975, Price performance of common stock new issues, Journal of Financial Economics 2, 235-272. Jain, Bharat A. and Omesh Kini, 1994, The post-issue operating performance of IPO firms, Journal of Finance 49, 1699-1726. Jegadeesh, Narasimhan, Mark Weinstein and Ivo Welch, 1993, An empirical investigation of IPO returns and subsequent equity offerings, Journal of Financial Economics 34, 153-175. Jenkinson, Tim and Alexander Ljungqvist, 2001, Going Public: The Theory and Evidence on How Companies Raise Equity Finance (2nd edition), Oxford University Press. Kandel, S., O. Sarig and A. Wohl, 1999, The demand for stocks: An analysis of IPO auctions, Review of Financial Studies 12, 227-247. Keloharju, Matti, 1993, The winner's curse, legal liability, and the long-run price performance of initial public offerings in Finland, Journal of Financial Economics 34, 251-277. Kahneman, Daniel, and Amos Tversky, 1979, Prospect theory: An analysis of decision under risk, Econometrica 47, 263-291. Killian, Linda, Kathleen Smith, and William Smith, 2001, IPOs for Everyone, John Wiley & Sons. Kim, Moonchul and Jay R. Ritter, 1999, Valuing IPOs, Journal of Financial Economics 53, 409-437. Koh, Francis and Terry Walter, 1989, A direct test of Rock's model of the pricing of unseasoned issues, Journal of Financial Economics 23, 251-272. Krigman, L., W. Shaw, and K. Womack, 1999, The persistence of IPO mispricing and the predictive power of flipping, Journal of Finance 54, 1015-1044. Krigman, L., W. Shaw, and K. Womack, 2001, Why do firms switch underwriters? Journal of Financial Economics 60, 245-284.

43
La Porta, Rafael, Florencio Lopez-de-Silanes, Andrei Shleifer, and Robert W. Vishny, 1997, Legal determinants of external finance, Journal of Finance 52, 1131-1150. Lee, Philip J., Stephen L. Taylor and Terry S. Walter, 1999, IPO underpricing explanations: Implications from investor application and allocation schedules, Journal of Financial and Quantitative Analysis 34, 425-444. Lerner, Josh, 1994, Venture capitalists and the decision to go public, Journal of Financial Economics 35, 293-316. Ljungqvist, Alexander, and William Wilhelm, 2002, IPO allocations: Discriminatory or discretionary?, Journal of Financial Economics, forthcoming. Ljungqvist, Alexander, Vikram Nanda, and Raj Singh, 2001, Hot markets, investor sentiment, and IPO pricing, unpublished NYU working paper. Logue, Dennis E., 1973, On the pricing of unseasoned equity issues: 1965-1969, Journal of Financial and Quantitative Analysis 8, 91-103. Logue, Dennis E., Richard Rogalski, James Seward, and Lynn Foster-Johnson, 2001, What’s special about the role of underwriter reputation and market activities in IPOs? Journal of Business, forthcoming. Loughran, Tim and Jay R. Ritter, 1995, The new issues puzzle, Journal of Finance 50, 23-51. Loughran, Tim, and Jay R. Ritter, 2000, Uniformly least powerful tests of market efficiency. Journal of Financial Economics 55, 361-389. Loughran, Tim, and Jay R. Ritter, 2001, Why has IPO underpricing increased over time? unpublished University of Florida working paper. Loughran, Tim, and Jay R. Ritter, 2002, Why don’t issuers get upset about leaving money on the table in IPOs? Review of Financial Studies forthcoming. Loughran, Tim, Jay R. Ritter and Kristian Rydqvist, 1994, Initial public offerings: International insights, Pacific-Basin Finance Journal 2, 165-199. Lowry, Michelle, 2002, Why does IPO volume fluctuate? Journal of Financial Economics, forthcoming. Lowry, Michelle, and G. William Schwert, 2002, IPO market cycles: Bubbles or sequential learning? Journal of Finance, forthcoming. Lowry, Michelle, and Susan Shu, 2002, Litigation risk and IPO underpricing, Journal of Financial Economics, forthcoming.

44
Lucas, Deborah, and Robert McDonald, 1990, Equity issues and stock price dynamics, Journal of Finance, 45, 1019-1043. Lyon, John D., Brad M. Barber, and Chih-Ling Tsai, 1999, Improved methods for tests of long-run abnormal stock returns, Journal of Finance 54, 165-201. Maksimovic, Vojislav, and Pegaret Pichler, 2001, Technological innovation and initial public offerings, Review of Financial Studies 14, 459-494. Mello, Antonio, and John Parsons, 1998, Going public and the ownership structure of the firm. Journal of Financial Economics 49, 79-109 Michaely, Roni, and Wayne H. Shaw, 1994, The pricing of initial public offerings: Tests of adverse-selection and signaling theories, Review of Financial Studies 7, 279-319. Michaely, Roni, and Kent L. Womack, 1999, Conflict of interest and the credibility of underwriter analyst recommendations, Review of Financial Studies 12, 653-686. Mikkelson, Wayne H., M. Megan Partch and Kshitij Shah, 1997, Ownership and operating performance of companies that go public, Journal of Financial Economics 44, 281-307. Miller, Edward M., 1977, Risk, uncertainty, and divergence of opinion, Journal of Finance 32, 1151-1168. Muscarella, Chris J. and Michael R. Vetsuypens, 1989, A simple test of Baron's model of IPO underpricing, Journal of Financial Economics 24, 125-136. Myers, Stewart, and Nicholas Majluf, 1984, Corporate financing and investment decisions when firms have information that investors do not have, Journal of Financial Economics 13, 187-222. Nanda, Vikram and Youngkeol Yun, 1997, Reputation and financial intermediation: An empirical investigation of the impact of IPO mispricing on underwriter market value, Journal of Financial Intermediation 6, 39-63. Pagano, Marco, Fabio Panetta, and Luigi Zingales, 1998, Why do computers go public? An empirical analysis, Journal of Finance 53, 27-64. Pulliam, Susan, and Randall Smith, 2000, Linux deal is focus of IPO-commission probe, December 12, 2000 Wall Street Journal, p. C1 Pulliam, Susan, and Randall Smith, 2001, CSFB official set quota for repayment of IPO profits in form of commissions, August 10, 2001 Wall Street Journal, p. C1. Purnanandam, Amiyatosh K., and B. Swaminathan, 2001, Are IPOs underpriced? unpublished Cornell University working paper.

45
Rajan, Raghuram and Henri Servaes, 1997, Analyst following of initial public offerings, Journal of Finance 52, 507-529. Reilly, Frank K., 1973, Further evidence on short-run results for new issues investors, Journal of Financial and Quantitative Analysis 8, 83-90. Ritter, Jay R., 1991, The long run performance of initial public offerings, Journal of Finance 46, 3-27. Ritter, Jay R., 1998, Initial public offerings, Contemporary Finance Digest. Ritter, Jay R., 2002, Investment banking and securities issuance, North-Holland Handbook of the Economics of Finance edited by G. Constantinides, M. Harris, and R. Stulz. Rock, Kevin, 1986, Why new issues are underpriced, Journal of Financial Economics 15, 187-212. Rydqvist, Kristian, 1997, IPO underpricing as tax-efficient compensation, Journal of Banking and Finance 21, 295-313. Sahlman, W.A., 1990. The Structure and Governance of Venture Capital Organizations. Journal of Financial Economics 27, 473-524. Schultz, Paul, 2000, The timing of initial public offerings, unpublished University of Notre Dame working paper. Schultz, Paul, 2001, Pseudo market timing and the long-run underperformance of IPOs, unpublished University of Notre Dame working paper. Schultz, Paul, and Mir Zaman, 2001, Do the individuals closest to internet firms believe they are overvalued? Journal of Financial Economics 59, 347-381. Sherman, Ann, 2000, IPOs and long-term relationships: An advantage of bookbuilding, Review of Financial Studies 13, 697-714. Sherman, Ann, 2001, Global trends in IPO methods: Book building versus auctions, unpublished University of Notre Dame working paper. Sherman, Ann, and Sheridan Titman, 2002, Building the IPO order book: Underpricing and participation limits with costly information, Journal of Financial Economics, forthcoming. Siconolfi, Michael, 1997, Underwriters set aside IPO stock for officials of potential customers, November 12, 1997 Wall Street Journal, p. A1. Spatt, Chester and Sanjay Srivastava, 1991, Preplay communication, participation restrictions, and efficiency in initial public offerings, Review of Financial Studies 4, 709-726.

46
Stoll, Hans R., and Anthony J. Curley. 1970 Small business and the new issues market for equities. Journal of Financial and Quantitative Analysis 5, 309-322. Stoughton, Neal M., and Josef Zechner, 1998, IPO-mechanisms, monitoring and ownership structure, Journal of Financial Economics 49, 45-77. Teoh, Siew Hong, Ivo Welch and T. J. Wong, 1998, Earnings management and the long-run market performance of initial public offerings, Journal of Finance 53, 1935-1974. Tinic, Seha M., 1988, Anatomy of initial public offerings of common stock, Journal of Finance 43, 789-822. Subramanyam, A., and Sheridan Titman, 1999, The going public decision and the development of financial markets, Journal of Finance 54, 1045-1082. van Bommel, Jos, and Theo Vermaelen, 2001, Post-IPO capital expenditures and market feedback, Journal of Banking and Finance, forthcoming. Welch, Ivo, 1989, Seasoned offerings, imitation costs, and the underpricing of initial public offerings, Journal of Finance 44, 421-450. Welch, Ivo, 1992, Sequential sales, learning, and cascades, Journal of Finance 47, 695-732. Zhang, Donghang, 2001, Why do IPO underwriters allocate extra shares when they expect to buy them back? unpublished working paper, University of Florida. Zingales, Luigi, 1995, Insider ownership and the decision to go public, Review of Economic Studies 62, 425-448.