A REVIEW OF CIRCULATION AND MIXING STUDIES OF SAN ...
46
A REVIEW OF CIRCULATION AND MIXING STUDIES OF SAN FRANCISCO BAY CALIFORNIA U.S. GEOLOGICAL SURVEY CIRCULAR 1015 Prepared in cooperation with the CALIFORNIA STATE WATER RESOURCES CONTROL BOARD and the CALIFORNIA DEPARTMENT OF WATER RESOURCES
Transcript of A REVIEW OF CIRCULATION AND MIXING STUDIES OF SAN ...

A REVIEW OF CIRCULATION AND MIXING STUDIES OF
SAN FRANCISCO BAY CALIFORNIA
U.S. GEOLOGICAL SURVEY CIRCULAR 1015
Prepared in cooperation with the CALIFORNIA STATE WATER RESOURCES CONTROL BOARD and the
CALIFORNIA DEPARTMENT OF WATER RESOURCES

COVER: A computer-generated graph, created by Jon R. Burau of the U.S. Geological Survey, illustrates the shape of the bottom of San Francisco Bay. Vertical scale is exaggerated a factor of 800.

A REVIEW OF CIRCULATION AND MIXING STUDIES
OF SAN FRANCISCO BAY, CALIFORNIA
By Lawrence H. Smith
U.S. GEOLOGICAL SURVEY CIRCULAR 1015
Prepared in cooperation with the
CALIFORNIA STATE WATER RESOURCES CONTROL BOARD, and the
CALIFORNIA DEPARTMENT OF WATER RESOURCES

DEPARTMENT OF THE INTERIOR DONALD PAUL HODEL, Secretary
U.S. GEOLOGICAL SURVEY Dallas L. Peck, Director
UNITED STATES GOVERNMENT PRINTING OFFICE: 1987
Free on application to Books and Open-File Reports Section, U.S. Geological Survey, Box 25425, Building 810, Federal Center, Denver, CO 80225

CONTENTS
Abstract •••••••••••••••.••••••••••.••.••.••••••••••••••••.•••••• Introduction ••••.•••••••••••••••••••••••••••••.••••••
Purpose and contents of this report •••.•••••••••
Page 1 2 3
Ackrlowlec;Igment. • • • • • • • • • • • • • • • • • • • • • • • • • • • • • • • • • • • • • • • • • • • • • • • • • • • • • • 3 Characteristic scales of circulation and mixing for San Francisco Bay..... 4
Ocean-river mixing zone.............................................. 4 Ocean-bay exchanges. • • • • • • • • • • • • • • • • • • • • • • • • • • • • • • • • • • • • • • • • • • • • 5 River inflows • • • . • • • • • • • • • • • • • • • • • • • • • • • . • • • • • • • • • • • • • • • • . • • • • • • 6 Evaporation. • • • . • • • • • • • • • • • • • • • • • • • • • . • • • • • • • • • • • • • • • • • • • • • • • • • • 7
Exchange process between embayments.................................. 8 Processes within the embayments...................................... 9
Tide-induced net currents....................................... 9 Gravitational circulation ••••••••••.••••.••••••••••••••••.•••.•• 16 Wind-induced currents •••••••••.••••••••••••••••••••••••••••••••• 16
Circulation characteristics during low and high delta discharges •••••••••• 17 Northern reach. • • • • • • • • • • • • • • • • • • • • • • • • • • • • • • • • • • • • • • • • • • • • • • • • • • • • • • 17
The null zone................................................... 20 Gravitational circulation •••••••••••••••••••••••••••••••• Net horizontal circulation ••••••.••••••••••••••••••••••••
20 23
South Bay............................................................ 23 Net horizontal circulation •••••••••••••••••••••••••••••••••••••• 25 Gravitational circulation •••••••.•••••••••••••.••••••••••••••••• 26
Mixing of river and ocean water during low and high delta discharges •••••• 28 Northern reach. • • • • • • • . • • • • • • • • • • • • • . • • • • • • • • . • • • • • • • • • • • • • • • • • • • . • • • 28
Low delta discharges. • • • • • • • • • • • • • • . • • . • • • • • • • • • • • • • • • • • • • • • • • • • 28 High delta discharges •.•••••••.••••••••••••••.•••••••••••••••••• 31
South Bay. • • • • • • • • • • • • • • • • • • • • • • • • • • • • • • • • • • • • • • • • • • • • • • • • • . • • • • • • • • • 3 2 Low delta discharges. • • • • • • • • • • • • • • • • • • • • • • • • • • • • • • • • • • • • • • • • • • • 32 High delta discharges. • • • • • • • • • • • • • . • . • • • • • • • • • • • • • • • • • • • • • • • • • • 3 2
Summary. • • • • • • • • • • • • • • • • • • • . • • • • • • • • • • • • • • • • • • • • • • • • • • • • • • • • • • • • • • • • • • • • • • 3 4 References cited •••••••••••••••••••••••••••••••••••••••••••••••••••••••••• 35
Contents III

ILLUSTRATIONS
Figure 1. Map of the San Francisco Bay region showing the adjacent coastal ocean and a portion of the Sacramento-San Joaquin
Page
De 1 ta. . . . . . . . . . . . . . . . . . . . . . . . . . . . . . . . . . . . . . . . . . . . . . . . . . . . . . . . 4 2. Graph of means and standard deviations of net monthly
discharges of the Sacramento-San Joaquin Delta into San Francisco Bay at Chipps Island, 1956-85...................... 6
3. Illustration of net currents for an idealized cross section of San Francisco Bay......................................... 10
4. Graph of tidal elevations at the Golden Gate estimated for January 1980................................................. 11
5. Graph of the amplification of major daily (K1 ) and twicedaily (M2) tidal constituents and the time-difference of high tide within San Francisco Bay in relation to the Golden Gate. • • • • • • • • • • • • • • • • • • • • • • • • • • • • • • • • • • • • • • • • • • 12
6. Maps showing various measures of tidal currents in (a) Suisun Bay, (b) San Pablo Bay, (c) Central Bay, and {d) South Bay ••• 13
7. Illustration of idealized vertical profiles of tidal currents and the pattern of gravitational circulation........ 16
8. Graphs showing magnitudes of seaward-landward currents in San Francisco Bay................................................ 19
9. Graph of net seaward-landward currents versus depth in San Francisco Bay............................................ 21
10. Graph of net seaward-landward currents versus depth at the Golden Gate.............................................. 22
11. Map of net, depth-averaged transports in Suisun Bay estimated with a numerical model............................. 24
12. Map of net, tide-induced, depth-averaged, velocities in South Bay deduced from current measurements •••••••••••••••••• 25
13. Illustration of idealized summer and winter patterns of net currents in the channels of South Bay •••••••••••••••••••••••• 27
14. Graph of estimates of mean residence times in each embayment ••• 29 15. Graph of estimates of mean residence times in the northern
reach divided into advective and diffusive portions •••••••••• 30 16. Graph of silver concentrations in the clam Macoma balthica
in South Bay with respect to delta discharge................. 33
TABLES
Page Table 1. Major time and space scales at which circulation and mixing
factors are important........................................ 5 2. Major circulation and mixing characteristics of San Francisco
Bay. . . . . . . . . . . . . . . . . . . . . . . . . . . . . . . . . . . . . . . . . . . . . . . . . . . . . . . . . . 18
IV Contents

CONVERSION FACTORS
Conversion factors for terms used in this report are listed below:
Multiply
meter {m)
kilometer (km)
square meters (m2 )
cubic kilometers (km3)
centimeters per second (cm/s)
cubic meters per second {m3/s)
Length
3.281
.6214
Area
Volume
8.1Q7X1Q5
Flow
.03281
35.31
To Obtain
feet {ft)
mile (mi)
acres
acre-feet (acre-ft)
feet per second (ft/s)
cubic feet per second {ft3/s)
Conversion Factors V


A REVIEW OF CIRCULATION AND MIXING STUDIES
OF SAN FRANCISCO BAY, CALIFORNIA
By Lawrence H. Smith
Abstract
A description of the major characteristics and rema~n~ng unknowns of circulation and mixing in San Francisco Bay has been constructed from a review of published studies. From a broad perspective San Francisco Bay is an oceanriver mixing zone with a seaward flow equal to the sum of the river inflows less evaporation. Understanding of circulation and mixing within the bay requires quantification of freshwater inflows and ocean-bay exchanges, characterization of source-water variations, and separation of the within-bay components of circulation and mixing processes. Description of net circulation and mixing over a few days to a few months illustrates best the interactions of major components. Quantification of tidal circulation and mixing is also necessary because net circulation and mixing contain a large tide-induced component, and because tidal variations are dominant in measurements of stage, currents, and salinity.
The discharge of the ·sacramento-San Joaquin Delta into Suisun Bay is approximately 90 percent of the freshwater inflow to San Francisco Bay. Annual delta discharge is characterized by a winter season of high runoff and a summer season of low runoff. For the period 1956 to 1985 the mean of monthly discharges exceeded 1,000 cubic meters per second {35,000 cubic feet per second) for the months of December through April, whereas for July through October, it was less than 400 cubic meters per second (14,000 cubic feet per second). The months of November, May, and June commonly were transition months between these seasons. Large year-to-year deviations from this annual pattern have occurred frequently.
Much less is known about the ocean-bay exchange process. Net exchanges depend on net seaward flow in the bay, tidal amplitude, and longshore coastal currents, but exchanges have not yet been measured successfully. Source-water variations are ignored by limiting discussion of mixing to salinity.
The bay is composed of a northern reach, which is strongly influenced by delta discharge, and South Bay, a tributary estuary which responds to conditions in Central Bay. In the northern reach net circulation is characterized by the river-induced seaward. flow and a resulting gravitational circulation in the channels, and by a tide- and wind-induced net horizontal circulation. A surface layer of relatively fresh water in Central Bay generated by high delta discharges can induce gravitational circulation in South Bay. During low delta discharges South Bay has nearly the same salinity as Central Bay and is characterized by tide- and wind-induced net horizontal circulation.
Abstract 1

Several factors control the patterns of circulation and m~x~ng in San Francisco Bay. Viewing circulation and mixing over different time-periods and at different geographic scales causes the influences of different factors to be emphasized. The exchange between the bay and coastal ocean and freshwater inflows determine the year-to-year behavior of San Francisco Bay as a freshwater-saltwater mixing zone. Within the bay, exchanges between the embayments control variations over a season. Circulation and mixing patterns within the embayments and the magnitude of river-induced seaward flow influence the between-bay exchanges. The within-bay patterns are in turn determined by tides, winds, and freshwater inflows.
Because freshwater inflow is the only factor that can be managed, a major study focus is estimation of inflow-related effects. Most questions relate to the patterns of freshwater inflow necessary to protect valuable resources whose welfare is dependent on conditions in the bay. Among the important questions being addressed are:
--What quantity of freshwater inflow is necessary to prevent salt intrusion into the Sacramento-San Joaquin Delta, and what salinity distributions in the bay would result from various inflow patterns?
--What quantity of freshwater inflow is sufficient to flush pollutants through the bay?
Knowledge of circulation and mixing in the bay is necessary to address these questions.
Purpose and Contents of This Report
A number of reports (see list of references) describe in detail what is known about circulation and mixing in San Francisco Bay. The main purpose of what follows is to summarize these reports in non-technical language. Characteristic scales and influential factors are covered in the next section. Observed circulation and mixing patterns are then presented in two sections in terms of the relative importance of the physical factors for low-inflow and high-inflow conditions. Finally a summary of the major circulation and mixing features permits comment on the above questions.
Acknowledgment
In addition to the numerous U.S. - Geological Survey colleagues who have provided essential guidance and review, the author wishes to thank Richard Denton, University of California at Berkeley, and Spencer Smith, U.S. Fish and Wildlife Service (retired), for helpful reviews of the manuscript.
Introduction 3

In the northern reach a nontidal current null zone moves rapidly seaward in response to increases in delta discharge, and after runoff events returns landward over a few months. During the low-discharge period the northern reach achieves an approximate salt balance in 2 to 3 months. The mean residence time in the northern reach is a few days during high discharges and on the order of 2 to 3 months during low discharges.
In South Bay evidence suggests three distinct mixing zones, separated by San Bruno Shoal and a constriction at the San Mateo Bridge. These mixing restraints combined with relatively small local inflows cause the mean residence time to be on the order of months during the low-discharge season. When gravitational circulation penetrates these zones during high discharges, the mean residence time probably is reduced to less than a month. Initially the gravitational circulation is southward at the surface and northward at the bottom, and it reverses after runoff subsides when reintrusion of ocean water through the Golden Gate raises salinities in Central Bay.
The need to quantify important features of circulation and mixing suggests a need for additional study. Gravitational circulation, net horizontal circulation, and the salt flux in the northern reach have not been examined in detail. The exchange process between Central and South Bays has not yet been quantified. Estimation of residence time distributions, particularly the differences between channels and shallows, requires quantification of net currents in the shallows and the shallow-channel exchange. Measurements of net delta discharges and quantification of the ocean-bay exchange process are needed to address many questions.
INTRODUCTION
Population growth and industrial and agricultural development have changed the quality and quantity of fresh water entering San Francisco Bay. These changes have altered the chemical and physical environments of the bay, and are thus perceived to be responsible for observed changes in the aquatic ecosystems. Uncertainties about the cause-effect relations have led to a number of detailed studies whose goals are to define these relations.
Many of the important ecological questions are complicated by uncertainties about circulation and mixing in the bay. Circulation and mixing introduce large variability in chemical concentration and species abundance data that makes separation of effects and identification of trends problematical. Furthermore, circulation and mixing themselves have important effects on the bay's biology and chemistry. They control the movement of plankton, including larval stages of fish and benthic organisms. They also determine the rates at which pollutants are flushed seaward and ocean water is mixed landward, effectively controlling the exposure of benthic organisms to pollutants and salinity. Estimation of the relative importance of causes and effects thus requires estimation of circulation and mixing.
2 Circulation and Mixing, San Francisco Bay, California

CHARACTERISTIC SCALES OF CIRCULATION AND MIXING FOR
SAN FRANCISCO BAY
Ocean-River Mixing Zone
A broad view of San Francisco Bay is as a body of water (fig. 1) in which ocean water is mixed landward and river water is mixed seaward, with a seaward flow equal to the sum of river i nflows less evaporation. The characteristics of this mixing process are determined by the exchange process between the bay and the local coastal ocean and by the pattern of river inflows, as well as by circulation and mixing processes in the bay. Over a period of a few months these external and internal influences affect the entire bay (table 1) , whereas tides and local bathymetry dominate within the bay for periods less than a few days. Any understanding of circulation and mixing within the bay requires description of these external influences over periods of a few days to a few months.
Depth curves in meters
38° 00'
37° 30'
0
0 20 Mi
South San Francisco
Bay
FIGURE 1.--Map of the San Francisco Bay region showing the adjacent coastal ocean and a portion of the Sacramento-San Joaquin Delta. Locations of place names mentioned in the text are shown. Depth contours shown are in meters.
4 Circulation and Mixing, San Francisco Bay, California

Factor
Ocean-Bay exchange
Freshwater inflow
Tides and wind
TABLE I.--Major time and space scales at which circulation and mixing factors are important
Period of influence
A few months A few weeks
A few months A few weeks
A few days
A few months A few weeks A few days
Geographic extent of influence
Whole Bay Central Bay and northern South Bay
Whole Bay Whole Bay during high inflows Northern reach during low inflows Channels of northern reach during high inflows Suisun Bay during low inflows
Whole Bay Adjacent embayments Within each embayment
Ocean-Bay Exchanges
The factors that control ocean-bay exchanges through the Golden Gate include:
the tidal prism, which is the tide-induced fraction of the water that passes through the Golden Gate between low and high tide;
the river-induced seaward flow, which is the net amount of water leaving the bay;
density differences between the bay and local coastal ocean and wind, which influence the vertical structure of currents in the Golden Gate;
circulation and mixing in the bay, which exchange bay water for ocean water near the Golden Gate; and
circulation and mixing in the local coastal ocean.
Exchange of any dissolved substances besides ocean salt would depend also on their concentration variations in the coastal ocean and other sources to the bay. In this report only salinity will be considered. The one attempt to measure exchange through the Golden Gate (Parker and others, 1972) was inconclusive because of inadequate data.
Some discussion of the first four factors above is in following sections. Conomos and others (1985) summarized what is known about processes in the local coastal ocean. Wind conditions along the Pacific coast determine the circulation patterns in the Gulf of the Farallones. During summer the prevailing northwest winds induce the southward-flowing California current that generates an upwelling of water in the gulf, and makes it available for exchange with the waters of the bay over the sandy bar (fig. 1) separating the bay from the gulf. During winter, when winds are more variable and often from the south or southeast, upwelling ceases, and exchanges of only near-surface water occur with the bay.
Scales of Circulation and Mixing 5
River Inflows
In contrast, much more is known about freshwater inflow to the bay, especially if consideration of dissolved substances is restricted to ocean salt. The Sacramento-San Joaquin Delta contributes about 90 percent of the freshwater inflow, the other 10 percent consisting of runoff from local streams, most of which are negligible during the summer (Conomos and others, 1985}. The freshwater discharge of the delta (hereafter called delta discharge) is highly seasonal and is characterized by large winter inflows from Pacific storms and small, relatively steady inflows during the dry summers (fig. 2). Means of monthly delta discharges for the period 1956 to 1985 indicate that delta discharge commonly exceeded 1,000 m3 /s (35,000 ft 3 /s) during the months of December through April, whereas for July through October it was less than 400 m3 /s (about 14,000 ft 3 /s}. May, June, and November were usually transition months. The large standard deviations (fig. 2} reflect both the addition of upstream storage during this period and significant year-to-year variability.
2000 70.,000
u 1800 c ~
0 lJ u
rMean c
Q) 1600 0
(J) 0 rstandard deviation ID
L (/) Q) 1400 - .......... o..._ -+->
ID (J) ID L 1200 - <+-Q)
~ High 0 Q) _..) E 1000 35.,000 __Q
:J u 0 _ _)
__Q 800 1-:J Transition ID u rn
600 r- L 0
Q) .L. m 0 L 400 14.,000 (/) 0
_c Low _..)
u 0 (J) 200 1-
I~ In ~ _ _)
0
0 OCT NOV DEC JAN FEB MAR APR MAY JUN JUL AUG SEP
Monlh of waler !:)ear
FIGURE 2.--Means and standard deviations of net monthly discharges of the Sacramento-San Joaquin Delta into San Francisco Bay at Chipps Island, 1956-85 from estimates of the State of California (1986). Also shown are arbitrary divisions of the months into high (>1,000 m3 /s [35,000 ft 3 /s]), transition (400-1,000 m3 /s [14,000-35,000 ftl/s]), and low (<400 m3 /s [14,000 ftl/s]) delta discharges.
6 .Circulation and Mixing, San Francisco Bay, California

The flood and drought extremes illustrate the variability of the seasonal pattern. Although ocean water usually represents a significant fraction of the water in the bay, fresh water on the surface flowed out the Golden Gate continuously for nearly 2 weeks during the colossal flood of 1862 {Young, 1929), and freshwater fish were present in the bay for months afterward {Thomas, 1978). Peterson and others (1985) estimated that river inflows to the bay of at least 120,000 m3 /s (4 million ft 3 /s) would have been necessary to overcome the tides at the Golden Gate during this period.
In contrast, although ocean salt usually penetrates landward no farther than Suisun Bay, it intruded inland as far as Courtland on the Sacramento River and Stockton on the San Joaquin River during the extreme drought of 1929-31. During the summer of 1931, river inflows to the delta were persistently less than 15 m3 /s (500 ft 3 /s) and were effectively zero during a 2-week period {State of California, 1932). It is likely that delta discharge was effectively zero for significant periods during this drought.
Since then, the addition of a number of reservoirs and diversion structures has changed the freshwater discharge of the delta. Although no reasonable amount of storage can overcome extreme floods and droughts, the additions of upstream storage have had a significant influence on delta discharges {Williams and Fishbain, 1987) • A principal effect has been to delay discharge from winter and spring until summer and autumn, permitting consumption of 40 percent and export of an additional 24 percent of the historical annual freshwater discharge of 34 km 3 (27 .6 million acre-ft) {Nichols and others, 1986) • Summer flows are maintained now by reservoir releases whose purposes are to supply users and to suppress salinity intrusion into the delta (Conomos and others, 1985). Upstream storage has also reduced the discharge peaks of winter storms (Williams and Vorster, 1987).
Despite the attention that responsible agencies have focused on estimating delta discharges, questions remain about discharge quantities during the irrigation season. The present method for estimating daily delta discharges {State of California, 1986) involves uncertain assumptions about consumptive use in the delta and traveltime of water through the delta. Measurement of discharges into Suisun Bay is an alternative, but a practical method has yet to be found that is accurate enough to determine net discharges during low-discharge conditions (Smith, 1969).
Evaporation
Evaporation has a relatively minor effect on the water balance of San Francisco Bay as a whole. On an annual basis, net evaporation (actual evaporation minus precipitation) accounts for less than 7 percent of an average annual delta discharge of 12 km 3 (10 million acre-ft), assuming an annual evaporation of 0.73 m {2.4 ft) (Selleck and others, 1966) over a surface area of 1.1x1o 9 m2
(270,000 acres) (Conomos, 1979). Seasonal variations, however, are significant, and net evaporation can nearly equal delta discharges during summers of dry years. Net evaporation during July accounts for a loss of about 90 m3 /s (3,200 ft 3 /s), assuming 0.19 m {0.6 ft) evaporation {Selleck and others, 1966) over the same surface area. The effects of evaporation will be ignored in the remainder of this report, and the delta discharge effects described can be assumed to be for delta discharges in excess of evaporation.
Scales of Circulation and Mixing 7

Exchange Process Between Embayments
A rudimentary description of circulation and m1x1ng within the bay is as an exchange process between embayments. The embayments and their connecting straits form a network that splits from Central Bay into two branches, South Bay and a northern reach composed of San Pablo and Suisun Bays. Significant quantities of fresh water flow only into the northern reach, principally into Suisun Bay.
At this level of detail the exchange process between the embayments can be represented by the volumes of water passing between embayments during ebb and flood tides, and net fractions of these volumes that are exchanged between the embayments. The volumes can be estimated from delta discharges and tidal prisms. The net fractions, called exchange ratios, can be estimated by using differences between mean salinities of connected embayments (Dyer, 1973). Denton and Hunt (1986) described a tidal prism model which views the bay in this fashion. They estimated exchange ratios between the connected embayments by adjusting the ratios until predicted salinities fell within the ranges of salinity observations from current-meter deployments during 1979-80 (Cheng and Gartner, 1984).
A feature of their model analogy is that it permits estimation of mean residence times for each embayment. The definition of mean residence time depends on the way in which it is estimated. Their method was to estimate the time necessary to exchange the water in an embayment with water from the ocean. Over a period sufficiently long for the rate of salt introduction to equal the rate at which fresh water exits an embayment, their exchange time is equivalent to a mean residence time.
An alternative way of estimating mean residence time for an estuary is the fraction of fresh water method, as employed for San Francisco Bay by Walters and others (1985) • This method assumes that the residence time of interest is that of a substance introduced in freshwater inflow. Mean residence time is calculated as the time necessary for freshwater inflow to replace the fraction of water in the estuary that is fresh water, the fraction being determined by the estuary's mean salinity (Dyer, 1973). An upper bound on residence time is the hydraulic residence time, the time required for freshwater inflow to replace the entire volume of the estuary.
Denton and Hunt (1986) pointed out that a shortcoming of their model is that m1x1ng of all water within each embayment is assumed to be complete within one tidal cycle. Because this assumption is poor, particularly when freshwater inflow over a tidal cycle is a small fraction of the embayment volume, their exchange ratios are unlikely to be accurate over the wide range of conditions that occur in San Francisco Bay. Therefore, as they concluded, quantification of the processes within each embayment is desirable.
8 Circulation and Mixing, San Francisco Bay, California

Processes Within the Embayments
Glenne (1966) used an advection-diffusion analogy to construct a net transport model of San Francisco Bay. He divided San Francisco Bay into 31 channel segments and used salinity and silica data to adjust a diffusion parameter for each segment. His advection-diffusion analogy assumes that net transport of dissolved substances can be represented by a combination of what is carried (net advected) seaward by the river flow and what is mixed seaward and landward (diffused) by the combination of all other processes. A central assumption of the analogy is that the diffusive process is proportional to the differences in mean concentrations in the landward-seaward direction, the proportionality parameter being determined from means of concentration (salinity and silica) data. Glenne used the analogy to estimate residence times for the northern reach of San Francisco Bay in a fashion analogous to the fraction of freshwater method.
Glenne concluded that the diffusion parameters could not be assumed to be constant in the northern reach, and that their variations could not be accurately predicted over the range of delta discharges. Net currents induced by tides, wind, and density differences in the bay, which were incorporated into Glenne's diffusion parameters, play a dominant role in circulation and mixing in the bay. These net currents are illustrated at a hypothetical embayment cross section in figure 3. Significant variations in these net currents make representation of their effects in terms of net landward-seaward diffusion unrealistic, and thus their effects need to be considered explicitly.
Tide-Induced Net Currents
In figure 3b tide-induced currents are shown as horizontal net currents averaged over one or more tidal cycles and over vertical sections of a cross section. These currents contribute to net exchanges between the shallows and channels as well as to landward-seaward currents because they do not point exactly in the landward-seaward direction. Estimating net tide-induced currents requires accurate estimates of tidal currents because the net currents are a small fraction of the tidal currents. The following discussion describes some important characteristics of tides and tidal currents in San Francisco Bay.
Figure 4 shows variations of water levels at the Golden Gate that can be attributed to tidal influences of the Moon and Sun on Earth's oceans (Cheng and Gartner, 1984). Tides are complex waves hundreds of kilometers (or miles) long that are a composite of many discrete frequencies which cluster around one cycle per 12 hours and one cycle per 24 hours. For San Francisco Bay the combination of frequencies leads to two high tides and two low tides each 24 hours and SO minutes. The slight differences in frequencies lead to periods during each month when the frequency components reinforce each other, producing a large tidal range (spring tides), and periods when they cancel each other, producing a smaller tidal range (neap tides) (fig. 4). Similar regular variations of the spring-neap variations occur over even longer periods.
Scales of Circulation and Mixing 9

a
b
Low salinity
FIGURE 3.--Net currents for an idealized cross section of San Francisco Bay: (a) cross-sectional mean currents induced by delta discharge; (b) depth (water column) averages at locations within the cross section induced by a combination of tides and wind; (c) depth-variable currents in the channels induced by landward-seaward salinity differences (gravitational circulation) and wind. The directions of the arrows in (a) are perpendicular, in (b) are not perpendicular, and in (c) are approximately perpendicular, to the cross section.
10 Circulation and Mixing, San Francisco Bay, California

+1
Neap
-1
Spring FIELD DATA
01
s2 o~~~~~~~~m#~~~~~~~~~~~~~~~~N2
QHrl+r~+H~~~H+~~~~~+H4+~~~+H~~~~~~ p1
o~~~~~~~~~~~~NY~~~~~~~~~AN~K2
o~~~~~~~~~~~~~~~~~~~~~~~~a1
v2
I I I I
10 20 30
JANUARY 1 -31, 1980 (DAYS)
FIGURE 4.--Tidal elevations at the Golden Gate estimated for January 1980 (modified from figure I.lla of Cheng and Gartner, 1984) showing two highs and two lows each day, two periods of small tidal amplitudes around the lOth and the 24th (neap tides), and three periods of large tidal amplitudes around the 1st, 18th, and 30th (spring tides). Below the elevations are shown the contribution of the major tidal constituents. Those constituents with subscript 2 have twicedaily frequences, and those with subscript 1 have once-daily frequencies.
Scales of Circulation and Mixing 11

Tide waves move landward at a rate that is determined primarily by the depth of the water and the frictional resistance exerted by the bay bottom. The waves move more quickly through the channels, spreading into the shallows and partially reflecting off the shorelines. High water at the Golden Gate takes 1 to 1.5 hours to reach the southern end of South Bay and 3 to 3.5 hours to reach Chipps Island (fig. 5) (Walters and others, 1985}. The combination of effects in the northern reach reduces the tidal range at the Golden Gate by about 30 percent, whereas in South Bay wave reinforcment from reflection of the tide wave overshadows other effects, amplifying the tidal range by up to 60 percent (fig. 5} (Walters and others, 1985}.
The importance of tides to circulation and mixing in the bay results from the currents that the tides induce. Tidal currents usually are the dominant feature of observed currents in the bay, and this dominant influence on circulation and mixing in San Francisco Bay has resulted in modeling studies of tidal currents and tide-induced net currents in various embayments {Walters and Cheng, 1979; Cheng and Casulli, 1982; Smith and Cheng, 1987} based on field data (Cheng and Gartner, 1984}.
i (J
<ll Cl '0 ·;:::: co
<ll Cl '0 ·;:::: co 0 ~ ro
:2:
'0 0 c -o ~ '0 CIJ
c.. ~<ll~
c ~!ilu; ro
;_;;<.9= (/)
roc<ll <ll(l)Cl '-'0 c f--o<t
<.9
1.4 .-----'-:------------------------, '+- Q)
0-o c ::J 1.2 0 .~
·.;:::::; a.. ~ E 1.0 ~<(
O..-cu E ~ 0.8 <(I-
0.6
0 3 Q) ~ u £: c e .....
2 2 Q) ......
M2 '+- Ctl
0 s Q) £:
E .~ :r: I-
0 60
~2 ' ' --K,
I
/ I
I
/
/
/
/ /
/
/ /
/ /
/ /
/ /
___ Location of / / /
/
-------Golden Gate // ------,, t ////
20 0 20 40 60 80 100
Distance (km)
6
4 K,
2
0
FIGURE 5.--Amplification of major daily (K1) and twice-daily (M2 ) tidal constituents and the timedifference of high tide within San Francisco Bay in relation to the Golden Gate (modified from figure 4 of Walters and others, 1985).
12 Circulation and Mixing, San Francisco Bay, California

The reflection of the tide wave in South Bay causes the maximum currents in South Bay to occur at mid-tide and slack water (zero current) to occur near tide extremes (high or low) , whereas in the northern reach maximum currents in the channels occur just before extremes and slack water occurs 1 to 2 hours after extremes. An important result of this difference is that South Bay begins flooding while San Pablo Bay is still ebbing (Disney and Overshiner, 1925), making it possible for South Bay to receive some water from the northern reach.
Tidal currents are stronger by a factor of 2 to 3 during spring tides than during neap tides as a result of the greater tidal range (Cheng and Gartner, 1984). A major consequence of this difference is more intense vertical mixing and reduced vertical stratification during spring tides, (Cloern, 1984). Tidal currents are stronger in the channels [more than 100 cm/s (3 ft/s)] and weaker in the shallows [less than 20 cm/s (0. 7 ft/s)] (fig. 6), and tend to parallel the contours of the bay bottom (Cheng and Gartner, 1984). Slack water occurs earlier in the shallows than in the channels nearby (Cheng and Gartner, 1984). These current assymetries enhance exchanges of water parcels between the shallows and channels during the tidal cycle. The net shallow-channel exchange contributes significantly to the landward mixing of ocean water and enhances the seaward mixing of river water (Fischer and Dudley, 1975).
0 5km
0 5 mi
Current meter station
____. 100 CM/S
a
38°~------------~--------------~--------------~------------~------~ 10' 05' 122°00' 55' 50'
FIGURE G.--Various measures of tidal currents from current-meter data in (a) Suisun Bay, (b) San Pablo Bay, (c) Central Bay, and (d) South Bay, show that tidal currents are parallel to bathymetric contours, and are larger in deeper parts of the bay than in the shallows (figure 11.5, 111.5, 1V.5, and V.5 from Cheng and Gartner, 1984). Tidal current measures for each location include spring (constituent reinforcement), neap (constituent cancellation), M2 (principal constituents), and RMS (root-mean-square, overall average) tidal currents.
Scales of Circulation and Mixing 13

FIGURE G.--Various measures of tidal currents from current-meter data in (a) SUisun Bay, (b) San Pablo Bay, (c) Central Bay, and (d) South Bay--Continued.
14 Circulation and Mixing, San Francisco Bay, California

0
0 I
5 Kilometers I
5 Miles
SPRING- NEAP
RENT METER>""' RMS
STATION -------y M2~
.____. 100 CM/S
d
FIGURE G.--Various measures of tidal currents from current-meter data in (a) SUisun Bay, (b) San Pablo Bay, (c) Central Bay, and (d) South Bay--Continued.
Scales of Circulation and Mixing 15

Gravitational Circulation
In addition to inducing net seaward flow, freshwater inflows induce a net current pattern in the channels called gravitational circulation (fig. 3c}. By gravitational circulation is meant a pattern of flow that in the mean is landward at the bay bottom and seaward at the water surface. It results from a significant difference in salinities in the landward-seaward direction, which enlarges ebb currents near the surface and flood currents near the bottom, and reduces ebb currents near the bottom and flood currents near the surface (fig. 7}. The net result is a mean current that is seaward at the surface and landward at the bottom, and that is usually a small fraction of the tidal currents. Enhanced vertical mixing during spring tides weakens gravitational circulation in San Francisco Bay (Walters and others, 1985}.
The magnitude of inflows determines how far landward the gravitational circulation mechanism penetrates. The most landward zone of gravitational circulation (fig. 7}, where bottom ebb and flood velocities are approximately equal, is called the non-tidal current null zone (Peterson and others, 1975}, and has been shown to accumulate high concentrations of plankton (Arthur and Ball, 1979).
Wind-Induced Currents
Wind-induced currents contribute to circulation and mixing in two major ways. First, the strong winds that occur daily during the summer and during the passage of winter storms have a pronounced effect in the shallows on resuspension of sediments and mixing of shallow water masses (Conomos and others, 1985}. Second, persistent winds drive surface currents and compensatory counter-currents deep in the channels (Walters, 1982; Walters and others, 1985; Cheng and Gartner, 1985). These two effects are superimposed on the tide-induced currents and on gravitational circulation.
Water surface a --.,-,.------.--
b Ocean
Ebb currents
+
---
Flood currents
Zone of gravitational circulation
Net currents
,,·::o•' , ..
River
• • • • -J •• ~ • '
,•','
FIGURE 7 .--(a) Idealized vertical profiles of tidal currents showing the effect of horizontal salinity differences (dashed profiles without salinity differences) that lead to a net current that is seaward at the surface and landward at the bottom (gravitational circulation), and (b) a landward-seaward section of an idealized estuary channel showing the spatial pattern of gravitational circulation and the nontidal current null zone.
16 Circulation and Mixing, San Francisco Bay, California

CIRCULATION CHARACTERISTICS DURING LOW AND HIGH
DELTA DISCHARGES
The circulation and m1x1ng characteristics of the northern reach differ from those of South Bay because South Bay receives relatively little freshwater inflow. These characteristics vary seasonally primarily in response to seasonal variations in delta discharge. Table 2 summarizes the major circulation and mixing characteristics of the northern reach and South Bay for low and high delta discharges, and the following sections describe these characteristics from this perspective.
Northern Reach
Within the northern embayments circulation is characterized by gravi tational circulation in the deeper channels (Peterson and others, 1975) on which is superimposed a tide- and wind-induced horizontal net circulation, including an exchange process between the channels and the shallows (Walters and others, 19S5) (table 2). Current measurements demonstrate that these characteristics dominate over the delta discharge-induced seaward flow except for short periods during large runoff events (fig. Sa). That some currents are landward (negative magnitudes in fig. Sa) suggests the presence of gravitational circulation.
The points joined by lines in figure Sa are net seaward currents induced by delta discharge (as defined in figure 3a and estimated by dividing delta discharge by cross-sectional areas in the embayments) for discharges of 400, 1,000, and 2,500 m3 /s (14,000, 35,000, and SS,OOO ft 3 /s). Embayment crosssectional areas were computed using the method of J .R. Burau and R.T. Cheng (U.S. Geological Survey, written commun., 19S7). The rest of the points in figure Sa represent means of at least 14 days of current-meter data (Cheng and Gartner, 19S4) at locations in or adjacent to the channel where the water column is at least 5 m (16 ft) deep. The landward-seaward direction was taken to be the principal direction of the tidal currents at each location as reported by Cheng and Gartner (19S4).
The large range of currents at most locations (vertical spread of points in figure S) reflects the combined effects of variations of meter depth, delta discharge, wind, and tides. The apparent lack of differences between measurements during low and high discharges reflects the relatively long averaging period as well as the sparseness of data for high discharges. With these qualifications, net seaward-landward currents in the northern embayments seem to vary between 30 cm/s (1 ft/s) seaward and 30 cm/s (1 ft/s) landward, and are most often less than 15 cm/s {0.5 ft/s).
Circulation Characteristics 17

I-' co
(") ..... 11 0 c ....... Ill rt ..... 0 ::s Ill ::s 0..
3: ..... >< 1-'· ::s
I.Q " C/)
Ill ::s l'1j 11 Ill ::s 0 1-'· m 0 0
txl
~ " (") Ill ....... 1-'· HI 0 11 ::s 1-'· Ill
NORTHERN REACH
Circulation:
Null zone:
Mixing:
SOUTH BAY
Circulation:
Mixing:
TABLE 2.--Major circulation and mixing characteristics of San Francisco Bay
Low delta discharge (less than 400 m3 /s)
Gravitational circulation in channels (Peterson and others, 1975; Walters and Gartner, 1985; Walters and others, 1985).
Tide- and wind-induced net horizontal circulation (Walters and others, 1985; Smith and Cheng, 1987).
Suisun Bay and landward (Peterson and others, 1975). Approximate salt balance in late summer (Winkler,
1985).
Mean residence times of 2 to 3 months affected by a combination of delta discharge and mixing (Glenne, 1966; Walters and others, 1985; Denton and Hunt, 1986).
Tide- and wind-induced net horizontal circulation (Walters, 1982; Cheng and Casulli, 1982; Walters and others, 1985; Cheng and Gartner, 1985).
Three mixing zones separated by San Bruno Shoal and constriction at the San Mateo Bridge (Powell and others, 1986).
Mean residence times of a few months affected by mixing and exchanges with Central Bay (Walters and others, 1985; Denton and Hunt, 1986).
High delta discharge (greater than 1,000 m3 /s)
Intense gravitational circulation seaward of null zone, and river-like flow landward of null zone (Peterson and others, 1975; Walters and others, 1985).
Carquinez Strait and seaward (Peterson and others, 1975). Rapid seaward movement in channel during runoff events,
slow landward movement afterward (Imberqer and others, 1977).
Mean residence times less than 2 weeks controlled by delta discharge (Glenne, 1966; Walters and others, 1985; Denton and Hunt, 1986).
Gravitational circulation in channel, initially southward at surface and northward at bottom, and vice-versa later (McCulloch and others, 1970; Conomos, 1979; Walters and others, 1985) •
Intrusion of fresh water southward dependent upon magnitude of runoff event (Imberger and others, 1977; Conomos, 1979) and vertical mixing (Cloern, 1984).
Mean residence times of a few weeks affected by exchanges with Central Bay and mixing (Walters and others, 1985; Denton and Hunt, 1986).

30.0
a Cf) • Cf)
......... 20.0 '-.. E _,_) () • 4--• • Cf)
0 • • Cf) _,_)
10.0 _,_)
c • 0 g~ c
Q) I Q)
L • L L
I L
:J 0 :J () ()
0.0 0 --o 0 0 --o L • I
0 0 0 L
0 • @ 0 0 3 • ~ I 0 3
--o I 0 • 0 --o c -10.0 0 c 0 I 0
_) 0 _)
I • • I --o i --o L L 0 " 0 3 -20.0 • 0 Low deLla dl._scharges 3 0 0 Q) • Hl._gh deLla dl._scharges Q)
Ul I Ul
-30.0 -1 0.0 10.0 20.0 30.0 40.0 50.0 60.0 70.0 80.0
Dl-slance Landward from ba_4 entrance (kmJ
0 20 40
Ol._slance Landward from ba_4 entrance (ml._)
10.0
b .3
Cf) 7.5 Cf) ......... ......... E _,_) () • 4--
5.0 0
§ 0
Cf) 0
• ' 0 Cf) _,_) _,_) c g 0
0 c Q) 2.5 • 0 • • Q) L 0 io • 0 L L 0 • •100 m3/sl
~ L
:J 8 i :J ()
' '$ • ()
0.0 ' ' T T Uo ~ 0 ., ' ,. u ljl 0 --o 0 0 0
• 20 m3/sJ 0 --o
L • 0 • I L 0
0 • • 0 3 0 • • 3 --o -2-.5 0 0 • • --o • c • 0 • c 0 0 • • 0
_) _)
I -5.0 I --o --o L • L 0 • 0 3 0 Low deLla dl_schorges • 3 0 -7.5 0 Q) • Hl_gh deLla dl_schorges Q)
Ul Ul -.3
-10.0 10.0 15.0 20.0 25.0 30.0 35.0 40.0 45.0 50.0 55.0 60.0
DLslance Landward from ba_4 entrance (km)
10 20 30
0Lslance Landward from ba_4 entrance (mL)
FIGURE B.--Magnitudes of seaward-landward currents in San Francisco Bay (a) the northern reach, and (b) South Bay with respect to distance landward from the bay entrance. Positive currents indicate seaward flow and negative currents landward flow. Points connected by lines are estimates of the cross-sectionally averaged net seaward currents (calculated using the method of J.R. Burau and R.T. Cheng, U.S. Geological Survey, written commun., 1987) induced by the indicated delta discharges for the northern reach, and by local freshwater inflow for South Bay. Net currents deduced from measurements averaged over at least 15 days (Cheng and Gartner, 1984) at points in these cross sections are plotted for delta discharges less than 400 m3 /s (14,000 ft3 /s) (open circles), and delta discharges greater than 400 m3 /s (14,000 ft 3 /s) (solid circles).
Circulation Characteristics 19
The Null Zone
Knowing the location of the null zone in the northern reach is important because it is the transition zone between gravitational circulation and riverlike net flow (fig. 7) • During low-discharge conditions the null zone is located in Suisun Bay and landward, whereas during high-discharge conditions it is located in Carquinez Strait and seaward (Peterson and others, 1975) • The null zone moves seaward rapidly in response to significant discharge events (Imberger and others, 1977) • Imberger and others (1977) concluded that the response time is shorter than the period of a discharge event, and that the magnitude of the peak discharge is more important than the total volume of the event in determining how far seaward the null zone moves. As delta discharge declines, the reintrusion of ocean water into the northern reach is much slower (Winkler, 19S5), and the null zone moves landward over a period of months. The total volume of fresh water in the northern reach and tides and wind determine what combination of gravitational circulation and net horizontal circulation restores salinities and the null zone to prior conditions.
Imberger and others (1977) presented evidence that the null zone was landward of the Benicia Bridge during a discharge of about S50 m3 Is ( 30,000 ft 3/s) after a peak of about 1,400 m3/s (51,000 ft 3/s) 15 days earlier. They also showed a null zone in the middle of Carquinez Strait for a rising discharge of 2,900 m3/s (102,000 ft3/s) after a peak of 6,600 m3/s (233,000 ft 3/s) 21 days earlier. Conomos and others (19S5) showed evidence of a null zone near the west end of Carquinez Strait at a discharge of 2,400 m3/s (S5,000 ft 3/s) after a peak of 9,600 m3/s (339,000 ft 3/s) 25 days earlier. Peterson and others {1975) presented evidence that the null zone was near Point San Pablo for a discharge at its peak of 5,300 m3/s (1S6,000 ft 3/s). (The discharge that they attributed to the event was 2,300 m3/s, which was based on a monthly average.)
Landward of the null zone net currents are seaward throughout the water column and increase approximately in proportion to increasing discharges. Net currents induced by delta discharge are 5 to 10 cm/s (0.2 to 0.3 ft/s) in Suisun Bay and Carquinez Strait at about 1,000 m3/s {35,000 ft 3/s), in San Pablo Bay at about 2,500 m3/s {SS,OOO ft3/s) (fig. Sa), and in Central Bay at about 5,000 m3/s (177,000 ft3/s).
Gravitational Circulation
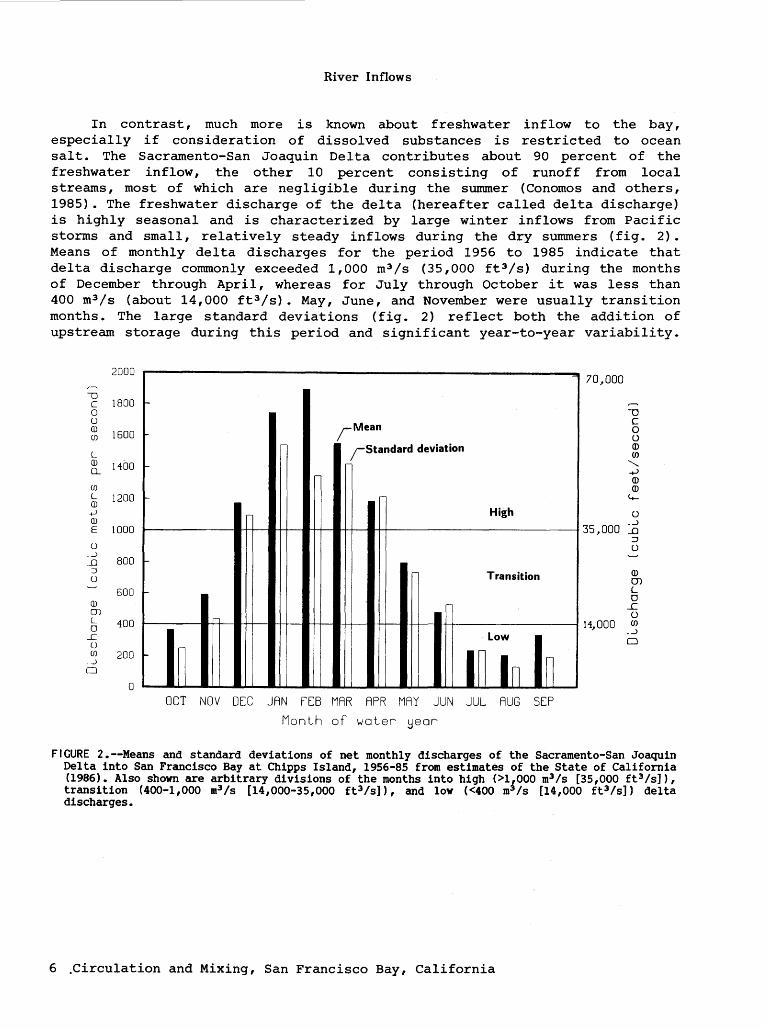
Seaward of the null zone gravitational circulation is a dominant circulation feature (fig. 9a). The points in figure 9a are the means of current-meter measurements from figure Sa that have been replotted with respect to depth to exhibit seaward flow near the surface and landward flow near the bottom. The distinctness of this pattern for the wide variety of locations and wind and tide conditions over which these data were collected underscores the persistence of gravitational circulation in the northern reach.
20 Circulation and Mixing, San Francisco Bay, California

0.0 0 • 0 0~ ~~.,0 • 0 •o• II> 8 cmo~ ~<t a
• 0 • o oof.je • • • oo • ec 'i .. oe o . ·~ -20.0 .f-- oo o!&:
• ~
E • • - 100 4--
3: • 3: __] 40.0 I- __]
__] __]
:L - :L
3 • 3 0 • • 0 0 0
__) __)
Q) Q) _o 60.0 f-- - 200 _o
_c _c ~ ~ Q__ Q__
Q) Q)
0 - 0
80.0 1-
0 Low deLta dl-scharge~ Hl-gh • • = deLta dl-schargEs Q) 0 0 •• 300 -
100.0 I I
30.0 20.0 10.0 0.0 -10.0 -20.0 -30.0
Seaward-Landward currents lcm/sl
~. 0 0.0 -1.0
Seaward-Landward currents lft/s)
0.0 0
b (I) 0
• 5.0
0
0 0
00 J> 8 ~
E 0 25 4--
3: 0 3: __] 10.0 0 0
__]
__] 00
0 __]
:L 0 :L 0 Sgo~ 0
3 0 0 0 3 0 0
__) __)
Q) 15.0
0 Q)
_o 0 50 _o 8 OOO[f>
_c _c ~ ~
Q__ • Q__
Q) O· Q)
0 s 0 0 8 0 0
20.0
0 = Northern reach 0 00(1)0
•= South Bay 75
25.0 25.0 20.0 15.0 10.0 5.0 0.0 -5.0 -10.0 -15.0
Seaward-Landward currents lcm/sl
Cl.75 0.50 0.25 0.0 -0.25
Seaward-Landward currents lft/sl
FIGURE ~.--Net seaward-landward currents in San Francisco Bay from figure 8 deduced from measurements (Cheng and Gartner, 1984) plotted with respect to depth below mean lower low water (MLLW) show that gravitational circulation (seaward flow near the surface and landward flow near the bottom) is persistent in the northern reach (a), but not clearly evident in South Bay (b). Positive currents are seaward and negative currents landward.
Circulation Characteristics 21
The strength of gravitational circulation varies over the spring-neap cycle, being small during spring tides and larger during neap tides (Walters and others, 1985). For low discharges and smaller than average tides in Suisun Bay, Peterson and others (1975) estimated that net landward currents at the bottom were less than 5 cm/s (0.2 ft/s) in the channel near Port Chicago and indistinguishable from measurement errors (less than about 3 cm/s (0.1 ft/s)) near Chipps Island. Walters and others (1985) reported about 10 cm/s (0.3 ft/s) in upper and eastern Suisun Bay from an analysis of data (Cheng and Gartner, 1984). The measurement accuracies of the current meters and the variability of gravitational circulation suggest that these numbers be used only qualitatively.
For San Pablo Bay Peterson and others (1975) estimated a landward net current near the bottom of about 5 cm/s (0.2 ft/s) in the channel at Point San Pablo for a discharge of about 300 m3/s (10,600 ft 3/s), whereas Walters and others (1985) estimated from more recent data about 15 cm/s (0.5 ft/s). Evidence suggests that Pinole Shoal interrupts gravitational circulation and contributes to the shallow-channel exchange (Walters and others, 1985).
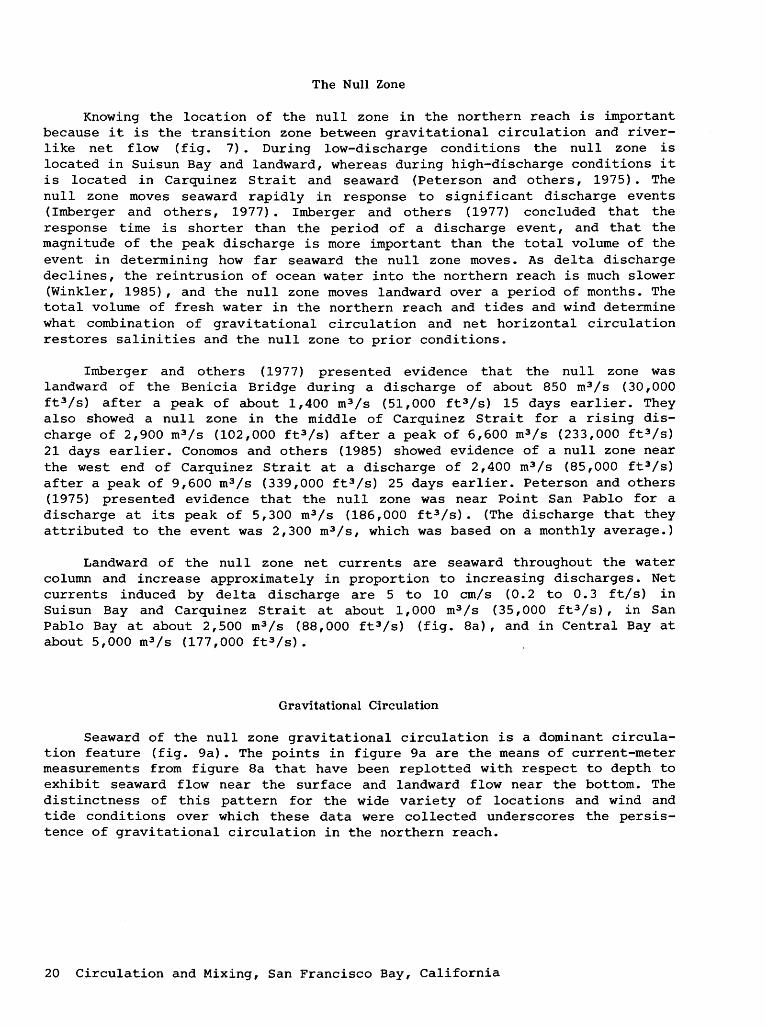
Gravitational circulation in Central Bay is probably even stronger, and increases with increasing delta discharge as indicated by net currents at the Golden Gate (fig. 10). The effect of higher delta discharges can be seen in enlarged seaward currents near the surface and landward currents near the bottom. More detailed analysis would be necessary to separate the influences of tides and wind from these several-week averages, but the trend is clear.
0.0 0
• • 0 o - Low della di.. scharges • • ooo
• - Hi..gh della di..scharges
20.0 0 0 00(D0
• ~ ~ E <+-- 100
3: 3: __J 10.0 f- __J __J __J L: L: -3 • 0
3 0 • ~ (j) 0
__) __)
Q) 60.0
Q) _o 1- - 200 _o
_c _c ~ ~ ()_ ()_ Q) Q)
0 - 0 80.0 f-
• Oo 0 0 •• - 300
100.0 I I I I I
lO.O 5.0 0.0 -5.0 -10.0 -15.0 -20.0 -25.0 -30.0
Seaward-Landward currents (cm/sl
0.25 0.0 -0.25 -0.50 -0.75
Seaward-Landward currents (ft/sl
FIGURE 10.--Net seaward-landward currents at the Golden Gate from figure 8 deduced from measurements (Cheng and Gartner, 1984) with respect to depth below mean lower low water (MLLW) indicate that increases in delta discharge magnify gravitational circulation (seaward currents near the surface and landward currents near the bottom) in Central Bay. Currents are divided into those for delta discharges less than (open circles) and greater than (solid circles) 400 m3 /s (14,000 ft3 /s). Positive currents are seaward and negative currents landward.
22 Circulation and Mixing, San Francisco Bay, California

Net Horizontal Circulation
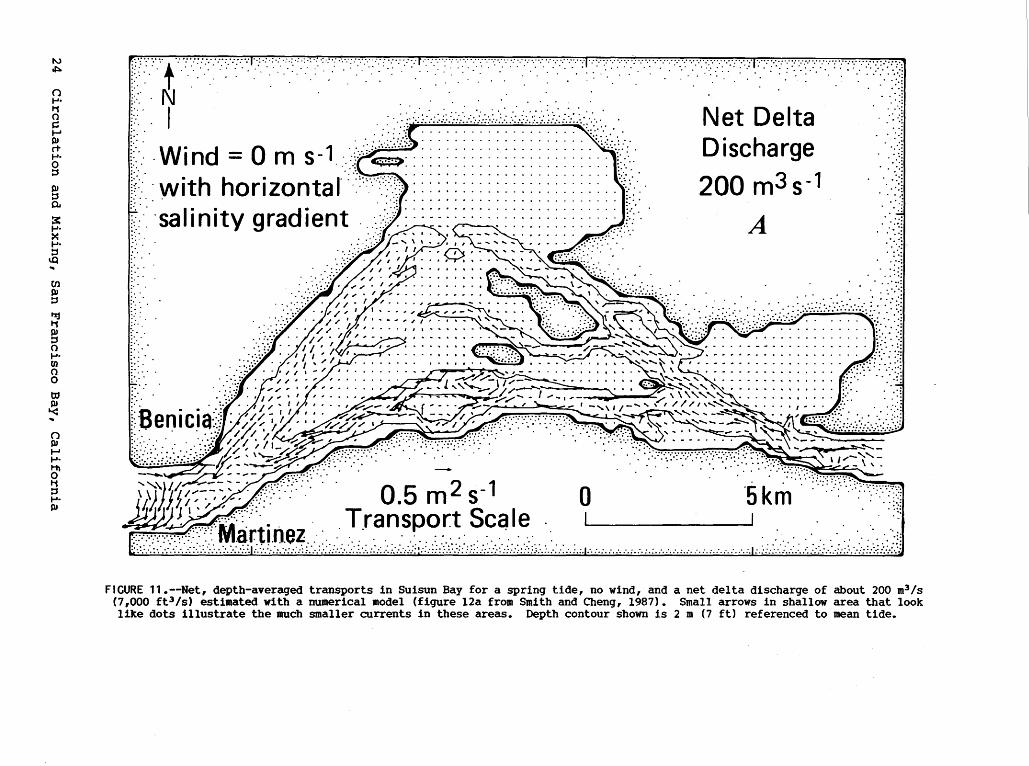
In Suisun Bay tides interacting with the web of channels produces a complicated net horizontal circulation during low delta discharges. Smith and Cheng {1987) used a numerical model calibrated and validated with current meter data for low delta discharge conditions {November, 1979 and 1980) to estimate net horizontal flow patterns for spring tides {fig. 11). Because their model was not calibrated for net currents these net patterns are speculative, particularly in the shallows, where there were no calibration data. Walters and Gartner {1985) speculated from an analysis of current measurements at four locations that the net tide-induced circulation pattern in the channels is a counterclockwise gyre, that is, landward in the main channel and seaward in the northern channels.
In San Pablo Bay the shape of the bay bottom combined with a net seaward flow suggests a net clockwise gyre in the large shallow area north and west of the channel, but this has not yet been confirmed (Walters and others, 1985). Evidence of wind effects on water levels and the overall shallowness of San Pablo Bay suggest that wind may have a significant effect on net circulation {Walters and Gartner, 1985).
Less is known about Central Bay than about San Pablo Bay. Horizontal circulation is complicated because of the irregular shape of the bay, the influences of the coastal ocean, and the different responses of the northern reach and South Bay to the tides. Further analysis is necessary before the effects of tides and wind on net horizontal circulation and the shallow-channel exchange in the northern reach can be quantified.
South Bay
Because South Bay usually has negligible freshwater inflow, it usually has a relatively constant salinity, and the salinity differences that drive gravitational circulation are absent. Under these conditions circulation in South Bay is controlled by tides and wind {table 2) • Gravitational circulation in South Bay is limited to episodes of large freshwater inflows into the northern reach that reduce surface salinities in Central Bay, which induce gravitational exchanges with South Bay {McCulloch and others, 1970).
The minute local freshwater inflow usually makes a negligible contribution to the range of observed currents (fig. 8b). During summer months evaporation can exceed local freshwater inflows. The unconnected points in figure 8b represent means of at least 14 days of data {Cheng and Gartner, 1984) at locations in or adjacent to the channel where the water column is at least 7 m (23 ft) deep. As is true for the northern reach the range of net currents (vertical spread of points in fig. 8b) reflects the combined effects of meter depth, wind, and tides. Additional variability results from the gravitational circulation during large runoff events. The net seaward-landward currents in South Bay are smaller than in the northern reach, usually being 5 cm/s (0.2 ft/s) or less averaged over these periods. Differences in net currents between low and high delta discharges are not apparent for such long averaging periods.
Circulation Characteristics 23
~ ~
() I-'• 11 0 s:: ...... PI rt 1-'· 0 ::s g 0.
3: 1-'· >< 1-'· ::s
\.Q
(/)
PI ::s l'%j 11 PI ::s 0 1-'· m 0 0
t:n PI '< ._
() PI ...... 1-'· l""h 0 11 ::s 1-'· PI
[r'·:·· ,~· .. , ·:· ~ ·::·. ,. ,_. 7"·:':.2.:-: ·.' ' "·.· ... · .•• : .. · . . . .... ·. . . . :1 :·: '. ::·:·:· ···: . ::: •·.' ·:·:. :·: : 0:· ,,. "'':: , .•. ,! :' ::·:' :: :·: .. =-·: .. :'::·=:·:··~<-~!
, I . ~/-. W. d - 0 -1 . ;. ,:·J:;_;_._;)C' ,_..' :'-~-',_,~,::'·::-~:: ,/;_ ,:;,::::::;.:;. >:: ;_:,-.:.::-\.\:=".;_;-, . ~ ~s: ~ae :gt: -:. i:(:ll . ·. 1n - m s .. · ~·-······················· ·. . ·· l/ ·with horizontal::,\, .. ;;_;:;.,,::::::::::::::::::::::::: \/· · 200 m3 s -1 · · . .-:-;:: r: ·salinity gradient·. ·_j_;f:: :::::::::::::::::: ·:.:. ·J;._;·. A ... ; (-· ·.·::· ~-~····· ·····~:· ..
··. · ....
:..: .• :~
.>~ .. ···=
.. · .. · .. ;-.o;: :_.:,:~·:.:.":-:J:·=-·::.:-:.·•,~::::Jk;::~~ ::.
:·.
.··
.. · .·
0 ·5km .!;' .. ·.
: .:· .. -.. :-. .: .... -.. : .· • .-: .:::· .: ........... :.: :.· :: .. : .. :.; .:::.-:·.:.=
FIGURE 11.--Net, depth-averaged transports in Suisun Bay for a spring tide, no wind, and a net delta discharge of about 200 m3 /s (7,000 ft3 /s) estimated with a numerical model (figure 12a from Smith and Cheng, 1987). Small arrows in shallow area that look like dots illustrate the much smaller currents in these areas. Depth contour shown is 2 m (7 ft) referenced to mean tide.

Net Horizontal Circulation
From analyses of current data by Walters {1982) and Cheng and Gartner {1985) for summer wind conditions and low delta discharges, Walters and others {1985) concluded that net currents in northern South Bay (north of San Bruno Shoal) are southward along the eastern side and northward along the western side {fig. 12). In addition net currents appear to be eastward over San Bruno Shoal and northward in the channel north of the San Mateo Bridge {fig. 12). Evidence that the area between San Bruno Shoal and the San Mateo Bridge is a separate mixing zone from the area south of the bridge {Powell and others, 1986) allows speculation that there may be a large clockwise gyre between the shoal and bridge. Numerical model estimates of net circulation patterns in this area exhibit such gyres (Cheng and Casulli, 1982). Walters and others (1985) concluded that net currents south of the San Mateo Bridge appear to be smaller than can be measured accurately with mechanical current meters except in the channel. For this reason, and because problems introduced by wind-generated waves prevented deployments in the shallows, they concluded that significant uncertainties remain about net current patterns in the shallows.
• Residual current from data
.. Ill Inferred from continuity
0 5 10km
South Bay
15'
FIGURE 12.--Net, tide-induced, depth-averaged, velocities in South Bay deduced from current measurements (figure 9 from Walters and others, 1985).
Circulation Characteristics 25
Gravitational Circulation
During low delta discharges, salinities in Central and South Bays are approximately equal (fig. 13a). Large delta discharges reduce surface salinities in Central Bay below those in South Bay, however, and this difference creates a gravitational circulation process in at least the northern part of South Bay (McCulloch and others, 1970). Unlike the northern reach the surface flow is initially landward (southward) and the bottom flow is seaward (fig. 13b). After runoff has subsided, reintrusion of ocean water raises salinities in Central Bay above those in South Bay, and the direction of gravitational circulation reverses (fig. 13c).
The strength and landward extent of the gravitational circulation is proportional to the magnitude of the salinity differences and inversely proportional to the degree of vertical mixing in South Bay (Walters and others, 1985). Net gravitational currents up to 15 cm/s (0.5 ft/s) have been estimated from data during neap tides, whereas increased vertical mixing during spring tides reduces the net currents to a few cm/s (0 .1 ft/s or less) (Walters and others, 1985). San Bruno Shoal appears to be an effective block to landward penetration of gravitational circulation for a range of delta discharges up to about 1,000 m3/s (35,000 ft 3/s) (Imberger and others, 1977). For delta discharges well above 1,000 m3/s (35,000 ft3/s} Imberger and others (1977) concluded that most of South Bay showed significant stratification. They also pointed out that subsequent delta discharge events do not depress South Bay salinities much further, an expected result of smaller horizontal salinity differences between Central and South Bays.
The absence of the distinct pattern of gravitational circulation in averages of current measurements in South Bay over more than 14 days (fig. 9b} suggests that the penetration of fresh water into South Bay is a rapid event. Imberger and others (1977} concluded that for large discharge events most of South Bay becomes stratified within a few days of the arrival of fresh water in Central Bay. The return of South Bay to prior salinities occurs over a longer period that is dependent on how long Central Bay takes to return to high salinities (Walters and others, 1985). During this period, there is evidence that sometimes net flows can be landward at the surface and bottom and seaward at intermediate depths (Walters and others, 1985). In exceptionally wet winters local inflows from Coyote Creek and the Guadalupe River may create gravitational circulation in the extreme south end of South Bay (Walters and others, 1985) •
26 Circulation and Mixing, San Francisco Bay, California

BEFORE RUNOFF
a
Northern reach
b
c
Water surface
High salinity
Medium salinity
...,_ High salinity
~ Medium salinity
<:;==:~ Low salinity
FIGURE 13.--Idealized summer (a) and winter (b and c) patterns of landward-seaward net currents in the channels of South Bay (McCulloch and others, 1970). During summer the lack of a salinity difference between Central and South Bays leads to oscillatory net currents (a). During winter, when large delta discharges lower the salinities of Central Bay below those of South Bay, gravitational exchanges between the two embayments are induced (b). After runoff events, when the ocean-bay exchange elevates the salinities of Central Bay above those of South Bay 1 the direction of gravitational exchange is reversed (c).
Circulation Characteristics 27

MIXING OF RIVER AND OCEAN WATER DURING LOW AND
HIGH DELTA DISCHARGES
Knowledge of circulation characteristics provides a necessary foundation for understanding mixing in San Francisco Bay. Mixing is determined by the path that a water mass takes and by its coming ling with other water masses along that path. Direct measurements of mixing in the bay are rare because they require following specific parcels of water, and thus involve technically difficult and labor-intensive tasks. Instead, most mixing characteristics of the bay have been inferred from observations of salinity distributions. In general, much less is known about mixing than about circulation in San Francisco Bay (Walters and others, 1985}.
Perhaps the simplest mixing characteristic of an embayment is its mean residence time. Estimates of mean residence times for delta discharges near 100, 1,000, and 10,000 m3/s (3,500, 35,000, and 350,000 ft 3/s} of Denton and Hunt (1986}, Walters and others (1985), and Glenne (1966) are illustrated in figure 14 for individual embayments. The results of other studies suggest limitations to the utility of these mean residence time estimates of whole embayments.
Northern Reach
Low Delta Discharges
The large salinity differences between Suisun, San Pablo, and Central Bays during low-discharge conditions permit estimation of exchange ratios, freshwater fractions, and diffusive transport fractions, so that Denton and Hunt (1986}, Walters and others (1985}, and Glenne (1966} calculate similar residence times within the degree of approximation expected (fig. 14a}. For delta discharges near 100 m3 /s (3, 500 ft3 /s) the estimates are 28 to 35 days in Suisun Bay and 20 to 25 days in San Pablo Bay. Glenne' s slightly different estimates can be attributed partly to a different, more sparse data set.
Delta discharge (advection) and diffusive processes (gravitational circulation and net horizontal circulation) both appear to be important determinants of mean residence times (fig. 15). Glenne estimated that the mean residence time that results from delta discharge only, about 60 and 170 days in Suisun and San Pablo Bays, respectively, is reduced in both embayments significantly by all other mixing processes, to about 30 and 20 days (fig. 15). Walters and others estimated slightly different reductions, 45 to 35 days in Suisun Bay, and 84 to 25 days in San Pablo Bay, but the trends are similar.
28 Circulation and Mixing, San Francisco Bay, California

42.0 - a 0 ~ Sui..sun Bay lDent.on and Hunt. J tt- Sui..sun Bay (WaLters and ot.hersl EB- Sui..sun Bay (GLenna) D- San PabLo Bay CDent.on and Hunt.) II- San PabLo Bay (WaLters and others)
~ ~ EB- San PabLo Ba~ (GLenna) 35.0
28.0 f- EB
II
f- E8 D 21.0
14.0 ... (f) :::T) D 0
-o 7.0
0
- EB Q)
E _...)
+> Q) 0.0
EB
I I I I I. I I i ()
c Q)
180.0 -o -b _...)
(f) Q)
L
0- South Bay (Denton and Hunt.) .. tt- South Bay (WaLters and others)
c 150.0 -0 Q)
L:
120.0 -
90.0 ~
60.0 f-
30.0 f- 0
0 .. 0.0 I I I
102 103 104
DeLta dLscharge (cubLc meters/second)
3,500 35,000 350,000 DeLta dLscharge (cubLc feet/second)
FIGURE 14.--Estimates of mean residence times in each embayment for three delta discharges for {a) northern embayments and {b) South Bay by Denton and Hunt (1986), Walters and others (1985), and Glenne {1966).
Mixing of River and Ocean Water 29

w 0
() 1-'· 11 0 c= ~ Ill rt 1-'· 0 ::s Ill ::s p_,
3:: 1-'· X 1-'· ::s
I..Q ... C/l Ill ::s l"%j 11 Ill ::s 0 1-'· (I)
0 0
ttl Ill "< ... () Ill ~ ..... 1-1'1 0 11 ::s 1-'· Ill
Central Bay San Pablo Bay Carquinez Strait
Suisun Bay
1000~------------~----------~---..-----------~
,.... ->. c ~ """" w ~ .....
100
10
5
0
o HYDRAULIC RESIDENCE TIME
• RESIDENCE TIME c...... c-....
o-0'-.......' Delta discharge
0~----------()....._ a..._.
-·-.'.~~
76m3 /s
·-·-·-·-·-------o'o
•"'-...o"'-.. ·,~
•-. .::::::~~ ~g~
Delta discharge ~.~Q.::::;:n
3 4r.:::~ t270m /s '
20 40 60
DISTANCE FROM GOLDEN GATE (km)
\ \ \
80
FIGURE 15.--Estimates of mean residence times for segments of the northern reach divided into an advective portion (induced by delta discharge and called hydraulic residence time) and a diffusive portion (induced by gravitational circulation and the net horizontal circulation) (figure 16 of Glenne, 1966 as modified by Conomos, 1979). Delta discharge controls residence times for high delta discharges (lower two curves are close), but the diffusive reduction of residence time is large for low delta discharges (upper two curves are separated). The delta discharge quantities, added to Glenne's figure by Conomos (1979), have been changed to reflect those appropriate for the hydraulic residence time curves.

Gravitational circulation and the shallow-channel exchange enhance mixing of fresh water seaward. They also are the principal factors that mix ocean water landward. The landward transport of salt by gravitational circulation and net horizontal circulation and the flushing effect of the delta discharge adjust toward an approximate balance of salt in the northern reach during the low delta-discharge period. Harder (1977) estimated that salinities in Carquinez Strait near Benicia are affected by the pattern of delta discharge for the previous 90 days. Similarly, Winkler (1985) concluded that prediction of monthly mean salinities in Suisun Bay could be made with monthly discharges for the same month and one previous month. Because the low-discharge period usually exceeds three months, a balance is probably achieved during most years.
Conomos (1979) concluded from theoretical arguments that 60 to 70 percent of the overall upstream salt intrusion results from processes other than the gravitational circulation during low freshwater inflows. Walters and Gartner (1985) concluded for one location in Suisun Bay that gravitational circulation was the dominant factor in the net salt flux during neap tides, but that its contribution was highly variable over the spring-neap cycle. Walters and others (1985) concluded that insufficient data exist for the northern reach to be conclusive about the relative contributions of these processes to net salt fluxes.
High Delta Discharges
For delta discharges of about 1300 m3 /s (46,000 ft 3 /s) mean residence times appear to be about a week each for Suisun and San Pablo Bays (fig. 14a). Glenne (1966) showed that delta discharge dominates mean residence times at or above this value, which means that mean residence times and hydraulic residence times are nearly equal (fig. 15). The high-discharge estimates of Denton and Hunt (1986) are probably too large because they exceed hydraulic residence times. For delta discharges of 10,000 m3 /s (350,000 ft 3 /s) Walters and others (1985) and Denton and Hunt (1986) estimate that mean residence times for the whole northern reach decrease to less than 5 days (fig. 14a).
Mixing of River and Ocean Water 31

South Bay
Low Delta Discharges
The difference between the residence time estimates for low delta discharges {fig. 14b) is attributable to the methods used and to the almostuniform salinities in South Bay. (Glenne {1966) did not predict residence times for South Bay.) Neither estimate is likely to be accurate. Denton and Hunt had to use data from periods of gravitational exchange between Central and South Bay because estimation of exchange ratios in the absence of salinity differences between Central and South Bays is problematical. Furthermore, South Bay is not completely mixed horizontally during each tidal cycle {Powell and others, 1986). Thus the mean residence time estimate of Denton and Hunt is probably too short. In contrast, the residence time estimate by the fraction of fresh water method of Walters and others is probably too long because the extremely small local freshwater inflows to South Bay contribute negligibly to seaward flow. Instead, exchanges with Central Bay and the net horizontal circulation control the replacement of water in South Bay {Walters and others, 1985) •
Powell and others {1986) presented evidence for 3 major mixing zones in South Bay. These are northern South Bay between the Bay Bridge and San Bruno Shoal, a central zone between San Bruno Shoal and the San Mateo Bridge, and a southern zone south of San Mateo Bridge. They exhibited evidence of these zones in landward-seaward variations of salinity and chlorophyll concentrations and concluded that the zones are consistent with inferences from data {Walters, 1982; Cheng and Gartner, 1985; and simulation results {Cheng and Casulli, 1982) • They concluded that the central zone has relatively long residence times compared to the southern zone, and that it is characterized by persistent, intense small-scale mixing.
High Delta Discharges
The reduced bioaccumulation of metals by a benthic organism in South Bay during wet years {fig. 16) {Luoma and others, 1985) offers indirect evidence that the high-discharge exchanges between Central and South Bays reduce residence times significantly. Walters and others {1985) suggest that during winter conditions the gravitational circulation alone should be able to exchange the water in South Bay in a period of two weeks or less {fig. 14b). The three-week estimate of Denton and Hunt (1986) {fig. 14b) is similar.
32 Circulation and Mixing, San Francisco Bay, California

c
CX)
260 ~ :~
240 ::>:- ~ ::-. 00
220 ·: :::::::}{'
C'l 100 <!
80
60
40
500 1 000 1500 2000 2500
River Discharge m3s-1
FIGURE 16.--Silver (Ag) concentrations measured in the clam Macoma balthica at a near-shore station on the west side of South Bay south of the Dumbarton Bridge plotted with respect to mean annual delta discharge for the years indicated (figure 9 of Luoma and others, 1985) suggests the influence of delta discharge on the winter flushing of South Bay.
The mean residence time for South Bay probably varies considerably during winter because the strength and landward penetration of gravitational circulation is dependent on the pattern of salinities in Central and South Bays and on vertical mixing rates. Large variations in the salinity patterns result from variations in magnitude and duration of delta discharge events (Imberger and others, 1977) . The exchange process diminishes at least temporarily during spring tides while South Bay becomes vertically well-mixed (Cloern, 1984) •
The combination of landward net flow near the bottom in the northern reach and seaward net flow near the bottom in South Bay leads to speculation that larval organisms, shrimp, and fish near the bottom in Central Bay are more likely to be drawn into the northern reach than into South Bay during high delta discharges (fig. 13b). Results of drifter studies (Conomos, 1979) suggest that this speculation may be valid. Movement of organisms into South Bay might become more likely as delta discharge subsides and the direction of gravitational circulation in South Bay reverses. The opposite tendency might hold true for those organisms near the surface in Central Bay that were not flushed into the ocean.
Mixing of River and Ocean Water 33

SUMMARY
The influence of delta discharge on San Francisco Bay is evident from the differences in circulation and mixing characteristics between low and high discharges (table 2). During low delta discharges the northern reach is characterized by gravitational circulation (fig. 9a and 10) seaward of the null zone, which is usually located in Suisun Bay. The presence of large shallow areas adjacent to the channels causes net horizontal circulation, and particularly the induced shallow-channel exchange, to be important as well. Mean residence times on the order of a month for each embayment result from a combination of seaward flow induced by delta discharge and by the diffusive effects of the circulation mechanisms (fig. 15) • During this period, salinity differences between Central and South Bays are negligible, so that tides and wind determine the characteristic net horizontal circulation in South Bay (fig. 12) • These circulation characteristics and exchanges with Central Bay cause the mean residence time of South Bay to be on the order of a few months, but uncertain.
During high delta discharges the null zone in the northern reach moves rapidly seaward during runoff events and returns landward more slowly under the control of gravitational circulation and net horizontal circulation. Mean residence times for the entire northern reach are reduced from months to weeks or days and are controlled almost entirely by delta discharge (fig. 15). The arrival of low-salinity surface water in Central Bay during runoff events induces gravitational circulation in South Bay (fig. 13), increasing its exchange rate with Central Bay. The duration of this increased exchange and the southward penetration of the fresh water are dependent on the magnitude of the discharge event. Under these conditions the mean residence time for South Bay can be reduced from months to a few weeks.
From this characterization of circulation and m1.x1.ng it is possible to make inferences about effects of delta discharge on the landward intrusion of salt and the seaward flushing of pollutants. For relatively steady summer discharges the region of the null zone has been determined, and there are probably enough salinity data to estimate approximate vertical and horizontal salinity distributions seaward of the null zone, although this latter work has not been done in detail. The salinity variations in the northern reach that would result from given discharge patterns, however, are presently difficult to quantify, because the variability of gravitational circulation and net horizontal circulation with time and location have not yet been quantified.
34 Circulation and Mixing, San Francisco Bay, California

Mean residence times for the northern reach provide order-of-magnitude estimates of the exposure times of organisms to pollutants. Residence times in the large shallow areas during low delta discharges, however, may be considerably longer than the means. Shallows residence times are not yet known because they depend on net currents in the shallows and the shallow-channel exchange, which have not yet been quantified. The same statements can be made about South Bay, where even the mean residence time estimates are poor. Quantification of exchanges with Central Bay also are needed to estimate residence times for South Bay. The exposure time question is further complicated by the interaction of many pollutants with sediments, whose transport and residence times in San Francisco Bay are unknown.
Finally, measurement of the external influences on San Francisco Bay is of generic importance to understanding the bay as an ocean~river mixing zone. Better estimates of delta discharge would improve most analyses of dischargeinduced effects, and would simplify their separation from other effects. Quantification of the ocean-bay exchange process is necessary for answering most circulation and mixing questions in the Central Bay region, and for addressing seasonal and longer time-scale questions throughout the bay.
REFERENCES CITED
Arthur, J. F. , and Ball, M.D. , 1979, Factors influencing the entrapment of suspended material in the San Francisco Bay-Delta Estuary, in San Francisco Bay: The Urbanized Estuary, edited by T. J. Conomos: American Association for the Advancement of Science, Pacific Division, San Francisco, California, p. 143-174.
California, State of, 1932, Variation and control of salinity in the Sacramento-San Joaquin Delta and the upper San Francisco Bay--1931: Department of Public Works, Division of Water Resources, Bulletin No. 27, 440 p.
California, State of, 1986, Dayflow program documentation and data summary user's guide: California Department of Water Resources, Central District Office, Sacramento, California, 360 p.
Cheng, R.T., and Casulli, Vincenzo, 1982, On Langrangian residual currents with applications in South San Francisco Bay, California: Water Resources Research, v. 18, no. 6, p. 1652-1662.
Cheng, R.T., and Gartner, J.W., 1984, Tides, tidal, and residual currents in San Francisco Bay, California--Results of measurements, 1979-1980: U.S. Geological Survey Water-Resources Investigations Report 84-4339, 319 p.
References Cited 35

Cheng, R. T., and Gartner, J. W. , 1985, Harmonic analysis of tides and tidal currents in South San Francisco Bay, California: Estuarine, Coastal, and Shelf Science, v. 21, p. 57-74.
Cloern, J.E., 1984, Temporal dynamics and ecological significance of salinity stratification in an estuary (South San Francisco Bay, USA): Oceanologica Acta, v. 7, no. 1, p. 137-141.
Conomos, T.J., 1979, Properties and circulation of San Francisco Bay waters, in San Francisco Bay: The Urbanized Estuary, edited by T.J. Conomos: American Association for the Advancement of Science, Pacific Division, San Francisco, California, p. 47-84.
Conomos, T.J., Smith, R.E., and Gartner, J.W., 1985, Environmental setting of San Francisco Bay, in Temporal Dynamics of an Estuary: San Francisco Bay, edited by J.E. Cloern and F.H. Nichols: Hydrobiologia, v. 129, p. 1-12.
Disney, L.P., and Overshiner, W.H., 1925, Tides and currents in San Francisco Bay: u.s. Coast and Geodetic Survey, Special Publication No. 115, 125 p.
Denton, R.A., and Hunt, J.R., 1986, Currents in San Francisco Bay--Final Report: University of California at Berkeley, Hydraulic and Coastal Engineering Report No. UCB/HEL-86/01, 99 p.
Dyer, K.R., 1973, Flushing and pollution distribution prediction, Chapter 7 of Estuaries: A Physical Introduction: New York, Wiley-Interscience, p. 109-121.
Fischer, H.B. and Dudley, Earll, 1975, Salinity intrusion mechanisms in San Francisco Bay, California: Proceedings, 16th, Congress of International Association of Hydraulic Research, v. 1, p. 124-133.
Glenne, Bard, 1966, Diffusive processes in estuaries: University of California at Berkeley, Sanitary Engineering Research Laboratory Report 66-6, 78 p.
Harder, J.A., 1977, Predicting estuarine salinity from river inflows: American Society of Civil Engineers, Journal of the Hydraulics Division, v. 103, no. HY8, p. 877-888.
Imberger, Jorg, Kirkland, W.B., Jr., and Fischer, H.B., 1977, The effect of delta outflow on the density stratification in San Francisco Bay: Berkeley, California, Hugo B. Fischer, Inc., Association of Bay Area Governments, Report HBF-77/02, 109 p.
Luoma, S.N., Cain, Daniel, and Johansson, Christopher, 1985, Temporal fluctuations of silver, copper, and zinc in the bivalve Macoma balthica at five stations in South San Francisco Bay, in Temporal Dynamics of an Estuary: San Francisco Bay, edited by J.E. Cloe~ and F.H. Nichols: Hydrobiologia, v. 129, p. 109-120.
McCulloch, D.S., Peterson, D.H., Carlson, P.R., and Conomos, T.J., 1970, A preliminary study of the effects of water circulation in the San Francisco Bay estuary: U.S. Geological Survey Circular 637-A, 27 p.
36 Circulation and Mixing, San Francisco Bay, California

Nichols, F.H., Cloern, J.E., Luoma, S.N., and Peterson, D.H., 1986, The modification of an estuary: Science, v. 231, p. 525-648.
Parker; D.S., Morris, D.P., and Nelson, A.W., 1972, Tidal exchange at the Golden Gate: American Society of Civil Engineers, Journal of the Sanitary Engineering Division, v. 98, p. 305-323.
Peterson, D.H., Conomos, T.J., Broenkow, w.w., and Doherty, P.C., 1975, Location of the non-tidal current null zone in northern San Francisco Bay: Estuarine and Coastal Marine Science, v. 3, p. 1-11.
Peterson, D. H. , Smith, R. E. , Hager, s . w. , Harmon, D. D. , Herndon, R. E. , and Schemel, L.E., 1985, Interannual variability in dissolved inorganic nutrients in northern San Francisco Bay estuary, in Temporal Dynamics of an Estuary: San Francisco Bay, edited by J.E. Cloern and F.H. Nichols: Hydrobiologia, v. 129, p. 37-58.
Powell, T.M., Cloern, J .E., and Walters, R.A., 1986, Phytoplankton spatial distribution in South San Francisco Bay: mesoscale and small-scale variability, in Estuarine Variability, edited by D.A. Wolfe: New York, Academic Press, p. 369-383.
Selleck, R.E., Pearson, E.A., Glenne, and hydrological characteristics California at Berkeley, Sanitary 65-10, 99 p.
Bard, and Storrs, P.N., 1966, Physical of San Francisco Bay: University of
Engineering Research Laboratory Report
Smith, L.H., and Cheng, R.T., 1987, Tidal and tidally averaged circulation characteristics of Suisun Bay, California: Water Resources Research, v. 23, no. 1, p. 143-155.
Smith, Winchell, 1969, Feasibility study of the use of the acoustic velocity meter for measurement of net outflow from the Sacramento-San Joaquin Delta in California: U.S. Geological Survey Water-Supply Paper 1877, 54 p.
Thomas, H.E., 1978, The natural endowment, Chapter 2, p. 4-14, of The California Water Atlas, prepared by the Governor's Office of Planning and Research in cooperation with the California Department of Water Resources: Available from William Kaufmann, Inc., Los Altos, California, 118 p.
Walters, R.A., 1982, Low-frequency variations in sea level and currents in south San Francisco Bay: Journal of Physical Oceanography, v. 12, no. 7, p. 658-668.
Walters, R.A., and Cheng, R.T., 1979, A two-dimensional hydrodynamic model of a tidal estuary: Advances in Water Resources, v. 2, December, p. 177-184.
Walters, R.A., Cheng, R.T., and Conomos, T.J., 1985, Time .scales of circulation and mixing processes of San Francisco Bay waters, in Temporal Dynamics of an Estuary: San Francisco Bay, edited by J.E. Cloern and F.H. Nichols: Hydrobiologia, v. 129, p. 13-36.
References Cited 37

Walters, R.A., and Gartner, J.W., 1985, Subtidal sea level and current variations in the northern reach of San Francisco Bay: Estuarine, Coastal and Shelf Science, v. 21, p. 17-32.
Williams, P.B., and Fishbain, Larry, 1987, Analysis of changes in delta outflow due to existing and future water development scenarios: San Francisco, California, Phillip Williams and Associates, Report 412-1, 11 p.
Williams, P.B., and Vorster, Peter, 1987, Changes in short duration spring flow peaks into San Francisco Bay due to upstream water development: San Francisco, California, Phillip Williams and Associates, Report 412-3, 7 p.
Winkler, E.D., 1985, Preliminary development of a statistical approach to salinity modeling in the western Sacramento-San Joaquin Delta ~nd Suisun Bay: Technical Information Record 1463-CD-04, California Department of Water Resources, Sacramento, California, 123 p.
Young, W .R., 1929, Report on the salt water barrier below confluence of Sacramento and San Joaquin Rivers, California: California Department of Public Works, Division of Water Resources, Bulletin No. 22, v., 1 670 p.
38 Circulation and Mixing, San Francisco Bay, California