4.9 Transportation and Circulation - Santa Barbara County · 4.9 Transportation and Circulation ......
22
4.9 Transportation and Circulation July 2011 4.9-1 Ellwood Pipeline Company Line 96 Modification Project FEIR 4.9 TRANSPORTATION AND CIRCULATION 1 This section describes the road transportation system as well as marine traffic in the 2 vicinity of the proposed Project and the impacts of the proposed Project and its 3 alternatives. The analysis in this section is based on area planning documents, other 4 project EIRs, a review of local and regional maps, and discussions with appropriate 5 agencies. 6 4.9.1 Environmental Setting 7 4.9.1.1 Methods of Describing Traffic 8 Transportation conditions are often described in terms of levels of service (LOS). The 9 LOS is a comparison of the existing amount of traffic on a roadway and the design 10 capacity of the roadway. The design capacity of a roadway is defined as the maximum 11 rate of vehicle travel, (e.g., vehicles per hour) that can reasonably be expected along a 12 section of roadway. Capacity is dependent on a number of variables, including road 13 classification and number of lanes, road condition, terrain, weather, and driver 14 characteristics. LOS is generally a function of the ratio of traffic volume (V) to the 15 capacity (C) of the roadway or intersection. The LOS rating uses qualitative measures 16 that characterize operational conditions within a traffic stream and their perception by 17 motorists. These measures include freedom of movement, speed and travel time, traffic 18 interruptions, types of vehicles, comfort, and convenience. 19 Trucks and other large or heavy vehicles, e.g., wider-than-normal vehicles, slower 20 moving tractors, impact LOS by occupying more roadway space and by having reduced 21 operating qualities than passenger cars. Because heavy vehicles accelerate more 22 slowly than passenger cars, gaps form in traffic flow that affect the efficiency of the 23 roadway. In addition, intersections present a number of variables that can influence 24 LOS, including curb parking, transit buses, turn lanes, signal spacing, pedestrians, and 25 signal timing. 26 The Highway Capacity Manual (Transportation Research Board [TRB] 2000) 27 establishes LOS classifications depending on roadway volume to capacity (V/C) ratios 28 for different types of roadways and intersections that are widely used in traffic studies 29 (Table 4.9-1). The LOS of a roadway or intersection is described using a scale ranging 30 from A to F, with Level A indicating excellent traffic flow quality and Level F indicating 31 stop-and-go traffic. Level E is normally associated with the maximum design capacity 32
Transcript of 4.9 Transportation and Circulation - Santa Barbara County · 4.9 Transportation and Circulation ......

4.9 Transportation and Circulation
July 2011 4.9-1 Ellwood Pipeline CompanyLine 96 Modification Project FEIR
4.9 TRANSPORTATION AND CIRCULATION 1
This section describes the road transportation system as well as marine traffic in the 2
vicinity of the proposed Project and the impacts of the proposed Project and its 3
alternatives. The analysis in this section is based on area planning documents, other 4
project EIRs, a review of local and regional maps, and discussions with appropriate 5
agencies. 6
4.9.1 Environmental Setting 7
4.9.1.1 Methods of Describing Traffic 8
Transportation conditions are often described in terms of levels of service (LOS). The 9
LOS is a comparison of the existing amount of traffic on a roadway and the design 10
capacity of the roadway. The design capacity of a roadway is defined as the maximum 11
rate of vehicle travel, (e.g., vehicles per hour) that can reasonably be expected along a 12
section of roadway. Capacity is dependent on a number of variables, including road 13
classification and number of lanes, road condition, terrain, weather, and driver 14
characteristics. LOS is generally a function of the ratio of traffic volume (V) to the 15
capacity (C) of the roadway or intersection. The LOS rating uses qualitative measures 16
that characterize operational conditions within a traffic stream and their perception by 17
motorists. These measures include freedom of movement, speed and travel time, traffic 18
interruptions, types of vehicles, comfort, and convenience. 19
Trucks and other large or heavy vehicles, e.g., wider-than-normal vehicles, slower 20
moving tractors, impact LOS by occupying more roadway space and by having reduced 21
operating qualities than passenger cars. Because heavy vehicles accelerate more 22
slowly than passenger cars, gaps form in traffic flow that affect the efficiency of the 23
roadway. In addition, intersections present a number of variables that can influence 24
LOS, including curb parking, transit buses, turn lanes, signal spacing, pedestrians, and 25
signal timing. 26
The Highway Capacity Manual (Transportation Research Board [TRB] 2000) 27
establishes LOS classifications depending on roadway volume to capacity (V/C) ratios 28
for different types of roadways and intersections that are widely used in traffic studies 29
(Table 4.9-1). The LOS of a roadway or intersection is described using a scale ranging 30
from A to F, with Level A indicating excellent traffic flow quality and Level F indicating 31
stop-and-go traffic. Level E is normally associated with the maximum design capacity 32

4.9 Transportation and Circulation
Ellwood Pipeline Company Line 96 Modification Project FEIR
4.9-2 July 2011
that a roadway or intersection can accommodate. Levels A, B, and C are generally 1
considered satisfactory. Level D is considered tolerable in urban areas during peak 2
hours due to the high cost of improving roadways or intersections. On State highway 3
facilities, the California Department of Transportation (Caltrans) endeavors to maintain a 4
target LOS at the transition between Level C and Level D. 5
Table 4.9-1 LOS vs. Volume to Capacity Ratios for Different Types of Roadways
LOS Traffic Conditions V/C
Multi-Lane Freeway 1
2-Lane Highway 2
Arterial Intersection
3
A Free-flow conditions with unimpeded maneuverability. Stopped delay at signalized intersections is minimal.
0.30 0.15 to
0.26
0.00 to
0.60
<0.60
B In the range of stable flow, but the presence of other users in the traffic streams begins to be noticeable.
0.50 0.27 to
0.42
0.61 to
0.70
0.61 to
0.70
C In the range of stable flow, but marks the beginning of the flow in which the operation of individual users becomes significantly affected by interactions with others in the traffic stream. Long queues are experienced at intersections.
0.71 0.43 to
0.63
0.71 to
0.80
0.71 to
0.80
D High-density but stable flow. Speed and freedom to maneuver are severely restricted, and the driver experiences a poor level of comfort.
0.89 0.64 to
0.99
0.81 to
0.90
0.81 to
0.90
E Near capacity. Operations with significant delays and low average speeds. Severe congestion.
1.00 1.00 and over
0.91-1.00 0.91-1.00
F Forced or breakdown flow. Operations with extremely low speeds, high delay, extensive queuing.
-- -- >1.00 > 1.00
Notes: 1 V/C for 65 mph vehicle speed. 2 V/C for level terrain, when passing is allowed. 3 From Goleta General Plan 2006 Table 7-3. Sources: TRB 1994; CalTrans 2002; Goleta 2006
For divided highways, the LOS classifications are based on the vehicle density, which is 6
a measure that quantifies the proximity of vehicles to each other within the traffic 7
stream, and indicates the degree of maneuverability within the traffic stream (TRB 8
1994). 9
As discussed above, LOS is determined not only by traffic volumes, but also by a 10
number of roadway conditions and intersection details. Determining a roadway’s 11

4.9 Transportation and Circulation
July 2011 4.9-3 Ellwood Pipeline CompanyLine 96 Modification Project FEIR
potential to present a traffic flow problem is a complicated process; therefore, a 1
screening approach is often used. The screening approach involves comparing the 2
roadway class with a traffic volume level for each LOS. The screening levels are 3
developed by making generic assumptions for the data input in the Highway Capacity 4
Manual calculations. The screening approach is used for roadways. For intersections, 5
the “Intersection Capacity Utilization” (ICU) approach is used. Each of these is 6
discussed below. 7
Roadways 8
Table 4.9-2 shows the screening traffic volume levels for determination of LOS for 9
roadways in the Project area and were adopted by Santa Barbara County for screening 10
traffic impacts. The roadway capacities listed in the Table are “rule of thumb” figures. 11
Some factors that affect these capacities are intersections (in the case of surface 12
roadways), degrees of access control, roadway grades, design geometries (horizontal 13
and vertical alignment standards), sight distance, levels of truck and bus traffic, and 14
levels of pedestrian and bicycle traffic. Caltrans develops its own screening criteria for 15
determining LOS on the roadways under its jurisdiction. 16
Table 4.9-2 LOS Screening Classifications and Roadway Daily Volumes
Roadway Class
Number of Lanes
LOS Classes *
A B C D E Santa Barbara County Freeway 6 44,000 74,400 88,800 99,900 111,000
Freeway 4 29,600 49,600 59,200 66,600 74,000
Arterial 4+ - - 47,000* - -
Arterial 4 23,900 27,900 34,000* 35,900 39,900
Arterial 2 12,000 14,000 14,300* 18,000 20,000
Major 4 19,200 22,300 25,500 28,700 31,900
Major 2 9,600 11,200 12,500* 14,400 16,000
Collector 2 7,100 8,200 9,280* 10,600 11,800
Local 2 - - 7,280* - -
CalTrans
Freeway per lane per hour
710 1,170 1,680 2,090 2,350
Note: * Defined in Goleta 2006 Sources: Santa Barbara County 1996; TRB 1994

4.9 Transportation and Circulation
Ellwood Pipeline Company Line 96 Modification Project FEIR
4.9-4 July 2011
The Goleta General Plan (Goleta 2006a) describes a roadways acceptable capacity, 1
which is defined as the capacity of the roadway at an LOS of C. If the traffic of a 2
roadway exceeds these criteria, it is defined as unacceptable. 3
Intersections 4
Intersections that exceed LOS of C are defined as unacceptable by the Goleta General 5
Plan. In order to assess the LOS of an intersection, the ICU method is used (Goleta 6
2006). The method sums the amount of time required to serve all movements at 7
saturation for a given cycle length and divides that by a reference cycle length. The 8
method is similar to taking a sum of critical volume to capacity flow ratios. The ICU tells 9
how much reserve capacity is available, or how much the intersection is at overcapacity. 10
The ICU does not predict delay, but it can be used to predict how often an intersection 11
will experience congestion. 12
4.9.1.2 Marine Traffic 13
Marine traffic is typically described in numbers of port calls per vessel category, e.g., 14
tankers, container vessels, as well as the number of vessels that traverse a given 15
waterway. Vessels associated with the current Project-related facilities traverse an area 16
between the EMT and the Santa Barbara Channel shipping lanes, and then continue 17
onward to a port delivery terminal (Port of Los Angeles/Long Beach or San Francisco 18
Bay destination). Supply vessels and crew boats use the area between the Ellwood 19
pier and Platform Holly. 20
Offshore waters in high traffic areas can be designated as safety fairways to prohibit the 21
placement of surface structures such as oil platforms. The Army Corps of Engineers is 22
prohibited from issuing permits for surface structures within safety fairways, which are 23
frequently located between a port and the entry into a Traffic Separation Scheme (TSS). 24
A TSS is an internationally recognized vessel routing designation, which separates 25
opposing flows of vessel traffic into lanes, including a zone between lanes where traffic 26
is to be avoided. TSSs have been designated to help direct vessels along highly 27
trafficked portions of the California coastline, including as the Santa Barbara Channel. 28
Vessels are not required to use any designated TSS, but failure to use one, if available, 29
would be a major factor in determining liability in the event of a collision. The TSS in the 30
Santa Barbara Channel extends from the waters north of Los Angeles to Point 31
Conception. 32
4.9 Transportation and Circulation
July 2011 4.9-5 Ellwood Pipeline CompanyLine 96 Modification Project FEIR
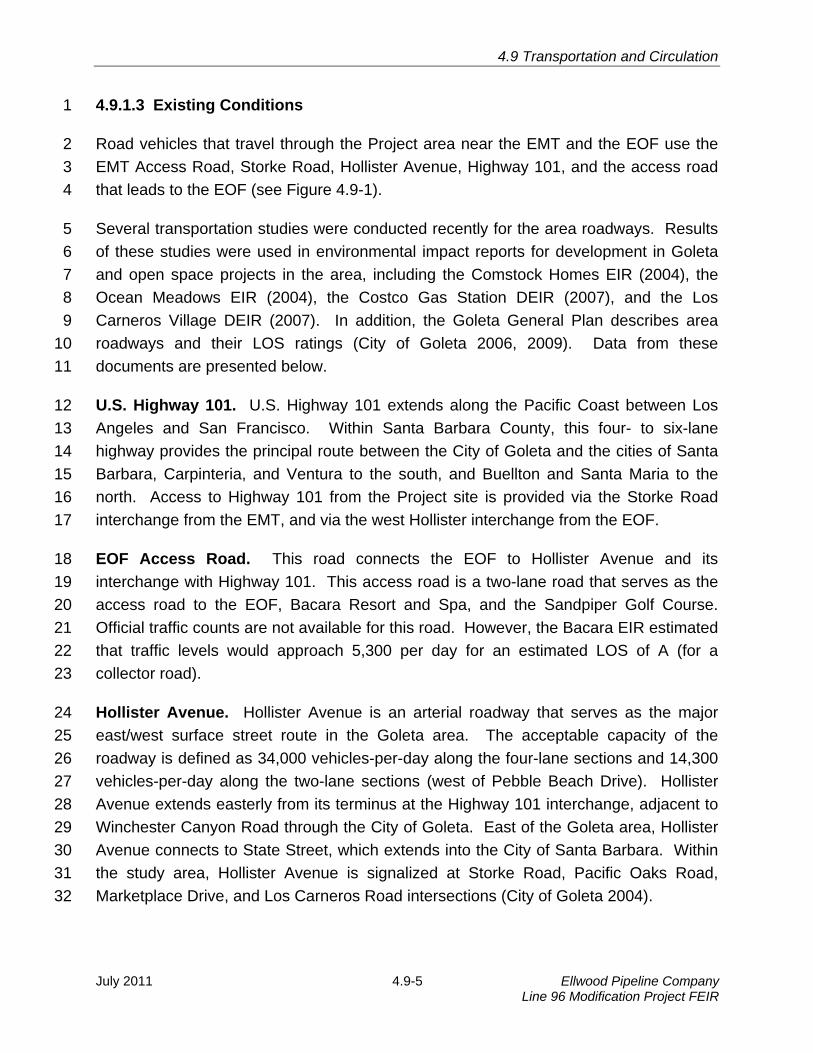
4.9.1.3 Existing Conditions 1
Road vehicles that travel through the Project area near the EMT and the EOF use the 2
EMT Access Road, Storke Road, Hollister Avenue, Highway 101, and the access road 3
that leads to the EOF (see Figure 4.9-1). 4
Several transportation studies were conducted recently for the area roadways. Results 5
of these studies were used in environmental impact reports for development in Goleta 6
and open space projects in the area, including the Comstock Homes EIR (2004), the 7
Ocean Meadows EIR (2004), the Costco Gas Station DEIR (2007), and the Los 8
Carneros Village DEIR (2007). In addition, the Goleta General Plan describes area 9
roadways and their LOS ratings (City of Goleta 2006, 2009). Data from these 10
documents are presented below. 11
U.S. Highway 101. U.S. Highway 101 extends along the Pacific Coast between Los 12
Angeles and San Francisco. Within Santa Barbara County, this four- to six-lane 13
highway provides the principal route between the City of Goleta and the cities of Santa 14
Barbara, Carpinteria, and Ventura to the south, and Buellton and Santa Maria to the 15
north. Access to Highway 101 from the Project site is provided via the Storke Road 16
interchange from the EMT, and via the west Hollister interchange from the EOF. 17
EOF Access Road. This road connects the EOF to Hollister Avenue and its 18
interchange with Highway 101. This access road is a two-lane road that serves as the 19
access road to the EOF, Bacara Resort and Spa, and the Sandpiper Golf Course. 20
Official traffic counts are not available for this road. However, the Bacara EIR estimated 21
that traffic levels would approach 5,300 per day for an estimated LOS of A (for a 22
collector road). 23
Hollister Avenue. Hollister Avenue is an arterial roadway that serves as the major 24
east/west surface street route in the Goleta area. The acceptable capacity of the 25
roadway is defined as 34,000 vehicles-per-day along the four-lane sections and 14,300 26
vehicles-per-day along the two-lane sections (west of Pebble Beach Drive). Hollister 27
Avenue extends easterly from its terminus at the Highway 101 interchange, adjacent to 28
Winchester Canyon Road through the City of Goleta. East of the Goleta area, Hollister 29
Avenue connects to State Street, which extends into the City of Santa Barbara. Within 30
the study area, Hollister Avenue is signalized at Storke Road, Pacific Oaks Road, 31
Marketplace Drive, and Los Carneros Road intersections (City of Goleta 2004). 32

4.9 Transportation and Circulation
July 2011 4.9-6 Ellwood Pipeline CompanyLine 96 Modification Project FEIR
Figure 4.9-1: Project Area Roadways
Sources: See table 4.9-3

4.9 Transportation and Circulation
July 2011 4.9-7 Ellwood Pipeline CompanyLine 96 Modification Project FEIR
Storke Road. Storke Road is a north/south arterial roadway that is four lanes wide 1
between Highway 101 and Phelps Road (acceptable capacity of 34,000 vehicles-per-2
day). South of Whittier Road, Storke Road narrows to two lanes (acceptable capacity of 3
14,300 vehicles-per-day). Storke Road provides freeway access to the western portion 4
of the Goleta Valley, via an interchange at Highway 101. North of the interchange, 5
Storke Road becomes Glen Annie Road, a two-lane road. Storke Road is signalized at 6
the Highway 101 northbound and southbound ramps and the intersections at Hollister 7
Avenue, Marketplace Drive, Phelps Road, and El Colegio Road. 8
Phelps Road. Phelps Road extends east of Cannon Green Drive as an east/west two-9
lane road to Storke Road. Phelps Road also extends easterly from Storke Road. The 10
roadway is signalized at Storke Road and is controlled by a stop sign at Pacific Oaks 11
Road. 12
EMT Access Road. The road is the only paved road connecting the EMT to the rest of 13
the transportation system. It is a one-lane road used mainly by vehicles that service the 14
EMT, and by recreational pedestrians, joggers, dog walkers, and bicyclists. The road is 15
maintained by Venoco. Motorized vehicles are rare on this road; although traffic counts 16
are not available, it is estimated that peak day activities at the EMT could generate 40 to 17
50 round-trips on this road. 18
Marine Traffic. Approximately 18 large ocean-going vessels pass through Santa 19
Barbara Channel each day (SBCAPCD 2003). Numerous small private vessels also 20
transit the Santa Barbara Channel on a regular basis. The Barge Jovalan visits the 21
EMT an average of about once every three weeks, while the larger Barge Olympic Spirit 22
would only be required to visit the EMT about once every month. 23
4.9.1.4 Existing Roadway Performance 24
Table 4.9-3 lists the current road conditions for the local roadways. The conditions were 25
estimated by the City of Goleta (City of Goleta 2004, 2009) and UCSB (2004). Current 26
roadway conditions for those roadways which only have older, pre-2008 traffic counts 27
were estimated assuming a one percent annual increase in vehicle traffic. LOS levels 28
were based on either the screening tables or the respective traffic studies. 29
Current traffic levels are acceptable for most roadways, except Storke Road south of 30
the Highway 101 interchange and Storke Road south of Whittier Avenue, which are 31
operating at LOS of F and D respectively. 32

4.9 Transportation and Circulation
Ellwood Pipeline Company Line 96 Modification Project FEIR
4.9-8 July 2011
Table 4.9-3 Average Daily Roadway Traffic and LOS, Existing and Future
Roadway Acceptable
Capacity Current
ADT LOS
Hollister Ave. at Storke Rd. a 34,000 31,900 C
Hollister Ave. at Pacific Oaks a 34,000 13,000 A
Hollister Ave. at Cannon Green Dr. b 34,000 21,000 A
Hollister Ave. east of U.S. 101 interchange a 14,300 6,500 A
Storke Rd. south of U.S. 101 interchange a 34,000 40,000 F
Storke Rd. at Phelps Rd. b 34,000 24,100 B
Storke Rd. south of Whittier a 14,300 15,800 D
EOF/Bacara Access Road b 7,280 5,300 A
Notes: Table data is most recent available per City Community Services Department; LOS = level of service; ADT = average daily traffic. Sources: a City of Goleta 2009, b based on rate of growth from City of Goleta 2006, City of Goleta 2004, Comstock EIR 2004, and UCSB 2004 .
4.9.1.5 Current Intersection Performance 1
Table 4.9-4 summarizes the traffic conditions at the Project-affected intersections during 2
peak hours (peak hours are defined as 6 a.m. to 8 a.m. and 4 p.m. to 6 p.m.). 3
Intersection LOS are acceptable for current conditions. Future conditions would 4
generate unacceptable delays at the Storke Road - Hollister Avenue intersection. 5
Table 4.9-4 Peak Hour Intersection Delay and LOS, Current
Roadway Control Current
V/C Ratio or Delay
LOS
Calle Real at U.S. 101 NB Off-Ramp b Stop-sign 8.9 sec. A
Hollister Ave./ Calle Real/U.S. 101 NB On-Ramp a Stop-Sign 13.9 sec. B
Hollister Ave./U.S. 101SB Ramp a Stop-Sign 14.6 sec. B
Hollister Ave./Ellwood School b Signal 0.40 A
Hollister Ave./S.B. Shores Drive b Stop-Sign 8.7 sec. A
Storke Rd/Hollister Ave. a Signal 0.77 C
Glenn Annie Rd./U.S. 101 NB Ramps a Signal 0.65 B
Storke Rd./U.S. 101 SB Ramp a Signal 0.51 A
Notes: Table data is most recent available per City Community Services Department; LOS = level of service; ADT = average daily traffic.
Sources: a City of Goleta 2009 ; b City of Goleta 2004, 2006.

4.9 Transportation and Circulation
July 2011 4.9-9 Ellwood Pipeline CompanyLine 96 Modification Project FEIR
4.9.1.6 Current Highway 101 LOS 1
The Highway 101 traffic conditions to the north and south of the Project area are listed 2
in Tables 4.9-5 and 4.9-6. Current traffic levels are based on CalTrans traffic volume 3
data (CalTrans 2007) along with a projected annual population growth rate of one 4
percent (U.S. Census 2000). 5
Table 4.9-5 Current Traffic Conditions on Highway 101 South of the Project Area
Road/Route
Current Traffic
ADT Peak Hour1 Non-peak Hour
VPL LOS VPL LOS
Casitas Pass Rd. 80,928 2,233 E 783 BCarpinteria, Linden Ave. 81,979 2,417 F 786 BSanta Monica Rd./7thSt. 83,030 2,365 F 800 BSouth Padaro Ln. 85,132 2,365 F 823 BPadaro Ln. 92,489 2,496 F 897 BEvans Ave. 90,387 2,470 F 875 BMontecito, Sheffield Dr. 91,438 2,365 F 891 BSan Ysidro Rd. 98,795 2,575 F 962 BOlive Mill Rd. 94,591 2,365 F 925 BCabrillo Rd. 110,356 2,785 F 1,078 BJct.Rte.144; Milpas St. 106,152 2,654 F 1,038 BGarden St. 106,152 1,769 D 692 ACastillo St. 118,764 1,979 D 775 BCarrillo St. 141,886 2,417 F 923 BMission St. 156,600 2,242 E 1,037 BJct. Rte. 225 S-E, Las Positas Rd. 142,937 2,102 E 944 BLa Cumbre Rd. 142,937 2,172 E 941 BJct. Rte. 154; State St. 126,121 2,049 D 825 BEl Sueno Rd. 125,070 2,032 D 818 BTurnpike Rd. 125,070 2,032 D 818 BJct. Rte. 217 South (to UCSB) 85,132 2,076 D 835 BFairview Ave. 74,622 1,813 D 732 BLos Carneros Rd. 65,163 1,419 C 647 A
Notes: ADT = average daily traffic; LOS = levels of service; VPL = vehicles per lane; 1 peak hours are defined as 6 a.m. to 8 a.m. and 4 p.m. to 6 p.m
Source: CalTrans 2007 data with one percent annual growth rate applied

4.9 Transportation and Circulation
Ellwood Pipeline Company Line 96 Modification Project FEIR
4.9-10 July 2011
Table 4.9-6 Current Traffic Conditions on Highway 101 North of the Project Area
Road/Route
Current Traffic
ADT Peak Hour1 Non-peak Hour
VPL LOS VPL LOS
Glen Annie/Stroke Rd. 42,040 1,090 B 410 A
Hollister Ave. 39,938 1,064 B 388 A
El Capitan Beach State Park 37,836 920 B 371 A
Las Cruces, Jct. Rte.1 Northwest 25,750 670 A 251 A
Santa Rosa Rd. 23,543 617 A 229 A
Buellton, Jct. Rte. 246 21,230 565 A 206 A
North Buellton 24,173 552 A 239 A
Zaca, Jct. Rte. 154 East 30,479 828 B 295 A
Los Alamos, Jct. Rte. 135 N-W 28,903 775 B 280 A
Clark Ave. 39,938 841 B 398 A
South Santa Maria 46,244 1,038 B 458 A
Betteravia Rd. 57,806 1,222 C 575 A
East Stowell Rd. 64,112 1,550 C 629 A
Jct. Rte. 166 W, Main St. 62,010 1,734 D 599 A
Donovan Rd. 60,959 1,787 D 585 A
Jct. Rte. 135 S 67,265 1,734 D 656 A
San Luis Obispo County 67,265 1,734 D 656 A
Notes: ADT = average daily traffic; LOS = levels of service; VPL = vehicles per lane; 1 peak hours are defined as 6 a.m. to 8 a.m. and 4 p.m. to 6 p.m
Source: CalTrans 2007 data with one percent annual growth rate applied
Highway LOS values are defined for average daily (non-peak) traffic levels and peak 1
hour traffic levels. Current daily average LOS levels on segments of Highway 101 to 2
both the north and south of the Project area are acceptable, and range between A and 3
B. However, the peak hour LOS for Highway 101 to the south of the Project area range 4
from B to F, with all roadway segments except Los Carneros Road having unacceptable 5
levels of service (LOS of D or less). Although peak hour LOS are acceptable to the 6
immediate north of the Project area, roadway segments at the northern end of Santa 7
Maria, from the junction of Route 166 onward to San Luis Obispo County are not. 8
4.9.1.7 Bicycle Facilities 9
Several on- and off-street bicycle facilities are located in the Project area. These 10
include Class I (off-street bike path) bike facilities along El Colegio Road east of Storke 11

4.9 Transportation and Circulation
July 2011 4.9-11 Ellwood Pipeline CompanyLine 96 Modification Project FEIR
Road. Class II (on-street bike lane) bike facilities are present on Storke Road, on 1
Phelps Road, and along Hollister Avenue. 2
4.9.1.8 Proposed Roadway Projects 3
According to the City of Goleta General Plan (City of Goleta 2006), there are a number 4
of major future roadway improvements to the street and intersection system that will be 5
needed to accommodate the forecasted future traffic volumes. These include: 6
Connection of Phelps Road with Los Carneros to help reduce congestion on 7
Hollister and Storke Avenues (General Plan, no specific timing); 8
Storke Road capacity improvements to help reduce congestion on Storke Road 9
south of the Highway 101 overpass and Storke Road south of Whittier (General 10
Plan, no specific timing); 11
Intersection improvements at Storke Road and Hollister, including changes in 12
signal timing, addition of lanes and other improvements (General Plan, no 13
specific timing); 14
Potential new freeway crossing at Ellwood Station Road to connect Hollister 15
Avenue with Calle Real. This project would help to reduce congestion at the 16
Storke/Hollister Intersection (General Plan, no specific timing); 17
A joint project with CalTrans to redesign and relocate the Hollister Avenue to 18
Calle Real Highway 101 bridge to a location at the intersection with Cathedral 19
Oaks Road. (MOU with CalTrans, currently under construction). 20
The implementation of these improvements would reduce all of the current LOS of the 21
roadways and intersections listed in Tables 4.9-3 and 4.9-4 to acceptable levels (City of 22
Goleta 2006), except for the Storke and Hollister intersection, which would only improve 23
from a future LOS of E to an LOS of D. 24
The Santa Barbara County Public Works Department publishes a listing of capital 25
improvement projects for roadways under their jurisdiction. The only project listed near 26
the Project area is a project to improve El Colegio Road between Los Carneros and 27
UCSB, by adding round-a-bouts and landscaping. This project was in the design and 28
permit stage as of May 2008. 29
According to CalTrans, there is only one additional road project involving Highway 101 30
in the vicinity of the Project (aside from the Hollister/Highway 101 overpass), which is 31

4.9 Transportation and Circulation
Ellwood Pipeline Company Line 96 Modification Project FEIR
4.9-12 July 2011
the widening of Highway 101 from Carpinteria to the Santa Barbara-Milpas Road 1
interchange. This improvement project is ongoing at the time of the writing of this EIR. 2
4.9.2 Regulatory Setting 3
International and Federal regulations and jurisdictions in regards to vessel safety are 4
described in Section 4.2, Hazards and Hazardous Materials. 5
4.9.2.1 Federal 6
The Federal government passes the responsibilities of maintaining and regulating the 7
roadways to the State and local entities. 8
United States Coast Guard (USCG) 9
USCG, through Title 33 (Navigation and Navigable Waters) and Title 46 (Shipping) of 10
the CFR, is the Federal agency responsible for vessel inspection, marine terminal 11
operations safety, coordination of Federal responses to marine emergencies, 12
enforcement of marine pollution statutes, marine safety (navigation aids, etc.), and 13
operation of the National Response Center for spill response. They are also the lead 14
agency for offshore spill response. 15
On 27 November 1996, USCG underkeel clearance regulations for tanker vessels 16
without double hulls became effective (33 CFR 157.455). These regulations require, in 17
part, that the ship’s master calculate the tanker's deepest navigational draft and the 18
controlling depth of the intended transit, and discuss these issues with the pilot prior to 19
any transit. 20
Current USCG regulations also require a federally licensed pilot aboard every tanker 21
vessel mooring and unmooring at offshore marine terminals. 22
4.9.2.2 State 23
CalTrans maintains the State highway system, including Highway 101, which provides 24
the main vehicle access to the Project area. Maximum load limits for trucks and safety 25
requirements for oversized vehicles are generally regulated by CalTrans for operation 26
on highways. 27

4.9 Transportation and Circulation
July 2011 4.9-13 Ellwood Pipeline CompanyLine 96 Modification Project FEIR
4.9.2.3 Local 1
The City of Goleta General Plan established a number of policies for transportation 2
demand management (City of Goleta 2006). These are summarized below. 3
TE2.1 - Limit traffic congestion through reducing low-occupancy auto trips and 4
shifting peak hour vehicle trips to off-peak hours; 5
TE2.4 - Require proposed larger sized non-residential developments with 100 or 6
more employees to prepare and adopt a Transportation Management Plan; 7
TE3.8 - Primary truck routes shall be limited to freeways and major and minor 8
arterials within the City; and 9
TE4.1 - Traffic LOS standard C shall apply Citywide to major arterials, minor 10
arterials, and collector roadways and signalized and unsignalized intersections. 11
The Santa Barbara County Association of Governments (SBCAG) is designated by 12
State and Federal governments as the Metropolitan Planning Organization (MPO), the 13
Local Transportation Authority (LTA), and the Regional Transportation Planning Agency 14
(RTPA). Under these designations, SBCAG has responsibility for all regional 15
transportation planning and programming activities. 16
The proposed Project would be subject to the provisions of the Santa Barbara County 17
Congestion Management Program (CMP). The CMP is a comprehensive program 18
designed to reduce auto-related congestion and designates major highway and road 19
segments within the Project vicinity. The CMP requires an assessment of the Project’s 20
potential impacts on designated roadways, which include Hollister Road and Highway 21
101. As the Congestion Management Agency (CMA) for Santa Barbara County, 22
SBCAG is responsible for the development and implementation of the County-wide 23
CMP. All urban counties are required to have a CMP. 24
The County of Santa Barbara Comprehensive Plan Circulation Element defines 25
acceptable increases in traffic levels along roadways and at intersections. 26
4.9.3 Significance Criteria 27
Traffic impacts from the proposed Project or its alternatives would be considered 28
significant if any of the following apply: 29
Project traffic would increase an intersection peak hour V/C ratio or number of 30
trips by the values provided in Table 4.9-6 (City of Goleta General Plan); 31

4.9 Transportation and Circulation
Ellwood Pipeline Company Line 96 Modification Project FEIR
4.9-14 July 2011
Table 4.9-6 Traffic Significance Criteria for Intersections
Peak Hour LOS (including Project)
Increase in V/C
Additional Trips per hour
A 0.20 ––
B 0.15 ––
C 0.10 ––
D –– 15
E –– 10
F –– 5
Project access to a major road or arterial road would require a driveway that 1
would create an unsafe situation, a new traffic signal, or require major revisions 2
to an existing traffic signal (City of Goleta General Plan); 3
Project would add traffic to a roadway that has design features (e.g. narrow 4
width, roadside ditches, sharp curves, poor sight distance, inadequate pavement 5
structure) or receives use, which would be incompatible with a substantial 6
increase in traffic (e.g. rural roads with use by farm equipment, livestock, 7
horseback riding, or residential roads with heavy pedestrian or recreational use, 8
etc.) and become a potential safety problem with the addition of Project-related 9
or cumulative traffic (City of Goleta General Plan); 10
Project traffic would use a substantial portion of an intersection’s capacity where 11
the intersection is currently operating at acceptable levels of service (A through 12
C), but with cumulative traffic would degrade to or approach LOS D (V/C 0.81) or 13
lower. Substantial is defined as a minimum change of 0.03 V/C for intersections 14
which would operate from 0.80 to 0.85 V/C, and a change of 0.02 V/C for 15
intersections which would operate from 0.86 to 0.90 V/C, and 0.01 V/C for 16
intersections which would operate greater than 0.90 V/C (LOS E or worse) (City 17
of Goleta General Plan); 18
Project traffic would contribute over 100 peak-hour trips to a roadway with LOS 19
D, or 50 peak-hour trips to a roadway with LOS E or F to roadways under the 20
Santa Barbara Association of Governments Congestion Management Plan 21
jurisdiction (Storke, Hollister or highway 101). (from SBAG CMP 2003); and 22
Project activities would reduce the existing level of safety for navigating vessels. 23

4.9 Transportation and Circulation
July 2011 4.9-15 Ellwood Pipeline CompanyLine 96 Modification Project FEIR
4.9.4 Impact Analysis and Mitigation 1
Traffic would be associated with the proposed Project for both trucks carrying 2
equipment and materials and for commuters/personnel vehicles/automobiles primarily 3
during the construction period, with minimal traffic associated with the operations 4
period. Each of these scenarios is discussed below. 5
4.9.4.1 Construction Traffic 6
Some area roadways and intersections currently have unacceptable levels of service 7
(Storke Road segment south of the Highway 101 overpass, Storke Road south of 8
Whittier, Highway 101 to the south during peak hours, and northern portions of Highway 9
101 during peak hours). If Project-related traffic was to use these roadways and 10
intersections, it would contribute to reducing the level of service, and would be 11
considered a significant impact (Class II). 12
4.9.4.2 Operations Traffic 13
Truck traffic associated with the current operations of the EOF consists of an estimated 14
700 to 800 truck round-trips annually. This is not anticipated to increase with the 15
proposed Project. Peak day truck round-trips would remain unchanged at 16
approximately two per day. 17
The existing personnel traffic to/from the EOF is estimated to be about 20 personnel 18
trips per day. Personnel trips to and from Platform Holly currently generate an 19
estimated average of ten round-trips per day. This is not anticipated to increase with 20
the proposed Project. 21
EMT traffic currently averages about one round-trip per day by the maintenance crew. 22
In case of an accident or unforeseen maintenance, e.g., to remove tank contents or 23
sump liquids from the EMT, there have been up to 40 to 50 vehicle round-trips per day 24
to/from the EMT. This operational traffic would cease under the proposed Project. 25
After the pipeline is constructed, operational traffic would include pipeline surveys that 26
would be done weekly by maintenance crews. One trip per day would have minimal 27
impact on the transportation network along the new pipeline right-of-way. Thus, there 28
would be no operational transportation impacts from the proposed pipeline installation. 29

4.9 Transportation and Circulation
Ellwood Pipeline Company Line 96 Modification Project FEIR
4.9-16 July 2011
Impact T-1: Increased Traffic during Construction and Abandonment of the 1
Existing Line 96 could Exacerbate Existing or Future Unacceptable Traffic Levels 2
of Service. 3
The use of certain intersections or roadways to deliver/remove materials to/from 4
the EOF or the pipeline route could cause significant impacts to area roadways 5
that are currently, or could in the future, have unacceptable levels of service 6
(Potentially Significant, Class II). 7
Impact Discussion 8
Pipeline construction would generate a total of about 492 truck round-trips, with a peak 9
day number equal to an estimated 48 truck round-trips for the period during pipeline 10
installation. Personnel trips would add an additional 113 round-trips per day. This 11
would be below the significance criteria for Hollister Avenue or Calle Real, but would be 12
a significant impact to the Storke/Hollister intersection, the Storke Road south of the 13
Highway 101 overpass roadway segment, through southerly segments of Highway 101 14
during peak hours and through northern segments of Highway 101 during peak hours. 15
Short-term transportation impacts could occur on roadways adjacent to the pipeline 16
right-of-way. These roadways would be used for deliveries of the pipeline construction 17
materials/equipment, and are used to transport materials and commuters to/from the 18
EOF. Potentially significant impacts would include: 19
Closures of lanes or entire roads, e.g., Calle Real, Storke Road or Phelps Road 20
(associated with pipeline construction/abandonment), that would result in 21
restrictions to traffic, emergency vehicles, bicycles, or pedestrian movements 22
through the roads, bike trails or pedestrian walks adjacent or part of the pipeline 23
right-of-way; and 24
Damage to the road surfaces due to movements of heavy machinery and trucks, 25
and/or due to the pipeline construction if the right-of-way includes a road or a 26
side of the road. 27
Mitigation Measures 28
T-1a. Truck and Commuter Vehicle Routing. For pipeline construction, the 29
Applicant shall limit truck deliveries and commuters/personnel to the west 30
Hollister-Highway 101 on and off ramps and shall not utilize the Storke 31
Road and Hollister Avenue intersection or the Storke Road Highway 101 32
4.9 Transportation and Circulation
July 2011 4.9-17 Ellwood Pipeline CompanyLine 96 Modification Project FEIR
on/off ramps during peak hours (peak hours are defined as 6 a.m. to 8 1
a.m. and 4 p.m. to 6 p.m). 2
T-1b. Truck and Commuter Highway non-peak Operations. Truck trips 3
associated with the proposed pipeline installation shall be limited to non-4
peak hours. 5
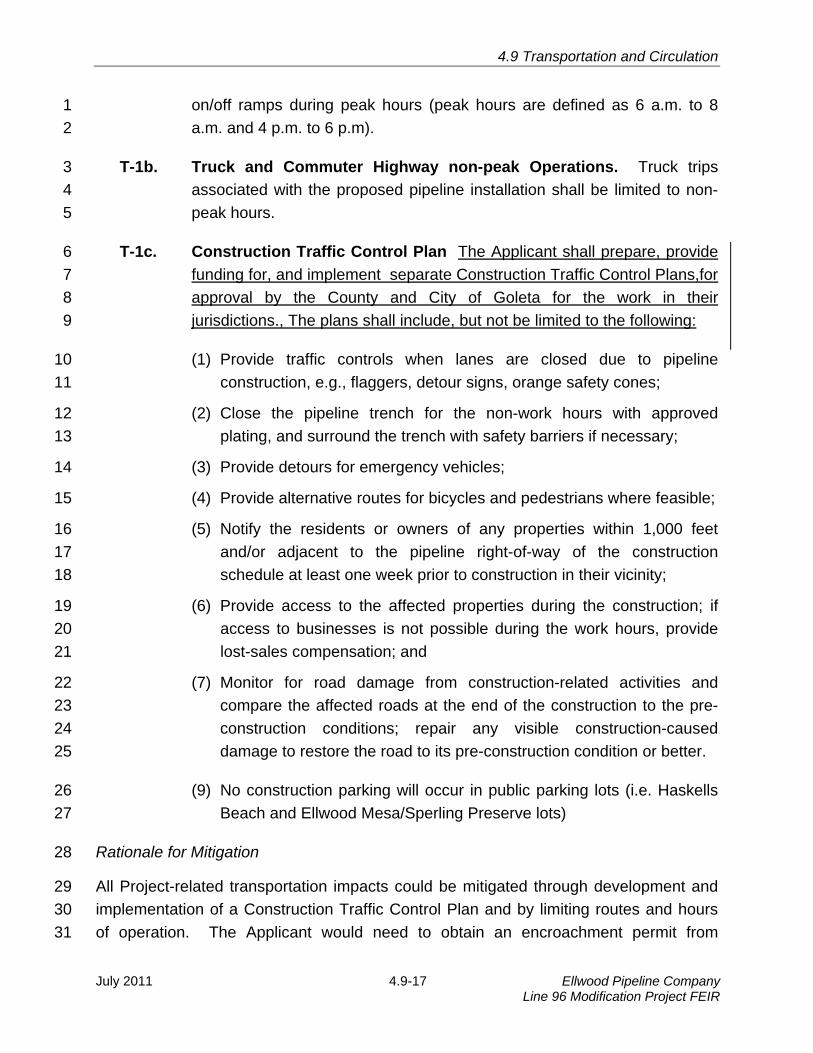
T-1c. Construction Traffic Control Plan The Applicant shall prepare, provide 6
funding for, and implement separate Construction Traffic Control Plans,for 7
approval by the County and City of Goleta for the work in their 8
jurisdictions., The plans shall include, but not be limited to the following: 9
(1) Provide traffic controls when lanes are closed due to pipeline 10
construction, e.g., flaggers, detour signs, orange safety cones; 11
(2) Close the pipeline trench for the non-work hours with approved 12
plating, and surround the trench with safety barriers if necessary; 13
(3) Provide detours for emergency vehicles; 14
(4) Provide alternative routes for bicycles and pedestrians where feasible; 15
(5) Notify the residents or owners of any properties within 1,000 feet 16
and/or adjacent to the pipeline right-of-way of the construction 17
schedule at least one week prior to construction in their vicinity; 18
(6) Provide access to the affected properties during the construction; if 19
access to businesses is not possible during the work hours, provide 20
lost-sales compensation; and 21
(7) Monitor for road damage from construction-related activities and 22
compare the affected roads at the end of the construction to the pre-23
construction conditions; repair any visible construction-caused 24
damage to restore the road to its pre-construction condition or better. 25
(9) No construction parking will occur in public parking lots (i.e. Haskells 26
Beach and Ellwood Mesa/Sperling Preserve lots) 27
Rationale for Mitigation 28
All Project-related transportation impacts could be mitigated through development and 29
implementation of a Construction Traffic Control Plan and by limiting routes and hours 30
of operation. The Applicant would need to obtain an encroachment permit from 31
4.9 Transportation and Circulation
Ellwood Pipeline Company Line 96 Modification Project FEIR
4.9-18 July 2011
CalTrans to be able to cross underneath Highway 101 via drilling. In order to obtain the 1
permit, the Applicant would be required to meet the applicable CalTrans specifications. 2
Therefore, impacts would be reduced to less than significant with mitigation (Class II). 3
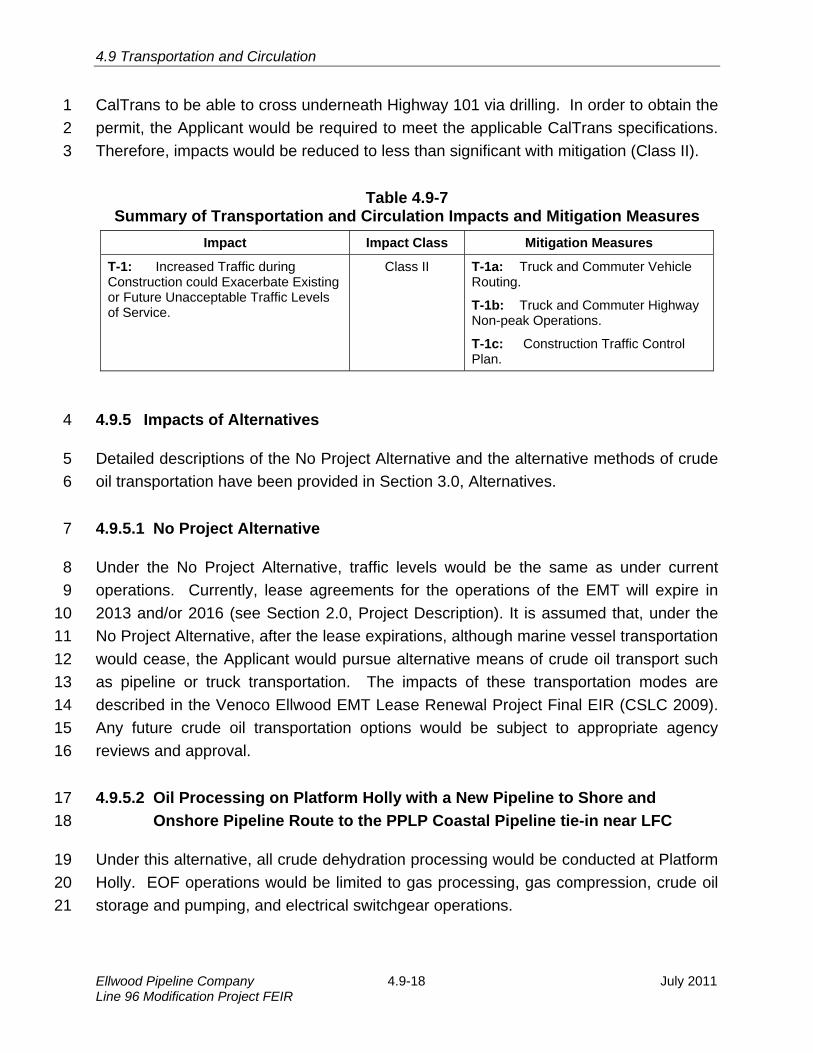
Table 4.9-7 Summary of Transportation and Circulation Impacts and Mitigation Measures
Impact Impact Class Mitigation Measures
T-1: Increased Traffic during Construction could Exacerbate Existing or Future Unacceptable Traffic Levels of Service.
Class II T-1a: Truck and Commuter Vehicle Routing.
T-1b: Truck and Commuter Highway Non-peak Operations.
T-1c: Construction Traffic Control Plan.
4.9.5 Impacts of Alternatives 4
Detailed descriptions of the No Project Alternative and the alternative methods of crude 5
oil transportation have been provided in Section 3.0, Alternatives. 6
4.9.5.1 No Project Alternative 7
Under the No Project Alternative, traffic levels would be the same as under current 8
operations. Currently, lease agreements for the operations of the EMT will expire in 9
2013 and/or 2016 (see Section 2.0, Project Description). It is assumed that, under the 10
No Project Alternative, after the lease expirations, although marine vessel transportation 11
would cease, the Applicant would pursue alternative means of crude oil transport such 12
as pipeline or truck transportation. The impacts of these transportation modes are 13
described in the Venoco Ellwood EMT Lease Renewal Project Final EIR (CSLC 2009). 14
Any future crude oil transportation options would be subject to appropriate agency 15
reviews and approval. 16
4.9.5.2 Oil Processing on Platform Holly with a New Pipeline to Shore and 17
Onshore Pipeline Route to the PPLP Coastal Pipeline tie-in near LFC 18
Under this alternative, all crude dehydration processing would be conducted at Platform 19
Holly. EOF operations would be limited to gas processing, gas compression, crude oil 20
storage and pumping, and electrical switchgear operations. 21

4.9 Transportation and Circulation
July 2011 4.9-19 Ellwood Pipeline CompanyLine 96 Modification Project FEIR
Installation of additional equipment on Platform Holly would require that the equipment 1
be trucked to the Ellwood pier, loaded on supply boats, and transported to Platform 2
Holly. An estimated 10 truck round-trips, with up to five per day, would be required to 3
transport the equipment to the pier. Personnel would generate an estimated 10 round-4
trips per day. As the use of Storke Road/Hollister Avenue intersection, the Storke Road 5
segment south of the Highway 101, Storke Road south of Whittier Ave. or Highway 101 6
southerly or northerly during peak hours could constitute a significant impact similar to 7
impact T-1, mitigation measures T-1a, T-1b and T-1c would apply. 8
Installation of the pipeline would have the same impacts as T-1 associated with the 9
proposed Project and mitigation measures T-1a, T-1b and T-1c would apply. 10
Operations at the EOF would be reduced. Therefore, truck and personnel trips to the 11
EOF would be reduced accordingly. The majority of truck trips currently to/from the 12
EOF are associated with gas liquids, which would still occur under this alternative, and 13
sulfur transportation, which would no longer take place under this alternative. This 14
would produce a net reduction in truck trips to the EOF of about 25 percent. 15
4.9.5.3 Offshore Pipeline Route from the EOF to the PPLP Coastal Pipeline tie-in 16
near LFC 17
Under this alternative, all crude and gas processing would be conducted at the EOF 18
facility, and crude oil would be transported to the PPLP Coastal Pipeline via an offshore 19
pipeline between the EOF and LFC. Traffic impacts would be similar to those described 20
above for the proposed Project, except the pipeline from the EOF to LFC would be 21
constructed offshore. This would generate an additional total 25 to 30 truck round-trips 22
to transport the additional pipe and equipment to the Ellwood pier. Other trips would be 23
the same as the proposed Project with the onshore pipeline. Total truck trips to/from the 24
EOF are estimated to be about 140 truck round-trips with a peak day of 20 to 30 truck 25
round-trips. Personnel trips would total 100 round-trips per day. This number of trips 26
would be below the significance criteria for Hollister Avenue and the EOF access road, 27
both of which currently have a LOS of A. This would, therefore, not be considered a 28
significant impact. Traffic associated with the onshore pipeline installation would be the 29
same as for the proposed Project. Mitigation measures T-1a, T-1b and T-1c would 30
apply. 31

4.9 Transportation and Circulation
Ellwood Pipeline Company Line 96 Modification Project FEIR
4.9-20 July 2011
4.9.6 Cumulative Projects Impact Analysis 1
4.9.6.1 Cumulative Development Projects 2
Other projects proposed in the Project area would contribute to transportation 3
congestion. None of the energy related offshore projects would produce traffic impacts 4
along the same roadways and intersections that the Project would impact. 5
Residential/commercial projects, including the Bacara Completion Phase, Mariposa at 6
Ellwood Shores assisted living facility, Village at Los Carneros, the Costco Gasoline 7
Station, the Cabrillo Business Park, the Comstock Homes project, the Haskell’s Landing 8
and the cumulative effect of the list of smaller projects, through increasing traffic in the 9
area, could produce significant cumulative impacts. The City of Goleta General plan 10
outlines roadway and intersection improvement projects that would be needed to reduce 11
the traffic impacts of the cumulative projects. This has been addressed by examining 12
the potential future traffic increases and their associated impact of roadway LOS, in the 13
above impact section. 14
4.9.6.2 Cumulative EMT Abandonment 15
Abandonment of the EMT would have the potential to result in potential cumulative 16
impacts in the project area. Truck trips associated with the EMT decommissioning 17
would total an estimated 487 truck round trips, including close to 300 truck round trips 18
for soil infill, with a peak day of up to an estimated 65 truck round trips for a short 19
period. Personnel trips are estimated to average 43 round trips per day. This would be 20
a significant impact to the Storke/Hollister intersection for the future case, to the Storke 21
Road south of the Highway 101 overpass road segment, the Storke Road south of 22
Whittier, or through southerly segments of Highway 101 during peak hours for the 23
existing case (exceeding 50 peak hour trips on a roadway segment with LOS of F or 10 24
trips during the peak hour through an intersection rated at E (future case for Hollister-25
Storke intersection)). 26
Short-term transportation impacts could occur on roadways that would be used to haul 27
demolition materials to and from the EMT, and those roadways that are used to 28
transport materials and commuters to/from the EOF and Platform Holly/Ellwood Pier. 29
Potentially significant impacts would include: 30
Closures of lanes or entire roads (associated with pipeline abandonment), that 31
would result in restrictions to traffic, emergency vehicles, bicycles, or pedestrian 32

4.9 Transportation and Circulation
July 2011 4.9-21 Ellwood Pipeline CompanyLine 96 Modification Project FEIR
movements through the roads, bike trails or pedestrian walks adjacent or part of 1
the pipeline ROW; 2
Trucks exiting the EMT access road would have to make a left-hand turn onto 3
Storke Road, which could produce a safety hazard; and 4
Damage to the road surfaces due to movements of heavy machinery and trucks, 5
All Project-related transportation impacts could be mitigated through development and 6
implementation of a Construction Traffic Control Plan and by limiting routes and hours 7
of operation, as required in MM T1a, T1b and T1c. Therefore, impacts would be 8
reduced to less than significant. 9

4.9 Transportation and Circulation
Ellwood Pipeline Company Line 96 Modification Project FEIR
4.9-22 July 2011
This page intentionally left blank.